Embed Size (px)
Citation preview

ENVIRONMENTAL DATA
Material Balance 117
Energy 117-118
CO2 119-120
Water 120-121
Emissions 122-123
Waste 123-124
Logistics 124-126
Supply Chain 126-127
Environmental Accounting 127
Facility 128
Fuel Economy, CO2 129-132
Technologies 133-134
Other Emissions 134-135
Lifecycle Assessments (LCAs) 136-137
Materials, Recycling 138
ELV Programs 139
Third-Party Assurance 140
GRI Index 141
117 129
139
140
Regarding Data for Publication● Fiscal year: April 1, 2016, through March 31, 2017.● Scope: All Nissan manufacturing facilities, management offices and subsidiaries worldwide covered under consolidation of
Nissan Motor Co., Ltd., and equity method affiliated manufacturing companies.● Environment Management Regions: Managed companies included in the scope are categorized by following regions:
Japan: JapanNorth America: United States, Mexico, CanadaEurope: United Kingdom, Spain, Russia, Germany, Italy, France, Netherlands, Belgium, Hungary, Finland, Switzerland (Russia data moved from Others and included in Europe from fiscal 2013)Others: China, Thailand, Indonesia, India, Australia, South Africa, Brazil, Egypt, Vietnam, UAE, others
● Calsonic Kansei Corporation became out of scope in fiscal 2016 though it is included in the data for fiscal 2016. However, Calsonic Kansei Corporation is not included in CO2 emission calculation of scope 3 employee commuting.
Restatement of Information Provided in Previous Years ● Fiscal 2015 data were reviewed and some were revised.
page_22
See p. 22, Employee Engagement and Education, for additional environment-related information.
116
SAFETY PHILANTHROPY QUALITY ECONOMIC CONTRIBUTIONEMPLOYEESVALUE CHAIN
RENAULT-NISSAN ALLIANCE
CORPORATE GOVERNANCE &INTERNAL CONTROL
CEO MESSAGEINTRODUCTIONCONTENTS THIRD-PARTY ASSURANCE
ENVIRONMENT
NISSAN’S CSR MANAGEMENTNISSAN’S CSR STRATEGIES
NISSAN MOTOR CORPORATION SUSTAINABILITY REPORT 2017
CSR DATA

Energy InputMaterial Balance(FY)
Unit 2012 2013 2014 2015 2016
Total MWh 8,984,864 9,207,124 9,474,368 9,683,528 10,189,082
Japan MWh 4,565,499 4,424,486 4,191,517 4,115,353 4,497,562
North America MWh 2,157,793 2,061,393 2,424,942 2,583,613 2,643,303
Europe MWh 982,332 1,027,027 1,156,519 1,107,279 1,093,103Other MWh 1,279,240 1,694,218 1,701,391 1,877,283 1,955,115Primary
Natural gas MWh 2,847,325 2,894,901 3,060,122 3,346,141 3,537,674 LPG MWh 360,891 339,751 295,800 303,826 249,426 Coal MWh 235,239 149,232 199,801 206,307 217,431Heating oil MWh 248,445 226,513 225,114 188,943 209,232 Gasoline MWh 211,449 263,663 322,624 302,564 303,040Diesel MWh 72,151 71,371 99,045 55,099 57,488Heavy oil MWh 67,967 61,359 58,274 34,289 43,853
ExternalElectricity (Purchased) MWh 4,785,477 5,038,384 5,084,989 4,979,114 5,247,663
Renewable energy MWh 15,522 118,917 154,515 141,076 157,226Chilled water MWh 25,947 11,646 4,239 12,116 12,919Heated water MWh 7,492 6,227 4,635 4,630 4,690Steam MWh 114,281 133,849 110,953 100,000 136,593
InternalElectricity (In-house generation) MWh 8,199 10,227 8,772 9,423 11,847
Renewable energy MWh 8,199 10,227 8,772 9,423 11,847
Total renewable energy MWh 23,721 129,144 163,287 150,499 169,073
Ratio of renewable energy % 0.26% 1.40% 1.73% 1.55% 1.66%
Despite the extensive energy-saving activities at Nissan facilities, energy usage was 10.19 million MWh in fiscal 2016, a 5.2% increase from fiscal 2015. Energy-saving activities throughout our corporate operations and efficient manufacturing contributed to limiting the rise, given that sales volume increased by 8.7% in the same period. Production sites globally accounted for 8.946 million MWh of total energy consumption.
Nissan’s objective was to increase the usage of renewable energy to 9% of total energy used in global activities by fiscal 2016. Direct use of renewable energy increased to 1.66% as a result of purchasing wind-power-generated electricity at the India plant. Taking into account renewable energy in electricity, the percentage reached 9.2%, achieving the target.
GRI G4 Indicators G4-EN3
page_140
This figure is subject to assurance by KPMG AZSA Sustainability Co., Ltd. For details, please see p.140.
CORPORATE INDICATORS – ENERGY
Output (FY)
Unit 2016
Vehicles
Global production volume unit 5,654,000Waste ton 158,939
Waste for disposal ton 8,707Recycled ton 150,231
Wastewater 1,000 m3 20,516CO2 emissions t-CO2 3,577,689
VOC ton 11,933NOx ton 430SOx ton 31
Input (FY)
Unit 2016
Raw materials ton 7,537,092
Water 1,000 m3 29,118
Energy MWh 10,189,082
GRI G4 Indicators G4-EN1/G4-EN3/
G4-EN8/G4-EN15/G4-EN16/G4-EN21/G4-EN22/G4-EN23
Nissan’s midterm environmental action plan, Nissan Green Program 2016 (NGP2016), focused on reducing the environmental impact of corporate activities and pursuing harmony between resource consumption and ecology. To minimize the company’s corporate carbon footprint, Nissan aims to reduce CO2 emissions per vehicle sold and to improve resource efficiency by increasing the recycled material usage ratio. Four key actions, including the above, are implemented throughout Nissan’s corporate activities.
CORPORATE INDICATORS
117
SAFETY PHILANTHROPY QUALITY ECONOMIC CONTRIBUTIONEMPLOYEESVALUE CHAIN
RENAULT-NISSAN ALLIANCE
CORPORATE GOVERNANCE &INTERNAL CONTROL
CEO MESSAGEINTRODUCTIONCONTENTS THIRD-PARTY ASSURANCE
ENVIRONMENT
NISSAN’S CSR MANAGEMENTNISSAN’S CSR STRATEGIES
NISSAN MOTOR CORPORATION SUSTAINABILITY REPORT 2017
CSR DATA

(FY)
Unit 2016
Japan MWh/vehicle 4.43North America MWh/vehicle 1.42Europe MWh/vehicle 1.50Other MWh/vehicle 0.95
Data for the Japan region includes manufacturing of powertrains and other components for use in overseas assembly operations. Since the denominator is vehicles produced in the region, this results in intensity tending to show higher values.
GRI G4 Indicators G4-EN3/G4-EN5/
G4-EN6
Energy per Vehicle ProducedIn fiscal 2016 energy per vehicle produced was 1.80 MWh, a 3.2% improvement from fiscal 2015. This result shows our continuous efforts to reduce energy used per vehicle produced.
(By Region)
(MWh/million ¥)
(FY)
0.810.93
20162012 2013 2014 2015
0.76 0.720.79
0.0
0.2
0.4
0.6
0.8
1.0
1.2
GRI G4 Indicators G4-EN3/G4-EN5/
G4-EN6
In fiscal 2016, global Nissan facilities saw energy per revenue rise to 0.79 MWh, an increase of 9.5% compared to the previous fiscal year. Nissan is taking continuous steps toward decoupling financial capital generation from energy use; however, an increase of production volume and decrease of revenue result in an increase of energy per revenue.
Energy per Revenue
1.87 1.86 1.801.811.86
2012 2013 2014 201620150.0
0.5
1.0
1.5
2.0
2.5
3.0
(MWh/vehicle)
(FY)
118
SAFETY PHILANTHROPY QUALITY ECONOMIC CONTRIBUTIONEMPLOYEESVALUE CHAIN
RENAULT-NISSAN ALLIANCE
CORPORATE GOVERNANCE &INTERNAL CONTROL
CEO MESSAGEINTRODUCTIONCONTENTS THIRD-PARTY ASSURANCE
ENVIRONMENT
NISSAN’S CSR MANAGEMENTNISSAN’S CSR STRATEGIES
NISSAN MOTOR CORPORATION SUSTAINABILITY REPORT 2017
CSR DATA

CORPORATE INDICATORS – CO2
Carbon Footprint(FY)
Unit 2012 2013 2014 2015 2016
Scope1 t-CO2 835,766 812,062 861,457 926,790 963,661Scope2 t-CO2 2,432,889 2,538,360 2,422,410 2,547,951 2,614,028Scope1+2 t-CO2 3,268,655 3,350,422 3,283,867 3,474,741 3,577,689
Japan t-CO2 1,526,182 1,446,871 1,267,676 1,479,572 1,579,089North America t-CO2 758,457 698,934 769,696 800,724 823,340Europe t-CO2 284,079 259,972 290,109 208,088 176,285 Other t-CO2 699,937 944,644 956,386 986,359 998,976
Scope3Commuting t-CO2 468,346 426,487 455,510 319,189 304,100
Japan, U.S., Europe t-CO2 214,619 217,091 227,248 218,137 213,747 Logistics t-CO2 1,490,050 1,678,903 1,608,582 1,598,891 1,925,281
In fiscal 2016, the total of Scope 1 and 2 emissions was 3.58 million tons. Given that sales volume increased by 8.7% in the same period, the increase in CO2 emissions from Nissan facilities was limited to 2.9% from the previous fiscal year, due to increase of production volume. Total CO2 emissions from manufacturing processes were 3.139 million tons (Scope 1 emissions: 0.841 million tons, Scope 2 emissions: 2.297 million tons).
GRI G4 Indicators G4-EN15/G4-EN16/
G4-EN17/G4-EN19/ G4-EN30
(FY)
Unit 2016
Japan t-CO2/vehicle 1.56North America t-CO2/vehicle 0.44Europe t-CO2/vehicle 0.24Other t-CO2/vehicle 0.49
GRI G4 Indicators
GRI G4 Indicators
G4-EN15/G4-EN16/G4-EN18
G4-EN15/G4-EN16/ G4-EN18
For fiscal 2016, CO2 emissions per vehicle produced improved 5.3% from the previous fiscal year, with combined Scope 1 and 2 emissions at 0.63 ton. Energy conservation diagnosis and best-practice sharing among global Nissan plants contributed to these significant improvements.
In fiscal 2016, as measured by the per revenue CO2 emissions from our global operations, the result was 0.28 ton per ¥1 million, increased 7.2% from fiscal 2015. A decrease in revenue resulted in this increase of emissions per revenue.
Data for the Japan region includes manufacturing of powertrains and other components for overseas assembly use. Since the denominator is vehicles produced in the region, this results in intensity tending to show higher values.
(By Region)
(t-CO2/vehicle)
(t-CO2/million ¥)
0.68 0.66
2012 2013 2014 2015
0.65 0.67 0.63
20160.0
0.2
0.4
0.6
0.8
1.0
(FY)
(FY)
0.34
0.29
0.00
0.05
0.20
0.15
0.10
0.25
0.30
0.35
2012 2013 2014 2015
0.26 0.260.28
2016
Scope 1 and 2 Emissions per Vehicle Produced
Scope 1 and 2 Emissions per Revenue
page_140
This figure is subject to assurance by KPMG AZSA Sustainability Co., Ltd. For details, please see p.140.
119
SAFETY PHILANTHROPY QUALITY ECONOMIC CONTRIBUTIONEMPLOYEESVALUE CHAIN
RENAULT-NISSAN ALLIANCE
CORPORATE GOVERNANCE &INTERNAL CONTROL
CEO MESSAGEINTRODUCTIONCONTENTS THIRD-PARTY ASSURANCE
ENVIRONMENT
NISSAN’S CSR MANAGEMENTNISSAN’S CSR STRATEGIES
NISSAN MOTOR CORPORATION SUSTAINABILITY REPORT 2017
CSR DATA

Corporate Carbon Footprint per Vehicle SoldIn the Nissan Green Program 2016 (NGP2016), the company aimed to reduce CO2 emissions from corporate activities by 20% compared to fiscal 2005, focusing on manufacturing, logistics, offices and dealerships in Japan. In fiscal 2016, overall corporate emissions were reduced by 22.3% compared to fiscal 2005, achieving the target. Lower CO2 emissions from manufacturing and dealerships in Japan contributed to emission reduction.
Manufacturing CO2 per Vehicle ProducedIIn the Nissan Green Program 2016 (NGP2016), the company aimed to reduce CO2 emissions per vehicle produced from manufacturing activities by 27% in fiscal 2016 compared to fiscal 2005. In fiscal 2016, Nissan’s manufacturing CO2 emissions per vehicle produced reached 0.53 ton, a 27.0% reduction compared to fiscal 2005, achieving the target.
GRI G4 Indicators G4-EN15/G4-EN16/
G4-EN18
GRI G4 Indicators G4-EN15/G4-EN16/
G4-EN18
(%)
(t-CO2/vehicle)
(FY)
(FY)
100
77.0 77.6 77.784.6
0
20
40
60
80
100
2005 2016201520142013
0.73
0.57
0.0
0.2
0.6
0.4
0.8
2005 2013 2014 2015
0.56 0.570.53
2016
(FY)
Unit 2012 2013 2014 2015 2016
Total 1,000 m3 29,537 30,967 29,162 28,570 29,118
Japan 1,000 m3 15,956 16,818 15,018 14,990 15,563North America 1,000 m3 4,770 5,176 5,419 5,427 5,483Europe 1,000 m3 2,410 2,404 2,310 2,330 2,299Other 1,000 m3 6,401 6,569 6,415 5,823 5,774
(FY)
Unit 2012 2013 2014 2015 2016
Total 1,000 m3 21,228 23,482 20,938 20,680 20,516
Japan 1,000 m3 13,710 15,114 13,358 12,976 12,681North America 1,000 m3 3,055 3,658 3,550 3,916 4,028Europe 1,000 m3 2,031 2,054 1,793 1,740 1,767Other 1,000 m3 2,432 2,656 2,237 2,048 2,040
(FY)
Unit 2012 2013 2014 2015 2016
Quality
Chemical oxygen demand (COD) kg 34,894 32,130 27,883 28,042 29,730
GRI G4 Indicators
GRI G4 Indicators G4-EN22
G4-EN8
CORPORATE INDICATORS—WATER
Water Input
Water Discharge
Nissan’s objective was to reduce water input by 15% in fiscal 2016 compared with fiscal 2010 in cubic meters per production unit; the target was achieved. In fiscal 2016, water input in our global sites was 29,118 thousand m3, the same level as in fiscal 2015. This is mainly due to water-saving activities in vehicle production plants, as shown in Vehicle Production Plant Water Input per Vehicle Produced on p. 121. Water input from production sites of Nissan Motor Co., Ltd. in Japan is 6,900,254 m3.
In fiscal 2016, water discharges from our global sites totaled 20,516 thousand m3, which was the same level as in fiscal 2015.
page_140
This figure is subject to assurance by KPMG AZSA Sustainability Co., Ltd. For details, please see p. 140.
120
SAFETY PHILANTHROPY QUALITY ECONOMIC CONTRIBUTIONEMPLOYEESVALUE CHAIN
RENAULT-NISSAN ALLIANCE
CORPORATE GOVERNANCE &INTERNAL CONTROL
CEO MESSAGEINTRODUCTIONCONTENTS THIRD-PARTY ASSURANCE
ENVIRONMENT
NISSAN’S CSR MANAGEMENTNISSAN’S CSR STRATEGIES
NISSAN MOTOR CORPORATION SUSTAINABILITY REPORT 2017
CSR DATA

(FY)
Unit 2016
Japan m3/vehicle 12.49North America m3/vehicle 2.17Europe m3/vehicle 2.42Other m3/vehicle 0.99
GRI G4 Indicators G4-EN22
In fiscal 2016, water discharge per vehicle produced was 3.63 m3, which was a 8.7% improvement from fiscal 2015.
Data for the Japan region includes manufacturing of powertrains and other components for overseas assembly use. Since the denominator is vehicles produced in the region, this results in intensity tending to show higher values.
(By Region)
(m3/vehicle)
(FY)
4.39 4.62
2012 2013 2014 2015
4.14 3.97 3.63
20160
2
4
6
8
10
Water Discharge per Vehicle Produced
(FY)
Unit 2016
Japan m3/vehicle 15.33North America m3/vehicle 2.96Europe m3/vehicle 3.15Other m3/vehicle 2.81
Data for the Japan region includes manufacturing of powertrains and other components for overseas assembly use. Since the denominator is vehicles produced in the region, this results in intensity tending to show higher values.
Water Input per Vehicle ProducedIn fiscal 2016, water input per vehicle produced decreased to 5.15 m3, a 6.2% improvement from fiscal 2015. This is mainly due to the water-saving activities in vehicle production plants as shown below.
Vehicle Production Plant Water Input per Vehicle ProducedNissan’s objective was to reduce water input by 15% in fiscal 2016 compared with fiscal 2010 in cubic meters per production unit. In fiscal 2016, water input per vehicle produced in vehicle production plants improved 15.7% compared with fiscal 2010, achieving the target.
GRI G4 Indicators G4-EN8
(By Region)
(m3/vehicle)
(FY)
6.11 6.09
2012 2013 2014 2015
5.76 5.49 5.15
20160
2
4
6
8
10
(m3/vehicle)
3.03 2.99
2010 2013
2.81 2.772.56
2014 2015 20160
1.5
1.0
0.5
2.0
2.5
3.0
3.5
(FY)
121
SAFETY PHILANTHROPY QUALITY ECONOMIC CONTRIBUTIONEMPLOYEESVALUE CHAIN
RENAULT-NISSAN ALLIANCE
CORPORATE GOVERNANCE &INTERNAL CONTROL
CEO MESSAGEINTRODUCTIONCONTENTS THIRD-PARTY ASSURANCE
ENVIRONMENT
NISSAN’S CSR MANAGEMENTNISSAN’S CSR STRATEGIES
NISSAN MOTOR CORPORATION SUSTAINABILITY REPORT 2017
CSR DATA

2.542.31
2012 2013 2014 2015
2.24 2.08 2.11
20160.0
1.0
2.0
3.0
4.0
CORPORATE INDICATORS—EMISSIONS
Emissions
Volatile Organic Compounds (VOCs)
(FY)
Unit 2012 2013 2014 2015 2016
NOx ton 525 450 453 450 430SOx ton 43 40 40 37 31
Nissan’s objective was to reduce volatile organic compounds (VOCs) from the body manufacturing process by 15% in fiscal 2016 compared with fiscal 2010 in grams per square meters. In fiscal 2016, VOCs from manufacturing plants were 11,933 tons globally, a 10.3% increase from fiscal 2015. This is mainly due to increase of global production volume.
GRI G4 Indicators G4-EN21
GRI G4 Indicators G4-EN21
(FY)
Unit 2012 2013 2014 2015 2016
Total ton 12,305 11,734 11,316 10,820 11,933
Japan ton 3,623 3,492 2,826 2,850 3,580North America ton 5,194 5,338 5,511 5,309 4,851Europe ton 3,488 2,904 2,979 2,661 3,502
In fiscal 2016, NOx and SOx emissions from Nissan facilities were 430 tons and 31 tons, respectively.
VOC Reduction from Paint Shop Technologies
In 2013, Nissan opened its most advanced paint plant in the world. The state-of-the-art facility in Smyrna, Tennessee, sets new standards for quality, efficiency and environmental impacts, as it is capable of reducing energy consumption by 30%, carbon dioxide emissions by 30% and volatile organic compound (VOCs) emissions by 70%. The plant uses an innovative three-wet paint process that applies all three paint layers in succession, before the vehicle goes into the oven. The plant is Nissan’s “Showcase Project” as part of the U.S. Department of Energy’s Better Buildings Better Plants Challenge, where Nissan has committed to reducing energy intensity in its three U.S. plants by 25% by 2020.
(FY)
Unit 2016
Japan kg/vehicle 3.53North America kg/vehicle 2.62Europe kg/vehicle 4.80 GRI G4 Indicators
G4-EN21
In fiscal 2016, VOCs per vehicle produced were 2.11 kg, the same level as the previous fiscal year.
(By Region)
(kg/vehicle)
(FY)
VOCs per Vehicle Produced
122
SAFETY PHILANTHROPY QUALITY ECONOMIC CONTRIBUTIONEMPLOYEESVALUE CHAIN
RENAULT-NISSAN ALLIANCE
CORPORATE GOVERNANCE &INTERNAL CONTROL
CEO MESSAGEINTRODUCTIONCONTENTS THIRD-PARTY ASSURANCE
ENVIRONMENT
NISSAN’S CSR MANAGEMENTNISSAN’S CSR STRATEGIES
NISSAN MOTOR CORPORATION SUSTAINABILITY REPORT 2017
CSR DATA

(FY)
Unit 2011 2012 2013 2014 2015
Japan site total ton 4,441 4,158 4,183 3,879 4,129
Oppama ton 981 715 676 402 488Tochigi ton 915 942 1,155 1,317 1,435Kyushu ton 1,390 1,394 1,300 1,152 1,173Yokohama ton 555 581 579 547 531Iwaki ton 320 183 128 114 132NTC ton 280 343 347 347 370
GRI G4 Indicators G4-EN21
Released Substances Designated by PRTR Law (Japan)
In fiscal 2015, released substances designated by the PRTR (Pollutant Release and Transfer Register) Law in Japan were 4,129 tons, an increase from the previous fiscal year.
PRTR Emissions per Vehicle Produced (Japan)In fiscal 2015, PRTR emissions per vehicle produced in Japan were 4.84 kg, an 8.8% increase from the previous fiscal year.
GRI G4 Indicators G4-EN21
(kg/vehicle)
(FY)
(FY)
Unit 2012 2013 2014 2015 2016
Total ton 168,617 172,849 173,513 159,345 158,939
Japan ton 65,412 61,999 59,808 63,630 61,115 North America ton 40,208 51,767 58,452 49,129 45,459 Europe ton 50,495 51,295 45,358 37,204 41,110Other ton 12,502 7,788 9,895 9,382 11,255
DetailWaste for disposal ton 31,187 17,903 13,153 11,355 8,707Recycled ton 137,430 154,946 160,360 147,990 150,231
GRI G4 Indicators G4-EN23
CORPORATE INDICATORS—WASTE
Waste
Nissan’s objective was to reduce waste in manufacturing plants by 2% per year for Japan and 1% per year globally compared to BAU (business as usual); the target was achieved in fiscal 2016. For fiscal 2016, waste generated totaled approximately 159,000 tons, the same level as in fiscal 2015. Contributing to this were waste-reduction activities at manufacturing plants in Mexico and Spain. The boundary of the waste data is limited to global production facilities. Waste generated from production sites of Nissan Motor Co., Ltd. in Japan is 28,842 tons.
The table shows chemical substance emissions calculated based on the Japanese government PRTR guideline. PRTR emissions show total volume excluding substances adherent to the product.
page_140
This figure is subject to assurance by KPMG AZSA Sustainability Co., Ltd. For details, please see p. 140.
4.454.84
3.703.92
4.18
0.0
1.0
3.0
4.0
5.0
2015
2.0
2011 2012 2013 2014
123
SAFETY PHILANTHROPY QUALITY ECONOMIC CONTRIBUTIONEMPLOYEESVALUE CHAIN
RENAULT-NISSAN ALLIANCE
CORPORATE GOVERNANCE &INTERNAL CONTROL
CEO MESSAGEINTRODUCTIONCONTENTS THIRD-PARTY ASSURANCE
ENVIRONMENT
NISSAN’S CSR MANAGEMENTNISSAN’S CSR STRATEGIES
NISSAN MOTOR CORPORATION SUSTAINABILITY REPORT 2017
CSR DATA
GRI G4 Indicators G4-EN23
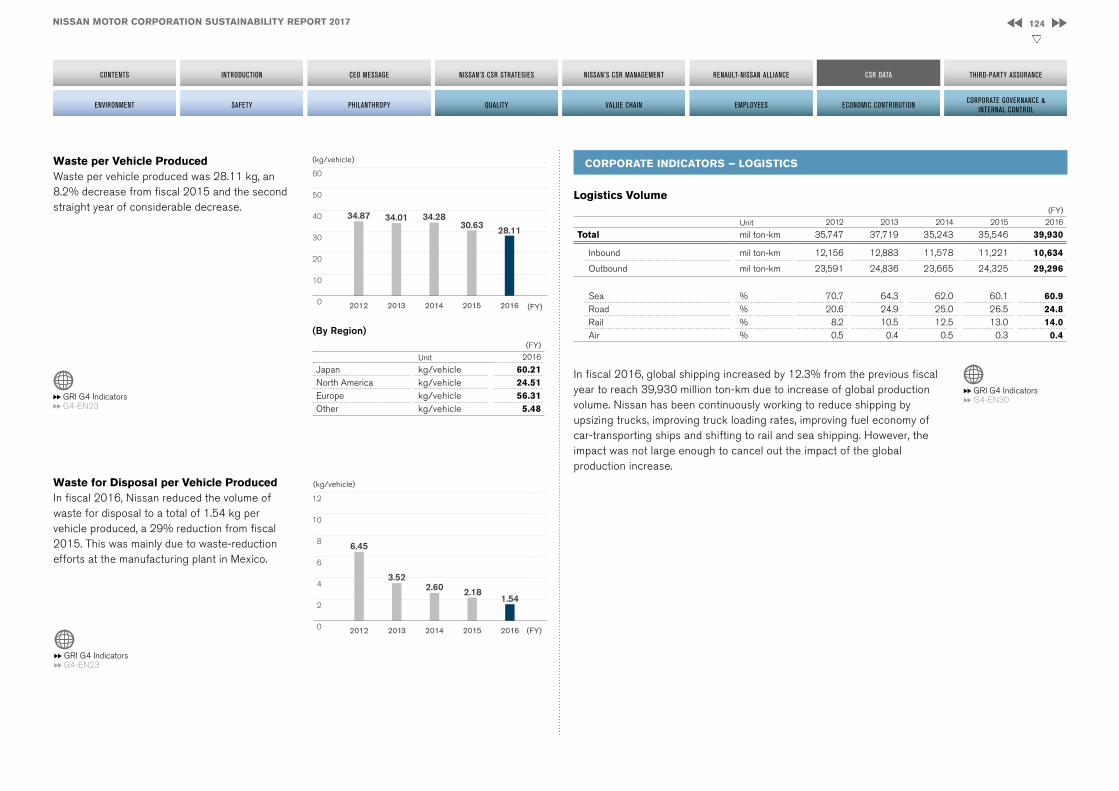
Waste for Disposal per Vehicle ProducedIn fiscal 2016, Nissan reduced the volume of waste for disposal to a total of 1.54 kg per vehicle produced, a 29% reduction from fiscal 2015. This was mainly due to waste-reduction efforts at the manufacturing plant in Mexico.
(kg/vehicle)
(FY)
6.45
3.52
0
2
6
4
10
8
12
20132012 2014 2015
2.60 2.181.54
2016
(FY)
Unit 2016
Japan kg/vehicle 60.21North America kg/vehicle 24.51Europe kg/vehicle 56.31Other kg/vehicle 5.48
GRI G4 Indicators G4-EN23
Waste per Vehicle ProducedWaste per vehicle produced was 28.11 kg, an 8.2% decrease from fiscal 2015 and the second straight year of considerable decrease.
(By Region)
(kg/vehicle)
(FY)
34.87 34.01
2012 2013 2014 2015
34.2830.63 28.11
20160
10
20
30
40
50
60
(FY)
Unit 2012 2013 2014 2015 2016
Total mil ton-km 35,747 37,719 35,243 35,546 39,930
Inbound mil ton-km 12,156 12,883 11,578 11,221 10,634
Outbound mil ton-km 23,591 24,836 23,665 24,325 29,296
Sea % 70.7 64.3 62.0 60.1 60.9Road % 20.6 24.9 25.0 26.5 24.8Rail % 8.2 10.5 12.5 13.0 14.0Air % 0.5 0.4 0.5 0.3 0.4
GRI G4 Indicators G4-EN30
CORPORATE INDICATORS – LOGISTICS
Logistics Volume
In fiscal 2016, global shipping increased by 12.3% from the previous fiscal year to reach 39,930 million ton-km due to increase of global production volume. Nissan has been continuously working to reduce shipping by upsizing trucks, improving truck loading rates, improving fuel economy of car-transporting ships and shifting to rail and sea shipping. However, the impact was not large enough to cancel out the impact of the global production increase.
124
SAFETY PHILANTHROPY QUALITY ECONOMIC CONTRIBUTIONEMPLOYEESVALUE CHAIN
RENAULT-NISSAN ALLIANCE
CORPORATE GOVERNANCE &INTERNAL CONTROL
CEO MESSAGEINTRODUCTIONCONTENTS THIRD-PARTY ASSURANCE
ENVIRONMENT
NISSAN’S CSR MANAGEMENTNISSAN’S CSR STRATEGIES
NISSAN MOTOR CORPORATION SUSTAINABILITY REPORT 2017
CSR DATA

(FY)
Unit 2012 2013 2014 2015 2016
Total t-CO2 1,490,050 1,678,903 1,608,582 1,598,891 1,925,281
Inbound t-CO2 821,030 908,804 822,867 797,034 809,088
Outbound t-CO2 669,020 770,098 785,715 801,857 1,116,193
Sea % 23.9 20.2 18.5 18.3 17.8Road % 55.3 61.7 60.5 65.7 62.1Rail % 4.3 5.2 5.1 5.4 5.6Air % 16.4 12.9 15.9 10.6 14.5
GRI G4 Indicators G4-EN19/G4-EN30
CO2 Emissions in Logistics
In fiscal 2016, CO2 emissions from logistics were 1,925,281 tons, an increase of 20.4% from the previous fiscal year. Emissions from air freight increased 65.0%, impacting the overall emission level.
“Inbound” includes parts procurement from suppliers and transportation of knockdown parts, and “Outbound” includes transportation of complete vehicles and service parts.
Other public transportation
8%
Car commuting92%
CO2 Emissions per Vehicle Transported
GRI G4 Indicators G4-EN18
In fiscal 2016, despite an expansion in global production, the CO2 emissions per vehicle transported were 0.39 ton, the same level as the previous fiscal year.
Employee Commuting CO2 Emissions
(FY)
2.93
2.80
2.85
2.95
2.90
3.00
2013 2014 2015 2016
2.90
2.872.85
(t-CO2/vehicle-year)In fiscal 2013, Nissan introduced a companywide CO2 reduction plan for car commuting employees in Japan. For fiscal 2016, CO2 emissions from car commuting in Japan were approximately 40 kton, or 2.85 ton-CO2/vehicle annually. This plan encourages car commuters to shift from internal combustion engine vehicles to the zero-emission electric vehicle Nissan LEAF to reduce CO2. The objective is to reduce emissions by 1% in ton-CO2/vehicle annually.
0.42 0.42
0.0
0.1
0.2
0.4
0.3
0.5
2012 2013 2014 2015
0.41 0.39 0.39
2016
CO2 Emissions from Commuting Calculated by using below parameters together with vehicle homologation data:
- Average car commuting range (Japan): 9,000 km/vehicle-year
- National Greenhouse Gas Inventory Report of Japan (2009), Ministry of the Environment, Japan: 0.33 kg-CO2e
- CO2 emission factor in fiscal 2014, Tokyo Electric Power Company: 0.000496 t-CO2/kWh
Employees of Nissan offices and manufacturing plants in Japan, fiscal 2016.
(t-CO2/vehicle)
(FY)
125
SAFETY PHILANTHROPY QUALITY ECONOMIC CONTRIBUTIONEMPLOYEESVALUE CHAIN
RENAULT-NISSAN ALLIANCE
CORPORATE GOVERNANCE &INTERNAL CONTROL
CEO MESSAGEINTRODUCTIONCONTENTS THIRD-PARTY ASSURANCE
ENVIRONMENT
NISSAN’S CSR MANAGEMENTNISSAN’S CSR STRATEGIES
NISSAN MOTOR CORPORATION SUSTAINABILITY REPORT 2017
CSR DATA
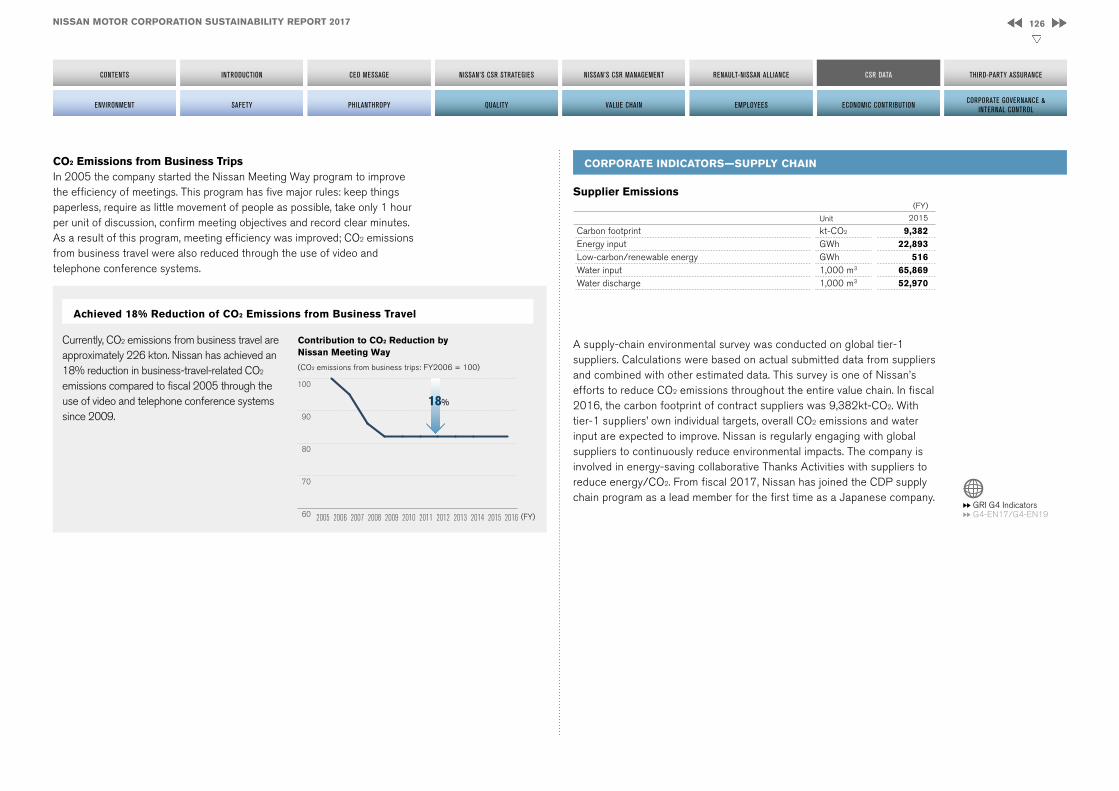
Achieved 18% Reduction of CO2 Emissions from Business Travel
Currently, CO2 emissions from business travel are approximately 226 kton. Nissan has achieved an 18% reduction in business-travel-related CO2 emissions compared to fiscal 2005 through the use of video and telephone conference systems since 2009.
CO2 Emissions from Business TripsIn 2005 the company started the Nissan Meeting Way program to improvethe efficiency of meetings. This program has five major rules: keep thingspaperless, require as little movement of people as possible, take only 1 hourper unit of discussion, confirm meeting objectives and record clear minutes.As a result of this program, meeting efficiency was improved; CO2 emissionsfrom business travel were also reduced through the use of video andtelephone conference systems.
Contribution to CO2 Reduction byNissan Meeting Way
(CO2 emissions from business trips: FY2006 = 100)
2005 2006 2007 2008 2009 2010 2011 2012 2013 2014 2015 201660
70
80
90
100
18%
(FY)
(FY)
Unit 2015
Carbon footprint kt-CO2 9,382Energy input GWh 22,893Low-carbon/renewable energy GWh 516Water input 1,000 m3 65,869Water discharge 1,000 m3 52,970
GRI G4 Indicators G4-EN17/G4-EN19
Supplier Emissions
A supply-chain environmental survey was conducted on global tier-1 suppliers. Calculations were based on actual submitted data from suppliers and combined with other estimated data. This survey is one of Nissan’s efforts to reduce CO2 emissions throughout the entire value chain. In fiscal 2016, the carbon footprint of contract suppliers was 9,382kt-CO2. With tier-1 suppliers’ own individual targets, overall CO2 emissions and water input are expected to improve. Nissan is regularly engaging with global suppliers to continuously reduce environmental impacts. The company is involved in energy-saving collaborative Thanks Activities with suppliers to reduce energy/CO2. From fiscal 2017, Nissan has joined the CDP supply chain program as a lead member for the first time as a Japanese company.
CORPORATE INDICATORS—SUPPLY CHAIN
126
SAFETY PHILANTHROPY QUALITY ECONOMIC CONTRIBUTIONEMPLOYEESVALUE CHAIN
RENAULT-NISSAN ALLIANCE
CORPORATE GOVERNANCE &INTERNAL CONTROL
CEO MESSAGEINTRODUCTIONCONTENTS THIRD-PARTY ASSURANCE
ENVIRONMENT
NISSAN’S CSR MANAGEMENTNISSAN’S CSR STRATEGIES
NISSAN MOTOR CORPORATION SUSTAINABILITY REPORT 2017
CSR DATA

Scope 3 Emissions by Category (FY)
Category Unit 2016
1. Purchased goods & services kt-CO2 17,9142. Capital goods kt-CO2 1,1803. Fuel- and energy-related activities kt-CO2 4114. Upstream transportation & distribution kt-CO2 8095. Waste generated in operations kt-CO2 1976. Business travel kt-CO2 2267. Employee commuting kt-CO2 3048. Upstream leased assets kt-CO2 09. Downstream transportation & distribution kt-CO2 871
10. Processing of sold products kt-CO2 011. Use of sold products kt-CO2 127,666 12. End-of-life treatment of sold products kt-CO2 42313. Downstream leased assets kt-CO2 46114. Franchises kt-CO2 015. Investments kt-CO2 0Total kt-CO2 150,462
GRI G4 Indicators G4-EN17
Nissan conducted a study based on the Corporate Value Chain (Scope 3) Accounting and Reporting Standard from the GHG Protocol. The results showed that about 90% of Scope 3 emissions were from the use of sold products. Nissan has introduced fuel-efficient vehicles globally and disclosed the resulting progress in corporate average fuel efficiency. As about 10% of Scope 3 emissions were from purchased goods and services, Nissan believes actions are necessary along the entire value chain. Since 2011, the company has shared its environmental policy and promoted collaboration with suppliers.
page_140
The values marked with an asterisk are subject to assurance by KPMG AZSA Sustainability Co., Ltd. For details, please see p. 140.
CORPORATE INDICATORS—ENVIRONMENTAL ACCOUNTING
(FY)
Unit 2014 2015
Investment Cost Investment Cost
Total mil ¥ 4,268 180,000 3,491 172,428
Business area mil ¥ 28 1,532 71 1,519
Upstream/downstream mil ¥ - 566 0 513
Management mil ¥ 0 2,321 0 2,297
R&D mil ¥ 4,240 175,000 3,420 167,800
Social activities mil ¥ 0 353 0 296
Damage repairs mil ¥ - 228 0 3
(FY)
Unit 2014 2015
Total mil ¥ 6,366 5,599
Cost reduction mil ¥ 1,341 2,289
Profit mil ¥ 5,025 3,310
GRI G4 Indicators G4-EN31
Environmental Conservation Cost
All environmental costs are based on the guidelines provided by Japan’s Ministry of the Environment, and are calculated for activities in Japan only.
127
SAFETY PHILANTHROPY QUALITY ECONOMIC CONTRIBUTIONEMPLOYEESVALUE CHAIN
RENAULT-NISSAN ALLIANCE
CORPORATE GOVERNANCE &INTERNAL CONTROL
CEO MESSAGEINTRODUCTIONCONTENTS THIRD-PARTY ASSURANCE
ENVIRONMENT
NISSAN’S CSR MANAGEMENTNISSAN’S CSR STRATEGIES
NISSAN MOTOR CORPORATION SUSTAINABILITY REPORT 2017
CSR DATA
(FY)
Unit 2013 2014 2015 2016
Allowance t-CO2 48,124 46,194 45,824 43,424
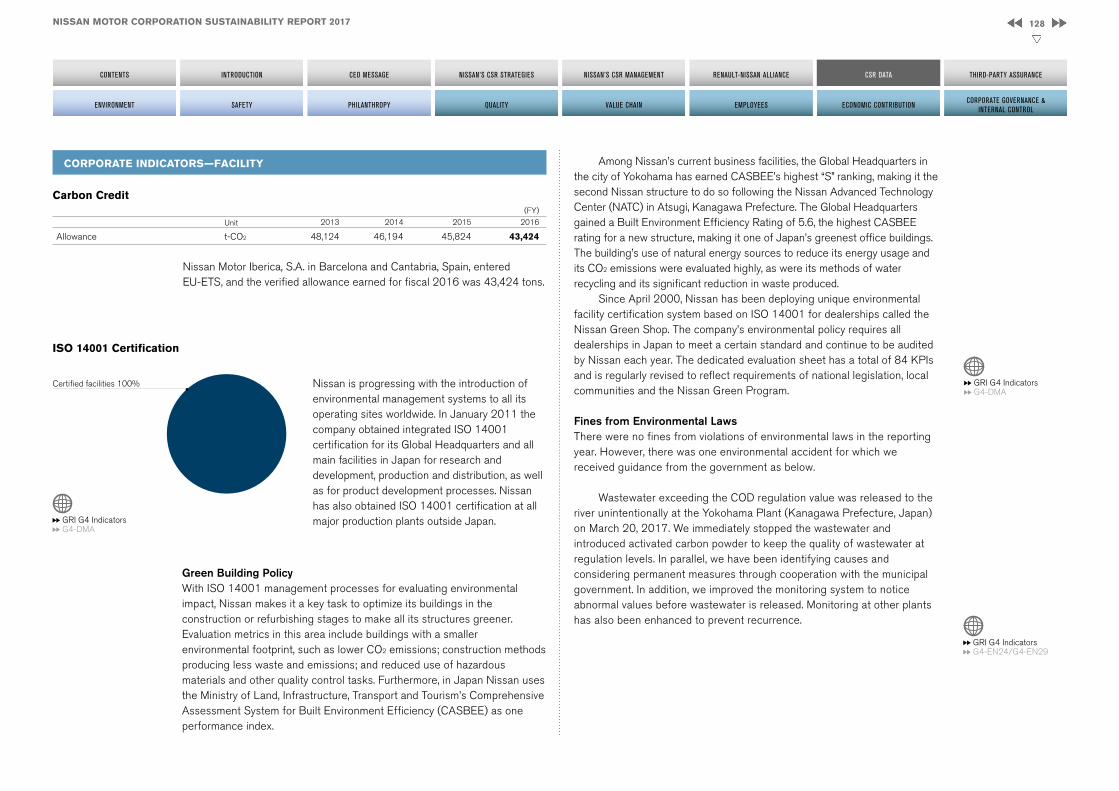
Nissan is progressing with the introduction of environmental management systems to all its operating sites worldwide. In January 2011 the company obtained integrated ISO 14001 certification for its Global Headquarters and all main facilities in Japan for research and development, production and distribution, as well as for product development processes. Nissan has also obtained ISO 14001 certification at all major production plants outside Japan.
Certified facilities 100%
GRI G4 Indicators G4-DMA
CORPORATE INDICATORS—FACILITY
Carbon Credit
ISO 14001 Certification
Nissan Motor Iberica, S.A. in Barcelona and Cantabria, Spain, entered EU-ETS, and the verified allowance earned for fiscal 2016 was 43,424 tons.
Among Nissan’s current business facilities, the Global Headquarters in the city of Yokohama has earned CASBEE’s highest “S” ranking, making it the second Nissan structure to do so following the Nissan Advanced Technology Center (NATC) in Atsugi, Kanagawa Prefecture. The Global Headquarters gained a Built Environment Efficiency Rating of 5.6, the highest CASBEE rating for a new structure, making it one of Japan’s greenest office buildings. The building’s use of natural energy sources to reduce its energy usage and its CO2 emissions were evaluated highly, as were its methods of water recycling and its significant reduction in waste produced.
Since April 2000, Nissan has been deploying unique environmental facility certification system based on ISO 14001 for dealerships called the Nissan Green Shop. The company’s environmental policy requires all dealerships in Japan to meet a certain standard and continue to be audited by Nissan each year. The dedicated evaluation sheet has a total of 84 KPIs and is regularly revised to reflect requirements of national legislation, local communities and the Nissan Green Program.
Fines from Environmental LawsThere were no fines from violations of environmental laws in the reporting year. However, there was one environmental accident for which we received guidance from the government as below.
Wastewater exceeding the COD regulation value was released to the river unintentionally at the Yokohama Plant (Kanagawa Prefecture, Japan) on March 20, 2017. We immediately stopped the wastewater and introduced activated carbon powder to keep the quality of wastewater at regulation levels. In parallel, we have been identifying causes and considering permanent measures through cooperation with the municipal government. In addition, we improved the monitoring system to notice abnormal values before wastewater is released. Monitoring at other plants has also been enhanced to prevent recurrence.
Green Building PolicyWith ISO 14001 management processes for evaluating environmental impact, Nissan makes it a key task to optimize its buildings in the construction or refurbishing stages to make all its structures greener. Evaluation metrics in this area include buildings with a smaller environmental footprint, such as lower CO2 emissions; construction methods producing less waste and emissions; and reduced use of hazardous materials and other quality control tasks. Furthermore, in Japan Nissan uses the Ministry of Land, Infrastructure, Transport and Tourism’s Comprehensive Assessment System for Built Environment Efficiency (CASBEE) as one performance index.
GRI G4 Indicators G4-DMA
GRI G4 Indicators G4-EN24/G4-EN29
128
SAFETY PHILANTHROPY QUALITY ECONOMIC CONTRIBUTIONEMPLOYEESVALUE CHAIN
RENAULT-NISSAN ALLIANCE
CORPORATE GOVERNANCE &INTERNAL CONTROL
CEO MESSAGEINTRODUCTIONCONTENTS THIRD-PARTY ASSURANCE
ENVIRONMENT
NISSAN’S CSR MANAGEMENTNISSAN’S CSR STRATEGIES
NISSAN MOTOR CORPORATION SUSTAINABILITY REPORT 2017
CSR DATA

GRI G4 Indicators G4-EN7/G4-EN27
Corporate Average Fuel Efficiency (CAFE, JC08 Mode) in Japan
PRODUCT INDICATORS
In fiscal 2016, mainly due to strong sales of the Note e-POWER, the average fuel economy improved to 19.5km/L in JC08 mode. Regarding the fiscal 2016 results for Japan, provisional values determined by Nissan are used.
(km/L)
(FY)
PRODUCT INDICATORS—FUEL ECONOMY, CO2
2005 2006 2011 2012 20132007 2008 2009 2010
14.213.6 14.0 14.015.3 16.1 16.3
18.219.7
2014 2015 20160
4
8
12
16
20
2420.0 19.519.7
GRI G4 Indicators G4-EN7/G4-EN27
PC LDT
Corporate Average Fuel Efficiency (CAFE) in the United States
In fiscal 2016, sales of Infiniti large-segment vehicles increased, resulting in CAFE of 40.6 MPG for passenger cars. CAFE for light-duty trucks improved by 5.1% from fiscal 2015 to 30.1 MPG.
(MPG)
(FY)
25.7
0
10
20
40
30
50
20012000 2002 2003 2004 2005 2006 2007 2008 2009 2010 2011 20132012
28.4 29.2 28.0 28.5 29.432.0 32.2 33.7 34.0 34.1 35.2
29.7
20.7 20.7 21.9 21.2 21.7 21.9 22.9 23.1 24.9 24.8 24.4
39.1
27.1
2014 20162015
40.0
27.5
40.641.3
29.526.2
20.8
30.1
129
SAFETY PHILANTHROPY QUALITY ECONOMIC CONTRIBUTIONEMPLOYEESVALUE CHAIN
RENAULT-NISSAN ALLIANCE
CORPORATE GOVERNANCE &INTERNAL CONTROL
CEO MESSAGEINTRODUCTIONCONTENTS THIRD-PARTY ASSURANCE
ENVIRONMENT
NISSAN’S CSR MANAGEMENTNISSAN’S CSR STRATEGIES
NISSAN MOTOR CORPORATION SUSTAINABILITY REPORT 2017
CSR DATA
2012 2013 2014 2015
137
131
115
2016
115
120
110
120
130
140
150
2013 2014
6.7 6.8
20162015
10.69.6
6.7
9.3
6.9
9.2
0
2
4
6
8
10
12
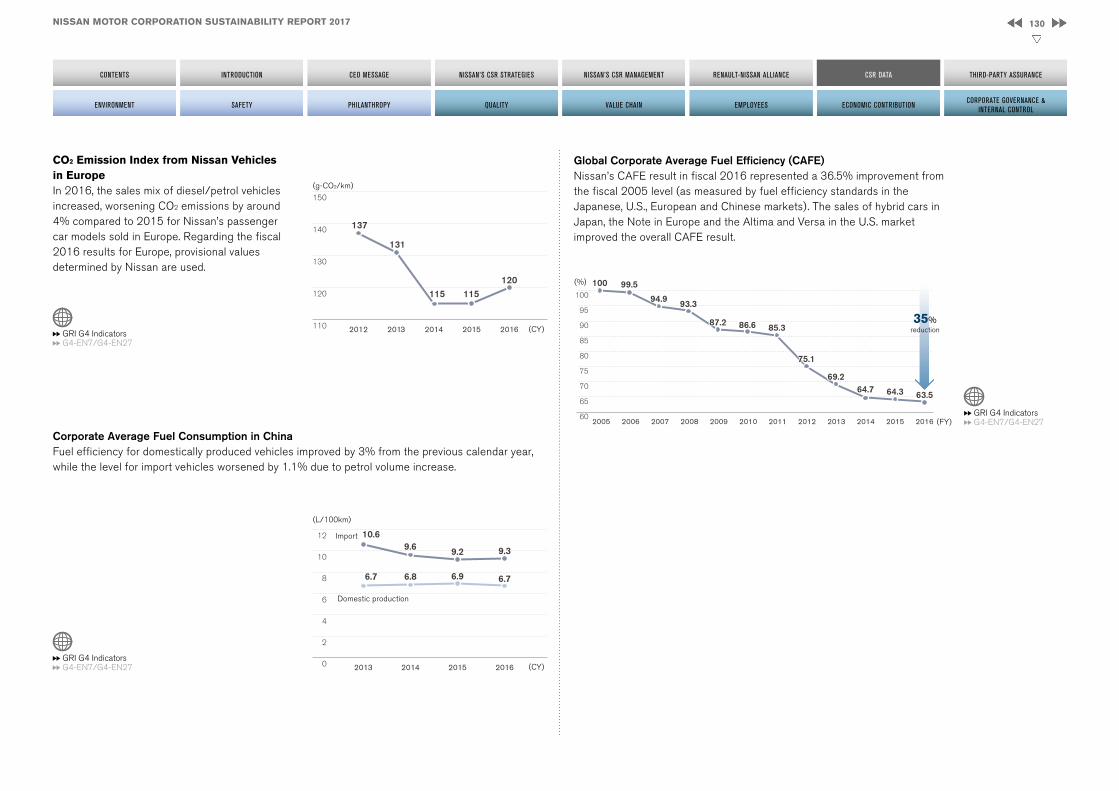
Corporate Average Fuel Consumption in ChinaFuel efficiency for domestically produced vehicles improved by 3% from the previous calendar year, while the level for import vehicles worsened by 1.1% due to petrol volume increase.
GRI G4 Indicators
GRI G4 Indicators
G4-EN7/G4-EN27
G4-EN7/G4-EN27
CO2 Emission Index from Nissan Vehicles in EuropeIn 2016, the sales mix of diesel/petrol vehicles increased, worsening CO2 emissions by around 4% compared to 2015 for Nissan’s passenger car models sold in Europe. Regarding the fiscal 2016 results for Europe, provisional values determined by Nissan are used.
(g-CO2/km)
(L/100km)
(CY)
(CY)
Import
Domestic production
Global Corporate Average Fuel Efficiency (CAFE)Nissan’s CAFE result in fiscal 2016 represented a 36.5% improvement from the fiscal 2005 level (as measured by fuel efficiency standards in the Japanese, U.S., European and Chinese markets). The sales of hybrid cars in Japan, the Note in Europe and the Altima and Versa in the U.S. market improved the overall CAFE result.
GRI G4 Indicators G4-EN7/G4-EN27
(%)
(FY)2010 2011 20162013 2014 201520122005 20072006 2008 2009
94.9
99.5
93.3
87.2 86.6 85.3
75.1
69.264.7 64.3
100
60
65
70
75
80
85
90
95
100
63.5
35%reduction
130
SAFETY PHILANTHROPY QUALITY ECONOMIC CONTRIBUTIONEMPLOYEESVALUE CHAIN
RENAULT-NISSAN ALLIANCE
CORPORATE GOVERNANCE &INTERNAL CONTROL
CEO MESSAGEINTRODUCTIONCONTENTS THIRD-PARTY ASSURANCE
ENVIRONMENT
NISSAN’S CSR MANAGEMENTNISSAN’S CSR STRATEGIES
NISSAN MOTOR CORPORATION SUSTAINABILITY REPORT 2017
CSR DATA

Applying EVs Toward a Zero-Emission Society
During fiscal 2016, Nissan started lending the e-NV200 for free for up to three years to 500 municipal governments and companies that proposed vehicle utilization plans to help improve urban development and solve administrative or corporate issues. Through this activity, Nissan is aiming to realize a zero-emission society.
The e-NV200, a multipurpose, zero-emission commercial vehicle, delivers a cruising range of 185-190 kilometers in Japan’s JC08 mode and is equipped with “Power Plug” outlets that can draw a maximum of 1,500W from the onboard battery. Nissan expects the proposed activities to take full advantage of the e-NV200’s clean, quiet operation and electric power availability. Assuming average cruising operation in Japan, the activities overall will mitigate approximately 1,450 tons of CO2 annually.
100% electric vehicles are excluded. From fiscal 2013, fuel economy in Japan is shown in JC08 mode.
Top Fuel Economy Models
GRI G4 Indicators G4-EN7/G4-EN27
(FY)
Region Model Unit 2016
Global Note e-POWER 1.2L km/L (JC08) 37.2Best selling model X-Trail (Rogue) km/L (JC08) 16.0~20.6Japan (excl. light vehicles) Note e-POWER 1.2L km/L (JC08) 37.2Japan (incl. light vehicles) Note e-POWER 1.2L km/L (JC08) 37.2Europe Micra 1.5L dCi + Stop/Start System g-CO2/km 85U.S. Versa 1.6L 2WD CVT MPG 35China Sylphy 1.6L 2WD CVT + Stop/Start System L/100km 5.2
131
SAFETY PHILANTHROPY QUALITY ECONOMIC CONTRIBUTIONEMPLOYEESVALUE CHAIN
RENAULT-NISSAN ALLIANCE
CORPORATE GOVERNANCE &INTERNAL CONTROL
CEO MESSAGEINTRODUCTIONCONTENTS THIRD-PARTY ASSURANCE
ENVIRONMENT
NISSAN’S CSR MANAGEMENTNISSAN’S CSR STRATEGIES
NISSAN MOTOR CORPORATION SUSTAINABILITY REPORT 2017
CSR DATA

12 37 107
15 34 112
37 12415
116
13114
5651
40 89 104
20
14
36 105
4218
19 23
12 16
18 33
12 30
17 25
13 24
0 10 20 30 40 50 60 70 80 90 100 110 120 130
14 34
Two-seaters
Minicompact Cars
Subcompact Cars
Compact Cars
Midsize Cars
Large Cars
Small Station Wagons
Midsize Station Wagons
Minivans
Passenger Vans
Small SUVs
Standard SUVs
Small Pickup Trucks
Standard Pickup Trucks
370Z (3.7L, 6cyl), 370ZRoadstar (3.7L, 6cyl)
GTR (3.8L, 6cyl)
Versa (1.6L, 4cyl)
Sentra (1.8L, 4cyl)Nissan LEAF (EV)
Juke (1.6L, 4cyl)
Quest (3.5L, 6cyl)
Murano Hybrid FWD (2.5L, 4cyl)
Rogue FWD/AWD (2.5L, 4cyl)
QX60 Hybrid FWD/AWD (2.5L, 4cyl)
Frontier 2WD (2.5L, 4cyl)
MPG
Nissan models
Fuel Economy LeadersThe Fuel Economy Guide published by the U.S. Environmental Protection Agency (EPA) and Department of Energy (DOE) helps buyers to choose the most fuel-efficient vehicle. Based on the Model Year 2016 Fuel Economy Guide, the all-electric Nissan LEAF was listed as a leader in the Midsize Cars category with a combined fuel economy of 114 MPGe.
Compiled from the Model Year 2016 Fuel Economy Guide by the U.S. Environmental Protection Agency (EPA) and Department of Energy (DOE).Left side of ranges ( ): conventional vehiclesRight side of ranges ( ): electric vehicles/plug-in hybrids
132
SAFETY PHILANTHROPY QUALITY ECONOMIC CONTRIBUTIONEMPLOYEESVALUE CHAIN
RENAULT-NISSAN ALLIANCE
CORPORATE GOVERNANCE &INTERNAL CONTROL
CEO MESSAGEINTRODUCTIONCONTENTS THIRD-PARTY ASSURANCE
ENVIRONMENT
NISSAN’S CSR MANAGEMENTNISSAN’S CSR STRATEGIES
NISSAN MOTOR CORPORATION SUSTAINABILITY REPORT 2017
CSR DATA

GRI G4 Indicators G4-EN27
UnitGasoline-powered vehicles
Diesel-powered vehicles
Natural-gas drive vehicles
Hybrid drive vehicles
Electric drive vehicles
Japan % 55.1 2.7
0.0 3.3 2.1 North America % 98.5 0.7
Europe % 47.7 49.2
Other % 90.7 8.4
PRODUCT INDICATORS – TECHNOLOGIES
Ratio of Powertrain Type (Shipment Base)
Sales of the all-electric Nissan LEAF—the world’s best-selling zero-emission car—surpassed 250,000 units in fiscal 2016. The ratio of EVs is steadily improving as the new Note e-POWER and a commercial EV, the e-NV200, were launched.
Green Product InnovationNissan believes it is important not only to develop and introduce zero-emission vehicles such as electric vehicles and fuel-cell vehicles, but also to improve the fuel economy of engine-powered vehicles. Nissan’s PURE DRIVE title is given to vehicles that not only meet existing fuel economy requirements in each market but clear more stringent internal standards which we periodically review in line with societal demands. PURE DRIVE implements innovative environmental technologies that maximize energy efficiency to lower fuel consumption and reduce CO2 emissions. Cars featuring these technologies are being marketed worldwide.
Number of 100% EV Units Sold
Number of ICE with CVT Units Sold
(K unit)
(M unit)
(FY)
(FY)
30
53
6661 63
2012 2013 2014 2015 20160
10
20
30
40
50
60
70
2.3
2.83.0 2.9 3.0
2012 2013 2014 2015 20160.0
0.5
1.0
1.5
2.0
2.5
3.0
3.5
0
30
60
90
120
150
180
71
101
71
95
176
2012 2013 2014 2015 2016
Number of HEV Units Shipped (K unit)
(FY)
Core Technologies for Green ProductsNissan strives to develop technologies that maximize the overall energy efficiency of internal combustion engines and improve transmission performance, as well as zero-emission technologies. Nissan’s core technologies in this area are lithium-ion batteries, Intelligent Dual Clutch Control Hybrid and the Xtronic transmission (Continuously Variable Transmission, or CVT) system.
The Note e-POWER represents 1.1% of global sales.
133
SAFETY PHILANTHROPY QUALITY ECONOMIC CONTRIBUTIONEMPLOYEESVALUE CHAIN
RENAULT-NISSAN ALLIANCE
CORPORATE GOVERNANCE &INTERNAL CONTROL
CEO MESSAGEINTRODUCTIONCONTENTS THIRD-PARTY ASSURANCE
ENVIRONMENT
NISSAN’S CSR MANAGEMENTNISSAN’S CSR STRATEGIES
NISSAN MOTOR CORPORATION SUSTAINABILITY REPORT 2017
CSR DATA

EVThe Nissan LEAF is now sold in 47 countries, with sales increasing every year. In 2016, total sales worldwide reached 250,000 vehicles. The second-generation LEAF newly launched in 2016 provides a longer driving range with a battery capacity improved from 24 kWh to 30 kWh.
Nissan also launched the company’s first commercial EV, the e-NV200, in the European and Japanese markets in 2014.
e-POWERNissan’s e-POWER powertrain combines a gasoline engine with an electric motor, enabling the low noise level of a motor-powered vehicle while offering excellent fuel efficiency. This powertrain was equipped in the new Note in Japan, which took the top spot in the Japan sales ranking for the compact segment in the second half of fiscal 2016.
HEVNissan launched the X-Trail Hybrid in fiscal 2015 with expansion of its electric vehicle (EV) mode and optimized system mode operation to offer 25% improved fuel economy compared to equivalent conventional vehicles, achieving top-level fuel economy in its class.
In fiscal 2013, Nissan launched two rear-wheel-drive vehicles, the Skyline and the Infiniti Q50, equipped with an original hybrid system. Nissan is also expanding use of its hybrid system for front-wheel-drive vehicles. The extremely compact system is combined with the Xtronic transmission in the fiscal 2013 Pathfinder and Infiniti QX60.
The Xtronic TransmissionNissan has achieved the goal of shipping 20 million Xtronic-equipped vehicles, with their fuel efficiency benefits, by fiscal 2016 from their first launch in 1992, thereby helping to reduce global CO2 emissions. Nissan sold 3.03 million Xtronic vehicles in fiscal 2016, bringing the cumulative total to 25 million.
(FY)
Unit 2015
Japan 75% lower than 2005 standard (SU-LEV) % 99Europe Euro 6b % 100 U.S. U-LEV/SULEV/ZEV % 98China National 5 % 100
While Nissan has zero-emission vehicles, the ultimate clean car, in its portfolio, the company endeavors to make the entire fleet as clean as possible by reducing exhaust emissions. Nissan has introduced vehicles that comply today with each region’s or country’s more stringent future emission regulations. Due to differences in regulations, there is no direct way to compare by region or country, but this shows the percentage of Nissan’s fleet in each location produced to the strictest standards of that region or country.
PRODUCT INDICATORS—OTHER EMISSIONS
GRI G4 Indicators G4-EN27
Compliance with Emission Regulations (Passenger Cars Only)
The compact segment includes small and ordinary passenger vehicles with engine displacement under 1,600 cc.
both PC & LCV
134
SAFETY PHILANTHROPY QUALITY ECONOMIC CONTRIBUTIONEMPLOYEESVALUE CHAIN
RENAULT-NISSAN ALLIANCE
CORPORATE GOVERNANCE &INTERNAL CONTROL
CEO MESSAGEINTRODUCTIONCONTENTS THIRD-PARTY ASSURANCE
ENVIRONMENT
NISSAN’S CSR MANAGEMENTNISSAN’S CSR STRATEGIES
NISSAN MOTOR CORPORATION SUSTAINABILITY REPORT 2017
CSR DATA

0 0 0 0 0 0 0 00
100
00
20
40
60
80
100
66 68 6967 70 71 72 73 74 75 76
0 011 14
47
8
20
0 00 0 00
20
40
60
80
100
65 66 68 6967 70 71 72 73 74 75 76
0 00
48
7
45
00
20
40
60
80
100
70 71 72 73 74 75 76
China
GRI G4 Indicators G4-EN27
Noise emissions are shown by the noise produced by the acceleration of vehicle in accordance with each national regulation. Only complete, built-up imported models are shown for China data.
(%)
(dB)
Japan Europe
Share of Noise Emissions
(%)
(dB)
(%)
(dB)
GRI G4 Indicators G4-EN27
Defined Chemical Substances
Regulated Chemical Substances In 2007, Nissan created a unified global approach to reducing environment-impacting substances. Since then the company has enhanced management of these substances and advanced plans to reduce or to replace their use. Through communication with NGOs, Nissan restricts usage of substances that have potential to be hazardous, that are thought to have a high risk of falling into this category or that have been identified as potential threats even if they are not covered by laws and regulations in each country where it does business. As defined in the Nissan Engineering Standard (NES) titled “Restricted Use of Substances,” these substances are banned or subject to controls in line with this approach. Nissan is working to apply this standard from the early development phase onward to the modules, raw materials and service parts that go into all Nissan vehicles. In fiscal 2016, the company revised its standard for assessment of hazards and risks in the Renault-Nissan Alliance, actively applying restrictions to substances that are increasingly the subject of consideration around the world going beyond regulation. As a result, the number of substances covered by the NES rose to 3,216.
(Substances)
(FY)2012 2013 2014 2015
2,882 2,896 2,897
3,2163,216
20161,000
1,500
2,000
2,500
3,500
3,000
135
SAFETY PHILANTHROPY QUALITY ECONOMIC CONTRIBUTIONEMPLOYEESVALUE CHAIN
RENAULT-NISSAN ALLIANCE
CORPORATE GOVERNANCE &INTERNAL CONTROL
CEO MESSAGEINTRODUCTIONCONTENTS THIRD-PARTY ASSURANCE
ENVIRONMENT
NISSAN’S CSR MANAGEMENTNISSAN’S CSR STRATEGIES
NISSAN MOTOR CORPORATION SUSTAINABILITY REPORT 2017
CSR DATA

Nissan introduced its new e-POWER system in fiscal 2016, marking another significant milestone in the electrification strategy with lifecycle emission improvements. Calculations show that e-POWER reduces CO2 emissions by more than 32% over the vehicle’s lifecycle compared to the previous-generation Note and by 18% compared to same the same-generation Note.
Unlike a full EV, an electrified e-POWER vehicle only requires small battery as the system is supported by a gasoline engine as its power source for charging. This means that emissions at the manufacturing stage can be kept at a lower level, similar to that for gasoline-powered vehicles. Nissan is also making efforts to reduce CO2 emissions in manufacturing by improving the yield ratio of materials, using more efficient manufacturing processes and increasing the use of recycled materials. In the fuel-production and energy-use stages, the weight reduction and optimal energy management of e-POWER vehicles leads to lower CO2 emissions.
Nissan also continues to pursue technology development on electric powertrains, power savings on ancillary devices and the use of renewable energy to reduce CO2 emissions over the entire electrified vehicles’ lifecycle. In the end-of-life stage, used batteries can be utilized for energy storage and further contribute to CO2 emission reduction in society.
100
75
25
50
0
(%)
Previous Note(gas-powered)
Current Note(gas-powered)
Current Note(e-POWER)
Nissan uses the lifecycle assessment (LCA) method to evaluate and comprehensively assess environmental impact in all stages of the vehicle lifecycle, from resource extraction to production, transport, customer use and vehicle disposal. Climate change related to emissions is our primary concern, yet LCAs can also offer insights for management of environmental impacts beyond climate change. The company carries out LCAs for new technologies as they are introduced for better understanding and evaluation of their environmental impacts.
Company calculations show that the Nissan LEAF reduces CO2 emissions by up to 40% over its lifecycle compared to gasoline-powered vehicles of the same class. This assessment was certified by a third-party LCA assessment organization, the Japan Environmental Management Association for Industry.
PRODUCT INDICATORS—LIFECYCLE ASSESSMENTS (LCAs)
Lifecycle Assessment to Reduce Environmental Impact
CO2 Equivalent Emissions over Vehicle Lifecycle for Note e-POWER
100
75
25
50
0
CO2 Equivalent Emissions over Vehicle Lifecycle for Nissan LEAF
(%)
Nissan LEAFSame-class gas-powered car
■ ELV■ Maintenance■ Usage■ Fuel & Electricity Production■ Production & Logistics
■ ELV■ Maintenance■ Usage■ Fuel & Electricity Production■ Production & Logistics
CO2, CH4, N2O, etc.
CO2, CH4, N2O, etc.
Production in Japan, 100,000 km driving in Japan
Production in Japan, 100,000 km driving in Japan
136
SAFETY PHILANTHROPY QUALITY ECONOMIC CONTRIBUTIONEMPLOYEESVALUE CHAIN
RENAULT-NISSAN ALLIANCE
CORPORATE GOVERNANCE &INTERNAL CONTROL
CEO MESSAGEINTRODUCTIONCONTENTS THIRD-PARTY ASSURANCE
ENVIRONMENT
NISSAN’S CSR MANAGEMENTNISSAN’S CSR STRATEGIES
NISSAN MOTOR CORPORATION SUSTAINABILITY REPORT 2017
CSR DATA

Predecessor
Current
25
50
75
100CO2
CH4
N2O
NOx
SO2
NMVOC
Nissan has been working to enhance the application of the LCA method and to extend quantitative understanding of the environmental impact of its products, especially the most impactful top-selling models worldwide.
The global best-selling model in fiscal 2016, X-Trail (Rogue), shows a 23% emission improvement over the entire lifecycle compared to the predecessor model, while that of another top selling model, Altima (Teana), shows around 13% improvement. Both models show major emission reduction improvements at the fuel production and use stages.
With growing societal concerns over air quality, ocean acidification and eutrophication, Nissan has expanded the LCA study scope to chemical types beyond greenhouse gases.
Company calculations show that the current gasoline-powered Note has holistic environmental improvements over the lifecycle with approximately 9%-18% emission reduction for all targeted chemical types, as compared to the predecessor model. It creates well-balanced and holistic environmental benefits for society over the lifecycle.
Nissan also studies on products’ environmental impact over a wider range of segments, including small- to large-size gasoline-powered vehicles and zero-emission vehicles. In fiscal 2016, the LCA application rate as a percentage of total sales volume in the EU was more than 90%.
Global Top Selling Model’s Life Cycle Improvements Lifecycle Improvements beyond Climate Change
100
75
25
50
0
100
75
25
50
0
CO2 Equivalent Emissions Improvement in the New Model over
Vehicle Lifecycle
Emissions Improvement in the New Note over Vehicle Lifecycle
(%) (%)
■ Production & logistics ■ Fuel & electricity production ■ Usage ■ Maintenance ■ ELV Production in EU, 120,000 mile driving in EU Production in U.S., 120,000 mile driving in U.S.
Production in Japan, 100,000 km driving in Japan
Current Current
X-Trail (Rogue) Altima (Teana)
Predecessor Predecessor
Chemicals Environmental Impacts
CO2 – Carbon dioxide Global warming potential
CH4 – Methane Global warming potential, Photochemical ozone creation potential
N2O – Nitrous oxides Global warming potential
NOx – Nitrogen oxides Acidification potential, Photochemical ozone creation potential, Eutrophication Potential
SO2 – Sulphur dioxide Acidification potential, Photochemical ozone creation potential
NMVOC – Non-methane volatile organic compound Photochemical ozone creation potential
CO2, CH4, N2O, etc.
137
SAFETY PHILANTHROPY QUALITY ECONOMIC CONTRIBUTIONEMPLOYEESVALUE CHAIN
RENAULT-NISSAN ALLIANCE
CORPORATE GOVERNANCE &INTERNAL CONTROL
CEO MESSAGEINTRODUCTIONCONTENTS THIRD-PARTY ASSURANCE
ENVIRONMENT
NISSAN’S CSR MANAGEMENTNISSAN’S CSR STRATEGIES
NISSAN MOTOR CORPORATION SUSTAINABILITY REPORT 2017
CSR DATA

Material RatioNissan is increasing the use of renewable resources and recycled materials in addition to the traditional approach of using resources more efficiently to reduce reliance on them. The company’s efforts with respect to recycled materials are based on the thought that once a natural resource is extracted, it should continue to be used, while maintaining quality, to minimize environmental impact. Nissan has set a target of increasing the recycled material usage ratio per new vehicle for which production begins in fiscal 2016 by 25% in Japan, the United States and Europe. The data shown here represents the status in fiscal 2016.
GRI G4 Indicators G4-EN1/G4-EN2/
G4-EN27/G4-EN28
PRODUCT INDICATORS—MATERIALS, RECYCLING
Other: 10.4%
Thermoplastic resins: 11.2%
Elastomers: 2%
Thermosetting resins: 1%
Nonferrous metals: 14.7%Steel and iron: 60.6%
Recycled Material Ratio
For production, Nissan has focused efforts on using recycled materials containing steel, aluminum and plastics. As a result, recycled materials account for approximately 20% by weight in the average vehicle. For example, the recycled ratio of cast aluminum in vehicle components such as engine cylinders is over 90% in total. This calculation was based on Nissan production in fiscal 2010.
Other: 80%
Recycled materials: 20%
GRI G4 Indicators G4-EN2/G4-EN27
Recycled Plastic Usage in Vehicle
Automotive Shredder Residue to Landfill Ratio
Ratio of recycled plastic to total plastic was based on the best performance model in Europe. Recycled plastic use in fiscal 2016 was 13%.
Based on the Automobile Recycling Law in Japan, Nissan calculated the ratio of landfill to residue after removing ferrous and nonferrous metals from ELVs. Nissan achieved a zero landfill ratio in fiscal 2016 by enhancing recycling capability through the acquisition of additional facilities that comply with the law.
(%)
(FY)0
5
10
15
2012 2013 2014 2015
0.000.000.00 0.00
2016
0.00
RecyclingNissan has defined a long-term goal of maintaining global usage of these natural resources at 2010 levels through 2050.
Toward this end, Nissan is presently researching ways to increase the recovery rate further in order to reclaim and reuse valuable materials from end-of-life vehicles (ELVs). As of fiscal 2016, company calculations showed that Nissan had achieved a recovery rate of 99.7% in Japan.
From the early development stage, Nissan considers the use of highly recyclable materials and makes structural improvements for ease of recycling. Since the Note, launched in 2005, all new models have achieved a 95% or greater recyclability rate based on the national regulations on ELVs in regions such as Europe, Japan and Korea.
Other: 87%
Recycled plastic: 13%
138
SAFETY PHILANTHROPY QUALITY ECONOMIC CONTRIBUTIONEMPLOYEESVALUE CHAIN
RENAULT-NISSAN ALLIANCE
CORPORATE GOVERNANCE &INTERNAL CONTROL
CEO MESSAGEINTRODUCTIONCONTENTS THIRD-PARTY ASSURANCE
ENVIRONMENT
NISSAN’S CSR MANAGEMENTNISSAN’S CSR STRATEGIES
NISSAN MOTOR CORPORATION SUSTAINABILITY REPORT 2017
CSR DATA

PRODUCT INDICATORS—ELV PROGRAMS
ELV ProgramsNissan has joined forces with other automotive companies to promote the recycling of ELVs through dismantling and shredding. In fiscal 2016, the program in Japan achieved a final recovery ratio for ELVs of 99.7% (actual value), at the same time reducing the amount of automotive shredder residue (ASR) related landfill and incineration disposal to zero based on the calculation method provided by the Japanese government.
This program consists of three phases: First, any Nissan ELVs entering the dismantling process are recycled, including flat steel, cast aluminum, bumpers, interior plastic parts, wire harnesses and precious rare earth metals. Second, specific items such as lithium-ion batteries are collected individually and directed to a dedicated recycling process. Third, residues from the dismantling process are shredded and collected at a dedicated facility.
Since 2004, Nissan and seven other Japanese auto manufacturers have promoted this facility to recycle ASR. Aligned with the Automobile Recycling Law in Japan, this serves as an integral part of a system to recycle ASR effectively, smoothly and efficiently. Nissan is a team leader of this alliance.
Another activity is Nissan’s take-back system for ELVs in Europe. This network of Authorized Treatment Facilities was developed for individual countries in collaboration with contracted dismantlers, contracted service providers and governments to be aligned with the European ELV directive.
Targets set for four key initiatives under NGP2016 were fully achieved.
Activities for Zero-emission Vehicle PenetrationIn addition to promotional efforts to expand penetration of the 100% electric Nissan LEAF, Nissan has developed technologies, such as LEAF to Home and V2G (Vehicle to Grid), in order to realize a zero-emission society.
Activities for Expanding Fuel-efficient VehiclesIn addition to technological advances including variable compression ratio engine and CVT improvement and vehicle weight reduction, Nissan has introduced a broader lineup of hybrid vehicles, as well as promoting the penetration of the e-POWER powertrain that is equipped in the new Note.
Activities for Minimizing Corporate Carbon FootprintNissan has introduced higher-efficiency equipment and manufacturing processes, energy-saving measures, and the use of renewable energy such as that generated from biomass gas and wind power.
Activities for Minimizing Natural Resource UseIn collaboration with business partners, Nissan has collected steel and aluminum scrap generated during manufacturing and end-of-life aluminum wheel rims for reuse in new vehicles. In addition, Nissan developed a new electric motor that requires just 40% as much dysprosium as a conventional motor, and is currently implementing it in the Nissan LEAF.
RESULTS OF NISSAN GREEN PROGRAM 2016
Key Focus Area NGP2016 Target NGP2016 Results
Zero-emission vehicle penetration
Achieve number-one global market share
Achieved number-one cumulative sales and market share
Fuel-efficient vehicle expansion
Improve CAFE by 35% from FY2005
Improved by 36.5% (achieved in FY2014)
Corporate carbon footprint minimization
Reduce CO2 emissions of global corporate activities by 20% (t-CO2/vehicle, vs. FY2005)
Reduced by 22.3% (achieved in FY2014)
Natural resource use minimization
Increase recycled material usage ratio per new vehicle by 25%
Achieved rate of over 25%
139
SAFETY PHILANTHROPY QUALITY ECONOMIC CONTRIBUTIONEMPLOYEESVALUE CHAIN
RENAULT-NISSAN ALLIANCE
CORPORATE GOVERNANCE &INTERNAL CONTROL
CEO MESSAGEINTRODUCTIONCONTENTS THIRD-PARTY ASSURANCE
ENVIRONMENT
NISSAN’S CSR MANAGEMENTNISSAN’S CSR STRATEGIES
NISSAN MOTOR CORPORATION SUSTAINABILITY REPORT 2017
CSR DATA

Third-Party Assurance
THIRD-PARTY ASSURANCE
[Remarks] Basis of calculation for CO2 emissions, waste generated and water input subject to third-party assurance■ CO2 emissions from production sites: Calculated based on Nissan internal
standards. The energy use data of each site is based on invoices from suppliers, which are multiplied by a CO2 emissions coefficient publicly available for each production site.
■ CO2 emissions resulting from employees’ commutes: Calculated based on the GHG Protocol Scope 3 Standard. Specifically, the annual CO2 emissions resulting from each employee’s commute are calculated using a standard unit of measurement announced by Japan’s Ministry of Economy, Trade and Industry, Ministry of the Environment, and Ministry of Land, Infrastructure, Transport and Tourism. This figure is calculated on the basis that employees working at Global Headquarters commute by bus and other employees use cars that are vehicles designated by Nissan, based on the data they submit when applying for transportation allowances. This is multiplied by the number of employees at each facility or office.
■ CO2 emissions from the use of sold products: Calculated using the average regional CO2 emissions per vehicle multiplied by estimated average lifecycle mileage and multiplied by fiscal 2016 sales volumes. The average CO2 emissions for the use phase (including direct emissions only) per unit are calculated for each of our main regions (Japan, U.S., EU and China) and extrapolated from average emissions of these markets for other markets. The Sustainable Mobility Project (SMP) model issued by the International Energy Agency was used to determine estimated average lifecycle mileages.
■ Scope 3 emissions figures are estimates subject to varying inherent uncertainties.■ Waste generated from production sites of Nissan Motor Co., Ltd. in Japan:
Calculated based on Nissan internal standards. The discharged waste is based on data from truck scales at the sites or data reported by disposal contractors. All discharged waste within the sites concerned is targeted. However, nonsteady and irregular generated waste, waste generated in canteens, waste from permanently stationed companies at the sites, waste generated by external vendors and waste from construction are excluded. In addition, materials recycled in-house, used in reproduction (reused by Nissan) or recycled (as salable, valuable materials) are not categorized as generated waste.
■ Water input from production sites of Nissan Motor Co., Ltd. in Japan: Calculated based on Nissan internal standards. Water input is the water withdrawal amount according to billing meters or company meters installed on site. The water withdrawal amount includes drinking water (tap water), industrial-use water, underground water (spring/well water) and rainwater or the like.
140
RENAULT-NISSAN ALLIANCE
SAFETY PHILANTHROPY QUALITY ECONOMIC CONTRIBUTIONEMPLOYEESVALUE CHAINCORPORATE GOVERNANCE &
INTERNAL CONTROL
CEO MESSAGEINTRODUCTIONCONTENTS CSR DATA THIRD-PARTY ASSURANCE
ENVIRONMENT
NISSAN’S CSR MANAGEMENTNISSAN’S CSR STRATEGIES
NISSAN MOTOR CORPORATION SUSTAINABILITY REPORT 2017

Section Index Reference
G4-EN1 Materials used by weight or volume 117, 138
G4-EN2 Percentage of materials used that are recycled input materials 138
G4-EN3 Energy consumption within the organization 117, 118
G4-EN4 Energy consumption outside of the organization 125, 126, 127
G4-EN5 Energy intensity 118
G4-EN6 Reduction of energy consumption 118
G4-EN7 Reductions in energy requirements of products and services 129, 130, 131
G4-EN8 Total water withdrawal by source 117, 120, 121
G4-EN9 Water sources significantly affected by withdrawal of water _
G4-EN10 Percentage and total volume of water recycled and reused _
G4-EN11 Location and size of protected areas _
G4-EN12 Description of significant impacts in protected areas _
G4-EN13 Habitats protected or restored _
G4-EN14 Total number of IUCN Red List species in areas affected by operations _
G4-EN15 Direct greenhouse gas (GHG) emissions (Scope 1) 117, 119, 120
G4-EN16 Energy indirect greenhouse gas (GHG) emissions (Scope 2) 117, 119, 120
G4-EN17 Other relevant indirect greenhouse gas emissions 119, 125, 126, 127
G4-EN18 Greenhouse gas (GHG) emissions intensity 119, 120, 125
G4-EN19 Reduction of greenhouse gas (GHG) emissions 119, 125, 126
G4-EN20 Emissions of ozone-depleting substances (ODS) _
G4-EN21 NOx, SOx and other significant air emissions 117, 122, 123
G4-EN22 Total water discharge by quality and destination 117, 120, 121
G4-EN23 Total weight of waste by type and disposal method 117, 123, 124
G4-EN24 Total number and volume of significant spills 128
G4-EN25 Weight of transported, imported, exported, or treated hazardous waste _
G4-EN26 Areas affected by the reporting organization’s discharges of water and runoff _
G4-EN27 Extent of impact mitigation of environmental impacts of products and services 129, 130, 131, 133, 134, 135, 136, 137, 139
G4-EN28 Percentage of products sold and their packaging materials that are reclaimed by category 138
G4-EN29 Significant fines and noncompliance with environmental laws and regulations 128
G4-EN30 Environmental impacts of transporting products, goods, materials, and members of the workforce 119, 124, 125, 126
G4-EN31 Total environmental protection expenditures and investments by type 127
G4-EN32 Percentage of new suppliers that were screened using environmental criteria 23, 73
G4-EN33 Significant actual and potential negative environmental impacts in the supply chain and actions taken 23
G4-EN34 Number of grievances about environmental impacts filed, addressed, and resolved through formal grievance mechanisms _
GRI index (Environment)
141
RENAULT-NISSAN ALLIANCE
SAFETY PHILANTHROPY QUALITY ECONOMIC CONTRIBUTIONEMPLOYEESVALUE CHAINCORPORATE GOVERNANCE &
INTERNAL CONTROL
CEO MESSAGEINTRODUCTIONCONTENTS CSR DATA THIRD-PARTY ASSURANCE
ENVIRONMENT
NISSAN’S CSR MANAGEMENTNISSAN’S CSR STRATEGIES
NISSAN MOTOR CORPORATION SUSTAINABILITY REPORT 2017