Embed Size (px)
Citation preview

_________________________________________________________________________________________________
ENVIRONMENTAL ASSESSMENT
JOHN H. KERR DAM and RESERVOIR WATER CONTROL PLAN REVISION
VIRGINIA AND NORTH CAROLINA
December 2015 _________________________________________________________________________________________________
US Army Corps of Engineers
Wilmington
1
ENVIRONMENTAL ASSESSMENT JOHN H. KERR DAM and RESERVOIR WATER CONTROL PLAN REVISION
TABLE OF CONTENTS
TABLE OF CONTENTS ............................................................................ 1
1 INTRODUCTION ................................................................................ 6
PROJECT AUTHORITY .................................................................................. 6
PROJECT BACKGROUND AND LOCATION ..................................................... 6
PROJECT PURPOSE AND NEED .................................................................... 9
ALTERNATIVES ............................................................................................ 9 1.4.1 ALTERNATIVES ELIMINATED .............................................................................................................. 11
2 AFFECTED ENVIRONMENT ............................................................. 15
PHYSICAL RESOURCES .............................................................................. 15 2.1.1 LAND USE ............................................................................................................................................. 15 2.1.2 GEOLOGY AND SEDIMENTS ............................................................................................................... 17 2.1.3 FLOODPLAINS ...................................................................................................................................... 18
WATER RESOURCES .................................................................................. 18 2.2.1 FLOOD RISK MANAGEMENT OPERATIONS AT KERR RESERVOIR .................................................. 18 2.2.2 WATER QUALITY .................................................................................................................................. 22 2.2.3 HYDROPOWER ..................................................................................................................................... 24 2.2.4 WATER SUPPLY ................................................................................................................................... 25
BIOLOGICAL RESOURCES .......................................................................... 25 2.3.1 WETLANDS ........................................................................................................................................... 25 2.3.2 FISH AND WILDLIFE ............................................................................................................................. 27 2.3.3 ENDANGERED SPECIES ...................................................................................................................... 30
CULTURAL RESOURCES ............................................................................. 33
SOCIO-ECONOMIC RESOURCES .................................................................. 34 2.5.1 DEMOGRAPHICS .................................................................................................................................. 34 2.5.2 AGRICULTURE AND SILVICULTURE ................................................................................................... 35 2.5.3 RECREATION ........................................................................................................................................ 35
OTHER RESOURCES ................................................................................... 36 2.6.1 AIR QUALITY AND NOISE ..................................................................................................................... 36 2.6.2 CLIMATE................................................................................................................................................ 36 2.6.3 HAZARDOUS, TOXIC, AND RADIOACTIVE WASTES (HTRW) ............................................................ 37 2.6.4 AESTHETICS ......................................................................................................................................... 37
3 ENVIRONMENTAL EFFECTS ........................................................... 38
2
PROJECT PURPOSES AND PHYSICAL RESOURCES ..................................... 39 3.1.1 LAND USE ............................................................................................................................................. 41 3.1.2 GEOLOGY AND SEDIMENTS ............................................................................................................... 41 3.1.3 FLOODPLAINS ...................................................................................................................................... 41
WATER RESOURCES .................................................................................. 42 3.2.1 FLOOD RISK MANAGEMENT OPERATIONS AT KERR RESERVOIR .................................................. 42 3.2.2 WATER QUALITY .................................................................................................................................. 42 3.2.3 HYDROPOWER ..................................................................................................................................... 45 3.2.4 WATER SUPPLY ................................................................................................................................... 46
BIOLOGICAL RESOURCES .......................................................................... 47 3.3.1 WETLANDS ........................................................................................................................................... 47 3.3.2 FISH AND WILDLIFE ............................................................................................................................. 47 3.3.3 ENDANGERED SPECIES ...................................................................................................................... 48
CULTURAL RESOURCES ............................................................................. 48
SOCIO-ECONOMIC RESOURCES .................................................................. 50 3.5.1 DEMOGRAPHICS .................................................................................................................................. 50 3.5.2 AGRICULTURE AND SILVICULTURE ................................................................................................... 50 3.5.3 RECREATION ........................................................................................................................................ 51
OTHER RESOURCES ................................................................................... 51 3.6.1 AIR QUALITY AND NOISE ..................................................................................................................... 51 3.6.2 CLIMATE CHANGE................................................................................................................................ 52 3.6.3 HAZARDOUS, TOXIC, AND RADIOACTIVE WASTES (HTRW) ............................................................ 53 3.6.4 AESTHETICS ......................................................................................................................................... 53
CUMULATIVE IMPACTS ............................................................................... 53
RECOMMENDED PLAN (QRR) ...................................................................... 54
EXECUTIVE ORDERS (EO) ........................................................................... 54 3.9.1 EXECUTIVE ORDER (E.O.) 12898, FEDERAL ACTIONS TO ADDRESS ENVIRONMENTAL JUSTICE IN MINORITY POPULATIONS AND LOW-INCOME POPULATIONS (EO 12898). ............................................... 54 3.9.2 PROTECTION AND ENHANCEMENT OF ENVIRONMENTAL QUALITY (EO 11514) ........................... 55 3.9.3 PROTECTION AND ENHANCEMENT OF THE CULTURAL ENVIRONMENT (EO 11593) .................... 55 3.9.4 FLOODPLAIN MANAGEMENT (EO 11988) ........................................................................................... 56 3.9.5 PROTECTION OF WETLANDS (EO 11990) .......................................................................................... 56
4 COMPLIANCE WITH ENVIRONMENTAL REQUIREMENTS .................. 57
MONITORING .............................................................................................. 57
5 AGENCY AND PUBLIC INVOLVEMENT ............................................. 59
6 POINT OF CONTACT ....................................................................... 63
7 FINDING ......................................................................................... 64
8 REFERENCES ................................................................................ 65
3
LIST OF FIGURES Figure 1.1 Vicinity Map Figure 1.2 Plan View Figure 1.3 Quasi Run of River (QRR) vs Existing Operations Guide Curve and
Comparison Figure 2.1 Land use in study area Figure 2.2 Conservation Areas Figure 2.3 Kerr Reservoir elevations, releases, and storage Figure 3.1 Affected Environment Figure 3.2 Percent of time Kerr Reservoir flood storage pool is at elevation 300
feet NGVD 29 or higher of existing and QRR operations
LIST OF TABLES Table 1.1 J. H. Kerr Elevations and Storage Table 1.2 Existing Operations vs. QRR Table 2.1 Land Use for Upper and Lower Roanoke River Basin Table 2.2 Threatened and Endangered Species within the Roanoke River Basin Table 2.3 Income and poverty statistics by County Table 3.1 Comparison of Environmental Effects of the No Action Alternative with
the Recommended Plan Table 3.2 Average Annual Power Generation Table 3.3 Cultural Resources Erosion Monitoring Results Table 3.4 Estimated average annual increase in regional emissions of
greenhouse gases and criteria pollutants that could potentially result from implementation of the QRR alternative
Table 4.1 The relationship of the proposed action to Federal Laws and Policies
APPENDICES Appendix A Kerr Water Control Plan Update October 2015 Appendix B Cumulative Impacts

4
List of Acronyms AAHU Average Annual Habitat Units BOD Biochemical Oxygen Demand BGPA Bald and Golden Eagle Protection Act C Candidate CEQ Council on Environmental Quality CFR Code of Federal Regulations cfs Cubic Feet per Second COD Chemical Oxygen Demand DO Dissolved Oxygen E Endangered EA Environmental Assessment EFH Essential Fish Habitat EO Executive Order ER Engineering Regulation ESA Endangered Species Act EXP Experimental Population FCSA Feasibility Cost Sharing Agreement FERC Federal Energy Regulatory Commission FONSI Finding of No Significant Impact FSC Federal Species of Concern ft Foot or Feet GAP Geographic Approach to Planning HTRW Hazardous, Toxic, and Radioactive Waste MGC Modified Guide Curve mg/l Milligrams per Liter msl Mean Sea Level MW Megawatts NA No Action NC North Carolina NE No Effect NEPA National Environmental Policy Act NER National Ecosystem Restoration NGVD 29 National Geodetic Vertical Datum of 1929 NMFS National Marine Fisheries Service O&M Operations and Maintenance P Proposed PCB Polychlorinated Biphenyl QRR Quasi-Run-of-River QRR_GSME Quasi-Run-of-River with Growing Season Minimum Energy RRBROM Roanoke River Basin Reservoir Operations Model SAIPE Small Area Income and Poverty Estimates SEPA Southeastern Power Administration SRVC Sub Region Virginia/Carolinas T Threatened T&E Threatened and Endangered

5
USACE United States Army Corps of Engineers USFWS United States Fish and Wildlife Service VA Virginia WRDA Water Resources Development Act

6
ENVIRONMENTAL ASSESSMENT
JOHN H. KERR DAM and RESERVOIR WATER CONTROL PLAN REVISION
1 INTRODUCTION
PROJECT AUTHORITY The John H Kerr Dam and Reservoir Project (originally Buggs Island Reservoir) was authorized by the Flood Control Act of 1944 for the purpose of flood control, hydropower generation, recreation, low flow augmentation, “and other uses” as part of the comprehensive development of the Roanoke River Basin in Virginia and North Carolina. Water supply and the promotion and conservation of fish and wildlife resources and habitat were added as project purposes by the Water Supply Act of 1958 (P.L. 85-500) and the Fish and Wildlife Coordination Act of 1958 (P.L. 85-624), respectively. This Environmental Assessment (EA) analyzes a proposed operational change at John H. Kerr through the revision of the Water Control Plan (WCP) (Appendix A). The purpose of the operational change is to offset adverse impacts to the downstream riverine ecosystem caused by dam operations. The Corps’ existing authority to operate John H. Kerr Dam and Reservoir for flood control, hydroelectric power generation, and other uses, provides appropriate authority to make the proposed operational adjustment is the Flood Control Act of 1944. This authority will be implemented using ER 1110-2-240 “Water Control Management” and ER 1105-2-100 “Planning Guidance Notebook.”
PROJECT BACKGROUND AND LOCATION Prior to the decision to pursue operational changes at John H. Kerr through a Water Control Plan Revision, the Corps conducted a Section 216 feasibility study. The purpose of the study was to review the operation of the John H. Kerr Dam and Reservoir and to determine the advisability of modifying operations for the purpose of improving the quality of the environment in the overall public interest, as authorized under Section 216 of Public Law 91-611, the River and Harbor and Flood Control Act of 1970. Based on the interests of the Sponsors and opportunities for improvement identified to date, the study focused on examining the feasibility of addressing downstream environmental resource concerns in the Lower Roanoke River through changes in operations or structures at the John H. Kerr Dam and Reservoir. The non-federal cost sharing partners for this study were the Commonwealth of Virginia and the State of North Carolina.

7
Several alternatives were evaluated and the recommended plan was one that could be done by altering the Water Control Plan. A summary of the Kerr 216 study is available at http://www.saw.usace.army.mil/Missions/EcosystemRestorationCAPStudies/KerrWaterControlPlanUpdate.aspx. The study area for the Kerr 216 study, which is the area of effect for the proposed WCP revision, encompasses the Kerr Reservoir and approximately 1,917 square miles of watershed downstream of Kerr Dam. Kerr Dam is located on the Roanoke River, about 180 river-miles upstream from where the river enters the Albemarle Sound. The dam is in Mecklenburg County, Virginia, 20 miles downstream from Clarksville, Virginia, 18 miles upstream from the Virginia-North Carolina border, and 80 miles southwest of Richmond, Virginia. John H. Kerr Dam and Reservoir currently provides flood risk management, recreation, hydropower, water supply and fish and wildlife conservation to the public. The Reservoir is operated as a unit of a coordinated system of reservoirs in the Roanoke River basin, especially Dominion’s Gaston and Roanoke Rapids Dams located downstream of Kerr Dam. The Kerr project has a dependable hydroelectric generating capacity of 225,000 kilowatts. Kerr Reservoir covers nearly 50,000 acres at its normal summer pool elevation of 299.5 feet National Geodetic Vertical Datum of 1929 (NGVD 29) and extends about 39 miles up the Roanoke River. The impact area of the proposed WCP revision includes the Kerr Reservoir project and the Roanoke River Basin from Kerr Dam downstream to the Albemarle Sound. For this EA, the combined area will be referred to as the Lower Roanoke River Basin. The proposed impact area is located in Charlotte, Halifax, Mecklenburg, and Brunswick Counties of Virginia, and in Granville, Vance, Warren, Halifax, Northampton, Bertie, Martin and Washington Counties of North Carolina, and it is located in the 4th and 5th Congressional Districts of Virginia and the 1st and 13th Congressional Districts of North Carolina. Maps of the dam, reservoir, downstream areas, and study area are shown in Figures 1.1 and 1.2.

8
Figure 1.1 Vicinity Map.
Figure 1.2 Plan View.
John H. Kerr Study Area

9
PROJECT PURPOSE AND NEED The purpose is to determine the advisability of modifying operations for ecosystem restoration for the overall public interest. Regulated flows have reduced hydrologic variance in the system and resulted in changes in duration and timing of flood events as compared to pre-dam conditions. This has caused some areas lower in the floodplain to experience longer durations of flooding, and some areas higher in the floodplain to experience less frequent flooding, as compared to an unregulated system. The overall effect is the drier floodplain community types (mesic bottom) moving farther downslope and wetter community types (swamp forest) moving farther upslope, creating a “squeeze” of the middle (wet bottom) community type. The overall benefits to the floodplain ecosystem will serve as the basis for evaluating the alternatives. Kerr Reservoir, which was completed in 1952, is a significant regional resource. Operation of Kerr Reservoir is outlined in a water control plan, last updated in October 1995 (see http://epec.saw.usace.army.mil/KERRWCP.TXT). The primary project purposes authorized by Congress were flood control and hydroelectric power generation and other uses. No additional project purposes have been specifically added to the project since the Flood Control Act of 1944. However, additional purposes of the reservoir were authorized under general standing authorizations including the Flood Control Act of 1944 (recreational development), the Rivers and Harbors Act of 1958, the Flood Control Act of 1958, the Water Supply Act of 1958, and the Fish and Wildlife Coordination Act of 1958. These additional purposes include recreation, water supply, and fish and wildlife (including low flow augmentation. Additionally, under the standing authority of the 1958 Water Supply Act, a limited amount of the reservoir power pool has been re-allocated for water supply. Although recreation was not a specifically authorized project purpose of the reservoir, the reservoir does provide quality natural resource-based recreation for the area. The Water Control Plan indicates that “the project will be operated for recreation in the reservoir to the maximum extent possible without serious interference with the purposes of flood control and hydropower generation”. The Roanoke River Basin below Kerr Dam and Reservoir also represents one of the finest remaining contiguous bottomland hardwood forest ecosystems within the eastern United States. These forested wetlands, upland forests, and streams provide high quality diverse habitat for fish, waterfowl, and other wildlife.
ALTERNATIVES Potential management measures were developed for the Kerr 216 study through a collaborative process between the Corps, sponsors and the project stakeholders. Measures that were included were both structural features and operational (non-structural) changes to the Kerr Reservoir releases. Because
10
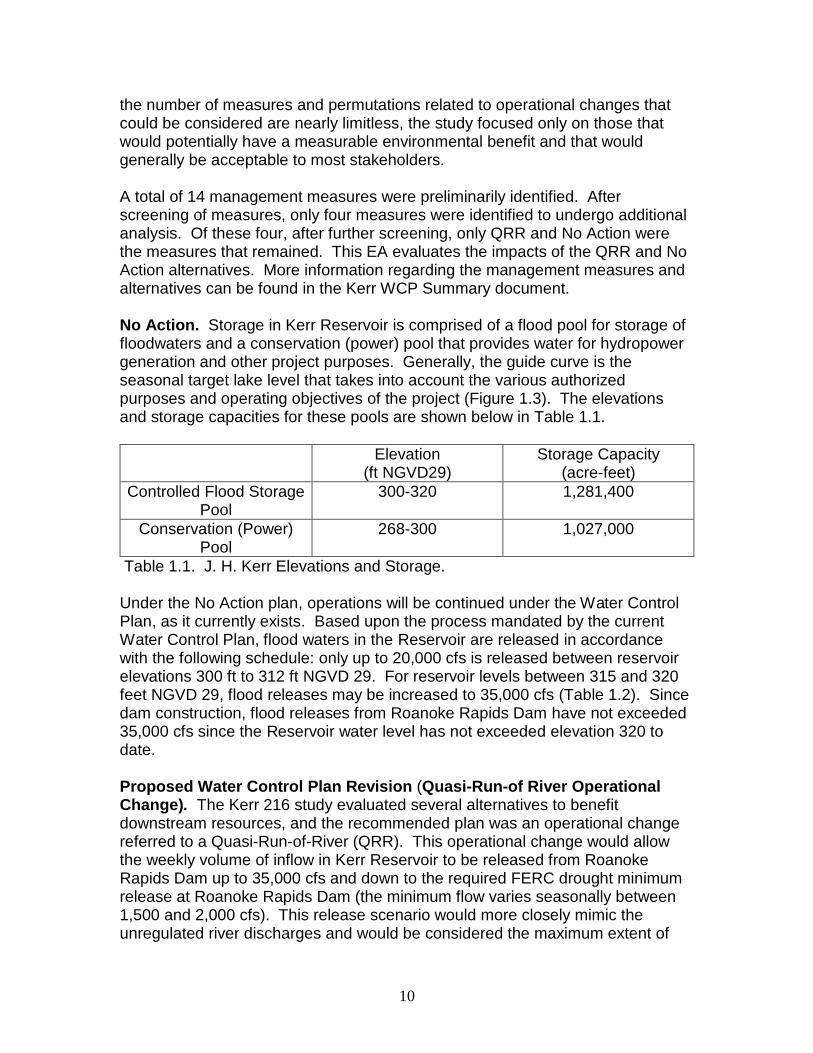
the number of measures and permutations related to operational changes that could be considered are nearly limitless, the study focused only on those that would potentially have a measurable environmental benefit and that would generally be acceptable to most stakeholders. A total of 14 management measures were preliminarily identified. After screening of measures, only four measures were identified to undergo additional analysis. Of these four, after further screening, only QRR and No Action were the measures that remained. This EA evaluates the impacts of the QRR and No Action alternatives. More information regarding the management measures and alternatives can be found in the Kerr WCP Summary document. No Action. Storage in Kerr Reservoir is comprised of a flood pool for storage of floodwaters and a conservation (power) pool that provides water for hydropower generation and other project purposes. Generally, the guide curve is the seasonal target lake level that takes into account the various authorized purposes and operating objectives of the project (Figure 1.3). The elevations and storage capacities for these pools are shown below in Table 1.1.
Elevation (ft NGVD29)
Storage Capacity (acre-feet)
Controlled Flood Storage Pool
300-320 1,281,400
Conservation (Power) Pool
268-300 1,027,000
Table 1.1. J. H. Kerr Elevations and Storage. Under the No Action plan, operations will be continued under the Water Control Plan, as it currently exists. Based upon the process mandated by the current Water Control Plan, flood waters in the Reservoir are released in accordance with the following schedule: only up to 20,000 cfs is released between reservoir elevations 300 ft to 312 ft NGVD 29. For reservoir levels between 315 and 320 feet NGVD 29, flood releases may be increased to 35,000 cfs (Table 1.2). Since dam construction, flood releases from Roanoke Rapids Dam have not exceeded 35,000 cfs since the Reservoir water level has not exceeded elevation 320 to date. Proposed Water Control Plan Revision (Quasi-Run-of River Operational Change). The Kerr 216 study evaluated several alternatives to benefit downstream resources, and the recommended plan was an operational change referred to a Quasi-Run-of-River (QRR). This operational change would allow the weekly volume of inflow in Kerr Reservoir to be released from Roanoke Rapids Dam up to 35,000 cfs and down to the required FERC drought minimum release at Roanoke Rapids Dam (the minimum flow varies seasonally between 1,500 and 2,000 cfs). This release scenario would more closely mimic the unregulated river discharges and would be considered the maximum extent of
11
what could be changed operationally, without drastically altering reservoir levels and the flood footprint.
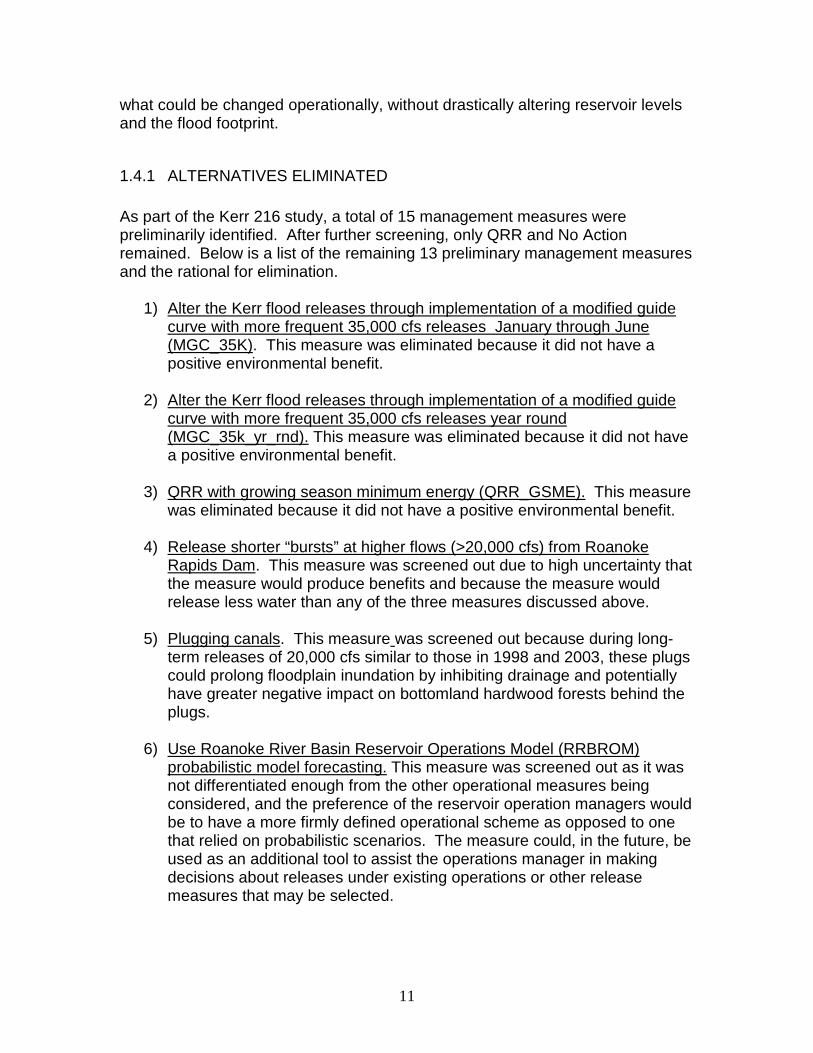
1.4.1 ALTERNATIVES ELIMINATED As part of the Kerr 216 study, a total of 15 management measures were preliminarily identified. After further screening, only QRR and No Action remained. Below is a list of the remaining 13 preliminary management measures and the rational for elimination.
1) Alter the Kerr flood releases through implementation of a modified guide curve with more frequent 35,000 cfs releases January through June (MGC_35K). This measure was eliminated because it did not have a positive environmental benefit.
2) Alter the Kerr flood releases through implementation of a modified guide
curve with more frequent 35,000 cfs releases year round (MGC_35k_yr_rnd). This measure was eliminated because it did not have a positive environmental benefit.
3) QRR with growing season minimum energy (QRR_GSME). This measure
was eliminated because it did not have a positive environmental benefit.
4) Release shorter “bursts” at higher flows (>20,000 cfs) from Roanoke Rapids Dam. This measure was screened out due to high uncertainty that the measure would produce benefits and because the measure would release less water than any of the three measures discussed above.
5) Plugging canals. This measure was screened out because during long-
term releases of 20,000 cfs similar to those in 1998 and 2003, these plugs could prolong floodplain inundation by inhibiting drainage and potentially have greater negative impact on bottomland hardwood forests behind the plugs.
6) Use Roanoke River Basin Reservoir Operations Model (RRBROM) probabilistic model forecasting. This measure was screened out as it was not differentiated enough from the other operational measures being considered, and the preference of the reservoir operation managers would be to have a more firmly defined operational scheme as opposed to one that relied on probabilistic scenarios. The measure could, in the future, be used as an additional tool to assist the operations manager in making decisions about releases under existing operations or other release measures that may be selected.
12
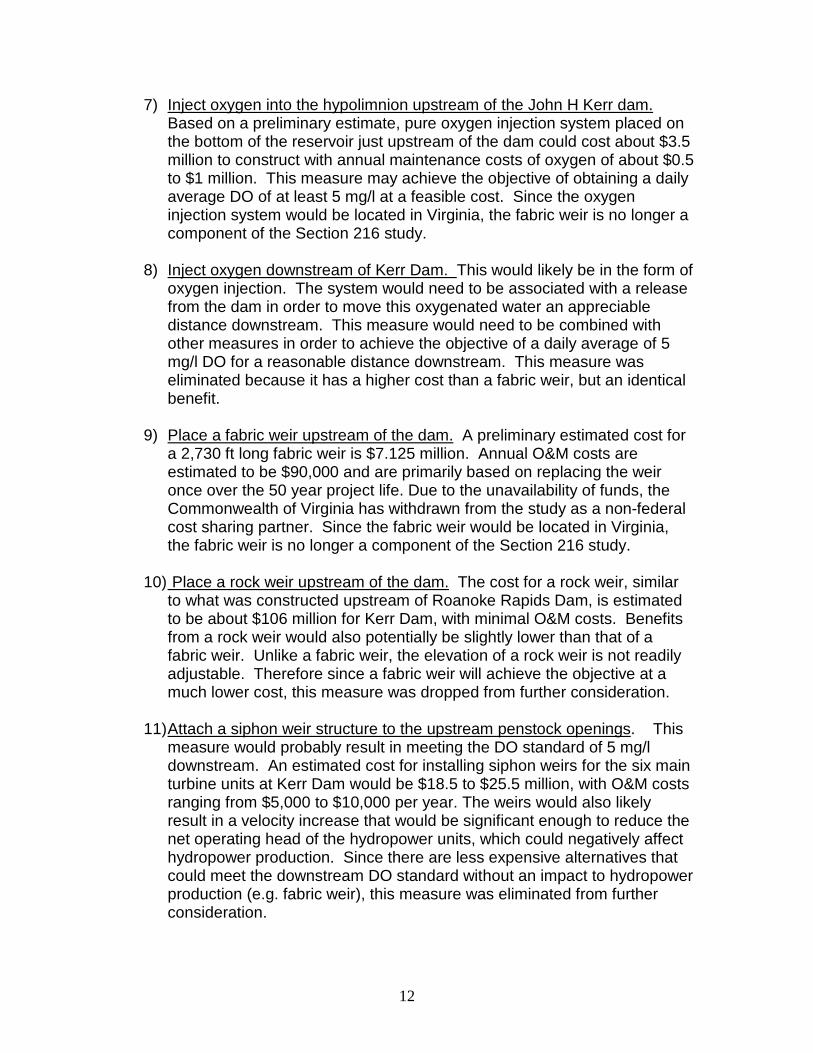
7) Inject oxygen into the hypolimnion upstream of the John H Kerr dam. Based on a preliminary estimate, pure oxygen injection system placed on the bottom of the reservoir just upstream of the dam could cost about $3.5 million to construct with annual maintenance costs of oxygen of about $0.5 to $1 million. This measure may achieve the objective of obtaining a daily average DO of at least 5 mg/l at a feasible cost. Since the oxygen injection system would be located in Virginia, the fabric weir is no longer a component of the Section 216 study.
8) Inject oxygen downstream of Kerr Dam. This would likely be in the form of oxygen injection. The system would need to be associated with a release from the dam in order to move this oxygenated water an appreciable distance downstream. This measure would need to be combined with other measures in order to achieve the objective of a daily average of 5 mg/l DO for a reasonable distance downstream. This measure was eliminated because it has a higher cost than a fabric weir, but an identical benefit.
9) Place a fabric weir upstream of the dam. A preliminary estimated cost for a 2,730 ft long fabric weir is $7.125 million. Annual O&M costs are estimated to be $90,000 and are primarily based on replacing the weir once over the 50 year project life. Due to the unavailability of funds, the Commonwealth of Virginia has withdrawn from the study as a non-federal cost sharing partner. Since the fabric weir would be located in Virginia, the fabric weir is no longer a component of the Section 216 study.
10) Place a rock weir upstream of the dam. The cost for a rock weir, similar to what was constructed upstream of Roanoke Rapids Dam, is estimated to be about $106 million for Kerr Dam, with minimal O&M costs. Benefits from a rock weir would also potentially be slightly lower than that of a fabric weir. Unlike a fabric weir, the elevation of a rock weir is not readily adjustable. Therefore since a fabric weir will achieve the objective at a much lower cost, this measure was dropped from further consideration.
11) Attach a siphon weir structure to the upstream penstock openings. This
measure would probably result in meeting the DO standard of 5 mg/l downstream. An estimated cost for installing siphon weirs for the six main turbine units at Kerr Dam would be $18.5 to $25.5 million, with O&M costs ranging from $5,000 to $10,000 per year. The weirs would also likely result in a velocity increase that would be significant enough to reduce the net operating head of the hydropower units, which could negatively affect hydropower production. Since there are less expensive alternatives that could meet the downstream DO standard without an impact to hydropower production (e.g. fabric weir), this measure was eliminated from further consideration.

13
12) Place surface water pumps in the epilimnion upstream of the dam. This type of device has typically only been marginally effective in large, deep reservoirs like Kerr; therefore, this measure is not likely to obtain the objective of achieving a daily average DO of 5 mg/l. The construction and operation costs for this measure have not been estimated but it is anticipated to be much higher than oxygen injection upstream of the dam or a fabric weir. Therefore this measure was eliminated from further consideration.
13) Modify power generation to include night time and/or weekend releases
via the vented turbines. Recent tests using a single turbine indicated that periodic releases of water through vented turbines at night reduces the DO sag for about one mile downstream of the dam. Larger releases using multiple turbines at typical non-generation periods at night and weekends may elevate DO conditions further downstream, but it is doubtful the effect would reach 6 miles downstream to the US 1 bridge unless generation was continuous for several hours. However, impacts on hydropower generation could be high during non-peak hours and this action would likely need to be done most every night during the summer. Therefore this measure was eliminated from further consideration.

14
Figure 1.3 Quasi Run of River (QRR) vs Existing Operations Guide Curve and Comparison.
Existing Operations Quasi Run of River
Kerr Lake Level (ft, NGVD29)
Roanoke Rapids
Releases (cfs)
Roanoke Rapids Releases (cfs)
below 300 up to 8000 • Above QRR Guide Curve (GC): Weekly Outflows ≈ Weekly Inflows up to 35,000 cfs.
• Below GC: Minimum energy (equals or exceeds FERC minimum releases at Roanoke Rapids Dam).
• Above elev 320: Existing Operations.
• Comply with fishery releases April 1-June 15, if feasible.
300 – 312 20,000
312 – 315 25,000
315 – 320 35,000
320 – 321 85% of inflow
321 inflow
Table 1.2. Existing Operations vs. QRR.

15
2 AFFECTED ENVIRONMENT This Section describes significant, physical, biological, cultural, and socioeconomic resources located in the Lower Roanoke River Basin, which is the area of potential impact for the WCP revision.
PHYSICAL RESOURCES
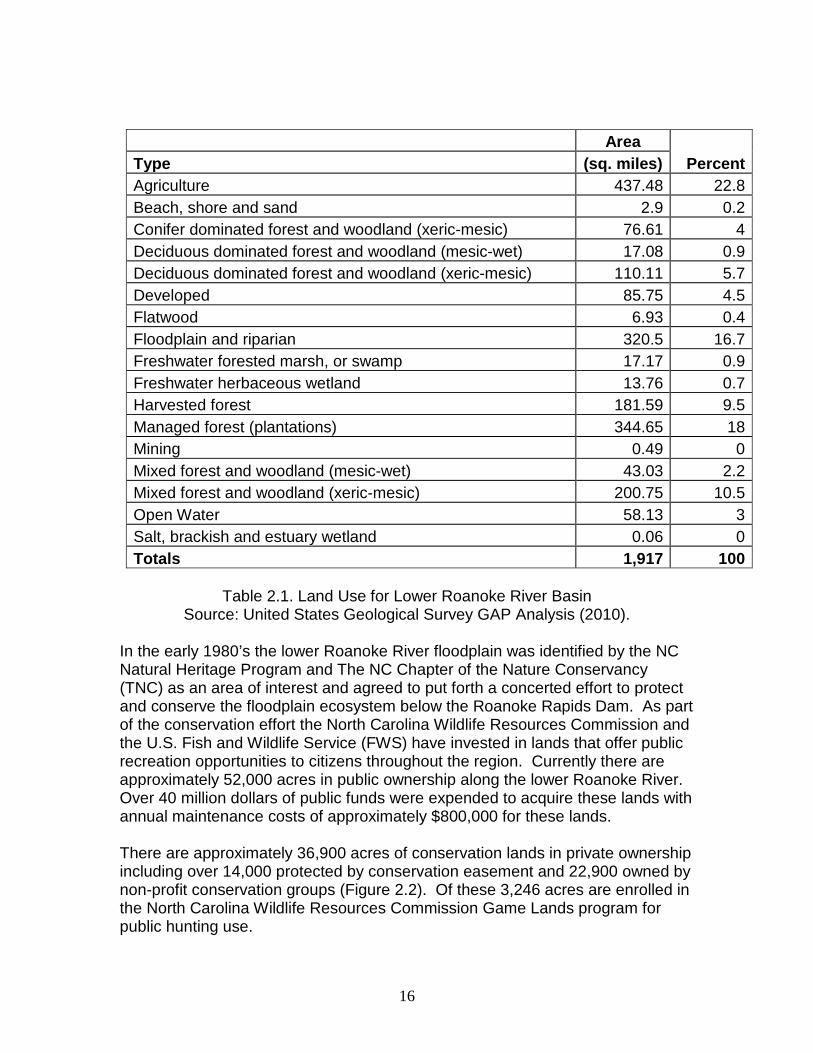
2.1.1 LAND USE The entire Roanoke River Drainage area is about 9,700 square miles. The project study area encompasses Kerr Reservoir and the approximately 1,917 square miles of the lower Roanoke River Basin. Figure 2.1 shows the extent of general land use categories in the study area, based on the 2010 USGS Geographic Approach to Planning Analysis Program (GAP) land use dataset (USGS 2010). Table 2.1 indicates the acreages and the percentage of the total area encompassed for some more detailed land use categories, derived from the same dataset.
Figure 2.1 Land Use in Study Area (USGS 2010).
Albemarle Sound
16
Area Percent Type (sq. miles)
Agriculture 437.48 22.8 Beach, shore and sand 2.9 0.2 Conifer dominated forest and woodland (xeric-mesic) 76.61 4 Deciduous dominated forest and woodland (mesic-wet) 17.08 0.9 Deciduous dominated forest and woodland (xeric-mesic) 110.11 5.7 Developed 85.75 4.5 Flatwood 6.93 0.4 Floodplain and riparian 320.5 16.7 Freshwater forested marsh, or swamp 17.17 0.9 Freshwater herbaceous wetland 13.76 0.7 Harvested forest 181.59 9.5 Managed forest (plantations) 344.65 18 Mining 0.49 0 Mixed forest and woodland (mesic-wet) 43.03 2.2 Mixed forest and woodland (xeric-mesic) 200.75 10.5 Open Water 58.13 3 Salt, brackish and estuary wetland 0.06 0 Totals 1,917 100
Table 2.1. Land Use for Lower Roanoke River Basin
Source: United States Geological Survey GAP Analysis (2010). In the early 1980’s the lower Roanoke River floodplain was identified by the NC Natural Heritage Program and The NC Chapter of the Nature Conservancy (TNC) as an area of interest and agreed to put forth a concerted effort to protect and conserve the floodplain ecosystem below the Roanoke Rapids Dam. As part of the conservation effort the North Carolina Wildlife Resources Commission and the U.S. Fish and Wildlife Service (FWS) have invested in lands that offer public recreation opportunities to citizens throughout the region. Currently there are approximately 52,000 acres in public ownership along the lower Roanoke River. Over 40 million dollars of public funds were expended to acquire these lands with annual maintenance costs of approximately $800,000 for these lands. There are approximately 36,900 acres of conservation lands in private ownership including over 14,000 protected by conservation easement and 22,900 owned by non-profit conservation groups (Figure 2.2). Of these 3,246 acres are enrolled in the North Carolina Wildlife Resources Commission Game Lands program for public hunting use.

17
Figure 2.2 Conservation Areas.
2.1.2 GEOLOGY AND SEDIMENTS The study area is comprised of two main physiographic regions—the Piedmont and the Atlantic Coastal Plain. The Piedmont section of the study area includes the Kerr Reservoir to approximately Roanoke Rapids, North Carolina. Underlying geologic formations of this physiographic region are typified by Precambrian and Paleozoic metamorphic and igneous rock (USGS 2000). The fall line that occurs around Roanoke Rapids represents the area where the Paleozoic metamorphic rocks of the Piedmont give way to the softer alluvial deposits and sedimentary rock of the Coastal Plain (USGS 2000). The project area within the Atlantic Coastal Plain physiographic region includes the lower section of the Roanoke River from the Roanoke Rapids Dam to the Albemarle
18
Sound. The Atlantic Coastal Plain physiographic region is characterized by Tertiary marine deposited sedimentary rock (Hupp et al.1996). The geology of the Roanoke River downstream of the Roanoke Rapids Dam is the Yorktown Formation which is characterized by fossiliferous clay with varying amounts of fine-grained sand, and shell material commonly concentrated in lenses.
Soils downstream of the Roanoke Rapids Dam along the Roanoke River floodplain mainly consist of nearly level, poorly drained loamy soils. The Natural Resources Conservation Service (NRCS) Soil Surveys for Halifax, Northampton Martin, Bertie and Washington Counties show the general soil types along much of the Roanoke River to be Wehadkee-Congaree along the north side of the river and Chewacla along the south. As the river gets closer to the Albemarle Sound the soils have been mapped in the NRCS Soil Survey of Washington County as being the Dorovan series which is characterized as very poorly drained, mucky, predominated saturated soils (USDA, NRCS 1981). These soils are classified as hydric soils. Hydric soils are "soil that formed under conditions of saturation, flooding, or ponding long enough during the growing season to develop anaerobic conditions in the upper part" (USDA, NRCS 2010).
2.1.3 FLOODPLAINS The floodplains located within the Roanoke River Basin are some of the largest in North Carolina with areas reaching up to five miles wide near Albemarle Sound. Water found in the floodplain is generally a combination of precipitation, groundwater and/or surface water which is conveyed to the floodplain during overbank flooding events (Brinson 1993). Some of the features found within the Roanoke River floodplain landscape include levees, swamp sloughs, a series of ridges and swales, and abandoned river channels. These distinctive features cover over 150,000 acres adjacent to the Roanoke River and provide a diverse habitat for birds, herptiles, (reptiles and amphibians) mammals, and fish (USFWS 2006). Bottomland hardwood floodplains especially provide several major benefits including: nutrient retention, groundwater recharge, flood storage, wildlife habitat, strong biogeochemical activity, and areas of high biodiversity (Brinson 1993). See “Bottomland Hardwood Forests” below for more information.
WATER RESOURCES
2.2.1 FLOOD RISK MANAGEMENT OPERATIONS AT KERR RESERVOIR The Kerr Reservoir project operation is predicated on a seasonally varying guide curve. The guide curve elevation is the targeted lake level at which the water storage in the reservoir best serves current project purposes. The controlled flood storage at the reservoir is located between elevations 300 and 320 feet-mean sea level (msl, which is equivalent to NGVD 29). During flood operations, the Water Control Plan (http://epec.saw.usace.army.mil/KERRWCP.TXT)

19
dictates a discharge regime at Roanoke Rapids Dam dependent on the Kerr Reservoir level. This is illustrated in Figure 2.3 below. For Kerr Reservoir levels above guide curve but below 300 feet NGVD 29, discharges are typically limited to 8,000 cubic feet per second (cfs) at Roanoke Rapids Dam to reduce impacts on timber harvesting in the lower Roanoke River basin, especially below Hamilton. This discharge scenario is most common in the winter when the guide curve drops to 4.5 feet below the bottom of the flood storage pool. For reservoir levels between 300 and 312 feet NGVD 29, flood releases from Roanoke Rapids Dam may be increased to 20,000 cfs which inundates much of the bottomland hardwood forests. For reservoir levels between 312 and 315 feet NGVD 29, flood releases may be increased to 25,000 cfs. For reservoir levels between 315 and 320 feet NGVD 29, flood releases may be increased to 35,000 cfs. These latter two releases extend inundation beyond forests and begin flooding farm fields. From elevation 320 to 321, 85% of inflow is released and above elevation 321, outflow equals inflow. Since dam construction, flood releases from Roanoke Rapids Dam releases have not exceeded about 35,000 cfs since the reservoir water level has not exceeded elevation 320 to date.

20
Source: USACE 2014. Kerr Reservoir flood operations must also take into account downstream local drainage into Lake Gaston and Roanoke Rapids Reservoir. For example, during 35,000 cfs flood releases from Roanoke Rapids, releases from Kerr might only be about 33,000 cfs to allow for 2,000 cfs additional downstream local drainage into Lake Gaston and Roanoke Rapids Reservoir. The hydropower facilities at Kerr and Gaston Dams can both generate with flows over 35,000 cfs, with significant additional discharge capacity provided by flood control gates. However, the hydropower facility at Roanoke Rapids can only generate power up to a discharge of about 20,000 cfs. Therefore, any additional discharge above 20,000 cfs from Roanoke Rapids must be spilled (i.e., released without going through the turbines).

21
Flood management operations at the Reservoir may affect resources in the Lower Roanoke River Basin. Parts of the lower Roanoke River floodplain can typically be characterized as broad and flat. The lower Roanoke River channel conveyance capacity is approximately 20,000 cfs before substantial flooding over the existing natural river levees occurs. However, floodplain inundation into the bottomland hardwood forest is initiated via natural (creeks) and man-made (canals) breaches in the levees when the weekly average flow is at or above approximately 11,000 cfs. Releases in excess of 8,000 cfs average for 3 days or longer are known to interfere with downstream timber removal operations near Williamston; therefore, winter releases are currently limited to this rate when lake levels are above the winter guide curve (295.5 ft NGVD 29) but below the flood pool (300 ft NGVD 29). At flows below 8,000 cfs, drainage of water from the floodplain occurs. Under existing operations, economic damages from sustained high flows occur primarily to agricultural lands during the growing season, May-November. The growing season normally starts in March, but May was chosen since replanting after May 1 is generally not practicable due to a reduced yield. These agricultural damages begin when sustained flows exceed 20,000 cfs. At 20,000 cfs approximately 250 acres of agricultural lands are impacted, at 25,000 cfs approximately 604 acres are impacted, and at 35,000 cfs, an estimated 1,631 acres are impacted. Overall for both agricultural and non-agricultural areas, the flood control operations at Kerr Reservoir have precluded releases higher than 35,000 cfs, and the average annual damages prevented over the last 34 years (1980-2013) have been about $11.4 million. This has ranged from $0 in a drought year like 2002 up to about $149 million in wet years like 1996. These dollar values are based on the indicated year estimates, and have not been updated to year 2015 values. Annual damages prevented are estimated based on stage damage curves developed for the lower Roanoke River. A representative curve can be found in the Kerr Reservoir Regulation Manual – Plate A-17 (USACE 1965). Flood releases for about the last 40 years have not exceeded an average daily value of 35,000 cfs from Roanoke Rapids Dam. However, average daily inflows to Kerr Reservoir over the same period exceeded 100,000 cfs during eight different years with one inflow exceeding 163,000 cfs. The most recent inflow approaching 100,000 cfs was 90,000 cfs in November 2009. During the 40 year period before construction of any of the dams, average daily flows exceeded about 100,000 cfs in eight different years, with one flow exceeding 250,000 cfs in August 1940 which resulted in massive flood damage that justified the need for Kerr Dam. Prior to construction of Kerr Dam, flood flows had a more rapid rise and decline, but with Kerr Dam in place these peaks have been reduced to no more than 35,000 cfs, which greatly reduces damages to structures and farmland.
22
However, the duration of flood releases (20,000 to 35,000 cfs) have been extended by several months in some cases. Even though damages caused by high flood peaks have been precluded, the extended duration of flood releases (20,000 to 35,000 cfs) has changed and is continuing to change the ecosystem of the lower Roanoke River. The controlled reduction of natural flooding by Kerr Dam results in longer duration flood flows downstream, albeit at lower depths of flooding. The management of natural flooding continues to provide numerous hydropower, agricultural, recreational, and real estate benefits to the area; however, the management of flooding has also had negative impacts. The impacts of flood flows of a long duration can include interruption of economic activities such as hunting leases, forestry operations, agricultural operations and recreation. The public lands along the lower River totaling approximately 52,000 acres, offer quality hunting opportunities to the general public who do not have access to the many private hunt clubs that lease or own lands along the lower river. Untimely and long duration floods often prevent hunters from being able to access hunting areas. Long duration and untimely flood events also interfere with many other recreational activities on the lower river such as bird watching, fishing, environmental education, photography, hiking etc
The impacts of prolonged flood events can also cause downstream ecosystem problems. Water is the driving force in creating and maintaining the ecological integrity of bottomland forest communities. When the timing and duration of flood events is significantly altered from what the floodplain and riverine ecosystem evolved with, the potential for ecological degradation of the natural communities results. Controlled flood releases can negatively affect the timing of critical annual environmental activities such as wildlife breeding, fish spawning, vegetation regeneration, and death and stress on canopy and understory vegetation as well as changes to the river’s channel morphology. Some agricultural impacts resulting from controlled flood releases can also occur, but much less than would occur without the dams. Upstream of the reservoir, minor impacts to roadways and recreation facilities begin whenever Kerr Reservoir rises to or above 303 feet NGVD 29, or 3 feet into the flood pool, with more significant impact above 305 feet NGVD 29. Reservoir levels at or above 320 are rare events and have not occurred during the 60 plus year history of the Kerr project. Elevation 320 is associated with a 50-year frequency flood event, and elevation 321 is associated with a 100-year frequency flood event.
2.2.2 WATER QUALITY Water quality standards for both Virginia and North Carolina apply to the study area. The Virginia designated use of the Roanoke River downstream of the Kerr Reservoir to the state line is classified for public water supply. Additional
23
information related to the Virginia designated classes are listed under Title 9 from the State Water Control Board (VDEQ, 2009). The Virginia 303 (d) list of impaired waters includes the Kerr Reservoir, Roanoke River, and Lake Gaston due to polychlorinated biphenyl (PCB) concentrations measured in fish tissue. North Carolina’s designated uses of the Roanoke River downstream of the state line to Jamesville, NC include water supply and primary and secondary recreation. Information related to the North Carolina designated water use classes is at the North Carolina Division of Water Quality Website http://portal.ncdenr.org/web/wq/ps/csu . The North Carolina 303 (d) list of waters not meeting water quality standards includes Lake Gaston, Roanoke Rapids Lake, and the Roanoke River. The Roanoke River from Roanoke Rapids Dam downstream to Jamesville, NC has been identified for impairment due to mercury. A half-mile upstream of Lake Gaston Dam downstream to Roanoke Rapids Dam has been listed for aquatic weeds. A segment of the Roanoke River from Highway 17 downstream to Jamesville, NC has been identified for dissolved oxygen (DO) impairment due to frequent values below the state standard of 5.0 mg/l during the warmer months. Reservoir operations affect water quality downstream including temperature, nutrient levels, and DO. Decreased DO levels may be indicative of too many bacteria (organic wastes) in the water, including untreated sewage; runoff from dairies, feedlots, and other agricultural operations; lawn clippings, top soil, and other materials from residential areas, land clearing activities such as logging or construction; and runoff from agricultural fields. Low DO levels in particular have been identified as an issue of concern, as low DO impairs habitat quality and has led to fish kills. Penstocks that provide water to the powerhouse turbines at Kerr Dam draw water from the lower portion of the reservoir (the hypolimnion), and in the warmer months, when the reservoir is stratified, this layer is oxygen depleted. During these months, releases from the dam can lower DO values below the state standard of a daily average of 5 mg/l (VDEQ, 2009) downstream in Lake Gaston for about 6 miles. These six miles are basically a riverine system beyond which the lentic influences of Lake Gaston dominate. Additionally, during non-peaking periods in the summer, DO levels downstream of the dam at night frequently decline to around 1 mg/l. In order to improve DO levels downstream of Kerr Dam, the six main turbines have been vented, which allows air to be entrained into the water. This work was completed in January 2012. When 3 or less of these vented turbines are used, this venting helps raise the downstream DO daytime values by 2-3 mg/l to frequently meet the state standard. However, DO values continue to decline at night to or below 2 mg/l. When all the vented turbines are used, DO does not improve downstream since venting efficiency greatly diminishes when more than four turbines are used. This is due to a decreased venturi effect of sucking air into the turbines with higher tailwater elevation below Kerr Dam with increased discharge.
24
The low DO levels generally do not extend below Lake Gaston Dam, as there is a submerged weir that is located just upstream of Lake Gaston Dam which permits only the oxygenated surface waters to flow downstream. There is also a similar weir just upstream of Roanoke Rapids Dam. The Gaston weir is primarily composed of concrete and the Roanoke Rapids weir is composed of rock rubble. However, during flood events in the warmer months, low DO releases from Kerr Dam may overwhelm the system and affect releases from Lake Gaston and Roanoke Rapids Dams. Measures to provide further improvements to DO were considered as part of the Kerr 216 study but were dropped due to costs. Other authorities may be explored in the future to improve low DO. A major concern for the lower Roanoke River is the effect of low DO concentrations during warm weather. When approximately 20,000 cfs is released over long periods of time, water tends to stand in the downstream swamps and the DO approaches zero due to biochemical oxygen demand (BOD) and chemical oxygen demand (COD). This low DO water eventually drains back into the river when discharge from the dam is reduced and the low DO values can result in fish kills. A Betterment Plan was developed by a multiagency group and was initiated to attempt to reduce this effect. When the Kerr Reservoir water levels were back near the guide curve, flood releases were stepped down in about 5,000 cfs increments from Roanoke Rapids Dam and each step was held for several days. Since implementation in 1998, this plan has been effective and no fish kills have occurred following protracted Kerr Reservoir flood releases.
2.2.3 HYDROPOWER Prior to turbine rehab completed in October 2010, Kerr Dam had a capacity of 225 megawatts (MW). Following the rehab, the capacity is 267 MW. The Roanoke Rapids station has a total capacity of 104 MW, and the Gaston Power hydro-station has a total capacity of 224 MW. The hydropower generated at Kerr Dam is managed through contracts between the SEPA and Duke Power and Dominion (Virginia/ North Carolina Power Company). The Wilmington District submits a weekly energy declaration of capacity and generation amounts to SEPA and the power companies. The declaration amount includes the minimum contractual firm energy for each week, plus any additional “secondary” energy needed to bring the lake level back down towards the guide curve or additional outflow for striped bass spawning season. These spawning releases are determined by collaboration between the Wilmington District and the North Carolina Wildlife Resources Commission to determine desirable spawning flows, subject to the availability of spawning storage (Section 2.3.2). During non-flood and non-striped bass spawn periods, daily power generation at Kerr Reservoir, Gaston, and Roanoke Rapids is coordinated and scheduled by Dominion. Dominion’s operation of the three projects adhere to the following guidelines 1) the weekly energy declaration amount for Kerr Reservoir is
25
generated, 2) the desired schedules of SEPA’s preference customers are met, 3) the FERC license minimum flows are met downstream of Roanoke Rapids, and 4) Lake Gaston and Roanoke Rapids Lake elevations are maintained within FERC license ranges. SEPA contracts do allow for Dominion to take additional power (overdraw) or less power (payback) on a limited basis each week according to their customer power demands or other constraints. During flood events (generally 20,000 cfs or greater), the Wilmington District dictates the flows to be released from Roanoke Rapids Dam. These flood operations typically equal and occasionally exceed the generation capacity at Roanoke Rapids; however, it does typically allow the power companies to continue “peaking” generation at Kerr Dam and Gaston Dam. “Peaking” is when hydropower facilities are operated during the portion of the day when the demand for electric power is the highest.
2.2.4 WATER SUPPLY Water supply was not an original congressionally authorized purpose of the Kerr Reservoir project. However, under the standing authority of the 1958 Water Supply Act, a limited amount of the conservation (power) pool can be reallocated for municipal and industrial water supply (Figure 2.3). Four local entities have acquired water supply storage which totals 21,115 acre-feet. This is just over 2% of the 1,027,000 acre-feet of conservation pool storage that exists between elevations 268 and 300 feet NGVD 29. These entities are the City of Virginia Beach, VA, Virginia Department of Corrections, Mecklenburg Cogeneration Limited Partnership (now Dominion Power), and the City of Henderson, NC. In addition, the City of Clarksville, VA, and Burlington Industries (no longer in operation) are small, grandfathered water supply users. Water released for flood control or hydropower does not diminish water available from these water supply storage accounts for these entities. Downstream water supply withdrawals below Roanoke Rapids Dam include both public water systems and industrial water users. Drought conditions can influence the location of the salt wedge in the lower river, but minimum release requirements under the Dominion FERC license (2,000 cfs for all months except 1,500 cfs September through November) generally precludes impacts on downstream water users except during severe droughts.
BIOLOGICAL RESOURCES
2.3.1 WETLANDS Wetlands are those areas that are inundated or saturated by surface or groundwater at a frequency and duration sufficient to support, and under normal circumstances do support, a prevalence of vegetation typically adapted for life in saturated soil conditions (33 C.F.R. § 328.3). Wetlands possess three essential

26
characteristics: hydrophytic vegetation, hydric soils, and wetland hydrology. The majority of wetlands in the lower Roanoke consist of floodplain forest. Throughout the floodplain forest ecosystem is a complex micro topography that was carved over several hundreds of years. Each feature can support a unique forest community relative to the hydrologic gradient on the floodplain. For example, a relief as little as three inches can mean the difference between an oak forest and a red maple/green ash forest. The result is a diversely-rich ecosystem that can support a variety of ecological niches and provide numerous ecological services. Most of the floodplain forest within the affected area of the lower Roanoke River floodplain consists of two major vegetation community types – swamp forest, covering approximately 38,000 acres and which is dominated by water tupelo, blackgum, and cypress; and about 54,000 acres of bottomland hardwood. The bottomland hardwood can be further broken out into two types, 29,000 acres of wet bottom (consisting largely of maple, oak, tupelo, sweetgum, box elder, sugarberry, and ash) and about 25,000 acres of mesic bottom (consisting of oak, sweetgum, beech, hickory and pine). According to USGS (1997), the bottomland hardwood forest that exists in the Roanoke River floodplain is one of the largest contiguous, relatively undisturbed examples of this forest type in the mid-Atlantic region. These bottomland hardwood forests are the most valuable forest type in the lower basin in terms of biological and ecological diversity, game value, timber value, and water quality enhancement. However, the extent of bottomland hardwood forests is also decreasing dramatically in the region. Between 1960 and 1975, the southeastern United States lost 429,963 acres of bottomland hardwood forest annually. In North Carolina, bottomland hardwood forests accounted for 8.9 percent of the total land area in 1970. From 1960 to 1975, these forests were lost at the rate of 30,023 acres per year, or one percent annually (Peet and Rice 1997). It is estimated that the entire 92,000 acres of floodplain forest along the lower Roanoke River are affected by altered hydrology due to current flood risk management operations at the Kerr Reservoir (TNC 2008). The forest dynamics along the lower Roanoke River are strongly influenced by longer duration floods especially those that occur during the growing season. During flood operations, certain portions of the forest can be inundated for extended periods during the growing season, and other areas are flooding less than they would under a natural hydrologic regime. The overall effect is a reduction in forested community diversity in the watershed. White and Peet (2013) found that there is one dominant group of tree species on the active floodplain: prolific seeders, with a high germination rate most years across a broad gradient, combined with fast growth. These species belong to a functional group consisting of species such as Fraxinus pennsylvanica (green ash) and Acer rubrum (red maple) that are moderately flood-tolerant, shade-tolerant, and have low-density wood. This group has high mortality in all seedling and sapling size classes, but consistent recruitment at least partially compensates for this mortality. Since these species are only moderately flood tolerant, a series of years with tolerable conditions is

27
necessary to enable growth out of the vulnerable seedling and sapling stage. The data suggest that other species that produce a more variable seed crop or are more specialized are not capable of survival and growth out of the seedling and sapling stage in the floodplain when subjected to long duration floods during the growing season. Examples of these include several species of oak and hickory, the hard mast producers that provide a valuable food source for multiple species of wildlife e.g., waterfowl, large and small mammals. As the hard mast producing tree species drop out of the floodplain forest the complexity of the forest ecosystem will be diminished reducing its ability to provide habitat for a variety of wildlife and its overall resilience to catastrophic events. Wilder et. al., 2012b concluded that the long duration flood events that the floodplain forest has been subjected to over the past five decades is stressing the trees in the lower Roanoke River. If the stresses persist species composition of the forest will shift and the degradation of the floodplain forest will continue. Another example of a case study of the Lower Roanoke River showed evidence that the vegetation communities along the Roanoke are becoming increasingly stratified due to the change in the natural flood regime caused by altered flood patterns from regulation by the upstream dams. This change in the natural inundation pattern is allowing for less flood tolerant species to become established in areas naturally inhabited by bottomland hardwood species thereby lowering the overall vegetative diversity of the floodplain (Richter et al. 1996). According to the Environmental Benefits Analysis performed for the floodplain forest, the habitat value of this resource will continue to decline over the next 50 years if releases from Kerr Reservoir are not changed.
2.3.2 FISH AND WILDLIFE The John H. Kerr Dam and Reservoir system and the lower Roanoke River Basin downstream of the dam provide a high-quality habitat for fish and wildlife. Wildlife resources include North Carolina’s largest population of wild turkey and critical habitat for the black bear; 214 species of birds including species such as wood ducks, bald eagles, barred owls, great blue herons, and cerulean warblers. There are 33 breeding neo-tropical migratory bird species and 88 additional species of breeding birds identified in the Roanoke River basin including 7 major heron nesting and breeding areas (TNC 2008). Concentrations of these wintering waterfowl, nesting ducks, raptors, osprey, and neo-tropical migrants represent the highest diversity of breeding birds in the North Carolina coastal plain including the largest inland heron rookery in North Carolina (USFWS 2006). However, the impacts of prolonged flood events at the wrong time can negatively affect the timing of critical annual environmental activities such as wildlife breeding and fish spawning disrupting the delicate balance of the timing and availability of life requisite resources. When prolonged flood events occur during the nesting season for wild turkeys along the Roanoke River, Cobb et. al. 1993 found that turkey recruitment was significantly reduced and forces turkeys to concentrate in isolated locations out of the bottomlands to locations where they
28
were more vulnerable to predators and increased legal and illegal harvest. The Swainson’s warbler, a high priority species as recognized by the FWS and NCWRC is a ground foraging bird that spends most of its time foraging for arthropods in the leaf litter. Nesting activity by ground foraging birds such as the Swainson’s warbler may be affected by long duration floods that occur during the growing season by reducing their food base which has negative implications on productivity (Neil Chartier pers. Comm.; Graves 2001; Thompson 2005; Savage 2009). The lower Roanoke River also provides an immense habitat for fish species such as striped bass, alewife, blueback herring, hickory shad, largemouth bass, white perch, bluegill, pumpkinseed, redear sunfish, yellow perch, and catfish. Other nongame species include the blueback herring, gizzard shad, carp, and suckers (USACE 2001). Efforts are being made to restore American shad, an anadromous species native to the Roanoke River basin, through cooperation with the NC Wildlife Resources Commission, US Fish and Wildlife Service, and Dominion. Shad fry are raised at hatcheries and then stocked in the basin every year. Stocks are evaluated by biologists each fall when the juveniles move downstream (NCWRC 2010). The goal is that the populations will become self-sustaining and stocking will no longer be needed. However, the altered flow regime on the river has significantly changed the morphology of the river channel below the Roanoke Rapids Dam which has implications for aquatic organisms. Since the construction of the dams, accelerated rates of bank erosion have been an ongoing occurrence downstream. The upper reach most likely began eroding soon after dam completion in 1953. Presently, it is believed that the channel in the upper reach has reached some semblance of equilibrium (Hupp et al. 2010). That is, starting at the base of the last dam to approximately 70 miles downstream, the river channel has conformed to the regulated flow regime. The upper reach has a wider channel (not the typical trend on alluvial rivers) and higher banks than downstream. Presently, the impetus for erosion has lessened in the upper reach and has migrated downstream to the middle reaches (Hupp et al. 2009a). In the middle reach where the banks are actively eroding, the highly regulated dam-release patterns concentrate flow on the middle and lower bank surfaces and facilitate bank erosion. The managed flow regime on the river has significantly dampened the magnitude of short duration floods by creating long duration moderate floods. These post-dam flood events don’t have the energy associated with them to scour floodplain drainages and build levees from overbank flooding. Recent studies have indicated that the micro topography on the floodplain is slowly being diminished. The sediment laden floodwaters that meander on to the floodplain via guts and creeks deposit their sediment in the backswamps gradually filling in these low-lying areas (Hupp et al. 2009b). Loss of topographic relief will lead to the loss of some forest communities, reducing the number of ecological niches and associated wildlife species resulting in simplifying an otherwise complex ecological system.
29
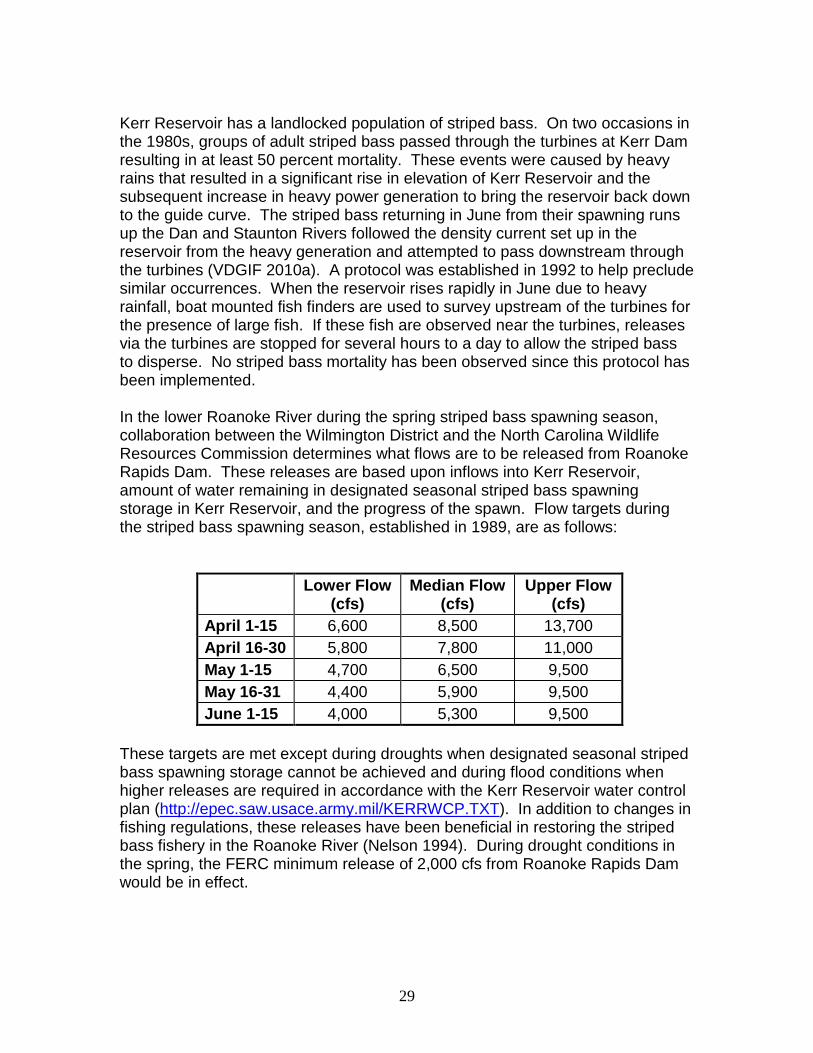
Kerr Reservoir has a landlocked population of striped bass. On two occasions in the 1980s, groups of adult striped bass passed through the turbines at Kerr Dam resulting in at least 50 percent mortality. These events were caused by heavy rains that resulted in a significant rise in elevation of Kerr Reservoir and the subsequent increase in heavy power generation to bring the reservoir back down to the guide curve. The striped bass returning in June from their spawning runs up the Dan and Staunton Rivers followed the density current set up in the reservoir from the heavy generation and attempted to pass downstream through the turbines (VDGIF 2010a). A protocol was established in 1992 to help preclude similar occurrences. When the reservoir rises rapidly in June due to heavy rainfall, boat mounted fish finders are used to survey upstream of the turbines for the presence of large fish. If these fish are observed near the turbines, releases via the turbines are stopped for several hours to a day to allow the striped bass to disperse. No striped bass mortality has been observed since this protocol has been implemented. In the lower Roanoke River during the spring striped bass spawning season, collaboration between the Wilmington District and the North Carolina Wildlife Resources Commission determines what flows are to be released from Roanoke Rapids Dam. These releases are based upon inflows into Kerr Reservoir, amount of water remaining in designated seasonal striped bass spawning storage in Kerr Reservoir, and the progress of the spawn. Flow targets during the striped bass spawning season, established in 1989, are as follows:
Lower Flow
(cfs) Median Flow
(cfs) Upper Flow
(cfs) April 1-15 6,600 8,500 13,700 April 16-30 5,800 7,800 11,000 May 1-15 4,700 6,500 9,500 May 16-31 4,400 5,900 9,500 June 1-15 4,000 5,300 9,500
These targets are met except during droughts when designated seasonal striped bass spawning storage cannot be achieved and during flood conditions when higher releases are required in accordance with the Kerr Reservoir water control plan (http://epec.saw.usace.army.mil/KERRWCP.TXT). In addition to changes in fishing regulations, these releases have been beneficial in restoring the striped bass fishery in the Roanoke River (Nelson 1994). During drought conditions in the spring, the FERC minimum release of 2,000 cfs from Roanoke Rapids Dam would be in effect.

30
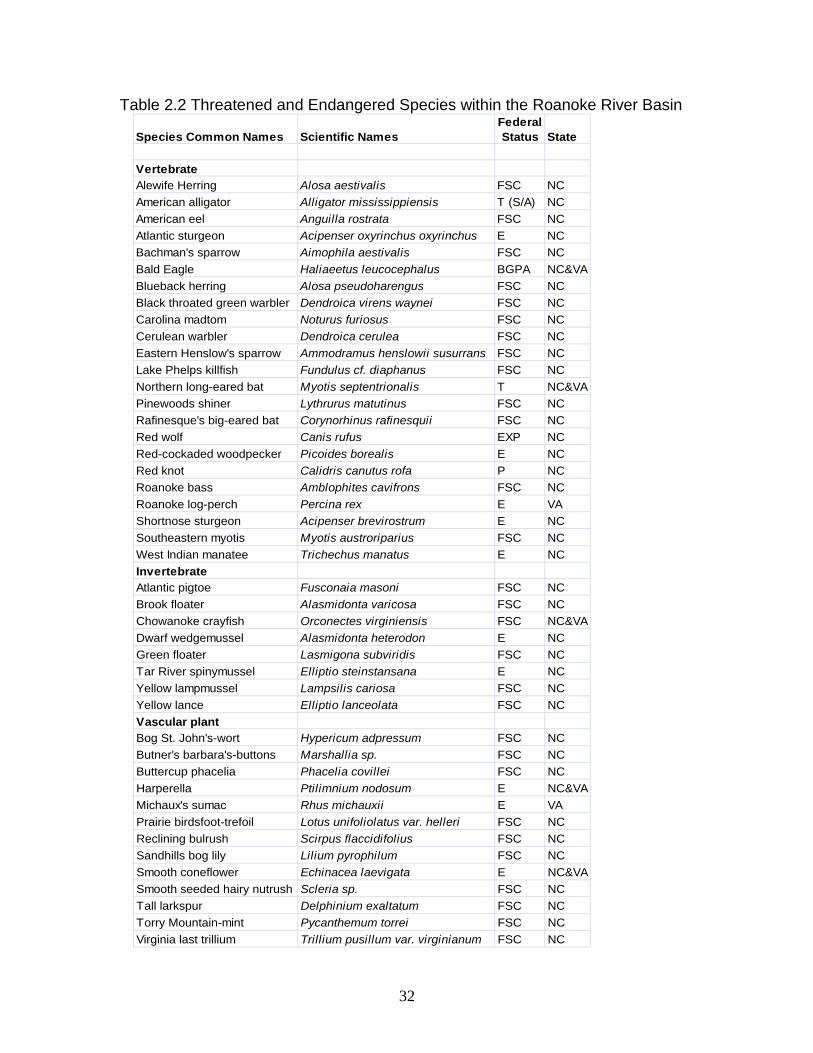
2.3.3 ENDANGERED SPECIES Coordination with the U.S. Fish and Wildlife Service (USFWS) and the National Marine Fisheries Service (NMFS) was conducted to identify endangered and threatened species (as well as Federal Species of Concern and candidate species) that might be present within the study area based on species information, maps of species distributions, species occurrences, and geographic search areas. Threatened and endangered species that may be present in North Carolina and Virginia around and downstream of Kerr Reservoir in the lower Roanoke River basin include: Red-cockaded woodpecker, Dwarf wedgemussel, Tar River spinymussel, shortnose and Atlantic sturgeon, Roanoke logperch, red wolf, smooth coneflower, Michaux’s sumac, Harperella and the Northern long-eared bat. The only threatened and endangered species in North Carolina that falls under the jurisdiction of the NMFS are the shortnose and Atlantic sturgeons. Table 2.2 contains a complete listing of protected species, their scientific names, and official status (USFWS 2014; NOAA 2014). Effective May 4, 2015, the USFWS listed the Northern Long-Eared Bat as a threatened species, with an interim special rule under Section 4(d) of the Endangered Species Act (ESA). A Conservation Measure included in the interim 4(d) rule states that incidental take from forest clearing activities will not be prohibited if the activity is conducted in a manner that avoids cutting or destroying known, occupied maternity roost trees during the pup season (June 1-July 31). During the summer, northern long-eared bats typically roosts singly or in colonies in a wide-variety of forested habitats, underneath bark or in cavities/crevices of both live trees and snags. Northern long-eared bats have also been documented roosting in man-made structures (i.e., buildings, barns, etc.) during the summer. Northern long-eared bats predominately winter in hibernacula that include caves and abandoned mine portals, and potentially large boulder areas. It should be noted that the general habitat types described above may not be all-inclusive, and additional habitat types may be identified as new information is obtained. The Corps is aware of the potential presence of the Northern Long Eared Bat, and with future consultation, the Corps will adopt necessary measures to implement our ESA responsibilities, to the extent that they are within the Corps’ legal authorities, consistent with the Corps’ missions and responsibilities, and are feasible from both a technological and economic point of view. Although several listed species may be present in the counties where the Dam and downstream areas are located, most species are not present in the project area of effect. Therefore, the Corps has determined there is no effect to the Red-cockaded woodpecker, Dwarf wedgemussel, Tar River spinymussel, shortnose and Atlantic sturgeon, Roanoke logperch, red wolf, smooth coneflower, Michaux’s sumac, Harperella and the Northern long-eared bat.

31
The shortnose and Atlantic sturgeon may be in the project area, however, since there are no proposed changes in the spring releases, the historic runs of spring-spawned sturgeon should not be adversely impacted by the proposed WCP revision. Recent studies, however, have documented a population of Atlantic sturgeon that migrate up the Roanoke River in late summer and spawn in September (Smith et al. 2015). Future measures that improve DO in the river and simulate more natural river discharge will most likely benefit sturgeon. The Roanoke River is under study as part of a program to restore American eels (Anguilla rostrata), a federally listed species of concern, to the Roanoke River basin by providing passage upstream of the dams (VDGIF 2010b). Eels are a catadromous species meaning that adults move downstream from freshwater streams and rivers to spawn in the ocean and the young eels (elvers) migrate back into freshwater streams and rivers to mature. The dams on the Roanoke River block both the movement of adults downstream and of the elvers moving upstream. In the spring of 2010, eel ladders were installed at Roanoke Rapids Dam to provide American eels an avenue to continue to move upstream into more of their historic habitat range. The eels range at one time extended up into the head waters of the Roanoke River (Dominion 2010). The success of the Roanoke Rapids eel ladder is currently being studied and evaluated. Eel traps are currently in place at Gaston Dam to determine if eels move that far upstream. Based on those results, the need to install ladders at Gaston Dam will be evaluated under Dominion’s FERC license requirements. The Gaston Dam evaluation will probably not be completed until after this EA is completed. After that date, if eel ladders appear to be warranted at Kerr Dam, then further action could be pursued under the Corps Section 1135 continuing authority (project modification for improvement of the environment).
32
Table 2.2 Threatened and Endangered Species within the Roanoke River Basin
Species Common Names Scientific NamesFederal Status State
VertebrateAlewife Herring Alosa aestivalis FSC NCAmerican alligator Alligator mississippiensis T (S/A) NCAmerican eel Anguilla rostrata FSC NCAtlantic sturgeon Acipenser oxyrinchus oxyrinchus E NCBachman's sparrow Aimophila aestivalis FSC NCBald Eagle Haliaeetus leucocephalus BGPA NC&VABlueback herring Alosa pseudoharengus FSC NCBlack throated green warbler Dendroica virens waynei FSC NCCarolina madtom Noturus furiosus FSC NCCerulean warbler Dendroica cerulea FSC NCEastern Henslow's sparrow Ammodramus henslowii susurrans FSC NCLake Phelps killfish Fundulus cf. diaphanus FSC NCNorthern long-eared bat Myotis septentrionalis T NC&VAPinewoods shiner Lythrurus matutinus FSC NCRafinesque's big-eared bat Corynorhinus rafinesquii FSC NCRed wolf Canis rufus EXP NCRed-cockaded woodpecker Picoides borealis E NCRed knot Calidris canutus rofa P NCRoanoke bass Amblophites cavifrons FSC NCRoanoke log-perch Percina rex E VAShortnose sturgeon Acipenser brevirostrum E NCSoutheastern myotis Myotis austroriparius FSC NCWest Indian manatee Trichechus manatus E NCInvertebrateAtlantic pigtoe Fusconaia masoni FSC NCBrook floater Alasmidonta varicosa FSC NCChowanoke crayfish Orconectes virginiensis FSC NC&VADwarf wedgemussel Alasmidonta heterodon E NC Green floater Lasmigona subviridis FSC NCTar River spinymussel Elliptio steinstansana E NCYellow lampmussel Lampsilis cariosa FSC NCYellow lance Elliptio lanceolata FSC NCVascular plantBog St. John's-wort Hypericum adpressum FSC NCButner's barbara's-buttons Marshallia sp. FSC NCButtercup phacelia Phacelia covillei FSC NCHarperella Ptilimnium nodosum E NC&VAMichaux's sumac Rhus michauxii E VAPrairie birdsfoot-trefoil Lotus unifoliolatus var. helleri FSC NCReclining bulrush Scirpus flaccidifolius FSC NCSandhills bog lily Lilium pyrophilum FSC NCSmooth coneflower Echinacea laevigata E NC&VASmooth seeded hairy nutrush Scleria sp. FSC NCTall larkspur Delphinium exaltatum FSC NCTorry Mountain-mint Pycanthemum torrei FSC NCVirginia last trillium Trillium pusillum var. virginianum FSC NC

33
Definitions of Federal Status Codes: E = endangered. A taxon "in danger of extinction throughout all or a significant portion of its range." T = threatened. A taxon "likely to become endangered within the foreseeable future throughout all or a significant portion of its range." C = candidate. A taxon under consideration for official listing for which there is sufficient information to support listing. (Formerly "C1" candidate species.) BGPA =Bald and Golden Eagle Protection Act. FSC = federal species of concern. A species under consideration for listing, for which there is insufficient information to support listing at this time. These species may or may not be listed in the future, and many of these species were formerly recognized as "C2" candidate species. T(S/A) = threatened due to similarity of appearance. A taxon that is threatened due to similarity of appearance with another listed species and is listed for its protection. Taxa listed as T(S/A) are not biologically endangered or threatened and are not subject to Section 7 consultation. EXP = experimental population. A taxon listed as experimental (either essential or nonessential). Experimental, nonessential populations of endangered species (e.g., red wolf) are treated as threatened species on public land, for consultation purposes, and as species proposed for listing on private land. P = proposed. Taxa proposed for official listing as endangered or threatened will be noted as "PE" or "PT", respectively.
CULTURAL RESOURCES Formal archaeological investigations have been conducted at the Kerr Reservoir project and vicinity for over 40 years. The largest and most comprehensive study to date was an archaeological survey of approximately 6,000 acres and 220 miles of shoreline. The survey identified 315 archaeological sites in Virginia and North Carolina (Garrow et al. 1980). Detailed cultural resources surveys of Buggs Island were completed for the USACE, Wilmington District (Abbott et al. 2000, New South Associates 2004). Buggs Island, state site number 44MC491, is a prehistoric archaeological site near the base of Kerr Dam. This site has been determined to be a historic property eligible for nomination to the National Register of Historic Places (Abbott et al. 2000). Past studies have documented the rate and location of erosion at Buggs Island. A total of 365 archeological sites had been previously recorded within and in the immediate vicinity of Lake Gaston. Of these, 237 were located within North Carolina and 128 were located within Virginia. The majority of sites represent prehistoric period sites. A total of 107 archeological sites were previously identified within the project area and immediate vicinity of Roanoke Rapids Lake. Like those sites recorded in the Lake Gaston project area and vicinity, these sites are predominantly prehistoric. The archeological site data files consulted did not contain information about any sites recorded in the Lower Roanoke River portion of the project area. While site frequencies may be low in this area, the lack of previously recorded sites may be a reflection of the fact that little archeological survey work had been conducted in this portion of the project area (Tetra Tech 2005).

34
SOCIO-ECONOMIC RESOURCES
2.5.1 DEMOGRAPHICS In 2009, the four most significant employment sectors in the study area economy were retail trade, manufacturing, public administration, and health care. The 2009 collective unemployment rate for the study area is 11.4%, which represents persons over the age of 16 that are in the labor force. Overall, in 2009, the State of North Carolina had an unemployment rate of 9.8 % (USBLS, 2009) while Virginia was at 6.7%. The average 2008 personal per capita income in the study area is $28,406, considerably lower than both states, with $34,437 as the median per capita income in North Carolina and $42,870 in Virginia (USBLS, 2009). The study area consists of a mix of white (46.4%), black (51.4%), and Hispanic (2.2%) occupants. Aside from basic population and ethnicity make-up, household information and poverty data depict a good deal of the overall socio-economic conditions of a region. Table 2.3 indicates higher than average poverty rates in the study area counties, with significantly lower household median incomes, when compared to the respective State totals (U.S. Census Bureau 2009).
Households, 2009
Persons per household,
2009
Median household
income, 2008
Persons below poverty level, percent, 2008
North Carolina 3,541,807 2.47 $46,574 14.60%
Bertie 7,766 2.41 $31,375 23.30%Halifax 21,595 2.49 $31,495 23.70%Martin 9,753 2.38 $35,072 23.40%
Northampton 7,959 2.54 $31,054 26.60%Warren 7,594 2.51 $33,632 24.40%
Washington 4,936 2.56 $34,027 23.20%Virginia 2,936,634 2.54 $61,210 10.20%
Brunswick 6,149 2.44 $35,876 22.20%Mecklenburg 12,532 2.44 $36,941 17.40%
Table 2.3. Income and poverty statistics by County, Kerr 216 Study. Housing: Source: US Census Bureau, American Community Survey, 2005-2009 5 Year Estimates Income: Source: US Census Bureau, 2008 Small Area Income and Poverty Estimates (SAIPE) Poverty: Source: US Census Bureau, 2008 Small Area Income and Poverty Estimates (SAIPE)
35
2.5.2 AGRICULTURE AND SILVICULTURE Agricultural development is extensive throughout the upstream and downstream counties affected by Kerr Reservoir (Figure and Table 2.1). Upstream counties include Brunswick and Mecklenburg counties in Virginia. Downstream counties include Halifax, Warren, Northampton, Bertie, Martin, and Washington Counties in North Carolina. Farm acreage (cropland, pastureland, and grazing) accounts for some 244,017 acres of the upstream counties and 775,679 acres of the downstream counties. In most counties the major crops are soybeans, corn, peanuts, wheat, hay, cotton, and some remaining tobacco. The average market value of goods produced, per farm, in the upstream counties of Virginia is $44,326 and North Carolina downstream counties, per farm, is approximately $289,136 (USDA 2007). This dollar value difference is primarily due to farms averaging a larger size in North Carolina. Much of the area is currently prime farmland and some of it will gradually be converted to commercial and residential use. The existing operation of Kerr Reservoir will not affect that rate of conversion. Much of the remaining downstream area is devoted to commercial forestry management and production, as well as conservation management. Economic damages under existing conditions during sustained high flows occur primarily to agricultural lands during the growing season. These agricultural damages begin when sustained flows exceed 20,000 cfs. Releases up to 35,000 cfs occur periodically during flood operations. At 20,000 cfs about 250 acres of agricultural lands are impacted, at 25,000 cfs about 604 acres, and at 35,000 cfs about 1,631 acres. For Kerr Reservoir levels below 300 feet NGVD 29, discharges are typically limited to 8,000 cubic feet per second (cfs) at Roanoke Rapids Dam to preclude impacting silvicultural operations in the lower Roanoke River floodplain downstream. For reservoir levels between 300 and 312 feet NGVD 29, water releases may be increased to 20,000 cfs which can have major impacts on silvicultural operations.
2.5.3 RECREATION The Roanoke River and associated floodplain provide many opportunities for an assortment of recreational activities. The river itself provides opportunity for sport fishing, canoeing, kayaking, swimming, and boating. Dominion’s FERC license requires whitewater recreation flows from June 16 – Oct. 31 on weekends below Roanoke Rapids Dam when declarations (releases) are ≥8,000 cfs. The Roanoke River boasts a 200 mile paddle trail system which features a series of camping platforms maintained by the Roanoke River Partners. Many sport fishermen are drawn to the river each year for the chance to catch one of many sought-after species like striped bass, largemouth bass, black crappie, hickory shad, perch, sunfish, catfish and bowfin. During an annual survey conducted by the NC Wildlife Resources Commission in 2005-2006, anglers spent an

36
estimated $2.5 million to enjoy fishing on the lower Roanoke River (McCargo et al. 2007). The Roanoke River National Wildlife Refuge, Kerr Reservoir, along with several Nature Conservancy Preserves, and several state and local parks provide many land-based recreational opportunities such as: bird watching, hunting, hiking, camping, and photography and wildlife observation. The Kerr Reservoir project is operated for recreation to the extent possible without hampering flood management or hydropower operations. In the first half of June, the guide curve descends from the spring spawning storage level to the summer target level, or from lake elevation 302.0 to 299.5 feet NGVD 29. Lake level elevations greatly affect commercial and recreation activities at the project. For example high elevations can flood camp sites and parking lots, and low levels can limit boat ramp and swim beach use. Currently there are 30 recreation areas on Kerr Reservoir with a total of 1,322 campsites, 228 picnic sites, and 38 boat ramps. Visitors to these recreation sites average about 1.7 million per year. The Corps of Engineers manages 12 of these areas and leases land to the State of North Carolina and the Commonwealth of Virginia to manage 15 other areas. There are 4 marina areas managed by private companies and 15 quasi-public recreation areas under lease to various churches, civic, and scout organizations. Twenty-six wildlife management areas are located around the reservoir, which are used by hunters and nature enthusiasts. Along with the wildlife management areas, there are private gun and hunting clubs, including the Roanoke and Tar River Gun Club, which lease or own land to offer hunting and recreation opportunities to their members.
OTHER RESOURCES
2.6.1 AIR QUALITY AND NOISE According to the NC, Division of Air Quality (NCDAQ 2010) and the Virginia Office of Air Quality (VAOAQ 2011), counties in both North Carolina and Virginia, within the project boundaries, are in attainment for ozone and particulates. Areas of the country where air pollution levels persistently exceed the national ambient air quality standards may be designated as “non-attainment.” There are no known air quality problems in the study area. There is noise associated with highway traffic and boat traffic year round, and boat traffic is higher in the warmer months related to fishing, skiing, and other activities. Also there is hunting activity along the lower Roanoke River during the fall and early winter. Otherwise there are no regular noise disturbances.
2.6.2 CLIMATE The project area generally has mild winters and warm humid summers. Average summertime highs are in the upper 80’s and winter time lows average in the low

37
30’s. Precipitation is fairly well distributed throughout the year and average annual rainfall is around 40 inches.
2.6.3 HAZARDOUS, TOXIC, AND RADIOACTIVE WASTES (HTRW) There are no known HTRW waste sites around Kerr Reservoir or in the lower Roanoke River below Roanoke Rapids Dam that are affected by existing operations.
2.6.4 AESTHETICS The aesthetic environment around the reservoirs and along the lower Roanoke River is rural, dominated by woodlands and farming with a few residential or urban areas adjacent to the water. These natural areas attract birdwatchers, hikers, and other noncomsumptive outdoor recreationalists.

38
3 ENVIRONMENTAL EFFECTS This section discusses the probable effects or impacts of the proposed WCP revision on the resources discussed in Section 2. The recommended plan is Quasi-Run-of-River (QRR). The effects discussed can be either beneficial or adverse and were considered over a 50-year period of analysis. Figure 3.1 shows the extent of the environmental effects of the QRR alternative. In addition to QRR, the impacts of the No Action alternative are addressed in this section. The no action alternative involves the existing condition of the resources in the project area as well as the future without-project condition of these resources also over a 50-year period of analysis. A future without-project condition entails no changes in the current operation of the John H. Kerr Dam and Reservoir, or additions or modifications to structures beyond normal maintenance. In addition, impacts of the No Action plan are compared to QRR in Table 3.1 and are discussed in more detail in the sections following Table 3.1. Benefits resulting from QRR are not measured monetarily, but are instead quantified in terms of increases over the no-action plan in average annual ecosystem habitat or functional outputs (e.g. Habitat Units (HU)). Environmental benefits were measured based on the amount of area (usually acres) being improved (quantity), multiplied by the increase in quality of that area. Quality is generally measured through the use of an environmental benefits model, which is an index-based model where the habitat is rated on a scale of 0 through 1. These models were meant as a simplified method for representing, measuring, and comparing relative changes in ecosystem quality, and as such may not capture or include every aspect of a complex ecosystem. Hydrologic conditions for all scenarios were simulated for the Roanoke River using Roanoke River Basin Reservoir Operations Model (RRBROM) and Hydrologic Engineering Center's River Analysis System (HEC-RAS). The Roanoke River Basin Reservoir Operations Model is a reservoir operations mass-balance model of the Roanoke Basin that takes inflows to dams, determines needed outflows dependent upon reservoir operating rules, and computes lake level changes over time. By varying these modeled operating rules to match the proposed changes to flood operations at Kerr, releases and lake levels for each alternative could be generated for comparison and use by other models. The USACE Hydrologic Engineering Center's River Analysis System software allows users to perform one-dimensional steady and unsteady flow river hydraulics calculations.

39
Figure 3.1 Affected Environment.
PROJECT PURPOSES AND PHYSICAL RESOURCES The purpose is to determine the advisability of modifying operations for ecosystem restoration for the overall public interest.

40
Alternative PlansEnvironmental Effect No Action Quasi Run of River (QRR)
Land Use No Change Increased frequency of flooding on 1,631 acres of farm land.
Geology and Sediments Continued elevated rates of erosion and turbidity as compared to natural flow. Reduced rate of erosion and reduced turbidity.
Floodplains Vegetation continue to shift away from natural conditions. Vegetation slowly shifts toward natural conditions.
Flood Risk Management No Change Evacuate flood pool sooner thus restoring Kerr flood storage quicker.
Water Quality DO levels below Kerr Dam will remain below state standards during the warmer months.
Slight improvement in DO in the lower river following flood events.
Hydropower No Change Less than 3.3% loss in hydropower generation.Water Supply No Change No effect
Wetlands Vegetation will continue to shift away from natural conditions. Vegetation slowly shift toward natural conditions.
Fish and Wildlife Continued degradation of habitat.
More stable Kerr Reservoir level would benefit fisheries. Lower river habitat increased by 1,976 average annual habitat units by improving conditions in 92,000 acres of forest.
Endangered Species Continued degradation of habitat.Slight improvement in DO in lower river following flood events may improve conditions for the endangered Atlantic and shortnose sturgeon.
Cultural Resources No Change Increased frequency of 35,000 cfs releases may impact site on Buggs Island.
Demographics No Change No effect
AgricultureFarmland impacted by sustained releases to 20,000 cfs will continue to be impacted.
1,631 acres flooded more frequently resulting in an average annual increase in damages of $234,272 compared to no action.
SilvicultureHabitats continue to degrade. Higher $ value tree species are replaced by lower $ value species.
More frequent flooding may occasionally limit access, but productivity should increase due to a more natural flooding regime.
Recreation No Change
More stable Kerr Reservoir level would benefit recreation features such as boat ramps, swim beaches and camp sites. A greater fluctuation allows for additional days when the floodplain is not inundated and thereby increases availability.
Air Quality & Noise No Change Increase near or less than 2 hundredths of a percent of the total emissions for the SRVC.
Climate Change No Change No effectHTRW No Change No effect
AestheticsAs habitats degrade visual aesthetics that attract nonconsumpitve users degrade.
Bank erosion along the reservoir and downstream will likely be reduced leading to less denuded banks and more scenic vistas.
Table 3.1 Comparison of Environmental Effects of the No Action Alternative with the Recommended Plan

41
3.1.1 LAND USE QRR: Approximately 1,631 acres of agricultural land would potentially be subjected to more frequent, but shorter duration flooding. It is possible that the owners would choose to convert some of this land to other use. See section 3.5.2 for additional information. No Action: No changes to existing land uses would be expected.
3.1.2 GEOLOGY AND SEDIMENTS QRR: This alternative should not change the geology of the area. Regarding sediments, current operations are causing a higher rate of river bank collapse due to erosion, which results in loss of riparian vegetation and increased turbidity. QRR is closer to the natural flow regime and its implementation should reduce the rate of bank collapse and turbidity. No Action: No changes in geology. Regarding sediments, no action will result in continued elevated rates of erosion and turbidity as compared to natural flow.
3.1.3 FLOODPLAINS QRR: During flood operations, certain portions of the forest can be inundated for extended periods during the growing season, and other areas are flooding less than they would under a natural hydrologic regime. The overall effect is a reduction in forested community diversity in the watershed. By altering the existing hydrology so that it is closer to that of an unregulated system (reducing the duration of flooding events), QRR would benefit about 92,000 acres of bottomland hardwoods in the lower Roanoke River. Vegetation composition in these areas will slowly shift back towards what had been established prior to the building of the Kerr Reservoir. This component would produce an average benefit of 1,976 habitat units a year (Wilder et al. 2012a). The Recommended Plan would not involve any construction components. There are no known structures within the floodplain that would be impacted. No Action: Vegetation will continue to shift away from the natural condition that existed prior to construction of the dam
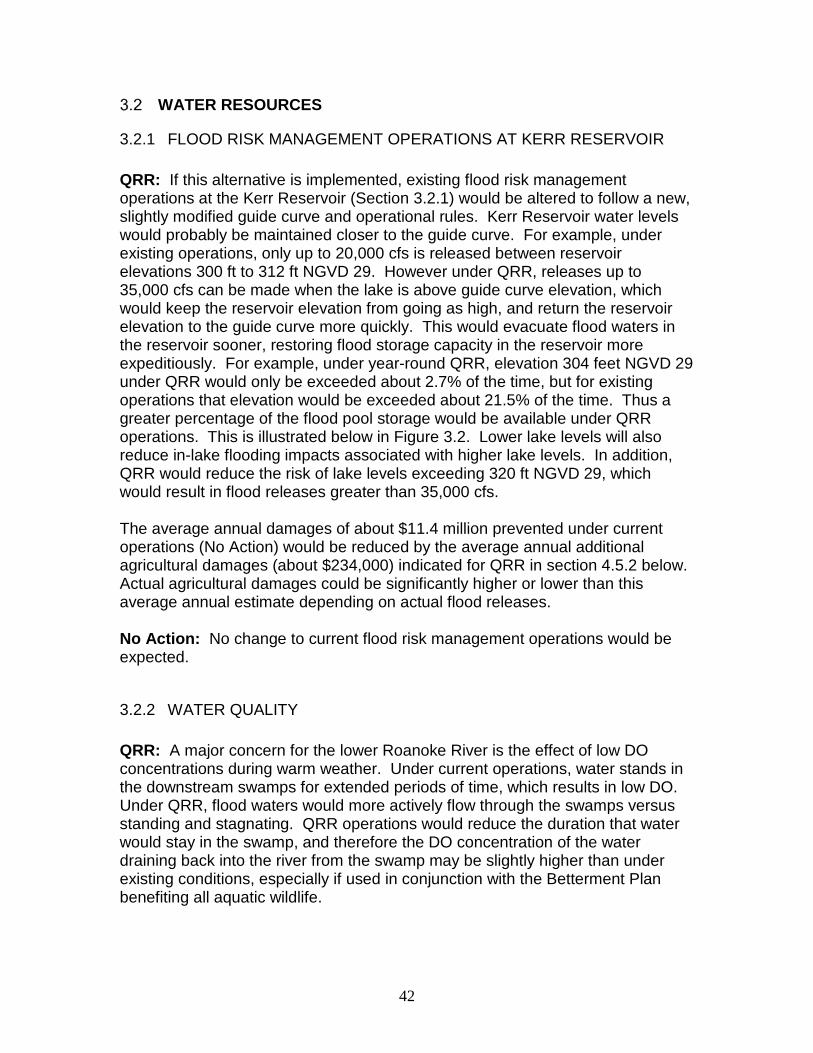
42
WATER RESOURCES
3.2.1 FLOOD RISK MANAGEMENT OPERATIONS AT KERR RESERVOIR QRR: If this alternative is implemented, existing flood risk management operations at the Kerr Reservoir (Section 3.2.1) would be altered to follow a new, slightly modified guide curve and operational rules. Kerr Reservoir water levels would probably be maintained closer to the guide curve. For example, under existing operations, only up to 20,000 cfs is released between reservoir elevations 300 ft to 312 ft NGVD 29. However under QRR, releases up to 35,000 cfs can be made when the lake is above guide curve elevation, which would keep the reservoir elevation from going as high, and return the reservoir elevation to the guide curve more quickly. This would evacuate flood waters in the reservoir sooner, restoring flood storage capacity in the reservoir more expeditiously. For example, under year-round QRR, elevation 304 feet NGVD 29 under QRR would only be exceeded about 2.7% of the time, but for existing operations that elevation would be exceeded about 21.5% of the time. Thus a greater percentage of the flood pool storage would be available under QRR operations. This is illustrated below in Figure 3.2. Lower lake levels will also reduce in-lake flooding impacts associated with higher lake levels. In addition, QRR would reduce the risk of lake levels exceeding 320 ft NGVD 29, which would result in flood releases greater than 35,000 cfs. The average annual damages of about $11.4 million prevented under current operations (No Action) would be reduced by the average annual additional agricultural damages (about $234,000) indicated for QRR in section 4.5.2 below. Actual agricultural damages could be significantly higher or lower than this average annual estimate depending on actual flood releases. No Action: No change to current flood risk management operations would be expected.
3.2.2 WATER QUALITY QRR: A major concern for the lower Roanoke River is the effect of low DO concentrations during warm weather. Under current operations, water stands in the downstream swamps for extended periods of time, which results in low DO. Under QRR, flood waters would more actively flow through the swamps versus standing and stagnating. QRR operations would reduce the duration that water would stay in the swamp, and therefore the DO concentration of the water draining back into the river from the swamp may be slightly higher than under existing conditions, especially if used in conjunction with the Betterment Plan benefiting all aquatic wildlife.

43
No Action: When flood waters are released over long periods of time, water tends to stand in the downstream swamps and the DO approaches zero due to BOD and COD. This low DO water eventually drains back into the river when discharge from the dam is reduced and has resulted in fish kills. DO levels below Kerr Dam will remain below state standards during the warmer months of the year.
44
300
302
304
306
308
310
312
314
316
318
320
0 10 20 30 40 50 60 70 80 90 100
Kerr
Res
ervo
ir st
age
(feet
msl
)
Percentage of Time Kerr Reservoir is Above Elevation Shown During Times When Kerr is in Flood Pool
Figure 3.2 Percent of Time Kerr Reservoir is at Elevation 300 feet msl or Higher During Times When Kerr is in Flood Pool forExisting and QRR operations.
Existing Operations QRR Operations
14%
25%
0%
Perc
ent
flood
sto
rage
rem
aini
ng
36%
47%
57%
66%
75%
84%
92%
100%
Source: USACE 2014 Note: Chart depicts the original year-round QRR alternative and not the modified QRR.
45
3.2.3 HYDROPOWER QRR: Since QRR only affects releases when Kerr Reservoir is above guide curve and/or in the flood pool, this alternative will have no effect on Kerr’s ability to meet its weekly minimum energy commitments to its customers or Kerr’s ability to maintain its marketed dependable capacity of 225 MW. Hydropower generation impacts at Kerr will be limited to secondary energy generation that is in excess of its contractual minimum energy requirements. Based on modeled hydropower outputs for the historical period from 1930-2010, it is estimated that average annual secondary (excess) power generation would be reduced by about 3.4% at Kerr Dam (see Table 3.2 below). Secondary energy is excess energy generated during flood operations, and is in excess of what is needed to meet minimum energy requirements. During flood operations, higher releases under QRR will generally prevent pool levels from reaching as high and will also bring pool levels down more quickly compared to existing operations. These lower flood pool elevations result in lower plant efficiencies, thereby reducing the overall secondary (excess) energy output; however, all water released under QRR’s 35,000 cfs flood releases will be released through Kerr’s turbines (i.e., used for generation). Hydropower impacts associated with QRR affect not only Kerr Dam, but also Dominion’s Gaston and Roanoke Rapids power stations. Gaston, like Kerr, can accommodate the full 35,000 cfs releases through its turbines, and since Lake Gaston lake levels are not affected by QRR, there is essentially no difference in generation at Gaston (as shown in table 3.2. However, Roanoke Rapids will have to spill QRR releases in excess of 20,000 cfs, which does have a measurable impact on generation. Based on the 80-year historical modeling period, 35,000 cfs releases (requiring 15,000 cfs spill) would have occurred about every 8 years on average under existing operations; however, under the original QRR, 35,000 cfs releases would have occurred about every 2 years on average. QRR releases between 20,000 and 35,000 cfs will also require spilling from Roanoke Rapids, but obviously to a lesser degree. As a result of these spills, an average annual reduction of 6.46% in generation would have been expected at Roanoke Rapids under the original QRR; however, when combined with generation impacts at Gaston, the average annual reduction in Dominion generation for both projects is reduced to an estimated 3.21% under the original QRR.

46
Alternative Average Annual Power Generation (MWH) John H Kerr Gaston Roanoke Rapids Gaston+RR
Existing 479,008 349,142 356,018 705,160 QRR 462,729 349,490 333,024 682,514 Difference -16,279 348 -22,994 -22,646 % Difference -3.40% +0.10% -6.46% -3.21%
Table 3.2 Average Annual Power Generation (based on year-round QRR). A portion of the generation differences is offset by beneficial guide curve modifications associated with QRR and is reflected in Table 3.2. From mid-June to mid-August and during the month of December, the QRR guide curve elevations are higher, increasing capacity and generating efficiency. In addition, the delayed guide curve drawdown associated with these changes potentially allow for additional secondary energy generation during higher demand periods than the existing guide curve. Lost hydropower generation would potentially need to be replaced by other more expensive sources of energy. Assuming that all of this reduced generation would need to be replaced, the average annual cost of this replacement energy has been estimated at approximately $3.8 million (based on year-round QRR; these costs are expected to less under QRR as proposed); however, since this is excess energy during a flood event that may not be fully needed to meet actual power demands, full replacement may not be necessary. Note also that this value does not reflect a direct cost to the energy end-user. The cost ultimately paid by the consumer is based on a variety of other factors, such as market conditions, that go beyond replacement energy costs. Although the QRR alternative will result in a slight decrease of secondary power generation, no significant hydropower impacts are expected to occur. No Action: No change to existing hydropower generation would be expected.
3.2.4 WATER SUPPLY QRR: QRR should not impact water supply availability or requirements in the basin. There are no ongoing federal water supply studies for the reservoir. Because a major population increase or the growth of major industries is not anticipated for the study area during the period of analysis, water supply will likely only be affected by natural events, such as drought. It is possible that at some point in the future issues of water allocation in the reservoir could be raised; however, the timing and nature of this are not known, nor is it expected to

47
impact the current study. Also, there are also no water supply impacts because the QRR is only affecting releases during flood time operations, not during normal or drought conditions when water supply could be a concern. Regardless, individual water supply storage accounts in Kerr Reservoir are not affected by releases from Kerr Dam, since they are separate from both the flood pool and the power pool. No Action: No changes to water supply would be expected.
BIOLOGICAL RESOURCES
3.3.1 WETLANDS QRR: This measure would affect about 92,000 acres of forested areas, but it likely would not result in any loss of wetland acreage. Vegetation composition in these forested wetlands would slowly convert back to the vegetation types that had been established prior to the building of the Kerr Reservoir. A slight increase in wetland acreage may be realized if some or all of the 1,560 acres of agricultural land that would potentially be subject to an increased frequency of flooding is converted to conservation land. No Action: Vegetation changes will continue to shift away from the natural conditions that existed before construction of the dam. This will result in a reduction of forested community diversity in the watershed which will cause the habitat value of this resource to decline. Wetland loss will continue as bank erosion occurs.
3.3.2 FISH AND WILDLIFE QRR: If this alternative is implemented, the Kerr Reservoir water level would probably be more consistently near the guide curve. The lower and more consistent reservoir levels would benefit fish spawning in the reservoir, especially for sunfishes, that spawn near the shallow shoreline. Reservoir shoreline vegetation would be inundated for shorter durations. The purpose of this alternative is to more closely mimic unregulated river flows which benefits fish and wildlife resources because they were historically adapted to unregulated conditions. This alternative would also result in the floodplain ecosystem returning to a more natural state as indicated in Section 3.1.3 above. It is estimated that this alternative would result in an increase of 1,976 AAHU (Average Annual Habitat Units). To obtain this estimate, daily-mean discharges at Roanoke Rapids were simulated with the Roanoke River Basin Reservoir Operations Model. Output from the RRBROM on September 7, 2011 served as
48
the upstream boundary conditions for HEC-RAS developed for the lower Roanoke River Basin by the USGS and modified by ERDC (Wilder et al. 2012a). The flow releases during the spring for anadromous fish would remain the same (Section 3.3.2) so that anadromous fish spawning would not be adversely impacted. QRR would not affect the upstream or downstream passage of anadromous and catadromous fish at Kerr, Gaston and Roanoke Rapids Dams. No Action: Continued degradation of habitat would be expected.
3.3.3 ENDANGERED SPECIES QRR: Even though there are several endangered species in the counties within the Roanoke Basin, the only species that may occur in the Roanoke system that could be affected by a change in operations at Kerr Dam are the endangered Atlantic and shortnose sturgeon. There are no proposed changes in the spring releases indicated in Section 3.3.2, thus the shortnose sturgeon should not be adversely impacted by QRR, especially since QRR would more closely mimic unregulated river flow the rest of the year. However, as indicated in Section 4.2.2, QRR would probably have a marginal improvement in the river DO levels which would benefit sturgeon and other aquatic species. Therefore, QRR should have no effect on protected species. QRR would reduce the negative impacts to forest diversity caused by prolonged inundation. Reduction of these impacts would provide a benefit to the threatened Northern Long-Eared Bat and the two bats that are a Federal Species of Concern, Rafinesque’s bigeared bat and the Southeastern myotis bat. By letter dated December 11, 2014, the USFWS stated that QRR should improve habitat for several listed species as well as species that are currently being considered for listing. The USFWS letter also stated that implementing QRR would reduce impacts of flood control operations on the system and provide benefits to the system’s listed species making QRR consistent with Section 7(a)(1) of the ESA. No Action: Continued degradation habitat would be expected.
CULTURAL RESOURCES QRR: Buggs Island, state site number 44MC491, is a prehistoric archaeological site near the base of Kerr Dam. This site has been determined to be a historic property eligible for nomination to the National Register of Historic Places. Past studies at Buggs Island have documented the location and rate of erosion at site

49
44MC491. Control points were established in 1997 at the northwest head of the island in 10 locations to monitor erosion. No appreciable erosion was recorded over a 661-day period along the western edge of 44MC491; however, severe erosion was noted at the head of the island (Abbott et al. 2000). A program of periodic monitoring of Buggs Island to document the rate of erosion, as supported by the SHPO (VDHR 2003), is in place. The latest monitoring occurred in March of 2012. A comparison of the recent measurements to the 2012 measurements is provided in Table 3.3. Little or no erosion was observed at monitoring points 2, 4, 6, 8, 9, and 10. Erosion monitoring points 1, 3, and 7 represent areas where large trees fell along the bluff.
Erosion Monitor Point #
Azimuth Distance to Bluff in Meters
(1997)
Distance to Bluff in Meters (2012)
Change in Distance to Bluff in Meters From 1997 to 2012
1 285 10.71 6.50 4.21 (13.81 ft)
2 269 10.67 10.45 .22 (.72 ft) 3 300 10.97 7.61 3.36 (11.02 ft) 4 299 9.34 9.34 No Change 5 256 10.98 9.93 1.05 (3.44 ft) 6 270 12.12 11.69 .43 (1.41 ft) 7 270 16.85 14.45 2.40 (7.87 ft) 8 242 11.15 11.15 No Change 9 248 10.18 10.18 No Change
10 262 10.06 10.06 No Change Table 3.3. Cultural Resources Erosion Monitoring Results (USACE 2012) The base of the bluff from the head of the island to erosion control monitoring point 10 was inspected for cultural material and signs of erosion. Two weathered, ceramic shards were observed at the base of the bluff near monitoring point 3. No erosion or undercutting attributable to stream flow was observed. Bluff erosion at 44MC491 appears to be most greatly influenced by slope steepness, sediment type, and vegetation (large trees) along the bluff line. It is possible that root motion associated with tree movement during wind events is a major factor in bluff erosion at the site. Management practices such as removal of large trees along the bluff, continued monitoring of erosion control points, and observation of the bluff during and after major discharges, should be considered. Should QRR increase erosion at site 44MC491, additional consultation with the SHPO, Advisory Council on Historic Preservation, and interested federally recognized tribes to address mitigation of adverse effects will be required. Mitigation measures could involve data recovery (Phase III archaeological investigation) or erosion protection (e.g. shoreline armoring) along the shoreline where it meets the western edge of the site.

50
QRR has a small potential to cause erosion at the site, but no adverse effect is expected for historic properties located in the project area downstream of Kerr Dam. Coordination with SHPO is ongoing and will continue, as appropriate. . No Action: No changes to the existing conditions described above would be expected.
SOCIO-ECONOMIC RESOURCES
3.5.1 DEMOGRAPHICS QRR: The floodplain affected by this alternative is largely unpopulated; hence it is not expected to affect the demographics of the area. No Action: No changes to existing conditions would be expected.
3.5.2 AGRICULTURE AND SILVICULTURE QRR: This measure would cause an increased probability of a growing season 35,000 cfs discharge to about once every 3.8 years versus once every 16 years under existing conditions. The 35,000 cfs discharge would impact about 1,631 acres of agricultural land. This would lead to additional average annual damages of $234,272 as compared to a No Action (existing) scenario. The growing season normally starts in March, but May was chosen since replanting after May 1 is generally not practicable due to a reduced yield. The majority of this land is currently planted as cotton and soybeans. It is possible that some of this land would be taken out of agriculture due to the increased risk of flood damages occurring. There are about 92,000 acres of forest land that could potentially be affected by this alternative. Since QRR has no provision for limiting winter releases to 8,000 cfs below lake elevation 300 ft NGVD 29, the alternative could have an effect on silviculture operations by limiting accessibility to certain logging roads and timber areas during floods more frequently as compared to No Action. However, restoration of a more natural hydrologic regime in these areas could also lead to increased productivity and/or decreased tree mortality in these areas. No Action: No changes to existing agricultural conditions would be expected. Sustained high flows would continue to result in economic damages during the May to November growing season. Degradation of silviculture habitats would also be expected to continue with higher dollar value trees being replaced by those of lower value.

51
3.5.3 RECREATION QRR: If this alternative is implemented, the Kerr Reservoir water level would probably be more consistently near the existing guide curve. The lower and more consistent reservoir levels would benefit the use of recreation features such as boat ramps, swim beaches, and camp sites. QRR may require some modification to public use facilities in an anticipation of the protracted guide curve into the peak recreation season. During the peak recreation summer season, water levels of 301’-303’ occur more frequently under QRR, and water levels at other elevations (both higher and lower) occur less frequently, relative to the Existing scenario. At 302’-303’, some amenities are available fewer days (flooded more days) per summer season under the QRR scenario. At 304’+, some amenities are flooded less frequently under the QRR scenario have studied the economic benefits of the QRR water control plan at Kerr Lake compared to the existing operating policy (Dumas, C., P. Schuhmann. 2015). The report finds that by reducing the time that recreation facilities are made unusable by high water levels, the QRR operating policy would increase recreational use of the reservoir, providing an additional $525,000 per year in sales and services in the region and five additional jobs. These are regional economic benefits, which are especially valuable in this low income part of North Carolina and Virginia. In addition to these regional economic benefits, the QRR operating policy would make more of the reservoir's recreational amenities available more of the time to reservoir visitors, resulting in an additional $2,370,000 per year in aggregate recreation value, which is a national net economic benefit of QRR.
On the lower River, shorter duration flood events will result in more hunter days with more than 100,000 acres of floodplain forest land available to hunters on both public and private lands. Anglers would have more quality fishing days. Other activities such as bird watching, hiking, environmental interpretation, photography would not be interrupted as often. No Action: Flood flows of a long duration (No Action) can interrupt recreational activities. Also, as the downstream habitat continues to degradeboth consumptive and nonconsumptive uses may be adversely affected.
OTHER RESOURCES
3.6.1 AIR QUALITY AND NOISE QRR: There will be no construction with this alternative so there will be no construction associated air quality or noise issues. There also will be no noise
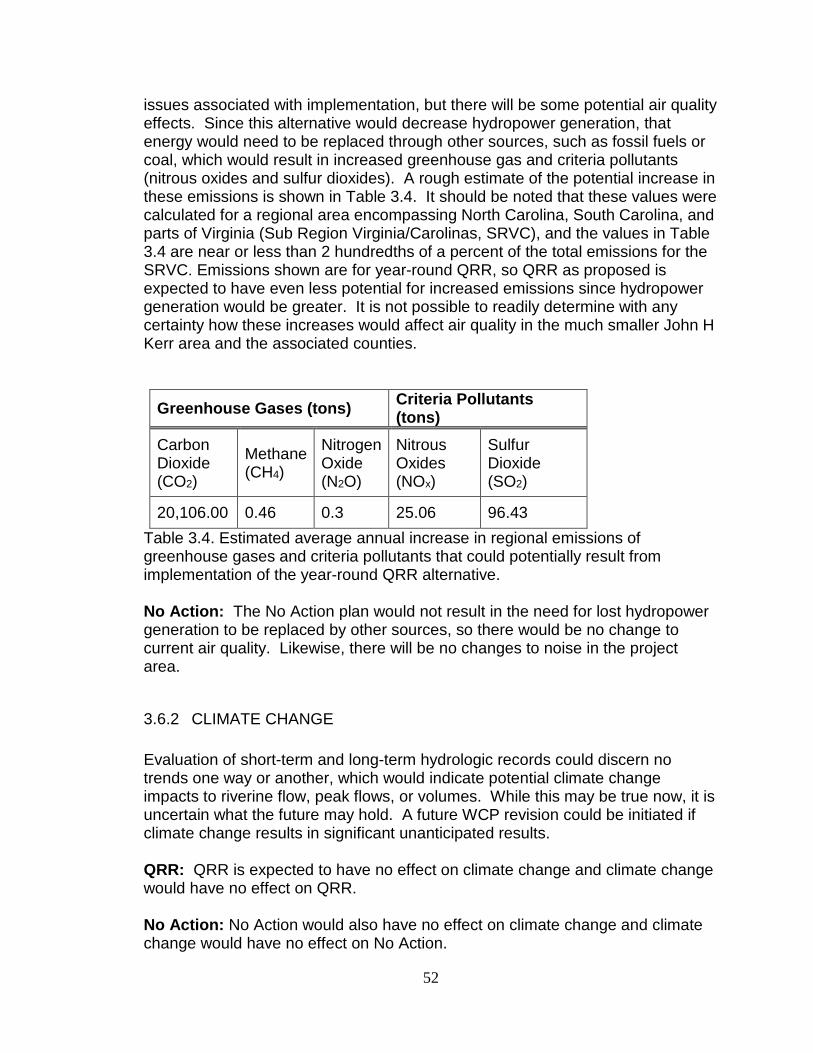
52
issues associated with implementation, but there will be some potential air quality effects. Since this alternative would decrease hydropower generation, that energy would need to be replaced through other sources, such as fossil fuels or coal, which would result in increased greenhouse gas and criteria pollutants (nitrous oxides and sulfur dioxides). A rough estimate of the potential increase in these emissions is shown in Table 3.4. It should be noted that these values were calculated for a regional area encompassing North Carolina, South Carolina, and parts of Virginia (Sub Region Virginia/Carolinas, SRVC), and the values in Table 3.4 are near or less than 2 hundredths of a percent of the total emissions for the SRVC. Emissions shown are for year-round QRR, so QRR as proposed is expected to have even less potential for increased emissions since hydropower generation would be greater. It is not possible to readily determine with any certainty how these increases would affect air quality in the much smaller John H Kerr area and the associated counties.
Greenhouse Gases (tons) Criteria Pollutants (tons)
Carbon Dioxide (CO2)
Methane (CH4)
Nitrogen Oxide (N2O)
Nitrous Oxides (NOx)
Sulfur Dioxide (SO2)
20,106.00 0.46 0.3 25.06 96.43 Table 3.4. Estimated average annual increase in regional emissions of greenhouse gases and criteria pollutants that could potentially result from implementation of the year-round QRR alternative. No Action: The No Action plan would not result in the need for lost hydropower generation to be replaced by other sources, so there would be no change to current air quality. Likewise, there will be no changes to noise in the project area.
3.6.2 CLIMATE CHANGE Evaluation of short-term and long-term hydrologic records could discern no trends one way or another, which would indicate potential climate change impacts to riverine flow, peak flows, or volumes. While this may be true now, it is uncertain what the future may hold. A future WCP revision could be initiated if climate change results in significant unanticipated results. QRR: QRR is expected to have no effect on climate change and climate change would have no effect on QRR. No Action: No Action would also have no effect on climate change and climate change would have no effect on No Action.
53
3.6.3 HAZARDOUS, TOXIC, AND RADIOACTIVE WASTES (HTRW) QRR: QRR is expected to have no effect on HTRW and QRR would not result in the production of HTRW. No Action: No Action would also have no effect on HTRW and would not result in the production of HTRW.
3.6.4 AESTHETICS QRR: Bank erosion along the reservoir and downstream will likely be reduced leading to less denuded banks and more scenic vistas. No Action: Bank erosion along the reservoir and downstream will continue at the current rate, which may adversely affect aesthetics in some areas.
CUMULATIVE IMPACTS The detailed analysis of cumulative effects is included as Appendix A. The point of a cumulative impact analysis is to determine if the proposed project, along with other past, present, and reasonably foreseeable projects conducted by the Corps of other parties contribute to more adverse effects on important resources. Examples included changes to hydropower production in the region by the Corps of Engineers, Dominion, Duke and other companies, changes in the basin caused by alterations in business practices by paper mills, changes in land use, water supply withdrawals, etc. Cumulative impacts can be either adverse or beneficial, and this assessment of cumulative impacts will focus on five issues related to the John H. Kerr Dam and Reservoir WCP: water quality, fisheries, bottomland hardwoods, agricultural lands, and hydropower. Cumulative impacts will focus on two different geographic areas. The first area is the Roanoke River watershed from John H. Kerr Dam and Reservoir downstream to where the river enters the Albemarle Sound. The discussion on water quality, fisheries, bottomland hardwoods and agriculture will be restricted to that area since impacts to these resources will not likely be appreciable outside of the watershed. On the other hand, hydropower impacts will be related to a much larger area since the hydropower losses during flood releases are not likely to be replaced from operations within the Roanoke River watershed. The area selected is the Southeastern Electric Reliability Council sub-region of Virginia/Carolina (SRVC) because the three hydropower facilities affected by the Kerr WCP lie within the

54
center of this sub-region. This sub-region covers North and South Carolinas and much of Virginia. In summary, there will be some loss in hydropower generation, a resultant slight increase in air emissions due to replacement energy efforts, increased impacts to agriculture and silviculture, but a long-term ecological improvement in the lower river ecosystem.
RECOMMENDED PLAN (QRR) The Recommended Plan is expected to produce a cumulatively positive effect on the environment. Cumulative significant adverse effects are not expected. Although there is a slight negative impact to hydropower, the benefits to the 92,000 acres of downstream ecosystem far outweigh the negative impacts. The proposed QRR operational change will have long-term ecological benefits to the forested ecosystem of the Roanoke River floodplain, by shifting the hydrology of the system closer to a more natural (pre-reservoir) state. Beneficial changes would include a long-term increase in vegetative diversity in the floodplain, with potential associated increases in habitat diversity and wildlife utilization, silvicultural benefits, recreational benefits, reservoir benefits, and agricultural benefits The only adverse impacts from the recommended alternative are associated with the loss of hydropower generation during flooding operations and its replacement with fossil fuel generation, and the potential for more frequent flooding of agricultural land. However, the loss of hydropower associated with flood releases would not affect the marketed minimum energy and capacity of Kerr Dam. If additional projects that would negatively impact hydropower generation were to be implemented in the Virginia/Carolina service area, there could be a potential for cumulative air quality impacts associated with the increased use of fossil fuels. The USACE is not aware of any such projects currently being planned in this area, and even if such projects were to be implemented, the magnitude and location of air quality impacts would be uncertain. Therefore, concerns about cumulative impacts to air quality would be extremely speculative at this stage.
EXECUTIVE ORDERS (EO)
3.9.1 EXECUTIVE ORDER (E.O.) 12898, FEDERAL ACTIONS TO ADDRESS ENVIRONMENTAL JUSTICE IN MINORITY POPULATIONS AND LOW-INCOME POPULATIONS (EO 12898).
This EO requires the federal government to achieve environmental justice by

55
identifying and addressing high, adverse and disproportionate effects of its activities on minority and low-income populations. The EO also states that the impacts of the action would not be disproportionate towards any minority or low-income population. The activity cannot (a) exclude persons from participation in, (b) deny persons the benefits of, or (c) subject persons to discrimination because of their race, color, or national origin. It requires the analysis of information such as the race, national origin, and income level for areas expected to be impacted by environmental actions. It also requires federal agencies to identify the need to ensure the protection of populations relying on subsistence consumption of fish and wildlife, through analysis of information on such consumption patterns, and the communication of associated risks to the public. The proposed WCP revision (QRR) would provide benefits to the quality of life by improving the natural environment, and would only flood areas currently affected by existing 35,000 cfs releases. No residences or public facilities would be impacted by any proposed actions. Also, the proposed activity would potentially improve any "subsistence consumption of fish and wildlife” by enhancing ecosystem features downstream of Roanoke Rapids Dam. In public outreach efforts to date, no potential environmental justice issues have been identified. Also appropriate demographic information related to environmental justice was indicated in Section 2.5.1. Therefore the proposed WCP revision complies with EO 12898.
3.9.2 PROTECTION AND ENHANCEMENT OF ENVIRONMENTAL QUALITY (EO 11514)
The Federal Government shall provide leadership in protecting and enhancing the quality of the Nation's environment to sustain and enrich human life. Federal agencies shall initiate measures needed to direct their policies, plans and programs so as to meet national environmental goals. According to the Environmental Benefits Analysis performed for the floodplain forest, the habitat value of this resource will continue to decline over the next 50 years if releases from Kerr Reservoir are not changed. Environmental quality will be enhanced therefore; the proposed WCP revision complies with Executive Order 11514/11991.
3.9.3 PROTECTION AND ENHANCEMENT OF THE CULTURAL ENVIRONMENT (EO 11593)
The Federal Government shall provide leadership in preserving, restoring and maintaining the historic and cultural environment of the Nation. Federal agencies shall administer the cultural properties under their control in a spirit of stewardship and trusteeship for future generations, initiate measures necessary to direct their policies, plans and programs in such a way that federally owned sites, structures, and objects of historical, architectural or archaeological significance are preserved, restored, and maintained for the inspiration and

56
benefit of the people, and, in consultation with the Advisory Council on Historic Preservation (16 U.S.C. 470i), institute procedures to assure that Federal plans and programs contribute to the preservation and enhancement of non-federally owned sites, structures and objects of historical, architectural or archaeological significance. The proposed WCP revision would have no impact on historic resources and therefore complies with Executive Order 11593.
3.9.4 FLOODPLAIN MANAGEMENT (EO 11988) Executive Order 11988 requires Federal agencies to avoid to the extent possible the long and short-term adverse impacts associated with the occupancy and modification of flood plains and to avoid direct and indirect support of floodplain development wherever there is a practicable alternative. In accomplishing this objective, "each agency shall provide leadership and shall take action to reduce the risk of flood loss, to minimize the impact of floods on human safety, health, and welfare, and to restore and preserve the natural and beneficial values served by flood plains in carrying out its responsibilities." By altering the existing hydrology so that it is closer to that of an unregulated system, this project would lead to a beneficial change in the composition of the floodplain, particularly in about 92,000 forested acres. Vegetation composition in these areas will slowly shift back towards what had been established prior to the building of the Kerr Reservoir. With the recommended plan, the ability to get back to the guide curve quicker restores flood storage capacity sooner than the no action alternative. The proposed WCP revision complies with Executive Order 11988.
3.9.5 PROTECTION OF WETLANDS (EO 11990) Executive Order 11990 directs all Federal agencies to issue or amend existing procedures to ensure consideration of wetlands protection in decision making and to ensure the evaluation of the potential effects of any new construction proposed in a wetland. The proposed action would not require filling any wetlands and would not be expected to produce significant changes in hydrology or salinity affecting wetlands. It is estimated that the entire 92,000 acres of floodplain forest along the lower Roanoke River are affected by altered hydrology due to current flood risk management operations at the Kerr Reservoir (TNC 2008). During flood operations, certain portions of the forest can be inundated for extended periods during the growing season, and other areas are flooding less than they would under a natural hydrologic regime. The overall effect is a reduction in forested community diversity in the watershed. According to the Environmental Benefits Analysis performed for the floodplain forest, the habitat value of this resource will continue to decline over the next 50 years if releases from Kerr Reservoir are not changed. The proposed WCP revision complies with Executive Order 11990.

57
4 COMPLIANCE WITH ENVIRONMENTAL REQUIREMENTS In addition to the indicated public involvement, the National Environmental Policy Act of 1969, as amended (NEPA), requires consideration of the environmental impacts for major federal actions. The purpose of the EA for this project is to ensure the environmental consequences of the proposed action are considered and that environmental and project information are available to the public. This EA was be prepared in accordance with NEPA of 1969, the Council on Environmental Quality (CEQ) regulations (40 Code of Federal Regulations (CFR) parts 1500-1508), U.S. Army Corps of Engineers Department of the Army procedures for implementing NEPA (33 CFR parts 230), and Engineering Regulation (ER) 200-2-2. The EA will undergo the normal NEPA review period. The WCP revision (QRR) has been coordinated with the US Fish and Wildlife Service and NMFS regarding consultation under Section 7 of the under the Endangered Species Act and coordination will continue throughout the NEPA process. A US Fish and Wildlife Service Fish and Wildlife Coordination Act Report is not required, since the proposed action involves an operational change, only. The proposed project does not require a Section 404(b) analysis since it involves no discharge of dredged or fill material.
MONITORING The Corps is not proposing any monitoring due to the ecological changes would be gradual and hard to measure, especially if flooding events are infrequent as they have been since 2003. Table 4.1 lists the compliance status of the major Federal Laws, policies and Executive Orders that were applicable or considered for the project. Upon completion of the NEPA process, the proposed WCP revision will be “in compliance” with all requirements. One Federal Law is listed as “not applicable” but is included here since it is frequently included in USACE projects. This is the Magnuson Fishery Conservation and Management Act – Essential Fish Habitat (EFH). Even though this project is near the coast, this law is not applicable because no EFH species exist in the Roanoke River.
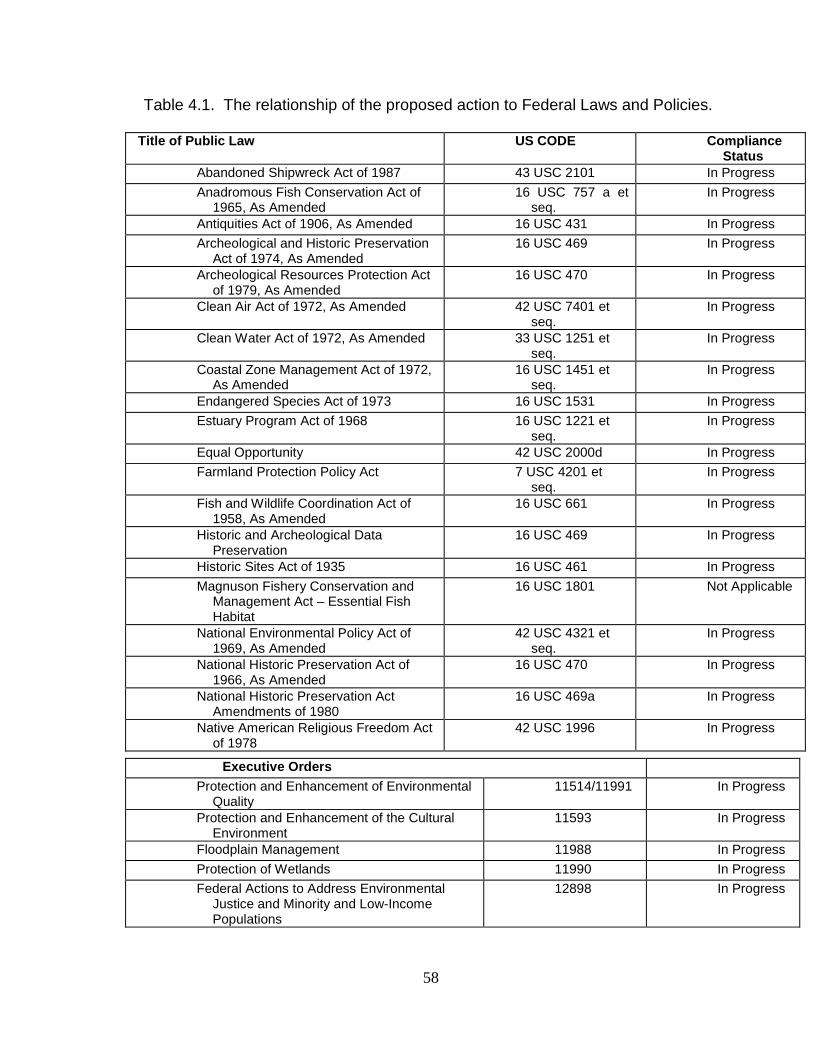
58
Table 4.1. The relationship of the proposed action to Federal Laws and Policies.
Title of Public Law US CODE Compliance Status
Abandoned Shipwreck Act of 1987 43 USC 2101 In Progress Anadromous Fish Conservation Act of
1965, As Amended 16 USC 757 a et
seq. In Progress
Antiquities Act of 1906, As Amended 16 USC 431 In Progress Archeological and Historic Preservation
Act of 1974, As Amended 16 USC 469 In Progress
Archeological Resources Protection Act of 1979, As Amended
16 USC 470 In Progress
Clean Air Act of 1972, As Amended 42 USC 7401 et seq.
In Progress
Clean Water Act of 1972, As Amended 33 USC 1251 et seq.
In Progress
Coastal Zone Management Act of 1972, As Amended
16 USC 1451 et seq.
In Progress
Endangered Species Act of 1973 16 USC 1531 In Progress Estuary Program Act of 1968 16 USC 1221 et
seq. In Progress
Equal Opportunity 42 USC 2000d In Progress Farmland Protection Policy Act 7 USC 4201 et
seq. In Progress
Fish and Wildlife Coordination Act of 1958, As Amended
16 USC 661 In Progress
Historic and Archeological Data Preservation
16 USC 469 In Progress
Historic Sites Act of 1935 16 USC 461 In Progress Magnuson Fishery Conservation and
Management Act – Essential Fish Habitat
16 USC 1801 Not Applicable
National Environmental Policy Act of 1969, As Amended
42 USC 4321 et seq.
In Progress
National Historic Preservation Act of 1966, As Amended
16 USC 470 In Progress
National Historic Preservation Act Amendments of 1980
16 USC 469a In Progress
Native American Religious Freedom Act of 1978
42 USC 1996 In Progress
Executive Orders Protection and Enhancement of Environmental
Quality 11514/11991 In Progress
Protection and Enhancement of the Cultural Environment
11593 In Progress
Floodplain Management 11988 In Progress Protection of Wetlands 11990 In Progress Federal Actions to Address Environmental
Justice and Minority and Low-Income Populations
12898 In Progress

59
5 AGENCY AND PUBLIC INVOLVEMENT As established by USACE Regulation 1105-2-100, Planning Guidance Notebook, the feasibility study will document substantial active involvement by interested government and non-governmental agencies and organizations. The goal of public involvement is to obtain information and views of those with an interest in the study, so that their comments and concerns receive full consideration in the planning process. All the information gathered from the actions indicated below has been and will be used as a part of the planning process. A scoping process was developed to obtain input from those individuals and groups affected by the operation of the John H. Kerr Dam and Reservoir. A scoping letter was prepared and coordinated with the States. The letter was mailed on March 13, 2000, to known parties with an interest in the operational aspects of the John H. Kerr Dam and Reservoir and the lower Roanoke River Basin. The recipients included municipalities, counties, State and Federal agencies, environmental and business organizations, and elected officials. The letter requested written comments to help in the identification of significant water resource issues and concerns relative to John H. Kerr Dam and Reservoir and the lower Roanoke River Basin. The comment period ended April 28, 2000. In addition to the letter, three public informational meetings were held at the following locations and dates:
Roanoke Rapids, NC April 4, 2000 Clarksville, VA April 5, 2000 Williamston, NC April 6, 2000
These meetings were open to the public and served as an additional means to gather comments from the public as a part of the scoping process. A wide range of interested parties attended these meetings. Concerns associated with the operation of John H. Kerr Dam and Reservoir were identified based on comments received from the public. These concerns were then grouped into 11 general categories of concern, which then became the basis for the formation of 11 work groups indicated below. These work groups consisted of subject matter experts from federal and state agencies (including the USACE and the sponsors), non-profit organizations, and businesses.
1. Downstream Flow Regime and Effects on Riparian Ecosystem 2. Water Quality 3. Sedimentation and Channel Morphology 4. Reservoir Resources 5. Downstream Flow Based Recreation 6. Salt Wedge – has been combined with the water quality group 7. Diadromous Fish and Downstream Riverine Aquatic Resources 8. Water Supply 9. Operating Policies and Administrative Procedures
60
10. Modeling Oversight 11. Hydropower
These workgroups were critical to the study process and assisted in the identification of problems and opportunities, data needs, and potential alternatives and their impacts. These work groups have met individually and collectively several times a year since 2003. Each of the federal and state agencies indicated below was involved in at least one of the workgroups listed above. A summary of the specific input received from each agency follows. All input has been addressed in the draft report. National Marine Fisheries Service (NMFS). This agency’s major concerns were for potential impacts of changes in operational releases on anadromous fish; therefore, no changes are proposed to the releases during the spring. Also NMFS indicated that the Corps needs to comply with the Endangered Species Act for the endangered Atlantic and shortnose sturgeon. The Corps will comply with the Endangered Species Act. Southeastern Power Administration (SEPA). SEPA’s was concerned about the impact the potential operational changes may have on hydropower production. As such SEPA was extensively involved related to input and review of the Hydropower Design Center’s analysis which is in Appendix O. US Geological Survey. USGS’s primary input was the water quality modeling for the lower Roanoke River related to existing operations and potential release alternatives. Their comments related to recommending specific models (EFDC and WASP), and the PDT agreed to these recommendations. US Fish and Wildlife Service (USFWS). The USFWS has provided input for the Kerr 216 study since inception. However, a Fish and Wildlife Coordination Act Report is not required for this project since it will only involve operational changes. In summary, their input involved five areas that correspond to the initial 5 project objectives: 1) lessen the duration of flood releases on the lower Roanoke River bottomland hardwoods and the associated adverse impacts on the ecosystem, 2) improve DO levels in the floodplain and river following long-term flood events, 3) improve DO levels for the 6 miles below John H. Kerr Dam, 4) reduce mass wasting and erosion rates downstream of Roanoke Rapids Dam, and 5) improve connectivity in the river to help the restoration of the American shad and American eel populations. USFWS also provided significant review and input related to USGS modeling effort. NC Department of Agriculture (NCDA). This agency was concerned about potential impacts of a change in release operations on the agricultural lands along the lower Roanoke River. NCDA helped arrange meetings to obtain input from the farming communities.
61
NC Division of Forest Resources (NCDFR). NCDFR was concerned about existing and potential impacts of a change in release operations on the forestry lands along the lower Roanoke River. NC Division of Marine Fisheries (NCDMF). NCDMF input was similar to NMFS. NC Division of Natural Resources and Conservation (NCDNRC). This agency provided documentation of important and unique habitat areas in the NC that could be affected by potential alternatives. NC Division of Parks and Recreation (NCDPR). NCPDR provided data on state recreation areas around Kerr Reservoir and the impacts of fluctuating reservoir water levels. NC Division of Water Quality (NCDWQ). NCDWQ provided significant review and input related to the USGS modeling effort. NC Division of Water Resources. The State of North Carolina is one of the two non-federal sponsors for the Kerr 216 study, and the NC Division of Water Resources is the POC agency for North Carolina. This agency’s major concerns have been project cost sharing, land use changes in the lower Roanoke River, and modeling of operational alternatives involving changes in releases to the lower Roanoke River NC Wildlife Resources Commission (NCWRC). NCWRC provided information on the impacts on fisheries due to fluctuating reservoir water levels and due to flood releases in the lower Roanoke River. Also NCWRC provided extensive assistance to the Corps in collecting data for the HEP modeling below Kerr Dam and collecting DO data used in evaluation of options to improve DO concentration below Kerr Dam. VA Department of Conservation and Recreation (VADCR). VADCR provided data on state recreation areas around Kerr Reservoir and the impacts of fluctuating reservoir water levels. VA Department of Environmental Quality. The Commonwealth of Virginia is one of the two non-federal sponsors for the Kerr 216 study, and VA Department of Environmental Quality is the POC agency for Virginia. This agency’s major concerns have been project cost sharing and improved water quality in the 6 miles below John H. Kerr Dam. VA Department of Game and Inland Fisheries (VADGIF). This agency provided information on the impacts on fisheries due to fluctuating reservoir water levels and impacts of low DO concentrations below Kerr Dam. VADGIF provided extensive assistance to the Corps in collecting data for the HEP modeling below

62
Kerr Dam and collecting DO data used in evaluation of options to improve DO concentration below Kerr Dam. Finally, in addition to the above, public coordination was also conducted regarding a proposed deviation to the John H. Kerr guide curve and release schedule at Roanoke rapids dam (measure 6B described in Section 3.3.1, and Appendix G). Four public informational meetings on the topic were held at the following locations and dates:
Williamston, NC May 12, 2008 Halifax, NC May 13, 2008 Kerr Resource Management Center, VA May 14, 2008 Williamston, NC August 28, 2008
Information was obtained in writing from the participants both during and after the meetings. All the information gathered from the public involvement actions described above has and will continue to be used as a part of the planning process for this study. In addition, a letter dated December 11, 2011 was addressed to all federally recognized tribes to identify any issues of importance to the tribes. Comments were requested within 30 days of the date of that letter and no responses have been received to date.

63
6 POINT OF CONTACT
Any comments or questions regarding this EA should be addressed to: Mr. Eric Gasch U.S. Army Corps of Engineers Wilmington District 69 Darlington Avenue Wilmington, NC 28403 (910) 251-4553 [email protected]

64
7 FINDING The Proposed action would not significantly impact the quality of the human environment. If this opinion is upheld following circulation and review of this EA, a Finding of No Significant Impact (FONSI) will be signed and circulated.

65
8 REFERENCES Abbott, L. E., E. E. Sanborn, L. E. Raymer, and L. D. O’Steen. 2000.
Archaeological Survey and Evaluation of Sites Impacted by Hurricane Fran, John H. Kerr, Mecklenburg County, Virginia. New South Associates Technical Report 626 submitted to the U.S. Army Corps of Engineers, Wilmington District.
Brinson, Mark M. 1993. A Hydrogeomorphic Classification for Wetlands. U.S.
Army Corps of Engineers, Washington D.C. Wetlands Research Program Technical Report WRP-DE-4.
Chartier N.A. 2009. NCSU Doctoral Student studying the Swainson’s warbler on
the lower Roanoak River floodplain, NC. Dominion. 2010. Roanoke Rapids Power Station. Retrieved from
http://www.dom.com/about/stations/hydro/roanoke-rapids-power-station.jsp.
Dumas, C., P. Schuhmann. 2015. Draft Final Report, Social-economic Benefits from Potential Changes in Water Releases from John H. Kerr Reservoir. Report submitted by UNCW Swain Center to the U.S. Army Corps of Engineers, Wilmington District.
Garrow, P. H., M. E. White, G. M. Watson, S. D. Nicklas, S. H. Savage, and J. L. Muse. 1980. Archaeological Survey of the John H. Kerr Reservoir, Virginia-North Carolina. Report submitted by Garrow and Associates to the U.S. Army Corps of Engineers, Wilmington District.
Graves, G. R. 2001. Factors governing the distribution of Swainson's Warbler
along a hydrological gradient in Great Dismal Swamp. Auk 118:650–664. Hupp, C.R., G.B. Noe, E.R. Schenk. 2010. Floodplains, Equilibrium, and Fluvial
Geomorphic Impacts of Human Alterations. Presented at the 2nd Joint Federal Interagency Conference, Las Vegas, NV, June27-July 1, 2010.
Hupp, Cliff R. and Osterkamp, W.R. 1996. Riparian Vegetation and Fluvial
Geomorphic Processes. Geomorphology, Volume 14 (Issue 4), 277-295. Hupp, C.R., A.R. Pierce, and G.B. Noe. 2009b. Floodplain Geomorphic
Processes and Environmental Impacts of Human Alteration along Coastal Plain River, USA. Wetlands 29(2): 413-429.
Hupp, C. R., Schenk, E. R., Richter, J. M., Peet, R. K., and Townsend, P. A.,
2009a. Bank erosion along the dam-regulated lower Roanoke River, North Carolina, Geological Society of America, Special Publication 451, pp. 97-108, DOI: 10.1130/2009.2451(06).

66
Kleinschmidt Associates. 2010. Final, Literature Based Assessment of American
Shad and American Eel Turbine Mortality at the John H. Kerr Hydropower Project on the Roanoke River, Virginia. Prepared for the Wilmington District Corps of Engineers.
McCargo, J.W., K.J. Dockendorf, and CD. Thomas. 2007. ROANOKE RIVER
RECREATIONAL ANGLING SURVEY, 2005–2006. North Carolina Wildlife Resources Commission, Federal Aid in Sport Fish Restoration, Final Report, Raleigh.
NC WRC (North Carolina Wildlife Resources Commission). 2010. North Carolina
Sport Fishing Profiles. Retrieved from http://www.ncwildlife.org/Fishing/profiles/American_shad.htm.
NCDENR-DAQ (North Carolina Department of Environment and Natural
Resources – Division of Air Quality). 2010. Planning and Attainment – Ozone Non-attainment Areas. Retrieved from http://daq.state.nc.us/planning/ozone/.
Nelson, K. 1994. Rockfish on the Rebound. Wildlife in North Carolina. March
1994. New South Associates. 2004. Archaeological Data Recovery at 44MC491:
Woodland settlement and subsistence practices on an alluvial island in the middle of Roanoke River Valley, John H. Kerr Reservoir. Volume 1. Hew South Associates, Stone Mountain, Ga.
NOAA (National Oceanic and Atmospheric Administration Fisheries Service).
2014. Threatened and Endangered Species List. Retrieved from http://www.nmfs.noaa.gov/pr/.
Peet, R.K., & Rice, S.K. 1997. Vegetation of the Lower Roanoke River Floodplain. University of North Carolina, Chapel Hill.
Richter, Brian D., Baumgartner, J.V., Powell, J., & Braun, D.P. 1996. A Method for Assessing Hydrologic Alteration within Ecosystems. Conservation Biology, Volume 10 (Issue 4), 1163-1174.
Savage A. L. 2009. Prey Selection by Swainson’s Warblers on the Breeding Grounds. Master’s Thesis, NC State University Raleigh, NC.
Smith, J. A., Flowers J. H. & Hightower J. E. (2015) Fall Spawning of Atlantic Sturgeon in the Roanoke River, North Carolina, Transactions of the American Fisheries Society, 144:1, 48-54, DOI:10.1080/00028487.2014.965344.
67
Tetra Tech. 2005. Historic Properties Management Plan Roanoke Rapids and Gaston Hydropower Project, FRERC, Project Number 2009. Prepared for Dominion Virginia Power/Dominion North Carolina Power. Tetra Tech EC, Inc.
The Nature Conservancy. 2008. Comment Letter. From Sam Pearsall to Colonel
Pulliam. Submitted March 4, 2008.
Thompson, J.L. 2005. Breeding biology of Swainson’s Warblers in a managed South Carolina bottomland forest. Ph.D. Dissertation, North Carolina State University, Raleigh, NC.
US Army Corps of Engineers, Wilmington District. October 1965. Roanoke River Basin, Va. – N.C., Reservoir Regulation Manual, Appendix A - Kerr Reservoir.
US Army Corps of Engineers. 2001. Reconnaissance Report: John H. Kerr Dam and Reservoir Virginia and North Carolina (Section 216) Lower Roanoke River. USACE, Wilmington District.
US Army Corps of Engineers, Hydropower Design Center. 2012. Hydropower Impacts of Changes in Water Control Operations John H Kerr-216 Study. Hydropower Analysis Center, Portland, Oregon.
US Army Corps of Engineers. 2014. Graphics based on USGS gage data and
RRBROM model output. U.S. Bureau of Labor Statistics .2009. USA Counties. Retrieved From
http://www.stats.indiana.edu/uspr/a/us_profile_frame.html. U.S. Census Bureau. 2009. Retrieved from http://quickfacts.census.gov.
USDA (United States Department of Agriculture). 2007. Census Report 2007. Retrieved from http://www.agcensus.usda.gov/Publications/2007/Full_Report/index.asp.
USDA, NRCS (U.S. Department of Agriculture, Natural Resources Conservation Service). 1981. Soil Survey of Washington County, North Carolina. Washington, DC.
USDA, NRCS (U. S. Department of Agriculture, Natural Resources Conservation
Service). 2010. Field Indicators of Hydric Soils in the United States. Version 7.0. Washington, DC.
USFWS (U.S. Fish and Wildlife Service). 2006. Roanoke River National Wildlife
Refuge. Retrieved from http://www.fws.gov/southeast/pubs/roagen.pdf.

68
USFWS (U.S. Fish and Wildlife Service). 2014. Threatened and Endangered Species in North Carolina. Retrieved from http://www.fws.gov/raleigh/species/cntylist/nc_counties.htmlUSFWS (U.S. Fish and Wildlife Service). 2014. Threatened and Endangered Species. Retrieved from http://www.fws.gov/endangered/.
USGS (United States Geological Survey). 2000. A Tapestry of Time and Terrain: The Fall Line. Retrieved from http://tapestry.usgs.gov/features/14fallline.html.
USGS (United States Geological Survey). 2010. Gap Analysis Program. http://www.gap.uidaho.edu/landcoverviewer.html.
USGS (United States Geological Survey). 1997. National Water Summary on
Wetland Resources: State Summary Highlights. Retrieved from http://water.usgs.gov/nwsum/WSP2425/state_highlights_summary.html.
VAOAQ (Virginia Office of Air Quality). 2011. Virginia Ambient Air Monitoring
2010 Data Report. Glen Allen, VA. http://www.deq.virginia.gov/export/sites/default/reports/pdf/2010/air_monitoring_Annual_Report_10.pdf.
VDEQ (Virginia Department of Environmental Quality). 2009. Water Quality
Standards. Virginia Administrative Code. 9 VAC 25-260. Virginia Department of Environmental Quality, Richmond, VA.
VDGIF (Virginia Department of Game and Inland Fisheries). 2010a. Fish and
Wildlife Information Service. Retrieved from http://vafwis.org/fwis/?Title=VaFWIS+Home+Page&Logout=1.
VDGIF (Virginia Department of Game and Inland Fisheries). 2010b. Report American Eel Catches from the Roanoke River Basin. Retrieved from http://www.dgif.virginia.gov/fishing/report-american-eels.asp.
Virginia Department of Historic Resources. 2003. Letter re: Data Recovery
Report-John H. Kerr Reservoir, DHR File # 2003-0883, December 2, 2002.
White and Peet. 2013. Establishment and survival of tree seedlings in floodplain
forests of the lower Roanoke River and their relationship to variation in site hydrology. Report to Dominion Generation, and the Cooperative Management Team.

69
Wilder, T. C., C. D. Piercy and T. M. Swannack. 2012a. An analysis of John H. Kerr Reservoir operation alternatives benefits to the lower Roanoke River floodplain ecology-Report to the US Army Corp of Engineers – Wilmington District. Vicksburg. MS: U.S. Army Engineer Research and Development Center, Environmental Laboratory.
Wilder, T. C., C. D. Piercy and T. M. Swannack. 2012b. Review of flow regulation scenarios at John H. Kerr Reservoir and effects on the lower Roanoke River floodplain-Report to the US Army Corp of Engineers – Wilmington District. Vicksburg. MS: U.S. Army Engineer Research and Development Center, Environmental Laboratory.
Wilder, T. C., C. D. Piercy and T. M. Swannack. 2012c. John H. Kerr Reservoir Operation Alternative, Quasi-Run-of-River Summer Minimum Energy, Analysis and Habitat Integrity Model Output. Report to the US Army Corp of Engineers – Wilmington District. Vicksburg. MS: U.S. Army Engineer Research and Development Center, Environmental Laboratory (Appendix C).
Yelverton, G. Frank. 2009. John H. Kerr Dam and Reservoir, Summary of
Dissolved Oxygen (DO) Monitoring August 26-28, 2009. Wilmington District Corps of Engineers, Summary of field sampling August 26-28, 2009.
List of Websites http://epec.saw.usace.army.mil/KERRWCP.TXT http://portal.ncdenr.org/web/wq/ps/csu

70
Appendix A
Kerr Water Control Plan Update October 2015
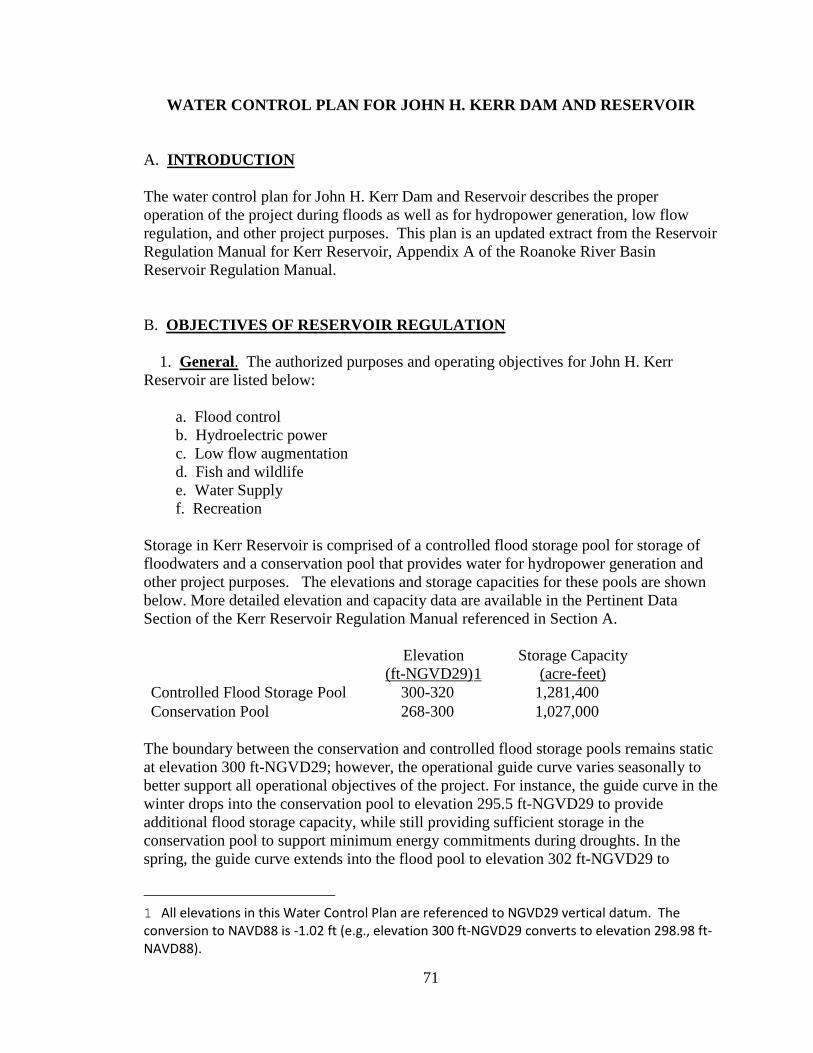
71
WATER CONTROL PLAN FOR JOHN H. KERR DAM AND RESERVOIR A. INTRODUCTION The water control plan for John H. Kerr Dam and Reservoir describes the proper operation of the project during floods as well as for hydropower generation, low flow regulation, and other project purposes. This plan is an updated extract from the Reservoir Regulation Manual for Kerr Reservoir, Appendix A of the Roanoke River Basin Reservoir Regulation Manual. B. OBJECTIVES OF RESERVOIR REGULATION 1. General. The authorized purposes and operating objectives for John H. Kerr Reservoir are listed below: a. Flood control b. Hydroelectric power c. Low flow augmentation d. Fish and wildlife e. Water Supply f. Recreation Storage in Kerr Reservoir is comprised of a controlled flood storage pool for storage of floodwaters and a conservation pool that provides water for hydropower generation and other project purposes. The elevations and storage capacities for these pools are shown below. More detailed elevation and capacity data are available in the Pertinent Data Section of the Kerr Reservoir Regulation Manual referenced in Section A. Elevation
(ft-NGVD29)1 Storage Capacity
(acre-feet) Controlled Flood Storage Pool 300-320 1,281,400 Conservation Pool 268-300 1,027,000
The boundary between the conservation and controlled flood storage pools remains static at elevation 300 ft-NGVD29; however, the operational guide curve varies seasonally to better support all operational objectives of the project. For instance, the guide curve in the winter drops into the conservation pool to elevation 295.5 ft-NGVD29 to provide additional flood storage capacity, while still providing sufficient storage in the conservation pool to support minimum energy commitments during droughts. In the spring, the guide curve extends into the flood pool to elevation 302 ft-NGVD29 to
1 All elevations in this Water Control Plan are referenced to NGVD29 vertical datum. The conversion to NAVD88 is -1.02 ft (e.g., elevation 300 ft-NGVD29 converts to elevation 298.98 ft-NAVD88).

72
provide supplementary storage in the reservoir to be utilized to support striped bass spawning releases downstream of the project (discussed in Section F.1). During the summer, the guide curve drops to the normal summer pool elevation of 299.5 ft-NGVD29, which provides sufficient storage to support increased minimum energy commitments during the summer, while having the added benefit of optimizing recreational opportunities. The controlled flood storage and conservation pools, as well as the guide curve, are depicted in Plate 1. Additional discussion of the operations with respect to the guide curve is provided throughout this water control plan. Dominion owns and operates two hydropower projects located in series directly downstream of Kerr (Gaston below Kerr and Roanoke Rapids below Gaston). The extent to which Kerr operates as a system with Dominion’s downstream projects for each operational objective is described in detail later in subsequent sections of this water control plan. (Plate A-1 and Appendix D of the Roanoke River Basin Reservoir Regulation Manual provide the geographic layout and operational descriptions of the Gaston and Roanoke Rapids Projects.) 2. Reservoir operation for flood control. The primary objective of the project is flood control, with a dedicated flood storage pool between elevations 300 and 320 ft-NGVD29 reserved exclusively for the detention storage of flood waters. In addition, a lower winter guide curve elevation allows the reservoir to be drawn down to elevation 295.5 ft-NGVD29, which provides additional flood control benefits. The objective of flood control operation is to reduce flood risk along the Roanoke River below Kerr Dam. Flood waters temporarily stored in the reservoir will be released at the maximum rate possible without causing significantly damaging stages downstream. (See Kerr Reservoir Regulation Manual for more detailed information concerning flood damages for downstream interests and locations, including procedures for estimating flood damages with and without project operations.) Higher releases will be made only when forecasts of inflow indicate such releases are necessary to prevent a reservoir rise above elevation 320 ft-NGVD29. Details of flood operation are described in Section C. 3. Reservoir operation for power. The Kerr Hydroelectric Power Plant operates as a peaking plant, meaning most of the energy produced will be generated during hours of peak customer demand. When the headwater elevation is at or below guide curve elevation, the project will be operated to the greatest extent possible to meet minimum energy requirements and maintain dependable capacity. When releases in excess of minimum generation are necessary for flood flows or other project purposes, those releases will be made by power generation to the fullest extent possible to maximize hydropower value. The Corps of Engineers will operate the Kerr Power Plant and deliver the entire output thereof (less the power and energy required in the operation of the project) to Dominion on its 115-kv lines in the Kerr station switchyard. The power operation is subject to such regulations concerning the maximum and minimum release of water from the reservoir

73
for flood control and flow regulation as may be established by the Wilmington District. Details of reservoir operation for power generation are described in Section D. 4. Operation for low flow augmentation. Kerr Reservoir is no longer specifically operated for low flow augmentation, since low flow requirements are now being met by Dominion, which owns and operates Gaston and Roanoke Rapids hydroelectric power projects immediately downstream of Kerr Dam. In accordance with their Federal Energy Regulatory Commission (FERC) license (No. 2009-18) for the Gaston-Roanoke Rapids power project, Dominion will release water from the Roanoke Rapids Dam to meet target flows for maintenance of proper quantity and quality of water in the lower Roanoke River. However, weekly releases from Kerr to meet Kerr’s minimum energy requirements are generally more than adequate to sustain the FERC minimum release requirements from the Roanoke Rapids project. Details of these FERC flow requirements related to Kerr operations are included in Section E. 5. Operation for fish and wildlife. Additional flows from Roanoke Rapids Dam that are required during the striped bass spawning season are made possible by releasing additional water from Kerr Reservoir. These flows are reregulated by the Roanoke Rapids Dam. These spawning flows place an additional demand on the storage available at Kerr. At present, the additional flows for the striped bass are provided by storing water in the flood control pool during the spring of the year, before and during the striped bass spawning season. Details of the requirements and the means by which the project meets these requirements are included in Section F. 6. Operation for water supply. Normally, there are no special reservoir operations required for water supply withdrawals. Local interests that have contracted for water supply storage in a percentage of Kerr’s conservation pool shall have the right to utilize water from Kerr to the extent that their storage will provide. Several water supply contracts to utilize storage in Kerr Reservoir are in effect. Details of these water supply contracts are discussed in Section G. 7. Operation for recreation. The project will be operated for recreation in the reservoir to the maximum extent possible without serious interference with the purposes of flood control and hydropower generation. Operation in accordance with the established guide curve and rules of operation provides a full or nearly full pool during the main recreation season in all but extremely dry years. Refer to Section H for additional information. 8. Mosquito-control operations. Kerr mosquito-control operations will be performed in accordance with ER 1130-2-413, Pest Control Program for Civil Works Projects. Corps of Engineers' policy is to respond whenever an authorized public health agency declares an emergency health hazard. It is against policy to participate in general pest/mosquito control programs to eliminate nuisance pests. Nuisance pest/mosquito control will only be performed on lands adjacent to Corps-managed public recreation facilities, operation and maintenance areas. Water level management will include,

74
whenever consistent with other purposes, a gradual drawdown of the conservation pool during the hot summer months. Refer to Section I for additional information. C. OPERATION FOR FLOOD CONTROL 1. Method of operation. The method of operation planned for Kerr Reservoir is generally designed to make maximum beneficial use of available storage in each flood event. Whenever the reservoir level rises into the flood storage pool (above elevation 300 ft-NGVD29) or whenever a rise into the flood storage pool is assured, the release will be such as to regulate the flow at the Roanoke Rapids gage as follows:
Table 1. Planned Flood Releases
Reservoir Elevation (ft-NGVD29)
Flood Release (cubic feet per second)
300-320 Inflow up to 35,000 320-321 85% of inflow
321 Inflow For reservoir levels below elevation 320 ft-NGVD29, planned flood releases will generally be based on weekly average inflows following a flood event. If weekly average inflows exceed 35,000 cubic feet per second (cfs) following a flood event, planned flood releases at Roanoke Rapids dam will be limited to 35,000 cfs unless reservoir levels are assured of exceeding elevation 320 ft-NGVD29. In addition, some allowance (typically 1000-2000 cfs) will generally be made to allow for additional flood releases from Roanoke Rapids dam to handle runoff (i.e., flood releases from Kerr would be limited to 33,000 to 34,000 cfs). Flood release decisions are typically made on a weekly basis in concert with our energy declaration procedures; however, flood releases and corresponding energy declarations can be revised as necessary throughout the week. Section D below gives more detail regarding the operation of Kerr for power generation. 2. Regulation within the upper conservation pool range. The reservoir guide curve varies seasonally, being only a half-foot below the bottom of the flood storage pool in the summer but as much as 4.5 feet below in the winter. Whenever the reservoir level is in this upper conservation pool range between the bottom of the flood storage pool elevation (300 ft-NGVD29) and the guide curve elevation, this storage space will also be evacuated using releases up to 35,000 cfs at Roanoke Rapids dam based on weekly average inflows into Kerr Reservoir, consistent with the flood operations described above. While releases up to 35,000 cfs are possible, planned releases in this range of lake levels will be contingent on inflows and proximity to guide curve to ensure that lake level is not drawn down below guide curve.

75
3. Control point for reservoir releases. The control point for releases from the reservoir is at the Roanoke Rapids, NC, stream gage located about 3 miles downstream of Roanoke Rapids Dam, which is also a National Weather Service flooding forecast location for Roanoke Rapids and other downstream communities along this portion of the river. The local watershed between Kerr Dam and Roanoke Rapids contains about 645 square miles and contributes a significant amount of flow to the Roanoke River. A portion of this flow will be stored in the 3 feet of flood storage provided in Lake Gaston and in the conservation pool at Roanoke Rapids Lake. Below the Roanoke Rapids gage the watershed is narrow and runoff reaches the river in a few hours. Coordinating releases from Kerr with the streamflow originating in this area is impractical because the time of travel from the dam is about 3 days. In the event that flood storage is utilized at Lake Gaston, the releases from Kerr will take into account any planned releases to empty the flood storage in Lake Gaston; however, it should not be necessary to reduce generation of on-peak energy at Kerr to accommodate flood storage releases from Lake Gaston. The discharge at the Roanoke Rapids gage will be permitted to exceed 35,000 cfs only when necessary to prevent filling Kerr Reservoir above elevation 320 ft-NGVD29. Forecasts of inflow will be periodically revised as updated streamflow and rainfall data become available, and the desired outflow adjusted if necessary. The object of this operation will be to obtain a maximum reduction in flood crests while utilizing all the available storage up to elevation 320 ft-NGVD29 in Kerr Reservoir. 4. Emptying operation. In the event that a discharge greater than 35,000 cfs is established in controlling a flood in accordance with Table 1, the reservoir will be operated so as to maintain that established maximum discharge until the reservoir falls to elevation 315 ft-NGVD29, providing enough flood control storage to hold one inch of additional runoff from the drainage area above Kerr Dam. Upon reaching elevation 315 ft-NGVD29, that maximum discharge would then be reduced to 35,000 cfs until the reservoir level is near guide curve. If a maximum discharge above 35,000 cfs is not warranted in accordance with Table 1 for a flood event, that maximum discharge will be maintained until the reservoir level is near guide curve. In all cases, discharges will be reduced toward the end of flood operations as needed to adhere to the Betterment Plan when applicable (see Section C.10) and/or to ensure that the lake level is not drawn down below guide curve. 5. Surcharge storage. Deliberate use of surcharge storage was not anticipated in the design of Kerr Dam or the gate operating machinery, or in the land acquisition program for the reservoir. The following features of the project, as constructed, limit the use of surcharge storage: a. From Kerr Dam upstream to Clarksville, VA, the land has been acquired only to about elevation 320 ft-NGVD29; however, flooding of this land above elevation 320 ft-NGVD29 would not be expected to cause serious damage.

76
b. The motors for the water supply and sewage pumps for Clarksville and others are located slightly above elevation 320 ft-NGVD29 (approximately elevation 323 ft-NGVD29). c. Primary highways and railroads have been raised or relocated so that low steel is at elevation 325 ft-NGVD29 or above. d. There is no freeboard on the top of the spillway gates, which are at elevation 320 ft-NGVD29 when fully closed. e. The gate operating indicators and machinery are at about elevation 323 ft-NGVD29, and the base of the motors is at about elevation 325 ft-NGVD29. Thus a rise of the reservoir above elevation 323 ft-NGVD29 before the gates are fully open could make gate operation hazardous with the further possibility that wave action might immobilize the motors and make further opening of the gates impossible. However, surcharge storage will be used to a limited extent by discharging 85 percent of inflow whenever a rising reservoir is between elevation 320 and 321 ft-NGVD29. Inflow used as a basis for determination of discharge required shall be actual inflow in emergency operation and a forecast maximum inflow in normal operation. Rise above elevation 321 ft-NGVD29 will be resisted by discharging 100 percent of inflow. Safety considerations dictate that all spillway gates should be fully open before there is any possibility that they might be immobilized by a reservoir elevation higher than 321 ft-NGVD29. 6. Spillway gate regulation schedules. Generally, releases directed by Wilmington District Water Management (Water Management) will be based on inflow and lake level forecasts. A gate regulation schedule has also been developed in accordance with EM 1110-2-3600 which will enable Water Management to make a quick determination of the required release. (The Spillway Gate Regulation Schedule is provided in Plates A-34 and A-35 of the Kerr Reservoir Regulation Manual.) This schedule may also be used by the damtender as an emergency operation tool in the event that communication with Water Management fails and the only data known to the damtender is that available at the dam. The minimum outflow required to prevent a reservoir rise above elevation 320 ft-NGVD29 for any given inflow and reservoir elevation can be determined from this schedule. The inflow to the reservoir at any time can be determined by either (1) discharge data recorded at Paces, Randolph, and Halifax, VA stream gages plus the local discharge as computed by the unit hydrograph, or (2) by the change in reservoir storage and the prevailing outflow at the dam. Determinations by each method will be made by Water Management and checked against the other as appropriate. Hourly inflow computations are available from the SCADA (supervisory control and data acquisition) system at the powerhouse. These computations will be made manually by powerhouse personnel on form SAW-35 (provided in the Kerr Reservoir Regulation Manual) when necessary.
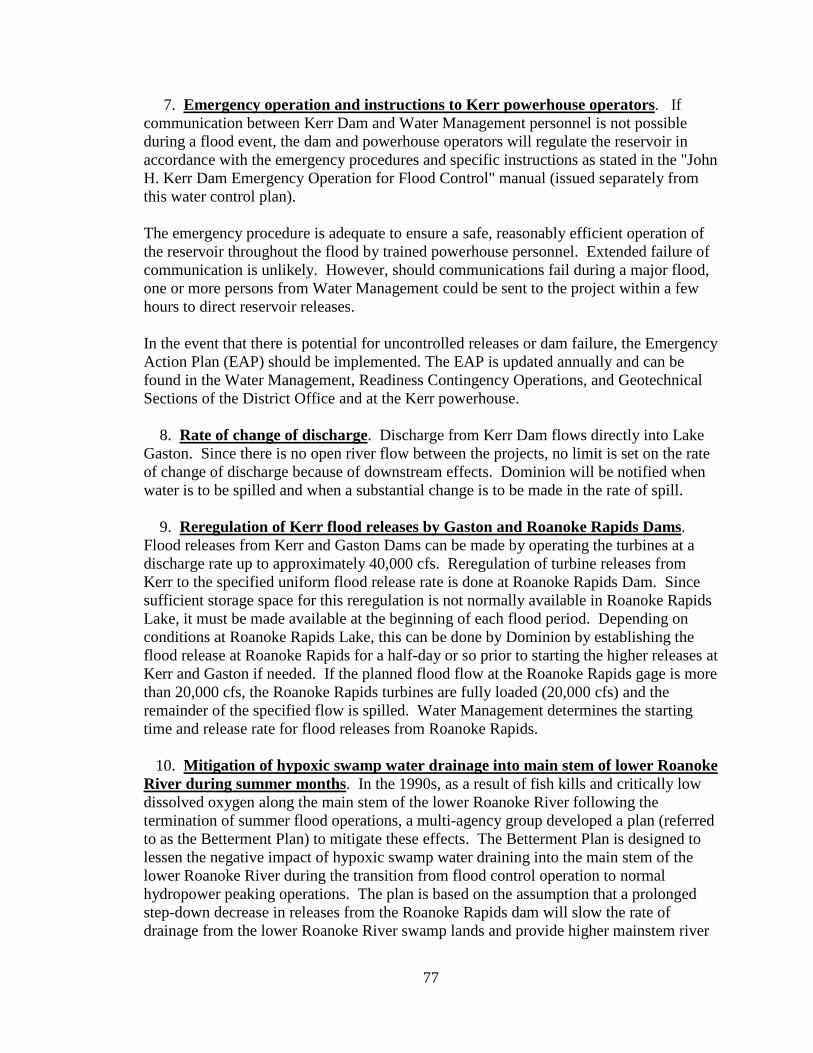
77
7. Emergency operation and instructions to Kerr powerhouse operators. If communication between Kerr Dam and Water Management personnel is not possible during a flood event, the dam and powerhouse operators will regulate the reservoir in accordance with the emergency procedures and specific instructions as stated in the "John H. Kerr Dam Emergency Operation for Flood Control" manual (issued separately from this water control plan). The emergency procedure is adequate to ensure a safe, reasonably efficient operation of the reservoir throughout the flood by trained powerhouse personnel. Extended failure of communication is unlikely. However, should communications fail during a major flood, one or more persons from Water Management could be sent to the project within a few hours to direct reservoir releases. In the event that there is potential for uncontrolled releases or dam failure, the Emergency Action Plan (EAP) should be implemented. The EAP is updated annually and can be found in the Water Management, Readiness Contingency Operations, and Geotechnical Sections of the District Office and at the Kerr powerhouse. 8. Rate of change of discharge. Discharge from Kerr Dam flows directly into Lake Gaston. Since there is no open river flow between the projects, no limit is set on the rate of change of discharge because of downstream effects. Dominion will be notified when water is to be spilled and when a substantial change is to be made in the rate of spill. 9. Reregulation of Kerr flood releases by Gaston and Roanoke Rapids Dams. Flood releases from Kerr and Gaston Dams can be made by operating the turbines at a discharge rate up to approximately 40,000 cfs. Reregulation of turbine releases from Kerr to the specified uniform flood release rate is done at Roanoke Rapids Dam. Since sufficient storage space for this reregulation is not normally available in Roanoke Rapids Lake, it must be made available at the beginning of each flood period. Depending on conditions at Roanoke Rapids Lake, this can be done by Dominion by establishing the flood release at Roanoke Rapids for a half-day or so prior to starting the higher releases at Kerr and Gaston if needed. If the planned flood flow at the Roanoke Rapids gage is more than 20,000 cfs, the Roanoke Rapids turbines are fully loaded (20,000 cfs) and the remainder of the specified flow is spilled. Water Management determines the starting time and release rate for flood releases from Roanoke Rapids. 10. Mitigation of hypoxic swamp water drainage into main stem of lower Roanoke River during summer months. In the 1990s, as a result of fish kills and critically low dissolved oxygen along the main stem of the lower Roanoke River following the termination of summer flood operations, a multi-agency group developed a plan (referred to as the Betterment Plan) to mitigate these effects. The Betterment Plan is designed to lessen the negative impact of hypoxic swamp water draining into the main stem of the lower Roanoke River during the transition from flood control operation to normal hydropower peaking operations. The plan is based on the assumption that a prolonged step-down decrease in releases from the Roanoke Rapids dam will slow the rate of drainage from the lower Roanoke River swamp lands and provide higher mainstem river

78
flow with high DO level to counteract the effect of the low DO level swamp water. Since implementation of this plan in 1998, it has been effective in avoiding any significant fish kills following protracted, hot weather releases. The Betterment Plan assumes the following conditions exist on the lower Roanoke River: a. Kerr Reservoir is being operated in flood control mode which has resulted in the flooding of the lower Roanoke River swamp lands. b. Daytime temperatures greater than 90 degrees F have occurred during the period that the swamp lands have been flooded. If the above conditions exist or have existed, the Betterment plan will be implemented as follows: a. During the week prior to the planned termination of flood operation, determine if hypoxic conditions (DO levels< 3mg/l) exist in the lower Roanoke River swamp waters based on consultation with Dominion biologists and state and federal fishery and water quality resource agencies. b. If hypoxic conditions exist in lower Roanoke River swamp waters, retain adequate flood storage in Kerr Reservoir for a step-down flow regime as described below in section (c). c. Initiate the following step-down flow regime from Roanoke Rapids dam (if flow at the 20,000 cfs level has already existed for 4 days, proceed to the next level).
Approximate Target Flow Duration 20,000 cfs 4 days 15,000 cfs 4 days 10,000 cfs 3 days 5,000 cfs 3 days
D. OPERATION FOR POWER GENERATION 1. General. While Kerr Reservoir has been constructed primarily to provide flood control, it is also intended that the greatest possible amount of the water released will be used for power generation, regardless of whether those releases are for flood control or other purposes (such as spawning releases). Power plant facilities at Kerr include 7 units having a total operating capacity of 267 megawatts (MW) and a dependable capacity of 225 MW, with a minimum dependable capacity pool elevation of 293 ft-NGVD29. Daily/hourly generation scheduling at Kerr is normally set by Dominion in coordination with generation at their Gaston and Roanoke

79
Rapids projects, taking into account federal power customer schedules as coordinated by Southeastern Power Administration (SEPA), the Corps-declared weekly energy totals for Kerr (including any Corps-directed flood or spawning releases), and Dominion’s FERC license requirements. The guide curve and generation requirements will be used as the basis for power generation at the plant. The guide curve represents the lower limit of reservoir level throughout the year that provides sufficient storage to support contractual minimum energy commitments during a repeat of any drought in the period of available record. Section D.2, below, provides additional information on contractual minimum energy requirements. The reservoir guide curve is shown on Plate 1. 2. Energy Generation Requirements. Whenever Kerr Reservoir level is at or below the guide curve, the power plant will be operated to produce only the minimum energy required to guarantee dependable capacity. When the power plant is not in operation to meet customer load, only water required to generate energy for station use will be released. Such an operation will ensure that dependable power (energy and capacity) can be supplied during a repeat of any drought on record. Minimum weekly energy requirements for Kerr per current SEPA contracts are shown below in Table 2:
Table 2. Minimum Weekly Energy Contract Amounts for John H. Kerr
John H. Kerr Effective 1 January 1997
Month Dominion
(MWH/week)
Duke Energy Progress
(MWH/week) Total
(MWH/week) JAN 1550 1450 3000 FEB 1370 975 2345 MAR 1275 975 2250 APR 1275 975 2250 MAY 1275 975 2250 JUN 1900 975 2875 JUL 1910 1470 3380 AUG 1910 1470 3380 SEP 1900 1470 3370 OCT 1275 975 2250 NOV 1275 975 2250 DEC 1550 1450 3000
When an energy declaration week (Saturday through Friday) falls within two months, use minimum energy for the month that includes Wednesday.
Kerr project power will be marketed in accordance with the SEPA contracts with Dominion and Duke Energy Progress. Power generated at Kerr, in excess of that used at the dam and at Island Creek Pumping Station, is made available for sale by Southeastern Power Administration (SEPA), the marketing agency of the Department of Energy.

80
SEPA has a contract with Dominion which provides for taking all of the project power from Kerr. Minimum energy and any excess (secondary) energy resulting from flood operations or spawning releases shall be distributed as follows: a. Fifty-eight percent (58%) or 130 megawatts (MW) of dependable capacity at Kerr Dam and two-thirds of the excess (secondary) project power is to be used by Dominion and preference customers in the area served by Dominion. b. The remaining 95 MW (42%) dependable capacity and one-third of the excess (secondary) project power is provided for transmission by Dominion from Kerr switchyard to Duke Energy Progress for use by Duke Energy Progress and preference customers in the area served by Duke Energy Progress (also per contract with SEPA). c. Provision is made for interchange of energy between Philpott and Kerr projects. 3. Mechanics of project operation for power. On Wednesday of each week, Water Management personnel prepare an energy declaration for the upcoming Saturday-through-Friday energy week. The total amount of energy (minimum plus secondary) declared for the upcoming week is based on the release required to meet the operational objectives of Kerr. These releases consider recent and expected inflows (usually without additional rainfall), lake levels, minimum energy requirements, and necessary releases for flood operations or spawning flows. Other considerations include any necessary limitations on discharges (e.g., allowance for local inflows into Gaston and Roanoke Rapids projects) and Dominion’s energy storage account balance. The energy declaration is emailed to SEPA and is also posted on Water Management’s website. SEPA provides the power customers’ schedule for the declared energy amount to Dominion, which Dominion uses to schedule generation at Kerr in coordination with its operations at Gaston and Roanoke Rapids projects. Dominion then provides the following day’s schedule to Kerr powerhouse and Water Management personnel each day. Water Management also coordinates the declaration with Dominion personnel during flood operations to ensure the proper flow from Roanoke Rapids. Energy declarations may be revised at any time. Generally, revisions can be implemented in 2 business days (i.e., a revision submitted to SEPA on Monday would be incorporated into the Wednesday through Friday schedule); however, an urgent revision can possibly be implemented the following day if necessary. E. OPERATION FOR LOW FLOW AUGMENTATION As previously indicated, minimum downstream flows are now maintained by Dominion’s Roanoke Rapids Dam per its FERC license requirements, with Kerr’s minimum energy requirements generally being more than adequate to sustain those license requirements. Those target flow and minimum flow requirements are intended to protect the water

81
quality standards and enhance the biological integrity of the Roanoke River downstream of the dam. Table 3 (Table FL2-1 from Article FL2 of Dominion’s FERC License 2009-018) summarizes those release requirements from Roanoke Rapids Dam.

82
Table 3. Minimum and Target Flow Releases from Roanoke Rapids Dam (Table FL2-1) Timeframe Condition Minimum Flow Jan. 1 – 15 Declaration < 6000 cfs 2000 cfs
Declaration >= 6000 cfs
2500 cfs
Jan. 15 – Feb. 28/29
Declaration < 6000 cfs 2500 cfs
Declaration >= 6000 cfs
3000 cfs
March Declaration <= 3500 cfs
Minimum flow = declaration
Declaration > 3500 cfs Minimum flow = 3500 for peaking days
5 peaking days during month 3 peaking day limit per week 3 consecutive peaking day limit Can only peak in two of the weeks Ramp up Ramp up from min. by 5000 cfs, hold
for one hour then go to full load
Ramp down Ramp down to min. flow + 5000 cfs, hold for one hour then go to minimum flow
April 1 – June 15 All conditions Flow = mean of weekly declaration, no peaking
Ramp
Change from one to next weekly declaration cannot exceed 5000 cfs per hour
June 16 – June 30 All conditions 2800 cfs July 1 – Sep. 15 All conditions 2000 cfs
Sept. 16 – Nov. 15 All conditions 1500 cfs Nov. 16 – Nov. 30 All conditions 2000 cfs Dec. 1 – Dec. 31 Declaration < 6000 cfs 2000 cfs
Declaration >= 6000 cfs
2500 cfs
In addition, whenever Water Management declares a drought, Article FL2 further indicates the drought minimum flows shown in Table 4 (Table FL2-2 from Article FL2), unless otherwise directed by Water Management in consultation with State of North Carolina water quality and fishery agencies.
Table 4. Drought Minimum Flows (Table FL2-2) January – August 2000 cfs
September – November 1500 cfs December 2000 cfs

83
F. OPERATION FOR FISH AND WILDLIFE 1. Striped Bass Spawning Releases. The striped bass fishery in the Roanoke River downstream from Kerr Dam is extremely important from an ecological, recreational, and economic standpoint. The major spawning ground for the striped bass in North Carolina waters is in the vicinity of Weldon. The striped bass require high water conditions to move up the river in the spring to the spawning ground. Continued high water even after spawning occurs is necessary for survival and transport of eggs and juvenile fish. The annual spawning run usually begins about April 15 and is completed by about May 15 with the peak of activity occurring about May 1. Soon after Kerr went into operation in 1953, objections to minimum flows provided during the striped bass spawning season were voiced. Although efforts were made to improve conditions, the objections persisted. On January 30, 1957, the Chief of Engineers authorized, on an interim basis, the use of storage in Kerr Reservoir between elevation 302 ft-NGVD29 and the guide curve to provide increased minimum flows during the striped bass spawning season. In 1971 a memorandum of understanding was signed by representatives of Virginia Power (now Dominion), the Wilmington District U.S. Army Corps of Engineers, and the N.C. Wildlife Resources Commission, which identifies reserved storage in Kerr Reservoir between 299.5 and 302 ft-NGVD29 for augmentation flow for striped bass spawning and a 13-foot minimum stage at Weldon during the spawning period. The telemark gage at Weldon was discontinued in July 1985. The releases to meet the 13-foot stage at Weldon have been measured at the Roanoke Rapids gage since July 1985. The 13-foot stage at Weldon is the equivalent of about 4.8 feet on the Roanoke Rapids gage. In cooperation with state and federal fish and wildlife agencies, the Wilmington District agreed to test a new fish flow regime in the lower Roanoke River to enhance striped bass fish reproduction. On April 1, 1989, a schedule of regulated releases at Roanoke Rapids Dam was implemented over a 4-year trial period to benefit striped bass spawning, and was subsequently implemented on a permanent basis in 1995. The schedule of spawning flow target releases measured at the Roanoke Rapids gage are shown below in Table 5:
Table 5. Lower Roanoke River Spawning Flow Targets
Dates
Lower Target Flow Rate
(cfs)
Median Target Flow Rate
(cfs)
Upper Target Flow Rate
(cfs) April 1-15 6600 8500 13,700 April 16-30 5800 7800 11,000 May 1-15 4700 6500 9500 May 16-31 4400 5900 9500 June 1-15 4000 5300 9500
In addition to the above, outflow from Roanoke Rapids Dam is limited to a maximum hourly variation of 1500 cfs. This schedule is followed each year to the extent that water

84
available from natural flow plus spawning storage at Kerr will permit. However, when flood operations at Kerr become necessary during the spawning release period, releases from Roanoke Rapids can exceed the upper target flow rates. Since flows released from Kerr are reregulated by Gaston and Roanoke Rapids, all spawning releases from Kerr for the striped bass should typically be made during on-peak hours. As a result, Dominion must store a portion of this water during the week and release it on weekends. In order to reduce the drawdown of Gaston and Roanoke Rapids Reservoirs over the weekends, the Corps has agreed to allow Dominion to use a one-foot portion of the 3 feet of flood storage in Lake Gaston for storing water for spawning releases, which is also reflected in its FERC license. 2. Mechanics of project operation during striped bass spawning season. During the striped bass spawning season (April 1 through June 15), any energy declaration in excess of the weekly minimum energy for the purposes of providing increased spawning releases is contingent on water being available from spawning storage and/or having sufficiently high inflows. Prior to each spawning season, an overall plan of operation is discussed with N.C. Wildlife Resources Commision (NCWRC) and other interested agencies (e.g., U.S. Fish & Wildlife Service), based on Water Management forecasts of available storage and inflows during the upcoming spawning season. Water Management will consult each week with NCWRC to coordinate planned releases based on available/forecast spawning storage and inflows and the status of the spawn, consistent with other operational considerations (e.g., flood operations). Release schedules are coordinated with Dominion as necessary to ensure that sufficient water is provided and releases from Kerr are appropriately reregulated by their projects. These releases are incorporated into Water Management’s weekly energy declaration (see Section D.3). 3. Fish Passage through Turbines. Passing of striped bass through the turbines at Kerr Dam is a fisheries concern during high inflow events following spawning upstream of the dam. As a result, whenever Kerr Reservoir is forecast to exceed elevation 303 ft-NGVD29 during the month of June and weekly average releases exceed 10,000 cfs, coordination with fishery agencies will be increased. Monitoring will include downstream fish pickup transects and chart fathometer transects at the upstream face of dam, as frequently as daily during a passage event. (A flowchart is available from Water Management that was developed in conjunction with fisheries agencies during the 1990s. This flowchart helps identify when conditions exist for fish passage through turbines and indicates procedures to be used to reduce fish passage.) Potential temporary operational changes to reduce fish passage include turbine shutdown and spillway releases; however, any significant operational changes would be coordinated with South Atlantic Division. 4. In-Lake Fisheries. To ensure success of bass spawning activities in the reservoir itself, a reasonably steady reservoir level is desirable for a 3 to 4 week period after the water temperature near the reservoir surface reaches 60 degrees F (about mid-April). This will be accomplished whenever practical; however, drawdown of the spawning storage to maintain target striped bass flows downstream often makes this impractical.

85
G. OPERATION FOR WATER SUPPLY In accordance with the provisions of the Water Supply Act of 1958, Public Law 85-500, the Government is authorized to include storage in any reservoir project constructed by the Corps of Engineers to impound water for municipal or industrial water use. Water supply storage space within Kerr Reservoir has been reallocated from the power pool for some water supply users, while other users have grandfathered withdrawal rights due to pre-impoundment withdrawals. Current water supply agreements in effect at Kerr Reservoir are described below, along with a storage summary in Table 6.
Table 6. John H Kerr Water Supply Storage Summary
Agreement Holder Estimated Water Supply Storage
(acre-feet)
Percent of Conservation
Storage City of Henderson 10,292 1.050 City of Virginia Beach 10,447 1.066 Virginia Department of Corrections 24 0.0024 Mecklenburg Co-Generation 617 0.063 Total 21,380 2.181
a. The Town of Clarksville, Virginia is allowed to make grandfathered water supply withdrawals from Kerr Reservoir at no cost in accordance with preproject agreements. Burlington Industries near Clarksville also had a grandfathered withdrawal, but is no longer in operation. b. A water use agreement between the Federal Government and the City of Henderson, North Carolina, was entered into on February 12, 1974, allowing withdrawals from Kerr Reservoir at a rate not to exceed 20 million gallons per day (MGD). This water use agreement was converted to a water storage contract on March 17, 2006, giving the City of Henderson the right to utilize 1.050 percent of the conservation storage in Kerr Reservoir between elevations 268 and 300 ft-NGVD29. This space is currently estimated to contain 10,292 acre-feet of storage. c. A water supply storage contract with the City of Virginia Beach, Virginia, for releases from Kerr Reservoir was signed on January 13, 1984. The City of Virginia Beach has a FERC-approved water supply intake in Lake Gaston, located downstream of Kerr Dam. The Kerr contract stipulates that the City of Virginia Beach has the right to utilize 1.066 percent of the conservation storage in Kerr Reservoir between elevations 268 and 300 ft-NGVD29, currently estimated to contain 10,447 acre-feet. This storage is not intended to directly provide water supply to Virginia Beach, but rather to provide limited mitigation storage to help meet downstream spawning or minimum releases on a short-term basis during severe droughts to offset concerns related to the City’s interbasin transfer of water from Lake Gaston. Releases from this storage will be made following coordination with the City of Virginia Beach and the State of North Carolina.
86
d. On January 25, 1989, a water storage contract was approved for the Virginia Department of Corrections (VDOC) for water supply storage space in Kerr Reservoir. VDOC has the right to utilize an undivided 0.0024 percent of the conservation storage from elevation 268 to 300 ft-NGVD29 in Kerr Reservoir or approximately 24 acre-feet. The specified withdrawal rate is not to exceed 60,000 gallons per day. This water supply allocation has not yet been utilized. e. On June 5, 1991, a water supply storage contract was approved for the Mecklenburg Cogeneration Limited Partnership (MCLP), now operated by Dominion. The 120 megawatt coal-fired cogeneration facility at Clarksville, Virginia, uses raw water from Kerr Reservoir as process water, cooling water, and steam supply for the facility, with maximum water use of approximately 3 mgd. MCLP has the right to utilize an undivided 0.063 percent (approximately 617 acre-feet) of the conservation storage in Kerr Reservoir. H. OPERATION FOR RECREATION A reservoir level near the guide curve would be desirable throughout the recreation season to provide the greatest lake area and most attractive shoreline. This water level requirement will be met when consistent with other flow regulation requirements. The reservoir will normally be near guide curve level from June through August; however, summer drawdown below guide curve enough to impact recreation can be expected to occur during droughts. I. OPERATION FOR MOSQUITO CONTROL. In the interest of mosquito control, the following is desirable: a. Rapid drawdown of a 1- or 2-foot surcharge above the maximum conservation pool in the spring to strand drift (floating vegetative debris). b. Maintain reservoir at the maximum conservation pool elevation from April through June to curb shoreline vegetation growth. c. Gradually draw reservoir down from July through September at a rate equal to 0.2 feet per week or more to keep the shoreline below the advancing growth. The one or two feet of drift-stranding surcharge is provided by the storage of water for the striped bass. While a faster drawdown would be more effective in stranding the drift, a separate drawdown for each purpose would not be practical. The other water level requirements will usually be met by normal power operations when consistent with flow regulation requirements.
87
J. DEVIATION FROM NORMAL REGULATION. a. General. The District Engineer is occasionally requested to deviate from normal regulation of Kerr Reservoir. Prior approval for a deviation is obtained from SAD, except as noted in the following emergencies, unplanned minor deviations and planned deviations which are discussed below. Requirements and guidance on deviations are provided in ER 1110-2-240, Water Control Management, dated 8 October 1982 with special updates on 1 March 1994. b. Emergencies. Some emergencies that can be expected are drownings and other accidents, failure of operation facilities, and flushing of pollution during fish kills. Necessary action under emergency conditions is taken immediately unless such action would create equal or worse conditions. SAD will be informed as soon as practicable, and a written confirmation showing the deviation and conditions will be furnished to SAD. c. Unplanned Minor Deviations. These are unplanned instances that create a temporary need for minor deviations from the normal regulation of the reservoir, although they are not considered emergencies. Construction accounts for the major portion of incidents and includes utility stream crossings, bridge work, and major construction contracts. Changes in releases are sometimes necessary for maintenance and inspection. Requests for changes of release rates are generally for a few hours to a few days. Each request is analyzed on its own merits. Consideration is given to reservoir and watershed conditions, potential flood threat, and possible alternative measures. These requests are generally accommodated, provided there are no adverse effects on the overall regulation of the project for the authorized purposes. Water Management will obtain approval for these minor deviations from SAD normally by telephone or email, with a follow-up written confirmation showing the deviation and conditions. d. Planned Deviations. Each planned deviation should be analyzed on its merits. Sufficient data on flood potential, reservoir and watershed conditions, possible alternative measures, benefits to be expected, and probable effects on other authorized and useful purposes will be submitted in writing to SAD along with recommendations for review and approval. e. Drought Contingency. Normal project operating procedures may be altered during critical drought situations to address both upstream and downstream water resource needs and impacts. Detailed instructions on operating procedures during times of drought can be found in the Drought Contingency Plan for John H. Kerr. Guidance on developing Drought Contingency Plans is found in TL 1110-2-335 Development of Drought Contingency Plans dated 01 Apr 93 and ER 1110-2-1941 Drought Contingency Plans dated 15 Sep 81.

88

89
Appendix B
Cumulative Impacts
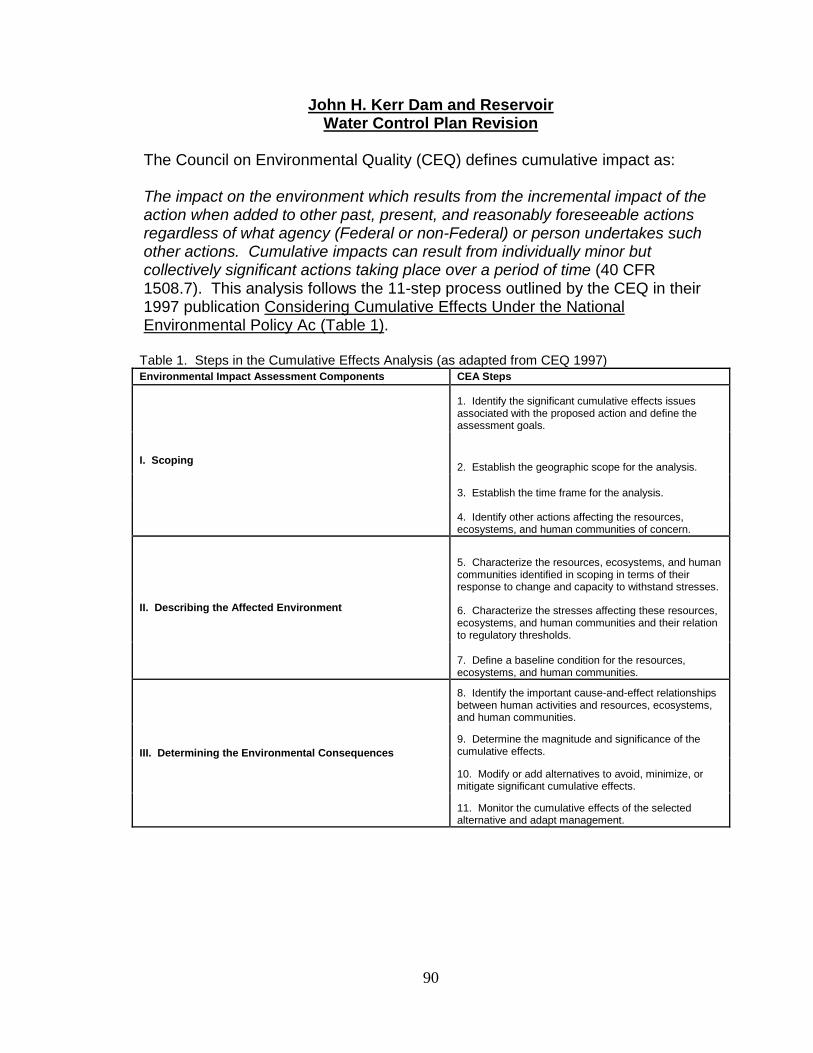
90
John H. Kerr Dam and Reservoir Water Control Plan Revision
The Council on Environmental Quality (CEQ) defines cumulative impact as: The impact on the environment which results from the incremental impact of the action when added to other past, present, and reasonably foreseeable actions regardless of what agency (Federal or non-Federal) or person undertakes such other actions. Cumulative impacts can result from individually minor but collectively significant actions taking place over a period of time (40 CFR 1508.7). This analysis follows the 11-step process outlined by the CEQ in their 1997 publication Considering Cumulative Effects Under the National Environmental Policy Ac (Table 1).
Table 1. Steps in the Cumulative Effects Analysis (as adapted from CEQ 1997) Environmental Impact Assessment Components CEA Steps
I. Scoping
1. Identify the significant cumulative effects issues associated with the proposed action and define the assessment goals.
2. Establish the geographic scope for the analysis.
3. Establish the time frame for the analysis.
4. Identify other actions affecting the resources, ecosystems, and human communities of concern.
II. Describing the Affected Environment
5. Characterize the resources, ecosystems, and human communities identified in scoping in terms of their response to change and capacity to withstand stresses.
6. Characterize the stresses affecting these resources, ecosystems, and human communities and their relation to regulatory thresholds.
7. Define a baseline condition for the resources, ecosystems, and human communities.
III. Determining the Environmental Consequences
8. Identify the important cause-and-effect relationships between human activities and resources, ecosystems, and human communities.
9. Determine the magnitude and significance of the cumulative effects.
10. Modify or add alternatives to avoid, minimize, or mitigate significant cumulative effects.
11. Monitor the cumulative effects of the selected alternative and adapt management.
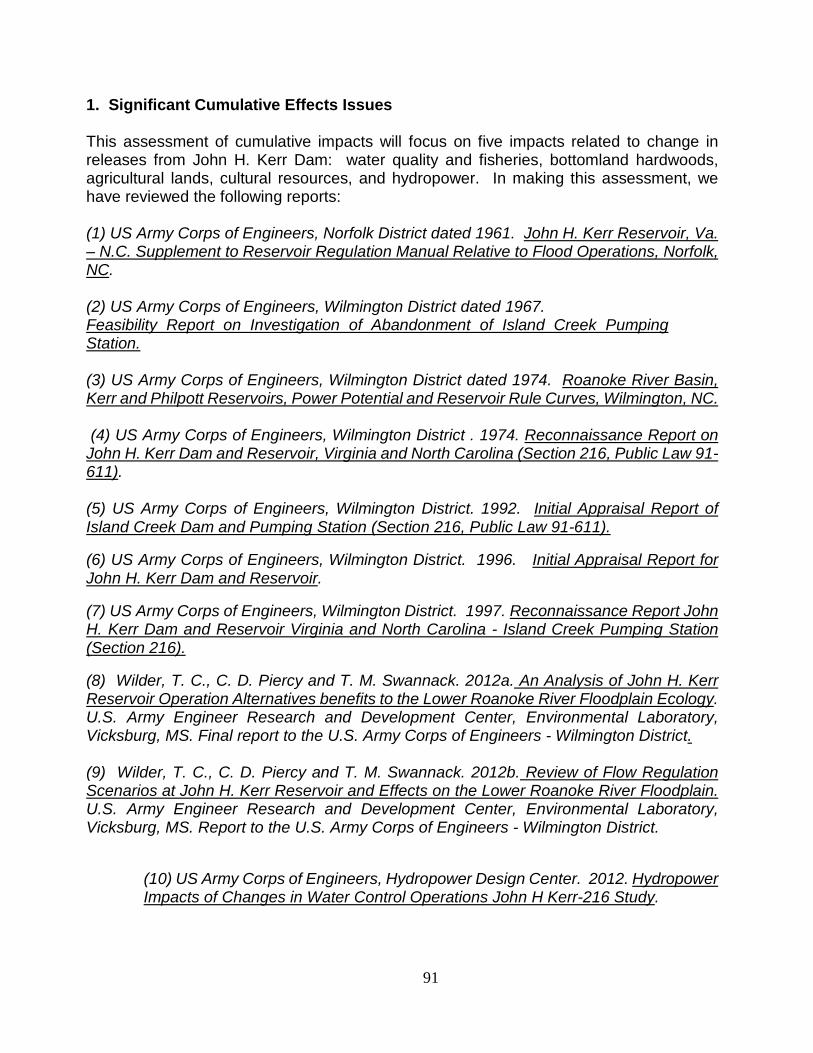
91
1. Significant Cumulative Effects Issues This assessment of cumulative impacts will focus on five impacts related to change in releases from John H. Kerr Dam: water quality and fisheries, bottomland hardwoods, agricultural lands, cultural resources, and hydropower. In making this assessment, we have reviewed the following reports: (1) US Army Corps of Engineers, Norfolk District dated 1961. John H. Kerr Reservoir, Va. – N.C. Supplement to Reservoir Regulation Manual Relative to Flood Operations, Norfolk, NC. (2) US Army Corps of Engineers, Wilmington District dated 1967. Feasibility Report on Investigation of Abandonment of Island Creek Pumping Station. (3) US Army Corps of Engineers, Wilmington District dated 1974. Roanoke River Basin, Kerr and Philpott Reservoirs, Power Potential and Reservoir Rule Curves, Wilmington, NC. (4) US Army Corps of Engineers, Wilmington District . 1974. Reconnaissance Report on John H. Kerr Dam and Reservoir, Virginia and North Carolina (Section 216, Public Law 91-611). (5) US Army Corps of Engineers, Wilmington District. 1992. Initial Appraisal Report of Island Creek Dam and Pumping Station (Section 216, Public Law 91-611).
(6) US Army Corps of Engineers, Wilmington District. 1996. Initial Appraisal Report for John H. Kerr Dam and Reservoir.
(7) US Army Corps of Engineers, Wilmington District. 1997. Reconnaissance Report John H. Kerr Dam and Reservoir Virginia and North Carolina - Island Creek Pumping Station (Section 216).
(8) Wilder, T. C., C. D. Piercy and T. M. Swannack. 2012a. An Analysis of John H. Kerr Reservoir Operation Alternatives benefits to the Lower Roanoke River Floodplain Ecology. U.S. Army Engineer Research and Development Center, Environmental Laboratory, Vicksburg, MS. Final report to the U.S. Army Corps of Engineers - Wilmington District. (9) Wilder, T. C., C. D. Piercy and T. M. Swannack. 2012b. Review of Flow Regulation Scenarios at John H. Kerr Reservoir and Effects on the Lower Roanoke River Floodplain. U.S. Army Engineer Research and Development Center, Environmental Laboratory, Vicksburg, MS. Report to the U.S. Army Corps of Engineers - Wilmington District.
(10) US Army Corps of Engineers, Hydropower Design Center. 2012. Hydropower Impacts of Changes in Water Control Operations John H Kerr-216 Study.

92
(11) Garcia, Ana Maria. 2011a. Water Quality Modeling of the Lower Roanoke River, North Carolina: Evaluation of scenarios for water quality improvement. USGS, Raleigh, NC
(12) Garcia, Ana Maria. 2011b. Water Quality Modeling of the Lower Roanoke River, North Carolina: Model development and calibration. USGS, Raleigh, NC
(13) US Army Corps of Engineers. 2012. Methodology and Results for Determining Flood Impacts to the Roanoke River Basin.
In addition to these documents, many other documents were reviewed and are referenced as appropriate in the remainder of this assessment.
2. Geographic Scope
This analysis will focus on cumulative impacts within two different geographic areas. The first area is the Roanoke River watershed from John H. Kerr Dam and Reservoir downstream to where the river enters the Albemarle Sound (Figures 1 & 2). The discussion on water quality, bottomland hardwoods, fisheries and agriculture will be restricted to those areas since impacts to these resources will not likely be appreciable outside of the watershed.
Figure 1. Location of John H. Kerr Reservoir and Dam and downstream dams.
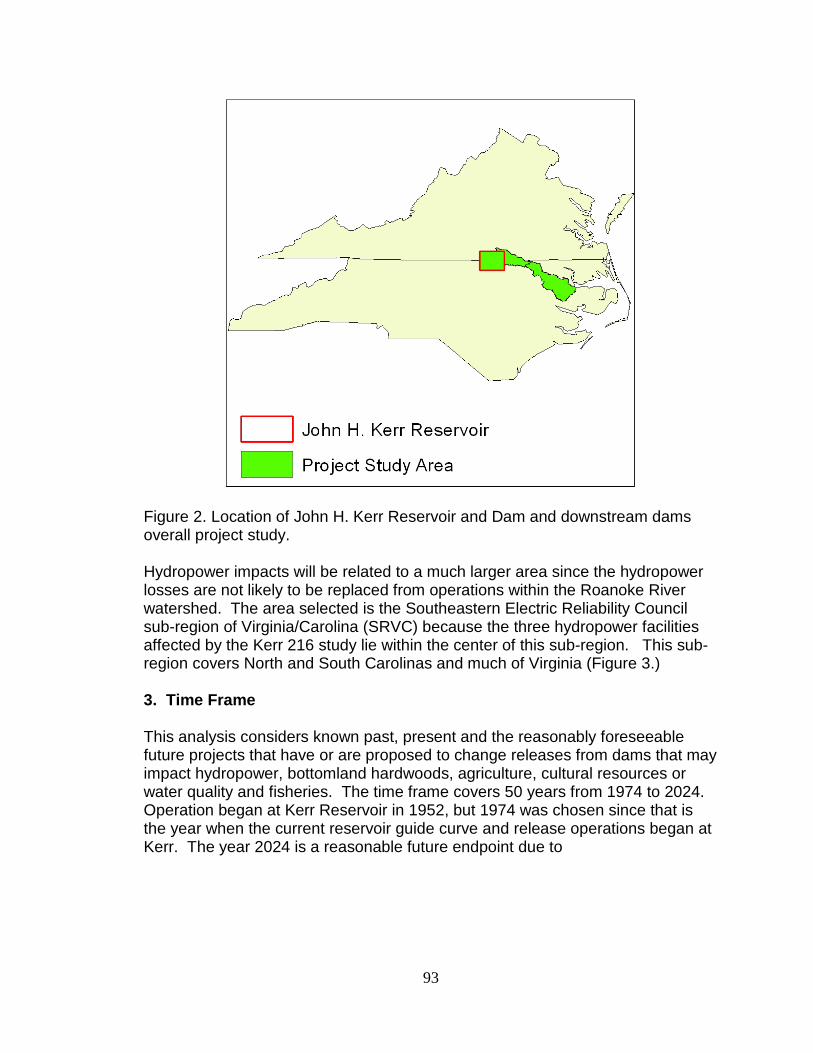
93
Figure 2. Location of John H. Kerr Reservoir and Dam and downstream dams overall project study. Hydropower impacts will be related to a much larger area since the hydropower losses are not likely to be replaced from operations within the Roanoke River watershed. The area selected is the Southeastern Electric Reliability Council sub-region of Virginia/Carolina (SRVC) because the three hydropower facilities affected by the Kerr 216 study lie within the center of this sub-region. This sub-region covers North and South Carolinas and much of Virginia (Figure 3.) 3. Time Frame This analysis considers known past, present and the reasonably foreseeable future projects that have or are proposed to change releases from dams that may impact hydropower, bottomland hardwoods, agriculture, cultural resources or water quality and fisheries. The time frame covers 50 years from 1974 to 2024. Operation began at Kerr Reservoir in 1952, but 1974 was chosen since that is the year when the current reservoir guide curve and release operations began at Kerr. The year 2024 is a reasonable future endpoint due to

94
Figure 3. Southeastern Electric Reliability Council sub-region of Virginia/Carolina (SRVC). eGRID2010 Version 1.1, Year 2007 Summary Tables, (created May 2011) http://www.epa.gov/cleanenergy/energy-resources/egrid/index.html relatively long lead time for changes at hydropower facilities and any other activities large enough to alter the basin conditions. Project vicinity scale cumulative assessment considers past historic hydrological impacts associated with current operational guidelines of hydropower resources, and any activities within the basin that would impact those same areas. This also assumes both cumulative impacts associated with continuation of current hydropower operational guidelines and impacts associated with alteration of the hydropower operating guidelines and guide curve should the fabric weir or quasi-run-of-river alternatives proposed in the environmental assessment (EA) be implemented. Additional, cumulative impacts within the basin that would affect resources within the basin were also taken into consideration. 4. Actions Affecting Resources of Concern This analysis of cumulative effects of the proposed action will focus on the change in releases from dams that will impact hydropower to improve downstream ecosystems as well as evaluate other activities within the basin that may affect those same downstream ecosystems. In making this assessment, we have reviewed the reports indicated in Section 1 above along with other
SRVC
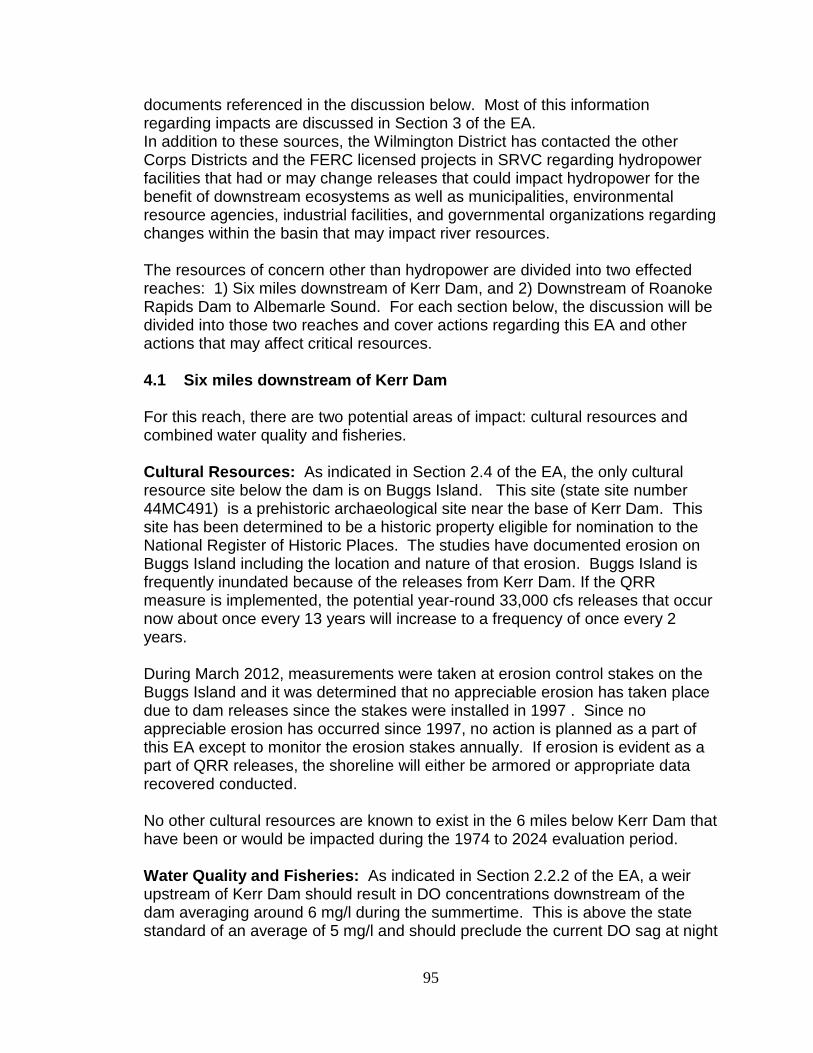
95
documents referenced in the discussion below. Most of this information regarding impacts are discussed in Section 3 of the EA. In addition to these sources, the Wilmington District has contacted the other Corps Districts and the FERC licensed projects in SRVC regarding hydropower facilities that had or may change releases that could impact hydropower for the benefit of downstream ecosystems as well as municipalities, environmental resource agencies, industrial facilities, and governmental organizations regarding changes within the basin that may impact river resources. The resources of concern other than hydropower are divided into two effected reaches: 1) Six miles downstream of Kerr Dam, and 2) Downstream of Roanoke Rapids Dam to Albemarle Sound. For each section below, the discussion will be divided into those two reaches and cover actions regarding this EA and other actions that may affect critical resources. 4.1 Six miles downstream of Kerr Dam For this reach, there are two potential areas of impact: cultural resources and combined water quality and fisheries. Cultural Resources: As indicated in Section 2.4 of the EA, the only cultural resource site below the dam is on Buggs Island. This site (state site number 44MC491) is a prehistoric archaeological site near the base of Kerr Dam. This site has been determined to be a historic property eligible for nomination to the National Register of Historic Places. The studies have documented erosion on Buggs Island including the location and nature of that erosion. Buggs Island is frequently inundated because of the releases from Kerr Dam. If the QRR measure is implemented, the potential year-round 33,000 cfs releases that occur now about once every 13 years will increase to a frequency of once every 2 years. During March 2012, measurements were taken at erosion control stakes on the Buggs Island and it was determined that no appreciable erosion has taken place due to dam releases since the stakes were installed in 1997 . Since no appreciable erosion has occurred since 1997, no action is planned as a part of this EA except to monitor the erosion stakes annually. If erosion is evident as a part of QRR releases, the shoreline will either be armored or appropriate data recovered conducted. No other cultural resources are known to exist in the 6 miles below Kerr Dam that have been or would be impacted during the 1974 to 2024 evaluation period. Water Quality and Fisheries: As indicated in Section 2.2.2 of the EA, a weir upstream of Kerr Dam should result in DO concentrations downstream of the dam averaging around 6 mg/l during the summertime. This is above the state standard of an average of 5 mg/l and should preclude the current DO sag at night

96
which can approach 1 mg/l. This improvement in DO will benefit at least six miles of habitat downstream which covers 501 acres. Also epilimnionic waters are low in oxygen demanding substances (BOD and COD) and are less likely to cause DO levels to sag at night compared to current releases of hypolimnionic waters. Epilimnionic waters are also generally lower in nutrients (e.g. nitrogen and phosphorus) and that would diminish potential occurrences of algal blooms downstream. After large algal blooms, DO levels can be depressed due to the decay of the excessive amount of organic matter resulting from the blooms. The temperature of the water released from Kerr Dam will increase from about 21oC to 29oC during the summertime because primarily epilimnionic waters will be released downstream. However these are normal summer temperatures for reservoirs in the South and the temperatures that exist below Lake Gaston and Roanoke Rapids Reservoir. Under current operations during high summertime releases from Kerr Dam, large volumes of low DO water from Kerr could overwhelm the downstream reservoirs and depress the DO concentration of the water released from both Gaston and Roanoke Rapids Dams. With a weir in place at Kerr Dam, this scenario should be precluded. As indicated in Section 2.2.2 of the EA, in order to improve DO levels downstream of Kerr Dam, the six main turbines have been vented, which allows air to be entrained into the water. This work was completed in January 2012. When venting three of these turbines was completed, this venting helped raise the downstream DO values but not enough to consistently raise DO levels to the state standard. Even if all the turbines were used, DO would probably not improve downstream since venting efficiency greatly diminishes when more than three turbines are used. This is due to a decreased venturi effect of sucking air into the turbines with higher tailwater elevation below Kerr Dam with increased discharge. As indicated in Sections 2.2.2 and 3.2.2 of the EA, the limiting parameter for enhancing fisheries below Kerr Dam is DO concentrations. If DO levels are improved to consistently meet the state standard via a fabric weir or DO injection upstream of Kerr Dam, fisheries will be substantively improved. No other appreciable actions have been conducted or are planned within the 50 year period to improve DO or fisheries habitat levels below Kerr Dam. 4.2 Downstream of Roanoke Rapids Dam to Albemarle Sound: For this reach, there are three potential areas of impact: bottomland hardwoods, water quality and fisheries, and agriculture.

97
Bottomland hardwoods: As identified in Section 2.3.1 and 3.2.1 of the EA, it is estimated that floodplain forest along the lower Roanoke River, comprised of 92,000 acres, are affected or altered by hydrology due to management operations at the Kerr Reservoir. An extended period of inundation or reduced inundation in some areas during the growing season is causing a reduction in community diversity. Vegetation communities along the Roanoke are becoming increasingly stratified due to the change in the natural flood regime caused by altered flood patterns from regulation by the upstream dams. This change in the natural inundation pattern is allowing for less flood tolerant species to become established in higher elevation areas naturally inhabited by bottomland hardwood species therefore lowering the overall vegetative diversity of the floodplain. Further effects of regulated flow are being documented in a University of North Carolina study that has examined tree seedling survival in the Lower Roanoke under different flooding conditions, and a study by the USACE Engineer Research and Development Center, which has found significantly higher signs of stress in trees in the lower Roanoke as compared to what was found in nearby, unregulated watersheds. According to the Environmental Benefits Analysis performed for the floodplain forest, the habitat value of this resource will decline by about 12 percent over the next 50 years if releases from Kerr Reservoir are not changed. Some future shifts may be dramatic under current hydrologic guidelines, occurring in a patchy fashion over a few years, or a single season. They may begin with a high mortality event triggered by a wet year or a series of them, as many individuals of a species succumb to the cumulative effects of years of prolonged soil hypoxia. They may come suddenly with the outbreak of a disease or parasite facilitated by many trees in a weakened state. Changes in the vegetation may be more gradual, as species favored by the existing hydrologic conditions out-compete those for whom the areas have become less suitable. Paper mills located at Roanoke Rapids (Kapstone) and further downstream at Plymouth (Domtar) have been reducing the amount of hardwoods processed over the last several years and both plants have transitioned to utilizing only soft woods such as Southern Pine to produce “fluff”. Additional changes in environmental business practices at Kapstone in Roanoke Rapids and the relocation of the International Paper plant to outside of the Roanoke River Basin to Franklin County should further improve conditions and dependence on the hardwoods within the Roanoke River Basin. ENVIVA, a supplier of sustainably- sourced wood pellets and other processed biomass, is in the process of completing a plant in Ahoskie, NC that will be completed during the period of consideration. The plant is not expected to be in close proximity to water sources directly connecting to the Roanoke River and processes wood by-products such as chips, branches, tree tops, and other forestry debris from removal of primary biomass such as tree trunks. As this utilizes an otherwise untapped resource from current forestry practices, that are not necessarily solely

98
within the Roanoke Basin, it is not anticipated that plant construction will change the overall conditions of the bottomland hardwoods along the Roanoke River. Several large tracts of Bottomland hardwoods are owned and maintained by resource agencies. The NC Wildlife Resources Commission has acquired roughly 24,000 acres in game lands to date. Economic constraints are expected to restrict WRC from the purchase of any additional lands during the period of record under consideration. Small scale timber harvest is occurring on upland tracks comprised primarily of loblolly pine plantations with no harvest of bottomland hardwood areas. The Roanoke River National Wildlife Refuge is managed by the Fish and Wildlife Service and currently encompasses 21,000 acres of forest that is accessible to the public. The refuge plan does allow for timber harvest for wildlife purposes but are generally small scale. A refuge expansion plan to connect the Pungo and Roanoke Refuges is being developed internally within the NWR and, if approved, approval would take several years. The Nature Conservancy holds titles or conservation easements privately protecting nearly 91,000 acres designated as the Roanoke River Conservation Area. Water Quality and Fisheries: As identified in 2.2.2 of the EA, the low DO levels generally do not extend below Lake Gaston Dam, as there is a submerged weir that is located just upstream of Roanoke Rapids Dam which permits only the oxygenated surface waters to flow downstream. There is also a similar weir just upstream of Gaston Dam. However, during flood events in the warmer months under existing conditions, low DO releases from Kerr Dam may overwhelm the system and affect releases from Lake Gaston and Roanoke Rapids Dams. A major concern for the lower Roanoke River is the effect of low DO concentrations during warm weather. When approximately 20,000 cfs is released over long periods of time, water tends to stand in the downstream swamps and the DO approaches zero due to biochemical oxygen demand (BOD) and chemical oxygen demand (COD). This low DO water eventually drains back into the river when discharge from the dam is reduced and can result in fish kills. A Betterment Plan was developed by a multiagency group in 1998 and was initiated to attempt to reduce this effect by stepping down the release in about 5,000 cfs increments and holding at those increments for several days. Since implementation, this plan has been effective and no fish kills have occurred due to Kerr Reservoir releases. Paper plants are one of the major industries along the Roanoke River providing a significant portion of water demand and outflows into the river system. Over the last decade changes in product production and business practices such as reduction of processed materials have reduced water demand on the Roanoke River by several millions of gallons of water per day while also reducing the loading back into the river. Plants located in Roanoke Rapids and Plymouth, NC have continued to alter practices to further reduce their impacts on the river

99
system. The relocation of the International Paper plant outside of the Roanoke River Basin to Franklin County should further reduce reliance on the river by industry and the proposed construction of the ENVIVA plant in Ahoskie, NC is not expected to be provide additional withdrawals or loading into the river as it is not located in the Roanoke River Basin. As industry standards and practices continue to change, the potential for improved water quality should continue to increase. While some growth of the surrounding community is expected over the next decade and beyond (Section 2.5.1), growth rates are anticipated to be low enough as to have minimal, if any, impacts on the overall composition of the river and should not lead to changes in water quality. The town of Williamson is planning on installation of a small water supply intake in response to growth requiring that the river be re-classified for water supply use in that area. However, the intake quantities are so minimal compared to the flow rates of the Roanoke that the intake will have no impact on the river. No other new major intakes or outflows into the river from the cities, industry, agricultural fields, or private estates are known at this time. However, based on current demographics and growth rates it is expected that if intakes were needed they would be of similar size to that of the Williamson intake and therefore have minimal impacts on the Roanoke River Basin. In April 2012, Atlantic sturgeons (Acipenser oxyrinchus) were classified as an endangered species by the National Marine Fisheries Service and have been documented in the Roanoke River. Based on known activities. The shortnose sturgeon (Acipenser brevirostrum) was already listed any may occur in the river. It is not expected that current or future anticipated conditions would negatively impact the sturgeon that may be in the Roanoke River. Other fish species, such as American shad and striped bass, are also not expected to be impacted by changes in water quality over the period of analysis mainly because the spring releases for anadromous fish is not proposed to be changed (Section 2.3.3). Agriculture: Downstream counties include Halifax, Warren, Northampton, Bertie, Martin, and Washington Counties in North Carolina with farm acreage (cropland, pastureland, and grazing) accounting for 775,679 acres of the downstream counties. As stated in Section 2.5.2 of the main document, much of the remaining downstream area is devoted to commercial forestry management and production, as well as conservation and conservation management. Timber production and management is distributed along both banks of the Roanoke River downstream of Roanoke Rapids with extensive tracts in the downstream counties. Several large forest product firms have plants in Roanoke Rapids and Plymouth that use timber harvested along the river and surrounding areas. While many of these plants have downsized and reduced produced materials there is still a harvest industry present as many of these plants have transitioned away from hardwoods but still require the harvesting of soft woods. See bottomland hardwoods section above for additional information.
100
Based on historic uses within the basin and the low growth rate of the area as indicated in Section 2.5.2 of the EA, it is expected that agriculture will continue in much the same capacity as it has over the last several decades. Off-loading from adjacent fields into the river and timber harvesting are expected to remain relatively consistent with past trends. Some existing farmland and timberland may eventually be converted to residential or other commercial use, however, large scale urbanization of the area is unlikely to occur. Economic downturns have not resulted in an increase in timber harvested by the agricultural community and the wood processing facility in Roanoke Rapids has not seen nor expects increases in production from local private timber harvests. Other factors affecting assessment areas: Many factors unrelated to the changes proposed in the EA may affect resources within the Roanoke River basin and, specifically, the resources of concern outlined above. These factors can be a result of natural events such as natural population cycles or weather conditions including La Nina, El Nino, and major storms such as hurricanes that could result in alterations to the current or projected future conditions of the Roanoke River Basin. Anthropogenic impacts associated with unanticipated development, fishing and hunting, or degradation of water quality due to pollution could play a role in the health of the bottomland hardwoods and fisheries resources. 5 & 6. Resource Capacity to Withstand Stress and Regulatory Thresholds Hydropower: Any changes in hydropower operation at John H. Kerr dam will result in an increase in emission of green house gases since the loss of hydropower generation will likely be replaced by a fossil fuel plant. These emission compared to what is produced in SRVC are indicated below and all the measures investigated indicate a very small percentage change. Full descriptions of the measures that may affect hydropower can be found in the EA Section 2.2.3. Currently, there are no established thresholds related to greenhouse gas emissions.

101
Table 2. Annual Regional Power System Non-Base-Load Emissions Increase Over Existing Conditions as a Result of Lost Hydropower (tons) 2 eGRID2010 Version 1.1, Year 2007 Summary Tables, (created May 2011) http://www.epa.gov/cleanenergy/energy-resources/egrid/index.html Other Resources: There are no known thresholds relating to the extent of the Roanoke Basin that can be disturbed without significant impacts to hardwood forests, fisheries, cultural resources, and agriculture. Therefore, a comparison of cumulative impacts to established thresholds is not made. State water quality regulatory standards has identified 5.0 mg/L as the minimum value for Dissolved oxygen in North Carolina waters. As identified in Section 2.2.2, water quality concerns regarding low dissolved oxygen, especially in the summer months, has lead to proactive measures such as the Betterment Plan to counter the low downstream values below Kerr Dam. It is expected that there is a low risk that the direct and cumulative impacts of the proposed action and other known similar activities would reach a threshold with potential for population adverse level impacts on resources, but should provide substantial benefits. 7. Baseline Conditions Hydropower: The baseline conditions for hydropower production (annual megawatt hours (AMWH)) as compared to the three potential measures are indicated in Table 3 below.
Kerr 216 Carbon Dioxide
Kerr 216 Methane
Kerr 216 Nitrogen Oxide
Kerr 216 Carbon Dioxide Equivalent
SRVC Carbon Dioxide Equivalent2
Kerr 216 Percent Change
CO2 CH4 N2O CO2e CO2eMGC_35K 13,717 0.31 0.2 13,783 176,695,590 0.0078Plan QRR 32,456 0.74 0.48 32,615 176,695,590 0.0185
MGC_35K YR 20,106 0.46 0.3 20,205 176,695,590 0.0114
Kerr 216 Nitrous Oxides
SRVC Nitrous Oxides2
Kerr 216 Percent Change
Kerr 216 Sulfur Dioxide SRVC Sulfur Dioxide2 Kerr 216 Percent Change
NOX NOX SO2 SO2
MGC_35K 17.09 196,705 0.0087 65.79 750,246 0.0088Plan QRR 40.45 196,705 0.0206 155.66 750,246 0.0207
MGC_35K YR 25.06 196,705 0.0127 96.43 750,246 0.0129
Criteria Pollutants
Alternative
Alternative
Greenhouse Gases

102
John H
Kerr Gaston Roanoke Rapids
System Average Annual Generation
Difference from Baseline
Alternative AMWH AMWH AMWH AMWH AMWH % Baseline 479,008 349,142 356,018 1,184,167 --- ---
MGC_35k 473,066 349,127 345,459 1,167,652 16,515 -1.39% Plan QRR 462,729 349,490 332,870 1,145,090 39,078 -3.30%
MGC_35k_ yr_rnd 471,194 349,303 339,462 1,159,960 24,207 -2.04%
Table 3. Average Annual Power Generation - Baseline and Three Flow Scenarios Other Resources: The following sections of the EA describe the status of hydropower and other significant resources that may be affected by this and other similar projects that are pertinent to this analysis as well as identify future without project conditions. Section 2.0 Affected Environment. Section 2.2.3 Hydropower 8. Cause and Effect Relationships Hydropower: As indicated in Table 3, if any of the potential measures are implemented there will be a 1.4% to 3.3% loss in hydropower production. This will be directly related to an increase in greenhouse emission because this loss in production will likely be replaced by fossil fuel generation. Other Resources: The following section of the EA describes impacts of the proposed actions on significant resources. Cause and effect relationships described in the report are consistent with those that would be expected for other similar projects that are pertinent to this analysis. Section 3.0 Environmental Effects 9. Magnitude and Significance of Resource Impacts 9a. 6 Miles Downstream of Kerr Dam Cultural Resources: There are no additional cumulative impacts beyond those identified in Section 3.4 of the EA which suggest that alterations in water releases from Kerr should not increase the erosion at the Buggs Island site. Also there should not be any impacts downstream of Roanoke Rapids Dam. Water Quality and Fisheries: Implementation of the proposed project should provide significant increases in habitat value as indicated in Section 3.2.2 of the
103
EA. Increased releases of higher dissolved oxygen waters will improve water quality conditions, and in turn, improve fisheries habitat. Other impacts that would negatively impact water quality or fisheries have not been identified in waters within the six miles below Kerr dam. Agricultural related runoff is the only other identified potential impact and agriculture is not anticipated to increase significantly during the period of consideration so it is expected that cumulative impacts will result in an overall positive benefit to water quality and fisheries within the local watershed. 9b. Downstream of Roanoke Rapids Hydropower: The Wilmington District has contacted the other Corps Districts and the FERC licensed projects in SRVC, and American Rivers regarding hydropower facilities that had or may change average annual power production due to facility upgrades, releases for environmental purposes, or the facility being closed. Table 4 summarizes those changes. While Table 4 does not represent an exhaustive study, the table indicates for the projects that involved releases for environmental benefits there was a 0.01 to 9.1% loss in average annual hydropower generation. However even with this loss, there is an approximate 7% net increase due to recent upgrades, new facilities, or an anticipated near term increase in hydropower generation in SRVC. The associated increase in greenhouse emissions will be around 0.02 percent of the emissions presently occurring in the SRVC which is not considered a significant increase. Bottomland Hardwoods: Implementation of the proposed project should result in the transition of the floodplains back to vegetation compositions that more historically reflect conditions of an unregulated river. Reduction of timber production of hardwood species in the area by paper mills and no expected increases in harvests by local property owners will further support the establishment of the bottomland hardwoods toward a more natural composition of species. Property acquisitions by State and Federal agencies will promote the
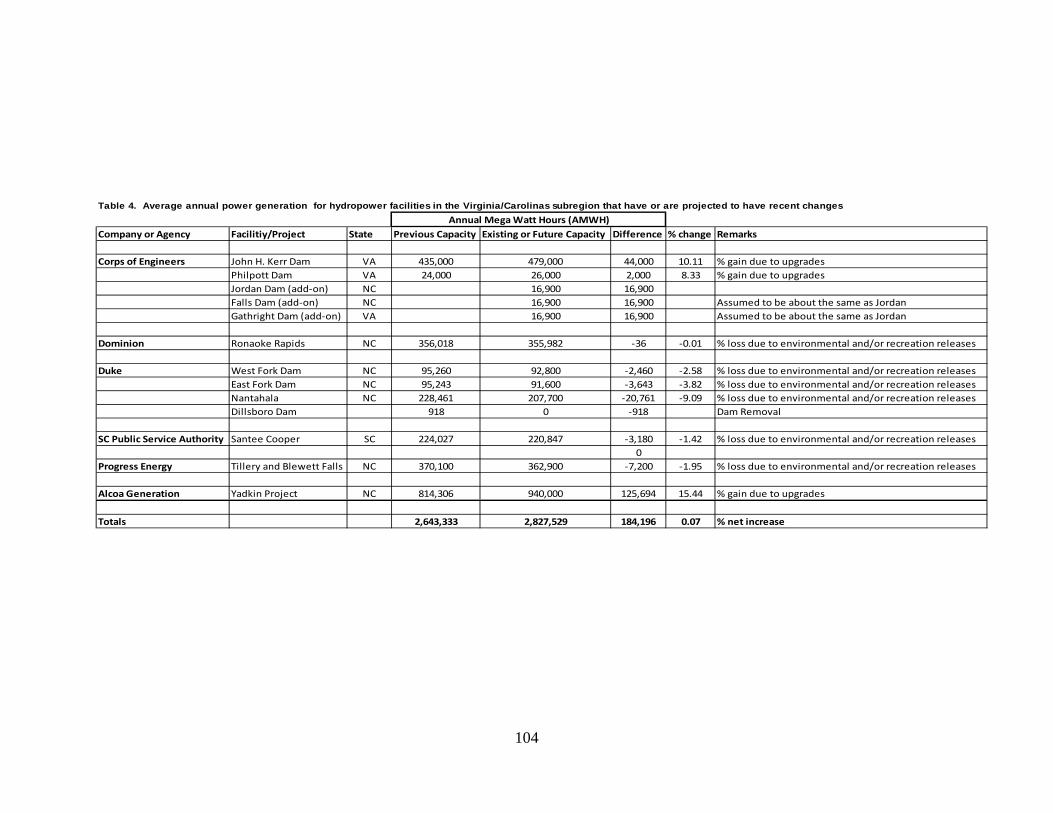
104
Table 4. Average annual power generation for hydropower facilities in the Virginia/Carolinas subregion that have or are projected to have recent changes
Annual Mega Watt Hours (AMWH)Company or Agency Facilitiy/Project State Previous Capacity Existing or Future Capacity Difference % change Remarks
Corps of Engineers John H. Kerr Dam VA 435,000 479,000 44,000 10.11 % gain due to upgradesPhilpott Dam VA 24,000 26,000 2,000 8.33 % gain due to upgradesJordan Dam (add-on) NC 16,900 16,900Falls Dam (add-on) NC 16,900 16,900 Assumed to be about the same as JordanGathright Dam (add-on) VA 16,900 16,900 Assumed to be about the same as Jordan
Dominion Ronaoke Rapids NC 356,018 355,982 -36 -0.01 % loss due to environmental and/or recreation releases
Duke West Fork Dam NC 95,260 92,800 -2,460 -2.58 % loss due to environmental and/or recreation releasesEast Fork Dam NC 95,243 91,600 -3,643 -3.82 % loss due to environmental and/or recreation releasesNantahala NC 228,461 207,700 -20,761 -9.09 % loss due to environmental and/or recreation releasesDillsboro Dam 918 0 -918 Dam Removal
SC Public Service Authority Santee Cooper SC 224,027 220,847 -3,180 -1.42 % loss due to environmental and/or recreation releases0
Progress Energy Tillery and Blewett Falls NC 370,100 362,900 -7,200 -1.95 % loss due to environmental and/or recreation releases
Alcoa Generation Yadkin Project NC 814,306 940,000 125,694 15.44 % gain due to upgrades
Totals 2,643,333 2,827,529 184,196 0.07 % net increase

105
continued establishment of historic conditions. Therefore, it is not expected that there will be negative cumulative impacts associated with the bottomland hardwoods of the Roanoke River Basin. Water Quality: Reduction in releases of low dissolved oxygen waters from upstream of Roanoke Rapids Dam and reduced inundation times of the bottomland forests should promote an increase in water quality due to higher levels of dissolved oxygen being maintained within the river system as indicated in Section 3.2.2. of the EA. Alterations in business practices by industry, specifically paper mills, in the basin have greatly reduced the amount of loading and withdrawals from the river, improving habitat conditions. In addition, a stable population with very little growth is not expected to greatly contribute to any further decline in water quality. It is not expected that any of the identified changes in water quality within the Roanoke River basin would result in negative cumulative impacts to water quality within the river basin during the period of consideration nor would cumulative impacts negatively impact water quality in the State of North Carolina. Agriculture: As stated in Section 3.5.2 – Agriculture and Silviculture, agriculture below Roanoke Rapids Dam could be impacted by the project by increasing the amount of flooding that occurs on agricultural land. Additional impacts to silviculture may occur as increased flooding frequency will periodically limit access to harvesting areas. Some urbanization is expected but should remain minimal during the period of analysis. These changes may facilitate some fields being taken out of agriculture due to the increased risk of flooding and some urbanization but generally should not result in any large changes in agriculture within the river basin nor should this appreciably impact overall agriculture within North Carolina. 10. Actions to Reduce Cumulative Impacts Measure QRR was chosen as the tentatively selected plan because it was the only measure that indicated an ecological benefit to the ecosystem downstream of Roanoke Rapids Dam. Other measures could have be formulated that would have a greater benefit to the ecosystem, but would likely have a greater impact to hydropower and other resources such as agriculture. Therefore other measures were not pursued. Net cumulative benefits suggest that there will be positive impacts on the other environmental resources identified. 11. Monitoring and Adaptive Management The Corps is not proposing any monitoring due to the ecological changes would be gradual and hard to measure, especially if flooding events are infrequent as they have been since 2003.