Embed Size (px)
Citation preview
Volume 3: ESIA Specialist Volume – Surface and Groundwater – September 2014
Coastal & Environmental Services (Pty) Ltd i EcoFarm Lda
ECOFARM IRRIGATION AND ORGANIC SUGARCANE PROJECT CHEMBA DISTRICT, SOFALA PROVINCE, MOZAMBIQUE
ENVIRONMENTAL AND SOCIAL IMPACT ASSESSMENT
VOLUME 3: SPECIALIST REPORTS
CHAPTER 3: SURFACE AND GROUNDWATER
Prepared for:
Prepared by:
EcoFarm Mozambique Lda Coastal & Environmental Services
Av. Eduardo Mondlane No 1723, Ponta Gea,
Beira, Sofala,
Mozambique
GRAHAMSTOWN P.O. Box 934, Grahamstown,
6140 South Africa
MAPUTO Rua da Frente de
Libertação de Mozambique, Number 324,
Maputo, Mozambique
South Africa and Mozambique
FINAL REPORT
September 2014
Volume 3: ESIA Specialist Volume – Surface and Groundwater – September 2014
Coastal & Environmental Services (Pty) Ltd ii EcoFarm Lda
This Report should be cited as follows: Coastal & Environmental Services, September 2014: Ecofarm Irrigation and Organic Sugarcane Project Mozambique, Surface and groundwater Assessment, CES, Grahamstown. Report Title: Ecofarm Irrigation and Organic Sugarcane Project Mozambique, Surface and groundwater Assessment, CES, Grahamstown
Name Affiliation Role / Function Date
Cherie-Lyn Mack Coastal and Environmental Services (Pty) Ltd
Author November 2013
Bill Rowlston Coastal and Environmental Services (Pty) Ltd
Editor / Reviewer December 2013
Mike bailey Coastal and Environmental Services (Pty) Ltd
Editor July 2014
Bill Rowlston Coastal and Environmental Services (Pty) Ltd
Editor September 2014
COPYRIGHT INFORMATION
This document has been prepared in accordance with the scope of Coastal & Environmental Services
(Pty) Ltd’s (CES) appointment and contains intellectual property and proprietary information that is
protected by copyright in favour of CES. The document may therefore not be reproduced, used or
distributed to any third party without the prior written consent of Coastal & Environmental Services. This
document is prepared exclusively for use by CES’s client. CES accepts no liability for any use of this
document other than by its client and only for the purposes for which it was prepared. No person other
than the client may copy, in whole or in part, use or rely on the contents of this document without the prior
written permission of CES. The document is subject to all confidentiality, copyright and trade secrets rules,
intellectual property law and practices of South Africa.
Volume 3: ESIA Specialist Volume – Surface and Groundwater – September 2014
Coastal & Environmental Services iii EcoFarm Mozambique Lda
EXECUTIVE SUMMARY Project Background The proposed project, which comprises the establishment, installation, operation and maintenance of irrigation infrastructure to serve between 2 000 and3 000 hectares of organic sugar cane, is situated in the Chemba District in the Sofala Province of Mozambique, is to be developed on the outskirts of the town of Chemba alongside the Zambezi River and its tributaries. The developer, EcoFarm Mozambique Lda. (EcoFarm), is an organic sugarcane-growing, processing and trading company based in Mozambique. EcoFarm wishes to establish this project with grant funding provided by the governments of Mozambique and the Netherlands. EcoFarm appointed Coastal and Environmental Services (CES) to conduct a faunal survey of the Project Area. This survey has established the anticipated impacts associated with the construction and operation of the project, and forms part of the Environmental and Social Impact AAssessment (ESIA) conducted by CES. EcoFarm also intends to erect a sugar factory that will ultimately be capable of processing 2 000 tonnes of sugar cane per day (TCD) to produce raw (brown) and “plantation white” sugar. The factory will be equipped with two medium-pressure, high-temperature boilers that will drive generators to power the factory and external electrically-drive irrigation equipment. The factory will be situated on the northern border of EcoFarm 1 DUAT. Terms of Reference Specialists will be required to address issues raised by I&APs in their reports. In addition, the specific terms of reference for this specialist study will be:
Provide a basic characterisation of the surface water resources, including seasonal variations, based on existing available information.
Determine whether or not there will be significant net loss of water from the system due to the development, and comment on the implications.
Identify significant impacts that may result, either directly from the use of water, or indirectly through the abstraction of water resources in the sub-region.
Comment on the risks to surface water resources at the site.
Determine possible impacts associated with pumping water from the Zambezi, as well as from the physical structures.
Determine whether there will be any cumulative impact on the rivers running through or adjacent to the site.
Provide practical design recommendations where possible.
Assess and rate the environmental significance of identified impacts using the methodology prescribed by CES.
Provide feasible recommendations of the mitigation of impacts on surface water resources and the hydrology and fluvial morphology of the river.
Provide recommendations with respect to parameters to be included in the establishment of a comprehensive water quality baseline for the site.
Assumptions and Limitations Much of the information regarding the proposed development and data relating to water use on which this report was based was provided by the Client. While every effort was made to verify the information, it was assumed that it was correct and valid. This specialist report was subject to the following additional assumptions and limitations:
All project-specific information was based on information supplied by client and was assumed to be accurate.
Volume 3: ESIA Specialist Volume – Surface and Groundwater – September 2014
Coastal & Environmental Services (Pty) Ltd iv EcoFarm Lda
This report provides a snapshot baseline quality assessment and does not account for the seasonal variations that may occur. It should be noted that a single sample at each site does not provide sufficient data for an accurate, high confidence assessment of the quality of the surface and groundwater quality.
Due to the remoteness of the sampling sites and duration of the overall sampling period, it was not possible to preserve the samples on ice prior to laboratory analysis. As a result, only heavy metal analysis, which requires acid digestion of samples to determine the total metal content, was analysed. The result presented in this report does not include hydrocarbon and biological assay of the water samples.
Sediment samples were not collected for analysis.
Approach In order to assess the likely significance of impacts associated with the management of surface and ground water resources in the locality of the proposed development and to make recommendations regarding the management of effluent streams, it was necessary to review the biophysical context of the project as well as the current legal framework and relevant international guidelines. The surface and groundwater assessment was conducted using the following steps:
Preliminary desktop review;
Site visit and sample collection;
Data analysis; and
Impact assessment. Data obtained from the laboratory analysis of water samples were benchmarked against the relevant standards as follows:
Australian and New Zealand Guidelines for Fresh and Marine Water Quality Volume 4 (ANZECC 2000).
Groundwater: Dutch List (2000).
Drinking water: Regulation on the Quality of Water for Human Consumption (Ministerial Diploma of 18/2004)
The CES Risk Assessment Methodology was adopted in the determining the potential environmental impacts on the water quality. Results and conclusions Potable water supply infrastructure in the project area and surrounding communities is lacking and the inhabitants are heavily dependent on the natural water resources for the supply of water for consumption and other domestic use. Most water is obtained either from wells or boreholes in the dry season, and from surface water sources in the wet season. The results show that for the most part, the water supply is saline and has a higher mineral content than is generally acceptable for drinking water in terms of the MICOA standards. The single surface water sample obtained was benchmarked against the ANZECC Guidelines for Fresh and Marine Water Quality. The water quality was consistent with the guidelines. The quality of sampled groundwater was compared against the Dutch Limit (2000), where all samples appear to be within specification, aside from elevated fluoride levels at some sites. In most cases the fluoride levels are, however, within the requirements for drinking water (as per MICOA), and is thus not of significance. It should be noted that the once off reading obtained in this report does not provide a confirmatory result for these parameters and as such further monitoring and investigation is warranted to confirm these readings and provide quality status of the surface and groundwater for the EcoFarm
Volume 3: ESIA Specialist Volume – Surface and Groundwater – September 2014
Coastal & Environmental Services (Pty) Ltd v EcoFarm Lda
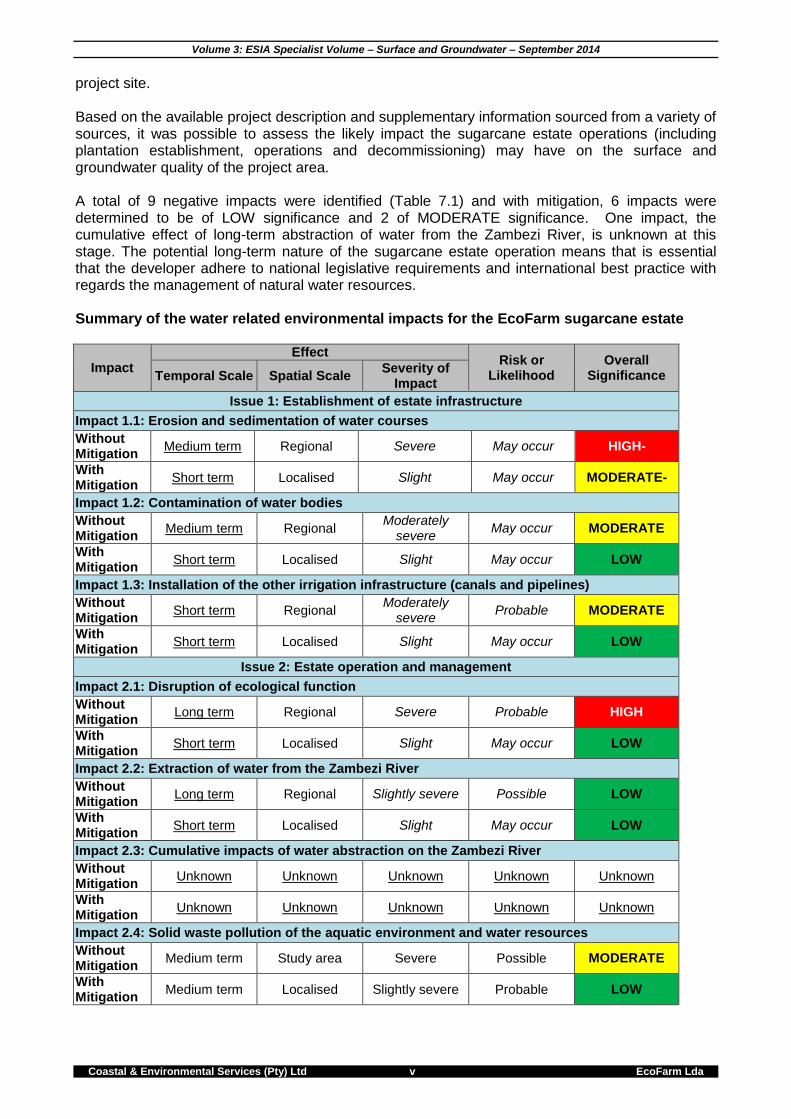
project site. Based on the available project description and supplementary information sourced from a variety of sources, it was possible to assess the likely impact the sugarcane estate operations (including plantation establishment, operations and decommissioning) may have on the surface and groundwater quality of the project area. A total of 9 negative impacts were identified (Table 7.1) and with mitigation, 6 impacts were determined to be of LOW significance and 2 of MODERATE significance. One impact, the cumulative effect of long-term abstraction of water from the Zambezi River, is unknown at this stage. The potential long-term nature of the sugarcane estate operation means that is essential that the developer adhere to national legislative requirements and international best practice with regards the management of natural water resources. Summary of the water related environmental impacts for the EcoFarm sugarcane estate
Impact
Effect Risk or
Likelihood Overall
Significance Temporal Scale Spatial Scale Severity of
Impact
Issue 1: Establishment of estate infrastructure
Impact 1.1: Erosion and sedimentation of water courses
Without Mitigation
Medium term Regional Severe May occur HIGH-
With Mitigation
Short term Localised Slight May occur MODERATE-
Impact 1.2: Contamination of water bodies
Without Mitigation
Medium term Regional Moderately
severe May occur MODERATE
With Mitigation
Short term Localised Slight May occur LOW
Impact 1.3: Installation of the other irrigation infrastructure (canals and pipelines)
Without Mitigation
Short term Regional Moderately
severe Probable MODERATE
With Mitigation
Short term Localised Slight May occur LOW
Issue 2: Estate operation and management
Impact 2.1: Disruption of ecological function
Without Mitigation
Long term Regional Severe Probable HIGH
With Mitigation
Short term Localised Slight May occur LOW
Impact 2.2: Extraction of water from the Zambezi River
Without Mitigation
Long term Regional Slightly severe Possible LOW
With Mitigation
Short term Localised Slight May occur LOW
Impact 2.3: Cumulative impacts of water abstraction on the Zambezi River
Without Mitigation
Unknown Unknown Unknown Unknown Unknown
With Mitigation
Unknown Unknown Unknown Unknown Unknown
Impact 2.4: Solid waste pollution of the aquatic environment and water resources
Without Mitigation
Medium term Study area Severe Possible MODERATE
With Mitigation
Medium term Localised Slightly severe Probable LOW
Volume 3: ESIA Specialist Volume – Surface and Groundwater – September 2014
Coastal & Environmental Services (Pty) Ltd vi EcoFarm Lda
Impact
Effect Risk or
Likelihood Overall
Significance Temporal Scale Spatial Scale Severity of
Impact
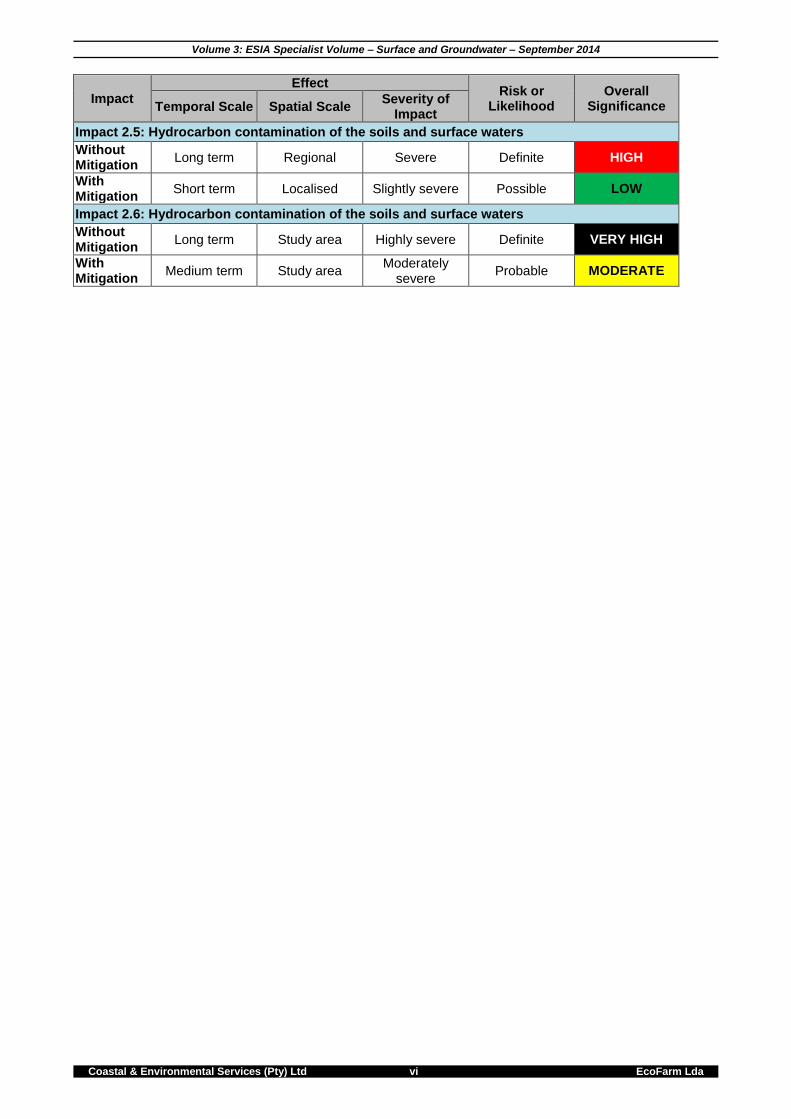
Impact 2.5: Hydrocarbon contamination of the soils and surface waters
Without Mitigation
Long term Regional Severe Definite HIGH
With Mitigation
Short term Localised Slightly severe Possible LOW
Impact 2.6: Hydrocarbon contamination of the soils and surface waters
Without Mitigation
Long term Study area Highly severe Definite VERY HIGH
With Mitigation
Medium term Study area Moderately
severe Probable MODERATE
Volume 3: ESIA Specialist Volume – Surface and Groundwater – September 2014
Coastal & Environmental Services vii EcoFarm Mozambique Lda
TABLE OF CONTENTS 1 INTRODUCTION ....................................................................................................................................... 1
1.1 Project background .......................................................................................................................... 1 1.2 Terms of reference ........................................................................................................................... 3 1.3 Assumptions and Limitations ........................................................................................................... 3
2 BIOPHYSICAL DESCRIPTION ................................................................................................................ 4 2.1 Introduction ....................................................................................................................................... 4 2.2 Biophysical Environment .................................................................................................................. 4
2.2.1 Climate ......................................................................................................................................... 4 2.2.2 Topography .................................................................................................................................. 5 2.2.3 Hydrology ..................................................................................................................................... 5 2.2.4 Current Land and Water Use ...................................................................................................... 8
3 METHODOLOGY .................................................................................................................................... 10 3.1 Introduction ..................................................................................................................................... 10
3.1.1 Preliminary desktop review ........................................................................................................ 10 3.1.2 Site Visit ..................................................................................................................................... 10 3.1.3 Surface and groundwater sampling ........................................................................................... 10 3.1.4 Laboratory analysis .................................................................................................................... 11 3.1.5 Data Analysis and Impact Assessment ..................................................................................... 12
4 LEGISLATION, POLICIES, STANDARDS AND GUIDELINES ............................................................. 14 4.1 Introduction ..................................................................................................................................... 14 4.2 Relevant International Guidelines and Conventions ...................................................................... 14
4.2.1 The International Finance Corporation Performance Standards and Guidance Notes (2012) . 14 4.3 Relevant National Legislation, Policies and Standards .................................................................. 15
4.3.1 The Constitution of Mozambique (1990) .................................................................................... 16 4.3.2 The Water Law (Law 16/91 of 1991) ......................................................................................... 16 4.3.3 National Water Policy (Decree 7/95) ......................................................................................... 17 4.3.4 Regulation on the Quality of Water for Human Consumption (Ministerial Diploma of18/2004) 17 4.3.5 Regulation for Quality Standards of the Environment and Emissions of Effluents .................... 17 4.3.6 National Surface and Groundwater Standards .......................................................................... 17 4.3.7 Other National Water-related Legislation ................................................................................... 18
5 RESULTS ................................................................................................................................................ 19 6 ASSESSMENT OF POTENTIAL ENVIRONMENTAL IMPACTS .......................................................... 24
6.1 Introduction ..................................................................................................................................... 24 6.2 Impacts associated with establishment of the Estate .................................................................... 24
6.2.1 Issue 1: Establishment of Estate infrastructure ......................................................................... 24 6.3 Impacts associated with estate operations .................................................................................... 28
6.3.1 Issue 2: Estate operations and management ............................................................................ 28 7 CONCLUSIONS ...................................................................................................................................... 35 8 REFERENCES ........................................................................................................................................ 37
Appendix A: Water Quality Standards ......................................................................................................... 38 Appendix B: Photograph Catalogue of Water Sampling Sites .................................................................... 40
LIST OF FIGURES
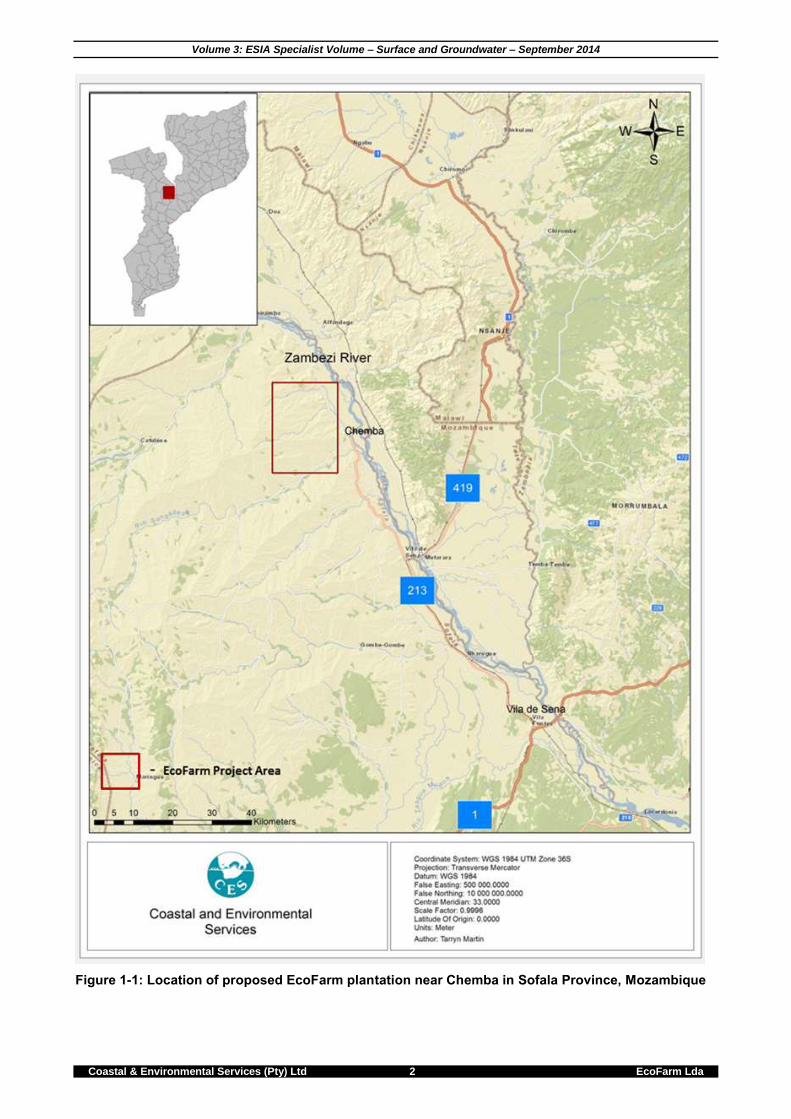
Figure 1-1: Location of proposed EcoFarm plantation near Chemba in Sofala Province, Mozambique ...... 2 Figure 2.1: Monthly average, minimum and maximum temperatures for the Chemba area for the period
2008. .............................................................................................................................................................. 4 Figure 2.2: Topography and elevation of the study area. .............................................................................. 5 Figure 2.3: Average daily flows at Muturara during wet, average and very dry years prior to the
construction of the Kariba Reservoir ............................................................................................................. 6 Figure 2.4: Average daily flow at Muturara after the construction of the Cahora Bassa Reservoir ............ 7 Figure 2.5: Average monthly flows in the Lower Zambezi River after the construction of the Cahora Bassa
Dam ............................................................................................................................................................... 7 Figure 3.1: Location of sampling sites in relation to the EcoFarm project area. ......................................... 11
Volume 3: ESIA Specialist Volume – Surface and Groundwater – September 2014
Coastal & Environmental Services (Pty) Ltd viii EcoFarm Lda
LIST OF TABLES
Table 2.1: Estimated mean monthly flows at Muturara between 1978 and 1999 ....................................... 8 Table 3.1: Water sampling sites including rivers and community boreholes .............................................. 10 Table 3.2: Chemical parameters ................................................................................................................. 11 Table 4.2: Potentially applicable water sector legislation ............................................................................ 15 Table 5.1: Sampled water quality compared with the Mozambican drinking water standard (Ministerial
Diploma of 18/2004) .................................................................................................................................... 20 Table 5.2: Sampled surface water quality as compared with the Australian and New Zealand Guidelines
for Fresh and Marine Water Quality (ANZECC 2000) ................................................................................. 22 Table 5.3: Sampled groundwater quality as compared against the Dutch List for groundwater ................. 23 Table 7.1: Summary of the water related environmental impacts for the EcoFarm sugarcane estate ....... 35
LIST OF PLATES
Plate B1: Chemba Water Tap – Z01 ........................................................................................................... 40 Plate B2: Chimuara Borehole – Z02 ............................................................................................................ 40 Plate B3: Calamo Well with hand pump – Z03 ............................................................................................ 41 Plate B4: Chivulivuli Well with hand pump – Z04 ........................................................................................ 41 Plate B5: Goba Borehole – Z05 .................................................................................................................. 42 Plate B6: Nhacalomo Well with hand pump – Z08 ...................................................................................... 42 Plate B7: Bairro 2 Water Tap – Z09 ............................................................................................................ 42 Plate B8: Galu Water Well – Z10................................................................................................................. 43 Plate B9: Macanga Borehole – Z11 ............................................................................................................ 43 Plate B10: Nhandula Well with hand pump – Z12 ....................................................................................... 43 Plate B11: Ntuanga tributary – Z13 ............................................................................................................. 44 Plate B12: Returning Youths Well with hand pump 1 – Z15 ....................................................................... 44 Plate B13: Returning Youths Well with hand pump 2 – Z16 ....................................................................... 44
Volume 3: ESIA Specialist Volume – Surface and Groundwater – September 2014
Coastal & Environmental Services 1 EcoFarm Mozambique Lda
1 INTRODUCTION
1.1 Project background This project involves the establishment, installation, operation and maintenance of an irrigation infrastructure development in the District of Chemba, Sofala Province, Mozambique. The project will be funded through a grant contract between the Governments of the Netherlands and Mozambique, represented by the Agency NL and the Zambezi Valley Development Agency. The project will be established on the western outskirts of the town of Chemba, approximately 50kms north of Vila da Sena on the western side of the Zambezi River in the extreme north of Sofala Province of Mozambique (Figure 1-1). Chemba is one of the poorest districts in Mozambique with a harsh hot and dry climate, with low and unpredictable rainfall. The livelihoods of the families are based on dry land subsistence farming, mainly maize and sorghum but with some beans, with very low yields resulting in malnutrition and food security becoming serious concerns in the region. The project therefore centres on an irrigation infrastructure development, which will enable the local communities to improve their income potential through better agricultural production, which will go some way to reducing malnutrition and food security concerns. The irrigation system is designed to be used to irrigate between 2 000 and 3 000 hectares of organic sugarcane as well as up to 100 hectares of vegetables and food crops. The developer, EcoFarm Mozambique Lda (EcoFarm) also intends to erect a sugar factory that will ultimately be capable of processing 2 000 tonnes of sugar cane per day (TCD) to produce raw (brown) and “plantation white” sugar. The factory will also be equipped with two medium-pressure, high-temperature boilers that will drive generators to power the factory and external electrically-drive irrigation equipment. The factory will be situated on the northern border of EcoFarm 1 DUAT.
Volume 3: ESIA Specialist Volume – Surface and Groundwater – September 2014
Coastal & Environmental Services (Pty) Ltd 2 EcoFarm Lda
Figure 1-1: Location of proposed EcoFarm plantation near Chemba in Sofala Province, Mozambique
Volume 3: ESIA Specialist Volume – Surface and Groundwater – September 2014
Coastal & Environmental Services (Pty) Ltd 3 EcoFarm Lda
1.2 Terms of reference Specialists will be required to address issues raised by I&APs in their reports. In addition, the specific terms of reference for this specialist study will be:
Provide a basic characterisation of the surface water resources, including seasonal variations, based on existing available information.
Determine whether or not there will be significant net loss of water from the system due to the development, and comment on the implications.
Identify significant impacts that may result, either directly from the use of water, or indirectly through the abstraction of water resources in the sub-region.
Comment on the risks to surface water resources at the site.
Determine possible impacts associated with pumping water from the Zambezi, as well as from the physical structures.
Determine whether there will be any cumulative impact on the rivers running through or adjacent to the site.
Provide practical design recommendations where possible.
Assess and rate the environmental significance of identified impacts using the methodology prescribed by CES.
Provide feasible recommendations of the mitigation of impacts on surface water resources and the hydrology and fluvial morphology of the river.
Provide recommendations with respect to parameters to be included in the establishment of a comprehensive water quality baseline for the site.
1.3 Assumptions and Limitations Much of the information regarding the proposed development and data relating to water use on which this report was based was provided by the Client. Whilst every effort was made to verify the information, it was assumed that it was correct and valid. This specialist report was subject to the following additional assumptions and limitations:
All project-specific information was based on information supplied by The Client and was assumed to be accurate.
This report provides a snapshot baseline quality assessment and does not account for the seasonal variations that may occur. It should be noted that a single sample at each site does not provide sufficient data for an accurate, high confidence assessment of the quality of the surface and groundwater quality.
Due to the remoteness of the sampling sites and duration of the overall sampling period it was not possible to preserve the samples on ice prior to laboratory analysis. As a result, only heavy metal analysis, which requires acid digestion of samples to determine the total metal content, was carried out. The results presented in this report do not include hydrocarbon and biological assays of the water samples.
Sediment samples were not collected for analysis.
Volume 3: ESIA Specialist Volume – Surface and Groundwater – September 2014
Coastal & Environmental Services 4 EcoFarm Mozambique Lda
2 BIOPHYSICAL DESCRIPTION
2.1 Introduction In order to assess the likely significance of impacts on the surface and groundwater resources in the project area from the proposed development and to make recommendations regarding the management of the water resources, it was necessary to review the biophysical context of the project.
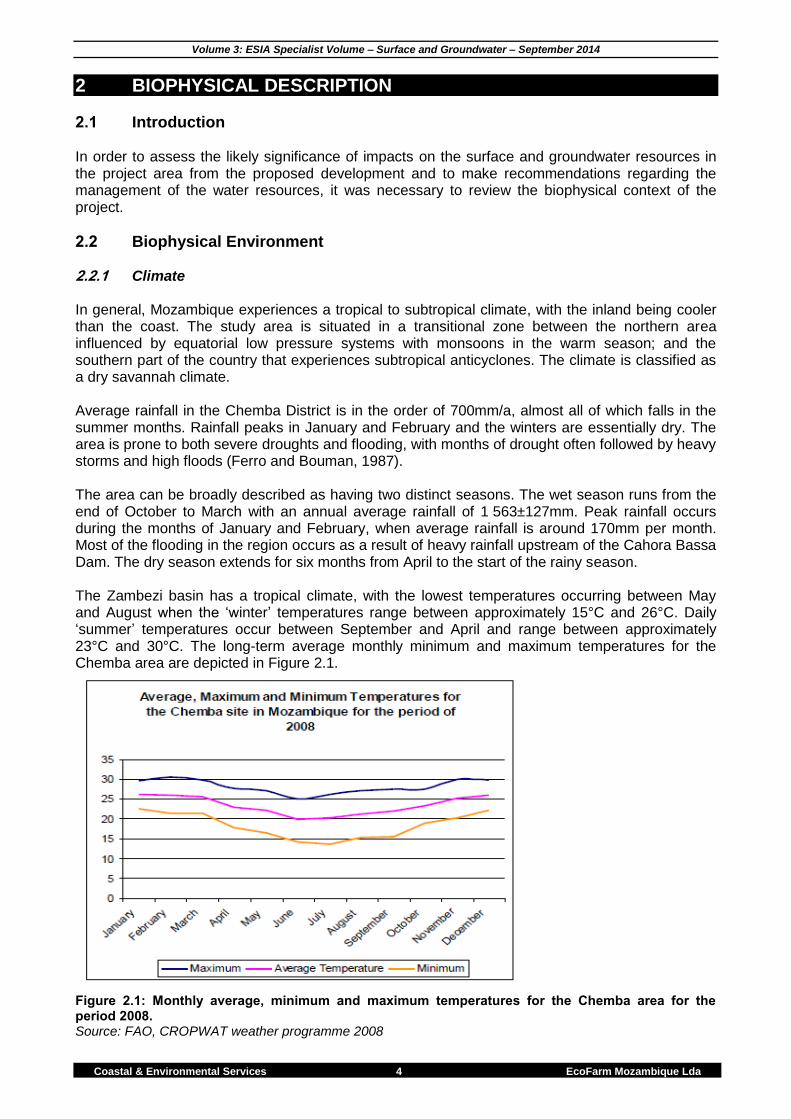
2.2 Biophysical Environment 2.2.1 Climate In general, Mozambique experiences a tropical to subtropical climate, with the inland being cooler than the coast. The study area is situated in a transitional zone between the northern area influenced by equatorial low pressure systems with monsoons in the warm season; and the southern part of the country that experiences subtropical anticyclones. The climate is classified as a dry savannah climate. Average rainfall in the Chemba District is in the order of 700mm/a, almost all of which falls in the summer months. Rainfall peaks in January and February and the winters are essentially dry. The area is prone to both severe droughts and flooding, with months of drought often followed by heavy storms and high floods (Ferro and Bouman, 1987). The area can be broadly described as having two distinct seasons. The wet season runs from the end of October to March with an annual average rainfall of 1 563±127mm. Peak rainfall occurs during the months of January and February, when average rainfall is around 170mm per month. Most of the flooding in the region occurs as a result of heavy rainfall upstream of the Cahora Bassa Dam. The dry season extends for six months from April to the start of the rainy season. The Zambezi basin has a tropical climate, with the lowest temperatures occurring between May and August when the ‘winter’ temperatures range between approximately 15°C and 26°C. Daily ‘summer’ temperatures occur between September and April and range between approximately 23°C and 30°C. The long-term average monthly minimum and maximum temperatures for the Chemba area are depicted in Figure 2.1.
Figure 2.1: Monthly average, minimum and maximum temperatures for the Chemba area for the period 2008. Source: FAO, CROPWAT weather programme 2008
Volume 3: ESIA Specialist Volume – Surface and Groundwater – September 2014
Coastal & Environmental Services (Pty) Ltd 5 EcoFarm Lda
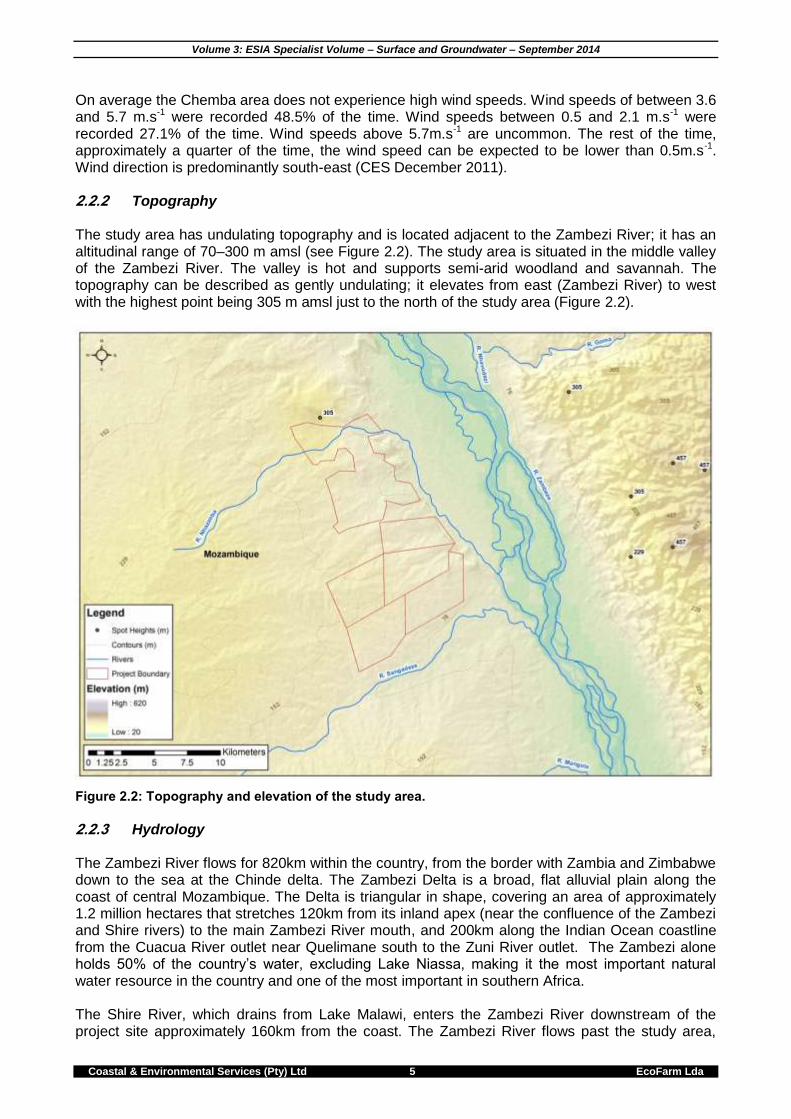
On average the Chemba area does not experience high wind speeds. Wind speeds of between 3.6 and 5.7 m.s-1 were recorded 48.5% of the time. Wind speeds between 0.5 and 2.1 m.s-1 were recorded 27.1% of the time. Wind speeds above 5.7m.s-1 are uncommon. The rest of the time, approximately a quarter of the time, the wind speed can be expected to be lower than 0.5m.s-1. Wind direction is predominantly south-east (CES December 2011). 2.2.2 Topography The study area has undulating topography and is located adjacent to the Zambezi River; it has an altitudinal range of 70–300 m amsl (see Figure 2.2). The study area is situated in the middle valley of the Zambezi River. The valley is hot and supports semi-arid woodland and savannah. The topography can be described as gently undulating; it elevates from east (Zambezi River) to west with the highest point being 305 m amsl just to the north of the study area (Figure 2.2).
Figure 2.2: Topography and elevation of the study area.
2.2.3 Hydrology The Zambezi River flows for 820km within the country, from the border with Zambia and Zimbabwe down to the sea at the Chinde delta. The Zambezi Delta is a broad, flat alluvial plain along the coast of central Mozambique. The Delta is triangular in shape, covering an area of approximately 1.2 million hectares that stretches 120km from its inland apex (near the confluence of the Zambezi and Shire rivers) to the main Zambezi River mouth, and 200km along the Indian Ocean coastline from the Cuacua River outlet near Quelimane south to the Zuni River outlet. The Zambezi alone holds 50% of the country’s water, excluding Lake Niassa, making it the most important natural water resource in the country and one of the most important in southern Africa. The Shire River, which drains from Lake Malawi, enters the Zambezi River downstream of the project site approximately 160km from the coast. The Zambezi River flows past the study area,
Volume 3: ESIA Specialist Volume – Surface and Groundwater – September 2014
Coastal & Environmental Services (Pty) Ltd 6 EcoFarm Lda
which is approximately 4km away. In addition, the Nhazimba River, a tributary to the Zambezi, flows through the northern section of the study area. The Sangadeze River flows to the south of the study area, and is also a tributary to the Zambezi River (see Figure 2.2).
A Description of the Hydrological Flow Regime of the Lower Zambezi River
Excerpted from CES’s Hydrology and Surface Water Assessment for Grown Energy Zambezi (Richardson, 2010)
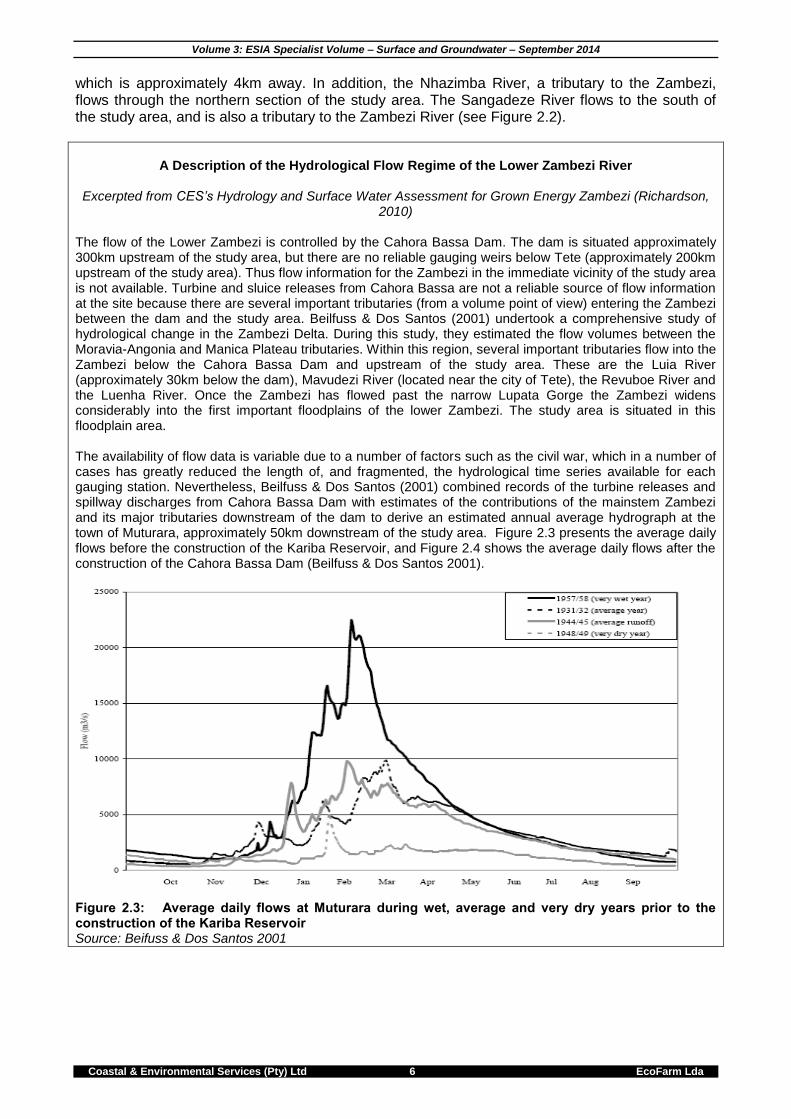
The flow of the Lower Zambezi is controlled by the Cahora Bassa Dam. The dam is situated approximately 300km upstream of the study area, but there are no reliable gauging weirs below Tete (approximately 200km upstream of the study area). Thus flow information for the Zambezi in the immediate vicinity of the study area is not available. Turbine and sluice releases from Cahora Bassa are not a reliable source of flow information at the site because there are several important tributaries (from a volume point of view) entering the Zambezi between the dam and the study area. Beilfuss & Dos Santos (2001) undertook a comprehensive study of hydrological change in the Zambezi Delta. During this study, they estimated the flow volumes between the Moravia-Angonia and Manica Plateau tributaries. Within this region, several important tributaries flow into the Zambezi below the Cahora Bassa Dam and upstream of the study area. These are the Luia River (approximately 30km below the dam), Mavudezi River (located near the city of Tete), the Revuboe River and the Luenha River. Once the Zambezi has flowed past the narrow Lupata Gorge the Zambezi widens considerably into the first important floodplains of the lower Zambezi. The study area is situated in this floodplain area. The availability of flow data is variable due to a number of factors such as the civil war, which in a number of cases has greatly reduced the length of, and fragmented, the hydrological time series available for each gauging station. Nevertheless, Beilfuss & Dos Santos (2001) combined records of the turbine releases and spillway discharges from Cahora Bassa Dam with estimates of the contributions of the mainstem Zambezi and its major tributaries downstream of the dam to derive an estimated annual average hydrograph at the town of Muturara, approximately 50km downstream of the study area. Figure 2.3 presents the average daily flows before the construction of the Kariba Reservoir, and Figure 2.4 shows the average daily flows after the construction of the Cahora Bassa Dam (Beilfuss & Dos Santos 2001).
Figure 2.3: Average daily flows at Muturara during wet, average and very dry years prior to the construction of the Kariba Reservoir Source: Beifuss & Dos Santos 2001
Volume 3: ESIA Specialist Volume – Surface and Groundwater – September 2014
Coastal & Environmental Services (Pty) Ltd 7 EcoFarm Lda
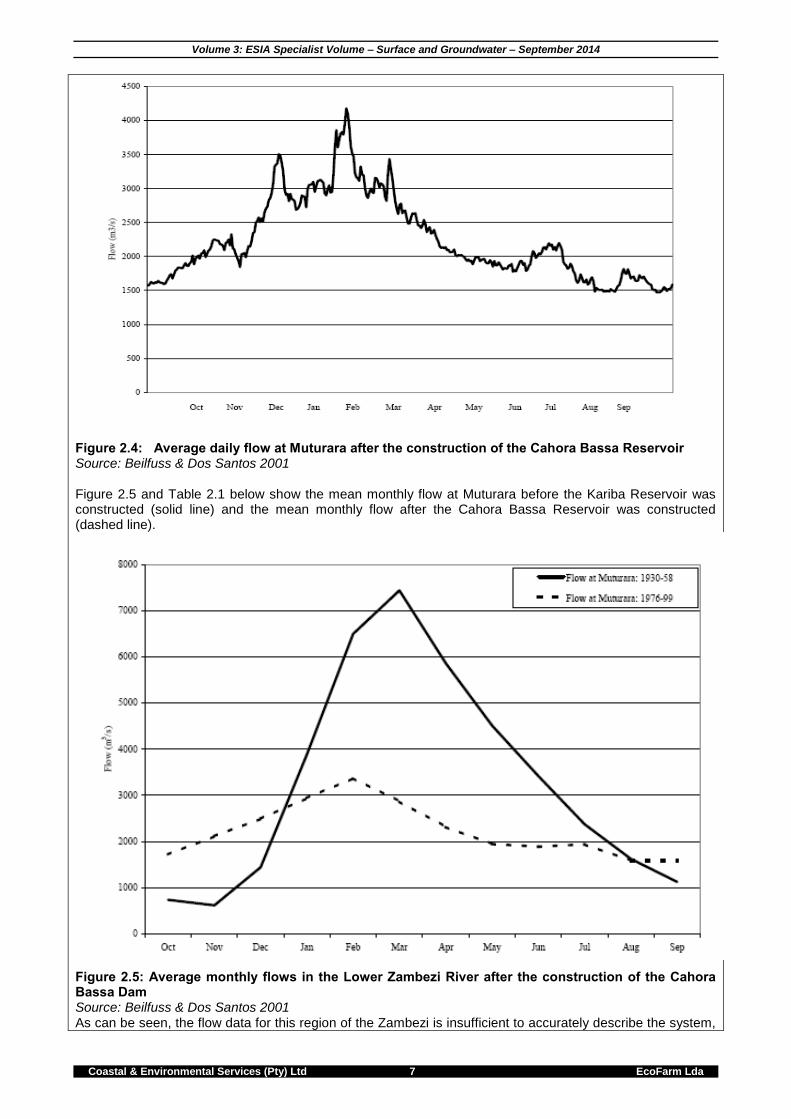
Figure 2.4: Average daily flow at Muturara after the construction of the Cahora Bassa Reservoir Source: Beilfuss & Dos Santos 2001 Figure 2.5 and Table 2.1 below show the mean monthly flow at Muturara before the Kariba Reservoir was constructed (solid line) and the mean monthly flow after the Cahora Bassa Reservoir was constructed (dashed line).
Figure 2.5: Average monthly flows in the Lower Zambezi River after the construction of the Cahora Bassa Dam Source: Beilfuss & Dos Santos 2001 As can be seen, the flow data for this region of the Zambezi is insufficient to accurately describe the system,
Volume 3: ESIA Specialist Volume – Surface and Groundwater – September 2014
Coastal & Environmental Services (Pty) Ltd 8 EcoFarm Lda
and any inferences made from this data must be applied in accordance with the precautionary principle. It is nonetheless the only data currently available that allows for a limited description of the average flows in the river, and therefore of the availability of water in the Zambezi River.
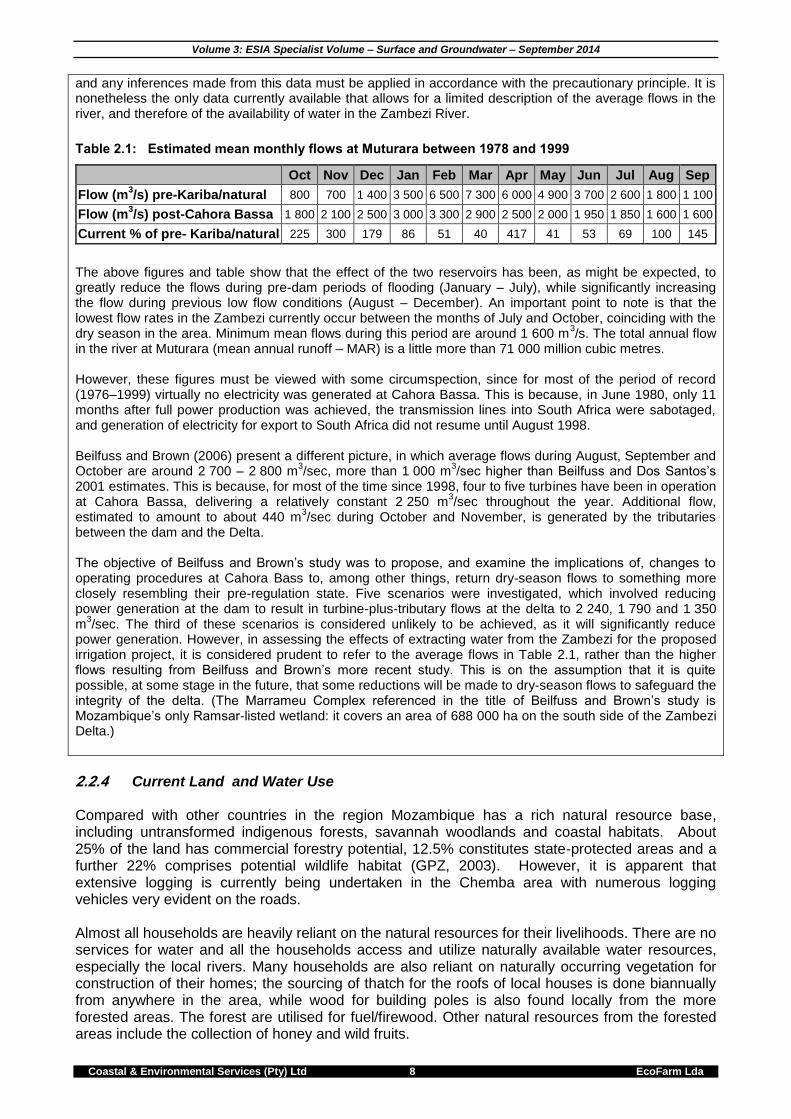
Table 2.1: Estimated mean monthly flows at Muturara between 1978 and 1999
Oct Nov Dec Jan Feb Mar Apr May Jun Jul Aug Sep
Flow (m3/s) pre-Kariba/natural 800 700 1 400 3 500 6 500 7 300 6 000 4 900 3 700 2 600 1 800 1 100
Flow (m3/s) post-Cahora Bassa 1 800 2 100 2 500 3 000 3 300 2 900 2 500 2 000 1 950 1 850 1 600 1 600
Current % of pre- Kariba/natural 225 300 179 86 51 40 417 41 53 69 100 145
The above figures and table show that the effect of the two reservoirs has been, as might be expected, to greatly reduce the flows during pre-dam periods of flooding (January – July), while significantly increasing the flow during previous low flow conditions (August – December). An important point to note is that the lowest flow rates in the Zambezi currently occur between the months of July and October, coinciding with the dry season in the area. Minimum mean flows during this period are around 1 600 m
3/s. The total annual flow
in the river at Muturara (mean annual runoff – MAR) is a little more than 71 000 million cubic metres. However, these figures must be viewed with some circumspection, since for most of the period of record (1976–1999) virtually no electricity was generated at Cahora Bassa. This is because, in June 1980, only 11 months after full power production was achieved, the transmission lines into South Africa were sabotaged, and generation of electricity for export to South Africa did not resume until August 1998. Beilfuss and Brown (2006) present a different picture, in which average flows during August, September and October are around 2 700 – 2 800 m
3/sec, more than 1 000 m
3/sec higher than Beilfuss and Dos Santos’s
2001 estimates. This is because, for most of the time since 1998, four to five turbines have been in operation at Cahora Bassa, delivering a relatively constant 2 250 m
3/sec throughout the year. Additional flow,
estimated to amount to about 440 m3/sec during October and November, is generated by the tributaries
between the dam and the Delta. The objective of Beilfuss and Brown’s study was to propose, and examine the implications of, changes to operating procedures at Cahora Bass to, among other things, return dry-season flows to something more closely resembling their pre-regulation state. Five scenarios were investigated, which involved reducing power generation at the dam to result in turbine-plus-tributary flows at the delta to 2 240, 1 790 and 1 350 m
3/sec. The third of these scenarios is considered unlikely to be achieved, as it will significantly reduce
power generation. However, in assessing the effects of extracting water from the Zambezi for the proposed irrigation project, it is considered prudent to refer to the average flows in Table 2.1, rather than the higher flows resulting from Beilfuss and Brown’s more recent study. This is on the assumption that it is quite possible, at some stage in the future, that some reductions will be made to dry-season flows to safeguard the integrity of the delta. (The Marrameu Complex referenced in the title of Beilfuss and Brown’s study is Mozambique’s only Ramsar-listed wetland: it covers an area of 688 000 ha on the south side of the Zambezi Delta.)
2.2.4 Current Land and Water Use Compared with other countries in the region Mozambique has a rich natural resource base, including untransformed indigenous forests, savannah woodlands and coastal habitats. About 25% of the land has commercial forestry potential, 12.5% constitutes state-protected areas and a further 22% comprises potential wildlife habitat (GPZ, 2003). However, it is apparent that extensive logging is currently being undertaken in the Chemba area with numerous logging vehicles very evident on the roads. Almost all households are heavily reliant on the natural resources for their livelihoods. There are no services for water and all the households access and utilize naturally available water resources, especially the local rivers. Many households are also reliant on naturally occurring vegetation for construction of their homes; the sourcing of thatch for the roofs of local houses is done biannually from anywhere in the area, while wood for building poles is also found locally from the more forested areas. The forest are utilised for fuel/firewood. Other natural resources from the forested areas include the collection of honey and wild fruits.
Volume 3: ESIA Specialist Volume – Surface and Groundwater – September 2014
Coastal & Environmental Services (Pty) Ltd 9 EcoFarm Lda
In 2008 the estimated total annual abstraction of water from surface and groundwater resources in the Zambezi Delta, for the domestic needs of both the rural and urban populations, and for agricultural use by smallholder and commercial producers, was between 28 and 28.5 million cubic metres, depending on whether the year could be characterised as a drought, normal or flood year (Guveya and Sukume, 2008). The SENA Sugar Estates, near the town of Marromeu, about 50km downstream from the head of the delta, accounted for about 95% of the total extraction in the Delta. The extent of the estimated extraction in the Delta area indicates that the total water requirements downstream of the proposed EcoFarm development are a small proportion of the total available water in the Zambezi. Fishing in the Zambezi River and other seasonal rivers is an important subsistence and economic activity for households living close to the river banks. Fishing in the study area is reported to be an important economic activity (Socio-economic specialist study). Fishing is practised most during the months of January and February, when the Zambezi is flowing at its peak. Fish are dried and sold to local markets in Sena and Chemba. There is also a small fishery that develops on the Sangadeze River during the wet season. The main target species of this fishery are Tilapia (Tilapia rendalli, Tilapia niloticus, and others), Clarias (Clarias gariepinus), eels (Anguilla spp), Synodontids (Synodontis zambezensis), electric catfish (Malapterurus electricus), mudsuckers (Labeo spp) and tiger fish (Hydrocynus vittatus) (see Fauna specialist study). Agriculture in the area is limited to small arable plots (machambas) usually located near to houses, where the predominant crops grown food subsistence food and limited export are maize, mapira and Njugo bean (Feijao joco). Livestock comprises mainly goats, chickens and pigs with only a small number of households that have relatively sizeable bovine herds. These animals are escorted to suitable grazing sites in the area. In addition to the use of the river for irrigation by commercial operations in the area it is also used by local communities as a source of potable water, as well as for washing clothes and bathing. As indicated above, fishing is also common. Although informal ferries operate near the project area, many local residents make use of the pedestrian bridge at Sena to cross the river.
Volume 3: ESIA Specialist Volume – Surface and Groundwater – September 2014
Coastal & Environmental Services 10 EcoFarm Mozambique Lda
3 METHODOLOGY
3.1 Introduction The surface and groundwater assessment was conducted using the following steps:
Preliminary desktop review;
Site visit and sample collection;
Data analysis; and
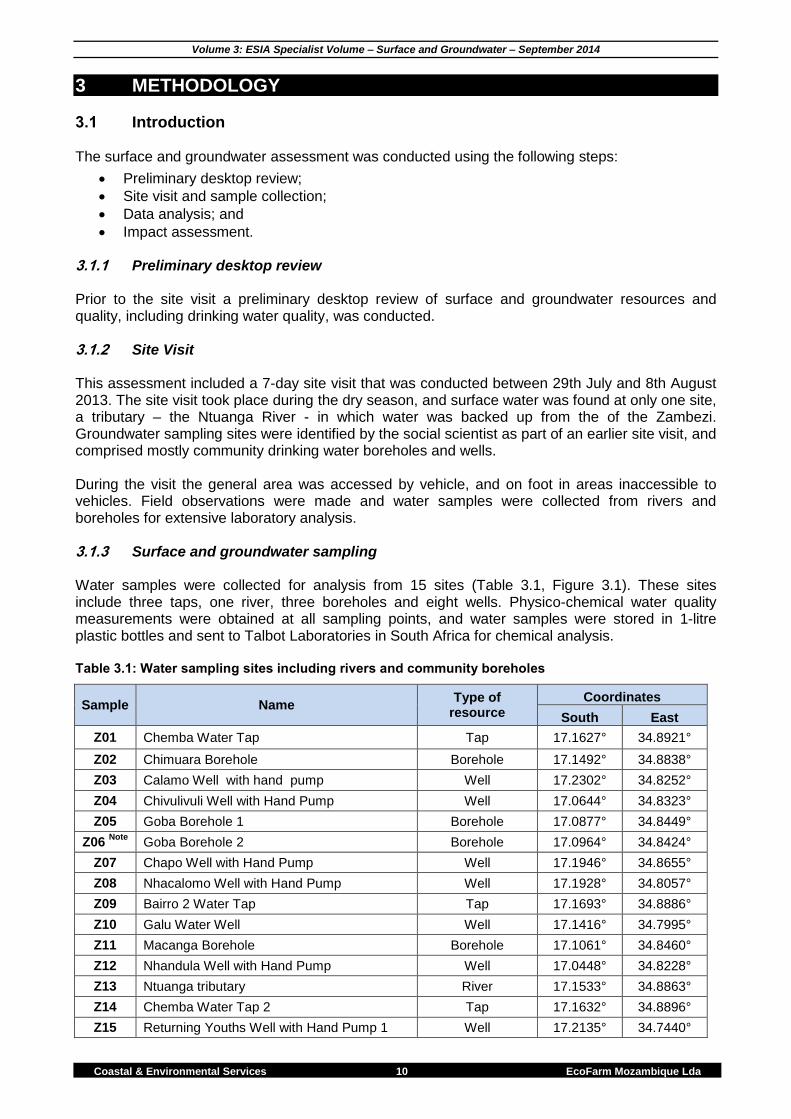
Impact assessment. 3.1.1 Preliminary desktop review Prior to the site visit a preliminary desktop review of surface and groundwater resources and quality, including drinking water quality, was conducted. 3.1.2 Site Visit This assessment included a 7-day site visit that was conducted between 29th July and 8th August 2013. The site visit took place during the dry season, and surface water was found at only one site, a tributary – the Ntuanga River - in which water was backed up from the of the Zambezi. Groundwater sampling sites were identified by the social scientist as part of an earlier site visit, and comprised mostly community drinking water boreholes and wells. During the visit the general area was accessed by vehicle, and on foot in areas inaccessible to vehicles. Field observations were made and water samples were collected from rivers and boreholes for extensive laboratory analysis. 3.1.3 Surface and groundwater sampling Water samples were collected for analysis from 15 sites (Table 3.1, Figure 3.1). These sites include three taps, one river, three boreholes and eight wells. Physico-chemical water quality measurements were obtained at all sampling points, and water samples were stored in 1-litre plastic bottles and sent to Talbot Laboratories in South Africa for chemical analysis. Table 3.1: Water sampling sites including rivers and community boreholes
Sample Name Type of
resource Coordinates
South East
Z01 Chemba Water Tap Tap 17.1627° 34.8921°
Z02 Chimuara Borehole Borehole 17.1492° 34.8838°
Z03 Calamo Well with hand pump Well 17.2302° 34.8252°
Z04 Chivulivuli Well with Hand Pump Well 17.0644° 34.8323°
Z05 Goba Borehole 1 Borehole 17.0877° 34.8449°
Z06 Note
Goba Borehole 2 Borehole 17.0964° 34.8424°
Z07 Chapo Well with Hand Pump Well 17.1946° 34.8655°
Z08 Nhacalomo Well with Hand Pump Well 17.1928° 34.8057°
Z09 Bairro 2 Water Tap Tap 17.1693° 34.8886°
Z10 Galu Water Well Well 17.1416° 34.7995°
Z11 Macanga Borehole Borehole 17.1061° 34.8460°
Z12 Nhandula Well with Hand Pump Well 17.0448° 34.8228°
Z13 Ntuanga tributary River 17.1533° 34.8863°
Z14 Chemba Water Tap 2 Tap 17.1632° 34.8896°
Z15 Returning Youths Well with Hand Pump 1 Well 17.2135° 34.7440°
Volume 3: ESIA Specialist Volume – Surface and Groundwater – September 2014
Coastal & Environmental Services (Pty) Ltd 11 EcoFarm Lda
Sample Name Type of
resource
Coordinates
South East
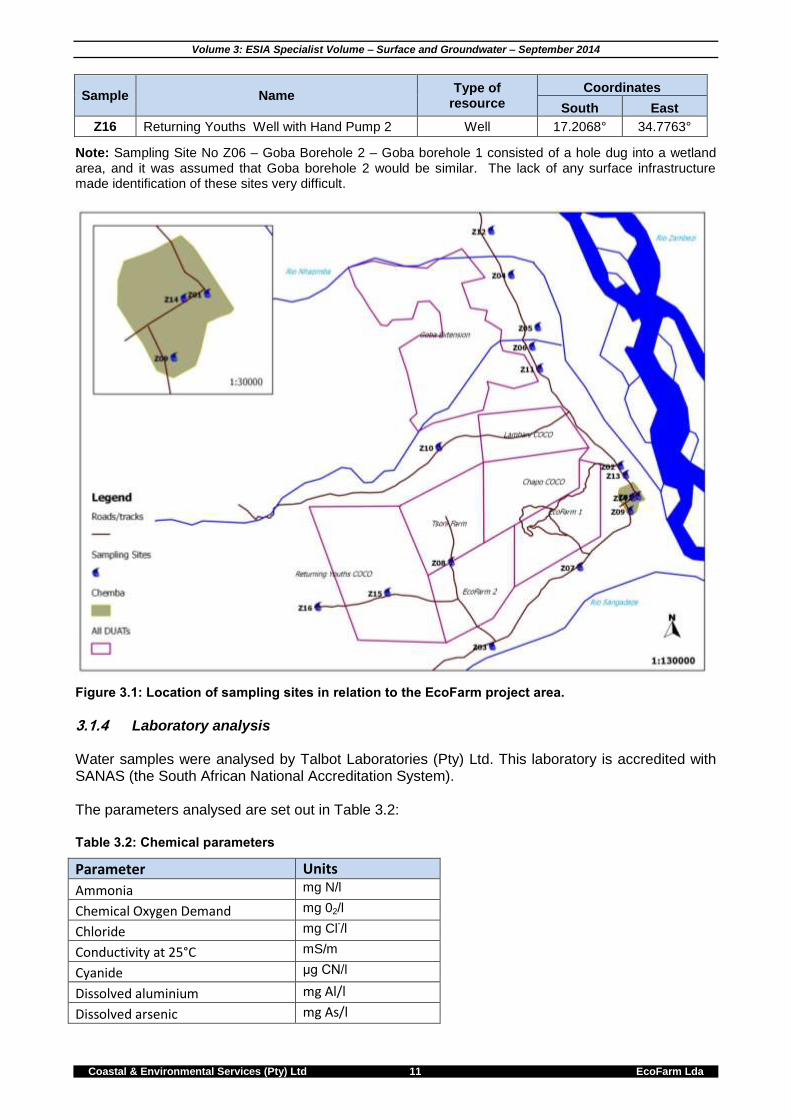
Z16 Returning Youths Well with Hand Pump 2 Well 17.2068° 34.7763°
Note: Sampling Site No Z06 – Goba Borehole 2 – Goba borehole 1 consisted of a hole dug into a wetland area, and it was assumed that Goba borehole 2 would be similar. The lack of any surface infrastructure made identification of these sites very difficult.
Figure 3.1: Location of sampling sites in relation to the EcoFarm project area.
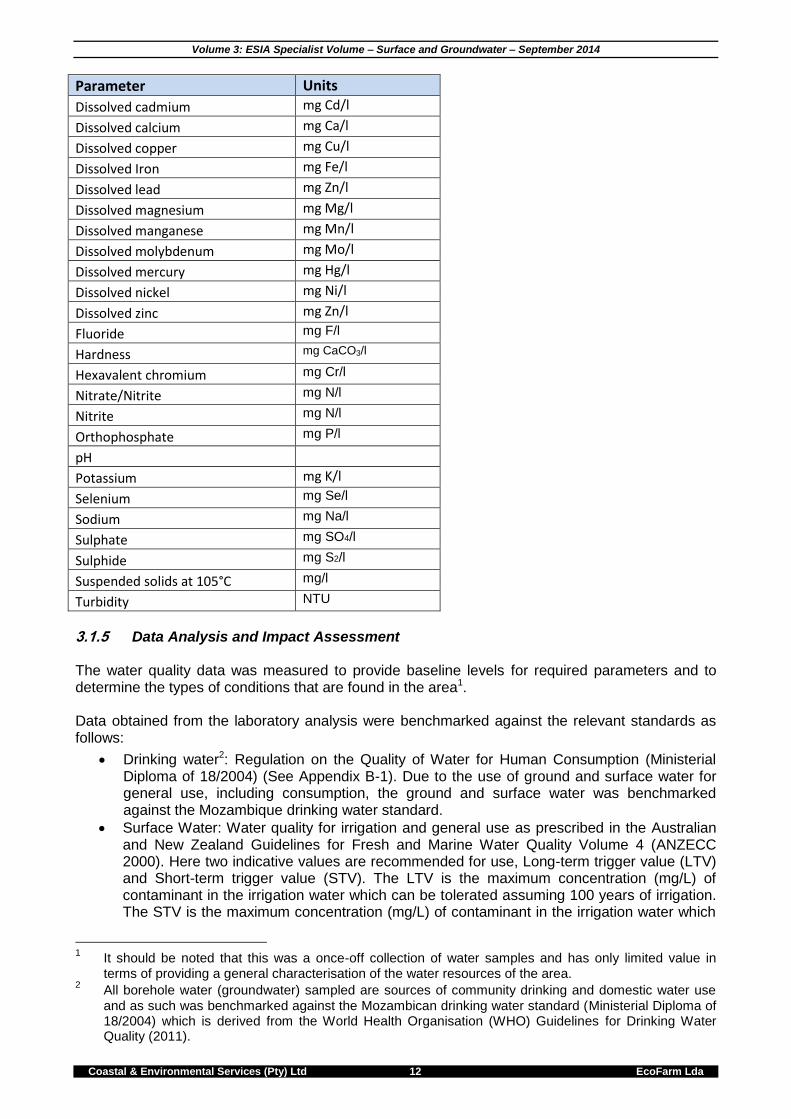
3.1.4 Laboratory analysis Water samples were analysed by Talbot Laboratories (Pty) Ltd. This laboratory is accredited with SANAS (the South African National Accreditation System). The parameters analysed are set out in Table 3.2: Table 3.2: Chemical parameters
Parameter Units
Ammonia mg N/l
Chemical Oxygen Demand mg 02/l
Chloride mg Cl-/l
Conductivity at 25°C mS/m
Cyanide μg CN/l
Dissolved aluminium mg Al/l
Dissolved arsenic mg As/l
Volume 3: ESIA Specialist Volume – Surface and Groundwater – September 2014
Coastal & Environmental Services (Pty) Ltd 12 EcoFarm Lda
Parameter Units
Dissolved cadmium mg Cd/l
Dissolved calcium mg Ca/l
Dissolved copper mg Cu/l
Dissolved Iron mg Fe/l
Dissolved lead mg Zn/l
Dissolved magnesium mg Mg/l
Dissolved manganese mg Mn/l
Dissolved molybdenum mg Mo/l
Dissolved mercury mg Hg/l
Dissolved nickel mg Ni/l
Dissolved zinc mg Zn/l
Fluoride mg F/l
Hardness mg CaCO3/l
Hexavalent chromium mg Cr/l
Nitrate/Nitrite mg N/l
Nitrite mg N/l
Orthophosphate mg P/l
pH
Potassium mg K/l
Selenium mg Se/l
Sodium mg Na/l
Sulphate mg SO4/l
Sulphide mg S2/l
Suspended solids at 105°C mg/l
Turbidity NTU
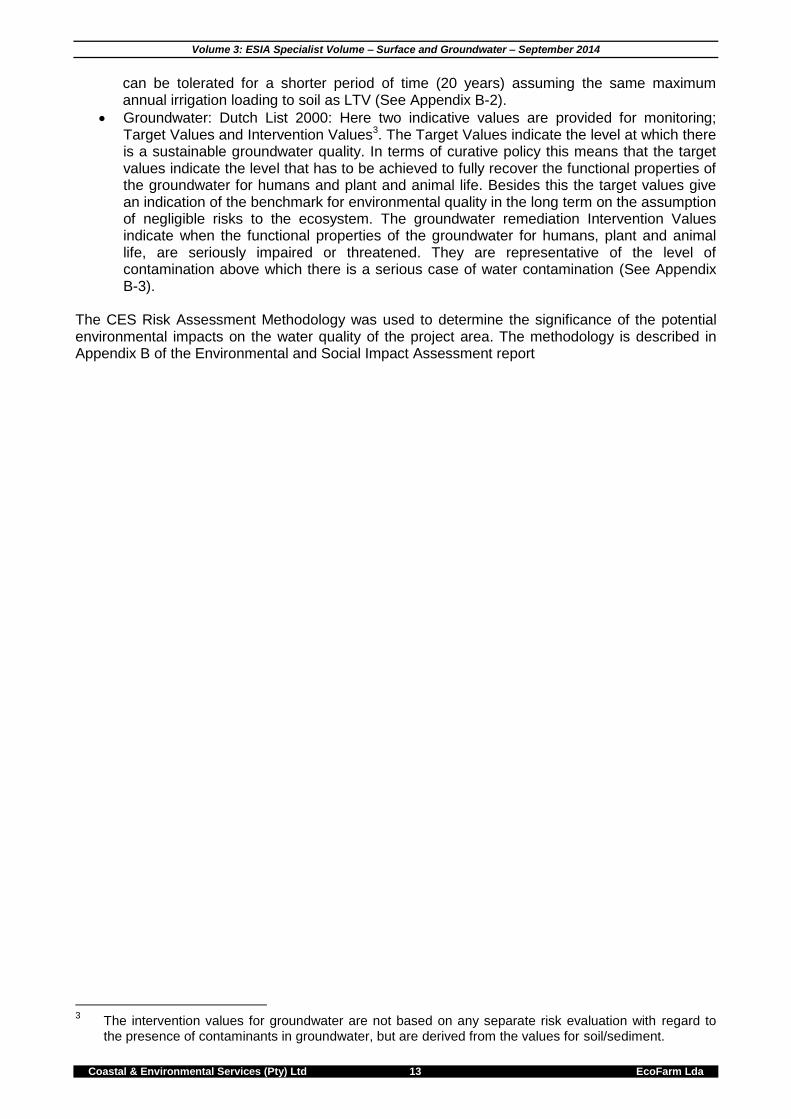
3.1.5 Data Analysis and Impact Assessment The water quality data was measured to provide baseline levels for required parameters and to determine the types of conditions that are found in the area1. Data obtained from the laboratory analysis were benchmarked against the relevant standards as follows:
Drinking water2: Regulation on the Quality of Water for Human Consumption (Ministerial Diploma of 18/2004) (See Appendix B-1). Due to the use of ground and surface water for general use, including consumption, the ground and surface water was benchmarked against the Mozambique drinking water standard.
Surface Water: Water quality for irrigation and general use as prescribed in the Australian and New Zealand Guidelines for Fresh and Marine Water Quality Volume 4 (ANZECC 2000). Here two indicative values are recommended for use, Long-term trigger value (LTV) and Short-term trigger value (STV). The LTV is the maximum concentration (mg/L) of contaminant in the irrigation water which can be tolerated assuming 100 years of irrigation. The STV is the maximum concentration (mg/L) of contaminant in the irrigation water which
1 It should be noted that this was a once-off collection of water samples and has only limited value in
terms of providing a general characterisation of the water resources of the area. 2 All borehole water (groundwater) sampled are sources of community drinking and domestic water use
and as such was benchmarked against the Mozambican drinking water standard (Ministerial Diploma of 18/2004) which is derived from the World Health Organisation (WHO) Guidelines for Drinking Water Quality (2011).
Volume 3: ESIA Specialist Volume – Surface and Groundwater – September 2014
Coastal & Environmental Services (Pty) Ltd 13 EcoFarm Lda
can be tolerated for a shorter period of time (20 years) assuming the same maximum annual irrigation loading to soil as LTV (See Appendix B-2).
Groundwater: Dutch List 2000: Here two indicative values are provided for monitoring; Target Values and Intervention Values3. The Target Values indicate the level at which there is a sustainable groundwater quality. In terms of curative policy this means that the target values indicate the level that has to be achieved to fully recover the functional properties of the groundwater for humans and plant and animal life. Besides this the target values give an indication of the benchmark for environmental quality in the long term on the assumption of negligible risks to the ecosystem. The groundwater remediation Intervention Values indicate when the functional properties of the groundwater for humans, plant and animal life, are seriously impaired or threatened. They are representative of the level of contamination above which there is a serious case of water contamination (See Appendix B-3).
The CES Risk Assessment Methodology was used to determine the significance of the potential environmental impacts on the water quality of the project area. The methodology is described in Appendix B of the Environmental and Social Impact Assessment report
3 The intervention values for groundwater are not based on any separate risk evaluation with regard to
the presence of contaminants in groundwater, but are derived from the values for soil/sediment.
Volume 3: ESIA Specialist Volume – Surface and Groundwater – September 2014
Coastal & Environmental Services 14 EcoFarm Mozambique Lda
4 LEGISLATION, POLICIES, STANDARDS AND GUIDELINES
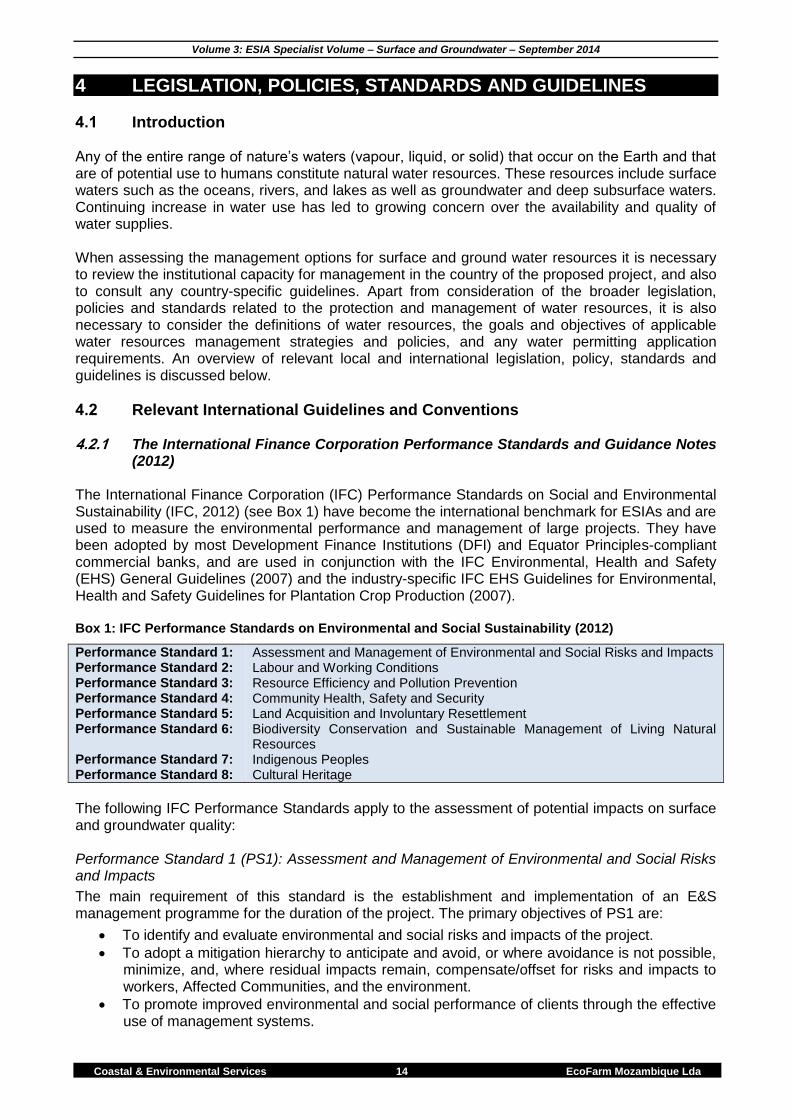
4.1 Introduction Any of the entire range of nature’s waters (vapour, liquid, or solid) that occur on the Earth and that are of potential use to humans constitute natural water resources. These resources include surface waters such as the oceans, rivers, and lakes as well as groundwater and deep subsurface waters. Continuing increase in water use has led to growing concern over the availability and quality of water supplies. When assessing the management options for surface and ground water resources it is necessary to review the institutional capacity for management in the country of the proposed project, and also to consult any country-specific guidelines. Apart from consideration of the broader legislation, policies and standards related to the protection and management of water resources, it is also necessary to consider the definitions of water resources, the goals and objectives of applicable water resources management strategies and policies, and any water permitting application requirements. An overview of relevant local and international legislation, policy, standards and guidelines is discussed below.
4.2 Relevant International Guidelines and Conventions 4.2.1 The International Finance Corporation Performance Standards and Guidance Notes
(2012) The International Finance Corporation (IFC) Performance Standards on Social and Environmental Sustainability (IFC, 2012) (see Box 1) have become the international benchmark for ESIAs and are used to measure the environmental performance and management of large projects. They have been adopted by most Development Finance Institutions (DFI) and Equator Principles-compliant commercial banks, and are used in conjunction with the IFC Environmental, Health and Safety (EHS) General Guidelines (2007) and the industry-specific IFC EHS Guidelines for Environmental, Health and Safety Guidelines for Plantation Crop Production (2007). Box 1: IFC Performance Standards on Environmental and Social Sustainability (2012)
Performance Standard 1: Performance Standard 2: Performance Standard 3: Performance Standard 4: Performance Standard 5: Performance Standard 6: Performance Standard 7: Performance Standard 8:
Assessment and Management of Environmental and Social Risks and Impacts Labour and Working Conditions Resource Efficiency and Pollution Prevention Community Health, Safety and Security Land Acquisition and Involuntary Resettlement Biodiversity Conservation and Sustainable Management of Living Natural Resources Indigenous Peoples Cultural Heritage
The following IFC Performance Standards apply to the assessment of potential impacts on surface and groundwater quality: Performance Standard 1 (PS1): Assessment and Management of Environmental and Social Risks and Impacts
The main requirement of this standard is the establishment and implementation of an E&S management programme for the duration of the project. The primary objectives of PS1 are:
To identify and evaluate environmental and social risks and impacts of the project.
To adopt a mitigation hierarchy to anticipate and avoid, or where avoidance is not possible, minimize, and, where residual impacts remain, compensate/offset for risks and impacts to workers, Affected Communities, and the environment.
To promote improved environmental and social performance of clients through the effective use of management systems.
Volume 3: ESIA Specialist Volume – Surface and Groundwater – September 2014
Coastal & Environmental Services (Pty) Ltd 15 EcoFarm Lda
Performance Standard 3 (PS3): Resource Efficiency and Pollution Prevention
The primary requirement of PS3 is that technologies and practices that avoid or minimise detrimental impacts of pollution are applied throughout the lifecycle of the project. The primary objectives of PS3 are:
To avoid or minimize adverse impacts on human health and the environment by avoiding or minimizing pollution from project activities.
To promote more sustainable use of resources, including energy and water. Performance Standard 4 (PS4): Community Health, Safety and Security
The major requirement in terms of PS4 is that all risks and impacts to the surrounding community are assessed and managed appropriately including the management of hazardous material storage and handling, hazards associated with the natural environment (such as floods and landslides), community exposure to disease, and emergency preparedness and response. The primary objectives of PS4 are:
To anticipate and avoid adverse impacts on the health and safety of the Affected Community during the project life from both routine and non-routine circumstances.
To ensure that the safeguarding of personnel and property is carried out in accordance with relevant human rights principles and in a manner that avoids or minimizes risks to the Affected Communities.
Performance Standard 6 (PS6): Biodiversity Conservation and Sustainable Management of Living Natural Resources
In order to conform to PS6 it is necessary to consider ecosystem goods and services afforded by the natural environment in the project area, and the assessment has to include an investigation into provisioning services, regulating services and cultural services. The primary objectives of PS 6 are:
To protect and conserve biodiversity.
To maintain the benefits from ecosystem services.
To promote the sustainable management of living natural resources through the adoption of practices that integrates conservation needs and development priorities.
A biodiversity monitoring plan is necessary at a later stage to demonstrate how the project will monitor the plant and animal biodiversity in the study area to ensure it is properly managed and conserved within designated ecological corridors. Biological offsets should be considered as a primary means to mitigate negative impacts on the biological environment.
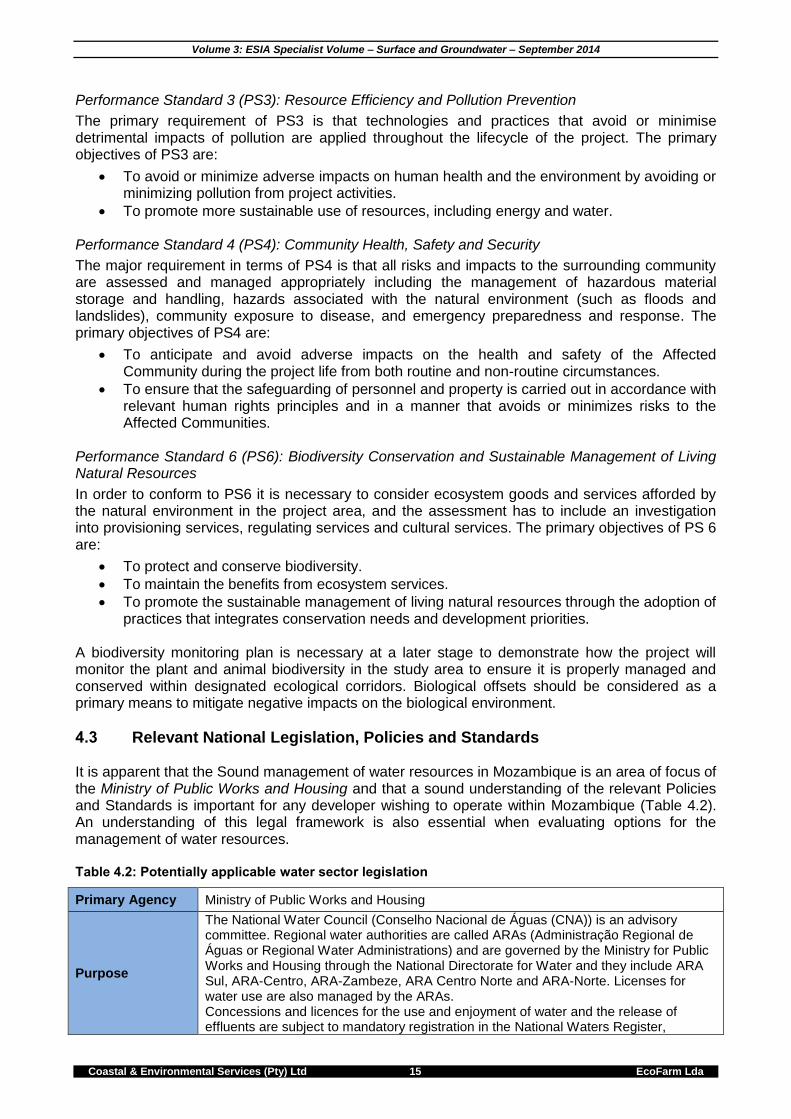
4.3 Relevant National Legislation, Policies and Standards It is apparent that the Sound management of water resources in Mozambique is an area of focus of the Ministry of Public Works and Housing and that a sound understanding of the relevant Policies and Standards is important for any developer wishing to operate within Mozambique (Table 4.2). An understanding of this legal framework is also essential when evaluating options for the management of water resources. Table 4.2: Potentially applicable water sector legislation
Primary Agency Ministry of Public Works and Housing
Purpose
The National Water Council (Conselho Nacional de Águas (CNA)) is an advisory committee. Regional water authorities are called ARAs (Administração Regional de Águas or Regional Water Administrations) and are governed by the Ministry for Public Works and Housing through the National Directorate for Water and they include ARA Sul, ARA-Centro, ARA-Zambeze, ARA Centro Norte and ARA-Norte. Licenses for water use are also managed by the ARAs. Concessions and licences for the use and enjoyment of water and the release of effluents are subject to mandatory registration in the National Waters Register,
Volume 3: ESIA Specialist Volume – Surface and Groundwater – September 2014
Coastal & Environmental Services (Pty) Ltd 16 EcoFarm Lda
implemented by ARA-Sul. Current water policy and law focus on water for domestic, livelihood and industrial uses.
Relevant Documents
The Constitution of Mozambique (1990)
Water Law (Law 16/91)
National Water Policy, 1995, amended in October 2007
Southern African Development Community (SADC) Protocol on Shared Watercourses.
National Water Resource Management Strategy, 2007
4.3.1 The Constitution of Mozambique (1990) The Constitution of Mozambique (as amended in 2004) is the supreme overarching law of the land and any act or conduct inconsistent with it is invalid and will have no force of law. It defines the right of all citizens to live in a balanced natural environment and their obligation to protect it. The Constitution addresses matters relating to the environmental protection and quality of life for all in Articles 45, 81, 90, 98, 102 and 117. Article 90, which is part of Chapter V (Economic, social and cultural rights and duties) of Title III (Fundamental rights, duties and liberties), gives the people of Mozambique the right to live in a balanced environment free of contamination. Furthermore, the State is required to promote initiatives that ensure ecological balance and preservation of the environment; and implement policies to prevent and control pollution and integrate environmental objectives in all public sector policies to guarantee citizens the right to live in a balanced environment under a sustainable development framework (Article 117 of the Constitution). 4.3.2 The Water Law (Law 16/91 of 1991) The Water Law of Mozambique is based on a river basin approach to water management (FAO 2005). The Water Law provides the basis for reforms within the water sector and outlines the institutional structure and the principles and policies for water management in Mozambique (DFID 1999; SADC 2003). The Water Law is designed to create a participatory and decentralised system of water management within Mozambique and its uses are classified as common use and private use. Common use is free and exempt from licensing and aims to meet domestic and personal water needs, including small scale farming (DFID 1999). Private use is given by concession or through the law. Licensing is required for various activities including (i) prospecting, capture and use of groundwater in a protected area; (ii) installation of reservoirs, planting of crops or felling of trees on the beds or shores of a water source; and (iii) removal of sand or clay on the banks or shores of a water source. Water use licences are valid for five years and are renewable. However, the licence is revoked if a water concession is requested in the same area. Licences, being temporary and revocable cannot form the basis for opposition to a concession request. In any situation not covered above, a concession is required. Concessions are also given by the ARA, are valid for 50 years, are renewable, and their application must be based on economic and technical reasons. Article 18 of the Water Law gives jurisdiction over water management to Regional Water Authorities (Administração Regional de Águas – ARA), which were established on the basis of river basins (DFID 1999). The ARAs maintain financial and organisational autonomy, but report to the National Water Directorate. Five regional ARAs exist (DFID 1999) as follows:
ARA Sul (South), covering the south border of the country to the basin of the Save river
ARA Centro (Central), which includes the basin of the Save river to the basin of the Zambezi river
ARA Zambezi that consists of the basin of the Zambezi river
ARA Centro Norte (Central North) covering the region from the basin of the Zambezi river to Lúrio river
ARA Norte (North), which consists of the basin of the Lúrio river to the northern border
Volume 3: ESIA Specialist Volume – Surface and Groundwater – September 2014
Coastal & Environmental Services (Pty) Ltd 17 EcoFarm Lda
The ARAs are responsible for collecting hydrological information, controlling irrigation systems, and collecting water fees. 4.3.3 National Water Policy (Decree 7/95) The National Water Policy was approved in August 8, 1995, through Resolution 7/95. It outlines specific strategies for the main areas of urban and peri-urban water supply, rural water supply, sanitation and integrated water resource management (SADC 2003). The National Water Policy aims to decentralise water resources management to autonomous entities at the basin and provincial levels. According to the policy the Government defines priorities, guidelines and minimum service delivery levels, but does not deliver services (DFID 1999). Integrated water management is promoted in the policy as a means to optimise the benefits to communities, whilst also considering environmental impacts and the sustainability of resources over time. 4.3.4 Regulation on the Quality of Water for Human Consumption (Ministerial Diploma
of18/2004) This regulation establishes the parameters of quality of the water destined for human consumption and the terms of realisation of its control, aiming at protecting human health from harmful effects resulting from any contamination that may occur in the different stages of the water supply system from its capture to the consumer. The Regulation establishes the competent authority, at central level, the Department of Environmental Health and the National Laboratory of Water and Foodstuffs Hygiene, at provincial level, the Centres for Environmental Hygiene and Medical Examinations and the Provincial Laboratories for Water, while at the local level, the Health Centres. The Regulation applies to, inter alia, fresh underground water destined for direct consumption or for production of water for human consumption and establishes compulsory parameters that must be measured in the water destined for human consumption in its Annex I(see Appendix B-1). It also establishes the regimen, modalities, frequency, parameters and characteristics of control in its Annex II. In addition, the supply of drinking water may be subject to the observance of the rules set out in articles 56 and 57 of the Water Law 16/19, for ensuring the quality of water. 4.3.5 Regulation for Quality Standards of the Environment and Emissions of Effluents This regulation prohibits “the deposit in the soil, outside the boundaries legally established, of harmful substances that may determine or contribute for its degradation” and establishes the quality standards of the environment (air, water, soil, noise). Annex III – Standards of Emission of Liquid Effluents by Industries, Annex IV – Standards of Emission of Domestic Liquid Effluents, Annex V – Standards for Receptor Body (Sea/Ocean) and Annex VI - Manual for Classification, Quantification, Interpretation of Laboratory Analysis of Soil and Water. 4.3.6 National Surface and Groundwater Standards The Mozambican Government, via the Ministry of Coordination of Environmental Affairs (MICOA), has not published water quality guidelines for surface and groundwater. In the absence of locally-derived criteria from MICOA it is therefore necessary to consult authoritative sources from other jurisdictions. The Australian and New Zealand Guidelines for Fresh and Marine Water Quality Volume 4 (ANZECC 2000) and Dutch Target and Intervention Values (Dutch List 2000) have been adopted for the surface and groundwater standards, respectively (Appendix B-2 & 3).
Volume 3: ESIA Specialist Volume – Surface and Groundwater – September 2014
Coastal & Environmental Services (Pty) Ltd 18 EcoFarm Lda
4.3.7 Other National Water-related Legislation In addition to the above, other relevant National Water Legislation includes:
Decree 25/91, of November 14, 1991, that determines the entry into force of the National Water Council (CNA – Conselho Nacional de Águas);
Decree 8/96, of April 2, that alters the composition of the CNA;
Decree 72/98, of December 23, 1998, that establishes the Framework for Delegated Management;
Decree 73/98, of December 23,1998, that establishes the Investment and Assets Fund for Water Supply (FIPAG - Fundo de Investimento e Património do Abastecimento de Água);
Decree 74/98, of December 23, 1998, that establishes the Regulatory Council for Water Supply (CRA - Conselho de Regulação de Abastecimento de Água);
Ministerial Diploma 134/93, of November 17, 1993, that approved the Statutes of South Regional Water Management Authority (ARA Sul - Administração Regionalde ÁguasSul); and
Ministerial Diploma 163/96, of December 25, 1996, that approved the bylaw of ARA – Sul.
Volume 3: ESIA Specialist Volume – Surface and Groundwater – September 2014
Coastal & Environmental Services 19 EcoFarm Mozambique Lda
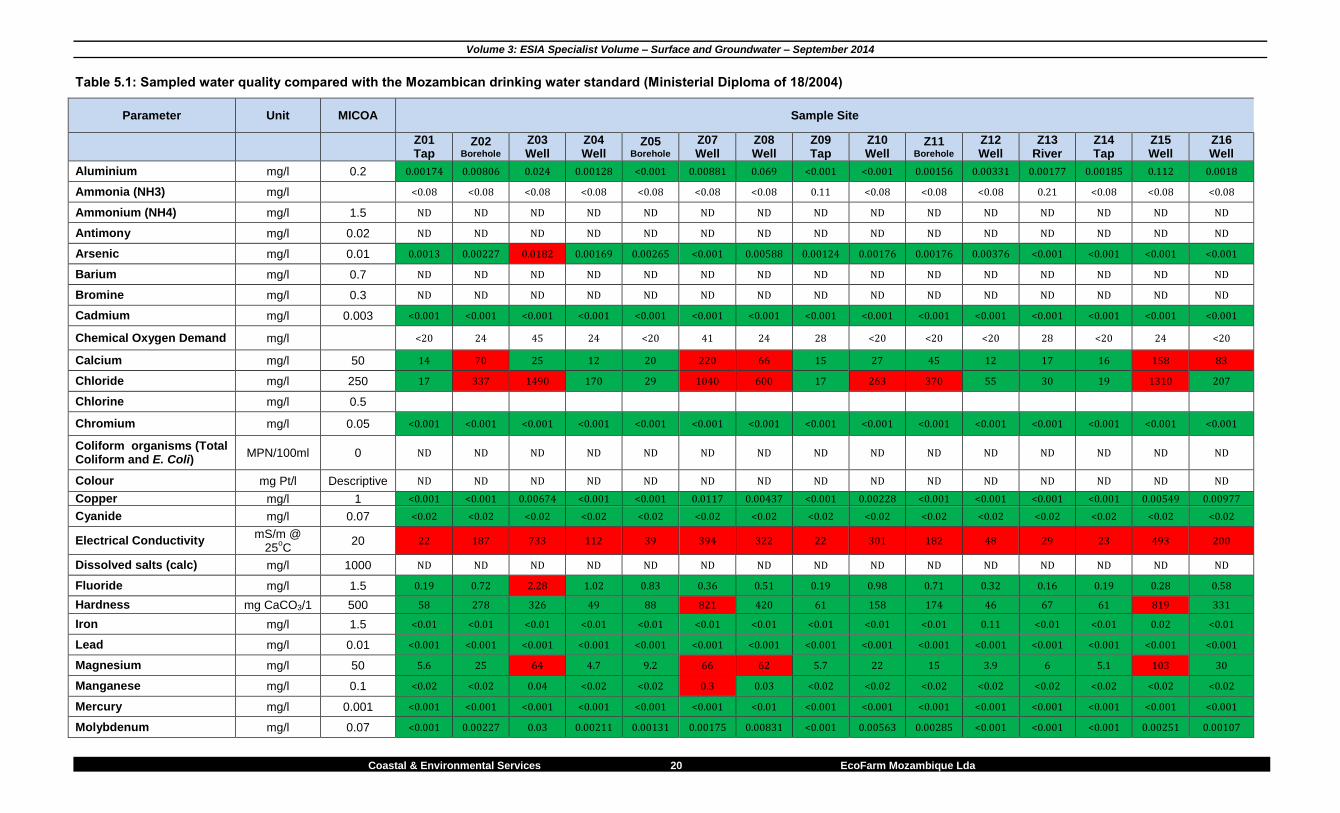
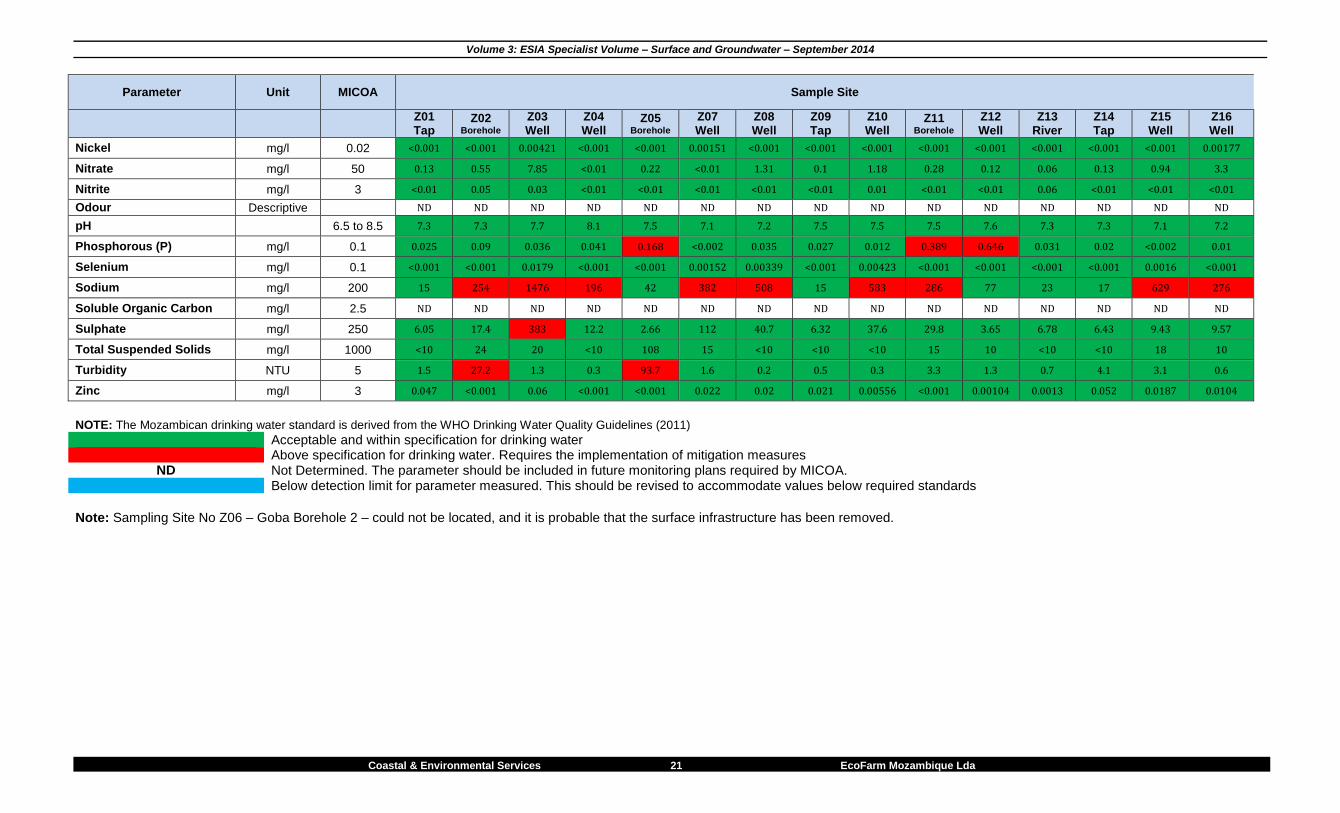
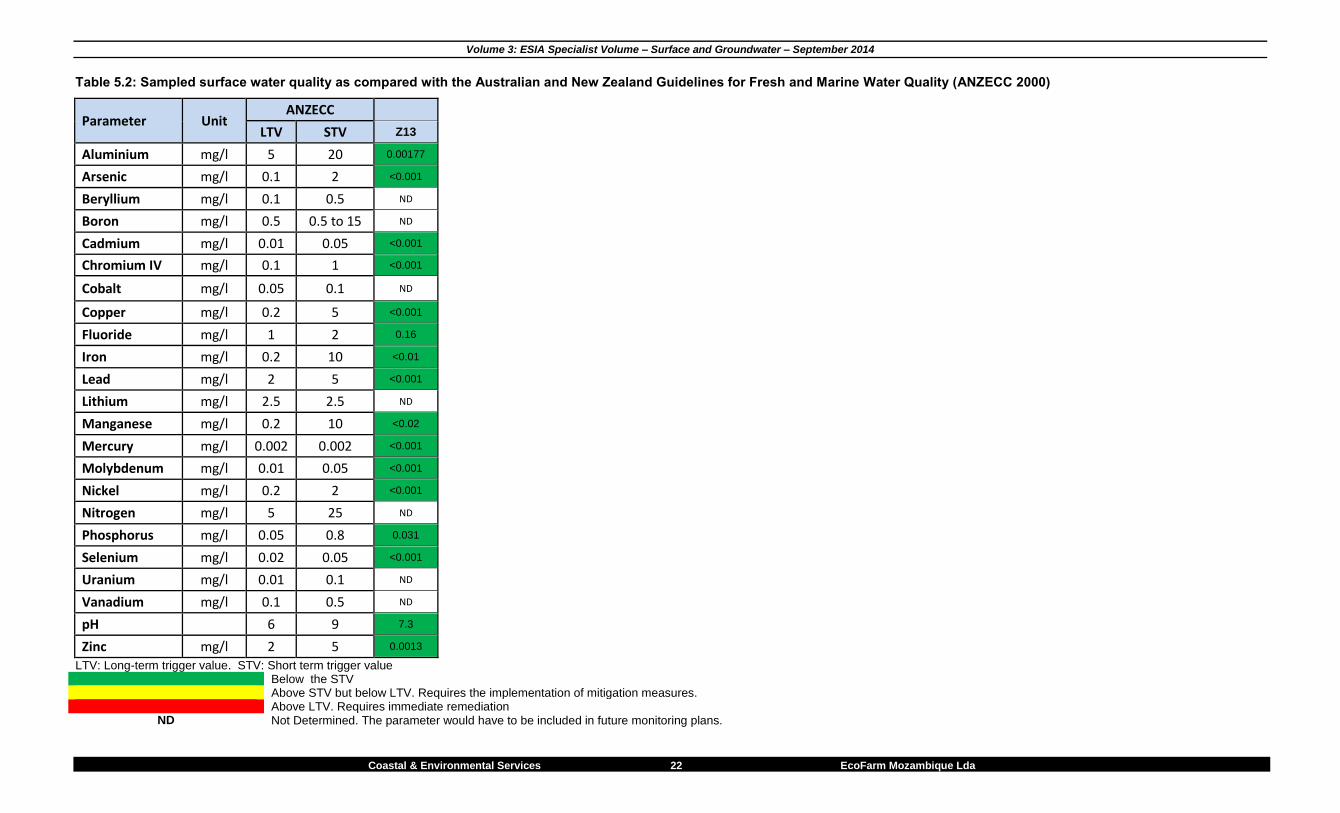
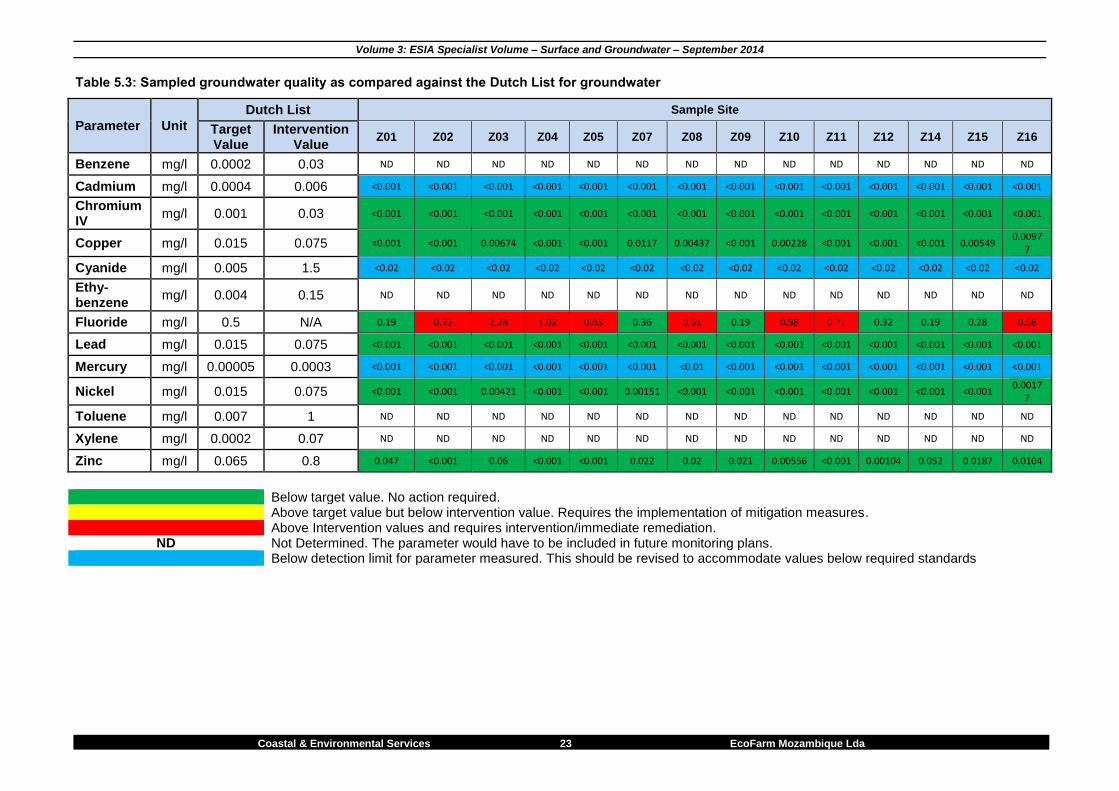
5 RESULTS Potable water supply infrastructure in the project area and surrounding communities is lacking and the inhabitants are heavily dependent on the natural water resources for the supply of water for consumption and other domestic use. Most water is obtained either from wells or boreholes in the dry season, and from surface water sources in the wet season. Table 5.1 benchmarks the quality of the water sampled in the project area against the Mozambican drinking water standards. The results show that, for the most part, the water supply is saline and has a higher mineral content than is generally acceptable for drinking water in terms of the MICOA standards. The single surface water sample obtained – Sample Site Z13 in the Ntuanga tributary - was benchmarked against the ANZECC Guidelines for Fresh and Marine Water Quality (Table 5.2). The water quality was consistent with the guidelines. Table 5.3 presents the quality of sampled groundwater against the Dutch Limit (2000), where all samples appear to be within specification, aside from elevated fluoride levels at some sites. In most cases the fluoride levels are within the requirements for drinking water (as per MICOA), and is thus not of significance. As noted above, the once off reading obtained in this report does not provide a confirmatory result for these parameters and as such further monitoring and investigation is warranted to confirm these readings and provide quality status of the surface and groundwater for the EcoFarm project site.
Volume 3: ESIA Specialist Volume – Surface and Groundwater – September 2014
Coastal & Environmental Services 20 EcoFarm Mozambique Lda
Table 5.1: Sampled water quality compared with the Mozambican drinking water standard (Ministerial Diploma of 18/2004)
Parameter Unit MICOA Sample Site
Z01 Tap
Z02 Borehole
Z03 Well
Z04 Well
Z05 Borehole
Z07 Well
Z08 Well
Z09 Tap
Z10 Well
Z11 Borehole
Z12 Well
Z13 River
Z14 Tap
Z15 Well
Z16 Well
Aluminium mg/l 0.2 0.00174 0.00806 0.024 0.00128 <0.001 0.00881 0.069 <0.001 <0.001 0.00156 0.00331 0.00177 0.00185 0.112 0.0018
Ammonia (NH3) mg/l <0.08 <0.08 <0.08 <0.08 <0.08 <0.08 <0.08 0.11 <0.08 <0.08 <0.08 0.21 <0.08 <0.08 <0.08
Ammonium (NH4) mg/l 1.5 ND ND ND ND ND ND ND ND ND ND ND ND ND ND ND
Antimony mg/l 0.02 ND ND ND ND ND ND ND ND ND ND ND ND ND ND ND
Arsenic mg/l 0.01 0.0013 0.00227 0.0182 0.00169 0.00265 <0.001 0.00588 0.00124 0.00176 0.00176 0.00376 <0.001 <0.001 <0.001 <0.001
Barium mg/l 0.7 ND ND ND ND ND ND ND ND ND ND ND ND ND ND ND
Bromine mg/l 0.3 ND ND ND ND ND ND ND ND ND ND ND ND ND ND ND
Cadmium mg/l 0.003 <0.001 <0.001 <0.001 <0.001 <0.001 <0.001 <0.001 <0.001 <0.001 <0.001 <0.001 <0.001 <0.001 <0.001 <0.001
Chemical Oxygen Demand mg/l <20 24 45 24 <20 41 24 28 <20 <20 <20 28 <20 24 <20
Calcium mg/l 50 14 70 25 12 20 220 66 15 27 45 12 17 16 158 83
Chloride mg/l 250 17 337 1490 170 29 1040 600 17 263 370 55 30 19 1310 207
Chlorine mg/l 0.5
Chromium mg/l 0.05 <0.001 <0.001 <0.001 <0.001 <0.001 <0.001 <0.001 <0.001 <0.001 <0.001 <0.001 <0.001 <0.001 <0.001 <0.001
Coliform organisms (Total Coliform and E. Coli)
MPN/100ml 0 ND ND ND ND ND ND ND ND ND ND ND ND ND ND ND
Colour mg Pt/l Descriptive ND ND ND ND ND ND ND ND ND ND ND ND ND ND ND
Copper mg/l 1 <0.001 <0.001 0.00674 <0.001 <0.001 0.0117 0.00437 <0.001 0.00228 <0.001 <0.001 <0.001 <0.001 0.00549 0.00977
Cyanide mg/l 0.07 <0.02 <0.02 <0.02 <0.02 <0.02 <0.02 <0.02 <0.02 <0.02 <0.02 <0.02 <0.02 <0.02 <0.02 <0.02
Electrical Conductivity mS/m @
25oC
20 22 187 733 112 39 394 322 22 301 182 48 29 23 493 200
Dissolved salts (calc) mg/l 1000 ND ND ND ND ND ND ND ND ND ND ND ND ND ND ND
Fluoride mg/l 1.5 0.19 0.72 2.28 1.02 0.83 0.36 0.51 0.19 0.98 0.71 0.32 0.16 0.19 0.28 0.58
Hardness mg CaCO3/1 500 58 278 326 49 88 821 420 61 158 174 46 67 61 819 331
Iron mg/l 1.5 <0.01 <0.01 <0.01 <0.01 <0.01 <0.01 <0.01 <0.01 <0.01 <0.01 0.11 <0.01 <0.01 0.02 <0.01
Lead mg/l 0.01 <0.001 <0.001 <0.001 <0.001 <0.001 <0.001 <0.001 <0.001 <0.001 <0.001 <0.001 <0.001 <0.001 <0.001 <0.001
Magnesium mg/l 50 5.6 25 64 4.7 9.2 66 62 5.7 22 15 3.9 6 5.1 103 30
Manganese mg/l 0.1 <0.02 <0.02 0.04 <0.02 <0.02 0.3 0.03 <0.02 <0.02 <0.02 <0.02 <0.02 <0.02 <0.02 <0.02
Mercury mg/l 0.001 <0.001 <0.001 <0.001 <0.001 <0.001 <0.001 <0.01 <0.001 <0.001 <0.001 <0.001 <0.001 <0.001 <0.001 <0.001
Molybdenum mg/l 0.07 <0.001 0.00227 0.03 0.00211 0.00131 0.00175 0.00831 <0.001 0.00563 0.00285 <0.001 <0.001 <0.001 0.00251 0.00107
Volume 3: ESIA Specialist Volume – Surface and Groundwater – September 2014
Coastal & Environmental Services 21 EcoFarm Mozambique Lda
Parameter Unit MICOA Sample Site
Z01 Tap
Z02 Borehole
Z03 Well
Z04 Well
Z05 Borehole
Z07 Well
Z08 Well
Z09 Tap
Z10 Well
Z11 Borehole
Z12 Well
Z13 River
Z14 Tap
Z15 Well
Z16 Well
Nickel mg/l 0.02 <0.001 <0.001 0.00421 <0.001 <0.001 0.00151 <0.001 <0.001 <0.001 <0.001 <0.001 <0.001 <0.001 <0.001 0.00177
Nitrate mg/l 50 0.13 0.55 7.85 <0.01 0.22 <0.01 1.31 0.1 1.18 0.28 0.12 0.06 0.13 0.94 3.3
Nitrite mg/l 3 <0.01 0.05 0.03 <0.01 <0.01 <0.01 <0.01 <0.01 0.01 <0.01 <0.01 0.06 <0.01 <0.01 <0.01
Odour Descriptive ND ND ND ND ND ND ND ND ND ND ND ND ND ND ND
pH 6.5 to 8.5 7.3 7.3 7.7 8.1 7.5 7.1 7.2 7.5 7.5 7.5 7.6 7.3 7.3 7.1 7.2
Phosphorous (P) mg/l 0.1 0.025 0.09 0.036 0.041 0.168 <0.002 0.035 0.027 0.012 0.389 0.646 0.031 0.02 <0.002 0.01
Selenium mg/l 0.1 <0.001 <0.001 0.0179 <0.001 <0.001 0.00152 0.00339 <0.001 0.00423 <0.001 <0.001 <0.001 <0.001 0.0016 <0.001
Sodium mg/l 200 15 254 1476 196 42 382 508 15 583 286 77 23 17 629 276
Soluble Organic Carbon mg/l 2.5 ND ND ND ND ND ND ND ND ND ND ND ND ND ND ND
Sulphate mg/l 250 6.05 17.4 383 12.2 2.66 112 40.7 6.32 37.6 29.8 3.65 6.78 6.43 9.43 9.57
Total Suspended Solids mg/l 1000 <10 24 20 <10 108 15 <10 <10 <10 15 10 <10 <10 18 10
Turbidity NTU 5 1.5 27.2 1.3 0.3 93.7 1.6 0.2 0.5 0.3 3.3 1.3 0.7 4.1 3.1 0.6
Zinc mg/l 3 0.047 <0.001 0.06 <0.001 <0.001 0.022 0.02 0.021 0.00556 <0.001 0.00104 0.0013 0.052 0.0187 0.0104
NOTE: The Mozambican drinking water standard is derived from the WHO Drinking Water Quality Guidelines (2011)
Acceptable and within specification for drinking water Above specification for drinking water. Requires the implementation of mitigation measures
ND Not Determined. The parameter should be included in future monitoring plans required by MICOA. Below detection limit for parameter measured. This should be revised to accommodate values below required standards
Note: Sampling Site No Z06 – Goba Borehole 2 – could not be located, and it is probable that the surface infrastructure has been removed.
Volume 3: ESIA Specialist Volume – Surface and Groundwater – September 2014
Coastal & Environmental Services 22 EcoFarm Mozambique Lda
Table 5.2: Sampled surface water quality as compared with the Australian and New Zealand Guidelines for Fresh and Marine Water Quality (ANZECC 2000)
Parameter Unit ANZECC
LTV STV Z13
Aluminium mg/l 5 20 0.00177
Arsenic mg/l 0.1 2 <0.001
Beryllium mg/l 0.1 0.5 ND
Boron mg/l 0.5 0.5 to 15 ND
Cadmium mg/l 0.01 0.05 <0.001
Chromium IV mg/l 0.1 1 <0.001
Cobalt mg/l 0.05 0.1 ND
Copper mg/l 0.2 5 <0.001
Fluoride mg/l 1 2 0.16
Iron mg/l 0.2 10 <0.01
Lead mg/l 2 5 <0.001
Lithium mg/l 2.5 2.5 ND
Manganese mg/l 0.2 10 <0.02
Mercury mg/l 0.002 0.002 <0.001
Molybdenum mg/l 0.01 0.05 <0.001
Nickel mg/l 0.2 2 <0.001
Nitrogen mg/l 5 25 ND
Phosphorus mg/l 0.05 0.8 0.031
Selenium mg/l 0.02 0.05 <0.001
Uranium mg/l 0.01 0.1 ND
Vanadium mg/l 0.1 0.5 ND
pH 6 9 7.3
Zinc mg/l 2 5 0.0013
LTV: Long-term trigger value. STV: Short term trigger value Below the STV Above STV but below LTV. Requires the implementation of mitigation measures. Above LTV. Requires immediate remediation
ND Not Determined. The parameter would have to be included in future monitoring plans.
Volume 3: ESIA Specialist Volume – Surface and Groundwater – September 2014
Coastal & Environmental Services 23 EcoFarm Mozambique Lda
Table 5.3: Sampled groundwater quality as compared against the Dutch List for groundwater
Parameter Unit
Dutch List Sample Site
Target Value
Intervention Value
Z01 Z02 Z03 Z04 Z05 Z07 Z08 Z09 Z10 Z11 Z12 Z14 Z15 Z16
Benzene mg/l 0.0002 0.03 ND ND ND ND ND ND ND ND ND ND ND ND ND ND
Cadmium mg/l 0.0004 0.006 <0.001 <0.001 <0.001 <0.001 <0.001 <0.001 <0.001 <0.001 <0.001 <0.001 <0.001 <0.001 <0.001 <0.001
Chromium IV
mg/l 0.001 0.03 <0.001 <0.001 <0.001 <0.001 <0.001 <0.001 <0.001 <0.001 <0.001 <0.001 <0.001 <0.001 <0.001 <0.001
Copper mg/l 0.015 0.075 <0.001 <0.001 0.00674 <0.001 <0.001 0.0117 0.00437 <0.001 0.00228 <0.001 <0.001 <0.001 0.00549 0.0097
7
Cyanide mg/l 0.005 1.5 <0.02 <0.02 <0.02 <0.02 <0.02 <0.02 <0.02 <0.02 <0.02 <0.02 <0.02 <0.02 <0.02 <0.02
Ethy-benzene
mg/l 0.004 0.15 ND ND ND ND ND ND ND ND ND ND ND ND ND ND
Fluoride mg/l 0.5 N/A 0.19 0.72 2.28 1.02 0.83 0.36 0.51 0.19 0.98 0.71 0.32 0.19 0.28 0.58
Lead mg/l 0.015 0.075 <0.001 <0.001 <0.001 <0.001 <0.001 <0.001 <0.001 <0.001 <0.001 <0.001 <0.001 <0.001 <0.001 <0.001
Mercury mg/l 0.00005 0.0003 <0.001 <0.001 <0.001 <0.001 <0.001 <0.001 <0.01 <0.001 <0.001 <0.001 <0.001 <0.001 <0.001 <0.001
Nickel mg/l 0.015 0.075 <0.001 <0.001 0.00421 <0.001 <0.001 0.00151 <0.001 <0.001 <0.001 <0.001 <0.001 <0.001 <0.001 0.0017
7
Toluene mg/l 0.007 1 ND ND ND ND ND ND ND ND ND ND ND ND ND ND
Xylene mg/l 0.0002 0.07 ND ND ND ND ND ND ND ND ND ND ND ND ND ND
Zinc mg/l 0.065 0.8 0.047 <0.001 0.06 <0.001 <0.001 0.022 0.02 0.021 0.00556 <0.001 0.00104 0.052 0.0187 0.0104
Below target value. No action required. Above target value but below intervention value. Requires the implementation of mitigation measures. Above Intervention values and requires intervention/immediate remediation.
ND Not Determined. The parameter would have to be included in future monitoring plans. Below detection limit for parameter measured. This should be revised to accommodate values below required standards
Volume 3: ESIA Specialist Volume – Surface and Groundwater – September 2014
Coastal & Environmental Services 24 EcoFarm Mozambique Lda
6 ASSESSMENT OF POTENTIAL ENVIRONMENTAL IMPACTS
6.1 Introduction This chapter deals with water quality-related issues and impacts that were identified as a result of the EcoFarm project. Due to the mobility of contaminants in water the spatial scale for all identified impacts were determined to be regional. The impact rating scales used for the assessment can be found in Appendix A.
6.2 Impacts associated with establishment of the Estate 6.2.1 Issue 1: Establishment of Estate infrastructure Impact 1.1: Erosion and sedimentation of water courses Cause and comment The establishment of the sugar estate involves the replacement of the existing vegetation cover with sugarcane, with tracts of land to be cleared and levelled in order for the centre pivots to be established. Exposed soils can result in a number of impacts such as erosion, sediment production and loss of topsoil. Potential impacts to water quality may result from erosion and accumulation of sediment and organic debris in watercourses, increased nutrient loads (e.g. from erosion) and changes to temperature levels and stream flows, which may affect fish and aquatic biota populations. These activities may impact on the water quality resulting in the loss of existing aquatic habitat diversity. Vegetation clearing results in the soils on the land becoming more prone to erosion. This is because there are fewer stabilizing structures within the soils, such as root systems and plant cover, to contain the water and bind the soil. This results in a net increase of surface water runoff, which can lead to excessive erosion. A secondary impact linked to this is the loss of topsoil. Topsoil is critical to successful plant growth and must be conserved at all times. It consists of the O and A horizons which contain the large proportion of nutrients required for plant establishment. Once lost, topsoils are extremely difficult to restore. Increased erosion could lead to increased sedimentation of the watercourses into which surface runoff flows. Sedimentation can have severe negative impacts on surrounding aquatic environments including increased turbidity (which decreases light penetration into water, thereby reducing photosynthetic activities in the water column), reduced oxygen concentration in the water column and benthic environment, smothering of benthic biota resulting in loss of food and smothering of spawning beds. This can have severe long-term negative impacts on aquatic habitats. Eutrophication occurs when excessive nutrients enter aquatic systems and cause an increase in primary and secondary production. This can result in algal blooms in the water column. The algae sink to the bottom and begin to decay, resulting in anoxic conditions in the benthos, leading to fish and invertebrate kills. It is, however, unlikely that eutrophication will result from land clearing. Mitigation measures
Develop and implement a Riparian Zone Management Plan (RZMP). Riparian zones are typically established on the border of water bodies and serve to protect and provide a buffer zone for water bodies such as lakes, navigable perennial/intermittent streams, and non-navigable streams.
Riparian zones should be connected with corridors of natural vegetation across watershed boundaries to allow for the movement of animals and plants.
Develop and implement a Surface and Groundwater Monitoring Plan that will incorporate both water quality and quantity measures.
Prevent or limit disturbance to water resources during the planning phase.
Volume 3: ESIA Specialist Volume – Surface and Groundwater – September 2014
Coastal & Environmental Services 25 EcoFarm Mozambique Lda
Water resources should be protected by implementing the recommended guidance contained in the Water Quality section of IFC General EHS Guidelines (2007).
Land clearing should only take place in the dry season or at the end of the wet season.
All fields with slopes greater than 2% must have erosion control measures to prevent loss of topsoil. 90% of the fields in the project area will have a gradient of less than 2%. In the remaining 10%, which is situated on higher ground, sugarcane will be planted. Ridges will be formed to act as erosion control measures and furrows will be formed at 2m intervals.
All roads on the fields must be grassed to minimise erosion.
Drains around each field should be constructed to capture runoff during the wet season. The drains should be designed so that water flow velocities in the drains are fast enough to maintain fine sediments in suspension but not so fast that they result in erosion.
Grassed spoon drains should be used wherever possible.
Site infrastructure such as roads and fences should be aligned with the natural drainage lines to minimise additional erosion.
Fields must not be left bare for long periods of time.
Fields must be designed to facilitate drainage.
Centre pivot drainage must be directed in line with the natural drainage in the area, into lower lying areas.
Drainage ditches must be dug on the periphery of the circles, and these must be grassed.
Water must be channelled into existing drainage areas, and these must be grassed to ensure that erosion does not take place. The grass will also act as a filter strip.
All areas between the pivots must be grassed and cut to maintain a buffer strip. These will also serve as roads for farm vehicles and machinery.
On the outer limits of the plantation, a buffer of 50m must be established, which must be grassed on the project side of the buffer. The middle and outer edges of the buffer must be rehabilitated and natural shrubs and vegetation should be established.
Where necessary, the use of subsurface drainage should be implemented.
Surface drainage that does not allow ponding on the fields and does not result in an increase in flow rates should be established.
Maximum vegetation cover should be maintained outside the field areas, particularly in riparian areas, to act as silt traps.
Riparian vegetation must be rehabilitated in all areas where it has been cleared.
Natural drainage lines must not be impeded or otherwise interfered with.
Erosion should be monitored over the entire site and, where initial indications of erosion are detected, appropriate remedial measures must be taken as soon as possible.
In addition, none of the estates should be established any nearer than 75m from any ephemeral river edges. All the vegetation along these river edges must be kept intact or rehabilitated because:
The vegetation strip will act as a sediment trap.
The vegetation strip will maintain the ecological functioning on the riparian areas during the operation phase.
The vegetation strip will provide shelterbelts to reduce wind speeds.
The vegetation strips will act as ecological corridors. Significance statement The impact associated with the clearing of existing vegetation on site may occur. Due to the mobility of contaminants in water, their impact may be of significance to the region. Without mitigation the significance was considered HIGH and with mitigation it was considered to be MODERATE.
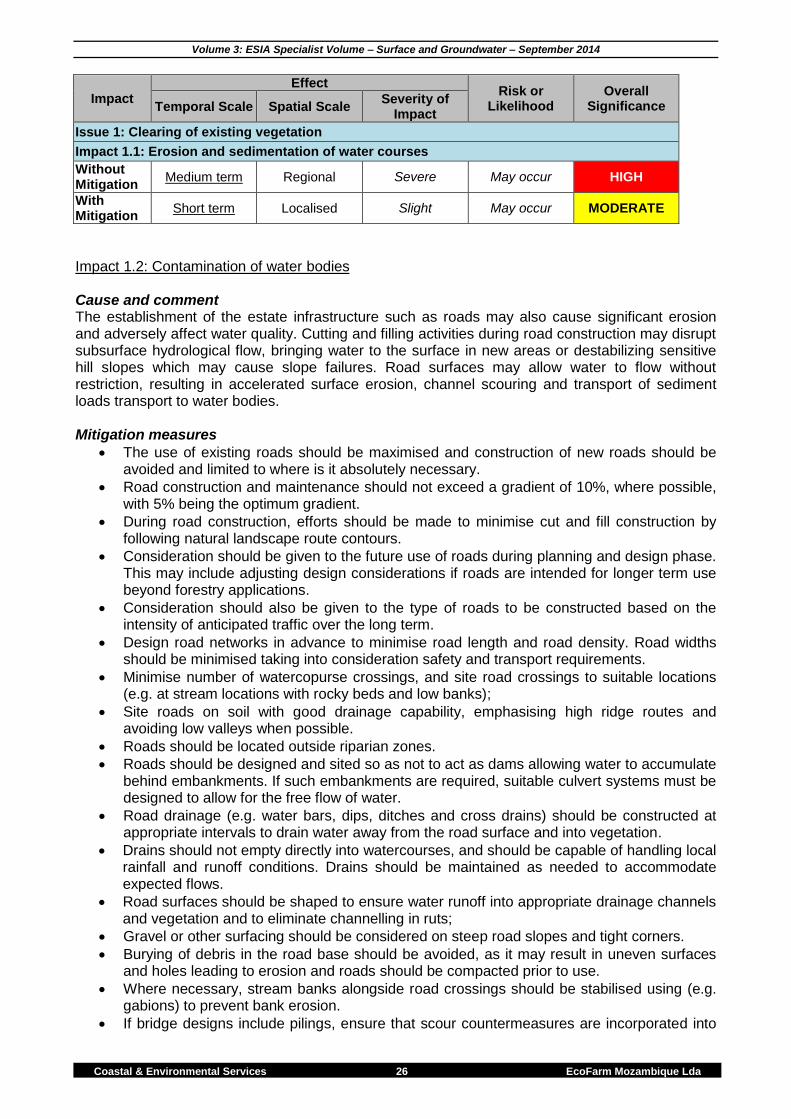
Volume 3: ESIA Specialist Volume – Surface and Groundwater – September 2014
Coastal & Environmental Services 26 EcoFarm Mozambique Lda
Impact
Effect Risk or
Likelihood Overall
Significance Temporal Scale Spatial Scale Severity of
Impact
Issue 1: Clearing of existing vegetation
Impact 1.1: Erosion and sedimentation of water courses
Without Mitigation
Medium term Regional Severe May occur HIGH
With Mitigation
Short term Localised Slight May occur MODERATE
Impact 1.2: Contamination of water bodies Cause and comment The establishment of the estate infrastructure such as roads may also cause significant erosion and adversely affect water quality. Cutting and filling activities during road construction may disrupt subsurface hydrological flow, bringing water to the surface in new areas or destabilizing sensitive hill slopes which may cause slope failures. Road surfaces may allow water to flow without restriction, resulting in accelerated surface erosion, channel scouring and transport of sediment loads transport to water bodies. Mitigation measures
The use of existing roads should be maximised and construction of new roads should be avoided and limited to where is it absolutely necessary.
Road construction and maintenance should not exceed a gradient of 10%, where possible, with 5% being the optimum gradient.
During road construction, efforts should be made to minimise cut and fill construction by following natural landscape route contours.
Consideration should be given to the future use of roads during planning and design phase. This may include adjusting design considerations if roads are intended for longer term use beyond forestry applications.
Consideration should also be given to the type of roads to be constructed based on the intensity of anticipated traffic over the long term.
Design road networks in advance to minimise road length and road density. Road widths should be minimised taking into consideration safety and transport requirements.
Minimise number of watercopurse crossings, and site road crossings to suitable locations (e.g. at stream locations with rocky beds and low banks);
Site roads on soil with good drainage capability, emphasising high ridge routes and avoiding low valleys when possible.
Roads should be located outside riparian zones.
Roads should be designed and sited so as not to act as dams allowing water to accumulate behind embankments. If such embankments are required, suitable culvert systems must be designed to allow for the free flow of water.
Road drainage (e.g. water bars, dips, ditches and cross drains) should be constructed at appropriate intervals to drain water away from the road surface and into vegetation.
Drains should not empty directly into watercourses, and should be capable of handling local rainfall and runoff conditions. Drains should be maintained as needed to accommodate expected flows.
Road surfaces should be shaped to ensure water runoff into appropriate drainage channels and vegetation and to eliminate channelling in ruts;
Gravel or other surfacing should be considered on steep road slopes and tight corners.
Burying of debris in the road base should be avoided, as it may result in uneven surfaces and holes leading to erosion and roads should be compacted prior to use.
Where necessary, stream banks alongside road crossings should be stabilised using (e.g. gabions) to prevent bank erosion.
If bridge designs include pilings, ensure that scour countermeasures are incorporated into
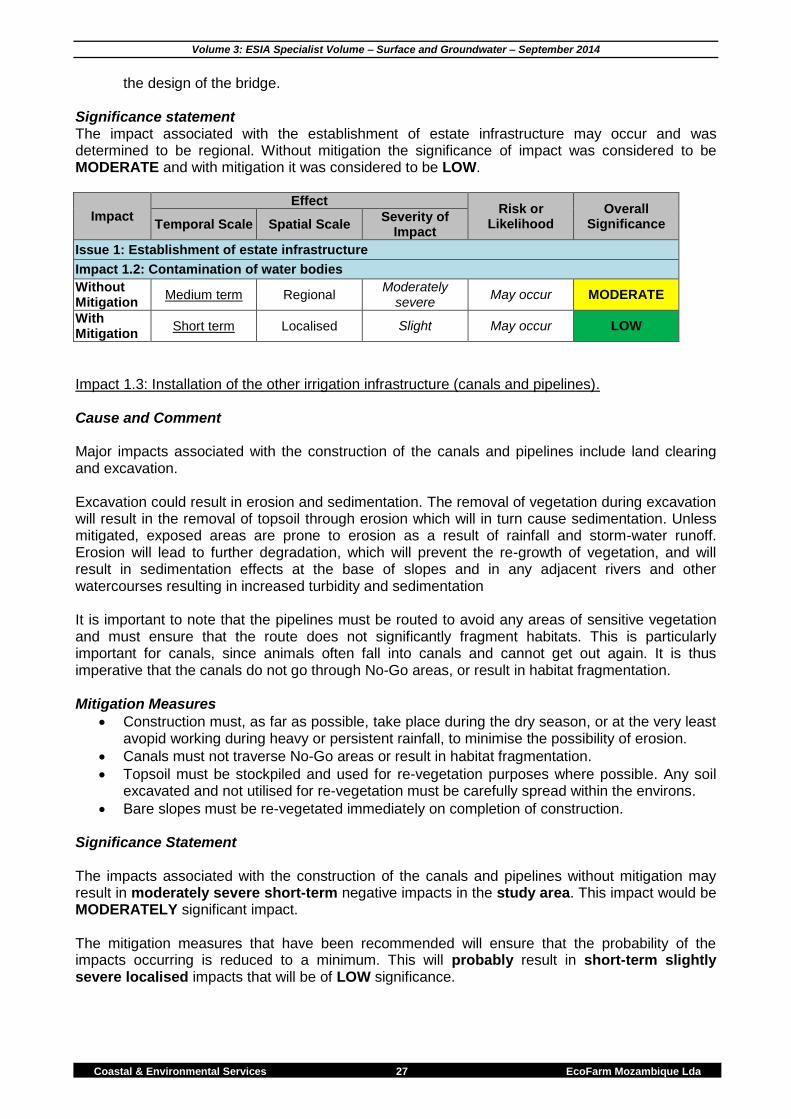
Volume 3: ESIA Specialist Volume – Surface and Groundwater – September 2014
Coastal & Environmental Services 27 EcoFarm Mozambique Lda
the design of the bridge. Significance statement The impact associated with the establishment of estate infrastructure may occur and was determined to be regional. Without mitigation the significance of impact was considered to be MODERATE and with mitigation it was considered to be LOW.
Impact Effect
Risk or Likelihood
Overall Significance Temporal Scale Spatial Scale
Severity of Impact
Issue 1: Establishment of estate infrastructure
Impact 1.2: Contamination of water bodies
Without Mitigation
Medium term Regional Moderately
severe May occur MODERATE
With Mitigation
Short term Localised Slight May occur LOW
Impact 1.3: Installation of the other irrigation infrastructure (canals and pipelines). Cause and Comment Major impacts associated with the construction of the canals and pipelines include land clearing and excavation. Excavation could result in erosion and sedimentation. The removal of vegetation during excavation will result in the removal of topsoil through erosion which will in turn cause sedimentation. Unless mitigated, exposed areas are prone to erosion as a result of rainfall and storm-water runoff. Erosion will lead to further degradation, which will prevent the re-growth of vegetation, and will result in sedimentation effects at the base of slopes and in any adjacent rivers and other watercourses resulting in increased turbidity and sedimentation It is important to note that the pipelines must be routed to avoid any areas of sensitive vegetation and must ensure that the route does not significantly fragment habitats. This is particularly important for canals, since animals often fall into canals and cannot get out again. It is thus imperative that the canals do not go through No-Go areas, or result in habitat fragmentation. Mitigation Measures
Construction must, as far as possible, take place during the dry season, or at the very least avopid working during heavy or persistent rainfall, to minimise the possibility of erosion.
Canals must not traverse No-Go areas or result in habitat fragmentation.
Topsoil must be stockpiled and used for re-vegetation purposes where possible. Any soil excavated and not utilised for re-vegetation must be carefully spread within the environs.
Bare slopes must be re-vegetated immediately on completion of construction. Significance Statement The impacts associated with the construction of the canals and pipelines without mitigation may result in moderately severe short-term negative impacts in the study area. This impact would be MODERATELY significant impact. The mitigation measures that have been recommended will ensure that the probability of the impacts occurring is reduced to a minimum. This will probably result in short-term slightly severe localised impacts that will be of LOW significance.
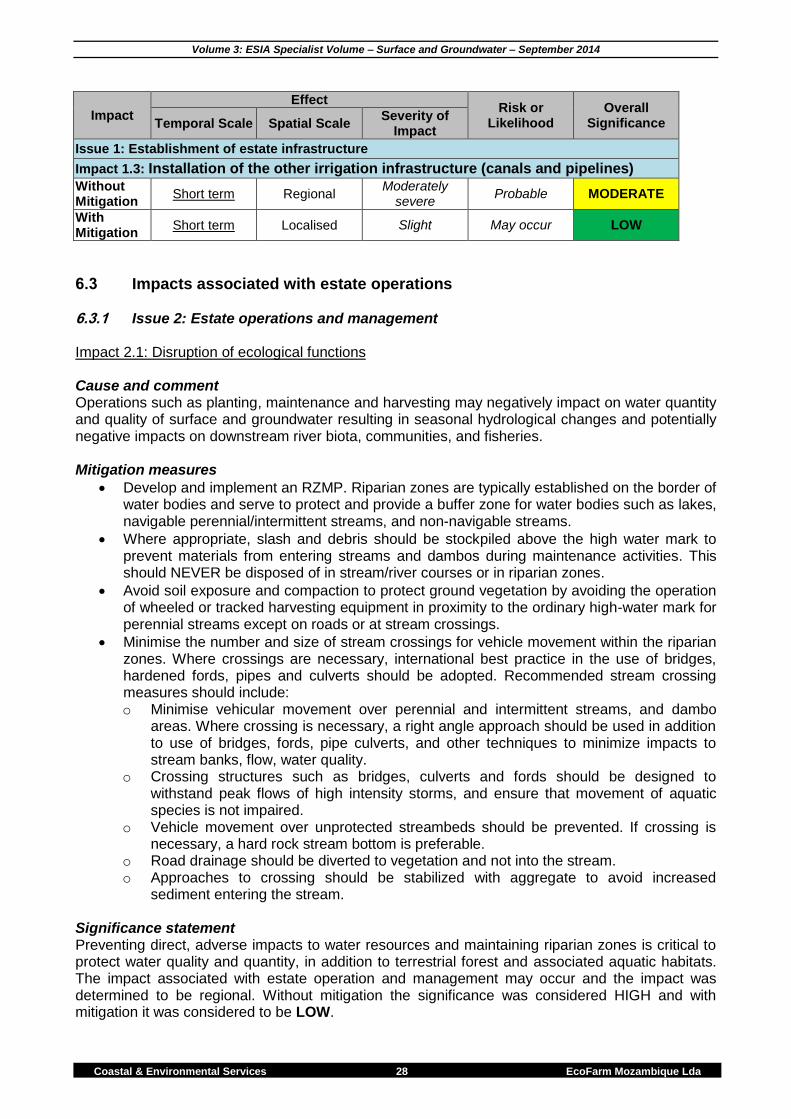
Volume 3: ESIA Specialist Volume – Surface and Groundwater – September 2014
Coastal & Environmental Services 28 EcoFarm Mozambique Lda
Impact
Effect Risk or
Likelihood Overall
Significance Temporal Scale Spatial Scale Severity of
Impact
Issue 1: Establishment of estate infrastructure
Impact 1.3: Installation of the other irrigation infrastructure (canals and pipelines)
Without Mitigation
Short term Regional Moderately
severe Probable MODERATE
With Mitigation
Short term Localised Slight May occur LOW
6.3 Impacts associated with estate operations 6.3.1 Issue 2: Estate operations and management Impact 2.1: Disruption of ecological functions Cause and comment Operations such as planting, maintenance and harvesting may negatively impact on water quantity and quality of surface and groundwater resulting in seasonal hydrological changes and potentially negative impacts on downstream river biota, communities, and fisheries. Mitigation measures
Develop and implement an RZMP. Riparian zones are typically established on the border of water bodies and serve to protect and provide a buffer zone for water bodies such as lakes, navigable perennial/intermittent streams, and non-navigable streams.
Where appropriate, slash and debris should be stockpiled above the high water mark to prevent materials from entering streams and dambos during maintenance activities. This should NEVER be disposed of in stream/river courses or in riparian zones.
Avoid soil exposure and compaction to protect ground vegetation by avoiding the operation of wheeled or tracked harvesting equipment in proximity to the ordinary high-water mark for perennial streams except on roads or at stream crossings.
Minimise the number and size of stream crossings for vehicle movement within the riparian zones. Where crossings are necessary, international best practice in the use of bridges, hardened fords, pipes and culverts should be adopted. Recommended stream crossing measures should include: o Minimise vehicular movement over perennial and intermittent streams, and dambo
areas. Where crossing is necessary, a right angle approach should be used in addition to use of bridges, fords, pipe culverts, and other techniques to minimize impacts to stream banks, flow, water quality.
o Crossing structures such as bridges, culverts and fords should be designed to withstand peak flows of high intensity storms, and ensure that movement of aquatic species is not impaired.
o Vehicle movement over unprotected streambeds should be prevented. If crossing is necessary, a hard rock stream bottom is preferable.
o Road drainage should be diverted to vegetation and not into the stream. o Approaches to crossing should be stabilized with aggregate to avoid increased
sediment entering the stream. Significance statement Preventing direct, adverse impacts to water resources and maintaining riparian zones is critical to protect water quality and quantity, in addition to terrestrial forest and associated aquatic habitats. The impact associated with estate operation and management may occur and the impact was determined to be regional. Without mitigation the significance was considered HIGH and with mitigation it was considered to be LOW.
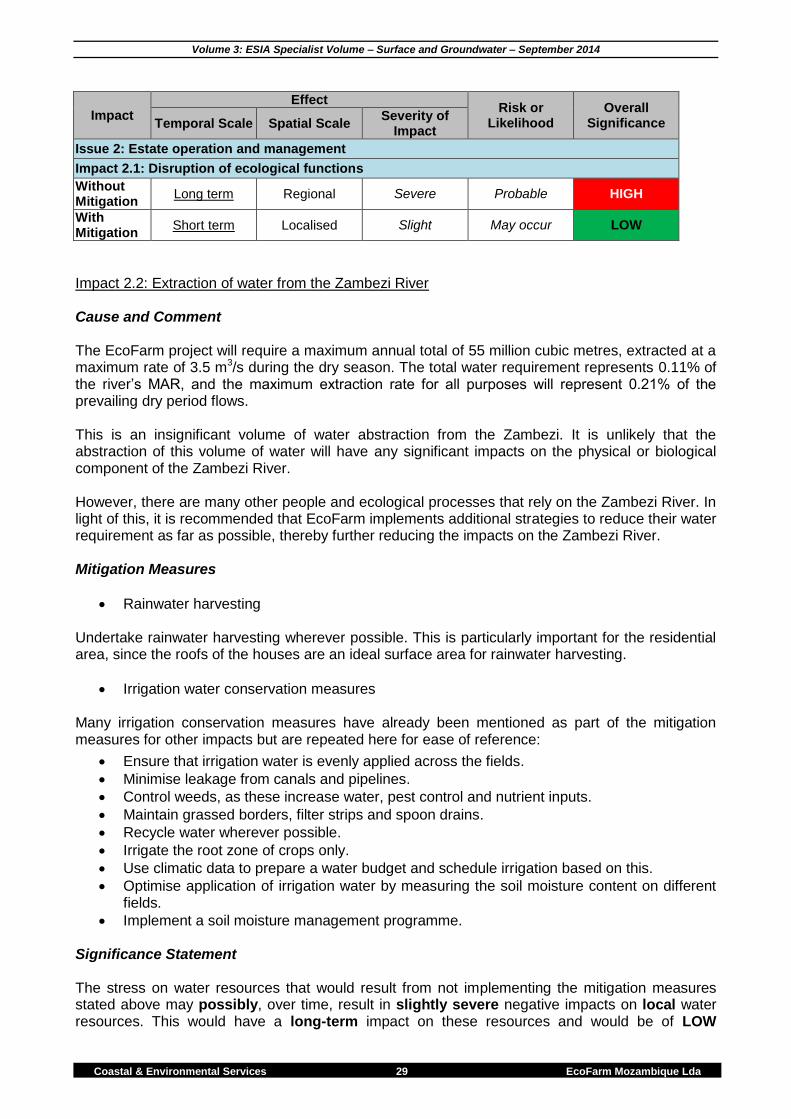
Volume 3: ESIA Specialist Volume – Surface and Groundwater – September 2014
Coastal & Environmental Services 29 EcoFarm Mozambique Lda
Impact
Effect Risk or
Likelihood Overall
Significance Temporal Scale Spatial Scale Severity of
Impact
Issue 2: Estate operation and management
Impact 2.1: Disruption of ecological functions
Without Mitigation
Long term Regional Severe Probable HIGH
With Mitigation
Short term Localised Slight May occur LOW
Impact 2.2: Extraction of water from the Zambezi River Cause and Comment The EcoFarm project will require a maximum annual total of 55 million cubic metres, extracted at a maximum rate of 3.5 m3/s during the dry season. The total water requirement represents 0.11% of the river’s MAR, and the maximum extraction rate for all purposes will represent 0.21% of the prevailing dry period flows. This is an insignificant volume of water abstraction from the Zambezi. It is unlikely that the abstraction of this volume of water will have any significant impacts on the physical or biological component of the Zambezi River. However, there are many other people and ecological processes that rely on the Zambezi River. In light of this, it is recommended that EcoFarm implements additional strategies to reduce their water requirement as far as possible, thereby further reducing the impacts on the Zambezi River. Mitigation Measures
Rainwater harvesting Undertake rainwater harvesting wherever possible. This is particularly important for the residential area, since the roofs of the houses are an ideal surface area for rainwater harvesting.
Irrigation water conservation measures Many irrigation conservation measures have already been mentioned as part of the mitigation measures for other impacts but are repeated here for ease of reference:
Ensure that irrigation water is evenly applied across the fields.
Minimise leakage from canals and pipelines.
Control weeds, as these increase water, pest control and nutrient inputs.
Maintain grassed borders, filter strips and spoon drains.
Recycle water wherever possible.
Irrigate the root zone of crops only.
Use climatic data to prepare a water budget and schedule irrigation based on this.
Optimise application of irrigation water by measuring the soil moisture content on different fields.
Implement a soil moisture management programme. Significance Statement The stress on water resources that would result from not implementing the mitigation measures stated above may possibly, over time, result in slightly severe negative impacts on local water resources. This would have a long-term impact on these resources and would be of LOW
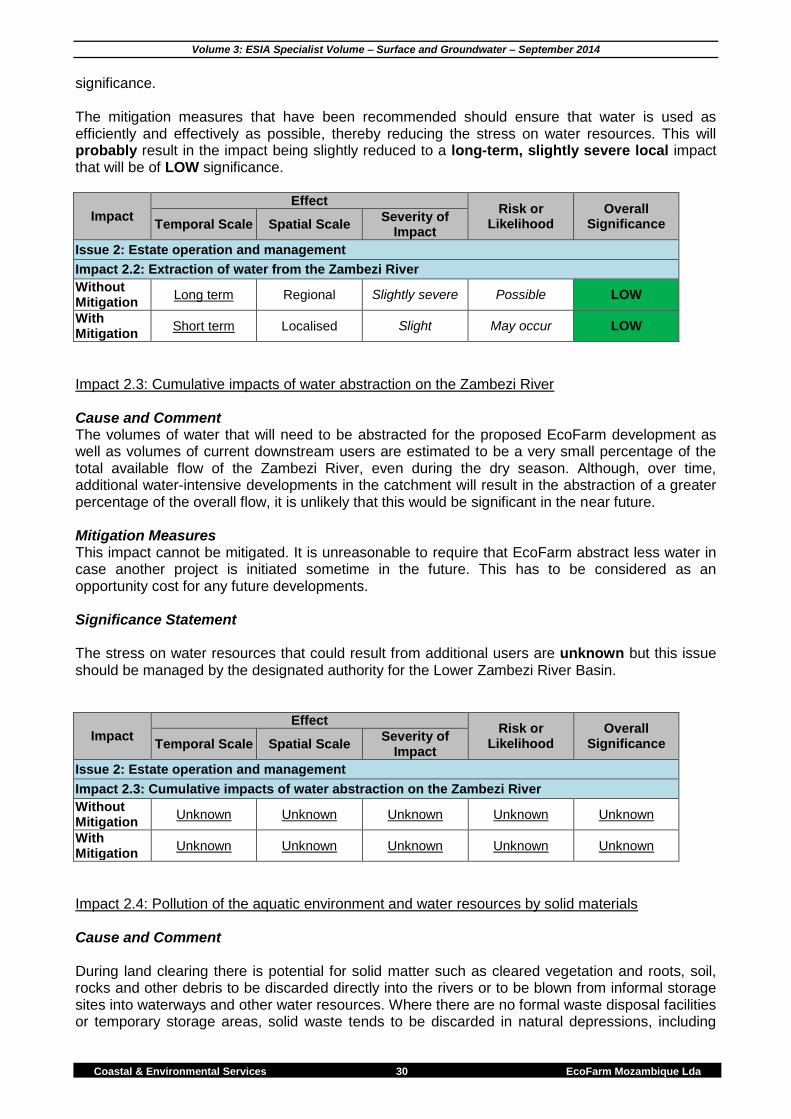
Volume 3: ESIA Specialist Volume – Surface and Groundwater – September 2014
Coastal & Environmental Services 30 EcoFarm Mozambique Lda
significance. The mitigation measures that have been recommended should ensure that water is used as efficiently and effectively as possible, thereby reducing the stress on water resources. This will probably result in the impact being slightly reduced to a long-term, slightly severe local impact that will be of LOW significance.
Impact Effect
Risk or Likelihood
Overall Significance Temporal Scale Spatial Scale
Severity of Impact
Issue 2: Estate operation and management
Impact 2.2: Extraction of water from the Zambezi River
Without Mitigation
Long term Regional Slightly severe Possible LOW
With Mitigation
Short term Localised Slight May occur LOW
Impact 2.3: Cumulative impacts of water abstraction on the Zambezi River Cause and Comment The volumes of water that will need to be abstracted for the proposed EcoFarm development as well as volumes of current downstream users are estimated to be a very small percentage of the total available flow of the Zambezi River, even during the dry season. Although, over time, additional water-intensive developments in the catchment will result in the abstraction of a greater percentage of the overall flow, it is unlikely that this would be significant in the near future. Mitigation Measures This impact cannot be mitigated. It is unreasonable to require that EcoFarm abstract less water in case another project is initiated sometime in the future. This has to be considered as an opportunity cost for any future developments. Significance Statement The stress on water resources that could result from additional users are unknown but this issue should be managed by the designated authority for the Lower Zambezi River Basin.
Impact
Effect Risk or
Likelihood Overall
Significance Temporal Scale Spatial Scale Severity of
Impact
Issue 2: Estate operation and management
Impact 2.3: Cumulative impacts of water abstraction on the Zambezi River
Without Mitigation
Unknown Unknown Unknown Unknown Unknown
With Mitigation
Unknown Unknown Unknown Unknown Unknown
Impact 2.4: Pollution of the aquatic environment and water resources by solid materials Cause and Comment During land clearing there is potential for solid matter such as cleared vegetation and roots, soil, rocks and other debris to be discarded directly into the rivers or to be blown from informal storage sites into waterways and other water resources. Where there are no formal waste disposal facilities or temporary storage areas, solid waste tends to be discarded in natural depressions, including
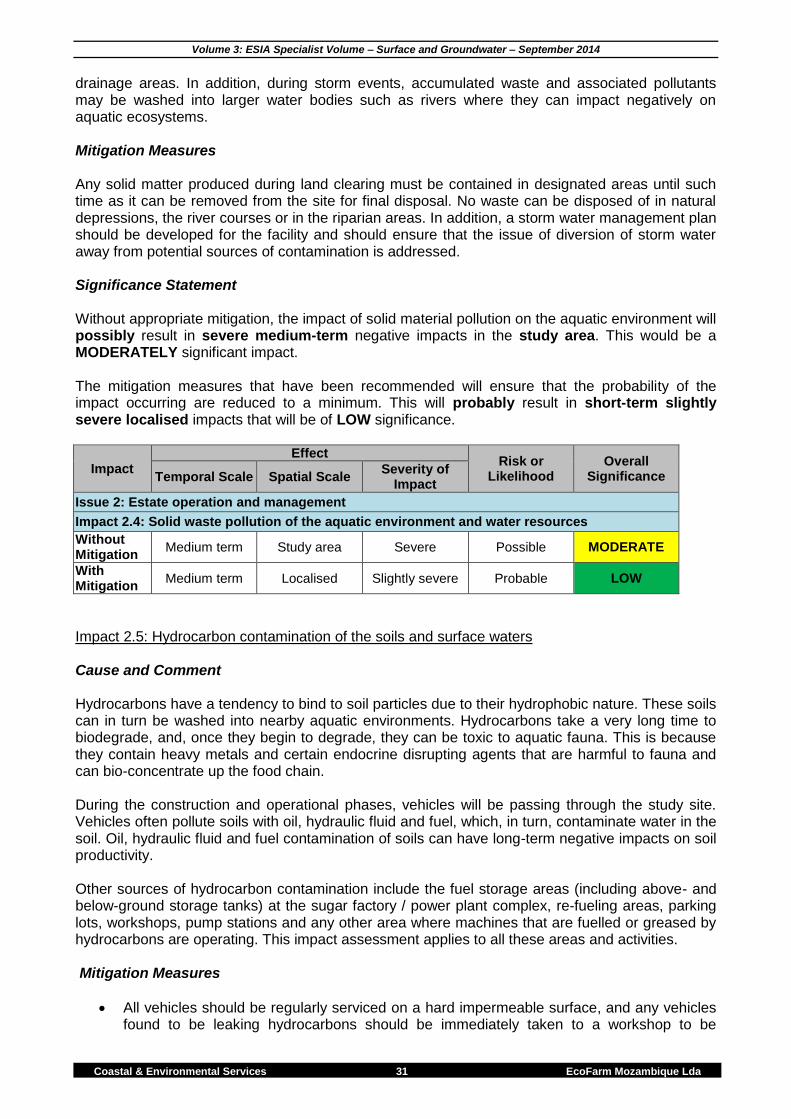
Volume 3: ESIA Specialist Volume – Surface and Groundwater – September 2014
Coastal & Environmental Services 31 EcoFarm Mozambique Lda
drainage areas. In addition, during storm events, accumulated waste and associated pollutants may be washed into larger water bodies such as rivers where they can impact negatively on aquatic ecosystems. Mitigation Measures Any solid matter produced during land clearing must be contained in designated areas until such time as it can be removed from the site for final disposal. No waste can be disposed of in natural depressions, the river courses or in the riparian areas. In addition, a storm water management plan should be developed for the facility and should ensure that the issue of diversion of storm water away from potential sources of contamination is addressed. Significance Statement Without appropriate mitigation, the impact of solid material pollution on the aquatic environment will possibly result in severe medium-term negative impacts in the study area. This would be a MODERATELY significant impact. The mitigation measures that have been recommended will ensure that the probability of the impact occurring are reduced to a minimum. This will probably result in short-term slightly severe localised impacts that will be of LOW significance.
Impact
Effect Risk or
Likelihood Overall
Significance Temporal Scale Spatial Scale Severity of
Impact
Issue 2: Estate operation and management
Impact 2.4: Solid waste pollution of the aquatic environment and water resources
Without Mitigation
Medium term Study area Severe Possible MODERATE
With Mitigation
Medium term Localised Slightly severe Probable LOW
Impact 2.5: Hydrocarbon contamination of the soils and surface waters Cause and Comment Hydrocarbons have a tendency to bind to soil particles due to their hydrophobic nature. These soils can in turn be washed into nearby aquatic environments. Hydrocarbons take a very long time to biodegrade, and, once they begin to degrade, they can be toxic to aquatic fauna. This is because they contain heavy metals and certain endocrine disrupting agents that are harmful to fauna and can bio-concentrate up the food chain. During the construction and operational phases, vehicles will be passing through the study site. Vehicles often pollute soils with oil, hydraulic fluid and fuel, which, in turn, contaminate water in the soil. Oil, hydraulic fluid and fuel contamination of soils can have long-term negative impacts on soil productivity. Other sources of hydrocarbon contamination include the fuel storage areas (including above- and below-ground storage tanks) at the sugar factory / power plant complex, re-fueling areas, parking lots, workshops, pump stations and any other area where machines that are fuelled or greased by hydrocarbons are operating. This impact assessment applies to all these areas and activities. Mitigation Measures
All vehicles should be regularly serviced on a hard impermeable surface, and any vehicles found to be leaking hydrocarbons should be immediately taken to a workshop to be
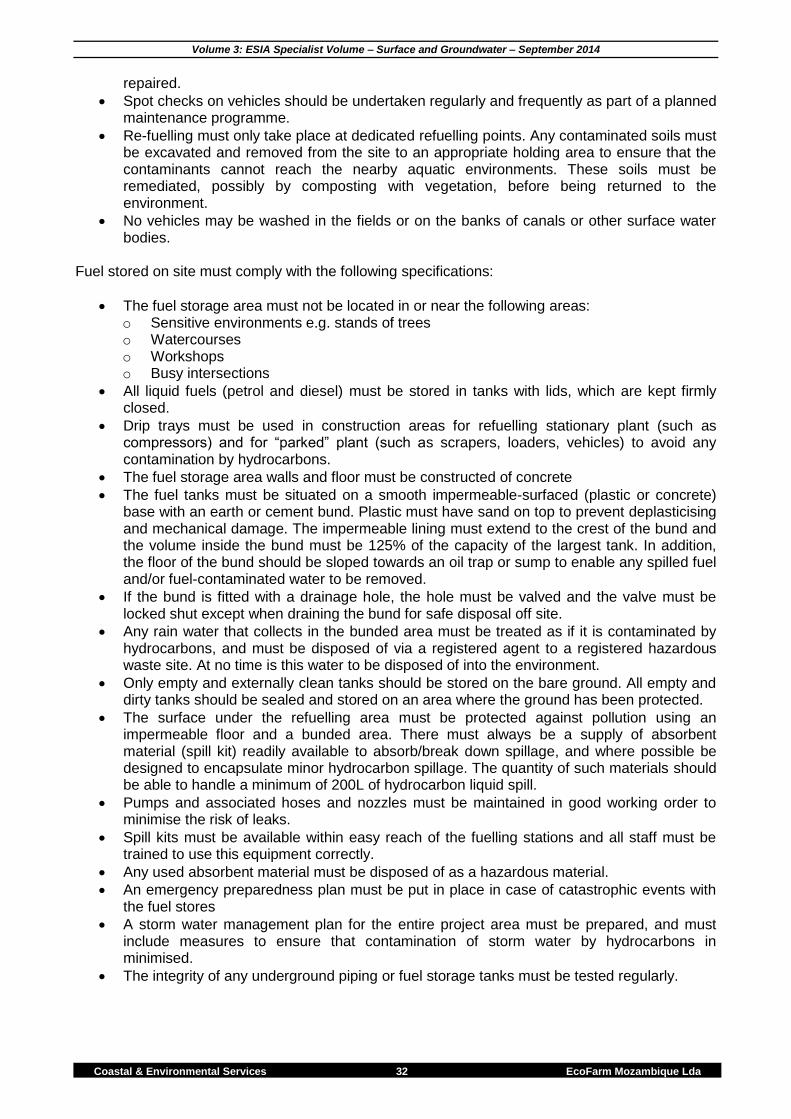
Volume 3: ESIA Specialist Volume – Surface and Groundwater – September 2014
Coastal & Environmental Services 32 EcoFarm Mozambique Lda
repaired.
Spot checks on vehicles should be undertaken regularly and frequently as part of a planned maintenance programme.
Re-fuelling must only take place at dedicated refuelling points. Any contaminated soils must be excavated and removed from the site to an appropriate holding area to ensure that the contaminants cannot reach the nearby aquatic environments. These soils must be remediated, possibly by composting with vegetation, before being returned to the environment.
No vehicles may be washed in the fields or on the banks of canals or other surface water bodies.
Fuel stored on site must comply with the following specifications:
The fuel storage area must not be located in or near the following areas: o Sensitive environments e.g. stands of trees o Watercourses o Workshops o Busy intersections
All liquid fuels (petrol and diesel) must be stored in tanks with lids, which are kept firmly closed.
Drip trays must be used in construction areas for refuelling stationary plant (such as compressors) and for “parked” plant (such as scrapers, loaders, vehicles) to avoid any contamination by hydrocarbons.
The fuel storage area walls and floor must be constructed of concrete
The fuel tanks must be situated on a smooth impermeable-surfaced (plastic or concrete) base with an earth or cement bund. Plastic must have sand on top to prevent deplasticising and mechanical damage. The impermeable lining must extend to the crest of the bund and the volume inside the bund must be 125% of the capacity of the largest tank. In addition, the floor of the bund should be sloped towards an oil trap or sump to enable any spilled fuel and/or fuel-contaminated water to be removed.
If the bund is fitted with a drainage hole, the hole must be valved and the valve must be locked shut except when draining the bund for safe disposal off site.
Any rain water that collects in the bunded area must be treated as if it is contaminated by hydrocarbons, and must be disposed of via a registered agent to a registered hazardous waste site. At no time is this water to be disposed of into the environment.
Only empty and externally clean tanks should be stored on the bare ground. All empty and dirty tanks should be sealed and stored on an area where the ground has been protected.
The surface under the refuelling area must be protected against pollution using an impermeable floor and a bunded area. There must always be a supply of absorbent material (spill kit) readily available to absorb/break down spillage, and where possible be designed to encapsulate minor hydrocarbon spillage. The quantity of such materials should be able to handle a minimum of 200L of hydrocarbon liquid spill.
Pumps and associated hoses and nozzles must be maintained in good working order to minimise the risk of leaks.
Spill kits must be available within easy reach of the fuelling stations and all staff must be trained to use this equipment correctly.
Any used absorbent material must be disposed of as a hazardous material.
An emergency preparedness plan must be put in place in case of catastrophic events with the fuel stores
A storm water management plan for the entire project area must be prepared, and must include measures to ensure that contamination of storm water by hydrocarbons in minimised.
The integrity of any underground piping or fuel storage tanks must be tested regularly.
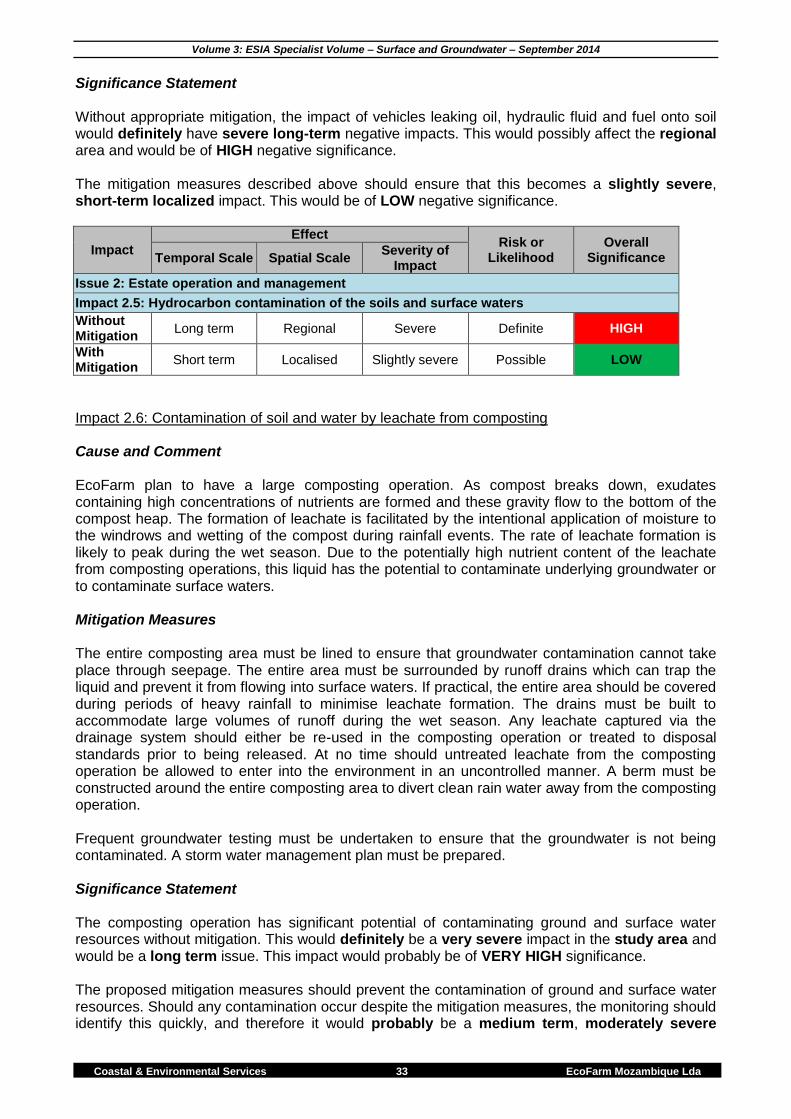
Volume 3: ESIA Specialist Volume – Surface and Groundwater – September 2014
Coastal & Environmental Services 33 EcoFarm Mozambique Lda
Significance Statement Without appropriate mitigation, the impact of vehicles leaking oil, hydraulic fluid and fuel onto soil would definitely have severe long-term negative impacts. This would possibly affect the regional area and would be of HIGH negative significance. The mitigation measures described above should ensure that this becomes a slightly severe, short-term localized impact. This would be of LOW negative significance.
Impact
Effect Risk or
Likelihood Overall
Significance Temporal Scale Spatial Scale Severity of
Impact
Issue 2: Estate operation and management
Impact 2.5: Hydrocarbon contamination of the soils and surface waters
Without Mitigation
Long term Regional Severe Definite HIGH
With Mitigation
Short term Localised Slightly severe Possible LOW
Impact 2.6: Contamination of soil and water by leachate from composting Cause and Comment EcoFarm plan to have a large composting operation. As compost breaks down, exudates containing high concentrations of nutrients are formed and these gravity flow to the bottom of the compost heap. The formation of leachate is facilitated by the intentional application of moisture to the windrows and wetting of the compost during rainfall events. The rate of leachate formation is likely to peak during the wet season. Due to the potentially high nutrient content of the leachate from composting operations, this liquid has the potential to contaminate underlying groundwater or to contaminate surface waters. Mitigation Measures The entire composting area must be lined to ensure that groundwater contamination cannot take place through seepage. The entire area must be surrounded by runoff drains which can trap the liquid and prevent it from flowing into surface waters. If practical, the entire area should be covered during periods of heavy rainfall to minimise leachate formation. The drains must be built to accommodate large volumes of runoff during the wet season. Any leachate captured via the drainage system should either be re-used in the composting operation or treated to disposal standards prior to being released. At no time should untreated leachate from the composting operation be allowed to enter into the environment in an uncontrolled manner. A berm must be constructed around the entire composting area to divert clean rain water away from the composting operation. Frequent groundwater testing must be undertaken to ensure that the groundwater is not being contaminated. A storm water management plan must be prepared. Significance Statement The composting operation has significant potential of contaminating ground and surface water resources without mitigation. This would definitely be a very severe impact in the study area and would be a long term issue. This impact would probably be of VERY HIGH significance. The proposed mitigation measures should prevent the contamination of ground and surface water resources. Should any contamination occur despite the mitigation measures, the monitoring should identify this quickly, and therefore it would probably be a medium term, moderately severe
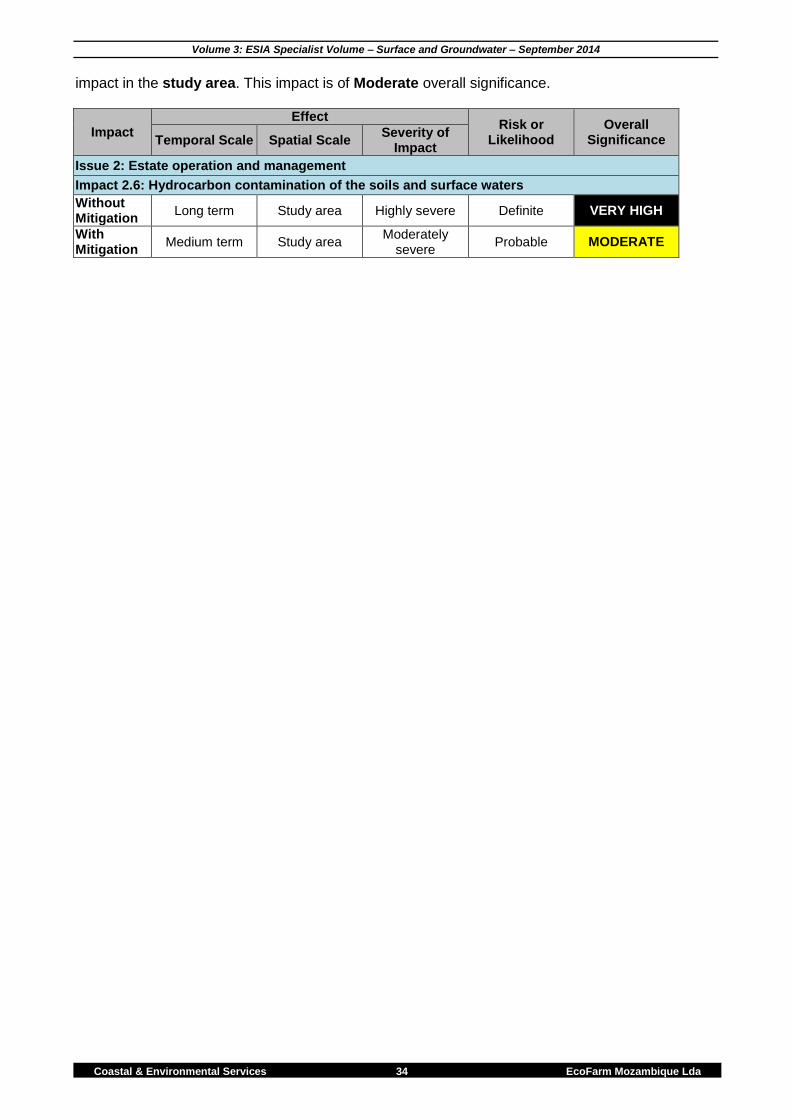
Volume 3: ESIA Specialist Volume – Surface and Groundwater – September 2014
Coastal & Environmental Services 34 EcoFarm Mozambique Lda
impact in the study area. This impact is of Moderate overall significance.
Impact
Effect Risk or
Likelihood Overall
Significance Temporal Scale Spatial Scale Severity of
Impact
Issue 2: Estate operation and management
Impact 2.6: Hydrocarbon contamination of the soils and surface waters
Without Mitigation
Long term Study area Highly severe Definite VERY HIGH
With Mitigation
Medium term Study area Moderately
severe Probable MODERATE
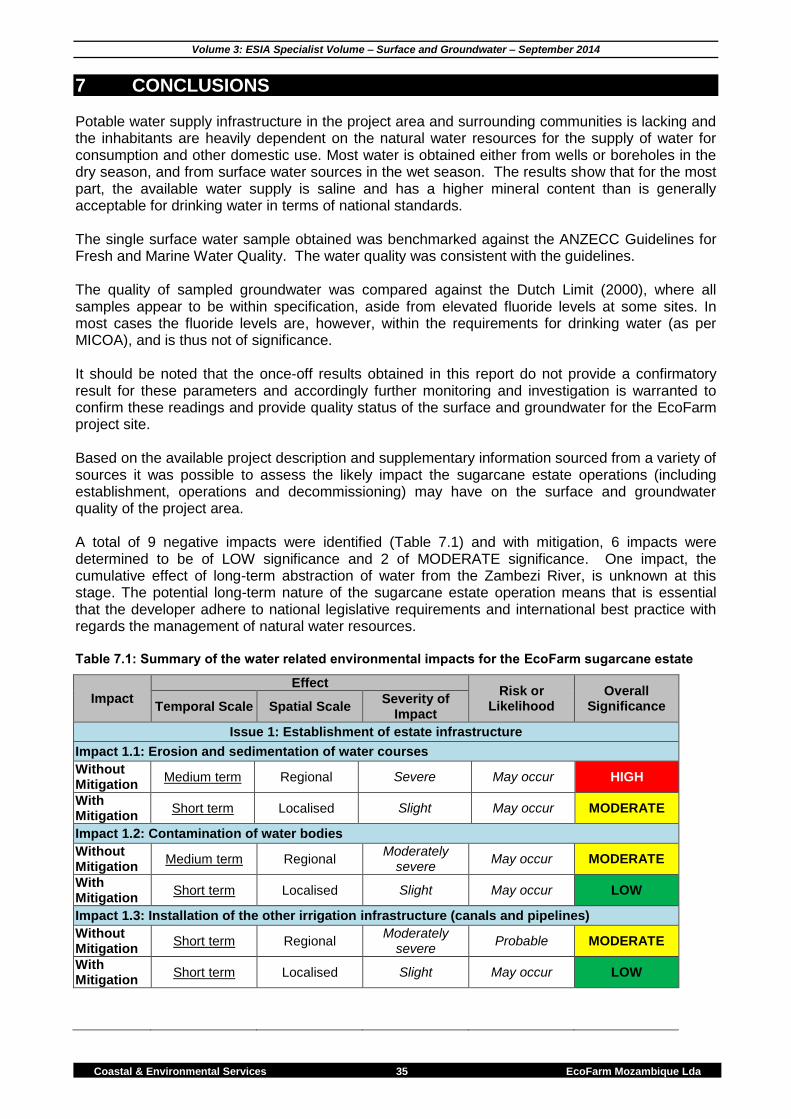
Volume 3: ESIA Specialist Volume – Surface and Groundwater – September 2014
Coastal & Environmental Services 35 EcoFarm Mozambique Lda
7 CONCLUSIONS Potable water supply infrastructure in the project area and surrounding communities is lacking and the inhabitants are heavily dependent on the natural water resources for the supply of water for consumption and other domestic use. Most water is obtained either from wells or boreholes in the dry season, and from surface water sources in the wet season. The results show that for the most part, the available water supply is saline and has a higher mineral content than is generally acceptable for drinking water in terms of national standards. The single surface water sample obtained was benchmarked against the ANZECC Guidelines for Fresh and Marine Water Quality. The water quality was consistent with the guidelines. The quality of sampled groundwater was compared against the Dutch Limit (2000), where all samples appear to be within specification, aside from elevated fluoride levels at some sites. In most cases the fluoride levels are, however, within the requirements for drinking water (as per MICOA), and is thus not of significance. It should be noted that the once-off results obtained in this report do not provide a confirmatory result for these parameters and accordingly further monitoring and investigation is warranted to confirm these readings and provide quality status of the surface and groundwater for the EcoFarm project site. Based on the available project description and supplementary information sourced from a variety of sources it was possible to assess the likely impact the sugarcane estate operations (including establishment, operations and decommissioning) may have on the surface and groundwater quality of the project area. A total of 9 negative impacts were identified (Table 7.1) and with mitigation, 6 impacts were determined to be of LOW significance and 2 of MODERATE significance. One impact, the cumulative effect of long-term abstraction of water from the Zambezi River, is unknown at this stage. The potential long-term nature of the sugarcane estate operation means that is essential that the developer adhere to national legislative requirements and international best practice with regards the management of natural water resources. Table 7.1: Summary of the water related environmental impacts for the EcoFarm sugarcane estate
Impact
Effect Risk or
Likelihood Overall
Significance Temporal Scale Spatial Scale Severity of
Impact
Issue 1: Establishment of estate infrastructure
Impact 1.1: Erosion and sedimentation of water courses
Without Mitigation
Medium term Regional Severe May occur HIGH
With Mitigation
Short term Localised Slight May occur MODERATE
Impact 1.2: Contamination of water bodies
Without Mitigation
Medium term Regional Moderately
severe May occur MODERATE
With Mitigation
Short term Localised Slight May occur LOW
Impact 1.3: Installation of the other irrigation infrastructure (canals and pipelines)
Without Mitigation
Short term Regional Moderately
severe Probable MODERATE
With Mitigation
Short term Localised Slight May occur LOW
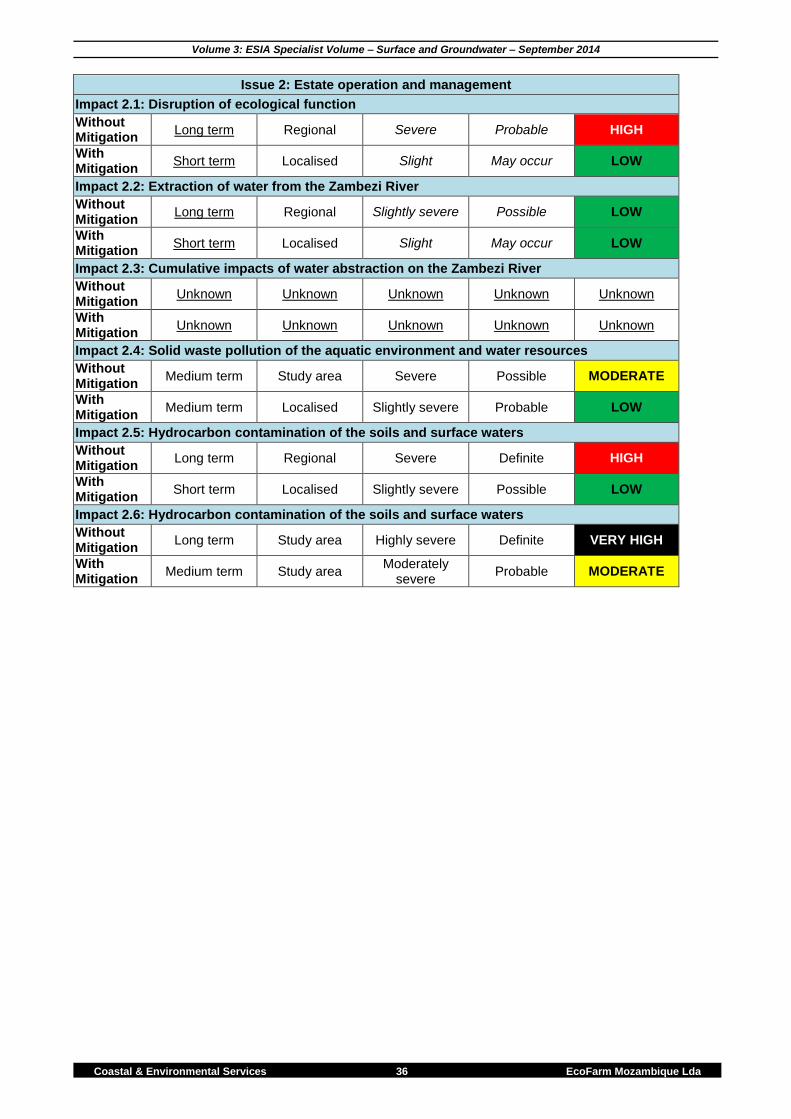
Volume 3: ESIA Specialist Volume – Surface and Groundwater – September 2014
Coastal & Environmental Services 36 EcoFarm Mozambique Lda
Issue 2: Estate operation and management
Impact 2.1: Disruption of ecological function
Without Mitigation
Long term Regional Severe Probable HIGH
With Mitigation
Short term Localised Slight May occur LOW
Impact 2.2: Extraction of water from the Zambezi River
Without Mitigation
Long term Regional Slightly severe Possible LOW
With Mitigation
Short term Localised Slight May occur LOW
Impact 2.3: Cumulative impacts of water abstraction on the Zambezi River
Without Mitigation
Unknown Unknown Unknown Unknown Unknown
With Mitigation
Unknown Unknown Unknown Unknown Unknown
Impact 2.4: Solid waste pollution of the aquatic environment and water resources
Without Mitigation
Medium term Study area Severe Possible MODERATE
With Mitigation
Medium term Localised Slightly severe Probable LOW
Impact 2.5: Hydrocarbon contamination of the soils and surface waters
Without Mitigation
Long term Regional Severe Definite HIGH
With Mitigation
Short term Localised Slightly severe Possible LOW
Impact 2.6: Hydrocarbon contamination of the soils and surface waters
Without Mitigation
Long term Study area Highly severe Definite VERY HIGH
With Mitigation
Medium term Study area Moderately
severe Probable MODERATE
Volume 3: ESIA Specialist Volume – Surface and Groundwater – September 2014
Coastal & Environmental Services 37 EcoFarm Mozambique Lda
8 REFERENCES Australian and New Zealand Environment and Conservation Council /Agriculture and Resource Management Council of Australia and New Zealand (2000): Australian and New Zealand Guidelines for Fresh and Marine Water Quality. Coastal & Environmental Services (2013): EcoFarm Sugar Plantation Project EPDA. Beilfuss R.D. & Dos Santos D. 2001. Patterns of hydrological change in the Zambezi Delta, Mozambique. Working paper #2. Programme for sustainable management of the Cahora Bassa Dam and the Lower Zambezi Valley, pp. 159 Beilfuss and Brown (2006): Assessing Environmental Flow Requirements for the Marromeu Complex of the Zambezi Delta: Application of the DRIFT Model (Downstream Response to Imposed Flow Transformations), Dr. Richard Beilfuss and Dr. Cate Brown (Eds), May 2006, Museum of Natural History - University of Eduardo Mondlane, Maputo, Mozambique. Department for International Development (1999): Water Law, Water Rights andWater Supply (Africa). Mozambique – Study Country Report. Dutch Target and Intervention Values (2000) (http://www.esdat.com) Food and Agriculture Organisation (2005):Aquastat Mozambique. Accessed at: http://www.fao.org/nr/water/aquastat/countries/mozambique/index.stm. Accessed on: May 18, 2010. Guveya & Sukume 2008: The Economic Value of the Zambezi Delta, Emmanuel Guveya and Crispen Sukume, November 2008 Southern African Development Community (2003): Mozambique Water PolicyReview. Timberlake J. (ed). 1998. Biodiversity of the Zambezi Basin Wetlands: Review and preliminary assessment of available information. Phase 1. Consultancy report for IUCN, the World Conservation Union, Regional office for Southern Africa (IUCN ROSA), Harare, Zimbabwe, pp. 241. United States Environmental Protection Agency (2003): Field Sampling Guidance Document #1225 - Surface Water Sampling.
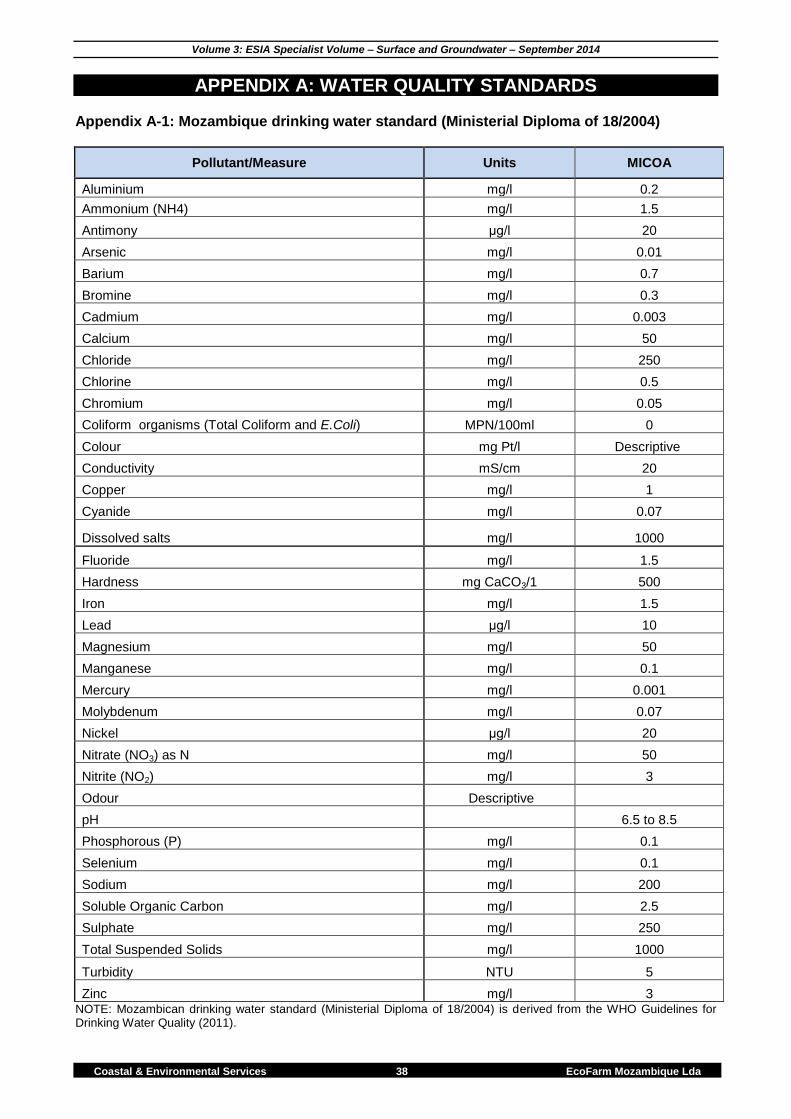
Volume 3: ESIA Specialist Volume – Surface and Groundwater – September 2014
Coastal & Environmental Services 38 EcoFarm Mozambique Lda
APPENDIX A: WATER QUALITY STANDARDS Appendix A-1: Mozambique drinking water standard (Ministerial Diploma of 18/2004)
Pollutant/Measure Units MICOA
Aluminium mg/l 0.2
Ammonium (NH4) mg/l 1.5
Antimony μg/l 20
Arsenic mg/l 0.01
Barium mg/l 0.7
Bromine mg/l 0.3
Cadmium mg/l 0.003
Calcium mg/l 50
Chloride mg/l 250
Chlorine mg/l 0.5
Chromium mg/l 0.05
Coliform organisms (Total Coliform and E.Coli) MPN/100ml 0
Colour mg Pt/l Descriptive
Conductivity mS/cm 20
Copper mg/l 1
Cyanide mg/l 0.07
Dissolved salts mg/l 1000
Fluoride mg/l 1.5
Hardness mg CaCO3/1 500
Iron mg/l 1.5
Lead μg/l 10
Magnesium mg/l 50
Manganese mg/l 0.1
Mercury mg/l 0.001
Molybdenum mg/l 0.07
Nickel μg/l 20
Nitrate (NO3) as N mg/l 50
Nitrite (NO2) mg/l 3
Odour Descriptive
pH 6.5 to 8.5
Phosphorous (P) mg/l 0.1
Selenium mg/l 0.1
Sodium mg/l 200
Soluble Organic Carbon mg/l 2.5
Sulphate mg/l 250
Total Suspended Solids mg/l 1000
Turbidity NTU 5
Zinc mg/l 3 NOTE: Mozambican drinking water standard (Ministerial Diploma of 18/2004) is derived from the WHO Guidelines for Drinking Water Quality (2011).
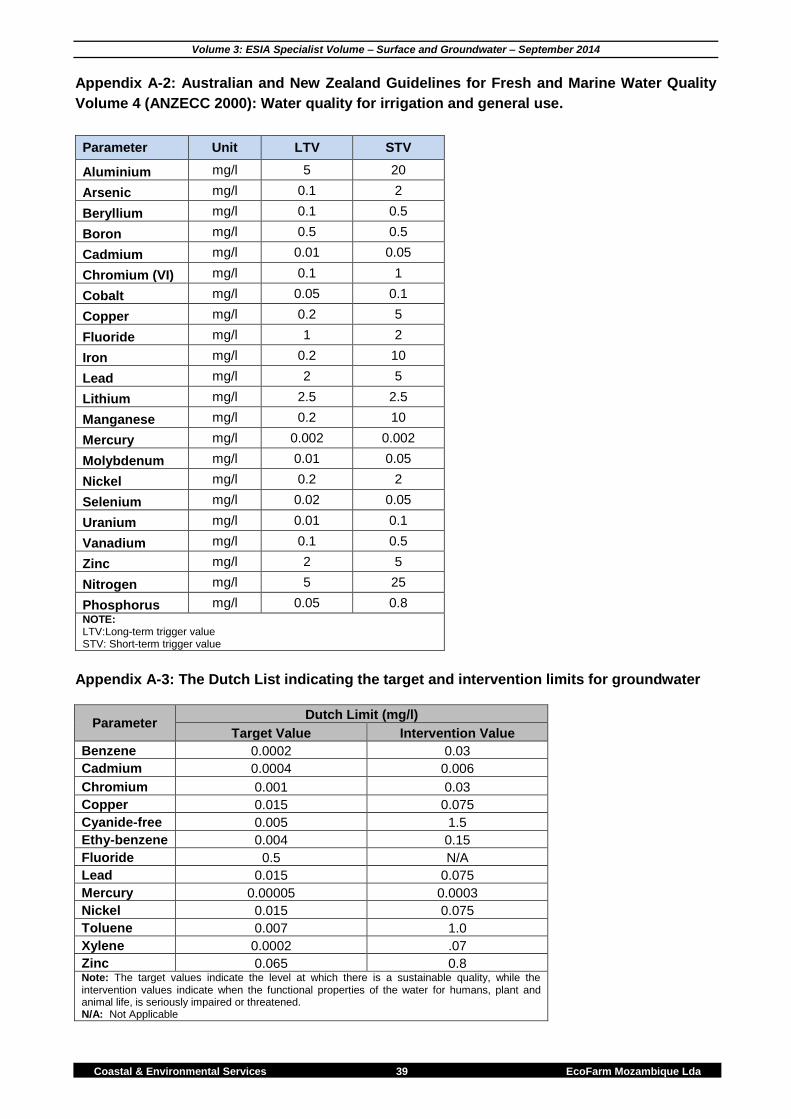
Volume 3: ESIA Specialist Volume – Surface and Groundwater – September 2014
Coastal & Environmental Services 39 EcoFarm Mozambique Lda
Appendix A-2: Australian and New Zealand Guidelines for Fresh and Marine Water Quality
Volume 4 (ANZECC 2000): Water quality for irrigation and general use.
Parameter Unit LTV STV
Aluminium mg/l 5 20
Arsenic mg/l 0.1 2
Beryllium mg/l 0.1 0.5
Boron mg/l 0.5 0.5
Cadmium mg/l 0.01 0.05
Chromium (VI) mg/l 0.1 1
Cobalt mg/l 0.05 0.1
Copper mg/l 0.2 5
Fluoride mg/l 1 2
Iron mg/l 0.2 10
Lead mg/l 2 5
Lithium mg/l 2.5 2.5
Manganese mg/l 0.2 10
Mercury mg/l 0.002 0.002
Molybdenum mg/l 0.01 0.05
Nickel mg/l 0.2 2
Selenium mg/l 0.02 0.05
Uranium mg/l 0.01 0.1
Vanadium mg/l 0.1 0.5
Zinc mg/l 2 5
Nitrogen mg/l 5 25
Phosphorus mg/l 0.05 0.8
NOTE: LTV:Long-term trigger value STV: Short-term trigger value
Appendix A-3: The Dutch List indicating the target and intervention limits for groundwater
Parameter Dutch Limit (mg/l)
Target Value Intervention Value
Benzene 0.0002 0.03
Cadmium 0.0004 0.006
Chromium 0.001 0.03
Copper 0.015 0.075
Cyanide-free 0.005 1.5
Ethy-benzene 0.004 0.15
Fluoride 0.5 N/A
Lead 0.015 0.075
Mercury 0.00005 0.0003
Nickel 0.015 0.075
Toluene 0.007 1.0
Xylene 0.0002 .07
Zinc 0.065 0.8 Note: The target values indicate the level at which there is a sustainable quality, while the intervention values indicate when the functional properties of the water for humans, plant and animal life, is seriously impaired or threatened. N/A: Not Applicable
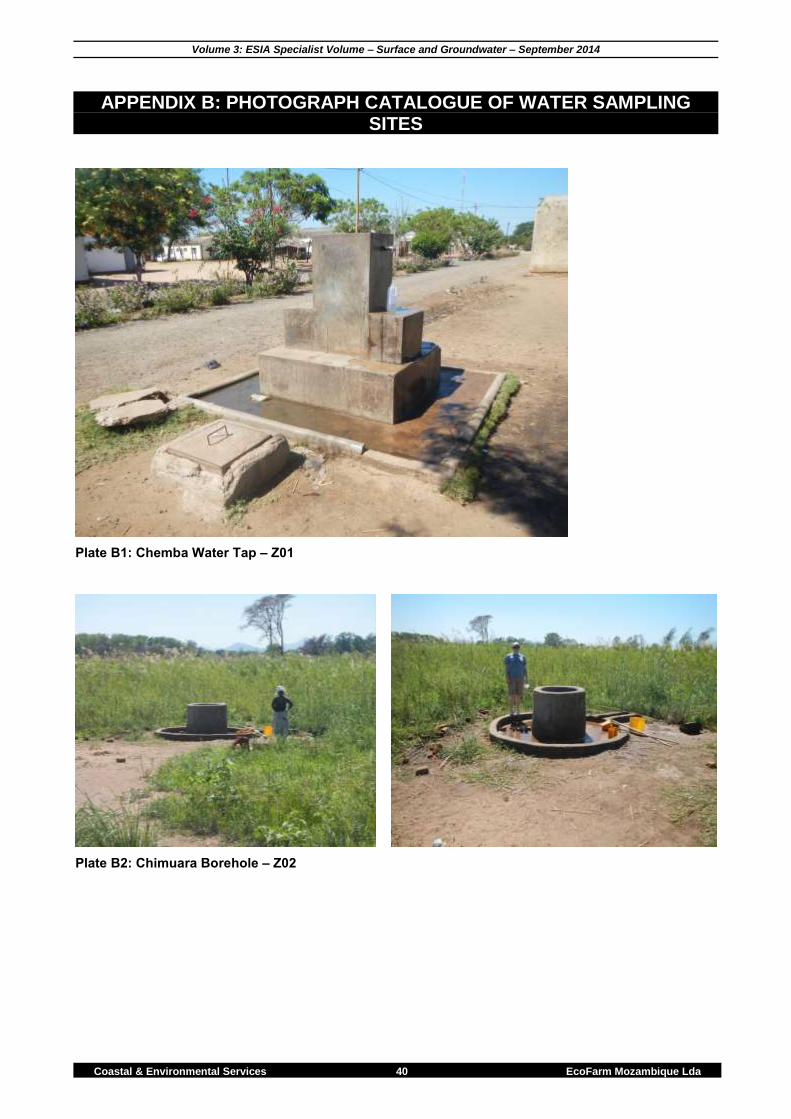
Volume 3: ESIA Specialist Volume – Surface and Groundwater – September 2014
Coastal & Environmental Services 40 EcoFarm Mozambique Lda
APPENDIX B: PHOTOGRAPH CATALOGUE OF WATER SAMPLING SITES
Plate B1: Chemba Water Tap – Z01
Plate B2: Chimuara Borehole – Z02
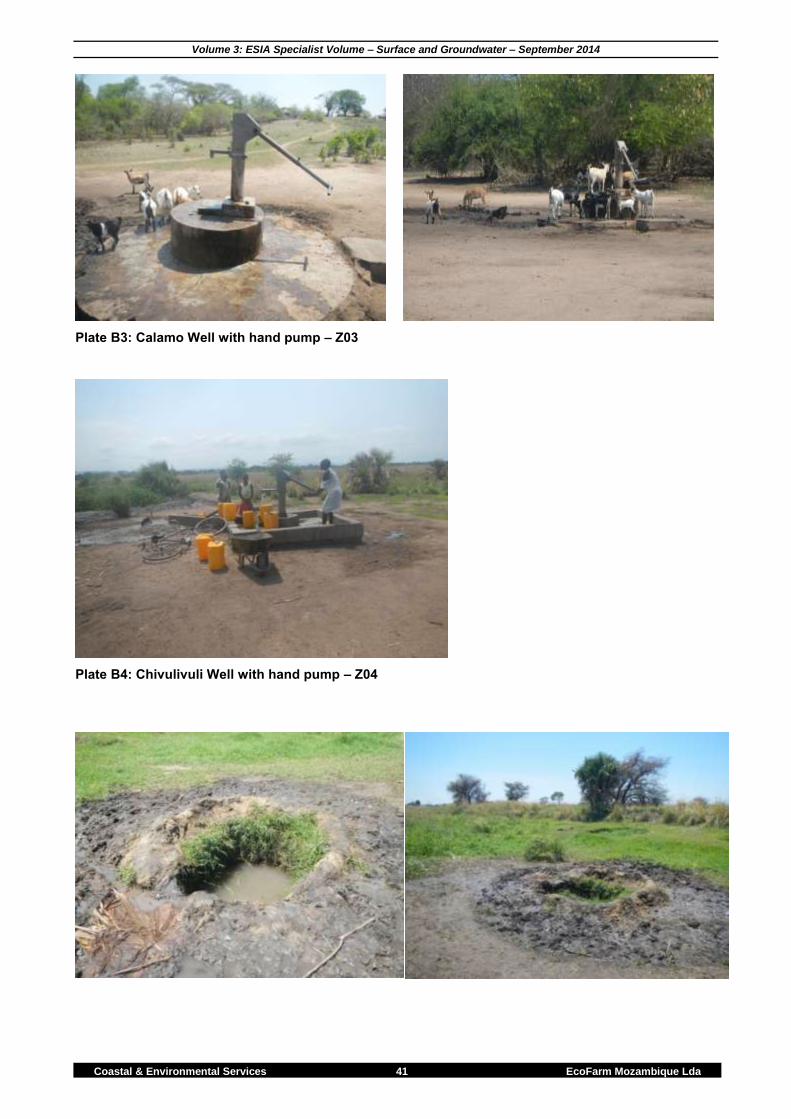
Volume 3: ESIA Specialist Volume – Surface and Groundwater – September 2014
Coastal & Environmental Services 41 EcoFarm Mozambique Lda
Plate B3: Calamo Well with hand pump – Z03
Plate B4: Chivulivuli Well with hand pump – Z04
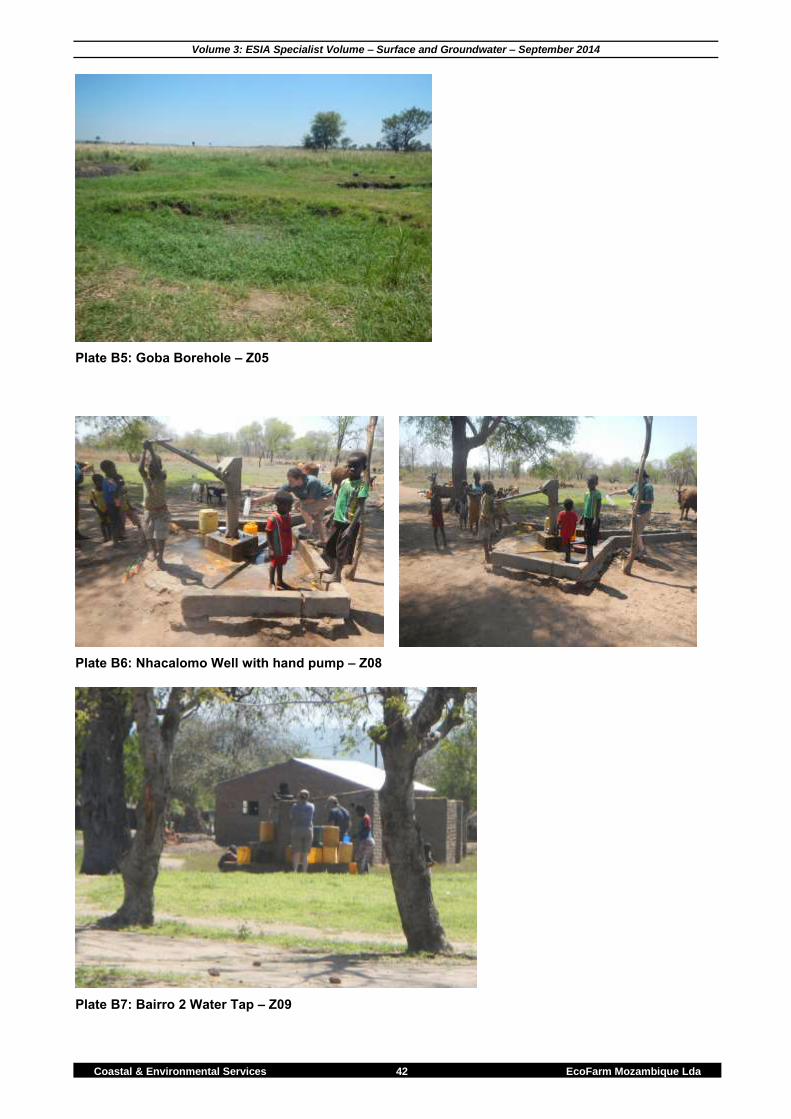
Volume 3: ESIA Specialist Volume – Surface and Groundwater – September 2014
Coastal & Environmental Services 42 EcoFarm Mozambique Lda
Plate B5: Goba Borehole – Z05
Plate B6: Nhacalomo Well with hand pump – Z08
Plate B7: Bairro 2 Water Tap – Z09
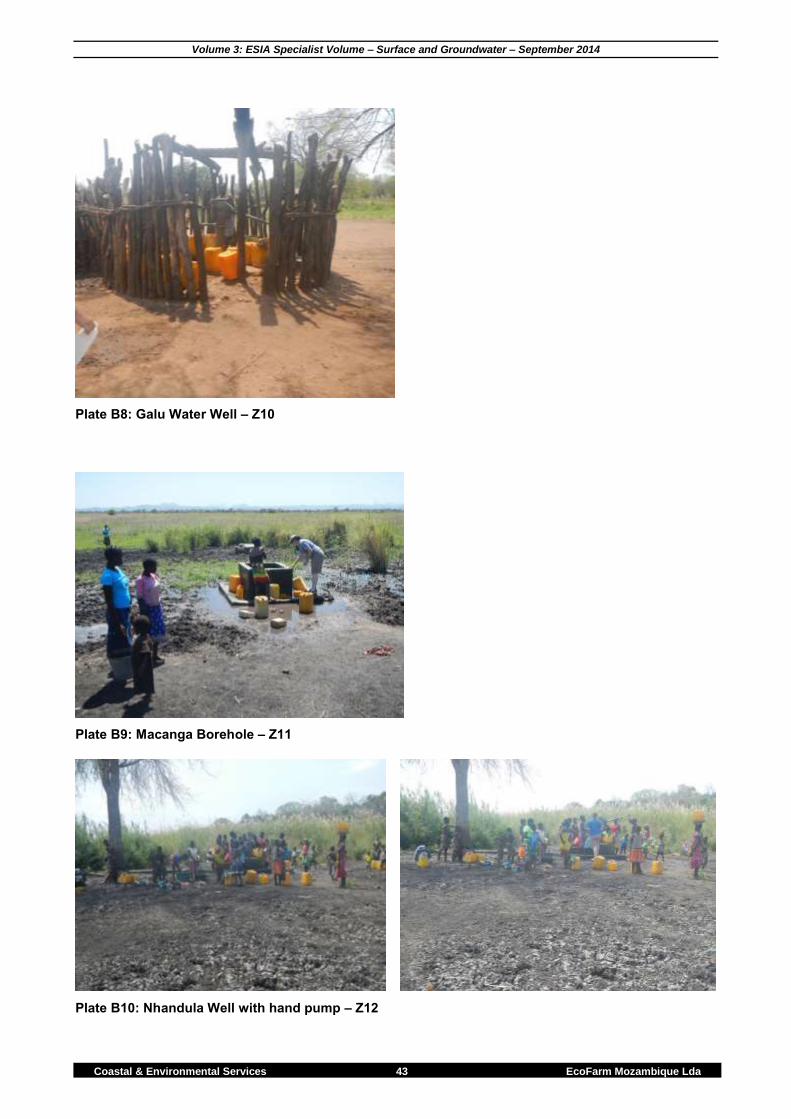
Volume 3: ESIA Specialist Volume – Surface and Groundwater – September 2014
Coastal & Environmental Services 43 EcoFarm Mozambique Lda
Plate B8: Galu Water Well – Z10
Plate B9: Macanga Borehole – Z11
Plate B10: Nhandula Well with hand pump – Z12
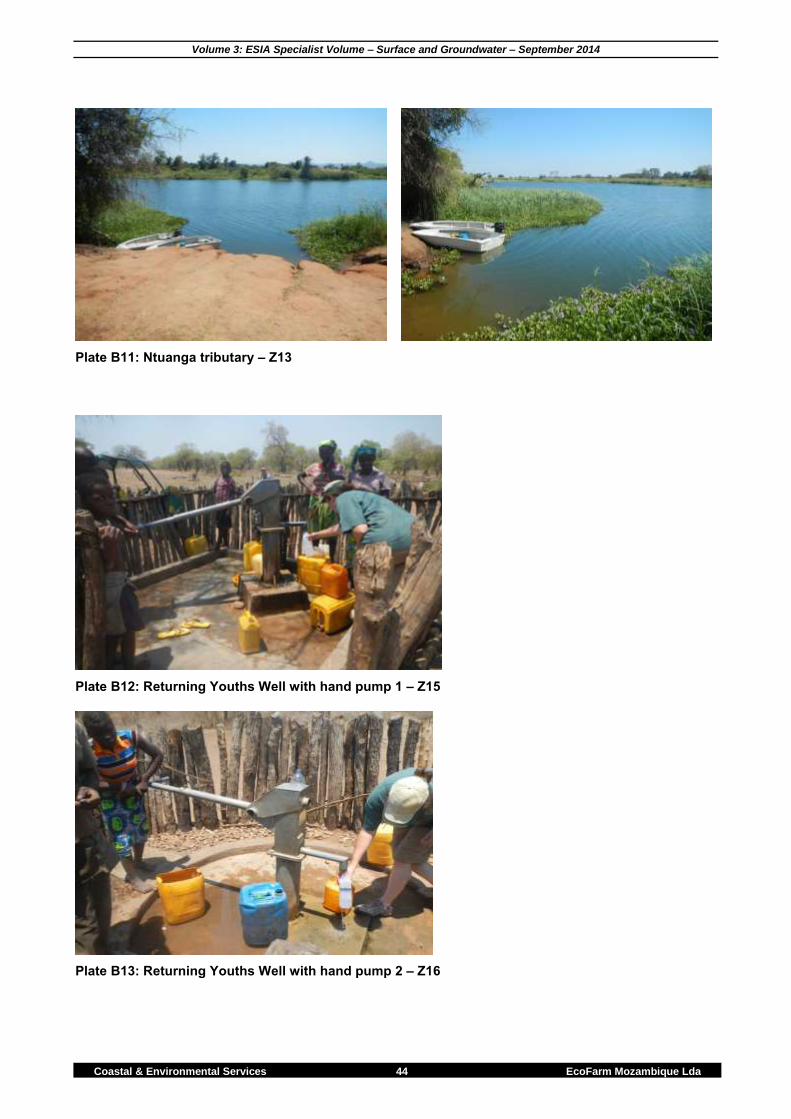
Volume 3: ESIA Specialist Volume – Surface and Groundwater – September 2014
Coastal & Environmental Services 44 EcoFarm Mozambique Lda
Plate B11: Ntuanga tributary – Z13
Plate B12: Returning Youths Well with hand pump 1 – Z15
Plate B13: Returning Youths Well with hand pump 2 – Z16