Embed Size (px)
Citation preview
NPL Report MATC (A) 41
Environment Assisted Cracking of Steam Turbine Disc and Blade Steels - Description of Test
Procedure and Preliminary Results
Shengqi Zhou and Alan Turnbull
September 2001
NPL Report MATC (A) 41
Date: September 2001
Environment Assisted Cracking of Steam
Turbine Disc and Blade Steels - Description of Test Procedure and Preliminary Results
Shengqi Zhou and Alan Turnbull Materials Centre
National Physical Laboratory Teddington, Middlesex, UK, TW11 0LW
ABSTRACT A facility has been established for investigating the resistance to environment assisted cracking of turbine steels. A distinctive feature is very tight control of water chemistry using a once-through water system for chloride-free environments and refreshing the reservoir weekly for the chloride-containing recirculated solutions. Constant displacement tests have been initiated on a 3% NiCrMoV disc steel using smooth and pre-pitted specimens in three environments at 90 �C: deaerated high purity water; aerated high purity water; aerated 1.5 ppm Cl- solution. In addition, the effect of oxygen and chloride content on the growth rate of long cracks has been studied using wedge opening loaded (WOL) specimens. Electrode potential measurements indicate that chloride and oxygen content have a significant effect on the corrosion potential of the disc steel. In deaerated pure water, the potential was about –0.62 V (SCE) whilst in aerated pure water the potential was about +0.10 V (SCE); both steady values being attained in about 10-20 days. By contrast, about 250 days was required to attain the steady corrosion potential in aerated 1.5 ppm Cl-. The slow change in the corrosion potential in the more aggressive environment suggests caution in interpreting the results of short-term laboratory stress corrosion cracking tests. To give insight as to the significance for service life of two-shifting operation, the impact of trapezoidal loading (the stress ratio was zero and the loading frequency was 4 cycles /day) on the growth rate of long cracks of disc and 12% Cr blade steels has been assessed using compact tension (CT) specimens in aerated 1.5 ppm Cl- solution at 90 �C and in aerated 35 ppm Cl- solution at 120 �C respectively. Tests are still ongoing, but preliminary results have shown that the long crack growth rate of the disc steel under transient loading is approximately four times higher than that under constant loading. A similar comparison is not possible at this stage for the blade steel but the growth rate under transient loading is about 1.87 � 10-10 m/s.
© Crown copyright 2001 Reproduced by permission of the Controller of HMSO
ISSN 1473-2734
National Physical Laboratory Teddington, Middlesex, UK, TW11 0LW
Extracts from this report may be reproduced provided the source is acknowledged and the extract is not taken out of context.
Approved on behalf of Managing Director, NPL, by Dr C Lea, Head, Materials Centre
NPL Report MATC (A) 41
1
INTRODUCTION The power industry worldwide has experienced failures over the last 30 years from environment assisted cracking (EAC) initiated from pits in steam turbine blades, discs and rotors. The blade material is mainly 12% Cr stainless steels whilst the discs and rotors are typically 3% Ni steels. The most notable failure was that at the Hinckley Point ‘A’ Power Station in 1969 which involved stress corrosion cracking (SCC) of the disc1. More recently in 1996, at the Aberthaw Power Station, a single pit resulted in failure of a turbine blade and eventually to damage to the power station estimated in excess of £10m2. The circumstances leading to these failures are well understood and in the case of Aberthaw were specific to the operational conditions of that plant, since modified. Nevertheless, changes in operating practice of UK coal-fired plant are posing new challenges in life prediction of components3. For economic reasons, the UK power industry is now operating its 500 MW coal-fired plants on a two-shift cycle in which the turbines are on-load for 16 hours per day and off-load overnight and at weekends. Ideally, more regular start-ups and shut-downs would be desirable in response to power demand, and are being introduced, but there are limitations to the rate at which the system can be brought to operational temperature. The concern with ‘two-shifting’ is the impact on cracking of the associated transients in stress, water chemistry and temperature, as described below. Description of low pressure (LP) turbine operation for coal fired plants On load, the inlet steam temperature of LP turbine varies depending on the water treatment. It is about 300 �C for phosphate treatment steam reducing to about 50 �C at the outlet. The inlet steam is dry but, as the temperature decreases and the pressure changes, droplets can form and condensates containing salts separate out on the discs, blades and rotors. The inlet steam chemistry is tightly controlled with a low initial conductivity of about 0.1-1.0 �S/cm and the oxygen content is less than 5 ppb under steady operating conditions. The pH of the inlet steam depends on the type of water treatment, being 9.0-9.3 for phosphate treatment and 7.8 for oxygenated treatment. The stresses on load are primarily centrifugal with superimposed high frequency vibrations of low amplitude. The stress ratio is typically about 0.9. The system shut-down usually takes 20 minutes as the load gradually decreases to near zero. The temperature decreases more slowly, taking several days to reach the ambient temperature. Gland sealing steam may be switched off and the water will gradually saturate with oxygen due to ingress of air. The ingress of air will lead also to dissolution of carbon dioxide in the condensate solution with a consequent decrease in pH. The start-up procedures are complex and vary from station to station. Generally, there are three start-up routines that may be used: hot, cold and pressure-warm cold start-up. For systems that are shut down overnight, the temperature will drop to about 70 �C and a ‘hot start-up’ will be employed. The temperature and the load will increase rapidly, reaching the operating conditions in 20 minutes to 2 hours. For systems at ambient temperature due to a longer period of shut down, e.g. a week, a ‘cold start-up’ will be used. A reduced steam flow rate causes the temperature to increase more slowly than the hot start-up, rising to the operation temperature in ~1 day and hence minimising thermal stresses between the shaft and
NPL Report MATC (A) 41
2
the case. The third approach is the ‘pressure-warm cold start’ for systems that are shut down over the weekend. This is designed to speed up the start-up process. Unlike the cold and hot start-ups, the outlet of the steam is not under vacuum during the pressure warm start-up. Therefore, the steam is under higher pressure, resulting in condensation on the metal and hence more rapid heating of the turbine owing to the more effective heat exchange between the steam and turbine components. Since the steam is wetter and there is a longer period when oxygen is present, the pressure-warm start-up presents a greater risk of pitting and cracking. Environment assisted cracking from pits Environment assisted cracking (EAC) of turbine materials often starts at corrosion pits or crevices, unless particularly high stresses are present, but predicting the life of a component in such circumstances poses significant challenges, not least to testing. In a conventional stress corrosion or corrosion fatigue test, the plain test specimen is simply exposed under the appropriate loading conditions and then tested to failure. The stresses are often high. As a consequence, the time for the pit to grow to any significant depth may be small relative to crack development and thus the impact of pitting may be underestimated. There is a need to follow the evolution of the crack from pits that are representative of those in service and to determine the corresponding growth rate. The difficulty is that pit growth in service may proceed for years before a crack initiates. Hence, controlled acceleration of the pitting process is required in testing. This usually involves a pre-pitting procedure with acceleration induced by an increase in the severity of the environment, increasing the electrode potential or raising the temperature. From the viewpoint of controlled crack monitoring, it is desirable to have one dominant pit, whose depth is controlled, and adjacent to which crack monitoring probes can be attached. An effective method of growing single pits of repeatable depth was developed by Zhou and Turnbull4 as a basis for measuring short crack growth kinetics. The emphasis on short crack growth behaviour arises because much of component life is spent in the short crack regime but extrapolation of long crack growth data may be invalid because of short crack effects including local chemistry differences and the inapplicability of long crack fracture mechanics. Variables affecting EAC in steam turbine applications A range of variables affect EAC of steam turbine materials including crack size, as just discussed, temperature, oxygen concentration, solution composition (particularly chloride concentration), pH, material properties such as yield strength, and loading conditions. Temperature The growth rate of stress corrosion cracks increases significantly with increasing temperature.5 On load, the temperature of the inlet steam is approximately 300 �C (it may vary from station to station, depending on the water treatment) and the temperature of the last row of turbines is about 50 �C. Since cracking only occurs in the presence of a liquid phase, the temperature range of concern is 60 �C - 120 �C, at and downstream of the point at which steam first condenses to form liquid water (i.e. at or downstream of the Wilson line).6 In the present study, EAC tests on disc material are being conducted at 90 �C, being typical of a temperature at which cracking might be expected and yet pragmatically easy for testing.
NPL Report MATC (A) 41
3
However, there is a particular concern in the power industry with respect to EAC of blade material at 120 �C (the temperature near the Wilson line of the steam turbine) and hence specific tests are being carried out also at this temperature. Oxygen A number of surveys have revealed a consistent relationship between the cracking incidence at plants and the presence of oxygen.6,7 Oxygen can have an important role in pitting and crack initiation. However, laboratory tests have not shown a unified consensus with respect to its impact on crack growth rate.8-15 The oxygen concentration of the inlet steam is tightly controlled at less than 5 ppb under normal operating condition. An EPRI study16 revealed that the oxygen content in the early condensate is less than 5 ppb even when the oxygen in the steam inlet is above 200 ppb. However, aeration occurs during off-loading due to the ingress of air. High oxygen content may also result from the leakage of the cooling water from heat exchangers into the turbine chamber. Correspondingly, tests in this study are being conducted with and without oxygen. Chloride Chloride is one of the most corrosive contaminants in the turbine. Chloride of a concentration of 100 ppb has a significant detrimental effect on pitting. Under normal operating conditions, the chloride level is tightly controlled at below 3 ppb.17 However, the EPRI study revealed that the chloride concentration in the early condensate is at least ten times higher than that in the inlet steam. Furthermore, the chloride in the liquid film on the disc and blade surfaces is at least ten times higher than that in the early condensate.18 In other words, under normal operation conditions where chloride in the inlet steam is controlled at below 3 ppb, the chloride in the liquid film on the disc and blade surfaces can be as high as 1 ppm. In addition, abnormal high concentrations of chloride may be present on the blade and disc surface if leakage of the cooling water occurs. pH Although the pH of the inlet steam depends on the type of water treatment, the EPRI study16 showed that there are only small variations in pH of the early condensate (pH 6.2 to 7.6 at ambient temperature). In the present work, the pH of the deaerated solutions was neutral, while the pH of the aerated solution was 5.6 – 5.8 at ambient temperature, reflecting the effect of dissociation of dissolved carbon dioxide. Yield strength The correlation between the crack growth rate and the yield strength of steels has been well established5. The crack growth rate increases with increasing yield strength. In the present study, the disc steel is 3% NiCrMoV, with a moderate yield strength for disc steels of 740 MPa. The blade steel is 12% Cr steel, with a relatively low yield strength of 860 MPa for this class of steel.
NPL Report MATC (A) 41
4
Objectives of present work �� To develop a robust test system with tight control and monitoring of water chemistry and
oxygen level. �� To assess the effect of oxygen and chloride content on long crack growth in fracture
mechanics specimens and on the growth of short cracks from pits on pre-pitted and smooth specimens.
�� To assess the impact of transient variations in stress on the growth rate of long cracks of blade and disc steels using fracture mechanics specimens.
In view of the long term nature of the testing, preliminary results are reported only for the long crack growth study. Nevertheless, the full range of testing undertaken is described.
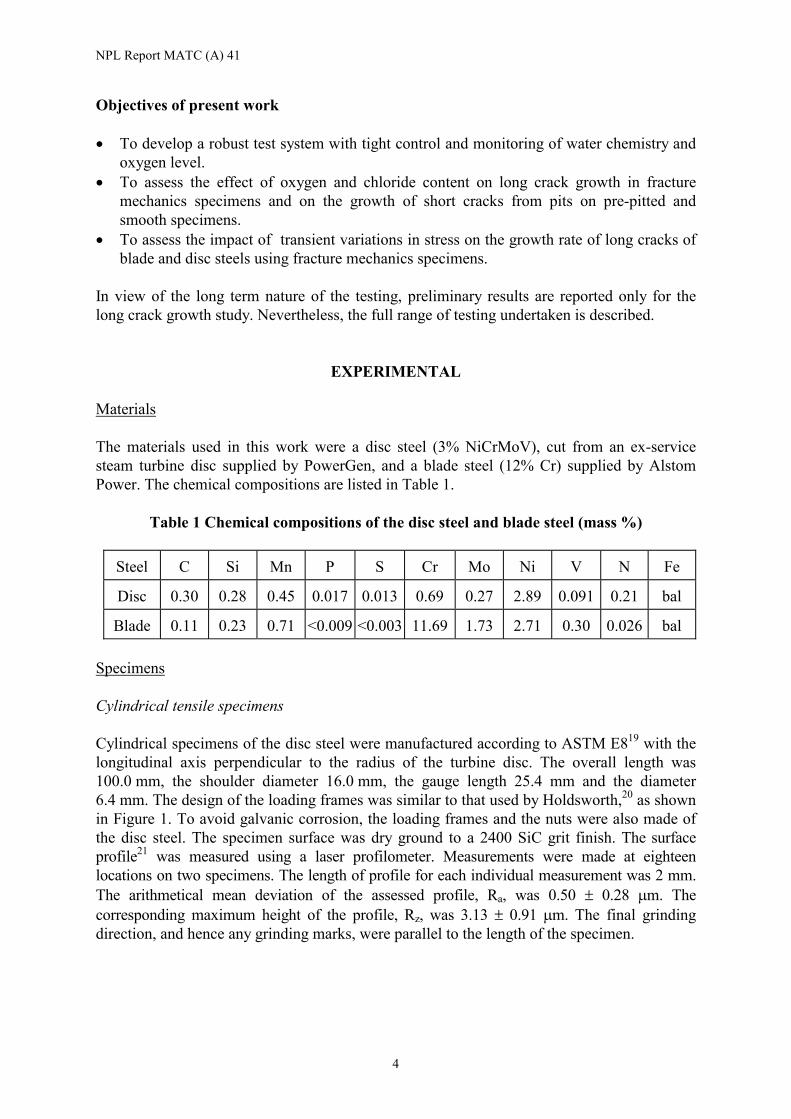
EXPERIMENTAL Materials The materials used in this work were a disc steel (3% NiCrMoV), cut from an ex-service steam turbine disc supplied by PowerGen, and a blade steel (12% Cr) supplied by Alstom Power. The chemical compositions are listed in Table 1.
Table 1 Chemical compositions of the disc steel and blade steel (mass %)
Steel C Si Mn P S Cr Mo Ni V N Fe
Disc 0.30 0.28 0.45 0.017 0.013 0.69 0.27 2.89 0.091 0.21 bal
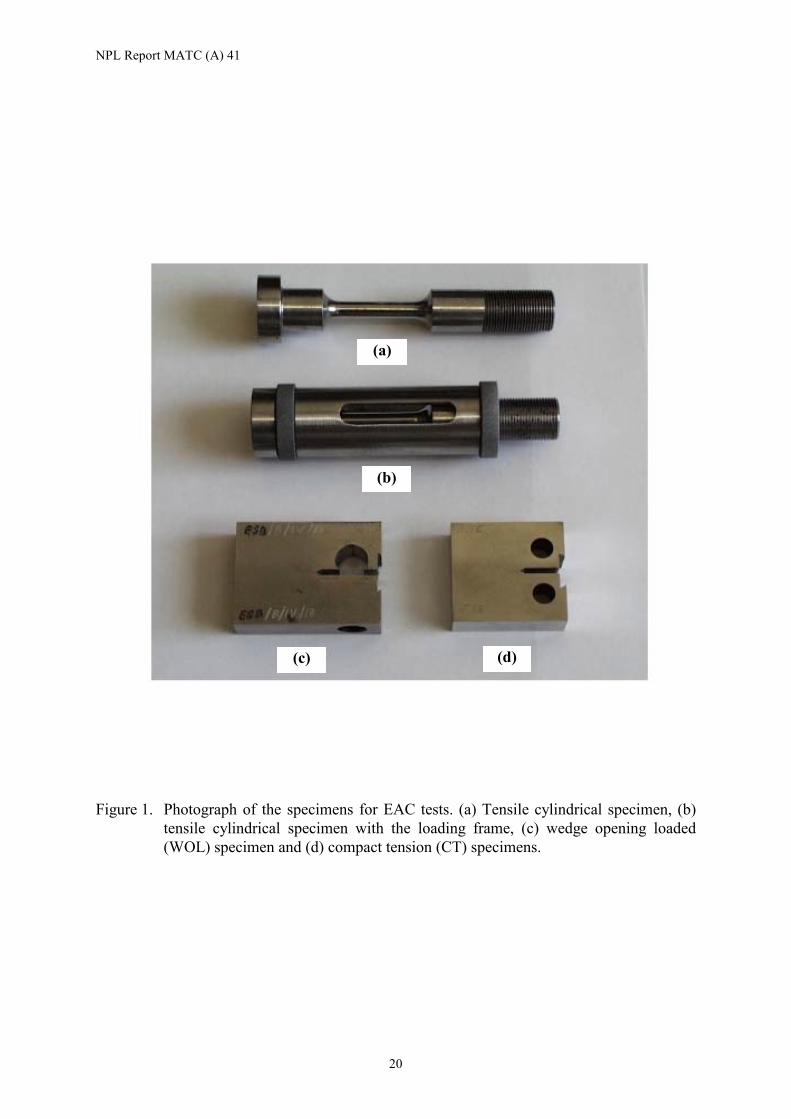
Blade 0.11 0.23 0.71 <0.009 <0.003 11.69 1.73 2.71 0.30 0.026 bal Specimens Cylindrical tensile specimens Cylindrical specimens of the disc steel were manufactured according to ASTM E819 with the longitudinal axis perpendicular to the radius of the turbine disc. The overall length was 100.0 mm, the shoulder diameter 16.0 mm, the gauge length 25.4 mm and the diameter 6.4 mm. The design of the loading frames was similar to that used by Holdsworth,20 as shown in Figure 1. To avoid galvanic corrosion, the loading frames and the nuts were also made of the disc steel. The specimen surface was dry ground to a 2400 SiC grit finish. The surface profile21 was measured using a laser profilometer. Measurements were made at eighteen locations on two specimens. The length of profile for each individual measurement was 2 mm. The arithmetical mean deviation of the assessed profile, Ra, was 0.50 � 0.28 �m. The corresponding maximum height of the profile, Rz, was 3.13 � 0.91 �m. The final grinding direction, and hence any grinding marks, were parallel to the length of the specimen.
NPL Report MATC (A) 41
5
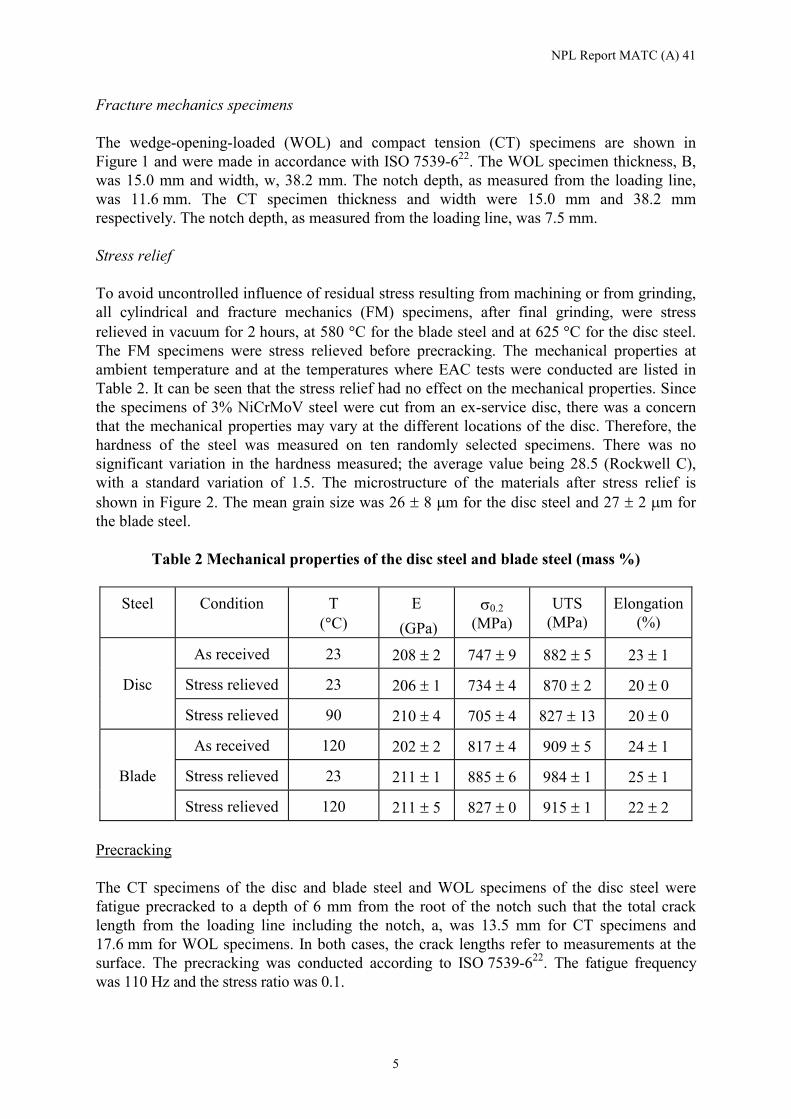
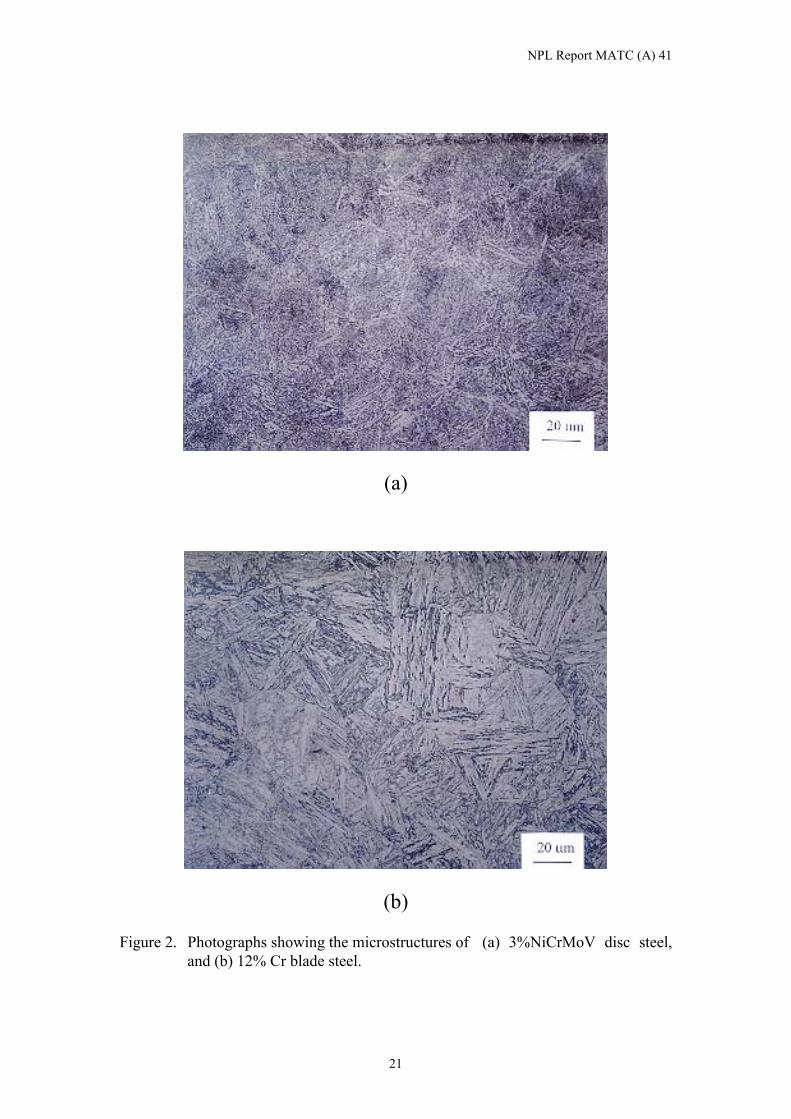
Fracture mechanics specimens The wedge-opening-loaded (WOL) and compact tension (CT) specimens are shown in Figure 1 and were made in accordance with ISO 7539-622. The WOL specimen thickness, B, was 15.0 mm and width, w, 38.2 mm. The notch depth, as measured from the loading line, was 11.6 mm. The CT specimen thickness and width were 15.0 mm and 38.2 mm respectively. The notch depth, as measured from the loading line, was 7.5 mm. Stress relief To avoid uncontrolled influence of residual stress resulting from machining or from grinding, all cylindrical and fracture mechanics (FM) specimens, after final grinding, were stress relieved in vacuum for 2 hours, at 580 �C for the blade steel and at 625 �C for the disc steel. The FM specimens were stress relieved before precracking. The mechanical properties at ambient temperature and at the temperatures where EAC tests were conducted are listed in Table 2. It can be seen that the stress relief had no effect on the mechanical properties. Since the specimens of 3% NiCrMoV steel were cut from an ex-service disc, there was a concern that the mechanical properties may vary at the different locations of the disc. Therefore, the hardness of the steel was measured on ten randomly selected specimens. There was no significant variation in the hardness measured; the average value being 28.5 (Rockwell C), with a standard variation of 1.5. The microstructure of the materials after stress relief is shown in Figure 2. The mean grain size was 26 � 8 �m for the disc steel and 27 � 2 �m for the blade steel.
Table 2 Mechanical properties of the disc steel and blade steel (mass %)
Steel Condition T (�C)
E (GPa)
�0.2 (MPa)
UTS (MPa)
Elongation (%)
As received 23 208 � 2 747 � 9 882 � 5 23 � 1
Disc Stress relieved 23 206 � 1 734 � 4 870 � 2 20 � 0
Stress relieved 90 210 � 4 705 � 4 827 � 13 20 � 0
As received 120 202 � 2 817 � 4 909 � 5 24 � 1
Blade Stress relieved 23 211 � 1 885 � 6 984 � 1 25 � 1
Stress relieved 120 211 � 5 827 � 0 915 � 1 22 � 2 Precracking The CT specimens of the disc and blade steel and WOL specimens of the disc steel were fatigue precracked to a depth of 6 mm from the root of the notch such that the total crack length from the loading line including the notch, a, was 13.5 mm for CT specimens and 17.6 mm for WOL specimens. In both cases, the crack lengths refer to measurements at the surface. The precracking was conducted according to ISO 7539-622. The fatigue frequency was 110 Hz and the stress ratio was 0.1.
NPL Report MATC (A) 41
6
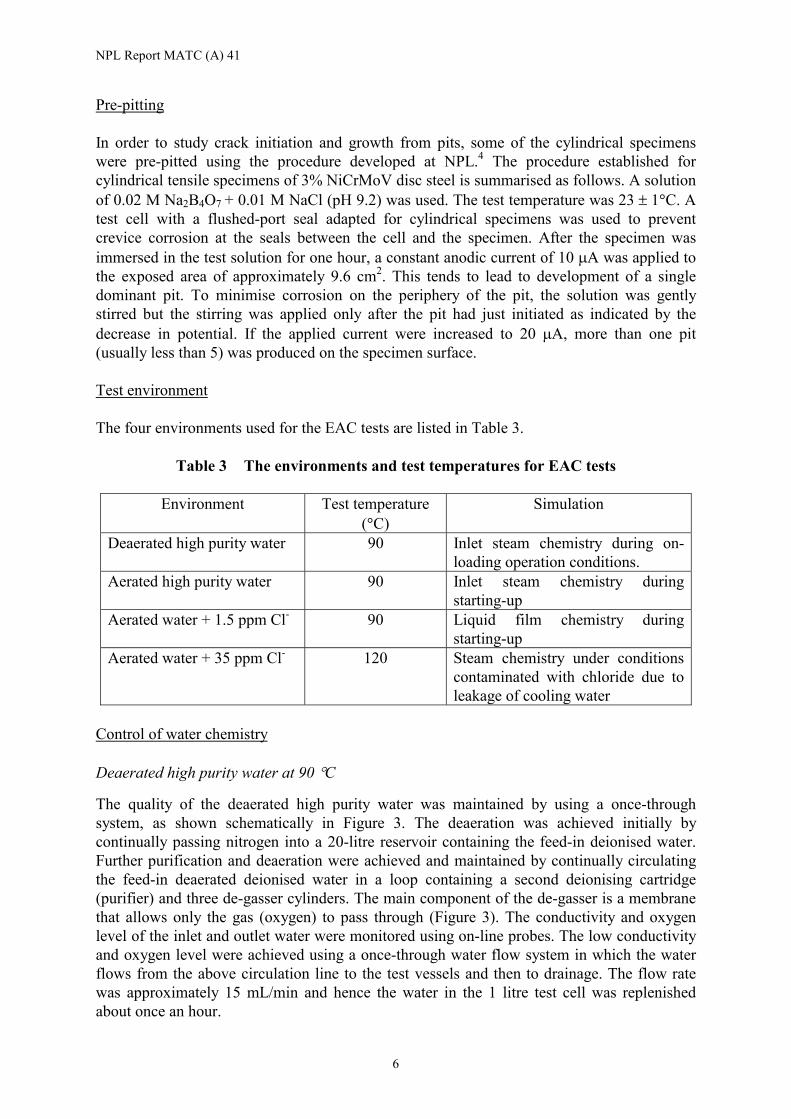
Pre-pitting In order to study crack initiation and growth from pits, some of the cylindrical specimens were pre-pitted using the procedure developed at NPL.4 The procedure established for cylindrical tensile specimens of 3% NiCrMoV disc steel is summarised as follows. A solution of 0.02 M Na2B4O7 + 0.01 M NaCl (pH 9.2) was used. The test temperature was 23 � 1�C. A test cell with a flushed-port seal adapted for cylindrical specimens was used to prevent crevice corrosion at the seals between the cell and the specimen. After the specimen was immersed in the test solution for one hour, a constant anodic current of 10 �A was applied to the exposed area of approximately 9.6 cm2. This tends to lead to development of a single dominant pit. To minimise corrosion on the periphery of the pit, the solution was gently stirred but the stirring was applied only after the pit had just initiated as indicated by the decrease in potential. If the applied current were increased to 20 �A, more than one pit (usually less than 5) was produced on the specimen surface. Test environment The four environments used for the EAC tests are listed in Table 3.
Table 3 The environments and test temperatures for EAC tests
Environment Test temperature (�C)
Simulation
Deaerated high purity water 90 Inlet steam chemistry during on-loading operation conditions.
Aerated high purity water 90 Inlet steam chemistry during starting-up
Aerated water + 1.5 ppm Cl- 90 Liquid film chemistry during starting-up
Aerated water + 35 ppm Cl- 120 Steam chemistry under conditions contaminated with chloride due to leakage of cooling water
Control of water chemistry Deaerated high purity water at 90 �C
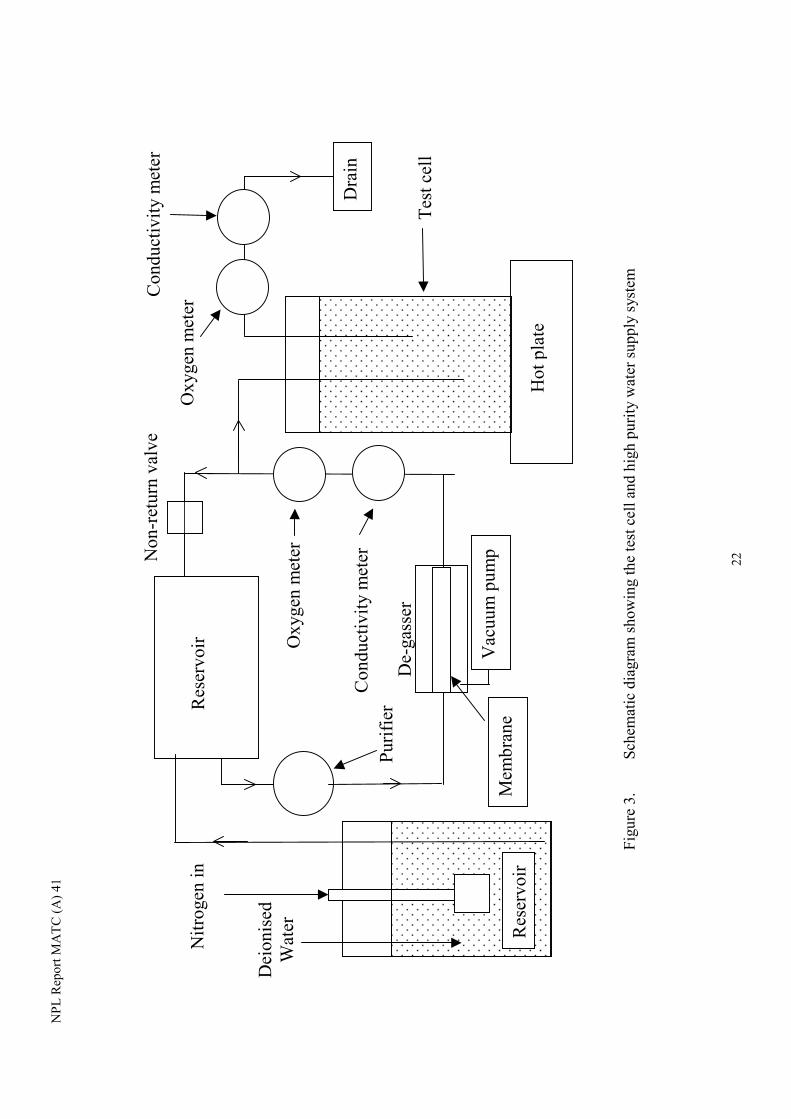
The quality of the deaerated high purity water was maintained by using a once-through system, as shown schematically in Figure 3. The deaeration was achieved initially by continually passing nitrogen into a 20-litre reservoir containing the feed-in deionised water. Further purification and deaeration were achieved and maintained by continually circulating the feed-in deaerated deionised water in a loop containing a second deionising cartridge (purifier) and three de-gasser cylinders. The main component of the de-gasser is a membrane that allows only the gas (oxygen) to pass through (Figure 3). The conductivity and oxygen level of the inlet and outlet water were monitored using on-line probes. The low conductivity and oxygen level were achieved using a once-through water flow system in which the water flows from the above circulation line to the test vessels and then to drainage. The flow rate was approximately 15 mL/min and hence the water in the 1 litre test cell was replenished about once an hour.
NPL Report MATC (A) 41
7
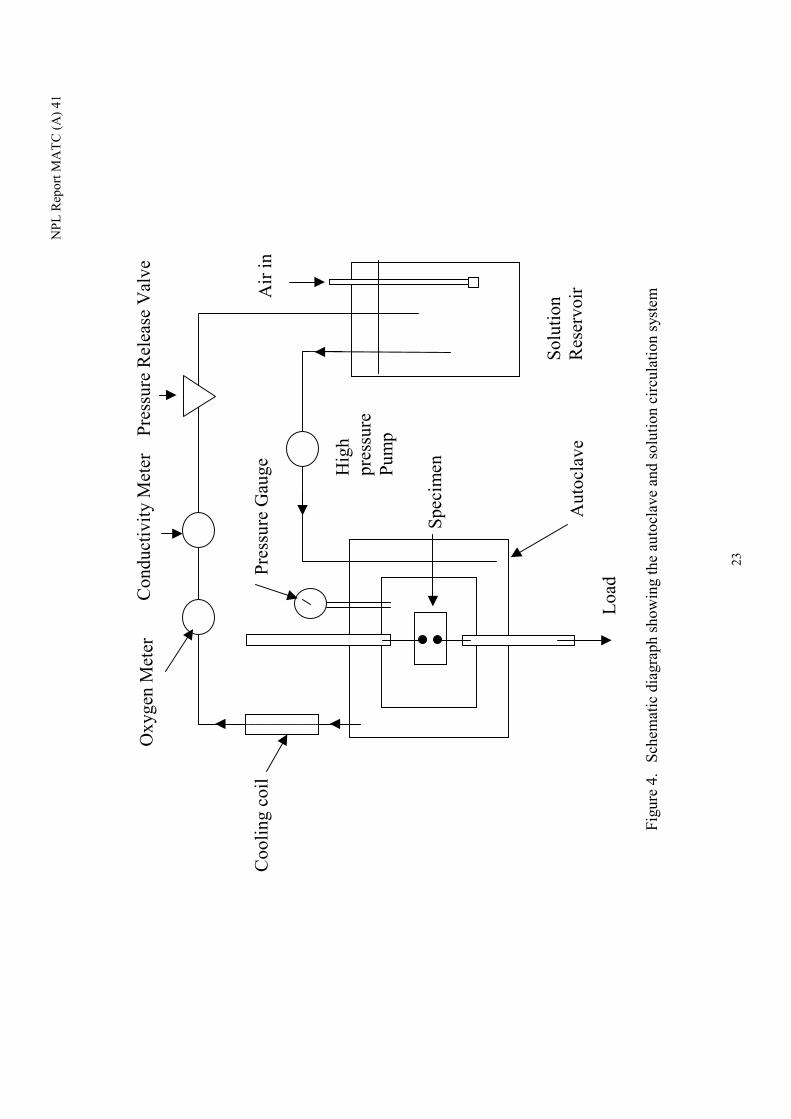
Aerated high purity water at 90 �C A once-through system, similar to that shown in Figure 3, was also used for tests in aerated high purity water but in this case the inlet water was aerated using an air pump. The flow rate was also approximately 15 mL/min. Aerated water containing 35 ppm Cl- at 120 �C The solution circulation loop used for tests in aerated water containing 35 ppm Cl- is shown in Figure 4. As tests were conducted in an autoclave at 120 �C, the system was pressurised at 0.6 MPa. The feed-in solution was provided from a 22-litre reservoir using a pressurised pump and the pressure was controlled using a pressure release valve. As the autoclave has a larger capacity (1.4 litre) than the 1 litre reaction vessel for the tests at 90 �C, a higher flow rate of 20 mL/min was used to maintain the same rate of solution refreshment of about once an hour. The solution in the reservoir was refreshed every week and the conductivity and pH were measured before and after the solution change. Aerated water containing 1.5 ppm Cl- at 90 �C The solution circulation loop for aerated water containing 1.5 ppm Cl- was similar to that shown in Figure 4. However, as the tests were conducted at 90 �C, the system was not pressurised. The flow rate was approximately 15 mL/min and hence the solution in the 1 litre test cell was replenished approximately once an hour. The solution in the 40-litre reservoir was refreshed every week and the conductivity and pH were measured before and after the solution change. Corrosion potential measurement For all the EAC tests conducted at 90 �C the corrosion potentials were measured at weekly intervals using an external 0.01N Ag/AgCl reference electrode specially designed with an extremely low chloride diffusion rate. The reference electrode was connected to the test cell through a glass bridge filled with the test solution. The reference electrode chamber and the test cell were separated with a glass valve, which was closed except when the measurements were taken. The solution conductivity was monitored to ensure that there was no significant chloride contamination due to the diffusion of chloride from the reference electrode chamber to the test cell. For the potential measurement in deaerated high purity water, the reference electrode chamber is also deaerated. The reference electrode remained at ambient temperature. All potentials quoted were converted to the saturated calomel electrode (SCE). The corrosion potential of the blade steel, for which tests are conducted in an autoclave at 120 �C, was not measured with a standard reference electrode. The high temperature reference electrodes developed problems in measurement. Instead, a wire of the same material as the specimen was placed in the autoclave, acting as a nominal ‘reference electrode’. New systems are presently being tested.
NPL Report MATC (A) 41
8
Test set-up Self-loaded cylindrical tensile specimens of disc steels 35 self-loaded cylindrical tensile specimens of disc steel are being used. 16 of the specimens were smooth (without pre-pitting), 7 specimens with a single pit and 12 specimens with multiple pits. The depth and the surface width of the pit were measured using a travelling microscope (resolution 1 �m). In the latter case, the maximum width in one direction was measured and the width perpendicular to this was measured also. The locations of the pits were mapped out before testing so that the surface of the tested specimen could subsequently be examined to determine the characteristics of the pits from which cracks did or did not initiate. Pits have been often treated as sharp cracks in the attempts to establish the threshold stress intensity for short crack initiation.6 Previous work on fatigue of a turbine blade steel has demonstrated that pits act as effective cracks of the same depth provided that a short crack model is used, i.e. the stress intensity factor can be calculated by treating the pits as short cracks and using the relationship of EL Haddad23-25: K a a� ��� � ( )0 (1) where K is the stress intensity factor, � is the stress, a is the pit depth, a0 is a constant and � is a geometry factor. � is approximated by 0.6726-28 by treating the pits as semi-circular surface cracks. It should be noted that the pit mouth is not ideally circular and that the pit geometry is not strictly hemispherical.4 There is a large variation in the aspect ratio, which varies from 0.28 to 0.40, reflecting a dependence of pit geometry on the shape of the inclusion from which the pit initiated. The shape of pits on the stress corrosion specimens will be studied further on the fractured surface of the specimens after the stress corrosion tests have been completed. The parameter, a0, is essentially a fitting parameter in equation (1) and its physical meaning is not well understood. It has been reported6 that the KISCC of the disc steels is between 5.6 MPa m1/2 and 11.5 MPa m1/2 for short cracks initiated from pits and/or corrosion trenches in simulated steam turbine environments. Hence, using Equation (1) to define K, all specimens were loaded to 634.5 MPa, i.e. 90% of the �0.2 at the test temperature (90 �C), so that the initial stress intensity factor for the pre-pitted specimens lay in this range of stress intensity factors. In order to prevent possible stress relaxation as the specimen and the loading frame are heated to the test temperature, all specimens were loaded at 90 � 1 �C with the specimen and the loading frame placed in a temperature-controlled oven. The loaded specimens were then cooled down and stored in a dessicator for at least 24 hours before placing in the test cell. For each environment, the specimens were distributed in three different test cells of 1 litre capacity so that specimens could be removed and examined at different test intervals without affecting the remaining specimens. After placing the specimens in the cells, the test solution was introduced and the test temperature increased gradually to 90 �C in about three hours. For deaerated high purity water, the test cells were purged with nitrogen for 4 hours before the solution was introduced.
NPL Report MATC (A) 41
9
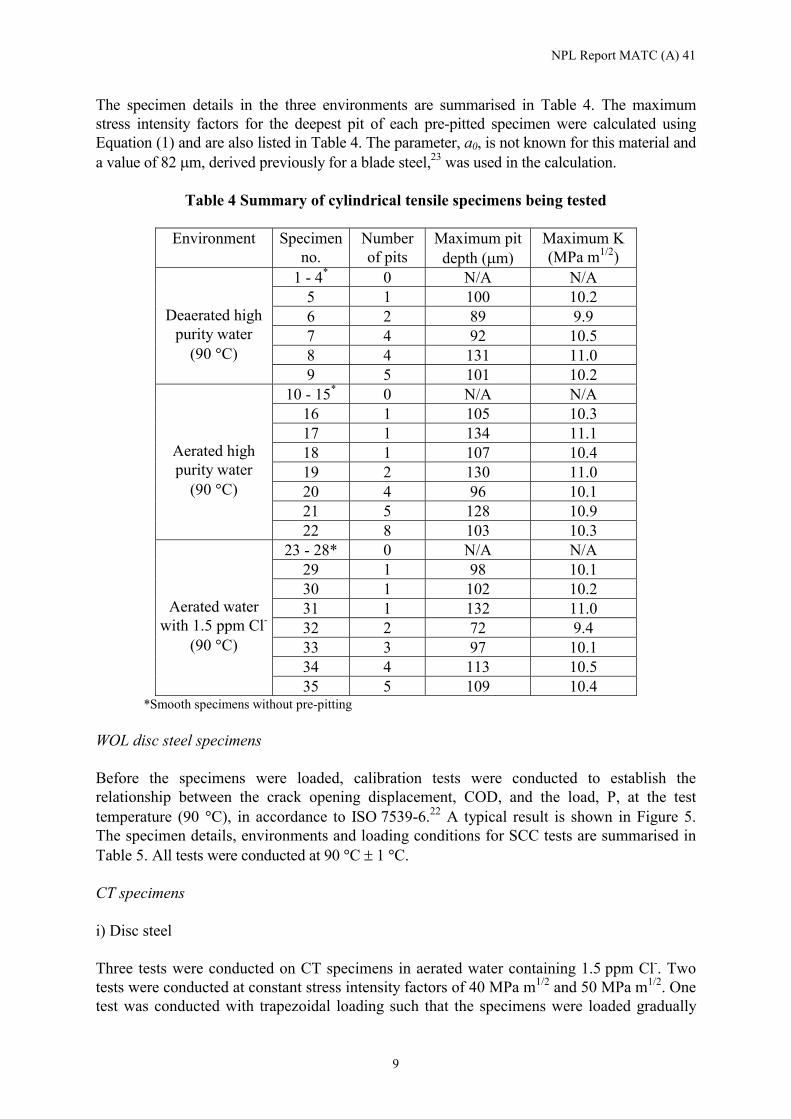
The specimen details in the three environments are summarised in Table 4. The maximum stress intensity factors for the deepest pit of each pre-pitted specimen were calculated using Equation (1) and are also listed in Table 4. The parameter, a0, is not known for this material and a value of 82 �m, derived previously for a blade steel,23 was used in the calculation.
Table 4 Summary of cylindrical tensile specimens being tested
Environment Specimen no.
Number of pits
Maximum pit depth (�m)
Maximum K (MPa m1/2)
1 - 4* 0 N/A N/A 5 1 100 10.2 6 2 89 9.9 7 4 92 10.5 8 4 131 11.0
Deaerated high purity water
(90 �C) 9 5 101 10.2
10 - 15* 0 N/A N/A 16 1 105 10.3 17 1 134 11.1 18 1 107 10.4 19 2 130 11.0 20 4 96 10.1 21 5 128 10.9
Aerated high purity water
(90 �C)
22 8 103 10.3 23 - 28* 0 N/A N/A
29 1 98 10.1 30 1 102 10.2 31 1 132 11.0 32 2 72 9.4 33 3 97 10.1 34 4 113 10.5
Aerated water with 1.5 ppm Cl-
(90 �C)
35 5 109 10.4 *Smooth specimens without pre-pitting
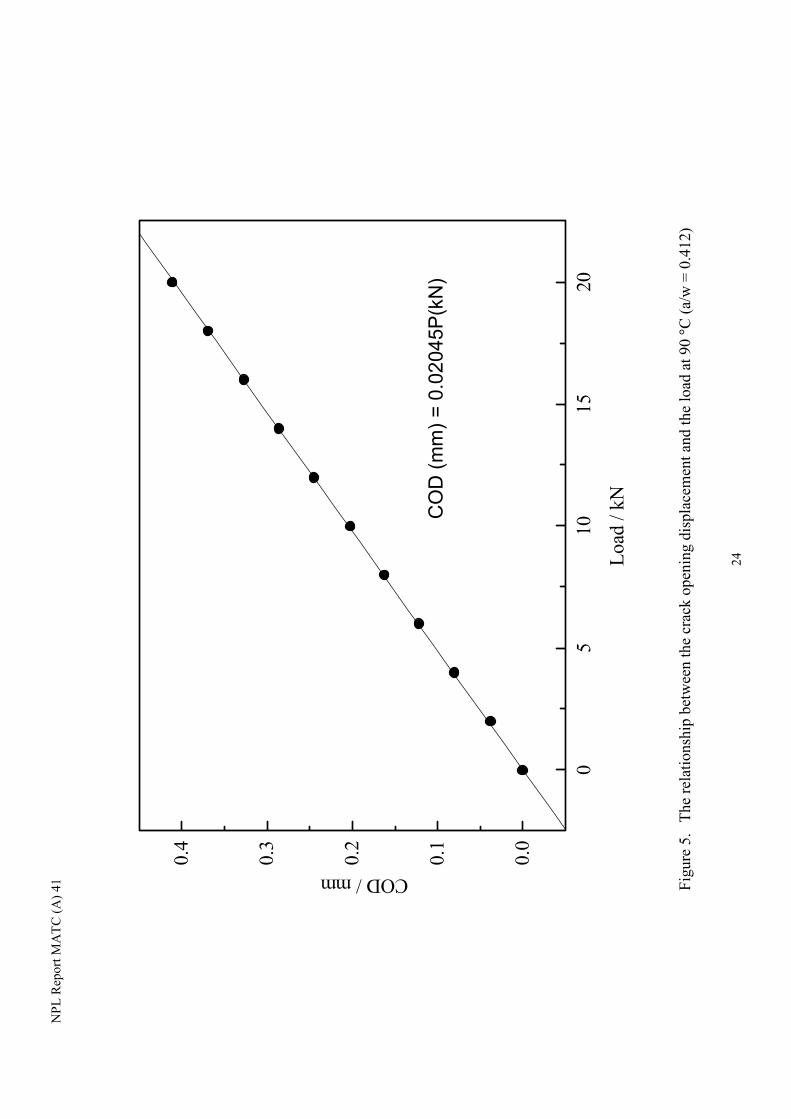
WOL disc steel specimens Before the specimens were loaded, calibration tests were conducted to establish the relationship between the crack opening displacement, COD, and the load, P, at the test temperature (90 �C), in accordance to ISO 7539-6.22 A typical result is shown in Figure 5. The specimen details, environments and loading conditions for SCC tests are summarised in Table 5. All tests were conducted at 90 �C � 1 �C.
CT specimens i) Disc steel Three tests were conducted on CT specimens in aerated water containing 1.5 ppm Cl-. Two tests were conducted at constant stress intensity factors of 40 MPa m1/2 and 50 MPa m1/2. One test was conducted with trapezoidal loading such that the specimens were loaded gradually
NPL Report MATC (A) 41
10
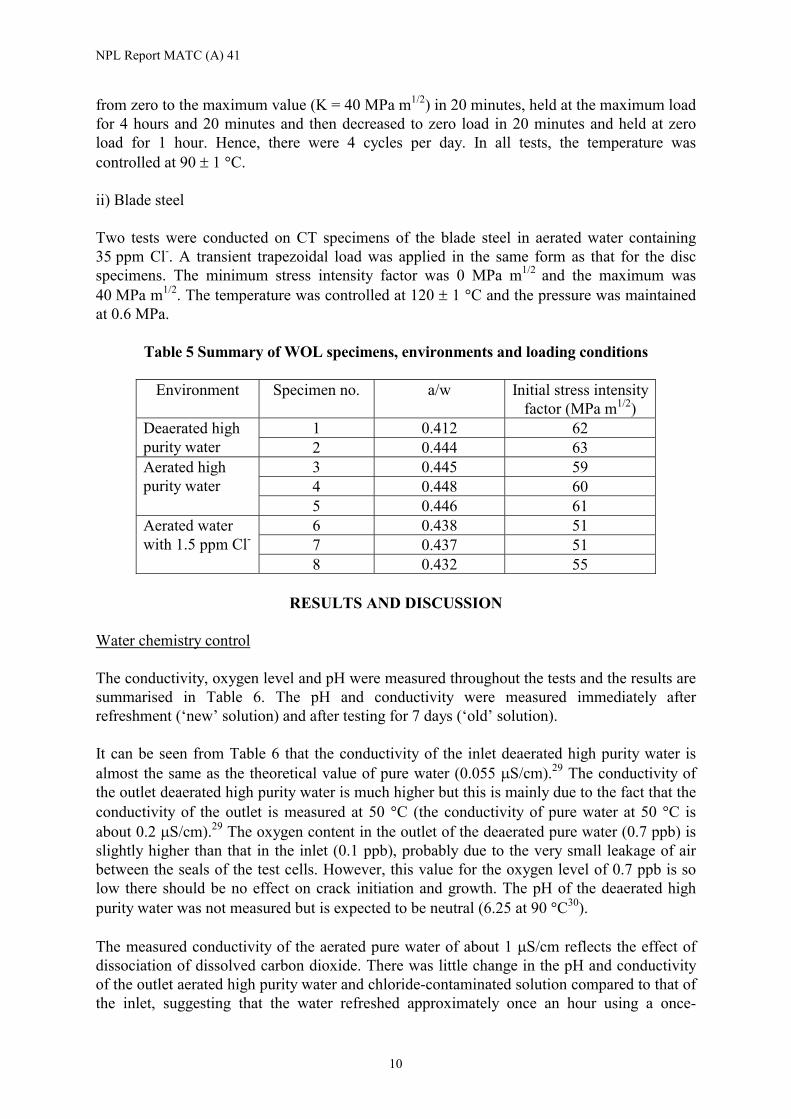
from zero to the maximum value (K = 40 MPa m1/2) in 20 minutes, held at the maximum load for 4 hours and 20 minutes and then decreased to zero load in 20 minutes and held at zero load for 1 hour. Hence, there were 4 cycles per day. In all tests, the temperature was controlled at 90 � 1 �C. ii) Blade steel Two tests were conducted on CT specimens of the blade steel in aerated water containing 35 ppm Cl-. A transient trapezoidal load was applied in the same form as that for the disc specimens. The minimum stress intensity factor was 0 MPa m1/2 and the maximum was 40 MPa m1/2. The temperature was controlled at 120 � 1 �C and the pressure was maintained at 0.6 MPa.
Table 5 Summary of WOL specimens, environments and loading conditions
Environment Specimen no. a/w Initial stress intensity factor (MPa m1/2)
1 0.412 62 Deaerated high purity water 2 0.444 63
3 0.445 59 4 0.448 60
Aerated high purity water
5 0.446 61 6 0.438 51 7 0.437 51
Aerated water with 1.5 ppm Cl-
8 0.432 55
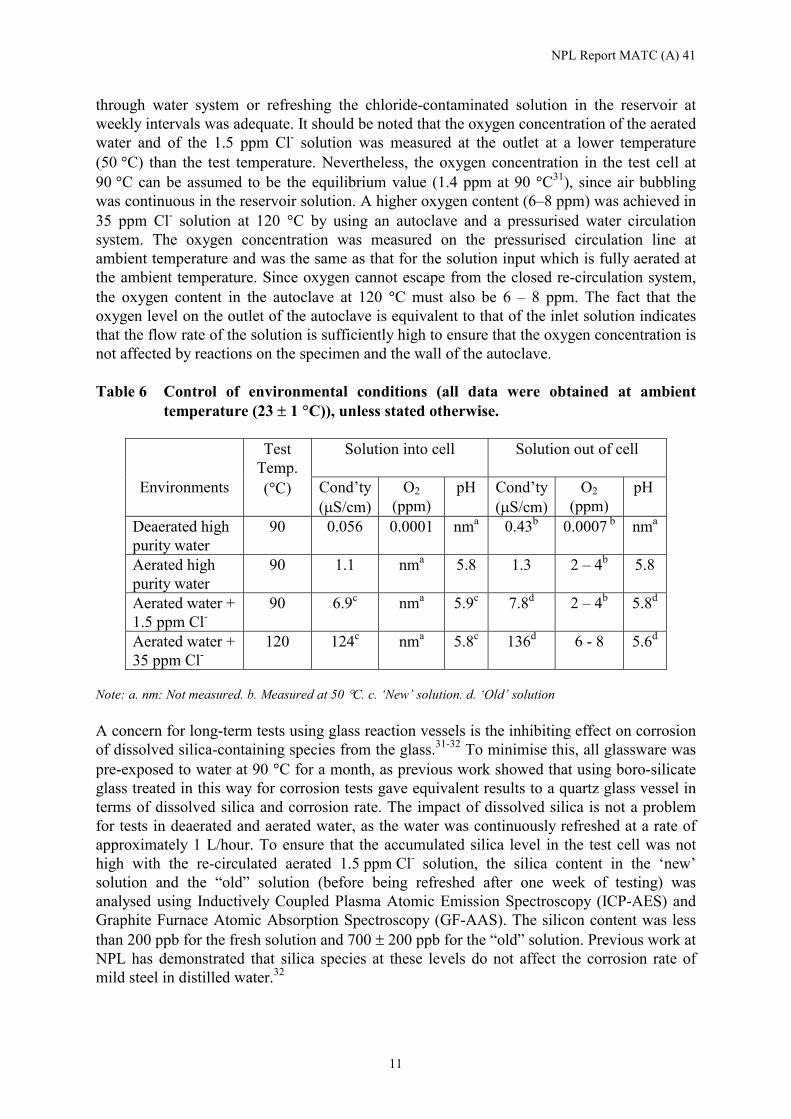
RESULTS AND DISCUSSION Water chemistry control The conductivity, oxygen level and pH were measured throughout the tests and the results are summarised in Table 6. The pH and conductivity were measured immediately after refreshment (‘new’ solution) and after testing for 7 days (‘old’ solution). It can be seen from Table 6 that the conductivity of the inlet deaerated high purity water is almost the same as the theoretical value of pure water (0.055 �S/cm).29 The conductivity of the outlet deaerated high purity water is much higher but this is mainly due to the fact that the conductivity of the outlet is measured at 50 �C (the conductivity of pure water at 50 �C is about 0.2 �S/cm).29 The oxygen content in the outlet of the deaerated pure water (0.7 ppb) is slightly higher than that in the inlet (0.1 ppb), probably due to the very small leakage of air between the seals of the test cells. However, this value for the oxygen level of 0.7 ppb is so low there should be no effect on crack initiation and growth. The pH of the deaerated high purity water was not measured but is expected to be neutral (6.25 at 90 �C30). The measured conductivity of the aerated pure water of about 1 �S/cm reflects the effect of dissociation of dissolved carbon dioxide. There was little change in the pH and conductivity of the outlet aerated high purity water and chloride-contaminated solution compared to that of the inlet, suggesting that the water refreshed approximately once an hour using a once-
NPL Report MATC (A) 41
11
through water system or refreshing the chloride-contaminated solution in the reservoir at weekly intervals was adequate. It should be noted that the oxygen concentration of the aerated water and of the 1.5 ppm Cl- solution was measured at the outlet at a lower temperature (50 �C) than the test temperature. Nevertheless, the oxygen concentration in the test cell at 90 �C can be assumed to be the equilibrium value (1.4 ppm at 90 �C31), since air bubbling was continuous in the reservoir solution. A higher oxygen content (6–8 ppm) was achieved in 35 ppm Cl- solution at 120 �C by using an autoclave and a pressurised water circulation system. The oxygen concentration was measured on the pressurised circulation line at ambient temperature and was the same as that for the solution input which is fully aerated at the ambient temperature. Since oxygen cannot escape from the closed re-circulation system, the oxygen content in the autoclave at 120 �C must also be 6 – 8 ppm. The fact that the oxygen level on the outlet of the autoclave is equivalent to that of the inlet solution indicates that the flow rate of the solution is sufficiently high to ensure that the oxygen concentration is not affected by reactions on the specimen and the wall of the autoclave. Table 6 Control of environmental conditions (all data were obtained at ambient
temperature (23 � 1 �C)), unless stated otherwise.
Test Temp.
Solution into cell Solution out of cell
Environments (�C) Cond’ty (�S/cm)
O2 (ppm)
pH Cond’ty (�S/cm)
O2 (ppm)
pH
Deaerated high purity water
90 0.056 0.0001 nma 0.43b 0.0007 b nma
Aerated high purity water
90 1.1 nma 5.8 1.3 2 – 4b 5.8
Aerated water + 1.5 ppm Cl-
90 6.9c nma 5.9c 7.8d 2 – 4b 5.8d
Aerated water + 35 ppm Cl-
120 124c nma 5.8c 136d 6 - 8 5.6d
Note: a. nm: Not measured. b. Measured at 50��C. c. ‘New’ solution. d. ‘Old’ solution A concern for long-term tests using glass reaction vessels is the inhibiting effect on corrosion of dissolved silica-containing species from the glass.31-32 To minimise this, all glassware was pre-exposed to water at 90 �C for a month, as previous work showed that using boro-silicate glass treated in this way for corrosion tests gave equivalent results to a quartz glass vessel in terms of dissolved silica and corrosion rate. The impact of dissolved silica is not a problem for tests in deaerated and aerated water, as the water was continuously refreshed at a rate of approximately 1 L/hour. To ensure that the accumulated silica level in the test cell was not high with the re-circulated aerated 1.5 ppm Cl- solution, the silica content in the ‘new’ solution and the “old” solution (before being refreshed after one week of testing) was analysed using Inductively Coupled Plasma Atomic Emission Spectroscopy (ICP-AES) and Graphite Furnace Atomic Absorption Spectroscopy (GF-AAS). The silicon content was less than 200 ppb for the fresh solution and 700 � 200 ppb for the “old” solution. Previous work at NPL has demonstrated that silica species at these levels do not affect the corrosion rate of mild steel in distilled water.32
NPL Report MATC (A) 41
12
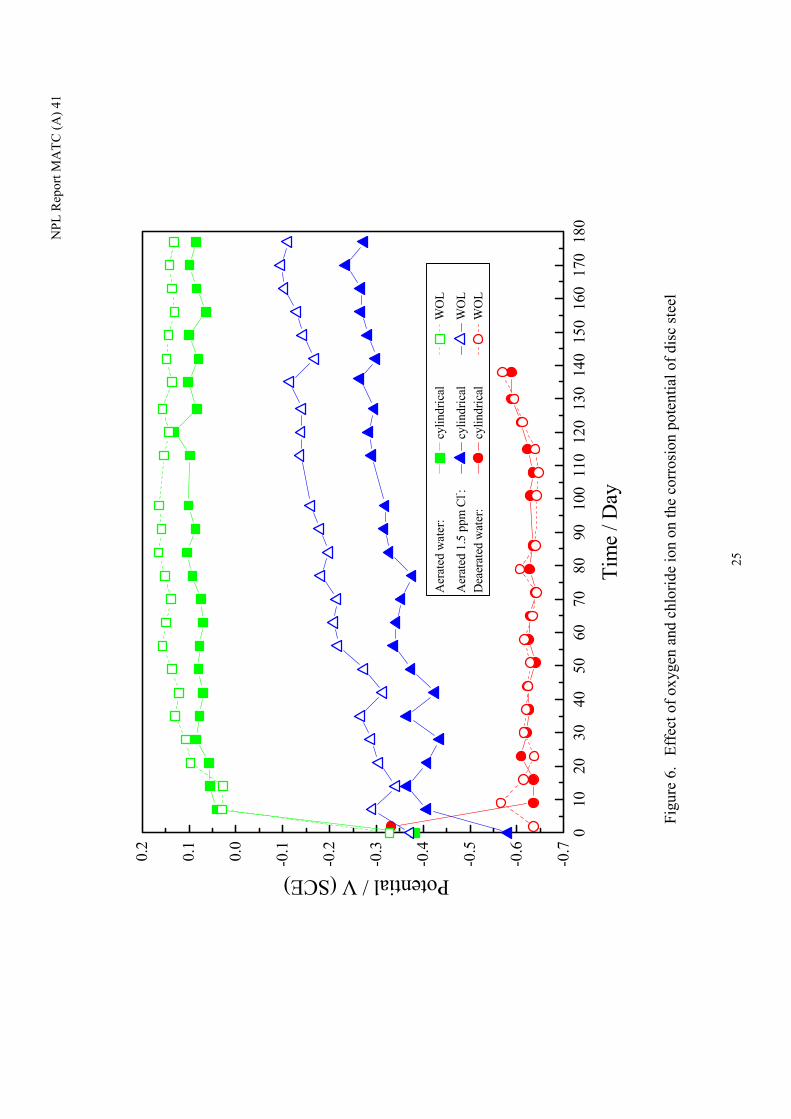
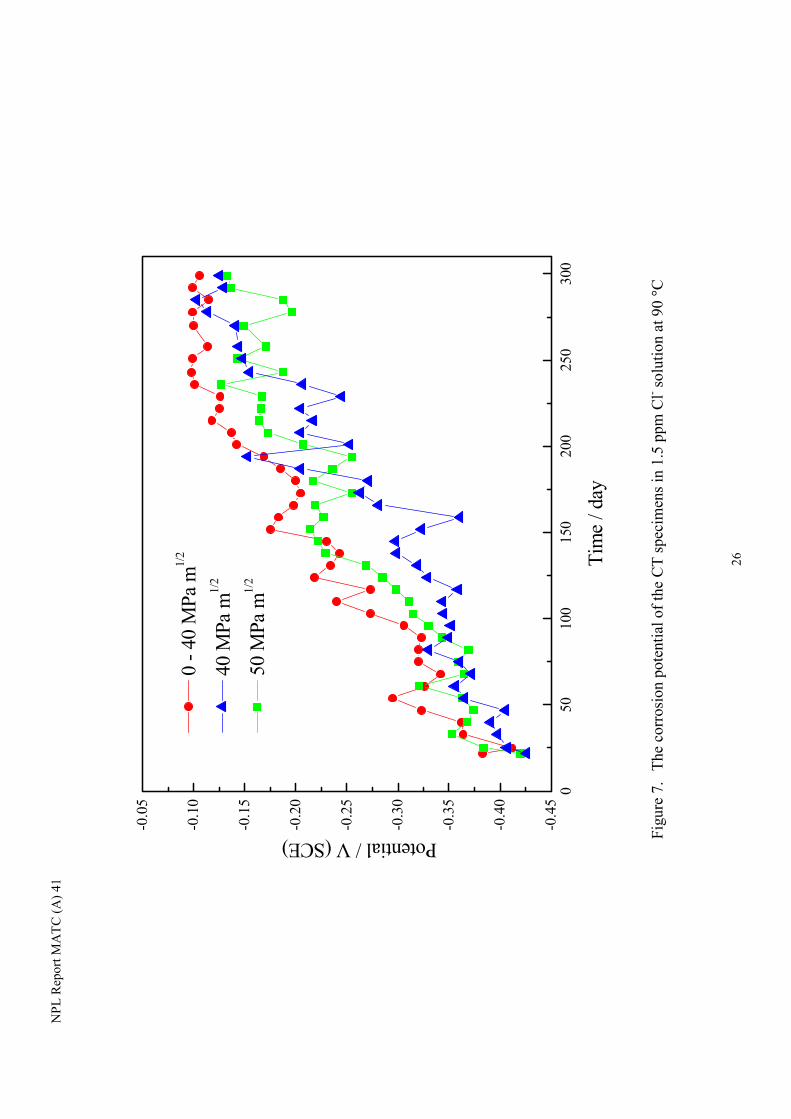
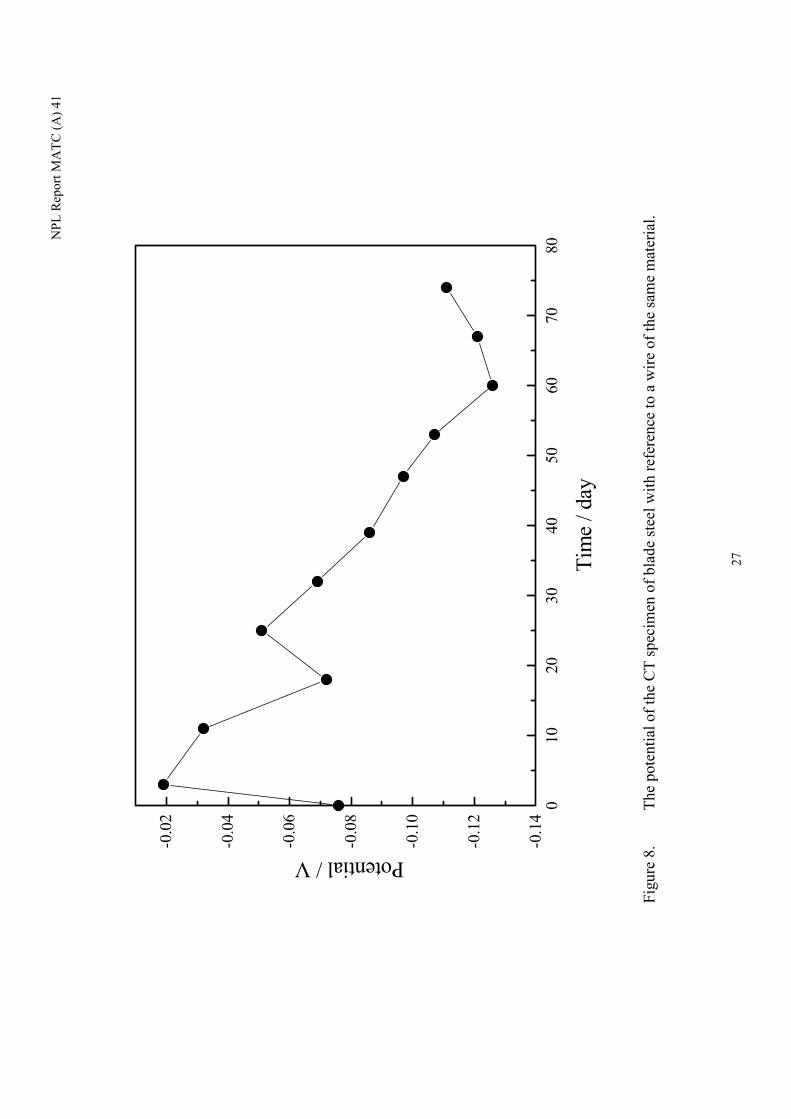
Effect of oxygen and chloride ion on the corrosion potential The corrosion potential of all specimens was measured and there was little variation for the same type of specimens in the same environment, with the spread being less than 0.05 V. Typical values for the cylindrical and WOL specimens of the disc steel in the three test environments at 90 �C are shown in Figure 6. The corrosion potential of the smooth and pre-pitted specimens were similar, suggesting that either the pre-generated pits deactivated or pits formed quickly on the smooth specimens. The corrosion potential of the disc steel in deaerated high purity water stabilised relatively quickly at approximately –0.60 V (SCE). Such a potential in deaerated solution suggests film formation, as separate measurements showed that the potential was about –0.76 V (SCE) in deaerated 0.1M NaCl at 90 �C. When viewed in-situ, a shiny black film, probably magnetite, could be seen on the specimen surface. The corrosion potential of the disc steel in aerated pure water reached a value above 0.0 V (SCE) within a few days, suggesting that the steel is easily passivated in the presence of oxygen. There was little general corrosion on the surface. When chloride was present in the aerated solution, the corrosion potential increased more slowly and attained a lower potential than the chloride-free environment. When viewed in-situ, brown corrosion products covered the specimen surface. Without prematurely removing the specimens, the extent of pit activity could not be assessed. The lower potential for the cylindrical specimen, relative to the WOL specimen, is a concern as lower values can be indicative of some degree of crevice attack between the loading frame and the specimen. On completion of the tests, careful examination will be undertaken as this would have implication not only for the present test work but also for all such test systems under these environmental conditions. The corrosion potentials of the CT specimens of the disc steel (Figure 7) were similar to those of the WOL specimens (Figure 6), although the time-evolution of the potential is more gradual. Despite the variability in the data, the general trend is that the potential increases with time and reaches a reasonably stable value of about -0.12 V (SCE) after 250 days, indicating gradual film formation on the surface. The change of the corrosion potential over such a long period of time has implications for testing as the electrochemical driving force will be changing with time. Indeed, it is feasible that initiation of a stress corrosion crack from the precrack may not occur until a ‘critical’ potential is achieved. Further work using in-situ crack depth measurement with high resolution is required to establish whether there are correlations between the corrosion potential, crack initiation and growth rate. As described earlier, the potential of the blade specimen was measured against that of a wire of the same material, as shown in Figure 8. It can be seen that although the potential of the specimen was more negative than that of the ‘reference’ electrode, the reduction was not dramatic although still significant. Since there is a crack in the CT specimen, a lower potential might be expected. However, on removal of the specimen there was evidence of crevice corrosion between the specimen and washers at the region where the specimen had been contacted with the grip and this may be responsible for the decrease in potential. It highlights the need for proper electrode potential measurement in all tests.
NPL Report MATC (A) 41
13
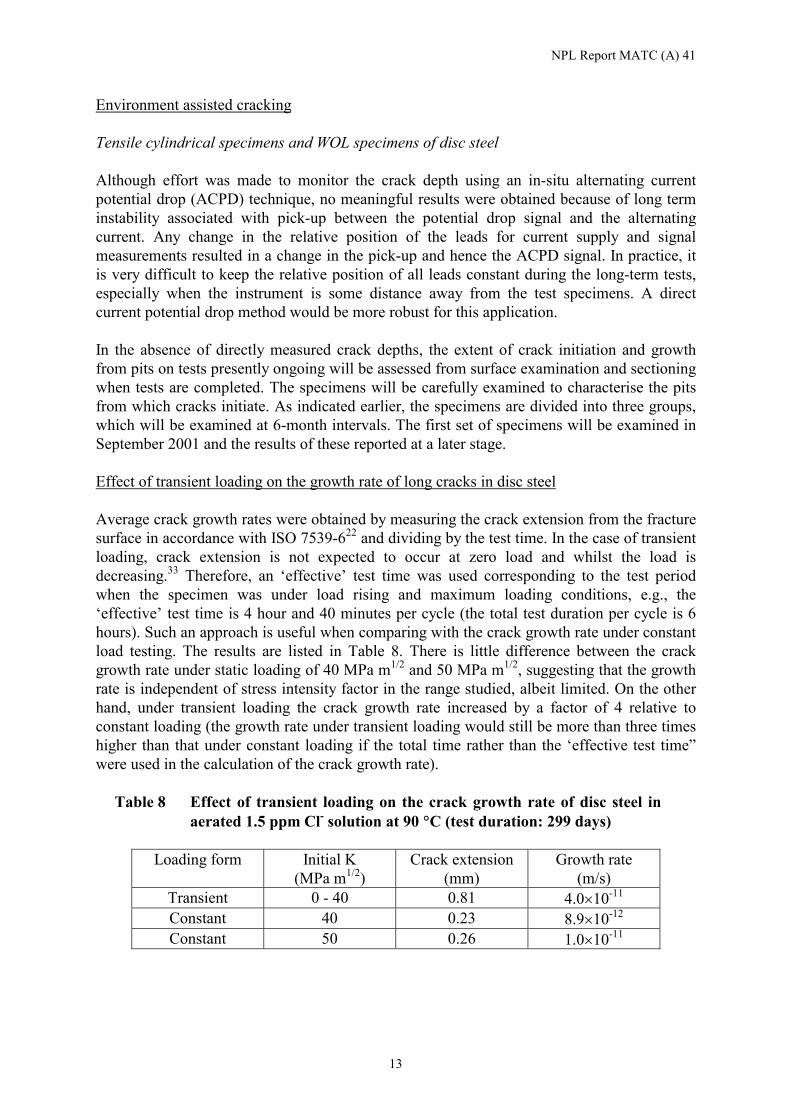
Environment assisted cracking Tensile cylindrical specimens and WOL specimens of disc steel Although effort was made to monitor the crack depth using an in-situ alternating current potential drop (ACPD) technique, no meaningful results were obtained because of long term instability associated with pick-up between the potential drop signal and the alternating current. Any change in the relative position of the leads for current supply and signal measurements resulted in a change in the pick-up and hence the ACPD signal. In practice, it is very difficult to keep the relative position of all leads constant during the long-term tests, especially when the instrument is some distance away from the test specimens. A direct current potential drop method would be more robust for this application. In the absence of directly measured crack depths, the extent of crack initiation and growth from pits on tests presently ongoing will be assessed from surface examination and sectioning when tests are completed. The specimens will be carefully examined to characterise the pits from which cracks initiate. As indicated earlier, the specimens are divided into three groups, which will be examined at 6-month intervals. The first set of specimens will be examined in September 2001 and the results of these reported at a later stage. Effect of transient loading on the growth rate of long cracks in disc steel Average crack growth rates were obtained by measuring the crack extension from the fracture surface in accordance with ISO 7539-622 and dividing by the test time. In the case of transient loading, crack extension is not expected to occur at zero load and whilst the load is decreasing.33 Therefore, an ‘effective’ test time was used corresponding to the test period when the specimen was under load rising and maximum loading conditions, e.g., the ‘effective’ test time is 4 hour and 40 minutes per cycle (the total test duration per cycle is 6 hours). Such an approach is useful when comparing with the crack growth rate under constant load testing. The results are listed in Table 8. There is little difference between the crack growth rate under static loading of 40 MPa m1/2 and 50 MPa m1/2, suggesting that the growth rate is independent of stress intensity factor in the range studied, albeit limited. On the other hand, under transient loading the crack growth rate increased by a factor of 4 relative to constant loading (the growth rate under transient loading would still be more than three times higher than that under constant loading if the total time rather than the ‘effective test time” were used in the calculation of the crack growth rate).
Table 8 Effect of transient loading on the crack growth rate of disc steel in
aerated 1.5 ppm Cl- solution at 90 �C (test duration: 299 days)
Loading form Initial K (MPa m1/2)
Crack extension (mm)
Growth rate (m/s)
Transient 0 - 40 0.81 4.0�10-11
Constant 40 0.23 8.9�10-12 Constant 50 0.26 1.0�10-11
NPL Report MATC (A) 41
14
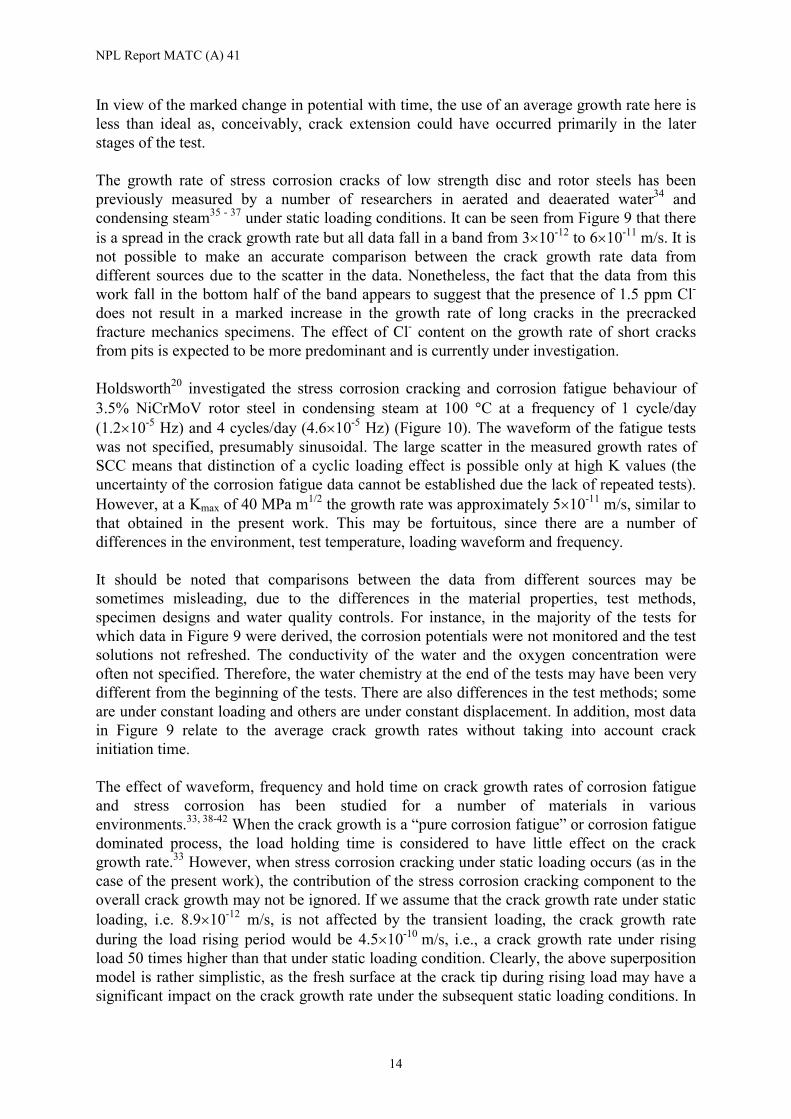
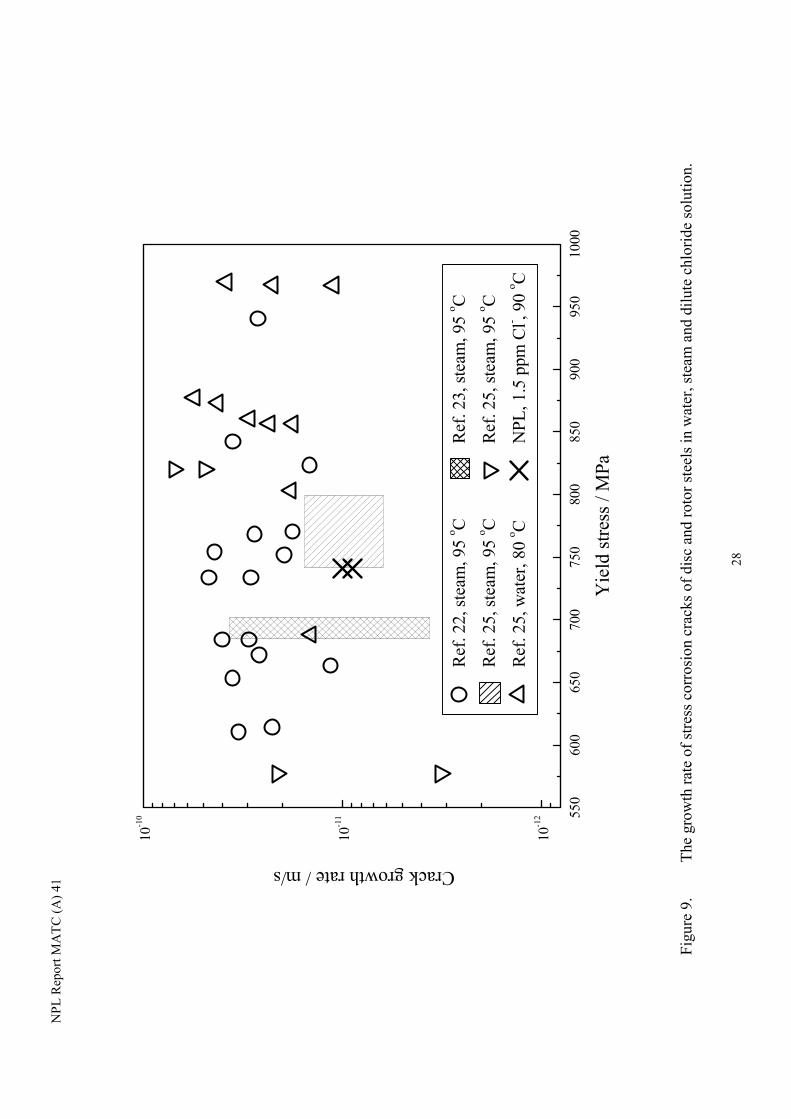
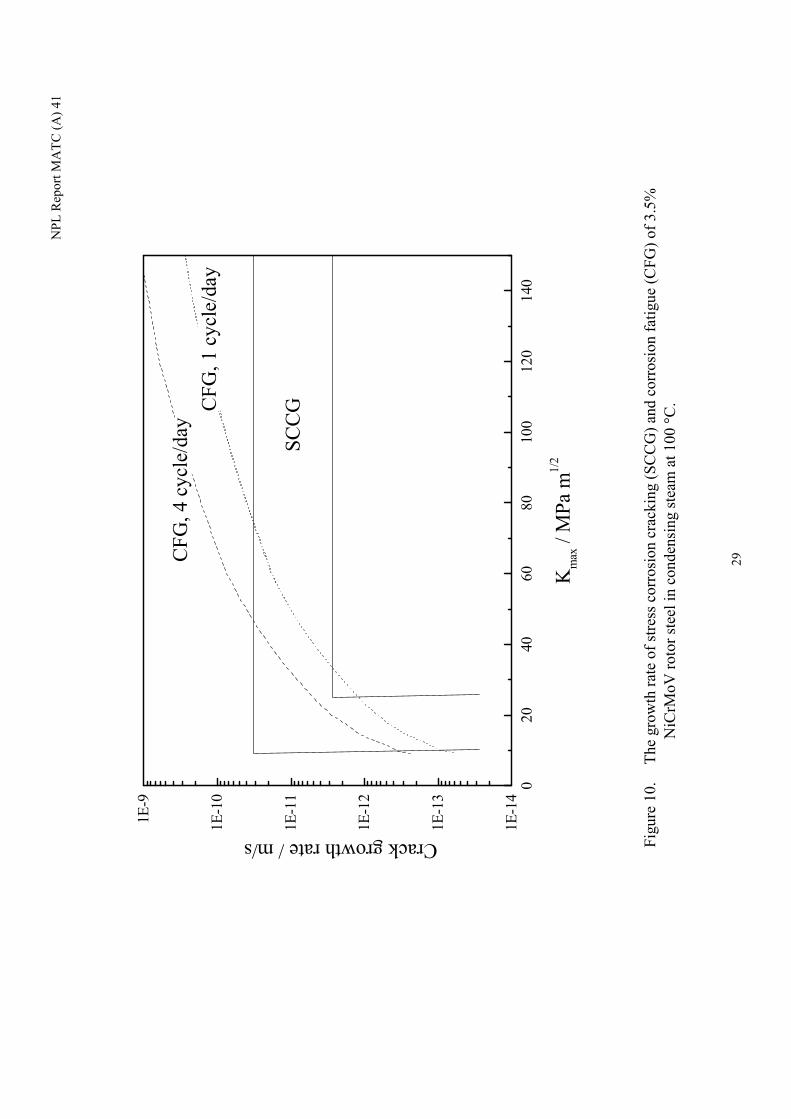
In view of the marked change in potential with time, the use of an average growth rate here is less than ideal as, conceivably, crack extension could have occurred primarily in the later stages of the test. The growth rate of stress corrosion cracks of low strength disc and rotor steels has been previously measured by a number of researchers in aerated and deaerated water34 and condensing steam35 - 37 under static loading conditions. It can be seen from Figure 9 that there is a spread in the crack growth rate but all data fall in a band from 3�10-12 to 6�10-11 m/s. It is not possible to make an accurate comparison between the crack growth rate data from different sources due to the scatter in the data. Nonetheless, the fact that the data from this work fall in the bottom half of the band appears to suggest that the presence of 1.5 ppm Cl- does not result in a marked increase in the growth rate of long cracks in the precracked fracture mechanics specimens. The effect of Cl- content on the growth rate of short cracks from pits is expected to be more predominant and is currently under investigation. Holdsworth20 investigated the stress corrosion cracking and corrosion fatigue behaviour of 3.5% NiCrMoV rotor steel in condensing steam at 100 �C at a frequency of 1 cycle/day (1.2�10-5 Hz) and 4 cycles/day (4.6�10-5 Hz) (Figure 10). The waveform of the fatigue tests was not specified, presumably sinusoidal. The large scatter in the measured growth rates of SCC means that distinction of a cyclic loading effect is possible only at high K values (the uncertainty of the corrosion fatigue data cannot be established due the lack of repeated tests). However, at a Kmax of 40 MPa m1/2 the growth rate was approximately 5�10-11 m/s, similar to that obtained in the present work. This may be fortuitous, since there are a number of differences in the environment, test temperature, loading waveform and frequency. It should be noted that comparisons between the data from different sources may be sometimes misleading, due to the differences in the material properties, test methods, specimen designs and water quality controls. For instance, in the majority of the tests for which data in Figure 9 were derived, the corrosion potentials were not monitored and the test solutions not refreshed. The conductivity of the water and the oxygen concentration were often not specified. Therefore, the water chemistry at the end of the tests may have been very different from the beginning of the tests. There are also differences in the test methods; some are under constant loading and others are under constant displacement. In addition, most data in Figure 9 relate to the average crack growth rates without taking into account crack initiation time. The effect of waveform, frequency and hold time on crack growth rates of corrosion fatigue and stress corrosion has been studied for a number of materials in various environments.33, 38-42 When the crack growth is a “pure corrosion fatigue” or corrosion fatigue dominated process, the load holding time is considered to have little effect on the crack growth rate.33 However, when stress corrosion cracking under static loading occurs (as in the case of the present work), the contribution of the stress corrosion cracking component to the overall crack growth may not be ignored. If we assume that the crack growth rate under static loading, i.e. 8.9�10-12 m/s, is not affected by the transient loading, the crack growth rate during the load rising period would be 4.5�10-10 m/s, i.e., a crack growth rate under rising load 50 times higher than that under static loading condition. Clearly, the above superposition model is rather simplistic, as the fresh surface at the crack tip during rising load may have a significant impact on the crack growth rate under the subsequent static loading conditions. In
NPL Report MATC (A) 41
15
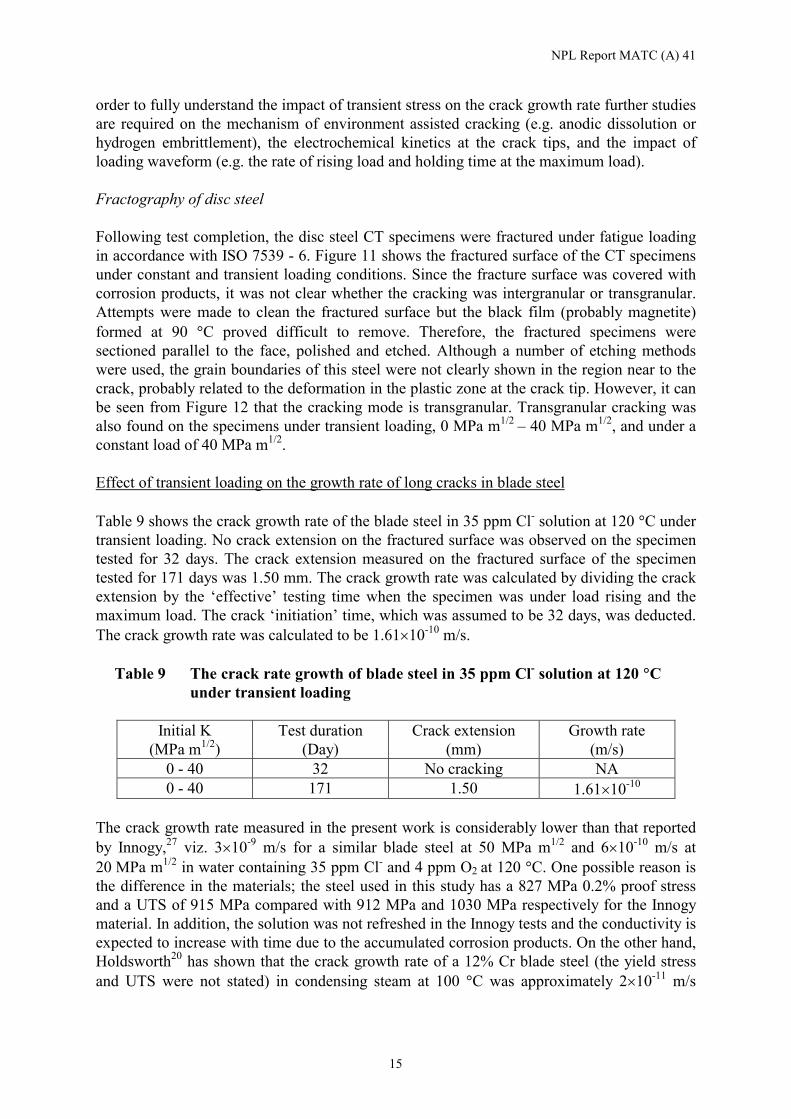
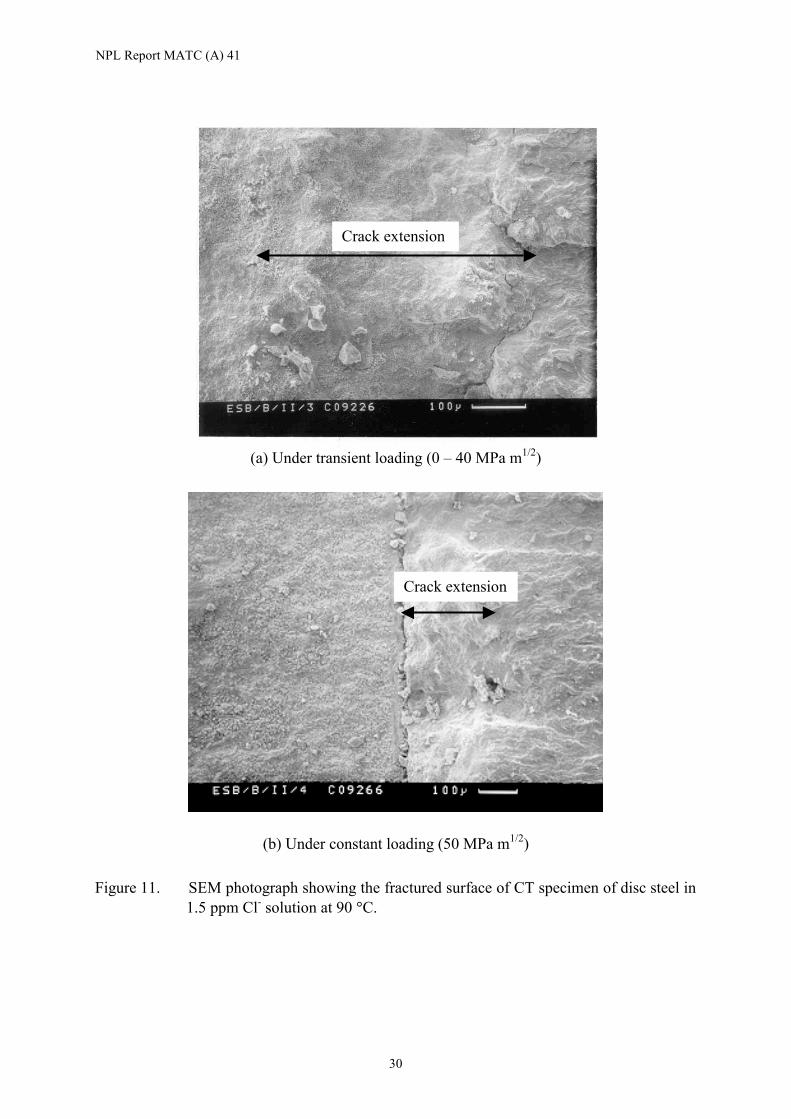
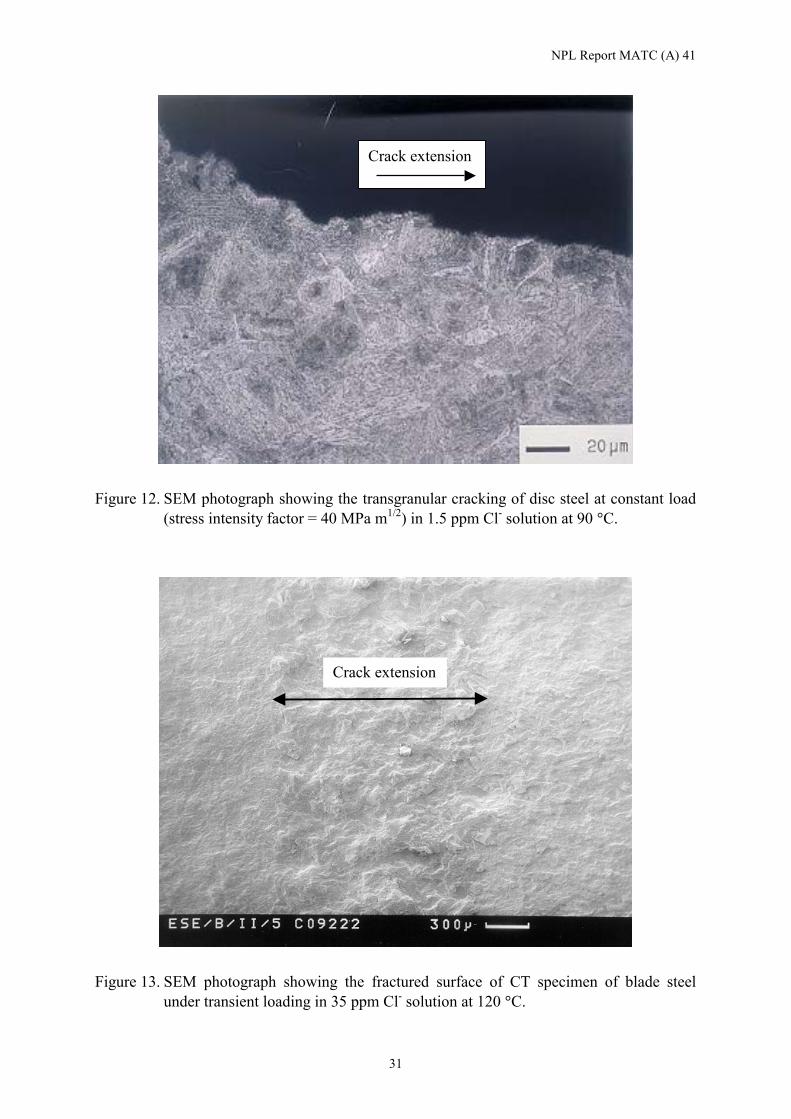
order to fully understand the impact of transient stress on the crack growth rate further studies are required on the mechanism of environment assisted cracking (e.g. anodic dissolution or hydrogen embrittlement), the electrochemical kinetics at the crack tips, and the impact of loading waveform (e.g. the rate of rising load and holding time at the maximum load). Fractography of disc steel Following test completion, the disc steel CT specimens were fractured under fatigue loading in accordance with ISO 7539 - 6. Figure 11 shows the fractured surface of the CT specimens under constant and transient loading conditions. Since the fracture surface was covered with corrosion products, it was not clear whether the cracking was intergranular or transgranular. Attempts were made to clean the fractured surface but the black film (probably magnetite) formed at 90 �C proved difficult to remove. Therefore, the fractured specimens were sectioned parallel to the face, polished and etched. Although a number of etching methods were used, the grain boundaries of this steel were not clearly shown in the region near to the crack, probably related to the deformation in the plastic zone at the crack tip. However, it can be seen from Figure 12 that the cracking mode is transgranular. Transgranular cracking was also found on the specimens under transient loading, 0 MPa m1/2 – 40 MPa m1/2, and under a constant load of 40 MPa m1/2. Effect of transient loading on the growth rate of long cracks in blade steel Table 9 shows the crack growth rate of the blade steel in 35 ppm Cl- solution at 120 �C under transient loading. No crack extension on the fractured surface was observed on the specimen tested for 32 days. The crack extension measured on the fractured surface of the specimen tested for 171 days was 1.50 mm. The crack growth rate was calculated by dividing the crack extension by the ‘effective’ testing time when the specimen was under load rising and the maximum load. The crack ‘initiation’ time, which was assumed to be 32 days, was deducted. The crack growth rate was calculated to be 1.61�10-10 m/s.
Table 9 The crack rate growth of blade steel in 35 ppm Cl- solution at 120 �C under transient loading
Initial K
(MPa m1/2) Test duration
(Day) Crack extension
(mm) Growth rate
(m/s) 0 - 40 32 No cracking NA
0 - 40 171 1.50 1.61�10-10 The crack growth rate measured in the present work is considerably lower than that reported by Innogy,27 viz. 3�10-9 m/s for a similar blade steel at 50 MPa m1/2 and 6�10-10 m/s at 20 MPa m1/2 in water containing 35 ppm Cl- and 4 ppm O2 at 120 �C. One possible reason is the difference in the materials; the steel used in this study has a 827 MPa 0.2% proof stress and a UTS of 915 MPa compared with 912 MPa and 1030 MPa respectively for the Innogy material. In addition, the solution was not refreshed in the Innogy tests and the conductivity is expected to increase with time due to the accumulated corrosion products. On the other hand, Holdsworth20 has shown that the crack growth rate of a 12% Cr blade steel (the yield stress and UTS were not stated) in condensing steam at 100 �C was approximately 2�10-11 m/s
NPL Report MATC (A) 41
16
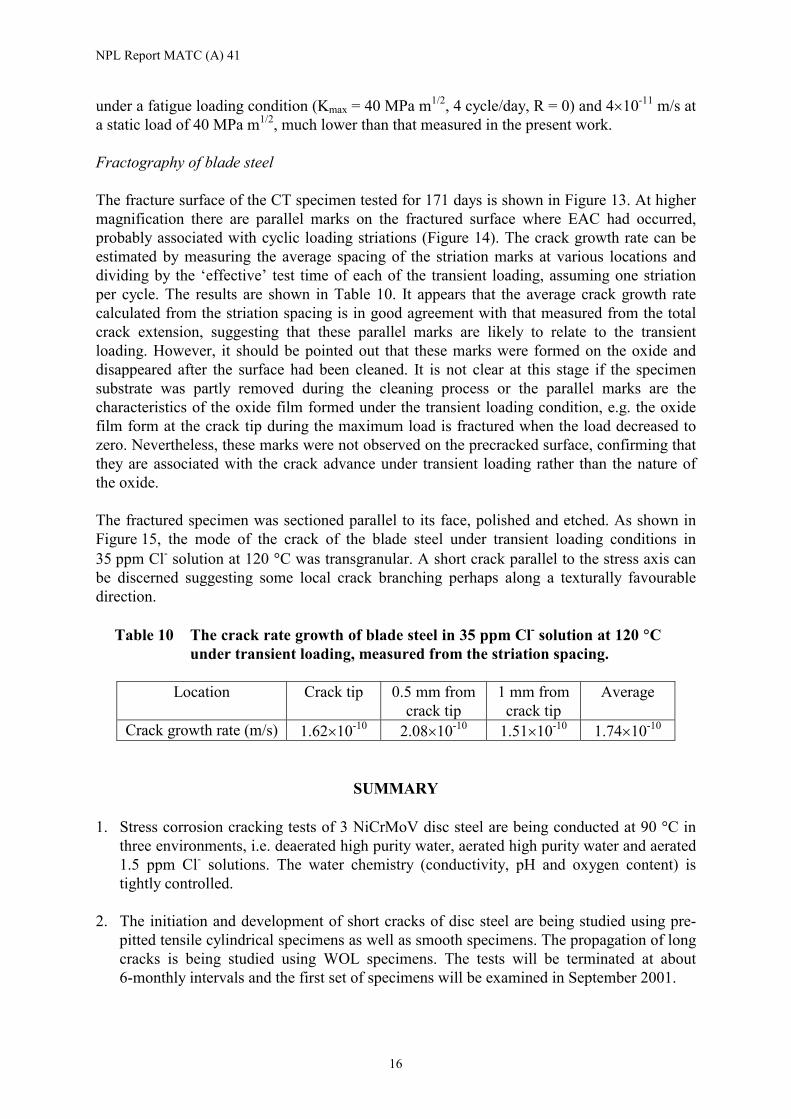
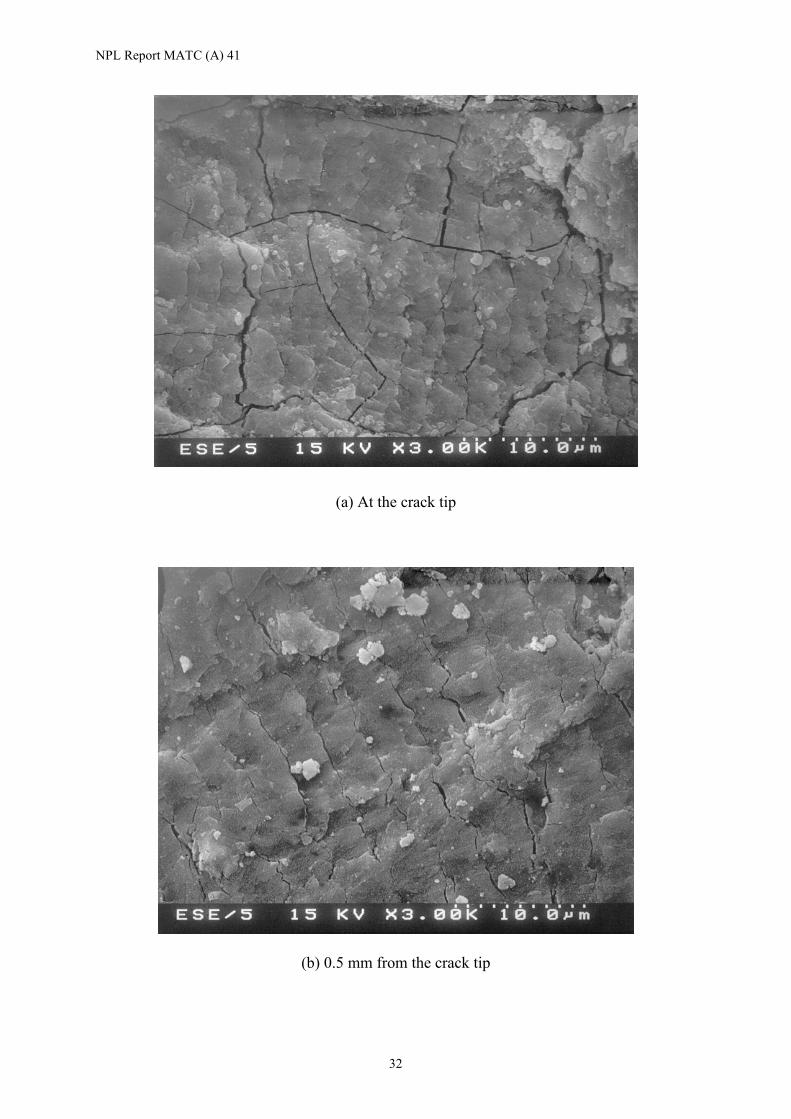
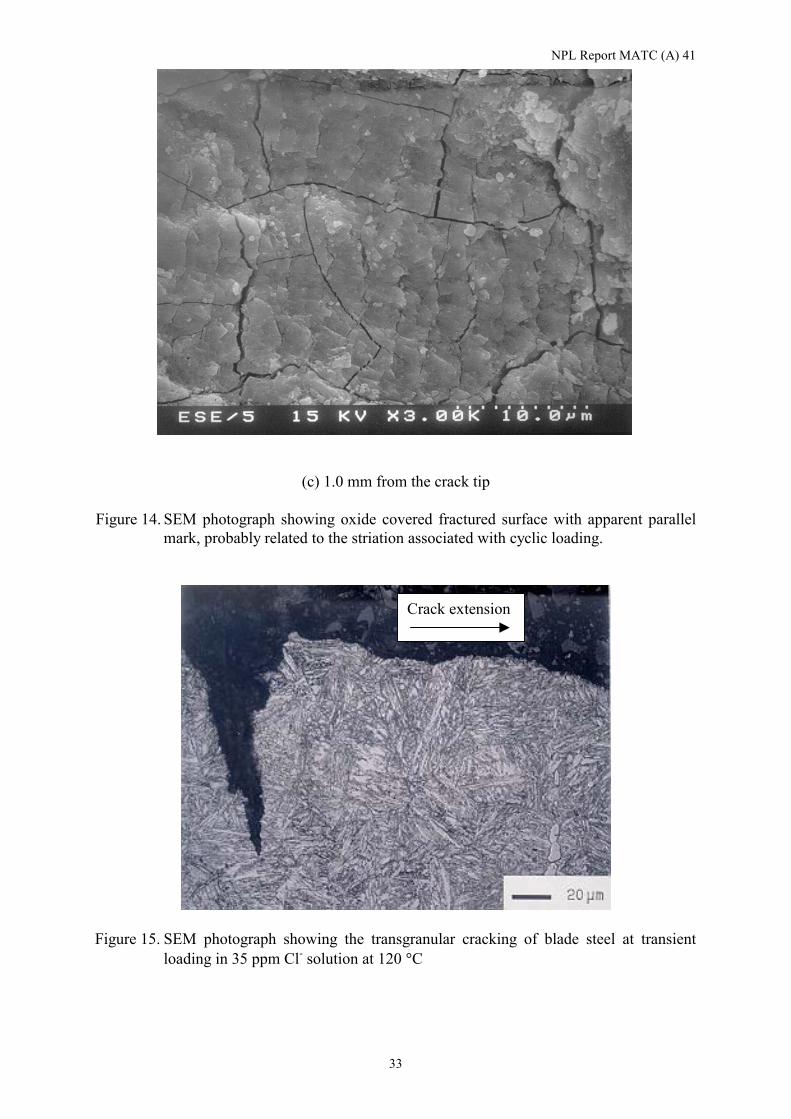
under a fatigue loading condition (Kmax = 40 MPa m1/2, 4 cycle/day, R = 0) and 4�10-11 m/s at a static load of 40 MPa m1/2, much lower than that measured in the present work. Fractography of blade steel The fracture surface of the CT specimen tested for 171 days is shown in Figure 13. At higher magnification there are parallel marks on the fractured surface where EAC had occurred, probably associated with cyclic loading striations (Figure 14). The crack growth rate can be estimated by measuring the average spacing of the striation marks at various locations and dividing by the ‘effective’ test time of each of the transient loading, assuming one striation per cycle. The results are shown in Table 10. It appears that the average crack growth rate calculated from the striation spacing is in good agreement with that measured from the total crack extension, suggesting that these parallel marks are likely to relate to the transient loading. However, it should be pointed out that these marks were formed on the oxide and disappeared after the surface had been cleaned. It is not clear at this stage if the specimen substrate was partly removed during the cleaning process or the parallel marks are the characteristics of the oxide film formed under the transient loading condition, e.g. the oxide film form at the crack tip during the maximum load is fractured when the load decreased to zero. Nevertheless, these marks were not observed on the precracked surface, confirming that they are associated with the crack advance under transient loading rather than the nature of the oxide. The fractured specimen was sectioned parallel to its face, polished and etched. As shown in Figure 15, the mode of the crack of the blade steel under transient loading conditions in 35 ppm Cl- solution at 120 �C was transgranular. A short crack parallel to the stress axis can be discerned suggesting some local crack branching perhaps along a texturally favourable direction.
Table 10 The crack rate growth of blade steel in 35 ppm Cl- solution at 120 �C under transient loading, measured from the striation spacing.
Location Crack tip 0.5 mm from
crack tip 1 mm from
crack tip Average
Crack growth rate (m/s) 1.62�10-10 2.08�10-10 1.51�10-10 1.74�10-10
SUMMARY
1. Stress corrosion cracking tests of 3 NiCrMoV disc steel are being conducted at 90 �C in three environments, i.e. deaerated high purity water, aerated high purity water and aerated 1.5 ppm Cl- solutions. The water chemistry (conductivity, pH and oxygen content) is tightly controlled.
2. The initiation and development of short cracks of disc steel are being studied using pre-
pitted tensile cylindrical specimens as well as smooth specimens. The propagation of long cracks is being studied using WOL specimens. The tests will be terminated at about 6-monthly intervals and the first set of specimens will be examined in September 2001.
NPL Report MATC (A) 41
17
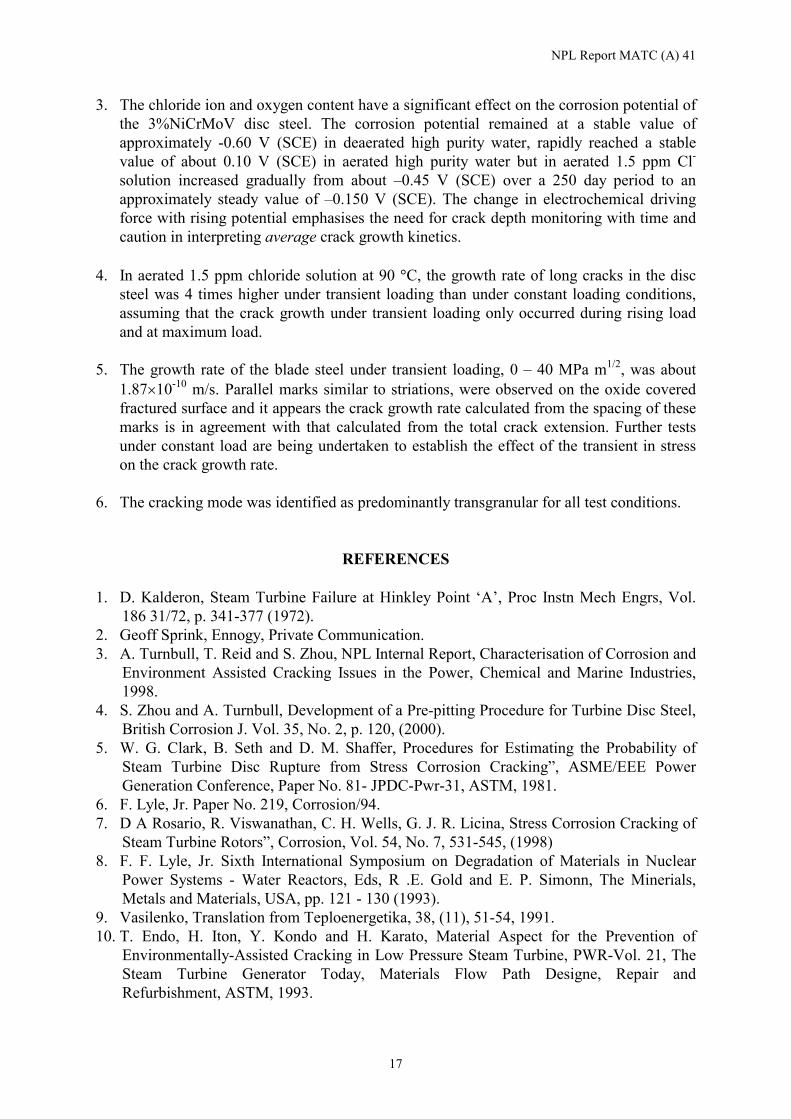
3. The chloride ion and oxygen content have a significant effect on the corrosion potential of the 3%NiCrMoV disc steel. The corrosion potential remained at a stable value of approximately -0.60 V (SCE) in deaerated high purity water, rapidly reached a stable value of about 0.10 V (SCE) in aerated high purity water but in aerated 1.5 ppm Cl- solution increased gradually from about –0.45 V (SCE) over a 250 day period to an approximately steady value of –0.150 V (SCE). The change in electrochemical driving force with rising potential emphasises the need for crack depth monitoring with time and caution in interpreting average crack growth kinetics.
4. In aerated 1.5 ppm chloride solution at 90 �C, the growth rate of long cracks in the disc
steel was 4 times higher under transient loading than under constant loading conditions, assuming that the crack growth under transient loading only occurred during rising load and at maximum load.
5. The growth rate of the blade steel under transient loading, 0 – 40 MPa m1/2, was about
1.87�10-10 m/s. Parallel marks similar to striations, were observed on the oxide covered fractured surface and it appears the crack growth rate calculated from the spacing of these marks is in agreement with that calculated from the total crack extension. Further tests under constant load are being undertaken to establish the effect of the transient in stress on the crack growth rate.
6. The cracking mode was identified as predominantly transgranular for all test conditions.
REFERENCES 1. D. Kalderon, Steam Turbine Failure at Hinkley Point ‘A’, Proc Instn Mech Engrs, Vol.
186 31/72, p. 341-377 (1972). 2. Geoff Sprink, Ennogy, Private Communication. 3. A. Turnbull, T. Reid and S. Zhou, NPL Internal Report, Characterisation of Corrosion and
Environment Assisted Cracking Issues in the Power, Chemical and Marine Industries, 1998.
4. S. Zhou and A. Turnbull, Development of a Pre-pitting Procedure for Turbine Disc Steel, British Corrosion J. Vol. 35, No. 2, p. 120, (2000).
5. W. G. Clark, B. Seth and D. M. Shaffer, Procedures for Estimating the Probability of Steam Turbine Disc Rupture from Stress Corrosion Cracking”, ASME/EEE Power Generation Conference, Paper No. 81- JPDC-Pwr-31, ASTM, 1981.
6. F. Lyle, Jr. Paper No. 219, Corrosion/94. 7. D A Rosario, R. Viswanathan, C. H. Wells, G. J. R. Licina, Stress Corrosion Cracking of
Steam Turbine Rotors”, Corrosion, Vol. 54, No. 7, 531-545, (1998) 8. F. F. Lyle, Jr. Sixth International Symposium on Degradation of Materials in Nuclear
Power Systems - Water Reactors, Eds, R .E. Gold and E. P. Simonn, The Minerials, Metals and Materials, USA, pp. 121 - 130 (1993).
9. Vasilenko, Translation from Teploenergetika, 38, (11), 51-54, 1991. 10. T. Endo, H. Iton, Y. Kondo and H. Karato, Material Aspect for the Prevention of
Environmentally-Assisted Cracking in Low Pressure Steam Turbine, PWR-Vol. 21, The Steam Turbine Generator Today, Materials Flow Path Designe, Repair and Refurbishment, ASTM, 1993.
NPL Report MATC (A) 41
18
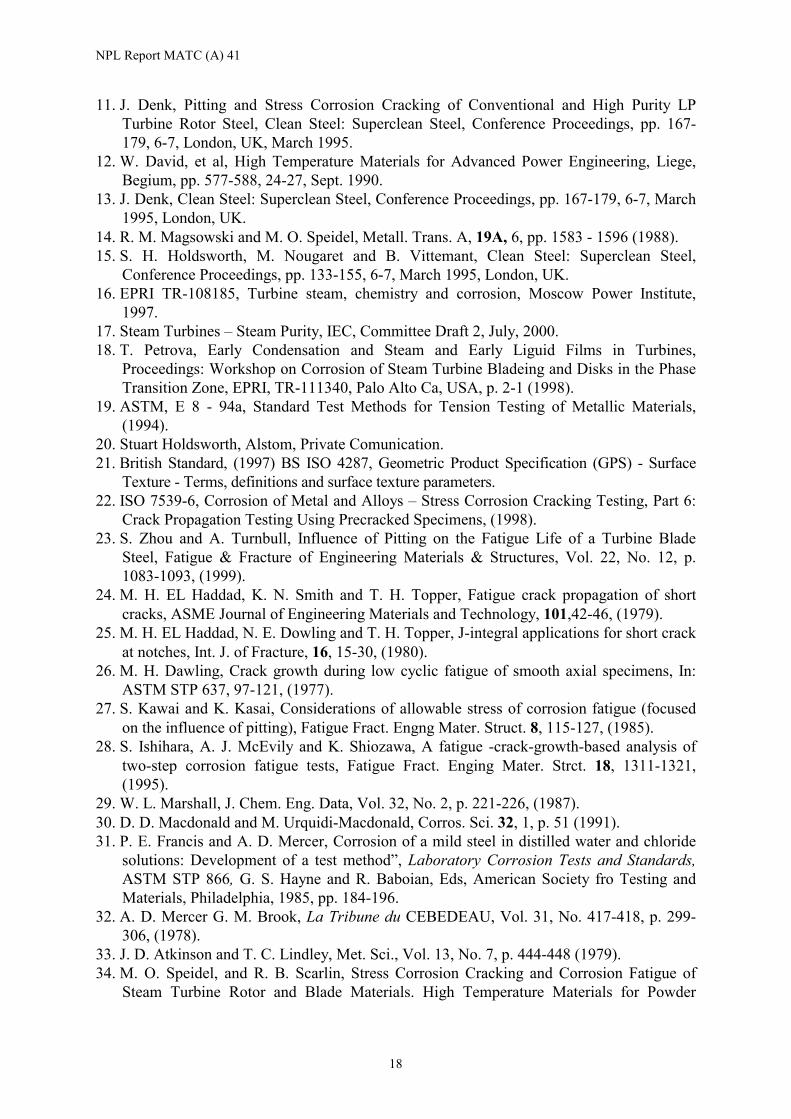
11. J. Denk, Pitting and Stress Corrosion Cracking of Conventional and High Purity LP Turbine Rotor Steel, Clean Steel: Superclean Steel, Conference Proceedings, pp. 167-179, 6-7, London, UK, March 1995.
12. W. David, et al, High Temperature Materials for Advanced Power Engineering, Liege, Begium, pp. 577-588, 24-27, Sept. 1990.
13. J. Denk, Clean Steel: Superclean Steel, Conference Proceedings, pp. 167-179, 6-7, March 1995, London, UK.
14. R. M. Magsowski and M. O. Speidel, Metall. Trans. A, 19A, 6, pp. 1583 - 1596 (1988). 15. S. H. Holdsworth, M. Nougaret and B. Vittemant, Clean Steel: Superclean Steel,
Conference Proceedings, pp. 133-155, 6-7, March 1995, London, UK. 16. EPRI TR-108185, Turbine steam, chemistry and corrosion, Moscow Power Institute,
1997. 17. Steam Turbines – Steam Purity, IEC, Committee Draft 2, July, 2000. 18. T. Petrova, Early Condensation and Steam and Early Liguid Films in Turbines,
Proceedings: Workshop on Corrosion of Steam Turbine Bladeing and Disks in the Phase Transition Zone, EPRI, TR-111340, Palo Alto Ca, USA, p. 2-1 (1998).
19. ASTM, E 8 - 94a, Standard Test Methods for Tension Testing of Metallic Materials, (1994).
20. Stuart Holdsworth, Alstom, Private Comunication. 21. British Standard, (1997) BS ISO 4287, Geometric Product Specification (GPS) - Surface
Texture - Terms, definitions and surface texture parameters. 22. ISO 7539-6, Corrosion of Metal and Alloys – Stress Corrosion Cracking Testing, Part 6:
Crack Propagation Testing Using Precracked Specimens, (1998). 23. S. Zhou and A. Turnbull, Influence of Pitting on the Fatigue Life of a Turbine Blade
Steel, Fatigue & Fracture of Engineering Materials & Structures, Vol. 22, No. 12, p. 1083-1093, (1999).
24. M. H. EL Haddad, K. N. Smith and T. H. Topper, Fatigue crack propagation of short cracks, ASME Journal of Engineering Materials and Technology, 101,42-46, (1979).
25. M. H. EL Haddad, N. E. Dowling and T. H. Topper, J-integral applications for short crack at notches, Int. J. of Fracture, 16, 15-30, (1980).
26. M. H. Dawling, Crack growth during low cyclic fatigue of smooth axial specimens, In: ASTM STP 637, 97-121, (1977).
27. S. Kawai and K. Kasai, Considerations of allowable stress of corrosion fatigue (focused on the influence of pitting), Fatigue Fract. Engng Mater. Struct. 8, 115-127, (1985).
28. S. Ishihara, A. J. McEvily and K. Shiozawa, A fatigue -crack-growth-based analysis of two-step corrosion fatigue tests, Fatigue Fract. Enging Mater. Strct. 18, 1311-1321, (1995).
29. W. L. Marshall, J. Chem. Eng. Data, Vol. 32, No. 2, p. 221-226, (1987). 30. D. D. Macdonald and M. Urquidi-Macdonald, Corros. Sci. 32, 1, p. 51 (1991). 31. P. E. Francis and A. D. Mercer, Corrosion of a mild steel in distilled water and chloride
solutions: Development of a test method”, Laboratory Corrosion Tests and Standards, ASTM STP 866, G. S. Hayne and R. Baboian, Eds, American Society fro Testing and Materials, Philadelphia, 1985, pp. 184-196.
32. A. D. Mercer G. M. Brook, La Tribune du CEBEDEAU, Vol. 31, No. 417-418, p. 299-306, (1978).
33. J. D. Atkinson and T. C. Lindley, Met. Sci., Vol. 13, No. 7, p. 444-448 (1979). 34. M. O. Speidel, and R. B. Scarlin, Stress Corrosion Cracking and Corrosion Fatigue of
Steam Turbine Rotor and Blade Materials. High Temperature Materials for Powder
NPL Report MATC (A) 41
19
Engineering 1990. I, Liege, Belgium, 24-27 Sept. 1990 Publ: Kluwer Academic Publishers, P.O. Box 17, 3300 AA Dordrecht, The Netherlands, p. 343-368 (1990).
35. S. R. Holdsworth, M. Nougaret, B. W. Roberts and D. V. Thornton, Laboratory Stress Corrosion Cracking Experience in Steam Disc Steel (Unpublished).
36. S. R. Holdsworth and G. Brunell Cost 505, UK11, Final Report (1989) 37. P. McIntyre, P. Mulvihill and P.J. Trant, COST 505, UK20, Progress Report (1988). 38. J. D. Atkinson, and J. E. Forrest, Corros. Sci., Vol. 25, No. 8/9, p. 607 – 631 (1985). 39. W. H. Cullen, Effect of Loading Rate, Waveform and Temperature on Fatigue Crack
Growth rates of RPV Steels, Aspect of Fracture Vessels and Piping, Orlando, 27 June – 2 July, 1982, American Soc. Of Mech. Eng., NYC, p. 303 – 312 (1982).
40. R. D. Achilles and J. H. Bulloch, Int. Pre. Ves. & Piping, Vol. 30, No. 5, p. 375 – 389 (1987).
41. H. Hänninen, K. Törrönen, M. Kemppainen and S. S. Salonen, Corros. Sci. Vol. 23, No. 6, p. 663 – 679 (1983).
42. S. Kawei, Effect of Waveform & Frequency on Corrosion Fatigue Crack Growth for a 13 Chromium Stainless Steel, Ultrasonic Fatigur , Champion, PA, USA, 25 – 30, Oct. 1981, Metallurgical Soc. Warrendale PA, USA, p. 541-552 (1982).
NPL Report MATC (A) 41
20
Figure 1. Photograph of the specimens for EAC tests. (a) Tensile cylindrical specimen, (b) tensile cylindrical specimen with the loading frame, (c) wedge opening loaded (WOL) specimen and (d) compact tension (CT) specimens.
(a)
(b)
(c) (d)
NPL Report MATC (A) 41
21
(a)
(b) Figure 2. Photographs showing the microstructures of (a) 3%NiCrMoV disc steel,
and (b) 12% Cr blade steel.
NPL
Rep
ort M
ATC
(A) 4
1
22
Figu
re 3
.
Sche
mat
ic d
iagr
am sh
owin
g th
e te
st c
ell a
nd h
igh
purit
y w
ater
supp
ly sy
stem
Non
-ret
urn
valv
e
Dei
onis
ed
Wat
e r
Nitr
ogen
in
Purif
ier
De-
gass
er
Con
duct
ivity
met
er
Oxy
gen
met
er
Oxy
gen
met
er C
ondu
ctiv
ity m
eter
Test
cel
l
Hot
pla
te
Res
ervo
ir
Dra
in
Vac
uum
pum
pM
embr
ane
Res
ervo
ir
NPL
Rep
ort M
ATC
(A) 4
1
23
Fi
gure
4.
Sche
mat
ic d
iagr
aph
show
ing
the
auto
clav
e an
d so
lutio
n ci
rcul
atio
n sy
stem
Load
Hig
h pr
essu
re
Pum
p
Solu
tion
Res
ervo
ir
Oxy
gen
Met
er
Con
duct
ivity
Met
erPr
essu
re R
elea
se V
alve
Coo
ling
coil
Air
in
Pres
sure
Gau
ge
Aut
ocla
ve
Spec
imen
NPL
Rep
ort M
ATC
(A) 4
1
24
05
1015
20
0.0
0.1
0.2
0.3
0.4
CO
D (m
m) =
0.0
2045
P(kN
)
COD / mm
Load
/ kN
Fi
gure
5.
The
rela
tions
hip
betw
een
the
crac
k op
enin
g di
spla
cem
ent a
nd th
e lo
ad a
t 90 �C
(a/w
= 0
.412
)
NPL
Rep
ort M
ATC
(A) 4
1
25
010
2030
4050
6070
8090
100
110
120
130
140
150
160
170
180
-0.7
-0.6
-0.5
-0.4
-0.3
-0.2
-0.10.0
0.1
0.2
Aer
ated
wat
er:
cyl
indr
ical
W
OL
Aer
ated
1.5
ppm
Cl- :
cyl
indr
ical
W
OL
Dea
erat
ed w
ater
: c
ylin
dric
al W
OL
Potential / V (SCE)
Tim
e / D
ay
Fi
gure
6.
Effe
ct o
f oxy
gen
and
chlo
ride
ion
on th
e co
rros
ion
pote
ntia
l of d
isc
stee
l
NPL
Rep
ort M
ATC
(A) 4
1
26
050
100
150
200
250
300
-0.4
5
-0.4
0
-0.3
5
-0.3
0
-0.2
5
-0.2
0
-0.1
5
-0.1
0
-0.0
5
0 -
40 M
Pa m
1/2
40
MPa
m1/
2
50
MPa
m1/
2
Potential / V (SCE)
Tim
e / d
ay
Fi
gure
7.
The
corr
osio
n po
tent
ial o
f the
CT
spec
imen
s in
1.5
ppm
Cl- so
lutio
n at
90 �C
NPL
Rep
ort M
ATC
(A) 4
1
27
010
2030
4050
6070
80-0
.14
-0.1
2
-0.1
0
-0.0
8
-0.0
6
-0.0
4
-0.0
2
Potential / V
Tim
e / d
ay
Fi
gure
8.
The
pote
ntia
l of t
he C
T sp
ecim
en o
f bla
de st
eel w
ith re
fere
nce
to a
wire
of t
he sa
me
mat
eria
l.
NPL
Rep
ort M
ATC
(A) 4
1
28
550
600
650
700
750
800
850
900
950
1000
10-1
2
10-1
1
10-1
0
Ref
. 22,
stea
m, 9
5 o C
Ref
. 23,
stea
m, 9
5 o C
Ref
. 25,
stea
m, 9
5 o C
Ref
. 25,
stea
m, 9
5 o C
Ref
. 25,
wat
er, 8
0 o C
NPL
, 1.5
ppm
Cl- , 9
0 o C
Crack growth rate / m/s
Yie
ld st
ress
/ M
Pa
Figu
re 9
. Th
e gr
owth
rate
of s
tress
cor
rosi
on c
rack
s of d
isc
and
roto
r ste
els i
n w
ater
, ste
am a
nd d
ilute
chl
orid
e so
lutio
n.
NPL
Rep
ort M
ATC
(A) 4
1
29
020
4060
8010
012
014
01E
-14
1E-1
3
1E-1
2
1E-1
1
1E-1
0
1E-9
CFG
, 1 c
ycle
/day
CFG
, 4 c
ycle
/day
SCC
GCrack growth rate / m/s
Km
ax /
MPa
m1/
2
Figu
re 1
0.
The
grow
th ra
te o
f stre
ss c
orro
sion
cra
ckin
g (S
CC
G) a
nd c
orro
sion
fatig
ue (C
FG) o
f 3.5
%
NiC
rMoV
roto
r ste
el in
con
dens
ing
stea
m a
t 100
�C.
NPL Report MATC (A) 41
30
(a) Under transient loading (0 – 40 MPa m1/2)
(b) Under constant loading (50 MPa m1/2)
Figure 11. SEM photograph showing the fractured surface of CT specimen of disc steel in 1.5 ppm Cl- solution at 90 �C.
Crack extension
Crack extension
NPL Report MATC (A) 41
31
Figure 12. SEM photograph showing the transgranular cracking of disc steel at constant load
(stress intensity factor = 40 MPa m1/2) in 1.5 ppm Cl- solution at 90 �C.
Figure 13. SEM photograph showing the fractured surface of CT specimen of blade steel under transient loading in 35 ppm Cl- solution at 120 �C.
Crack extension
Crack extension
NPL Report MATC (A) 41
32
(a) At the crack tip
(b) 0.5 mm from the crack tip
NPL Report MATC (A) 41
33
(c) 1.0 mm from the crack tip
Figure 14. SEM photograph showing oxide covered fractured surface with apparent parallel mark, probably related to the striation associated with cyclic loading.
Figure 15. SEM photograph showing the transgranular cracking of blade steel at transient loading in 35 ppm Cl- solution at 120 �C
Crack extension