Embed Size (px)
Citation preview

Environment and Sustainable Communities Overview and Scrutiny Committee
Date Thursday 26 September 2013
Time 9.30 am
Venue Committee Room 2, County Hall, Durham
Business
Part A
Items during which the Press and Public are welcome to attend. Members of the Public can ask questions with the Chairman's agreement.
1. Apologies
2. Substitute Members
3. Minutes of the Meeting held on 8th April 2013 (Pages 1 - 8)
4. Declarations of Interest, if any
5. Any items from Co-opted Members or interested parties
6. Media Relations
Update on press coverage.
7. Neighbourhood Services Revenue and Capital Outturn Quarter 4 2012/2013 and Quarter 1 2013/2014: (Pages 9 - 18)
Report of the Neighbourhood Services Management Team.
8. Quarter 1 Performance Management Report 2013/14: (Pages 19 - 28)
Report of the Corporate Management Team.
9. Limestone Landscapes Visit to Thrislington and Raisby Quarries: (Pages 29 - 34)
(i) Joint report of the Assistant Chief Executive and Corporate Director, Neighbourhoods.
(ii) Presentation by the Limestone Landscapes Programme Manager.
10. Overview in Relation to Potholes: (Pages 35 - 40)
Report of the Corporate Director, Neighbourhood Services.

11. Updated Street Lighting Policy (Pages 41 - 56)
Report of the Corporate Director, Neighbourhood Services.
12. Review of the Garden Waste Service: (Pages 57 - 70)
Report of the Corporate Director, Neighbourhood Services.
13. Minutes of the meeting of the County Durham Environment Partnership Board held on 25 June 2013 (Pages 71 - 76)
14. Such other business as, in the opinion of the Chairman is of sufficient urgency to warrant consideration
Colette Longbottom Head of Legal and Democratic Services
County Hall Durham 18 September 2013
To: The Members of the Environment and Sustainable Communities
Overview and Scrutiny Committee:
Councillor B Graham (Chairman) Councillor D Hall (Vice-Chairman) Councillors E Adam, D Bell, E Bell, J Clare, J Clark, D Freeman, J Gray, G Holland, K Hopper, I Jewell, C Kay, P May, O Milburn, S Morrison, J Shuttleworth, L Taylor, S Zair, J Armstrong and P Stradling Co-opted Members: Mr O Graham, Mr D Kinch, Mrs P Spurrell, Mr T Bolton and Mr D Easton
Contact: Lucy Stephenson Tel: 03000 269712

DURHAM COUNTY COUNCIL
At a Meeting of Environment and Sustainable Communities Overview and Scrutiny
Committee held in Committee Room 2, County Hall, Durham on Friday 21 June 2013 at 9.30 am
Present:
Councillor B Graham (Chairman)
Members of the Committee:
Councillors E Adam, D Bell, E Bell, J Clare, J Clark, J Gray, D Hall, G Holland, I Jewell, O Milburn, L Taylor, S Zair, J Armstrong and P Stradling Co-opted Members:
Mr D Kinch, Mrs P Spurrell, Mr T Bolton and Mr D Easton 1 Apologies There were no apologies for absence. 2 Substitute Members There were no substitute Members present. 3 Minutes of the meeting held on 8th April 2013. The minutes of the meeting held on 8th April 2013 were confirmed as correct record and signed by the Chairman. 4 Declarations of Interest, if any There were no declarations of interest submitted. 5 Any items from Co-opted Members or interested parties. There were no items from Co-opted Members or Interested Parties. 6 Quarter 4 Performance Management Report 2012/13 The Committee received a report and presentation of the Assistant Chief Executive which presented progress against the council’s corporate basket of performance indicators (PIs) for the Altogether Greener theme and reported other significant performance issues for 2012/13 (for copy of report and slides of presentation see file of Minutes). The Customer Relations, Policy and Performance Manager provided a summary of Council Plan actions reporting that 100% of actions had been met at year end. In addition detailed
Agenda Item 3
Page 1

information was provided relating to the key impacts of performance during Quarter 4 upon climate change, waste management, promoting pride in communities and the natural and built environment. The presentation provided in detail performance information relating to mitigating the impact of adapting to climate change and the actions that were in place such as the Durham Insulation Scheme And Warm Front Heating Grant Scheme. Moving on to discuss sustainable waste management solutions it was noted that the new waste contract had been in place since the 1st June 2013 and this would provide significant benefits in terms of directing waste from landfill sites. With regard to the recycling and composting aspect of waste management it was reported that the collection of waste from the kerbside had exceeded target and had continuously improved since Quarter 1. She further reported that during the period 55 composting bins had been sold. The presentation went on to detail performance in relation to litter and detritus. It was noted that performance in this area had declined mainly due to the resources being diverted to deal with flooding and poor weather over the early months of 2013, during which time it was not possible to keep up with scheduled cleansing. The Customer Relations, Policy and Performance Manager then provided an update in respect of performance in relation to the natural and built environment. In conclusion she gave a brief overview of work planned for the following months and planned events. Councillor Bell raised a query with regard to the number of composting bins sold and commented that the low number of sales was disappointing. In response the Strategic Waste Manager advised that the council had provided 20,000 bins to residents when they could be obtained at no charge, however since the introduction of a charge number purchased had been obtained. In response Councillor Bell asked how much the cost to the council was for the administration of 55 bins. It was reported that administration of the scheme was very minimal and no additional resource was required. Councillor Milburn queried whether there had been any consideration for central composting facilities to be provided for allotment associations. In response the Strategic Waste Manager advised that unfortunately bins could not be provided as the waste would be classified as commercial waste and a charge would have to be placed. He did however suggest that members of his team would be happy to provide advice to allotment holders on the best ways to manage their waste. Mr T Bolton asked what the known impact of the closure of some of the HWRC’s on fly tipping figures and whether increased monitoring was taking place around the site. In response the Customer Relations, Policy and Performance Manager advised that this had been identified as part of the closure as a potential risk and subsequently Neighbourhood Wardens would be monitoring sites closely. In addition anyone found to be fly tipping would have action taken against them. Councillor Stradling commented that it would be useful for fly tipping performance figures for across the County to be presented at a future meeting. In response the Customer
Page 2

Relations, Policy and Performance Manager advised that this information would be incorporated into data presented in Quarter 1. Further discussion then ensued regarding the policy on how homes were assessed for additional or larger wheelie bins. The Strategic Waste Manager also advised that recycling would also be collected from properties if placed in a transparent bag alongside the recycle bin. Mrs P Spurrell commented that she had been made aware of a number of elderely residents who had experienced a poor service whilst trying to use the Stainton Grove HWRC, in particular access issues with steps up to waste bins and some waste not being accepted. The Strategic Waste Manager advised that he would look in to this issue. In addition he advised that carpets would not be accepted at some sites. Further discussion took place regarding the policy on retrieval of bins following waste collection and some of the issues that this was causing for example within Durham City. Resolved: That the content of the report be noted. 7 Update on Waste Programme The Committee received a joint report and presentation of the Assistant Chief Executive and Corporate Director Neighbourhoods which provided information regarding the introduction of the new waste contract which was established from 1 June 2013 (for copy of report and slides of presentation see file of Minutes). The Strategic Waste Manager advised that following the decision to replace the existing integrated contract operated by the Councils LAWDC, Premier Waste Management, a further decision was made to source separate contracts for all aspects of the councils waste management functions (excluding collection). Which came in to effect from 1 June 2013. The three areas which had been identified were as follows:
• Treatment and Disposal of Residual Waste
• Household Waste Recycling Centre (HWRC) Operating Contract
• Haulage of kerbside collected wastes form Waste Transfer Stations to waste facilities.
Details were then provided as the estimated cost savings to the council resulting from the new contracts noting that residual waste treatment service which would be provided by SITA would result in savings of £17m over the duration of the contract. The contract to deal with HWRC, £9.9m worth of savings and Haulage £7m+. An explanation was also provided regarding the duration of each contract and the flexibility within each, to opt out extend. Aside from the huge financial benefits that the new contracts brought the environmental benefits were also significant. It was reported that by 2014/15 the council would be
Page 3

diverting only 10% of residual waste to landfill. The Strategic Waste Manager advised that methane produced from landfill sites was 23 times more damaging to the atmosphere than C02. With regard to the waste treatment contract it was noted that the SITA plant, based in Tees Valley, operated controlled emissions using extensive exhaust gas cleaning technology producing less than 3% fly-ash, which was then extracted and reused as construction aggregate. The Strategic Waste Manager advised that the SITA site covered an extensive area and had recently extended to accommodate to two further furnaces which would deal with Durham’s waste. It was noted that members would have an opportunity to visit the site in September 2013. The Strategic Waste Manager then gave an update on the new Household Waste Recycling Centre contract which was target led. It was noted that since the implementation of the new contract on 1 June 2013 generally good feedback had been received. Moving on to provide an update in respect of the Haulage contract it was noted that SITA sub contracted their Haulage to Hargreaves Transport. It was noted that the contract cost over the initial 5 years would be approximately £7m, however this would depend upon the tonnage delivered to the WTS’s. It was therefore difficult at this stage to estimate savings. It was also reported that there was huge flexibility in combining haulage and residual waste and a number of variable combinations. Discussion then ensued regarding how the waste was transferred from the refuse vehicles to the haulage wagons. The Strategic Waste Manager advised that waste was taken to the waste centres where a shovel driver would load the waste on to the haulage vehicles. A further query was raised as to what impact this process would have upon the council’s carbon footprint. It was noted that in year one of the contract benchmarking would be carried out, thereafter the contractor was obligated to reduce C02 emissions year on year. Councillor Armstrong added that the officers involved with the organisation and implementation of the contract deserved a special mention for their excellent work on this project. Councillor Adam commented whether consideration had been given to rail transport for the transportation of waste to SITA. In response the Strategic Waste Manager advised that this option had indeed been considered, however it was found that this option would only be viable on a longer term contract of around 25/30 years. Further discussion took place regarding the tender process and the conditions that had been written in to the contract, with specific reference to the cleaning up of surrounding areas of the HWRC’s. It was noted that there was a boundary around the sites which could be enforced under the new contract, however the wider area would still be covered by the DDC street scene team. Councillor Holland raised a query with regard to the sealing of waste within the haulage containers and what measures were taken to ensure that there was no flying waste during transportation.
Page 4

Mr T Bolton then asked whether waste from the North would be transferred to Byker for processing. The Strategic Waste Manager confirmed that this would be the case. Resolved: That the content of the report and presentation be noted. 8 Overview of the County Durham Climate Change Delivery Plan The Committee considered a joint report and presentation of the Assistant Chief Executive and Corporate Director, Regeneration and Economic Development which provided an overview of progress on the County Durham Climate Change Strategy and the programme for the next 12 months (for copy of report and slides of presentation see file of Minutes). The Sustainability and Climate Change Team Leader commenced by providing a brief introduction and background the delivery plan. She then invited the Senior Sustainability and Climate Change Officer to report on the drivers behind the Strategy, noting that gradual increases in mean annual temperatures and increases in energy prices had indicated that climate change was impacting upon our weather. Details were then provided regarding the key objectives of the strategy and the 7 main themes, which were:
• Public Sector Performance
• Low Carbon Economy
• Built Environment
• Natural Environment
• Transport and Infrastructure
• Community Engagement
• Impacts Beyond our Boundaries. Further information was then presented regarding the delivery plan and the example projects which would be undertaken. The presentation went on to detail progress on reducing emissions and the work which was being undertaken to engage with communities and local groups to improve efficiency and install renewables. Further information was circulated to members for their consideration. In conclusion the Senior Sustainability and Climate Change Officer advised that there was to be a formal consultation planned for during July / August on the Strategy, and further engagement would be undertaken with local representatives to ensure that they were fully aware of the key drivers, risks, opportunities and support that was available to them. Following the period of consultation a communications plan would be developed including information on the availability of grants, identifying skill shortages in communities and highlighting opportunities. Councillor Adam commented that he felt that the real focus should be upon reducing domestic C02 and reference was made to the use of solar and PV panels. In addition he queried what was being done to assist those who could not afford to install solar / PV.
Page 5

Councillor Holland commented that considering what was happening in countries such as China, what we could contribute to climate change was trivial however he did agree that we should aim to be energy self sufficient, and suggested that more should be done to ensure that developers incorporated 100% renewable energy in to new developments as currently only 10% was required under the council’s planning policy. He therefore suggested that there were massive opportunities to encourage self sufficiency via the planning process. Councillor Armstrong commented that he agreed that the council could do more via the planning process however it should be noted that the inclusion of renewable technologies could ultimately raise housing prices and a balance needs to be struck to ensure that affordable housing can still be provided. It was therefore suggested that it would be useful for the Head of Planning and Assets to attend a future meeting to discuss this further. Mr D Easton raised a query regarding the increases in water levels and questioned what the council were doing to deal with this problem. The Sustainability and Climate Change Team Leader advised that work was being undertaken by the Environment Agency alongside partners to look at this issue. In addition the council were looking at how services within the council were affected by climate change and what the economic costs of such were. Resolved: That the content of the report and presentation be noted. In addition the Head of Planning and Assets should be invited to attend a future meeting to discuss renewable energy technologies in new development. 9 Refresh of the work programme for the Environment and Sustainability Overview and Scrutiny Committee The committee received a report of the Assistant Chief Executive which provided for Member’s consideration an updated work programme for the Environment and Sustainable Communities Overview & Scrutiny Committee for 2013-2015 (for copy of report see file of Minutes). The Corporate Performance Manager referred members to appendix 2 of the report which outlined in detail the areas of work which had been identified for either review, overview / progress along with standard performance and budget reporting. It was noted that the Committee were yet to identify further topics for investigation via working groups or light touch reviews, however two site visits had been scheduled both Thrislington and Raisby Quarries in July 2013 and SITA in September 2013. Councillor Graham suggested that the following additional items be included in the work programme as follows:
• Flooding – the impact of; and policy and procedures for responding to incidents of flooding.
• Potholes – overview
• Reinstatement works and repairs. Councillor Armstrong suggested that any review work undertaken in respect of flooding should be done so in partnership with the Environment Agency. In addition it would be
Page 6

useful to ask the Head of Technical Services to attend a future meeting. In addition to the items raised by Councillor Graham he further suggested that the committee review the street lighting strategy and cost benefits. Councillor Stradling added that a small light touch review consisting of members located on the east of the county, may also be wish to review the Tyne and Wear Aquifier scheme as there was still very little information being received by the Coal Authority on this matter. Councillor Clare raised a query as to why the setting up of a charitable trust to manage the council’s Sport, Leisure, Cultural and Library Services was included within the committee’s work programme. In response Councillor Armstrong added that sports fields and parks were included within the remit of the committee and therefore the main reason for its inclusion. Councillor Clare further made reference to the absence of issues relating to biodiversity and AONB and in particular how these services were coping under increased cuts / savings. In response the Customer Relations, Policy and Performance Manager advised that an update could be provided on the Local Nature Partnership at a future meeting. In conclusion the Corporate Performance Manager advised that members had therefore indicated the following items as areas for inclusion within the work programme:-
• Flooding – mitigating against
• Potholes
• Lighting
• Biodiversity
• Air quality. Resolved: That the content of the report be noted and that the issues raised be included in the work programme. 10 Minutes of the meeting of the County Durham Environment Partnership Board held on 13th February 2013. Resolved: That the minutes of the meeting of the County Durham Environment Partnership Board held on 13 February 2013 be received.
Page 7

Page 8
This page is intentionally left blank
Page 1 of 6
Purpose of the report 1 To set out details of the final outturn as at Quarter 4 for 2012/13, highlighting
variances against revenue and capital budgets for Neighbourhood Services. Neighbourhood Services Revenue 2012/2013 2 The final 2012/13 Revenue Outturn position for Neighbourhood Services was an
under spend against the cash limit of £0.419m. This takes into account adjustments for sums outside the cash limit such as redundancy costs which are met from the strategic reserves, year end capital accounting entries and use of / contributions to earmarked reserves.
Analysis by Head of Service 3 The summary of the revenue outturn position, is shown in the following table analysed
by Head of Service:
Head of Service
Revised Base Budget 2012/13
£’000
QTR 4 Report
Final Outturn
(Apr-Mar)
£’000
Variance
Over/ (Under)
£’000
Reserves /
outside cash limit
£’000
Cash limit Variance
Over/ (Under)
£’000
Central Costs 1,623 9,556 7,933 (7,460) 473
Direct Services 36,114 35,149 (965) 302 (663)
Env, Health & C. Prot 7,154 5,048 (2,106) 1,612 (494)
Proj & Business Serv 19,900 19,867 (33) (1,409) (1,442)
Culture & Sport 23,279 21,597 (1,682) 1,974 292
Technical Services 26,018 10,032 (15,986) 17,401 1,415
Total 114,088 101,249 (12,839) 12,420 (419)
4 The underspend was a managed position, reflecting the proactive management of
activity by Heads of Service across Neighbourhoods to bring spend within the cash limit, having previously forecast an overspend position. The main reasons contributing to the outturn position were as follows:
• There was a shortfall of £1.4m in the surplus generated within Highways Services. This was primarily due to reduced levels of workload across the
Environment and Sustainable Communities Overview and Scrutiny Committee 26 September 2013 NEIGHBOURHOOD SERVICES QUARTER 4 REVENUE & CAPITAL OUTTURN 2012 / 2013
Report of Neighbourhood Services Management Team
Agenda Item 7
Page 9

Page 2 of 6
year. Progress has been made to downsize the workforce in order to align it with a more sustainable level of income for 2013/14.
• There was an overspend of £0.300m within Direct Services due a fall in the income from the sale of dry recyclates as a result of falling market prices.
• In order to mitigate against previously identified overspends, Neighbourhoods Management Team instigated an exercise during the financial year to further identify areas of the budget where costs could be saved on a one-off basis within the service. As a result, an underspend of approximately £0.700m was achieved on supplies and services across all areas of Neighbourhood Services.
• There was also an underspend of £1.0m within Strategic Waste, associated with savings from reduced levels of waste being generated, principally due to the economic climate, and the introduction of Alternate Weekly Collections, which increased diversion from landfill by more than was forecast.
• Finally, there was an underspend of approximately £0.400m within the service associated with both the Environment, Health and Consumer Protection service and Projects and Business Services where a number of planned MTFP savings from 2013/14 were achieved early.
5 Subsequent to the quarter 3 forecast outturn report, the following items have been
excluded from the outturn in arriving at the cash limit:
• An additional overspend on Winter Maintenance activities of £0.311m
• Other sums outside the cash limit include costs in respect of capital accounting entries, and central administration recharges.
6 In addition, the Service is making a net contribution to earmarked reserves of £0.545m, made up as follows
• £0.424m relates to a contribution to earmarked reserves in respect of Culture and Sport,
• £0.698m relates to a contribution to earmarked reserves in respect of Highways and Waste Disposal,
• £1.609m relates to a contribution to earmarked reserves in respect of Buildings and Grounds Maintenance, and Street Cleaning,
• £0.294m relates to a contribution to earmarked reserves for Environmental Health, and
• £0.110m relates to a contribution to earmarked reserves for Customer Services.
• Neighbourhood Services have incurred £0.404m in respect of additional ER/VR costs, and £2.186m for additional Insurance charges. Both these sums were funded corporately from earmarked reserves held centrally
7 Taking the outturn position into account, the Cash Limit Reserve to be carried forward
for Neighbourhood Services is £2.311m.
Page 10

Page 3 of 6
Neighbourhood Services Capital 2012 / 2013 8 The following table sets out details of final outturn in the period 1 April to 31 March analysed by individual Heads of Service areas within the Neighbourhoods capital programme against the revised budget.
Head of Service Revised Budget £’000
Outturn £’000s
Variance £’000s
Overspends financed by RED / ACE budgets &
budgets from 2013/14 £’000s
Unspent budgets given
up to Contingencies
£’000s Variance £’000s
EH&CP 30 16 (14) 0 0 (14)
Technical Services 18,173 15,548 (2,625) (79) 0 (2,704)
Direct Services 4,903 2,874 (2,029) 0 769 (1,260)
P & B Services 43 19 (24) 0 0 (24)
Culture and Sport 3,255 2,369 (886) (702) 207 (1,381)
Total 26,403 20,826 (5,578) (781) 976 (5,384)
9 The 2012/13 outturn capital spend for Neighbourhood Services was £20.826m,
against a quarter 3 revised budget of £26.403m, resulting in a £5.578m under spend for the year.
10 The Capital Member/Officer Working Group met to review the outturn against the agreed programme on a scheme by scheme basis, and reasons for any slippage and necessary re-profiling were thoroughly challenged.
11 Included in the capital outturn position is overspending on schemes financed by additional capital grants and contributions that were not included in the budget of £0.702m and accelerated spend on 2013/14 schemes that have been brought forward and commenced in quarter 4 of £0.079m.
12 Planned and budgeted capital expenditure of £5.384m will be re-profiled into 2013/14 and budgets adjusted in year accordingly.
13 In addition, there were Neighbourhood’s capital budgets of £0.976m that were no longer required and were therefore released back to Capital contingencies.
14 The main areas where re-profiling was requested to be carried forward were in
respect of the following schemes : Highway Capitalised Maintenance Schemes - £1.500m under spend The programme of works for this budget was not completed within the financial year. This was mainly due to the adverse weather conditions in the last quarter of the financial year resulting in a delay in completing schemes along with the requirement to complete other emergency works. It is anticipated that the remaining schemes will be completed in 2013/14.
Page 11

Page 4 of 6
Local Area Members Allowance - £0.644m under spend This budget is solely reliant on Members to commission schemes. Following delays in schemes being commissioned, a letter was sent to Members to prompt this in February 2013 and as a result of this a number of schemes were ordered in the last quarter of 2012/13and these outstanding schemes will be completed in the first half of the 2013/14. Browney Lane – Burnigill Bank - £0.182m under spend This project is to alleviate a long term subsidence problem and is being delivered in partnership with Network Rail. An agreement is yet to be reached regarding land access. Negotiations are continuing between Network Rail and the landowner relating this issue and it is anticipated that progress will be made in 2013/14. Vehicle & Plant replacement programme - £0.233m under spend This is an ongoing programme to replace Vehicles and Plant throughout DCC as and when required. MOWG agreed to carry this forward to enhance the 2013/14 budget. Oracle Projects Module - £0.145m under spend This project involves the introduction of hand held technology within Building Services. The budget is fully committed in terms of orders and the remaining expenditure will be incurred in 2013/14. Live Track System - £0.247m under spend This project involves the introduction of route optimisation and real time communication software in refuse vehicles. The budget is fully committed and it is envisaged that all costs will be received by September 2013. Environmental and Bereavement Improvements - £0.243m under spend Weather conditions during February and March caused delays in completing projects within this budget, so it was agreed to carry over this budget to 2013/14. Blackhill Park – Flood repair - £0.180 under spend Adverse weather conditions have caused delays in progressing with this project, which has continued into April 2013 and was due for completion by end of May 2013 Sport & Leisure Structural Maintenance - £0.245m under spend Several major projects have now been completed and are awaiting final costs. A number of projects require agreement and input from partners and this has led to delays. However, projects will be completed early in the new financial year. Refurbishment of Outdoor Sport & Leisure Facilities - £0.219m under spend The programme of works for this budget was not completed within the financial year. It is anticipated that the remaining schemes will be completed in the first quarter of 2013/14. Culture & Libraries - £0.250m under spend This underspend relates to continued projects associated with the cultural programme and also the Library Modernisation budget, where works will continue into 2013/14. Outdoor Play Areas/AAP Schemes- £0.267m under spend A number of outdoor Play schemes and AAP funded schemes relating to both indoor and outdoor play are still to complete and it was agreed that these be re-profiled into 2013/14.
Page 12

Page 5 of 6
Recommendations 12 It is recommended that:
• Overview and Scrutiny note the final 2012/13 outturn position on Revenue and Capital.
Contact: Terry Collins Tel: 03000 268080 Phil Curran Tel: 03000 261967
Page 13

Page 6 of 6
APPENDIX 1 - Implications
Finance
To set out details of the year end outturn, highlighting areas of over / underspend against the revenue and capital budgets for Neighbourhood Services, at each Head of Service level and for the whole of Neighbourhood Services.
Staffing
There are no implications associated with this report. Risk
There are no implications associated with this report.
Equality and Diversity/Public Sector Equality Duty
There are no implications associated with this report. Accommodation
There are no implications associated with this report. Crime and Disorder
There are no implications associated with this report. Human Rights
There are no implications associated with this report. Consultation
There are no implications associated with this report. Procurement
There are no implications associated with this report.
Disability Issues There are no implications associated with this report. Legal Implications There are no implications associated with this report.
Page 14

Page 1 of 4
Purpose of the report 1 To set out details of the forecast outturn as at Quarter 1 for 2013/14, highlighting
variances against revenue and capital budgets for Neighbourhood Services. Neighbourhood Services Revenue 2013/2014 Executive Summary 2 The Q1 forecast for the 2013/14 Revenue Outturn for Neighbourhood Services was
an under spend against the cash limit of £0.248m. This takes into account adjustments for sums outside the cash limit such as redundancy costs which are met from the strategic reserves, and use of / contributions to earmarked reserves.
ANALYSIS BY HEAD OF SERVICE 3 The summary of the revenue outturn position, is shown in the following table analysed
by Head of Service:
Head of Service
Revised Base Budget 2013/14
£’000
QTR 1 Report
Quarter 1 Forecast (Apr-Mar)
£’000
Variance
Over/ (Under)
£’000
Reserves /
outside cash limit
£’000
Cash limit Variance
Over/ (Under)
£’000
Central Costs 1,847 1,601 (246) 0 (246)
Direct Services 38,115 38,363 248 (229) 19
Env, Health & C. Prot 6,335 6,466 131 (110) 21
Proj & Business Serv 16,442 17,014 572 (410) 162
Culture & Sport 22,814 23,975 1,161 (1,290) (129)
Technical Services 24,171 24,479 308 (383) (75)
Total 109,724 111,502 2,174 (2,422) (248)
4 The forecast revenue outturn for 2013/14 is a cash limit underspend of £0.248m, after
taking account of the forecast use of reserves, and items outside the cash limit.
5 Since the original budget was presented to Council, the Neighbourhoods revenue budget has been increased to take into account the appeal outcomes of the pay and reward project (£0.175m), additional funding from contingencies for flood investigations (£0.25m) and some minor transfers from Neighbourhood Services to
Environment and Sustainable Communities Overview and Scrutiny Committee 26 September 2013 NEIGHBOURHOOD SERVICES QUARTER 1 REVENUE & CAPITAL OUTTURN 2013 / 2014
Report of Neighbourhood Services Management Team
Page 15

Page 2 of 4
other Service Groupings. This has resulted in a revised revenue budget of £109.724m.
6 The projected underspend of £0.248m is due to savings on supplies and services across the whole of Neighbourhoods.
7 The forecast outturn is net of an area of expenditure within Neighbourhood Services that has been treated as being outside the cash limit. This is;
• Due to the delay in the implementation of the proposed management transfer into a Culture and Leisure Trust, there is a projected overspend of £0.640m on NNDR costs, as the MTFP saving assumed that these would be saved through the introduction of the Trust. It has been agreed that £0.440m of this should be treated as being outside the cash limit, while the remaining £0.200m can be mitigated by savings within the Service Grouping. The majority of this will come from a projected underspend of £0.130m within Libraries, where some elements of the 2014/15 MTFP savings in this area have been achieved earlier than originally scheduled, resulting in this underspend.
8 At this stage of the year, there are four specific areas of overspend that are planned
to be mitigated by the use of Neighbourhood Services’ cash limit reserve. These are in respect of the delayed School Crossing Patrol savings (£47k), Customer Services alterations at Clayport Customer Access Point (£34k), and also within Technical Services, where there is a projected overspend of approximately £50k associated with the engagement of Street Lighting Metering consultants. In addition, £100k from the cash limit reserve is being used to address a backlog of drainage investigations that will help to reduce the future impact of flooding.
9 Taking the projected outturn position into account, including items proposed to be treated as outside the cash limit, the forecasted cash limit reserve to be carried forward for Neighbourhood Services is £2.189m
Neighbourhood Services Capital 2013 / 2014 10 The following table sets out details of forecast spend in the period 1 April to 31 March analysed by individual Heads of Service areas within the Neighbourhoods capital programme against the revised budget.
Head of Service Revised Budget
£’000 Outturn £’000s
Variance £’000s
EH&CP 14 14 0
Technical Services 25,588 24,397 (1,191)
Direct Services 6,458 6,458 0
P & B Services 4,008 4,008 0
Culture and Sport 3,378 3,378 0
Total 39,446 38,255 (1,191)
Page 16

Page 3 of 4
11 The original NS Capital Programme 2013/14 was £32.533m. Re-profiling of budget from 2012/13 of £5.673m was then agreed at the Capital Member/Officer Working Group on 14 May 2013. This resulted initially in a revised budget of £38.206m.
12 Additional capital budgets of £1.241m were then identified in 2013/14 and budgets have been adjusted in year accordingly.
13 This has now resulted in a revised 2013/14 Capital Programme of £39.446m. It is currently anticipated that the £38.255m will be spent in 2013/14, resulting in a forecast underspend of £1.191m. This forecast will however be closely monitored and revised throughout the remaining year.
14 The main reasons for this variance are as follows;
• Seaham North Pier - £1.7m underspend -The scheme is still currently in the process of design. The latest risk assessment suggests there is no immediate threat of structural damage; however it is still a high risk project which must be completed. As a result this scheme is anticipated to slip into next financial year.
• Street Lighting Invest to Save - £0.504m overspend -This is a six year scheme which is projecting an overspend in the first year of construction. Budgets in subsequent years will be re-profiled accordingly. The overspend is due to an increased projection in the number of units which will be installed during 2013/14. This will result in earlier realisation of anticipated revenue savings related to energy costs.
Recommendations 15 It is recommended that:
• Overview and Scrutiny note the Quarter 1 forecast outturn position on Revenue and Capital for 2013/14.
Contact: Terry Collins Tel: 03000 268080 Phil Curran Tel: 03000 261967
Page 17

Page 4 of 4
APPENDIX 1 - Implications
Finance
To set out details of the Q1 forecast outturn, highlighting areas of over / underspend against the revenue and capital budgets for Neighbourhood Services, at each Head of Service level and for the whole of Neighbourhood Services.
Staffing
There are no implications associated with this report. Risk
There are no implications associated with this report.
Equality and Diversity/Public Sector Equality Duty
There are no implications associated with this report. Accommodation
There are no implications associated with this report. Crime and Disorder
There are no implications associated with this report. Human Rights
There are no implications associated with this report. Consultation
There are no implications associated with this report. Procurement
There are no implications associated with this report.
Disability Issues There are no implications associated with this report. Legal Implications There are no implications associated with this report.
Page 18

Environment and Sustainable Communities Overview and Scrutiny Committee 26 September 2013 Quarter 1 2013/14 Performance Management Report
Report of Corporate Management Team Lorraine O’Donnell, Assistant Chief Executive Councillor Simon Henig, Leader
Purpose of the Report
1. To present progress against the council’s corporate basket of performance indicators (PIs) for the Altogether Greener theme and report other significant performance issues for the first quarter of 2013/14.
Background
2. This is the first quarterly corporate performance report of 2013/14 for the council highlighting performance for the period April to June 2013. The report contains information on key performance indicators, risks and Council Plan progress.
3. The report sets out an overview of performance and progress by Altogether priority theme.
Key performance indicator progress is reported against two indicator types which comprise of:
a. Key target indicators – targets are set for indicators where improvements can be measured regularly and where improvement can be actively influenced by the council and its partners; and
b. Key tracker indicators – performance will be tracked but no targets are set for indicators which are long-term and/or which the council and its partners only partially influence.
4. A summary of key performance indicators is provided at Appendix 3. More detailed
performance information and Altogether theme analyses are available on request from [email protected].
Developments since last quarter
5. Extensive work has been undertaken by all services to develop a revised 2013/14 corporate set of indicators. This set of indicators is based around our six Altogether priority themes and will be used to measure the performance of both the council and the County Durham Partnership.
6. Specific changes to note in respect to the corporate indicator set include:
a. There is to be a stronger focus this year on volume measures in our performance framework. This will allow us to better quantify productivity in the forthcoming year and to monitor the effects of reductions in resources and increases in volume driven by the economic situation and national policy changes such as welfare reform.
Agenda Item 8
Page 19

b. This year has seen a number of satisfaction indicators removed from the corporate indicator set mainly due to increasing intervals that surveys are carried out. Options are being considered to report measures of satisfaction through another process.
Page 20

Altogether Greener: Overview
Council Performance 7. Key achievements this quarter include:
a. Household recycling collected from the kerbside has been split between recycling and composting this year. Household recycling collected from the kerbside represented 22.3% of overall household waste collected and exceeded the 19% target this quarter. Performance has improved by 37.6% compared to the same period last year. Similarly, household composting collected from the kerbside represented 10.8% of overall household waste collected and exceeded this quarter target of 10.1%. Performance has improved by 12.5% compared to the same period last year.
b. During the 12 months ending June 2013, 46.8% of household waste was re-used, recycled or composted. Performance has improved from 43.3% reported 12 months earlier and was better than the 44% target.
8. The key performance improvement issues for this theme are:
a. The percentage of municipal waste landfilled for the 12 month period to May 2013 was estimated as 37.8% which had decreased from 42.3% reported at previous quarter. Performance was worse than the 35% target. However, a small decrease in the amount of waste going to landfill is expected during 2013/14, year 1 of the contract, and this downward trend will continue in the following years.
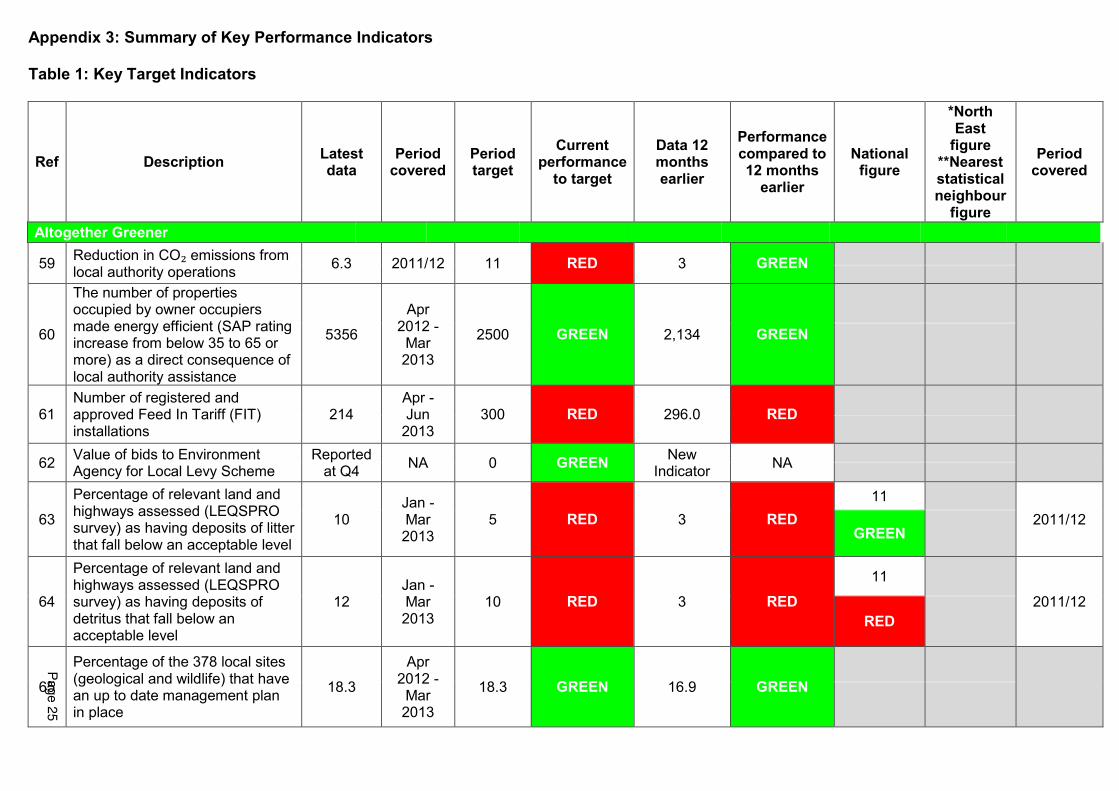
b. There were 214 feed in tariff installations registered and approved during quarter 1; 213 Solar PV and 1 wind installation equating to installed capacity of 0.727MW. The quarter 1 target of 300 installations was not achieved. There has been an increase of 13.1% in renewable energy generation this quarter compared to the same period last year. The installed or installed/approved capacity within County Durham was 200.99MW in quarter 1; 168.77 MW operational (wind 128.33) and 32.223 approved (wind 6.06).
c. There is one Council Plan action behind target, which is Delivery of the Limestone Landscapes Heritage Lottery Fund programme, including the consolidation of Hawthorn Hythe Lime Kiln and Field training for staff and volunteers. This was due for completion by November 2013. Due to timescales changing, following further in depth service planning discussions within the RED service grouping, the date has been revised to September 2014.
4,
36%
6,
46%
7,
64%
7,
54%
3
1
Direction of travel
Performance against
target
Target Performance indicators
Red
Green
NA
2,
100%5Direction of travel
Tracker Performance indicators
Green
NA
1,
5%
15,
79%
2,
11%
1,
5%Performance against target
ActionsRed
Green
White
Deleted
Page 21

d. There is also one Council Plan action to be deleted which is to develop an approach to providing fuel efficient pool vehicles at major depots to manage and reduce business mileage. This action is to be merged into the review of transport taking place within Neighbourhood Services.
9. Tracker indicators for this priority theme (see Appendix 3, table 2) show:
a. The volume of fly-tipping incidents has seen a reducing trend over 2012/13 compared with incidents reported during 2011/12. Fewer fly-tipping incidents were reported this period, compared to the same period last year, although incidents have increased this quarter compared with the previous quarter. There were 6,655 fly-tipping incidents reported for the 12 month rolling period to June 2013 compared with 6,390 for the period to March 2013 (see Appendix 4). Out of 1,913 fly-tipping incidents reported this quarter, 1492 fly-tipping incidents were investigated, which represents 78%.
b. CO₂ emissions in County Durham has achieved 41.2% reduction during 2011/12
compared to 25.1% reduction in 2010/11. The target of 40% reduction was met in 2011/12. However, this will have much to do with the economy and the reduced output from within County Durham and is similar to most UK authorities.
10. The key risk to successfully delivering the objectives of this theme is failure to identify and effectively regulate contaminated land. Management consider it possible that this risk will occur, which will impact on both public health and environmental sustainability across the county. A Contaminated Land Strategy has been approved, and two phases of the inspection have been completed, and a budget has been allocated to fund 2013/14 inspection programmes.
Recommendation
11. That the Environment and Sustainability Communities Overview and Scrutiny Committee
receive the report and consider any performance issues arising there from.
Contact: Jenny Haworth, Head of Planning and Performance Tel: 03000 268071 E-Mail [email protected]
Page 22

Appendix 1: Implications
Finance
Latest performance information is being used to inform corporate, service and financial planning.
Staffing
Performance against a number of relevant corporate health PIs has been included to monitor staffing levels and absence rates.
Risk
Reporting of significant risks and their interaction with performance is integrated into the quarterly monitoring report.
Equality and Diversity/Public Sector Equality Duty
Corporate health PIs and key actions relating to equality and diversity issues are monitored as part of the performance monitoring process.
Accommodation
Not applicable
Crime and Disorder
A number of PIs and key actions relating to crime and disorder are continually monitored in partnership with Durham Constabulary.
Human Rights
Not applicable
Consultation
Not applicable
Procurement
Not applicable
Disability Issues
Corporate health PIs and key actions relating to accessibility issues and employees with a disability are monitored as part of the performance monitoring process.
Legal Implications
Not applicable
Page 23

Appendix 2: Key to symbols used within the report
Where icons appear in this report, they have been applied to the most recently available information.
Performance Indicators: Direction of travel Performance against target
Actions:
Benchmarking:
Latest reported data have improved from comparable period
GREEN Performance better than target
Latest reported data remain in line with comparable period
AMBER Getting there - performance
approaching target (within 2%)
Latest reported data have deteriorated from comparable period
RED Performance >2% behind target
WHITE Complete. (Action achieved by deadline/achieved ahead of
deadline)
GREEN Action on track to be achieved by the deadline
RED Action not achieved by the deadline/unlikely to be achieved by the
deadline
GREEN Performance better than other authorities based on latest
benchmarking information available
AMBER Performance in line with other authorities based on latest
benchmarking information available
RED Performance worse than other authorities based on latest
benchmarking information available
Page 24
Appendix 3: Summary of Key Performance Indicators Table 1: Key Target Indicators
Ref Description Latest data
Period covered
Period target
Current performance
to target
Data 12 months earlier
Performance compared to 12 months
earlier
National figure
*North East
figure **Nearest statistical neighbour
figure
Period covered
Altogether Greener
59 Reduction in CO₂ emissions from local authority operations
6.3 2011/12 11 RED 3 GREEN No Data No Data No Period
Specified N/A N/A
60
The number of properties occupied by owner occupiers made energy efficient (SAP rating increase from below 35 to 65 or more) as a direct consequence of local authority assistance
5356
Apr 2012 -
Mar 2013
2500 GREEN 2,134 GREEN
No Data No Data
No Period Specified
N/A N/A
61 Number of registered and approved Feed In Tariff (FIT) installations
214 Apr - Jun
2013 300 RED 296.0 RED
No Data No Data No Period Specified N/A N/A
62 Value of bids to Environment Agency for Local Levy Scheme
Reported at Q4
NA 0 GREEN New
Indicator NA
No Data No Data No Period Specified N/A N/A
63
Percentage of relevant land and highways assessed (LEQSPRO survey) as having deposits of litter that fall below an acceptable level
10 Jan - Mar 2013
5 RED 3 RED
11 No Data
2011/12 GREEN N/A
64
Percentage of relevant land and highways assessed (LEQSPRO survey) as having deposits of detritus that fall below an acceptable level
12 Jan - Mar 2013
10 RED 3 RED
11 No Data
2011/12
RED N/A
65
Percentage of the 378 local sites (geological and wildlife) that have an up to date management plan in place
18.3
Apr 2012 -
Mar 2013
18.3 GREEN 16.9 GREEN
No Data No Data No Period Specified
N/A N/A
Page 2
5

Ref Description Latest data
Period covered
Period target
Current performance
to target
Data 12 months earlier
Performance compared to 12 months
earlier
National figure
*North East
figure **Nearest statistical neighbour
figure
Period covered
66 Area of council owned woodland brought into positive management
Reported Q4
NA 50 GREEN New
indicator NA
No Data No Data No Period Specified N/A N/A
67
Percentage of the 94 conservation areas in the county that have an up to date character appraisal.
34 as at Jun
2013 37 RED NA NA
No Data No Data No Period Specified
N/A N/A
68 Number of additional heritage assets that are open for Heritage Open Days
34
Apr 2012- Mar 2013
NA NA 13 GREEN No Data No Data
No Period Specified
N/A N/A
69 Percentage of household waste that is re-used, recycled or composted
46.8 Jun 12 - May 13
44.0 GREEN 43.3 GREEN 43.6 37.5* Oct 2011 -
Sep 2012 GREEN GREEN
70 Percentage of household waste collected from the kerbside - recycling
22.3 Jun 12 - May 13
19.0 GREEN 16 GREEN No Data No Data No Period
Specified N/A N/A
71 Percentage of household waste collected from the kerbside - composting
10.8 Jun 12 - May 13
10.1 GREEN 10 GREEN No Data No Data No Period
Specified N/A N/A
72 Percentage of municipal waste landfilled
37.8 Jun 12 - May 13
35.0 RED 33.6 RED 35.0 32.8* Oct 2011- Sep 2012
Pa
ge 2
6

Table 2: Key Tracker Indicators
Ref Description Latest data
Period covered
Previous period data
Performance compared to
previous period
Data 12 months earlier
Performance compared to 12 months
earlier
National figure
*North East
figure **Nearest statistical neighbour
figure
Period covered
Altogether Greener
160 Reduction in CO₂ emissions
in County Durham by 40% by 2020
41.2 As at Dec 2011
25.1 GREEN 25.1 GREEN 6 18*
2009 GREEN GREEN
161
Renewable energy generation -MwE installed or installed/ approved capacity within County Durham
200.99 As at 10
July 2013
198.35 Not
comparable [1]
177.76 Not
comparable
No Data No Data No Period Specified
N/A N/A
162 Number of fly-tipping incidents reported
6,655 Jul 12 - Jun 13
6,390 RED 6,791 GREEN No Data No Data No Period
Specified N/A N/A
163 Percentage of fly tipping incidents that have been investigated
78 Apr -
Jun 13 New
Indicator NA
New Indicator
NA No Data No Data
No Period Specified N/A N/A
164 Number of prosecutions by Durham County Council in response to fly tipping
Reported at Q2
NA New
Indicator NA
New Indicator
NA
No Data No Data No Period Specified
N/A N/A
165 Net change in the number of sites on the Heritage at Risk Register
Data due Q3
2012/13 0 NA 0 NA No Data No Data
No Period Specified N/A N/A
166
Net change in the number of sites at ‘high risk’ on previous years Heritage at Risk register
Data due Q3
2012 0 NA 0 NA No Data No Data No Period Specified
[1] This data is cumulative year on year
Page 2
7

Appendix 4: Volume measures
Fly tipping incidents reported
Q4 Q1 Q2 Q3 Q4 Q1 Q2 Q3 Q4
2011/12 2012/13 2013/14
Number 7,516 6,791 6,875 6,568 6,390 6,655
5800
6000
6200
6400
6600
6800
7000
7200
7400
7600
7800
Page 28

Environment and Sustainable Communities Overview and Scrutiny Committee 26th September 2013 Limestone Landscapes - visit to Thrislington and Raisby Quarries
Joint report of Lorraine O’Donnell, Assistant Chief Executive and Terry Collins, Corporate Director, Neighbourhoods
Purpose of the Report
1 To provide Members of the Environment and Sustainable Communities Overview and Scrutiny Committee with supporting information in advance of a presentation on Limestone Landscapes within County Durham and details of a recent visit undertaken by members of the committee to Thrislington and Raisby quarries.
Background 2 In July 2011 the Environment and Sustainable Communities Overview
and Scrutiny Committee received an overview presentation on the Limestone Landscapes Programme and the work of the Limestone Landscapes Partnership within County Durham. Following the presentation it was suggested that the committee would receive a further update when appropriate on the development of the project.
3 At the meeting of the Environment and Sustainable Communities
Overview and Scrutiny Committee held on the 21st June, 2013 members considered the refresh of the committee’s work programme for 2013 -2015. As part of the refresh of the work programme it was agreed by members that a visit should be undertaken by the committee to Limestone Landscapes within County Durham so that members could see ‘first hand’ the development work undertaken by Durham County Council and partners in relation to the Limestone Landscapes Programme.
4 Accordingly, arrangements were made for a visit to be undertaken on the 10th July, 2013 to Thrislington and Raisby quarries providing an opportunity for members to see various flora and vegetation, mammals, reptiles, amphibians, invertebrates and butterflies that inhabit the sites and to receive information on the work undertaken including the aftercare conditions and opportunities for further development in the future.
5 The feedback from those members, who attended the visit on the
10th July, 2013 was very positive and it was therefore thought appropriate that a presentation be given to the committee at the meeting on the 26th September, 2013 providing an overview on the
Agenda Item 9
Page 29
2
Limestone Landscapes together with information and photographs from the visit undertaken by the Committee.
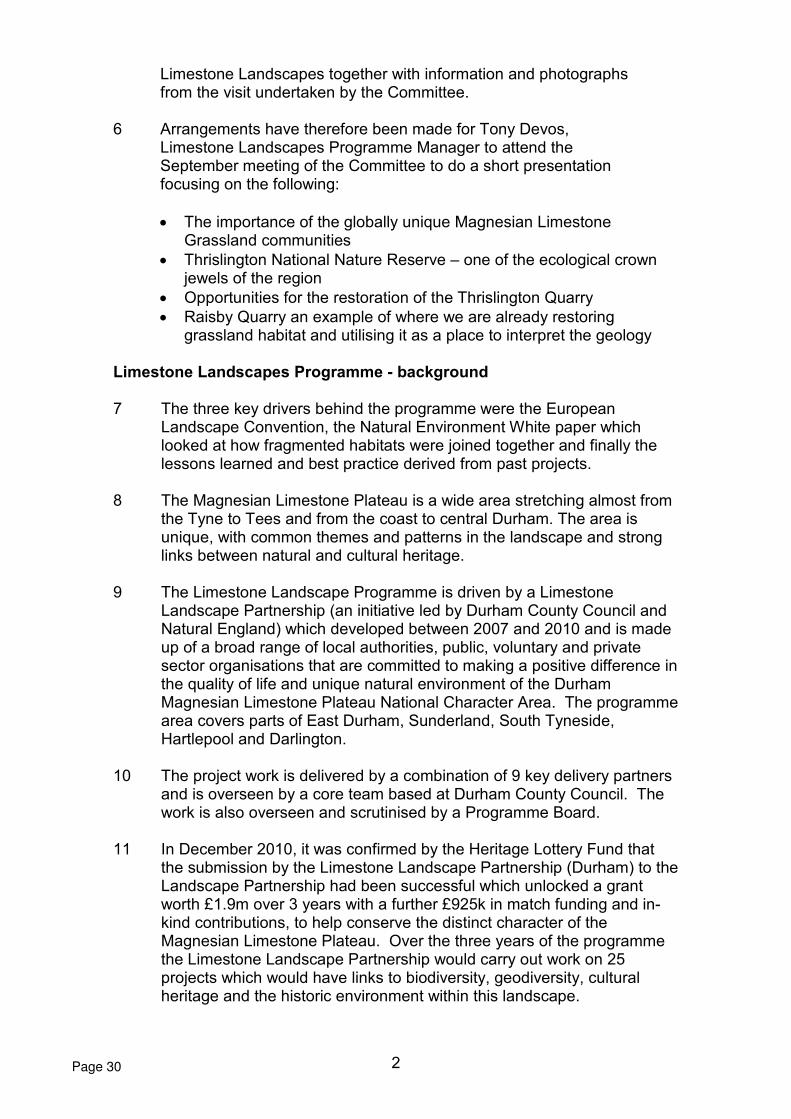
6 Arrangements have therefore been made for Tony Devos,
Limestone Landscapes Programme Manager to attend the September meeting of the Committee to do a short presentation focusing on the following:
• The importance of the globally unique Magnesian Limestone Grassland communities
• Thrislington National Nature Reserve – one of the ecological crown jewels of the region
• Opportunities for the restoration of the Thrislington Quarry
• Raisby Quarry an example of where we are already restoring grassland habitat and utilising it as a place to interpret the geology
Limestone Landscapes Programme - background 7 The three key drivers behind the programme were the European
Landscape Convention, the Natural Environment White paper which looked at how fragmented habitats were joined together and finally the lessons learned and best practice derived from past projects.
8 The Magnesian Limestone Plateau is a wide area stretching almost from
the Tyne to Tees and from the coast to central Durham. The area is unique, with common themes and patterns in the landscape and strong links between natural and cultural heritage.
9 The Limestone Landscape Programme is driven by a Limestone
Landscape Partnership (an initiative led by Durham County Council and Natural England) which developed between 2007 and 2010 and is made up of a broad range of local authorities, public, voluntary and private sector organisations that are committed to making a positive difference in the quality of life and unique natural environment of the Durham Magnesian Limestone Plateau National Character Area. The programme area covers parts of East Durham, Sunderland, South Tyneside, Hartlepool and Darlington.
10 The project work is delivered by a combination of 9 key delivery partners
and is overseen by a core team based at Durham County Council. The work is also overseen and scrutinised by a Programme Board.
11 In December 2010, it was confirmed by the Heritage Lottery Fund that
the submission by the Limestone Landscape Partnership (Durham) to the Landscape Partnership had been successful which unlocked a grant worth £1.9m over 3 years with a further £925k in match funding and in-kind contributions, to help conserve the distinct character of the Magnesian Limestone Plateau. Over the three years of the programme the Limestone Landscape Partnership would carry out work on 25 projects which would have links to biodiversity, geodiversity, cultural heritage and the historic environment within this landscape.
Page 30

3
Visit to Thrislington and Raisby Quarries - 10th July, 2013 12 The members of the Environment and Sustainable Communities
Overview and Scrutiny began the visit at Thrislington Plantation National Nature Reserve (NNR) which is one of the most valuable magnesian limestone grassland sites in County Durham. The site covers 24 hectares and is adjacent to an active quarry.
13 Members were provided with a brief introduction as to how the
grasslands were formed and weathered to produce the thin lime-rich soils on which unique grasslands have developed. The site is also designated as a site of Special Specific Scientific Interest (SSSI).
14 Various booklets and leaflets were provided to members to help identify
various flora and fauna together with plans showing the extent of the magnesian limestone within the area.
15 At the southern end of the quarry members were able to see the working
quarry site and were advised that Durham County Council would be working with the quarry to extend the grassland area as part of the restoration and aftercare of the quarry.
16 Raisby Quarry is in an active state and is also a site of Special Specific
Scientific Interest (SSSI). From the viewing platform members could see the area of land currently being quarried together with areas that
were being restored as Magnesian Limestone grasslands. 17 At the site members met with Vivien Kent from Durham Wildlife Trust
who provided information on how the land was being managed to ensure that the flora and fauna were able to flourish as part of the Limestone Landscapes Project which was working with the Wildlife
Trust to link sites along the Kelloe Beck and Raisby Way. 18 With regard to the future development of the site members were
informed that one of the existing water pools would be retained and spring fed which would lead to further nature and wildlife opportunities. Recommendations
19 It is recommended that the Environment and Sustainable Communities Overview and Scrutiny Committee notes the information provided during the presentation.
Page 31

4
20 It is recommended that as part of the refresh of the committee’s work
programme a further update on the development of the Limestone Landscapes Programme is scheduled for a future meeting of the committee.
Background Papers Limestone Landscapes - project update 2013. Environment and Sustainable Communities Overview and Scrutiny Report - Limestone Landscapes Partnership – 18th July, 2011. Visit to Thrislington and Raisby Quarries – Note from visit – 10th July, 2013
Contact: Tom Gorman Tel: 03000 268027 E-mail: [email protected] Author: Diane Close Tel: 03000 268141777E-mail: [email protected]
Page 32

5
Appendix 1: Implications
Finance – Limestone landscapes programme for County Durham was awarded £1.9m grant by the Heritage Lottery Fund which would attract £925k of ther cash funding, in kind donations and volunteer time, giving a total budget of £2.825m.
Staffing - None
Risk – None
Equality and Diversity / Public Sector Equality Duty – The work of the partnership will be inclusive and reflect the diverse community of the Magnesian Limestone Natural Area and those who visit. People of all ages and abilities from every sector of society will have the opportunity to enjoy the area.
Accommodation – None
Crime and Disorder – Raising community awareness of issues facing the Magnesian Limestone Natural Area and encouraging participation in local environment initiatives is important to engendering community ownership and reducing anti social behaviour.
Human Rights – None
Consultation – The work of the partnership is based upon wide ranging consultation and participation.
Procurement – None
Disability Issues – None
Legal Implications – None
Page 33

Page 34
This page is intentionally left blank

Review of Potholes Page 1 of 5
Environment and Sustainable Communities Overview and Scrutiny Committee 26th September 2013 Review of Potholes
Report of Terry Collins, Corporate Director - Neighbourhood Services Purpose of the Report 1. To provide members of the Environment and Sustainable Communities
Overview and Scrutiny Committee with information on how potholes arise, the procedures in place to identify and repair potholes, how they can be prevented and available funding.
Background 2. The Environment and Sustainable Communities Overview and Scrutiny
Committee at their meeting on 21st June 2013 considered the refresh of the Committee’s work programme for 2013-2015. An additional area identified by Members at that meeting for inclusion in the 2013-2015 work programme related to a review of potholes.
3. Accordingly, arrangements have been made for John Reed, Head of
Technical Services, and Colin Hodgson, Highways Inspection and Maintenance Manager, to attend the meeting on 26th September 2013 to present to Members.
How Potholes Arise 4. Potholes are where the top layer of the carriageway deteriorates leaving a
large void which is generally described as a pothole. Potholes arise due to a number of factors including:
� Wear and tear particularly from heavy goods vehicles � Lack of preventative structural capital maintenance � Poor quality repairs and maintenance including utility reinstatements � Water ingress and the freezing and thawing cycle.
5. Potholes can occur all year around but peak in the winter months when surface water ingress into small voids in the top layer of the carriageway freezes and expands creating a larger void. This cycle repeats as temperatures rise and fall below freezing.
6. The flooding events of 2012 followed by a severe and prolonged winter
lead to major growth in potholes. We estimate that we have repaired 67,200 potholes in the past 12 months at an average cost of £8.18 per pothole.
Agenda Item 10
Page 35

Review of Potholes Page 2 of 5
Durham County Council’s Responsibilities
7. As the Local Highway Authority, Durham County Council has a statutory duty under Section 41 of the Highways Act 1980 to maintain the adopted highway. This duty includes the majority of roads and footways in County Durham but there are some highways used by the general public which have not been adopted. The ‘Adopted Highways’ layer on Intramap will give an indication of whether a particular road is adopted or unadopted.
8. Whilst Section 41 imposes a wide ranging duty to maintain the adopted
highway there is provision under Section 58 of the Highways Act for a ‘Special Defence’ which may be available to Local Highway Authorities facing legal action for an alleged failure to maintain. Section 58 refers to the following:
� The character of the highway and the traffic expected to use it � The standard of maintenance appropriate for a highway of that
character � The state of repair in which a reasonable person would have expected
to find the highway � Whether the Local Highway Authority knew, or could reasonably have
been expected to know, that the condition of a particular part of the highway was likely to cause a danger to users of the highway.
9. In simple terms the Section 58 defence requires that procedures are in place for inspection, dealing with defect reports and repairing those defects which exceed the intervention criteria.
Inspection Procedures
10. Durham County Council’s Highway Safety Inspection Manual (HSIM) has been developed to provide a robust inspection and maintenance regime which ensures that the roads in the county are as safe as reasonably possible and if necessary complies with the requirements of the Section 58 defence. The basic principles outlined in the HSIM are as follows:
� Each road and footpath throughout the county has been assessed and
is given a hierarchy according to its use � Each road and footway is inspected at a frequency related to its
hierarchy � The inspection frequency for roads can be monthly, 3 monthly or yearly � If a defect is identified which exceeds the intervention criteria detailed
in the HSIM, repairs are arranged � The intervention criteria for a sharp edged depression in the road
(pothole) is depth >40mm and width>300mm � It should be noted that although the intervention criteria for defects is
the same for all hierarchies, the response time for repairs varies � The response time for potholes in the road surface can be 24 hour or
14 days depending upon the hierarchy. 11. The above inspections are undertaken by our team of 20 trained and
experienced Highway Inspectors.
Page 36

Review of Potholes Page 3 of 5
12. Durham County Council has a very good record of repudiating public
liability claims based on this robust inspection and maintenance regime. Defect Reports 13. Durham County Council has a Customer Relationship Management (CRM)
system which logs all reports of highway defects onto a database and redirects them to the most appropriate officer to deal with the issue. Defects can be reported to the Highways Action Line (HAL) by the public, staff and Members by:
� Telephone : 0191 370 6000 � Email : [email protected] � Website : www.durham.gov.uk/HAL
14. Members are requested to report routine and non urgent highway issues
through the Highways Action Line (HAL) since this ensures that they go directly to the appropriate Highway Inspector as quickly as possible and produces a verifiable audit trail.
15. Any significant issues or issues which have not been satisfactorily dealt with through HAL can be raised with the Highways Inspection and Maintenance Manager, Colin Hodgson:
� Telephone : 03000 269219 � Email : [email protected]
16. Once a highway defect has been reported, the Highway Inspector will investigate and if a defect is found which exceeds the intervention criteria repairs will be arranged which should be completed within the appropriate response times.
Defect Repairs 17. The only repair options generally available for potholes with a 24 hour
response time are as follows:
� Repair by the Highway Inspector using tubs of cold lay bitmac � Repair by the Priority Action Team (PAT) with pick-up which can collect
1 ton of hot material at the start of the day � Repair by PAT using material from the mobile 5 ton hot box which
ensures that the material is kept at the optimum temperature for use 18. The success of the pothole repairs referred to above will depend upon the
general condition of the road, weather condition and the traffic intensity. Whilst the repairs can often be permanent there are some locations and circumstances where they can only be temporary. It is accepted that temporary pothole repairs can result in a road with poor ride quality and this will be rectified with a permanent repair as soon as practical.
Page 37

Review of Potholes Page 4 of 5
19. The resources allocated to fixing potholes can be increased as necessary to deal with the peaks in reports which follow the winter period and flooding events which can cause severe damage in a very short period.
20. Where there are potholes with a 14 day response time or highway inspections identify sections of carriageway in a poor condition then patching will be considered.
21. In 2012/13, £2.16 million of the £4.08 million highway maintenance revenue budget was spent on reactive repairs and patching to the carriageway.
22. Technical Services’ highway staff are actively involved in the Department for Transport’s Highways Maintenance Efficiency Programme (HMEP) and have adopted the best practice recommendations set out in the HMEP’s guidance “Potholes Review - Prevention and a Better Cure”.
Prevention 23. The best way to minimise potholes and minimise whole life costs is
through preventative structural capital maintenance such as surface dressing and resurfacing of the carriageway. These maintenance techniques repair and seal the top layer of the carriageway therefore preventing surface water ingress.
24. Durham County Council has a preventative structural capital maintenance
programme and the spend this year on carriageways is £6 million. The Council’s Transport Asset Management Plan (TAMP) shows that spend of £10 million is required to maintain the carriageways in a “steady state” condition.
25. The maintenance backlog for carriageways is £160 million. Therefore, where spend is below the “steady state” level the maintenance backlog and occurrence of potholes can be expected to increase over time.
Recommendations and Reasons 26. It is recommended that the Environment and Sustainable Communities
Overview and Scrutiny Committee note and comment upon the information provided within the report.
Background Papers � Potholes Review - Prevention and a Better Cure, Highways Maintenance
Efficiency Programme (HMEP), April 2012
� Potholes Review, Follow Up Report - Prevention and a Better Cure, Highways Maintenance Efficiency Programme (HMEP), July 2013
Contact: John Reed, Head of Technical Services
Tel: 03000 267454
Colin Hodgson, Highways Inspection & Maintenance Manager Tel: 03000 269219
Page 38

Review of Potholes Page 5 of 5
Appendix 1: Implications
Finance Budget details are provided within the main report. Staffing Highway inspections and the majority of highway maintenance are undertaken by the Council’s in-house provider, Highway Services. Risk The report describes the Council’s risk management approach to potholes. Equality and Diversity / Public Sector Equality Duty None Accommodation None Crime and Disorder None Human Rights None Consultation None Procurement None Disability Issues None Legal Implications The Council has a statutory responsibility to maintain the adopted highway in a safe condition as described in the report.
Page 39

Page 40
This page is intentionally left blank

Environment and Sustainable Communities Overview and Scrutiny Committee 26th September 2013 Updated Street Lighting Policy
Report of Terry Collins, Corporate Director Neighbourhoods
Purpose of the Report 1 To provide members of the Environment and Sustainable Communities
Overview and Scrutiny Committee with details of the proposals within the revised Street Lighting Policy and the on-going consultation arrangements.
2 The change in the Street Lighting Policy supports the Street Lighting Energy
Reduction Project which generates major savings that are being used to meet the Medium Term Financial Plan whilst retrofitting existing street lighting lanterns and reducing carbon emissions.
Background
3 The Council has faced unprecedented reductions in Government grants since the 2010 Comprehensive Spending Review to the extent that it is now forecasted that Government support for the Council will over the six-year period 2011-2017 reduce by £139m. This equates to a 36% reduction in Government support.
4 As a result, the MTFP forecast requires the Council to deliver total savings of
£188m in the six-year period 2011/12 to 2016/17 and these are estimated to exceed £200m by 2017/18.
5 The Council is also required to reduce its carbon emissions by 40% by 2015 as part of the Council’s wider Carbon Management Programme.
6 Cabinet, at the meeting on 12th December 2012, approved the business case for the Street Lighting Energy Reduction Project which sets out the scope of the project, which is to achieve energy reduction through a combination of:-
• Retrofit with more energy efficient light sources
• Removal of unnecessary lighting
• de-illumination of signs
• Use of Central Management System or fixed settings to facilitate dimming
Agenda Item 11
Page 41

7 The business case indicates that the Street Lighting Energy Reduction Project achieves net total savings of £24 million in today’s prices and £55 million taking into account inflation over a 25 year period.
8 The business case also confirms that street lighting represents 18% of the Council’s total carbon emissions of 105,816 tonnes (2008/09 baseline) and therefore reducing street lighting energy consumption is essential if the Council it to meet its target.
9 The Council’s Street Lighting inventory on the adopted highway is summarised as follows:
Street Lighting Units 2008/09 Baseline Carbon Emissions (Tonnes)
2012/13 Electricity Consumption – KwH
2012/13 Electricity Cost
2012/13 Maintenance Costs
Street lighting 81,931 18,512 35,090,651 £3,594,841 £2,319,968
Externally Illuminated Signs
6,345 309
585,764 £59,761 £111,658
Internally Illuminated Signs 111 3 6,049 £733 £1,968
Bollards 879 51 109,078 £10,999 £25,824
Total 89,266 18,875 35,791,542 £3,666,335 £2,459,417
10 The current and original Street Lighting Policy was approved on 26th May 2010. Updated Policy 11 The updated Street Lighting Policy is detailed in Appendix 2.
12 The updated policy details where the Council will provide and maintain street
lighting on the adopted highway and to what standard subject to available funding. This is consistent with British Standards.
13 The need for street lighting varies by location. Therefore the level and standard
of lighting provided will be dependent on a number of factors. In accordance with national standards each locality is placed into one of four Environmental Zones:
� Zone E1 : National Parks, Areas of Outstanding Natural Beauty, Sites of
Special Scientific Importance and other Dark Areas � Zone E2 - Areas of Low District Brightness (Rural Locations outside Zone
E1) � Zone E3 - Areas of Medium District Brightness (Urban Locations) � Zone E4 - Areas of High District Brightness (urban Centres with high night-
time usage)
These zones will be used to determine the suitable level and type of street lighting that is required in an area.
14 The main changes to the updated policy are detailed below:
Page 42

Retrofit Existing Street Lights
15 A lot of the existing apparatus across the County is aged and would benefit
from replacement. Over recent years there has been technological improvement in the energy efficiency and quality of light sources such as Light Emitting Diodes (LEDs). This provides us with the opportunity to retrofit aged apparatus across the County with up to date energy efficient apparatus that will produce savings in both energy and maintenance costs.
16 For illustration purposes an existing street light consumes 90 Watts compared to an LED street light that consumes 30 Watts for the same light output. This is a saving of 66%. This significant reduction in energy consumption will greatly reduce the Council’s exposure to increases in energy costs.
17 The replacement of aged apparatus will also avoid or deter significant lifecycle replacement costs that are not currently budgeted for.
18 Officers have appraised all the 95,252 units in terms of technical and financial feasibility and it is considered that 45,407 units will be retrofitted in residential areas across the County.
19 LEDs have been in development for several years and manufacturers are now prepared to offer long term warranties on performance and energy consumption. This mitigates performance and energy consumption risks and enables the Council to proceed with confidence.
Additional Information 20 Some existing street lights on traffic routes in rural areas between towns and
villages are unnecessary and can be removed. The updated policy permits the removal of street lighting where it is not specifically required by the Policy. The removal of any street light is subject to a risk assessment. This assessment is based on road safety and fear of crime. Street lights will only be removed if it is safe to do so.
21 The street lights that are not required by the Policy are mainly those on link roads with a de-restricted speed limit between settlements in rural areas. We estimate that there are 7,000 street lights that are not required by this Policy in County Durham. These lights are not required by statute or under British Standards and similar roads are not usually lit in other areas of the North East and the rest of the United Kingdom.
22 Local Members will be consulted on the proposed removal of any street light and will be provided with details and locations of any street lights identified for possible removal.
23 No street lights will be removed in residential areas.
Page 43

24 The updated Policy introduces two-stage dimming as follows:
� 10.00 p.m. to 12.00 a.m. : 25% dimming downwards � 12.00 a.m. to 5.00 a.m. : 50% dimming downwards
25 The above reflects the reduction in road traffic flows and pedestrian activity late
in the evening and early in the morning. However, it will still provide an acceptable level of lighting. Trials have shown that dimming at these levels is usually not perceptible to the human eye. Indeed the Council has dimmed traffic routes by 25% for several years and no complaints have been received.
26 Although there is the potential to switch off street lighting during the above
mentioned hours rather than dimming, the savings over and above dimming are relatively low. Therefore after taking into consideration road safety and fear of crime a decision was made not to switch off street lighting completely during these hours.
27 There is also some potential to de-illuminate signs based on recent changes to Department for Transport regulations.
28 The above changes will help facilitate the Street Lighting Energy Reduction
Project which was approved by Cabinet on 12th December 2012. The net total savings from the Project over 25 years are £24 million in today’s prices and £55 million taking account of inflation.
Consultation 29 The updated policy will be subject to public consultation. 30 An engagement plan has therefore been drafted that was agreed by the
Consultation Officer Group. The planned mechanisms include a county-wide survey which will explain the rationale behind the policy intentions and outline the approach to implementing them. There will also be a series of focus groups arranged with the Area Action Partnerships and a session with the Disability Partnership.
31 The activities carried out, and the results of the consultation, will be included in a consultation summary document and used to inform a future report on the policy implementation.
32 Work is also being undertaken to ensure that future communications to both
Elected Members and residents on the changes taking place as a result of the dimming and removals processes are effective. This will include briefings with Local Members and updates in Member newsletters and information to local residents where removal of installations will be taking place.
Page 44
Conclusion
33 Although this project will require capital investment it will produce a very strong financial return in the form of revenue budget savings that significantly exceeds the prudential borrowing costs by a ratio of 2.07:1. The net total savings over 25 years are £24 million in today’s prices which equates to £55 million when taking account of inflation.
34 In addition the proposed investment also produces significant non quantified benefits in terms of lifecycle cost avoidance whilst reducing the Council’s energy consumption and carbon emissions.
35 The project will also reduce annual energy consumption thereby reducing the Council’s exposure to increases in energy costs.
36 Approximately 45,407 of the 95,252 units will benefit from improved LED technology with the potential to retrofit the remainder of the inventory over time as the cost of LEDs reduces further.
37 The dimming of street lighting by up to 50% will generally not be perceivable to the human eye. In addition, no street light will be removed in a residential area. This will minimise any potential impact on residents.
Recommendations 38 It is recommended that the Environment and Sustainable Communities
Overview and Scrutiny Committee note and comment upon the information provided within the report.
39 That the Environment and Sustainable Communities Overview and Scrutiny
Committee receive at a future meeting of the Committee an update on the revised Street Lighting Policy.
Background Papers � Street Lighting Energy Reduction Project: Cabinet Report dated 12 December
2012. � Street Lighting Policy : Current and original Policy approved on 26 May 2010
Contact: John Reed, Head of Technical Sevices, Neighbourhoods Tel: 03000 267 454 E-mail: [email protected] Author: Brian Buckley, Strategic Highways Manager, Neighbourhoods Tel: 03000 268 097 E-mail:[email protected]
Page 45

Appendix 1: Implications
Finance The updated Policy will help facilitate the Street Lighting Energy Reduction Project which was approved by Cabinet on 12th December 2012. This project will deliver significant financial savings that will help meet the MTFP. Staffing Not applicable Risk A corporate risk assessment has been carried out and no reportable risks were identified. Street lighting will continue to be provided in accordance with British Standards by the updated Policy. Where street lighting is not required by the updated Policy it will be removed subject to a risk assessment based on road safety and fear of crime confirming that it is safe to do so. Equality and Diversity / Public Sector Equality Duty An EqIA has been completed. Accommodation Not applicable Crime and Disorder Street lighting helps reduce the fear of crime. Human Rights Not applicable Consultation There will be a public consultation of 12 weeks if approved by Cabinet. Procurement Not applicable Disability Issues Not applicable Legal Implications The Council has the power but not a duty to provide street lighting under the Highways Act 1980.
Page 46
1
Appendix 2
Street Lighting Policy
Date 3 June 2013
Version 13
Status Draft
Prepared by Brian Buckley
Approved by O/S
Page 47

2
CONTENTS
Introduction����������������������. 3
Benefits and Costs of Street Lighting����������.. 3
Lighting Provision�������������������. 3 Environmental Zones������������������ 4 Removal of Street Lighting���������������. 5 Dimming������������������������ 5 Use of New and Emerging Technologies��������� 6 New Developments and Adoptions�����������... 6 Appendix 1: County Durham Environment Zones ���� 7
Page 48

3
1. Introduction 1.1 The purpose of this policy is to detail where the Council will provide
and maintain street lighting and to what standard on the adopted highway subject to available funding.
1.2 The term “street lighting” encompasses all illuminated assets on the
adopted highway including street lights, signs, bollards and other street furniture.
1.3 Under the Highway Act 1980 the Council has the power but not the
duty to light. 1.4 The Council currently manages and maintains over 80,000 street lights
and 5,000 illuminated signs on the adopted highway. The inventory grows each year as new developments are adopted.
1.5 Where the existing adopted highway is below the standards set in this
policy it will only be upgraded to the standards set in this policy where there is existing lighting which is life expired and due to be replaced.
1.6 This is the Council's Second Edition of its “Street Lighting Policy”
document. It supersedes the original policy published in 2010. 2. Benefits and Costs of Street Lighting 2.1 The benefits of street lighting are:
� Reduce road traffic accidents � Reduce the severity of road traffic accidents � Reduce the fear of crime � Promote the night time economy
2.2 The costs of street lighting are:
� Financial : Capital, maintenance and energy costs � Environmental : Carbon emissions and light pollution � Amenity : Visual and aesthetic impact
2.3 The policy strikes a balance between the benefits and costs of street lighting by applying British Standards.
3. Lighting Provision
3.1 The need for street lighting varies by location. It is generally accepted that urban and residential areas should be provided with street lighting.
Page 49

4
However, the level and standard of lighting provided will be dependent upon a number of factors.
3.2 For example, city and large urban areas may have relatively higher crime rates and may benefit from the provision of a high level of street public lighting whereas environmental factors in rural areas may constrain the level and type of lighting considered necessary.
3.3 Therefore, in accordance with national standards each locality in the
County is placed into one of four Environmental Zones as shown in appendix 1.
4. Environmental Zones The four Environmental Zones are as follows: Zone E1 : National Parks, Areas of Outstanding Natural Beauty, Sites of Special Scientific Importance and other Dark Areas
4.1 Roads in Zone E1 are defined as all roads within designated boundaries excluding roads in urban areas.
4.2 The general presumption is that street lighting should not be provided in Zone E1 areas due to light pollution and loss of amenity unless there is an overriding road safety issue which cannot be overcome by other means such as improvements to the carriageway delineation by reflective road studs, carriageway markings and improved signing.
Zone E2 - Areas of Low District Brightness (Rural Locations outside Zone E1)
4.3 Residential areas of villages and settlements within a Zone E2 area are generally provided with lighting in accordance with the relevant minimum British Standard applicable to the type and use of the adopted highway.
4.4 Adopted footpaths and cycle tracks will only be lit where there is high
night-time use, fear of crime issues and no alternative route. 4.5 On roads between villages and settlements in Zone E2 areas, lighting
will only be provided where there is a known night-time road safety problem that cannot be controlled by other methods such as improvements to the carriageway delineation by reflective road studs, carriageway markings and improved signing.
Page 50

5
Zone E3 - Areas of Medium District Brightness (Urban Locations)
4.6 Urban roads within a Zone E3 area are generally provided with lighting in accordance with the relevant minimum British Standard applicable to the type and use of the adopted highway.
4.7 Adopted footpaths and cycle tracks will only be lit where there is high night-time use, fear of crime issues and no alternative route.
Zone E4 - Areas of High District Brightness (urban Centres with high night-time usage)
4.8 Urban centres within a Zone E4 area are generally provided with lighting in accordance with the relevant minimum British Standard applicable to the type and use of the adopted highway.
4.9 Roads in such areas that carry high traffic volumes will be treated as traffic routes and lit accordingly.
Removal of Street Lighting 5.1 This policy sets out where street lighting will be provided and to what
standard on the adopted highway subject to available funding. 5.2 Where there is existing street lighting that is not specifically required by
this policy then this will be removed, where it is safe to do so, based on a risk assessment of road safety and the fear of crime.
5.3 The street lights that are not required by the Policy are mainly those on
link roads with a de-restricted speed limit between settlements in rural areas. We estimate that there are 7,000 street lights that are not required by this Policy in County Durham. These lights are not required by statute or under British Standards and similar roads are not usually lit in other areas of the North East and the rest of the United Kingdom.
5.4 Local Members will be consulted on the proposed removal of any street light and will be provided with details and locations of any street lights identified for possible removal.
5.5 Illuminated signs will be removed or de-illuminated where permitted by
the Department for Transport’s traffic sign regulations.
Page 51

6
Dimming
6.1 Where the street lighting equipment installed allows, lighting levels will be dimmed as follows:
� 10.00 p.m. to 12.00 a.m. - 25% downwards � 12.00 a.m. to 5.00 a.m. - 50% downwards
6.2 The above reflects the reduction in road traffic and pedestrians late in the evening and early in the morning. However, it will still provide a reasonable level of lighting.
Use of New and Emerging Technologies
7.1 This policy is output based on where street lighting will be provided and to what standard on the adopted highway subject to available funding.
7.2 The Council will constantly review new and emerging technologies to
ensure that the most technically and economically advantageous street lighting technology is utilised.
7.3 The Council already utilises LED (Light Emitting Diodes) light sources
and a Central Management System (CMS) to facilitate dimming and remote monitoring.
New Developments and Adoptions
8.1 The Council requires developers to follow this policy should they wish the Council to adopt street lighting. Further guidance for developers is provided in the Council’s Highway Design and Commuted Sums Policy.
Page 52

7
Appendix 1: County Durham Environmental Zones The following table shows the numbers of existing street lighting columns situated by Environmental Zones:
Zone
Area Parish E1 E2 E3/E4 Total
Derwentside
Cornsay 87 131 218
Esh 249 533 782
Healeyfield 3 204 207
Hedleyhope 43 43
Lanchester 588 588
Langley 288 288
Satley 21 21
Consett 1633 4413 6046
Stanley 1217 5950 7167
Chester le Street
Chester le Street 288 3320 3608
Bournmoor 361 361
Emondsley 137 137
Great Lumley 592 592
Little Lumley 286 286
North Lodge 469 469
Ouston 66 680 746
Pelton 447 936 1383
Plawsworth 221 221
Sacriston 36 722 758
Urpeth 341 341
Waldridge 59 59
A167 224 211 435
Wear Valley
Stanhope 457 418 875
Emundbyers 36 36
Bishop Auckland 430 4958 5388
Tow Law 280 280
Crook & Willington 1417 2615
4032
Hunstanworth 4 4
Wolsingham 338 338
Page 53

8
Zone
Area Parish E1 E2 E3/E4 Total
Durham
Durham City 150 1929 2079
Bearpark 318 318
Belmont 50 1225 1275
Brancepeth 79 79
Brandon & Byshottles
1423 1804 3227
Cassop Cum Quarrington
986 986
Coxhoe 633 633
Framwellgate Moor 35 1783 1818
Kelloe 201 201
Gilesgate 643 643
Pittington 217 217
Shadforth 307 307
Sherburn 420 420
Shincliffe 373 373
Sunderland Bridge & Hett
113 113
West Rainton 456 456
A167 155 236 391
Easington
Castle Eden 177 177
Easington Village 1053 1053
Dalton le Dale 68 206 274
East Murton 990 990
Haswell 320 320
Hawthorn 119 119
Horden 1094 1094
Hutton Henry 293 293
Monk Hesledon 840 840
Peterlee 3371 3371
Seaton with Slingley 48 93 141
Sheraton with Hulam
20 20
Shotton 258 849 1107
Thornley 448 448
Wingate 458 458
Seaham 73 2751 2824
Trimdon Foundry 165 165
Wheatley Hill 466 466
South Hetton 399 399
Page 54

9
Zone
Area Parish E1 E2 E3/E4 Total
Teesdale
Barnard Castle 686 686
Barningham 13 13
Bolam 9 9
Boldron 10 10
Bowes 65 65
Cleatlam 1 1
Cockfield 231 231
Cotherstone 76 76
Eggleston 3 65 68
Etherley 316 316
Evenwood & Barony 425 425
Forest & Frith 7 7
Gainford 165 165
Gilmonby 1 3 4
Hamsterley 58 58
Headlam 1 1
Hilton 21 21
Hunderthwaite 4 4
Hutton Magna 5 5
Ingleton 62 62
Langton 5 5
Lartington 20 20
Lynsack & Softley 245 245
Marwood 46 46
Mickleton 52 52
Middleton In Teesdale
50 133 183
Raby with Keverstone
5 5
Newbiggen 19 19
Ovington 17 17
Rokeby 8 8
Romaldkirk 40 40
Staindrop 194 194
Startforth 26 134 160
Stainton 99 99
Wackerfield 25 25
Westwick 2 2
Whorlton 10 10
Winston 50 50
Woodland 36 36
Page 55

10
Zone
Area Parish E1 E2 E3/E4 Total
Sedgefield
Bishop Middleham
175 175
Bradbury & The Isle
9 9
Chilton 667 667
Cornforth 465 465
Ferryhill 142 1224 1366
Fishburn 313 313
Great Aycliffe
204 3918 4122
Middridge Village
79 79
Mordon 10 10
Sedgefield 87 931 1018
Shildon 1648 1648
Spennymoor 247 2699 2946
TRA167 149 297 446
Trimdon 731 731
Windleston 30 30
Woodham 659 659
Total 601 28,212 53,118 81,931
Page 56

Environment and Sustainable Communities Overview and Scrutiny Committee 26th September 2013 Review of the Garden Waste Collection Service
Report of Terry Collins, Corporate Director Neighbourhood Services
Purpose of the Report
1. To provide members of the Environment and Sustainable Communities Overview and Scrutiny Committee with details of the proposals for consultation on the introduction of a charge for the collection of garden waste from the kerbside. In doing so recognising the need to achieve the Medium Term Financial Plan (MTFP) savings identified from the Review of Waste Charges (£933k) in 2014/15.
Background – Legislation
2. Under the EU Landfill Directive, the UK is obligated to reduce the amount of
Biodegradable Municipal Waste (BMW) it sends to landfill, benchmarked against the amount that was landfilled in 1995. The targets were set such that BMW to landfill would not exceed 75% of the 1995 level by 2010, 50% by 2013 and 35% by 2020.
3. The U.K. Government previously set challenging targets for BMW diversion from landfill through the Landfill Allowance Trading Scheme (LATS) which incorporated financial mechanisms to ensure compliance with the landfill directive. The introduction of a garden waste collection scheme was a popular method of achieving these targets as it guaranteed the capture of biodegradable waste and also increased the proportion of biodegradable waste available for collection (over and above the 1995 levels diverted).
4. With the boom in waste infrastructure development fuelled by Public Finance Initiative (PFI) projects the Department for Environment, Food and Rural Affairs (Defra) is now content that landfill directive targets can be met and these targets, along with the LATS scheme have been removed by Government.
5. The avoidance of disposal charges has now become the primary driver for the maintenance of garden waste collection. Residual waste disposal rates are typically £80/tonne, garden waste can be composted at farm based facilities for circa £23/tonne.
6. In County Durham the former district councils offered a variety of opt-in arrangements for garden waste collection, which has left a legacy of inconsistent service delivery across the County. In the former Teesdale area a
Agenda Item 12
Page 57

partnership arrangement was established with Teesdale Conservation Volunteers, a third sector organisation operating as “Rotters”. This arrangement has continued with support from the County Council. Services in all other areas are delivered by the in-house collection services operated by Neighbourhood Services.
Background – Current Position
7. The Council currently offers a free, fortnightly garden waste collection service
to 151,700 properties across the County. The scheme operates on 16 collections per year on a fortnightly basis between the months of April and November. The service is broken down by operational area as Table 1.
Table 1 Households per operational area included in garden waste collection.
Streetscene Area Approx. Households included in the existing scheme area*
East 62,300
North 44,000
South 45,400
Total 151,700
*The current garden waste scheme does not cover all households in each operational area. This inconsistent service provision has been considered inequitable by some residents.
8. An overall estimated breakdown of households is provided in Table 2. Table 2 Estimated breakdown of the status of properties in relation to garden
waste collection
Properties Percentage Status
151,700 68% Existing access to garden waste collections.
35,000 16% Properties which have gardens and are easily accessible but not currently on the scheme
23,000 10% Terraced streets with no garden, flats, properties that would have no requirement for garden waste collection.
4,200 2% Served by Rotters
4,500 2% Farms/remote areas
5,400 2% Hard to access properties
9. By proposing the operation of an ‘opt in’ chargeable garden waste service,
residents who currently choose not to use the service or who are exempt from the current scheme will be able to participate, enabling a more equitable service to be provided to many more residents of County Durham.
Page 58

10. At present, the service is carried out using 12 collection vehicles over 4 days per week on a fortnightly basis. The existing garden waste treatment arrangements are through direct delivery to three facilities, two located within County Durham and the third just outside of the County, in Gateshead.
11. Interim arrangements for the composting of garden waste have been put in place for the current season, pending the outcome of this report. Should the decision be to support introducing a charge then a full procurement exercise will take place based on the revised garden waste tonnages anticipated to be presented for collection to ensure certainty of supply.
12. In 2012/13, 24,429 tonnes of garden waste were collected either by our own
collection service or via Rotters. This equated to approximately 11.0% of the overall waste arisings and 23% of the recycled waste for County Durham in 2012/13.
Other Authorities
13. Approximately 30% of local authorities in England currently apply a charge for
garden waste collections, with typical annual fees ranging from circa £20 to over £50. Many more are currently considering the option in light of savings requirements.
14. Within the region, Northumberland County Council charge £23 per season for their garden waste collection and Newcastle City Council charge £20.
Financial Pressures
15. The Medium Term Financial Plan (MTFP) includes £933k of savings proposals from a review of waste charges in 14/15.
Proposed Service Offer Summary 16. The proposal is to provide a charged garden waste collection service between
April and November each year on a fortnightly basis totalling 16 collections per year. The scheme will be available within a defined area, identified on the map included as Appendix 3 to this report.
17. The standard service will be on an opt-in basis through the provision of a wheeled bin. New service users will be issued with a new bin while existing users will retain the bin already in use. Payment will be identified by a sticker identifiable with a given year and placed on the lid of the bin which will be provided to the resident on payment of the service charge. Properties which have paid for the service will also be identified in the collection vehicle’s in-cab system.
18. Residents who do not wish to opt-in, but who have previously been supplied with a wheeled bin for garden waste will be able to have the existing bin collected on request.
Page 59

19. The scheme will be available to those households not currently covered by the free of charge garden waste collection scheme provided they are within the defined boundary.
20. Households will be able to purchase more than one sticker and additional bins.
21. The annual fee in 2014/15 will be £20 per year. Incentive discounts are to be considered as part of the consultation process.
22. The charge will reduce to £10 for anyone joining the scheme after 1st September in any one year.
Modelling the Options for the Garden Waste Service
23. The critical factors in developing a model for garden waste income are as
follows: a. Take up How many of the households currently receiving the service will elect to
pay for the service in the future, and hence how much income is generated. Experience from other authorities suggests that take up drops in the first year of a charge being introduced but recovers over time. This principal of “elasticity of demand” has been seen in both Northumberland and Newcastle. By operating an ‘opt in’ chargeable garden waste service, residents who were not participating in or were exempt from the original scheme will contribute positively to sustaining participation levels.
b. Tonnage of garden waste Experience from other authorities has shown that the tonnage of garden waste presented does not fall in proportion to the take up. This is probably due to residents “getting the most for their money” or sharing bins.
c. Cost of other disposal routes - displacement The garden waste that is no longer presented in the garden waste bin will be disposed of through other routes, either through Household Waste Recycling Centre’s (HWRC) or the residual bin, or through home composting. The cost of disposal through the residual waste stream is a significant sensitivity factor in the modelling. Under the new HWRC contract extra garden waste diverted to HWRC sites will not result in any additional costs to the Council.
d. Cost of Administration This includes the cost of receiving and processing applications, the production and sending of bin stickers, advertising, communications and transaction costs.
e. Pricing
While the price point of a charged service can be an important factor in the take up of the service it is not the only one. This will be a sensitive issue when a charge is introduced for a service that has previously been provided for free so the price must be considered to provide value for
Page 60
money over the available alternatives. In this case this is likely to be measured against trips to the HWRC site with garden waste or using the residual bin. Pricing is also a useful mechanism to drive behaviours that will assist operations. In this case an operational certainty over uptake is required as soon as possible so that routing can be developed. It is therefore desirable that customers join the scheme early. Additionally back office processing will be placed under considerable pressures, customers should therefore be encouraged towards the cheapest and most automated payment methods.
24. The model in Appendix 2 has been developed on the benchmarked
assumptions that participation will drop to 40% of the current service, but that garden waste presented will be at 60% of the current tonnage. These assumptions are based on the experience of other authorities including Northumberland CC. Of the remaining waste it is assumed that 16% will be disposed of through residual waste, 12% through HWRC and 12% through home composting.
25. Set up and administration costs are best estimates, based on known internal and external costs and costs incurred elsewhere on similar projects.
26. This model shows that a charge of £20 per property per year would yield approximately £1.9m of revenue in the first year, would incur approximately £1m in costs yielding an overall benefit of £976k.
Operational Issues
27. Introducing a charge for a previously free service changes the nature of the relationship between the Council and the customer with regard to the delivery of that service in that it becomes a direct contractual relationship in which a specific payment is made for a specific service. It is therefore important that expectations are clear on both sides. A revised set of Service Standards will be prepared, which will form the basis of the offer to the customer.
28. The service is currently provided by 12 vehicles and crew. Four crews operate out of Morrison Busty Depot, four out of Chilton Depot, two operate out of Meadowfield Depot and two out of Peterlee Depot. Each crew have established daily collection rounds operating on a fortnightly cycle Tuesday to Thursday each week.
29. It is proposed to continue with a fortnightly collection service operating 4 days per week Tuesday to Friday. It is proposed that during 2014 collections will start the week commencing Tuesday 15th April and the last collection will take place week commencing 18th November which means that we will deliver 16 collections.
30. The introduction of a charge will mean significant change in customer base and hence new collection rounds will need to be developed. The redesigning of collection rounds will mean that collection days may change from those currently in place.
Page 61

31. Rounds will initially be developed based on assumptions relating to the numbers and locations of applicants that might apply during 2014 using the existing rounds as a starting point. As customers sign up for the new scheme these rounds will be refined to suit. This may mean a change in collection day for some residents and this will be clearly communicated where appropriate.
32. Rounds would initially be designed for 3 vehicles and crews working out of
Morrison Busty Depot in the North, 3 vehicles and crew working out of Chilton Depot in the South and 3 working out of Peterlee depot in the East. To cover capacity variations one floating vehicle would be used to cover situations where there are more applicants than expected in a particular area.
33. This would mean that the number of vehicles and crew required to deliver the
service would reduce from 12 to 10 reducing collection costs by around 17%. The service is currently carrying a number of vacant posts and agency cover at present that would enable the downsizing in staff by 6 posts to occur without redundancy.
Area Covered by the Scheme 34. The service has historically been provided in areas with higher density of
medium/large gardens in the interest of efficiency and to limit fuel use. Certain estates and villages were selected to be within the scheme and others that were more remote and would produce less garden waste were not. An exception to this is the Wear Valley area where the former District Council allowed any resident to apply as a result there is a legacy of some households in remote locations who receive the service. To deliver the service with the resources described above it would be necessary to reduce the number of remote or very rural locations to which the service is provided. The proposed operational area is shown on the map in Appendix 4. There are no composting facilities available to the Council within the extreme western area of the county which makes collecting from that area and delivering to existing composters uneconomical.
35. In order to ensure that the service operates with our standard 26 tonne collection vehicles it will not be possible to provide the service to some farms, isolated rural and hard to access locations within the operational area outlined.
36. There will be residents currently residing in areas that are outside of the
boundaries of the existing scheme that have previously been refused the service that will now be eligible to apply for the charged service.
37. Residents in parts of the former Teesdale area receive a service through a
third sector organisation, Teesdale Community Volunteers, trading as Rotters. Although it was originally a charged service, DCC has more recently supported this collection on behalf of residents through the use of recycling credits. The Council will continue to work with Rotters in the Teesdale area and the understanding of any implications of the proposed change for them will be part of the consultation process.
Page 62

Unwanted Bins 38. On the assumption that only 4 out of 10 residents currently receiving the free
service will wish to pay, there are potentially 90,000 households with bins who will not want to pay for the service and may want the bin removing. It is proposed that a service is provided to collect unwanted bins on request as part of a ‘Bin Take-back’ scheme. The process is labour intensive and will require storage space if these are to be stored and reused. It is also recognised from experience elsewhere that many of the households that initially decide not to opt-in return to the scheme at a later date. In these cases we would wish to avoid firstly collecting and then returning bins.
39. While the delivery of new bins is relatively efficient the reverse is much more difficult as wheels are not designed to be removed easily and are often damaged in the process and bins cannot be stacked. The logistics of organising the collections will therefore need to be planned and the collection and reuse of unwanted bins may take some time. An allowance is provided within the modelling to fund Bin Take-back activities.
40. Residents in the former Easington and Wear Valley Council areas were
provided with 140 litre and 180 litre wheelie bins respectively for garden waste compared with the standard 240 litre bins in Derwentside, Chester-le-Street, Durham City and Sedgefield. It is proposed to apply a uniform charge per bin and therefore residents in Easington and Wear Valley may prefer to replace their smaller bin with a larger one. This will be done on request and free of additional charge.
Payment 41. In revenue terms the individual household charges are relatively low at £20
per annum but will potentially provide a high volume of payments over a short period of time.
42. The handling of income would be within the Council’s income management system, ICON. A new fund will be created that will provide a full array of payment options, including:
� Internet using credit/debit cards � Automated Telephone Payments using credit/debit cards � Bank Credit, directly to the Council’s bank account � Postal Cheque � Post Offices and PayPoint Outlets using a bar code facility to allow for
cash transactions
43. In administrative terms a data base holding individual property details will have a two way interface to ICON. Each household/property within the database will have a unique identifying reference number which will enable tracking of payment and in time will interface directly with the Bartech in-cab devices in the refuse vehicles. This unique reference number will be forwarded to the household in the initial offer letter to enable payment against it.
Page 63
44. A substantial amount of development work will be required from ICT for the
development of the interfaces, this has been identified on the ICT prioritisation schedule and a “proof of concept” is currently being carried out in relation to payment of replacement bins that will support the proposed process. Once tested, the same methodology can be applied to this project.
45. The development of an online application form and linked payment facility via the ICON paylink module would also require ICT development resource as part of the ongoing CRM/webforms interface.
Consultation and Communications Consultation 46. The statutory requirement to consult is based on section 3 of the Local
Government Act 1999 in which it states that a best value authority must secure continuous improvement in the way its functions are exercised and in deciding how to fulfil its duty; an authority must consult a range of stakeholders including taxpayers.
47. In line with our approach to consultation, an engagement plan will be drafted which will then be approved by the Consultation Officers Group and the actions implemented. The results of the exercise will be carefully considered before any final decision is made.
48. The consultation will be designed to obtain the views of the public on a number of issues central to the design and implementation of the scheme, including:
• Likely take up and impact
• Payment methods and preferences
• Any other disposal methods that may be used
49. The consultation process will also make use of the Citizen’s Panel.
50. Consultation will take place from 19th September 2013 to 28th October 2013.
Communications
51. As this proposal will result in a change affecting a large number of households, a comprehensive communications plan will be central to implementation.
52. The overall objective will be that all affected residents understand the change and the decisions they have to make regarding opting into the scheme or not. Additionally, it is important that the scheme remains viable; therefore the communications mechanisms will be used to ensure that both as many users of the current scheme are retained and also to attract new customers onto the scheme, should they meet the assessment criteria.
Page 64
53. The communications plan will detail the key mechanisms to be used to inform residents of the new scheme and how it will operate. It is proposed that all current users are contacted by post to inform them of the change and where eligible to invite them to stay on the scheme by paying for the service. This information will also be added to the website and media will be used to attract new customers.
54. Customers will be encouraged to use the website to pay for the service; this will be made possible through the ICON project and CRM development to integrate the web form with the system. In line with the practise of other councils, customers who are eligible to receive the service following payment will be identified through a sticker placed on the garden waste bin.
55. There will inevitably be an impact on Customer Services and Business Support as the scheme is introduced; additional resource will therefore have to be considered as part of the set-up of the project. A full set of customer FAQ’s will be developed to assist with the implementation process.
56. The Council has actively maintained a campaign to encourage home composting for many years, and this campaign will continue alongside the implementation of the new charging scheme.
Summary 57. While the operational complexities of establishing a charged service across a
wide area are not to be underestimated, the model highlights that with realistic and conservative assumptions the charging for garden waste collection has the potential to bring significant benefits while meeting the MTFP plans.
Recommendations 58. It is recommended that the Environment and Sustainable Communities
Overview and Scrutiny Committee note and comment upon the information provided within the report.
59. That the Environment and Sustainable Communities Overview and Scrutiny
Committee receive at a future meeting of the Committee an update in relation to the consultation exercise and detail of the proposed scheme.
Contact: Alan Patrickson, Head of Projects and Business Services, Neighbourhoods Tel: 03000 268165 E-mail: [email protected]. Author: Michael Cooper, Project Manager, Neighbourhoods Tel: 03000 268047 E-mail: [email protected].
Page 65

Appendix 1: Implications
Finance The financial benefits of the scheme are outlined in the report, specifically Appendix 2. Staffing There is likely to be a requirement for some temporary staffing during the set up period both operationally and administratively. It is also likely that there will be a reduction of collection vehicles and associated staff once the routes are fully designed and bedded in. It is planned that this will be achieved without the need for compulsory redundancies. Risk A separate Risk Assessment has been produced. Equality and Diversity / Public Sector Equality Duty An Equality Impact Assessment has been developed in relation to this review; the consultation will capture the equalities data to provide a profile of respondents. Accommodation None Crime and Disorder None Human Rights None Consultation An engagement plan will be developed and implemented as set out in the report. Procurement None Disability Issues Assisted collection arrangements currently associated with the service will be maintained. Legal Implications None
Page 66

Appendix 2: Garden Waste Income Model
GARDEN WASTE CHARGING COST MODEL
Benefits
Total
Savings in Garden Waste Treatment Costs1 £244,370
Operational savings from reduced Collection Costs2 £225,836
Income from HWRC disposal3 £15,937
Income from Charge4 £1,493,600
SUB-TOTAL £1,979,743
Costs
Additional garden waste sent to Landfill5 £339,994
Administration Inc transactional costs and postage6 £215,126
Discounts estimate7 £63,000
Operational Costs (Bin collection/replacement)8 £265,000
Communications/Set-up9 £120,000
SUB-TOTAL £1,003,120
OVERALL SAVING £976,623
Notes
1 - Based on 40% of garden waste that will no longer require waste treatment due to a reduction in
total tonnage processed
2 - Based on service rationalisation
3 - Based on 12% of currently collected garden waste being deposited at HWRCs
4 - Based on a 40% uptake of eligible properties at a £20 annual charge
5 - Based on 16% of currently collected garden waste being deposited in residual waste bins
6 - Transaction costs will vary – modelled at 46p
7 - Potential discount to be offered to Customers based on consultation
8 - Based on business requirements to administer and manage scheme
9 - Based on likely costs required to promote and communicate scheme
Page 67

Page 68
This page is intentionally left blank

Appendix 3
Page 69

Page 70
This page is intentionally left blank

Page 1 of 5
County Durham Environment Partnership Board
Minutes
Tuesday 25th June 2013 Burlison Room, Durham Town Hall
Apologies Alan Hunter Julie Bradbrook Michael Duffy Steve Hunter Steve Bhowmick Su Jordan Jamie Fletcher Attendees: Chair: Terry Collins - Durham County Council Julie Form - Groundwork North East Jim Cokhill - Durham Wildlife Trust Marc Condra - Environment Agency Oliver Sherratt - Durham County Council Gordon Elliott - Durham County Council Clare Marshall - Durham County Council Vicki Burrell - Durham County Council Maggie Bosanquet - Durham County Council Sandra Robertson - Durham County Council Corinne Walton - Durham County Council Beverley Clark (Minutes) - Durham County Council
Item No.
Subject
Action By
1. Welcome and Introductions The chair welcomed everyone to the meeting and apologies were noted.
2. Minutes and Matters Arising Consideration was given to the minutes of 24th April 2013. The presentation from The Environment Agency on climate change adaptation has been received and will be circulated. Members of the Public Health Team to attend the next Board Meeting in September.
Vicki Burrell to circulate Vicki Burrell to contact Tony Walsh
Agenda Item 13
Page 71

Page 2 of 5
3. Review of Environment Partnership The chair thanked members of the group for their contribution towards the Review of the Environment Partnership. A discussion took place regarding the proposed structure of The Environment Partnership and the remit of the groups. The group agreed that the chair would meet with Julie and Vicki to look at the overall partnership objectives and remit for the groups. Vicki to circulate revised objectives following meeting. It was suggested that the Partnership needs to be more action focused. A discussion took place for the potential of bringing in new partners such as The Fire Brigade, Police, and partners from the private sector.
Terry Collins/Vicki Burrell/Julie Form
4. World Environment Day/Themed Week update Copies of press releases regarding World Environment Day/Week were circulated. The Climate Change Event in Consett went very well, with useful discussions held. The Food Awareness Event held by the Waste Group was well attended with 200 to 300 people spoken to directly. Partners included Feeding the 5000, Environment Agency and Groundwork. Pride events went very well and the twinning/international theme was well received. DCC and English Heritage jointly managed 2 stalls/displays at the event in the Market Place which gathered a lot of interest. Overall it was reported that the events held during the week were both useful and positive and were well received by the public, community groups and stakeholders.
5. Strengthening Partnership Links Details of funding and an update was given on the Area Action Partnerships. Examples of current projects include: Litter free coast and sea work, work on railway paths, walks, flower meadows, tree planting, bulb planting, use of allotments, targeting litter and graffiti ,
Page 72
Page 3 of 5
free dog microchipping, etc. It was requested that the Partnership use AAP’s as a valuable resource as they will take forward projects/ideas and pilot them. It was asked that the Partnership share any areas of good practice with AAP’s. An AAP Discussion Points paper was circulated. Any feedback from this to be forwarded to Vicki to co-ordinate.
Vicki Burrell
6. Sustainable Community Strategy Update An update was given on the overall Sustainable Community Strategy timetable. It was stated that the current objectives of the Environment Partnership are still relevant. It was requested that if there’s a need for them to be changed now is the time to do so. The current SCS is being refreshed and reviewed. Links to the environment need to be addressed throughout the document and also the opportunity for ‘added value’ through partnership working. The next CDP Forum meeting in October will address that. The Altogether Greener Partnership was asked to consider the recommendations of the SCS update and feedback any comments.
All
7. Environment Awards Update Environment Awards are now live. There has been a great deal of interest and sponsorship received from various organisations. Next year will be the 25th year of The Environment Awards - work is being carried out now in terms of partners and funding. There will be two new award categories next year: Urban Green Space and Urban Green Technology. Details for this year’s Environment Awards (to be held on 8th October 2013) to be sent to the Chair and Simon Henig.
Maggie Bosanquet
8. Updates from Group Chairs Built Environment The group has been involved in the revision of the Altogether Greener Framework Document and Built Environment Action Plan, making the Action Plan more robust. Work is ongoing with regard to the Environment Awards and nominations are now being invited. Work is continuing on Conservation Area Appraisals and Management Plans. Heritage Open Days are planned for 12th to 15th September with 46 venues already signed up to the national campaign.
Page 73

Page 4 of 5
Pride A wide range of activities have taken place including education work involving 1360 school children across the county, The Big Spring Clean, Slam Dunk The Junk and Blackhall Denemouth clean up (with over 7 tonnes of rubbish removed). Numerous events relating to World Environment Day such as litter picking and planting have taken place. Responsible dog ownership and free microchipping events ongoing. It was reported that a successful prosecution for flytipping and lack of duty of care had been carried out. Natural Environment It was stated that the Chair would hold a telephone conversation with Jim to discuss one point of contact for feeding in and out of the Local Nature Partnerships/LEP. Vicki to also arrange a meeting. The LNP is trying to build it’s profile and is meeting with the LEP to look at their relationship. The HLF Landscape Partnership bid for the Derwent Valley has been submitted, will find out in October if the bid has been successful. Work is ongoing to review the Durham Biodiversity Action Plan. Climate Change It was reported that the Small Medium Enterprises (SME) project is going well. Meetings have been held regarding the Climate Change Strategy and Delivery Plan. The group is working in partnership with the Health and Wellbeing Board, Environment Board and Altogether Wealthier Board to discuss how to tackle fuel poverty across the county. Work is ongoing with schools/school activities. Work on renewable energy studies continues. There has been a slow take up of the Green Deal nationally. Assisting with the development of the ‘Climate Ready’ adaptation plan. Waste The group is currently finalising their waste action plan. A catering waste project is underway and as of last week Groundwork had completed 40 audits to catering waste businesses. The Construction Resource Efficiency Forum (CREF) is now being held on 2nd July with key speakers and subjects now confirmed. World Environment Day event on 7th June was very successful, engaging with several hundred members of the public.
Terry Collins/Vicki Burrell/Jim Cokhill
9. AOB None.
Page 74

Page 5 of 5
Page 75

Page 76
This page is intentionally left blank