Embed Size (px)
Citation preview
EnviroMeter: A Platform for QueryingCommunity-Sensed Data
Saket SatheEPFL, [email protected]
Arthur OviedoEPFL, Switzerland.
Dipanjan ChakrabortyIBM Research India.
Karl AbererEPFL, [email protected]
ABSTRACTEfficiently querying data collected from Large-area Communitydriven Sensor Networks (LCSNs) is a new and challeng-ing problem. In our previous works, we proposed adap-tive techniques for learning models (e.g., statistical, non-parametric, etc.) from such data, considering the fact thatLCSN data is typically geo-temporally skewed. In this pa-per, we present a demonstration of EnviroMeter. EnviroMe-ter uses our adaptive model creation techniques for process-ing continuous queries on community-sensed environmentalpollution data. Subsequently, it efficiently pushes currentpollution updates to GPS-enabled smartphones (throughits Android application) or displays it via a web-interface.We experimentally demonstrate that our model-based queryprocessing approach is orders of magnitude efficient thanprocessing the queries over indexed raw data.
1. INTRODUCTIONCommunity-driven sensing relies on on-board or smartphone-
embedded sensors carried by the community (buses, cars,people) to sense an environmental phenomenon of interest(e.g., pollution). The main focus of research until now hasbeen on design and implementation of novel deploymentsto collect and process community-sensed data. Large-scalecommunity-driven sensor networks are fundamentally dif-ferent from traditional sensor networks, due to their au-tonomous and unstructured sensing behavior [5].
An example of such a community-sensed deployment isthe OpenSense project [5]. The primary objective of theOpenSense project is to efficiently and effectively monitorenvironmental pollution using wireless and mobile sensors.The project adopts complex utility driven approaches to-wards sensing and data management. The geographicalgranularity for monitoring environmental pollution is on thelevel of a city or state. Pollution data is collected using sen-sors installed on public transport buses.
Unfortunately, LCSNs cannot be tightly controlled espe-cially when deployments cover large areas, which makes it
Permission to make digital or hard copies of all or part of this work forpersonal or classroom use is granted without fee provided that copies arenot made or distributed for profit or commercial advantage and that copiesbear this notice and the full citation on the first page. To copy otherwise, torepublish, to post on servers or to redistribute to lists, requires prior specificpermission and/or a fee. Articles from this volume were invited to presenttheir results at The 39th International Conference on Very Large Data Bases,August 26th - 30th 2013, Riva del Garda, Trento, Italy.Proceedings of the VLDB Endowment, Vol. 6, No. 12Copyright 2013 VLDB Endowment 2150-8097/13/10... $ 10.00.
difficult to produce a homogeneous view of the phenomenon.Thus, the data collected by sensors is geo-temporally skewed.Data skewness drastically affects the efficiency and accuracyof query processing in the following ways: (a) due to semi-controlled or uncontrolled mobility of sensors, sensor valuesmay not be always available at a particular position andtime, (b) the accuracy of an estimated pollution value isnot high if a distant sensor value is used to approximate thepollution value at the current position. Queries that are typ-ically processed on such data are of two types: point queriesand continuous queries. Point queries return the pollutionvalue at a given position, while continuous queries are regis-tered by a mobile object, which is interested in continuouslyknowing the pollution around it.
In our prior research [6], we demonstrated that multi-model approaches are suitable for modeling geo-temporallyskewed community-sensed data. Previous literature existson scalable high-speed data processing on the server thataddresses efficient storing and querying of models from rawdata [9, 10]. In the past, research has focused on the prob-lem of inherent unreliability of the sensors due to their au-tonomous human-influenced nature or surrounding weatherconditions, due to which sensors become error-prone or runout of battery [7, 8].
Although the previous works investigate various ways forthe community to perform sensing, they are not concernedwith using the collected data and knowledge in providingfeedback and information about the phenomenon, back tothe community. This work, is focused in closing the gapin the loop. In this demonstration of EnviroMeter, we useour proposed techniques from [6] for succinctly representingcommunity-sensed data in the form of models.
We demonstrate how to use the learned models for ef-ficiently processing user queries. Our techniques adapt tothe changing nature of the sensed phenomenon by adjustingthe geographical granularity of the models, to capture thephenomena with high fidelity. EnviroMeter is a completeframework that senses data in a community-driven sensornetwork. It processes the results efficiently, and uses lazyupdate policies to present them to users on their mobile de-vices, while significantly reducing network bandwidth andprocessing delay.
2. SYSTEM DESIGNThe system designed for supporting EnviroMeter consists
of three main components. First component uses the adap-tive techniques for learning single or multiple models over
1294
the concerned geographical area. Second component con-sists of the different query processing methods that use thelearned models for answering continuous queries. Thirdcomponent optimizes the bandwidth required for commu-nicating the requests/responses during query processing. Inthe following sections we discuss each of these components.
2.1 Adaptive ModelsThe architecture of the EnviroMeter framework is shown
in Figure 1. It assumes a geographical region R, over whichenvironmental pollution is sensed using community-drivenapproaches. The sensed data is stored in a database in theform of raw tuples. The adaptive modeling approach thatwe propose creates a multi-model abstraction or a modelcover over the raw tuples dumped in the region R. A modelcover is defined as a set of modelsM = {M1, . . . ,MO} thatare respectively responsible for modeling the sub-regionsR1, R2, . . . , RO of R. The sub-regions taken together coverthe entire region R.
multiple model
M1M2M3
R1R2R3
M3
models
M1R1
R2 R3
W1
W2
R1R2R3R4R5R6R7
M1M2M3M4M5M6M7
raw_tuples
model_cover
siyixitii
database
M2
c
ib
Figure 1: Architecture of the framework.
We denote the raw tuple as bi = (ti, xi, yi, si), where si isthe raw sensor value, and ti and (xi, yi) are the time and theposition corresponding to the sensor value si. We assumethat the model cover is computed using a window of rawtuples Wc = 〈bi|cH ≤ ti ≤ (c + 1)H〉, where c is a positiveinteger and H is the window length.
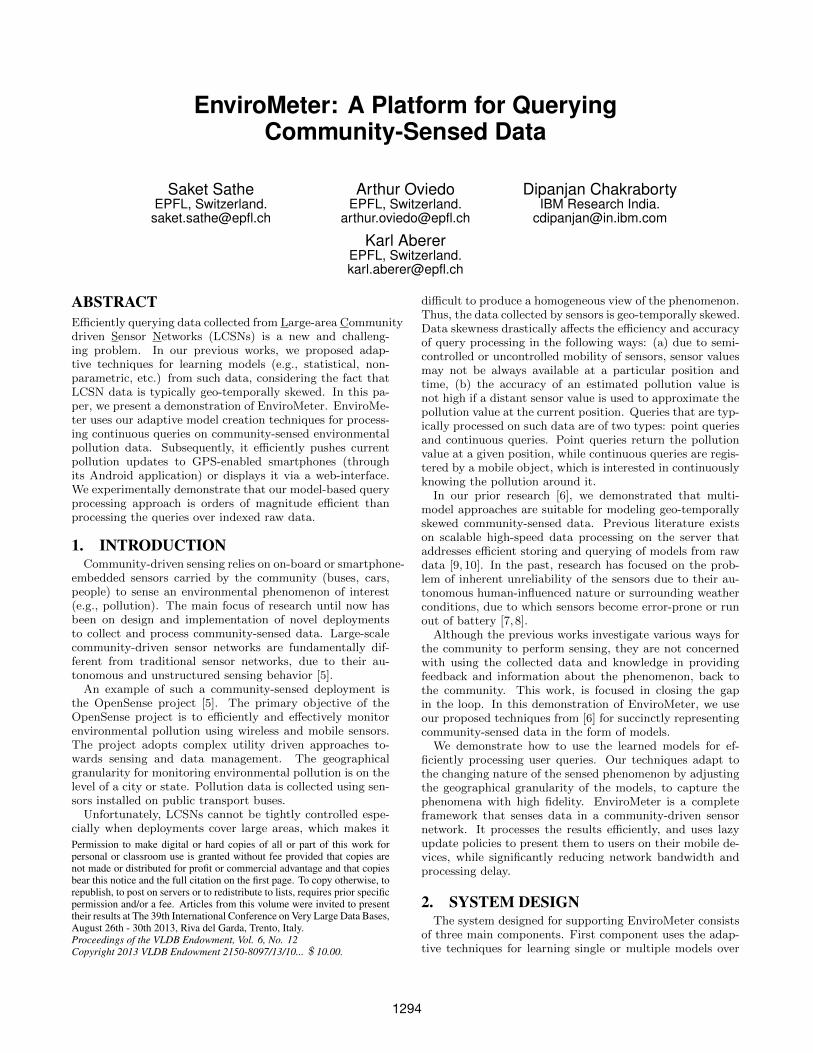
We briefly present the adaptive method, called adaptivek-means or Ad-KMN, that gave us the best results amongmany candidates we designed [6]. This method partitionsthe region R adaptively (i.e., only when and where it isnecessary) and estimates the models M1,M2, . . . ,MO. Thestandard k-means algorithm uses the Euclidean distance forcreating the clusters. Instead, in the Ad-KMN method, weuse the model approximation error as an additional cluster-ing criteria. An example of the Ad-KMN method on toydata is shown in Figure 2.
Assume that before executing the Ad-KMN method, wecompute two centroids µ1 and µ2 by executing the standardk-means algorithm using the positions (xi, yi) fromWc (referFigure 2(a)). Then, (a) we partition the sensor values inWc,such that R1 and R2 contain sensor values that are nearestto µ1 and µ2 respectively, and (b) for the sensor values inR1 and R2 we estimate linear regression models M1 and M2
and compute the approximation error 1.Next, we check whether the approximation error is within
a user-defined threshold τn. In the regions (R1 or R2) wherethe approximation error is greater than τn, we introducean additional cluster centroid (equivalent to splitting theregion) and re-estimate all the centroids. This procedure is
1approximation error is the average percentage error com-pared to the normal range of si in the environment (pollu-tant specific).
R1
R2R2
R3
R4R1
- centroids from last iteration- positions with worst error
road
centroid
(xi ,yi ,ri)
(b)(a)
μ1μ2
μ1
μ2
μ4
μ3
Figure 2: Example on toy data: (a) initial regions,and (b) two new regions R3 and R4 added after anAd-KMN iteration.
continued until all the regions meet the approximation errorthreshold τn. We denote the cluster centroids (µ1, . . . , µO)as µ.
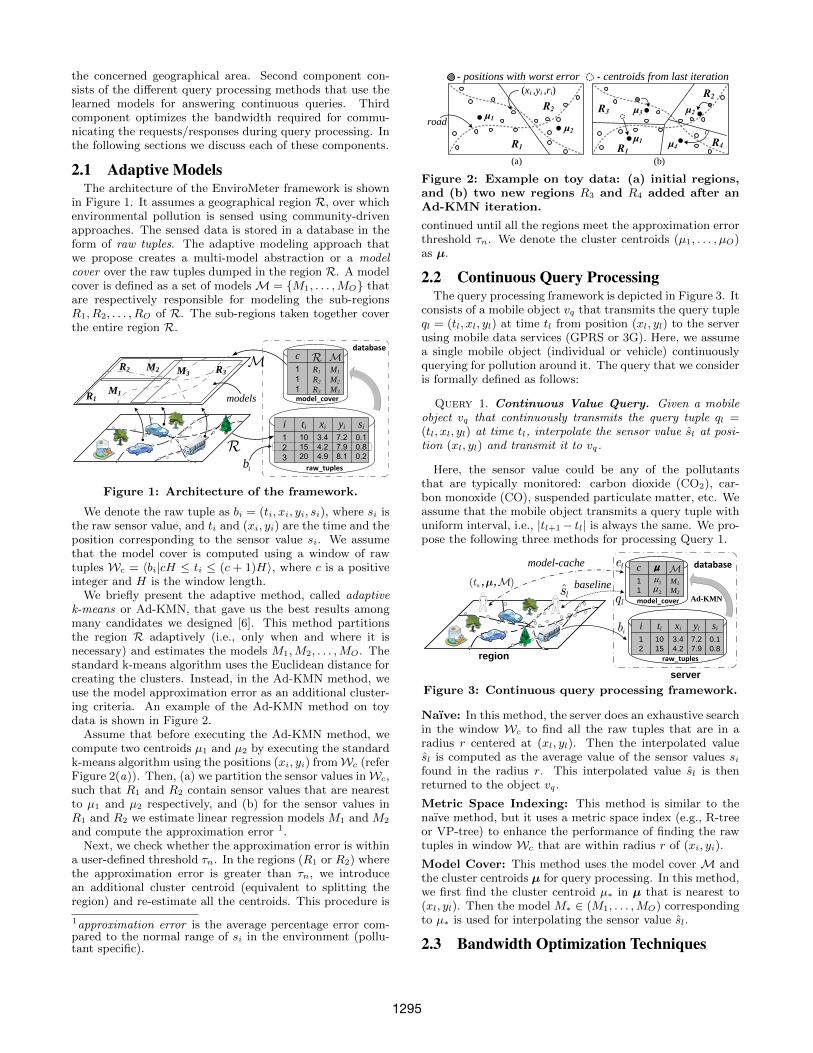
2.2 Continuous Query ProcessingThe query processing framework is depicted in Figure 3. It
consists of a mobile object vq that transmits the query tupleql = (tl, xl, yl) at time tl from position (xl, yl) to the serverusing mobile data services (GPRS or 3G). Here, we assumea single mobile object (individual or vehicle) continuouslyquerying for pollution around it. The query that we consideris formally defined as follows:
Query 1. Continuous Value Query. Given a mobileobject vq that continuously transmits the query tuple ql =(tl, xl, yl) at time tl, interpolate the sensor value sl at posi-tion (xl, yl) and transmit it to vq.
Here, the sensor value could be any of the pollutantsthat are typically monitored: carbon dioxide (CO2), car-bon monoxide (CO), suspended particulate matter, etc. Weassume that the mobile object transmits a query tuple withuniform interval, i.e., |tl+1− tl| is always the same. We pro-pose the following three methods for processing Query 1.
11
M1M2
raw_tuples
model_cover
si
1015
3.44.2
yixiti
0.10.8
7.27.9
12
i
database
base station
Ad-KMNnaivemodel cache
ls, ,nt m lqle
lq
serverregion
c12
le
ibib
11
M1M2
raw_tuples
model_cover
si
1015
3.44.2
yixiti
0.10.8
7.27.9
12
i
database
Ad-KMN
baseline
model-cache
ls( )nt ,m,
lq
server
region
c12
le
ib
Figure 3: Continuous query processing framework.
Naıve: In this method, the server does an exhaustive searchin the window Wc to find all the raw tuples that are in aradius r centered at (xl, yl). Then the interpolated valuesl is computed as the average value of the sensor values sifound in the radius r. This interpolated value sl is thenreturned to the object vq.
Metric Space Indexing: This method is similar to thenaıve method, but it uses a metric space index (e.g., R-treeor VP-tree) to enhance the performance of finding the rawtuples in window Wc that are within radius r of (xi, yi).
Model Cover: This method uses the model cover M andthe cluster centroids µ for query processing. In this method,we first find the cluster centroid µ∗ in µ that is nearest to(xl, yl). Then the model M∗ ∈ (M1, . . . ,MO) correspondingto µ∗ is used for interpolating the sensor value sl.
2.3 Bandwidth Optimization Techniques
1295
It is a well-known fact that smartphones spend significantamount of battery power and bandwidth in transmittingdata via GPRS or 3G data services. In order to optimizethe bandwidth- and power-usage, we propose a caching tech-nique referred to as model-cache. Model-cache stores themodel cover on the smartphone and only queries the serverwhen the cached model cover becomes invalid.
Model-Cache: As a system initialization step vq sends amodel request, denoted as el, to the server (refer Figure 3).In response to el the server sends the following items: (i) thecoefficients of all the models inM, (ii) the cluster centroidsµ, and (iii) the time tn until which the current model coveris valid. vq stores (tn,µ,M) in its local memory.
Now, when the user, who has EnviroMeter running onhis/her smartphone, needs a pollution update, a query tupleql is generated. Then, EnviroMeter checks whether tl ≤ tn.If tl ≤ tn, then it finds the nearest cluster centroid µ∗ to(xl, yl). It uses the model M∗ corresponding to µ∗ for com-puting the value sl, without contacting the server. If tl > tn,then the current model cover is invalid, and a new model re-quest el is sent to the server for updating (tn,µ,M). Sincein practice it often happens that mobile objects have limitedmobility or predefined trajectories, we save a considerableamount of bandwidth by caching (tn,µ,M).
In Section 4, we compare the model-cache technique witha baseline technique, which simply responds to each querytuple with the interpolated sensor value sl, without cachingthe models. We experimentally demonstrate that model-cache is approximately 50 times bandwidth efficient as com-pared to the baseline technique.
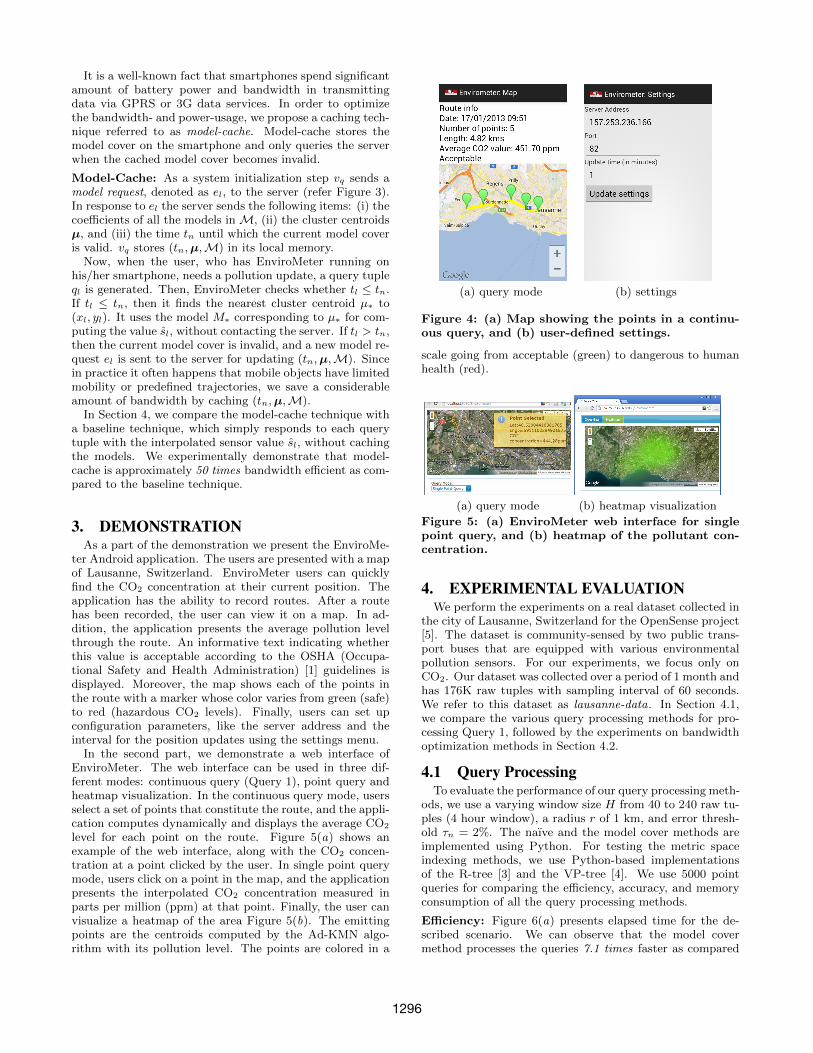
3. DEMONSTRATIONAs a part of the demonstration we present the EnviroMe-
ter Android application. The users are presented with a mapof Lausanne, Switzerland. EnviroMeter users can quicklyfind the CO2 concentration at their current position. Theapplication has the ability to record routes. After a routehas been recorded, the user can view it on a map. In ad-dition, the application presents the average pollution levelthrough the route. An informative text indicating whetherthis value is acceptable according to the OSHA (Occupa-tional Safety and Health Administration) [1] guidelines isdisplayed. Moreover, the map shows each of the points inthe route with a marker whose color varies from green (safe)to red (hazardous CO2 levels). Finally, users can set upconfiguration parameters, like the server address and theinterval for the position updates using the settings menu.
In the second part, we demonstrate a web interface ofEnviroMeter. The web interface can be used in three dif-ferent modes: continuous query (Query 1), point query andheatmap visualization. In the continuous query mode, usersselect a set of points that constitute the route, and the appli-cation computes dynamically and displays the average CO2
level for each point on the route. Figure 5(a) shows anexample of the web interface, along with the CO2 concen-tration at a point clicked by the user. In single point querymode, users click on a point in the map, and the applicationpresents the interpolated CO2 concentration measured inparts per million (ppm) at that point. Finally, the user canvisualize a heatmap of the area Figure 5(b). The emittingpoints are the centroids computed by the Ad-KMN algo-rithm with its pollution level. The points are colored in a
(a) query mode (b) settings
Figure 4: (a) Map showing the points in a continu-ous query, and (b) user-defined settings.
scale going from acceptable (green) to dangerous to humanhealth (red).
(a) query mode (b) heatmap visualization
Figure 5: (a) EnviroMeter web interface for singlepoint query, and (b) heatmap of the pollutant con-centration.
4. EXPERIMENTAL EVALUATIONWe perform the experiments on a real dataset collected in
the city of Lausanne, Switzerland for the OpenSense project[5]. The dataset is community-sensed by two public trans-port buses that are equipped with various environmentalpollution sensors. For our experiments, we focus only onCO2. Our dataset was collected over a period of 1 month andhas 176K raw tuples with sampling interval of 60 seconds.We refer to this dataset as lausanne-data. In Section 4.1,we compare the various query processing methods for pro-cessing Query 1, followed by the experiments on bandwidthoptimization methods in Section 4.2.
4.1 Query ProcessingTo evaluate the performance of our query processing meth-
ods, we use a varying window size H from 40 to 240 raw tu-ples (4 hour window), a radius r of 1 km, and error thresh-old τn = 2%. The naıve and the model cover methods areimplemented using Python. For testing the metric spaceindexing methods, we use Python-based implementationsof the R-tree [3] and the VP-tree [4]. We use 5000 pointqueries for comparing the efficiency, accuracy, and memoryconsumption of all the query processing methods.
Efficiency: Figure 6(a) presents elapsed time for the de-scribed scenario. We can observe that the model covermethod processes the queries 7.1 times faster as compared
1296
to the VP-tree method for H = 40. In addition, it is 39.4times faster than the R-tree method for H = 240.
Accuracy: For measuring the accuracy of the obtained re-sults, we compare the naıve method and our proposed modelcover method. Recall that the naıve method computes thevalue sl as the average of the sensor values that lie in theradius r of the query tuple. Figure 6(b) shows that ourmethod consistently generates a smaller NRMSE (normal-ized root-mean-square error) than the naıve method. TheR-tree and the VP-tree methods are not considered, sincethey produce the same result as the naıve method.
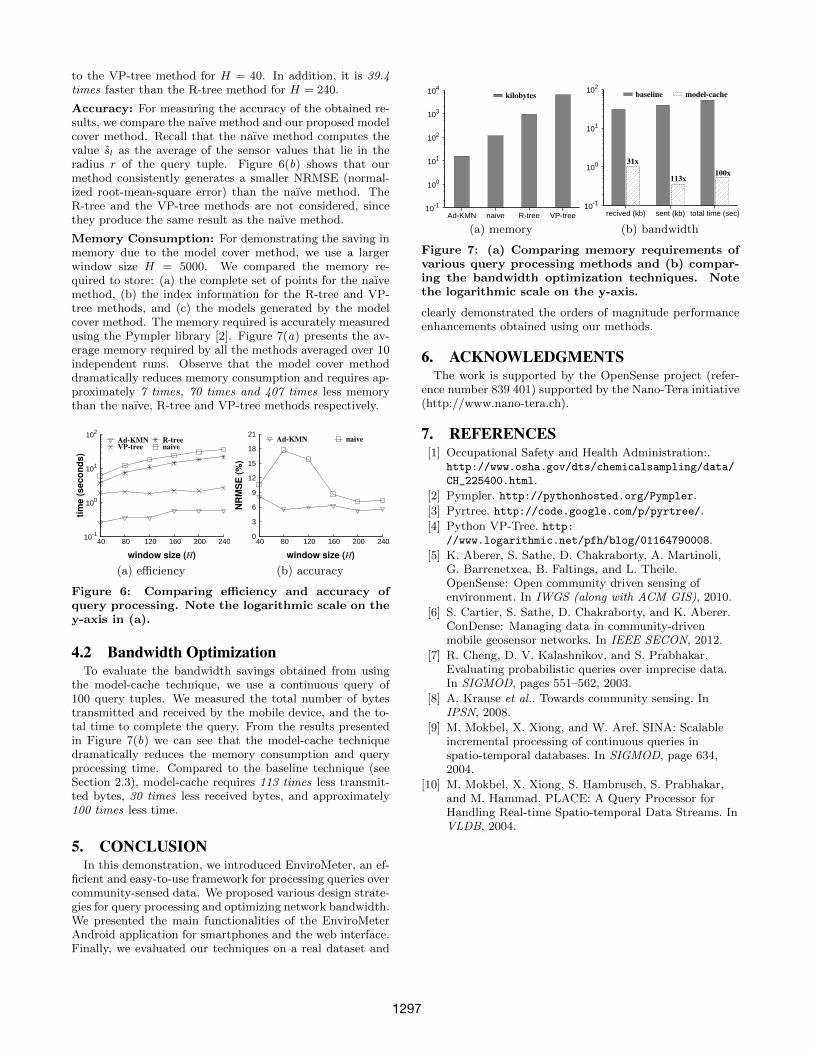
Memory Consumption: For demonstrating the saving inmemory due to the model cover method, we use a largerwindow size H = 5000. We compared the memory re-quired to store: (a) the complete set of points for the naıvemethod, (b) the index information for the R-tree and VP-tree methods, and (c) the models generated by the modelcover method. The memory required is accurately measuredusing the Pympler library [2]. Figure 7(a) presents the av-erage memory required by all the methods averaged over 10independent runs. Observe that the model cover methoddramatically reduces memory consumption and requires ap-proximately 7 times, 70 times and 407 times less memorythan the naıve, R-tree and VP-tree methods respectively.
10-1
100
101
102
40 80 120 160 200 240
tim
e (
seco
nd
s)
window size (H)
Ad-KMN VP-tree
R-tree
naive
(a) efficiency
0
3
6
9
12
15
18
21
40 80 120 160 200 240
NR
MS
E (
%)
window size (H)
Ad-KMN naive
(b) accuracy
Figure 6: Comparing efficiency and accuracy ofquery processing. Note the logarithmic scale on they-axis in (a).
4.2 Bandwidth OptimizationTo evaluate the bandwidth savings obtained from using
the model-cache technique, we use a continuous query of100 query tuples. We measured the total number of bytestransmitted and received by the mobile device, and the to-tal time to complete the query. From the results presentedin Figure 7(b) we can see that the model-cache techniquedramatically reduces the memory consumption and queryprocessing time. Compared to the baseline technique (seeSection 2.3), model-cache requires 113 times less transmit-ted bytes, 30 times less received bytes, and approximately100 times less time.
5. CONCLUSIONIn this demonstration, we introduced EnviroMeter, an ef-
ficient and easy-to-use framework for processing queries overcommunity-sensed data. We proposed various design strate-gies for query processing and optimizing network bandwidth.We presented the main functionalities of the EnviroMeterAndroid application for smartphones and the web interface.Finally, we evaluated our techniques on a real dataset and
10-1
100
101
102
103
104
Ad-KMN naive R-tree VP-tree
kilobytes
(a) memory
10-1
100
101
102
recived (kb) sent (kb) total time (sec)
31x
113x100x
baseline model-cache
(b) bandwidth
Figure 7: (a) Comparing memory requirements ofvarious query processing methods and (b) compar-ing the bandwidth optimization techniques. Notethe logarithmic scale on the y-axis.
clearly demonstrated the orders of magnitude performanceenhancements obtained using our methods.
6. ACKNOWLEDGMENTSThe work is supported by the OpenSense project (refer-
ence number 839 401) supported by the Nano-Tera initiative(http://www.nano-tera.ch).
7. REFERENCES[1] Occupational Safety and Health Administration:.
http://www.osha.gov/dts/chemicalsampling/data/
CH_225400.html.
[2] Pympler. http://pythonhosted.org/Pympler.
[3] Pyrtree. http://code.google.com/p/pyrtree/.
[4] Python VP-Tree. http://www.logarithmic.net/pfh/blog/01164790008.
[5] K. Aberer, S. Sathe, D. Chakraborty, A. Martinoli,G. Barrenetxea, B. Faltings, and L. Theile.OpenSense: Open community driven sensing ofenvironment. In IWGS (along with ACM GIS), 2010.
[6] S. Cartier, S. Sathe, D. Chakraborty, and K. Aberer.ConDense: Managing data in community-drivenmobile geosensor networks. In IEEE SECON, 2012.
[7] R. Cheng, D. V. Kalashnikov, and S. Prabhakar.Evaluating probabilistic queries over imprecise data.In SIGMOD, pages 551–562, 2003.
[8] A. Krause et al.. Towards community sensing. InIPSN, 2008.
[9] M. Mokbel, X. Xiong, and W. Aref. SINA: Scalableincremental processing of continuous queries inspatio-temporal databases. In SIGMOD, page 634,2004.
[10] M. Mokbel, X. Xiong, S. Hambrusch, S. Prabhakar,and M. Hammad. PLACE: A Query Processor forHandling Real-time Spatio-temporal Data Streams. InVLDB, 2004.
1297