Embed Size (px)
Citation preview
D/2007/6482/44
Vlerick Leuven Gent Working Paper Series 2007/36
ENTRY AND EXIT OF FIRMS IN A GLOBAL ECONOMY:
A CROSS-COUNTRY AND INDUSTRY ANALYSIS
ITALO COLANTONE
LEO SLEUWAEGEN
2
ENTRY AND EXIT OF FIRMS IN A GLOBAL ECONOMY:
A CROSS-COUNTRY AND INDUSTRY ANALYSIS
ITALO COLANTONE
Katholieke Universiteit Leuven
LEO SLEUWAEGEN
Contact:
Leo Sleuwaegen
Vlerick Leuven Gent Management School
Tel: +32 16 32 69 13
Fax: +32 16 32 67 32
Email: [email protected]
3
ACKNOWLEDGEMENTS
This paper benefited from presentations at Pennsylvania State University, the Max
Planck Institute of Economics (Jena) and the LICOS Center for Institutions and
Economic Performance (Leuven). We thank Carlo Altomonte, Rosario Crinò, Joep
Konings, Alessandro Olper, Damiaan Persyn, Joris Pinkse, Mark Roberts, James
Tybout and Stijn Vanormelingen for useful comments. Colantone is grateful to the
Economics Department of Penn State University, for their hospitality while working
on this paper. Financial support from the Research Council of Leuven is also
gratefully acknowledged.
4
ABSTRACT
This paper examines the impact of international trade on firm entry and exit in Europe.
The results point to strong displacement exit and less creative replacement entry in
industries characterized by increasing import competition Moreover, the evidence
suggests strong selection and higher entry barriers in industries characterized by
higher openness through the export channel. The negative effects of trade openness
lose importance if the increasing trade exposure concerns intra-industry trade, mainly
coupled with international sourcing within the industry.
Keywords: Globalization, Exit, Entry
5
1. EXECUTIVE SUMMARY
Entrepreneurship is proved to be beneficial for job creation and economic
growth. In the last thirty years Western countries have witnessed a shift from the
“managed” to the “entrepreneurial” economy, which is characterised by a central role
of entrepreneurs in innovation activities and wealth creation (Audretsch and Thurik,
2001). Fostering entrepreneurship has thus become a priority for policy makers. At the
same time, globalization has been changing the competitive environment in which
firms operate. Increasing economic openness implies higher competitive pressure for
companies, but also more business opportunities on the international markets. In this
context, an effective entrepreneurship policy needs to take the global dimension of
business into account. And yet, very little is known about the impact of globalization
on entrepreneurship. In this paper we start filling the gap by studying the relation
between international trade and firm entry and exit dynamics. In particular we explore,
at the empirical level, the effects of changes in various measures of trade openness on
sectoral entry and exit rates. We do this through panel econometric regressions,
focusing on eight European countries: Belgium, Denmark, Finland, Italy, Netherlands,
Spain, Sweden and United Kingdom. The analysis is carried on twelve manufacturing
sectors, for the time span 1997-2003. Industry-level data from Eurostat are employed
in a novel empirical framework, in which several trade-related explanatory variables
are included. At the same time, we control for other factors which previous literature
has identified as important determinants of industry dynamics.
The main results can be summarized as follows. First, we find that an increase
in openness to trade raises exit rates at the industry level, through the import
competition channel. International competitive pressure is thus found to be responsible
for the displacement of European manufacturing firms. Second, concerning entry, an
increasing level of openness to trade is found to lower firm birth rates, trough both
drivers of import competition and export intensity. Import pressure indirectly affects
the creation of new business ventures through the channel of “replacement entry”, i.e.
the component of entry which is directly associated to earlier exit dynamics. In fact,
we find that less replacement entry takes place with respect to firm exit which is
driven by import displacement.
6
This result has important implications. Indeed, many empirical studies of
industry dynamics have shown the presence of a positive correlation between entry
flows and previous exit (Dunne et al., 1988; Siegfried and Evans, 1994; Mata and
Portugal, 1994; Caves, 1998; De Backer and Sleuwaegen, 2003). In a recent article,
Pe’er and Vertinsky (forthcoming) show that such a process of creative replacement
entry is beneficial for aggregate productivity growth at the local level. In fact, new
business ventures replace exiting incumbents and re-employ their released resources in
more productive ways, for instance by adopting new technologies. Pe’er and
Vertinsky do not assess to what extent different drivers of firm exit might influence
this process. However, our results warn that replacement entry dynamics might be less
relevant when exit is caused by import penetration. In fact, import displaced firms are
more likely to be involved in activities which are at odds with a country’s comparative
advantages, and thus not appealing for potential new entrepreneurs. Increasing levels
of incumbents’ export intensity have instead a direct negative impact on firm birth
rates. This finding suggests that, as the market selects successful exporting firms,
barriers to entry increase. The minimum efficiency and capital commitment levels
which are required to enter the market are raised, thus resulting in lower entry. Finally,
other things equal, lower exit and higher entry rates are found to be associated with
increasing intra-industry trade, which captures both growth in international sourcing
of intermediates and product differentiation dynamics. When explicitly controlling for
international sourcing of intermediate goods, our results point to off-shoring as an
effective strategy in reacting to foreign competition. Indeed, if trade
complementarities in a sector are rising as a result of increasing sourcing of
intermediates from abroad, fewer firms exit and relatively more new business ventures
are created in the industry.
Overall, our results deepen the empirical evidence on trade pressure and exit in
the first place. Secondly, and most importantly, they shed some first interesting light
on entry in globalizing industries. The whole analysis conveys important implications
for entrepreneurship policy, which are developed in the last section of the paper.
7
2. INTRODUCTION
Trade liberalization is proved to be ultimately welfare enhancing. However, a
costly adjustment process needs to be undergone in order for gains from trade to be
realized. Resources in the economy need to be reallocated, across and within sectors,
in such a way that efficiency is enhanced. Firms are key players of the latter process,
and as such they are being paid increasing attention in the international trade literature,
both at the empirical and theoretical level, as reviewed by Bernard et al. (2007) and
Tybout (2003).
Following the latest research developments, we can think about two different
margins of industry adjustment to trade, which can be called “intensive” and
“extensive”. The intensive margin works through firms’ growth and behavioural
change. For instance, Bernard et al. (2006b) show that the growth differential in
favour of capital intensive firms rises with the level of import competition in US
manufacturing. Moreover, US firms are found to change systematically their product
mix in response to import pressure, shifting to more capital and skill intensive
activities. International outsourcing is also found to be a strategic reaction sheltering
manufacturing firms from import competition in Belgium (Coucke and Sleuwaegen,
forthcoming). All this evidence points to a trade related reallocation of resources
among surviving firms towards higher value added activities, consistent with the
comparative advantages of developed countries. Firm turnover is the complementary
“extensive” margin of industry adjustment, and constitutes the focus of our paper. Up
to date, empirical studies have primarily focused on firm exit, and increasing trade
exposure has been found to lower the likelihood of firm survival (Bernard et al.,
2006a-2006b; Coucke and Sleuwaegen, forthcoming). Consistent with the theoretical
market selection predictions (Melitz, 2003; Melitz and Ottaviano, 2005; Bernard et al.,
2007), heterogeneous firms seem to be affected differently by globalization pressure,
with less productive and labour intensive companies being more at risk of failure. In
spite of this interest on exit, no comparable attention has been paid to its mirror
phenomenon: firm entry. To the best of our knowledge, with the partial exception of
De Backer and Sleuwaegen (2003), no studies have looked insofar at the impact of
trade exposure on the creation of new business ventures. By focusing on both entry
and exit of firms in a novel conceptual framework, our paper fills this gap in the
literature.
8
Moreover, we add to the body of existing evidence in at least two other ways.
First, thanks to the availability of comparable industry level data, entry and exit
patterns are studied across countries. Second, for the first time we separately assess
the effects of trade integration on the population of small firms (with less than twenty
employees).
The remaining of the paper is organized as follows. In section 3 we develop
our conceptual framework and posit the research hypotheses. In section 4 data and
analytical model are presented. Results are analysed in section 5, while section 6
concludes.
3. CONCEPTUAL FRAMEWORK AND HYPOTHESES
Recently developed models of international trade with heterogeneous firms
predict that trade liberalization increases the competitive pressure on companies, thus
resulting in a market selection process (Melitz, 2003; Bernard et al., 2003; Melitz and
Ottaviano, 2005). When openness to trade increases, the minimum productivity level
to stay in business is bid up. As a result, the least productive firms are forced to exit,
while the most efficient ones benefit from the liberalization by entering the export
markets and expanding. This prediction has been confirmed by firm-level empirical
work on the US manufacturing sector by Bernard et al. (2006a, 2007). In theory, the
impact of trade on exit could be driven by both import competition, through lower
mark-ups (Melitz and Ottaviano, 2005), and export intensity (Melitz, 2003). In the
latter case, less efficient firms are crowded out on the factor markets by the more
productive companies selling abroad. Previous empirical studies have focused on
import competition pressure, which is found to result in lower probability of survival
at the firm level and, consistently, in higher exit rates at the industry level (Bernard et
al., 2006b; Coucke and Sleuwaegen, forthcoming; De Backer and Sleuwaegen, 2003).
However, the export intensity effects should also be tested for. We therefore posit:
H1: An increase in openness to trade results in higher exit rates at the sector
level. Both rising import competition and export intensity drive the effect.
9
As previously anticipated, much less attention has been paid in the literature to
firm entry in globalizing industries. At the theoretical level, a model by Grossman
(1984) predicts lower entrepreneurial rates in an open economy relatively to the
autarky case, in the absence of efficient risk sharing markets. The latter prediction has
been empirically confirmed by De Backer and Sleuwaegen (2003), working on
Belgian manufacturing industries. In both articles the focus is on the import
competition channel, and there is no control for the export dynamics in the empirical
estimation. Instead, we think that it is crucial to look also at the export intensity side of
trade integration. In fact, when trade exposure increases, the whole industry structure
facing a new business venture changes. The market selects the most productive
incumbents, which emerge as successful exporters and grow by capturing new market
opportunities abroad. The new relevant market for a potential entrepreneur thus
becomes more competitive and risky. This implies higher barriers to entry and is
intuitively likely to result in lower creation of new firms. Hence:
H2: An increase in openness to trade results in lower entry rates at the sector
level. Both rising import competition and export intensity drive the effect.
Several empirical studies of industry dynamics have shown that firm entry
tends to be positively correlated with previous exit (Dunne et al., 1988; Siegfried and
Evans, 1994; Mata and Portugal, 1994; Caves, 1998; De Backer and Sleuwaegen,
2003). A theoretical interpretation is provided by the carrying capacity models, with
the concept of replacement entry (Geroski, 1995; Carree and Thurik, 1999). The
simple underlying idea is that, as incumbent firms exit, room for new entrepreneurs
becomes available in the market. In a recent paper, Pe’er and Vertinsky (forthcoming)
show how such a process of creative replacement entry is associated to productivity
growth at the local level. Indeed, they find that exit of incumbent firms (especially
older ones) results in higher subsequent entry and aggregate efficiency gains, as new
entrants are on average more productive than exiting firms. These findings suggest
that new business ventures may take advantage of resources which are released by
previous exit and re-employ them in more productive ways, for instance by adopting
new technologies. Pe’er and Vertinsky do not analyze how different drivers of exit
affect these dynamics.
10
However, as manufacturing firms are displaced by increasing import
competition, we might expect the process of replacement entry to be less relevant. In
fact, import penetration primarily displaces firms involved in activities which are at
odds with a country’s comparative advantages, and thus not appealing for new
potential entrepreneurs. Therefore we posit:
H3: Relatively less replacement entry takes place with respect to exit which is
due to import competition displacement.
We have based our hypotheses on the traditional concepts of import
competition and export intensity. Basically this means referring to the evolution of
trade volumes relatively to domestic production over time. However, there is reason to
believe that changes in the composition of trade also matter in explaining industry
dynamics. Going back to our previous description of the intensive margin of sectoral
adjustment to trade, Bernard et al. (2006b) have shown that US firms react to import
competition by shifting to more capital and skill-intensive products, which are less
exposed to the latter competitive pressure. At the same time, labour-intensive
activities are increasingly off-shored to low-wage countries. A growing number of
firms in wealthier economies are actively facing the global competitive pressure by
sourcing intermediates abroad (OECD 2006). This cross-country fragmentation of
production networks often involves two-way outward processing trade flows. All the
latter adjustment dynamics jointly result in increasing trade complementarities within
broadly defined sectors, which can be captured by a growth in the standard Grubel-
Lloyd index of intra-industry trade (see section 3). Indeed, Coucke and Sleuwaegen
(forthcoming) show that firms in industries with low levels of intra-industry trade
(IIT) are more sensitive to import competition in terms of lower probability of
survival. We can also expect to observe relatively higher entry rates in those sectors in
which IIT is increasing. In fact, potential entrepreneurs would rather choose to enter
those industries which are getting more fit with respect to the global competitive
scenario, in terms of product differentiation and international sourcing dynamics.
Therefore we posit:
H4: Ceteris paribus, lower exit and higher entry rates are associated with
positive variations in Intra Industry Trade.
11
4. DATA AND EMPIRICAL MODEL
4.1 Data Description
Our analysis is based on the new “Business Demography Statistics” database
by Eurostat. We employ sectoral entry and exit rates for eight European countries:
Belgium, Denmark, Finland, Italy, Netherlands, Spain, Sweden and United Kingdom1.
We focus on the manufacturing sector, for the time-span: 1997-2003. Data are
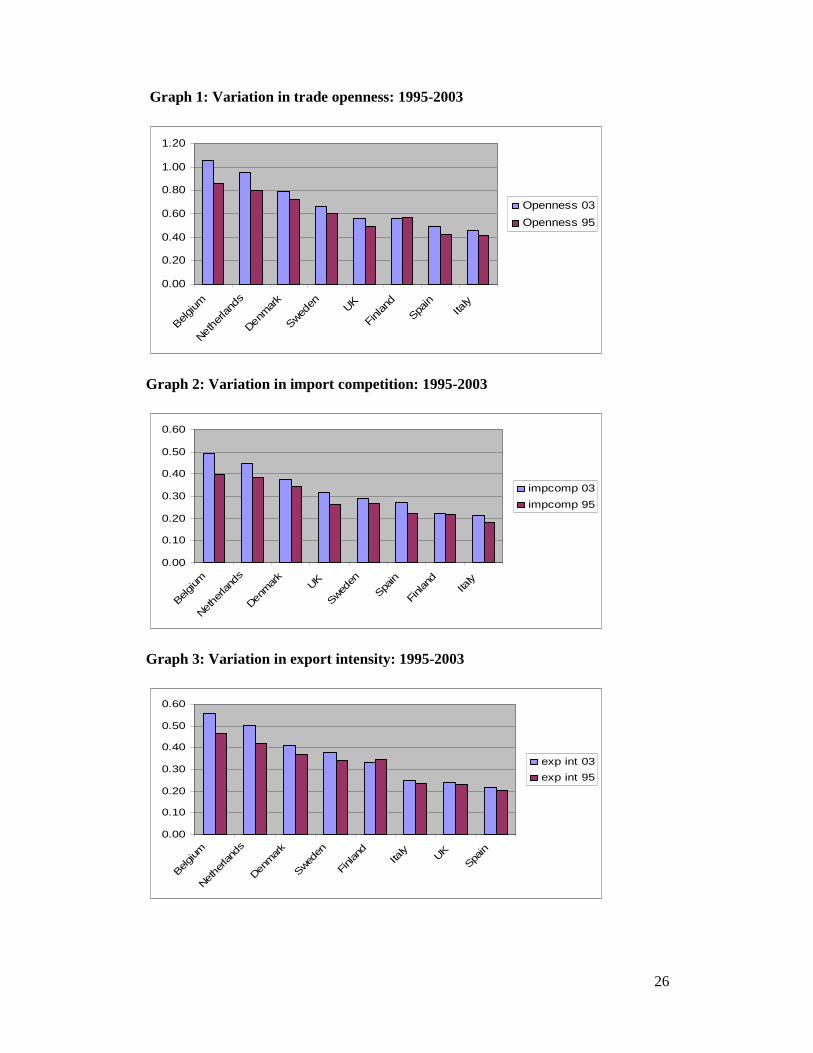
provided at the Eurostat NACE (Rev. 1.1) “sub-section” level of industry
aggregation2. Sub-sections are identified by two-character alphabetical codes (from
DA to DN) and correspond to two-digit sectors or aggregations of them (see Table 1).
Insert Table 1 About Here
Two industries have been excluded from the analysis: “manufacturing of coke,
refined petroleum products and nuclear fuels” (DF) and “manufacturing n.e.c.” (DN).
In the former case, the choice is due to the peculiar nature of the sector, whose
industry dynamics are more likely to be related to legal changes and natural factors
rather than trade. “Manufacturing n.e.c.” is instead a residual category for relatively
heterogeneous activities (from the manufacturing of furniture to recycling), which
would evidently raise problems in analysing the relation between sector-level trade
openness and firm dynamics.
Entry (exit) rates are defined as the ratio of the number of enterprise births
(deaths) in the reference year over the number of enterprises active in the same period,
for each industry-country pair. Data are comparable across countries and are
constructed to reflect “true” entry and exit of firms. Indeed, in Eurostat words,
enterprise births (deaths) refer only to the real creation (dissolution) of companies. In
practice this is obtained by processing the full national business registers data in order
to identify and exclude those entries and exits which are just due to mergers, take-
overs or break-ups of firms.
1 The sample selection is driven by data availability reasons. Indeed, not all the European countries participate in the demography data collection. Portugal was excluded due to lack of data for other variables which will be used in the analysis. 2 NACE (Rev. 1.1) is the European classification of economic activities corresponding to ISIC (Rev. 3.1).
12
Changes of activities at the firm level also do not result in exit (entry) from (in)
a given sector. Moreover, a company is excluded from the count of deaths in a given
period if it gets reactivated within two years. Specularly, the eventual reactivation is
not counted as a birth.
This kind of data processing also explains the time-lag in the data release3.
Finally, as previously anticipated, separate sectoral figures can be retrieved for the
category of small firms (with less than twenty employees).
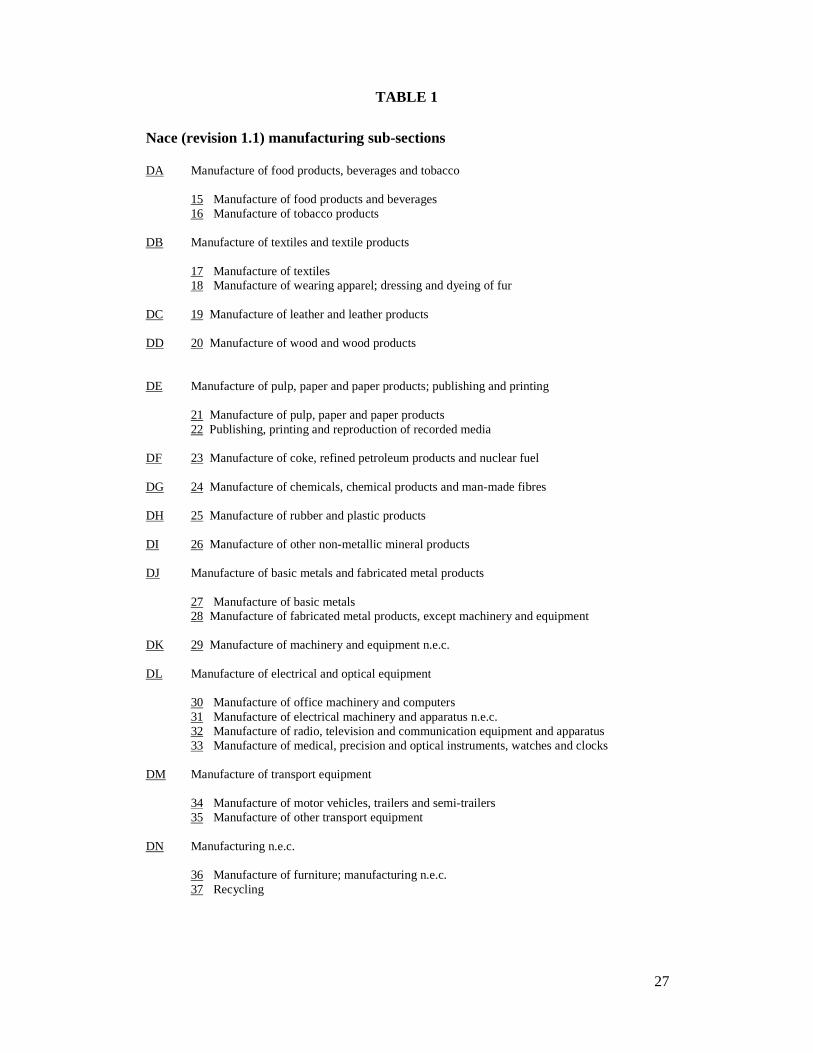
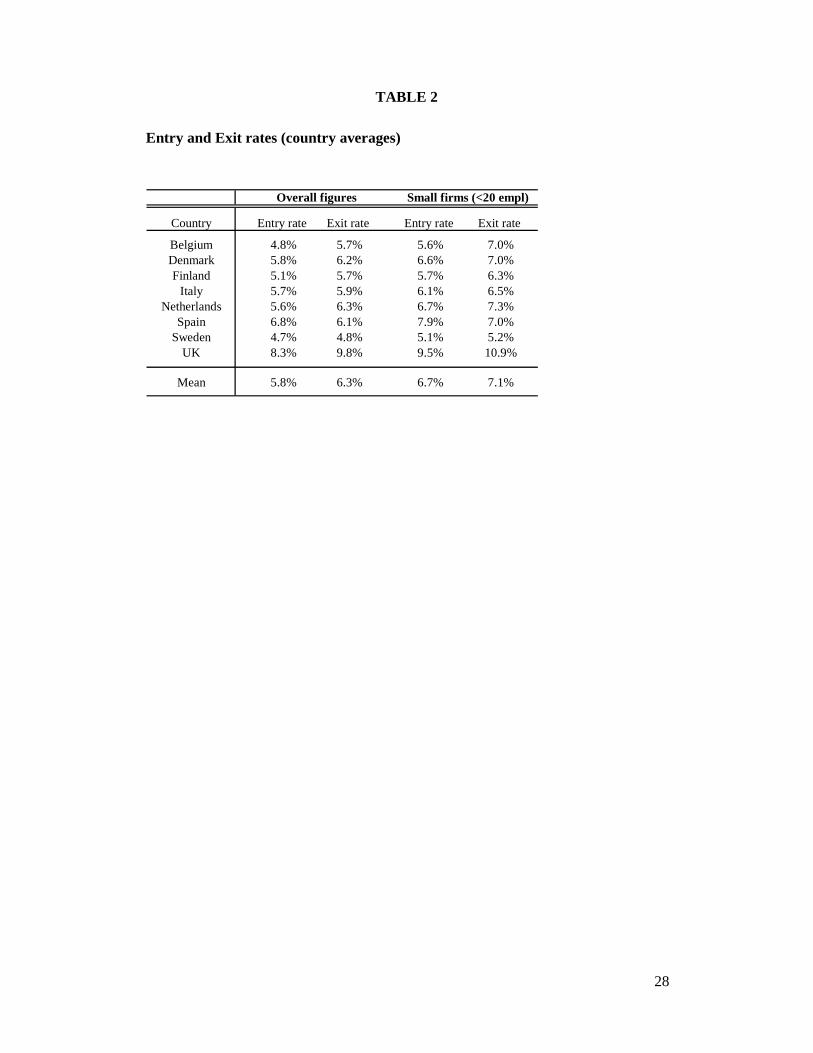
Table 2 provides some descriptive statistics referring to country-specific
average entry and exit rates (across sectors and time).
Insert Table 2 About Here
Both general and small firms’ figures are presented. As we can see from the
bottom row, overall entry and exit rates are on average 5.8% and 6.3% respectively.
Intuitively, small firms’ figures are higher than the ones referring to the whole
population. UK and Spain are the countries displaying the highest level of firm
churning. Spain is also the only country for which birth rates are on average higher
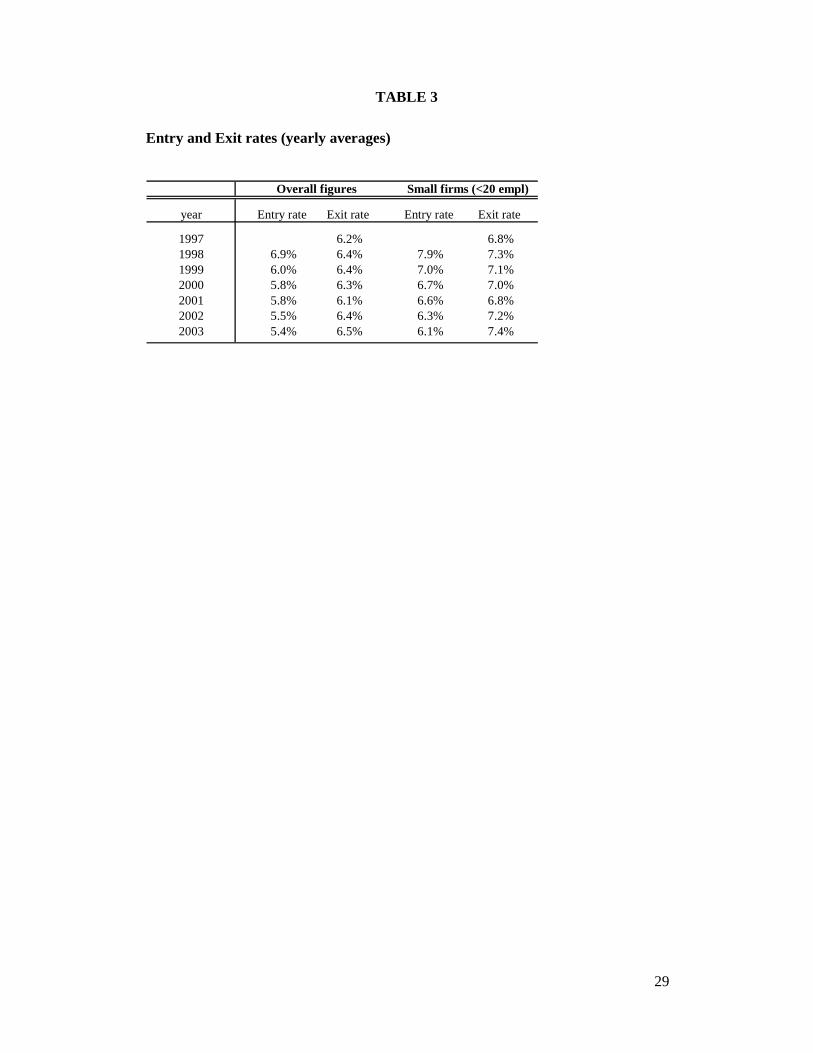
than the exit ones. In Table 3 we report the yearly average figures (across countries
and sectors).
Insert Table 3 About Here
Two trends seem to emerge: exit rates are on average increasing over time
while entry rates are significantly declining. For instance, the overall mean birth rate
drops from 6.9% in 1998 to 5.4% in 2003. Following our hypotheses, in the empirical
analysis we will investigate the relation between these firm dynamics and the
evolution in trade exposure. It is therefore important at this stage to present the foreign
trade data and the indicators that will be employed.
Sectoral import and export flows are retrieved from the Eurostat COMEXT
foreign trade database, from 1995 to 2003.
3 Further details can be found on the Eurostat metadata documents: http://epp.eurostat.ec.europa.eu
13
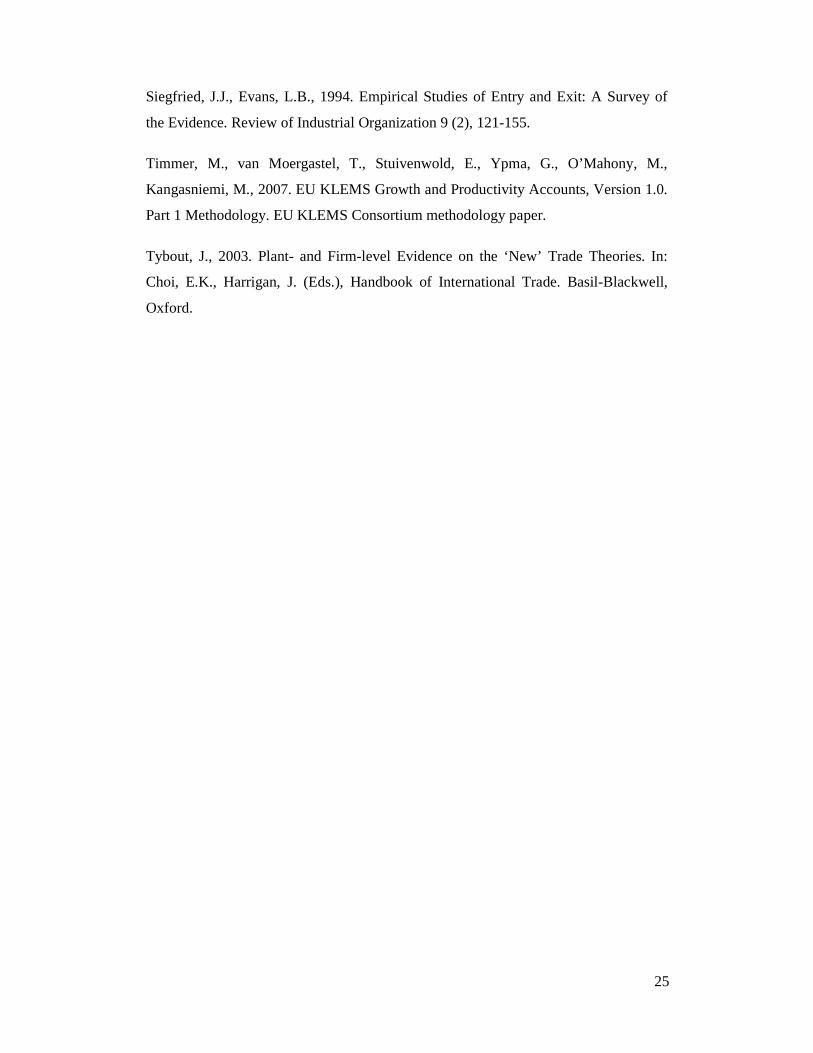
We adopt the following measure of general openness to trade: the sum of
industry imports and exports over the sum of domestic production plus imports4
(Klein, Schuh and Triest, 2003). This index can be further decomposed into two
components: import competition and export intensity. The former is defined as in
Davis et al. (1996): sectoral imports over the sum of domestic production plus
imports.
Specularly, the latter is computed as the ratio of industry exports over the same
denominator. Graph 1 shows the evolution of the general trade openness index from
1995 to 2003, at the country level, for the whole manufacturing sector. The level of
trade exposure is increasing everywhere but in Finland. The average growth is around
8 percentage points, with Belgium witnessing the highest boost: 19 perc. points.
Graphs 2 and 3 reveal that the increase in general openness is driven almost equally by
its two components: import competition and export intensity. Indeed, they grow on
average by 4.4 and 3.3 percentage points respectively.
These descriptive statistics confirm the view that a trade integration process is
going on, and this is characterized by both increasing import competition and higher
export intensity at the industry level.
Finally, in order to test for our H3 we will employ the Grubel-Lloyd (1975)
index of intra-industry trade, which is computed as follows (Coucke and Sleuwaegen,
forthcoming; Marvel and Ray, 1987):
IITijt = 2*min (Mijt, Xijt)/(Mijt + Xijt)
where M equals total imports and X stands for total exports of sector i, in
country j, at time t.
The index ranges between zero (no intra-industry trade) and one (perfect intra-
industry trade), and captures the level of product heterogeneity and trade
complementarities between each sector-country pair and the trading partners. We
interpret an increase in intra-industry trade as an adjustment to trade liberalization. In
fact, the index is likely to grow following firms’ strategic reactions to global
integration, in terms of product differentiation and international outsourcing. For
instance, it has been shown that companies adjust to increasing import pressure by
4 Domestic production figures are available in the Eurostat “Structural Business Statistics” database.
14
changing their product mix and developing market segments facing lower foreign
competition (Bernard et al., 2006b). Global sourcing of intermediate inputs and
outward processing trade are also becoming increasingly relevant (Coucke and
Sleuwaegen, forthcoming; OECD 2006).
When evaluated at our broad (NACE “sub-section”) level of industry
aggregation, the latter dynamics are expected to result in higher correlation of import
and export flows, thus leading to an increase in the Grubel-Lloyd index.
4.2 The empirical model
In what follows we present the baseline econometric model which will be
estimated in order to test for our hypotheses:
Exit (Entry)ijt = β0 +β1 lag(∆ TradeExposure ij) + β2 ∆ IIT ijt + β3 Z ij(t-1) + βi + βj + βt
+ε ijt
where i indicates the industry, j stands for the country and t for the year.
Depending on the considered hypothesis, the dependent variable can be either
the industry-level exit rate or the entry rate (both defined as explained in subsection
4.1). ∆ TradeExposure represents the percentage point variation in the trade exposure
index whose effects are tested for. We will always start with the overall trade
openness index, and then separately consider its two components: import competition
and export intensity (see subsection 4.1). Intuitively, and consistent with previous
studies (Bernard et al., 2006b; Coucke and Sleuwaegen, forthcoming; De Backer and
Sleuwaegen 2003), we allow for a lagged adjustment to the growth in trade exposure.
Without having a prior on the exact lag structure, we will begin the analysis by
including both the first and second lagged variations in overall trade openness, thus
accounting for both changes between (t-1) and (t-2), and between (t-2) and (t-3).
∆ IIT represents the percentage point change in the Grubel and Lloyd (1975)
index of intra-industry trade, as defined in the previous subsection.
15
A positive variation is interpreted as an industry adjustment to trade
integration; therefore the contemporaneous IIT change (between (t) and (t-1)) is
included in the exit rate regressions in order to test for the first part of H3: i.e. the
presence of a negative correlation between the extent of industry adjustment and the
death rate. Instead, the second part of H3 is tested for by including the lag one
variation of IIT in the Entry regressions.
(βi , βj , βt) stand for industry, country and year fixed effects. They are included
to control for unobserved heterogeneity and cyclical effects. Finally, Z represents a
vector of industry/country specific lagged control variables, whose inclusion is
suggested by theory and empirical evidence on industry dynamics. They are presented
in the remaining of this section.
Many papers have shown the presence of a positive correlation between entry
and exit flows in subsequent periods (Dunne et al., 1988; Siegfried and Evans, 1994;
Mata and Portugal, 1994; Caves, 1998; De Backer and Sleuwaegen, 2003). Higher
entry in a year is found to raise exit in the following one, and vice versa. A theoretical
explanation is provided by the carrying capacity models, with the concepts of
displacement and replacement entry (Geroski, 1995; Carree and Thurik, 1999).
Intuitively, firm entries displace incumbents, while room and resources for new
business ventures are released by previous exit (Pe’er and Vertinsky, forthcoming).
Consistent with this, we control for lagged entry and exit rates in our regressions.
Total factor productivity seems to be an important determinant of survival at
the firm level; in fact, more productive firms are found to be less likely to exit
(Bernard et al., 2006a-2006b; Coucke and Sleuwaegen, forthcoming). As we have
seen, this is consistent with the theoretical predictions on survival emerging from the
new models of international trade with heterogeneous firms (Melitz, 2003; Melitz and
Ottaviano, 2005; Bernard et al., 2003). Throughout our analysis, we control for total
factor productivity (%) growth at the industry level (TFP Growth). However, given
the sector level focus of our study, the expected effect on the exit rate is not obvious: it
will depend on the distribution of firm-level changes in TFP. For instance, if the
productivity growth is not homogeneous across companies, the effects on firm level
survival could cancel out at the industry level. On the contrary, we might expect
sectoral productivity growth to lower future entry rates. Indeed, an increase in
productivity at the industry level results in a more competitive environment for a new
entrepreneurial venture.
16
The minimum efficiency level which is required to enter the market is likely to
increase, thus resulting in higher barriers to entry. Data on industry level total factor
productivity are sourced from the EU KLEMS database (March 2007 version). The
latter db is the outcome of a project financed by the European Commission for the
analysis of productivity and growth.
It has been produced by a consortium of 15 organizations across the EU, with
support from Eurostat, OECD, the Groningen Growth and Development Centre and
various National Statistical Institutes5. Sectoral productivity is estimated through a
growth accounting exercise, by taking into account various categories of capital, labor,
energy, material and service inputs6.
We also incorporate a second control for the evolution of barriers to entry: the
(%) growth in the physical capital services per hour worked (K/L Growth), also
retrieved from the EU KLEMS database7. The inclusion of this variable is motivated
by capital intensity being identified as an important factor affecting entry and exit
decisions (Geroski, 1995; De Backer and Sleuwaegen, 2003). As a last control, we
include the logarithm of the net investment in tangible assets over turnover at the
sector level (Investment). This variable is computed from Eurostat data and constitutes
a proxy for the extent of restructuring, capacity building and investment opportunities
in the industry. As such, it is expected to have a positive impact on both exit and entry,
since restructuring waves are normally characterized by higher firm churning
(Geroski, 1995).
The model is estimated through Least Squares Dummy Variables regressions,
with heteroskedasticity robust standard errors. Results are presented in the following
section, first for exit and then for entry. A final discussion will follow.
5 More details are available on the EU KLEMS website: http://www.euklems.net/index.html 6 The methodology and variables are described in “EU KLEMS growth and productivity accounts (Version 1.0). Part I Methodology”. 7 See the previous footnote for a methodological reference.
17
5. RESULTS
5.1 Trade integration and Exit
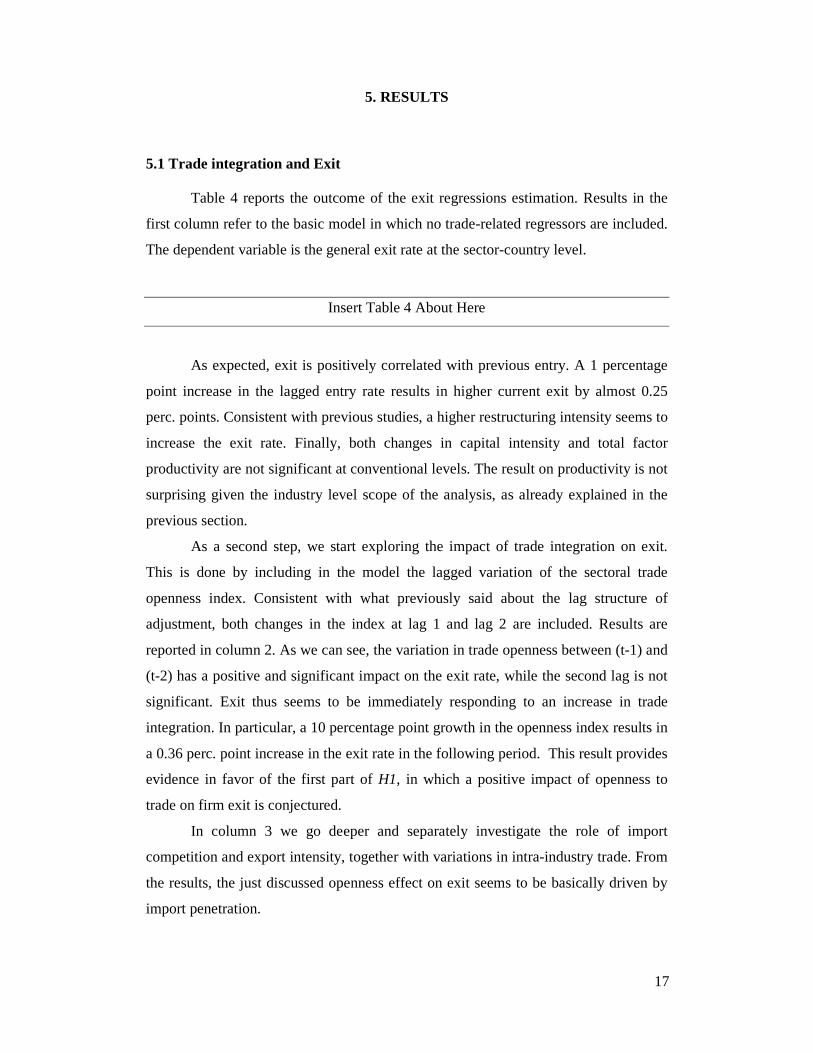
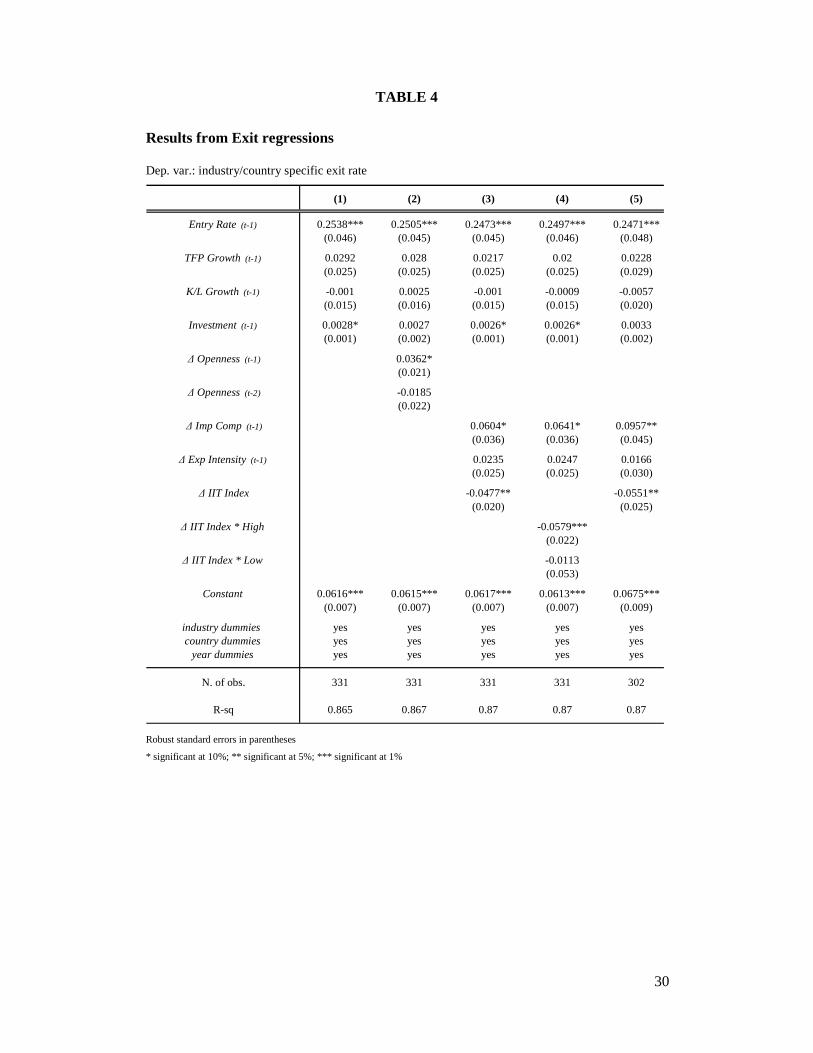
Table 4 reports the outcome of the exit regressions estimation. Results in the
first column refer to the basic model in which no trade-related regressors are included.
The dependent variable is the general exit rate at the sector-country level.
Insert Table 4 About Here
As expected, exit is positively correlated with previous entry. A 1 percentage
point increase in the lagged entry rate results in higher current exit by almost 0.25
perc. points. Consistent with previous studies, a higher restructuring intensity seems to
increase the exit rate. Finally, both changes in capital intensity and total factor
productivity are not significant at conventional levels. The result on productivity is not
surprising given the industry level scope of the analysis, as already explained in the
previous section.
As a second step, we start exploring the impact of trade integration on exit.
This is done by including in the model the lagged variation of the sectoral trade
openness index. Consistent with what previously said about the lag structure of
adjustment, both changes in the index at lag 1 and lag 2 are included. Results are
reported in column 2. As we can see, the variation in trade openness between (t-1) and
(t-2) has a positive and significant impact on the exit rate, while the second lag is not
significant. Exit thus seems to be immediately responding to an increase in trade
integration. In particular, a 10 percentage point growth in the openness index results in
a 0.36 perc. point increase in the exit rate in the following period. This result provides
evidence in favor of the first part of H1, in which a positive impact of openness to
trade on firm exit is conjectured.
In column 3 we go deeper and separately investigate the role of import
competition and export intensity, together with variations in intra-industry trade. From
the results, the just discussed openness effect on exit seems to be basically driven by
import penetration.
18
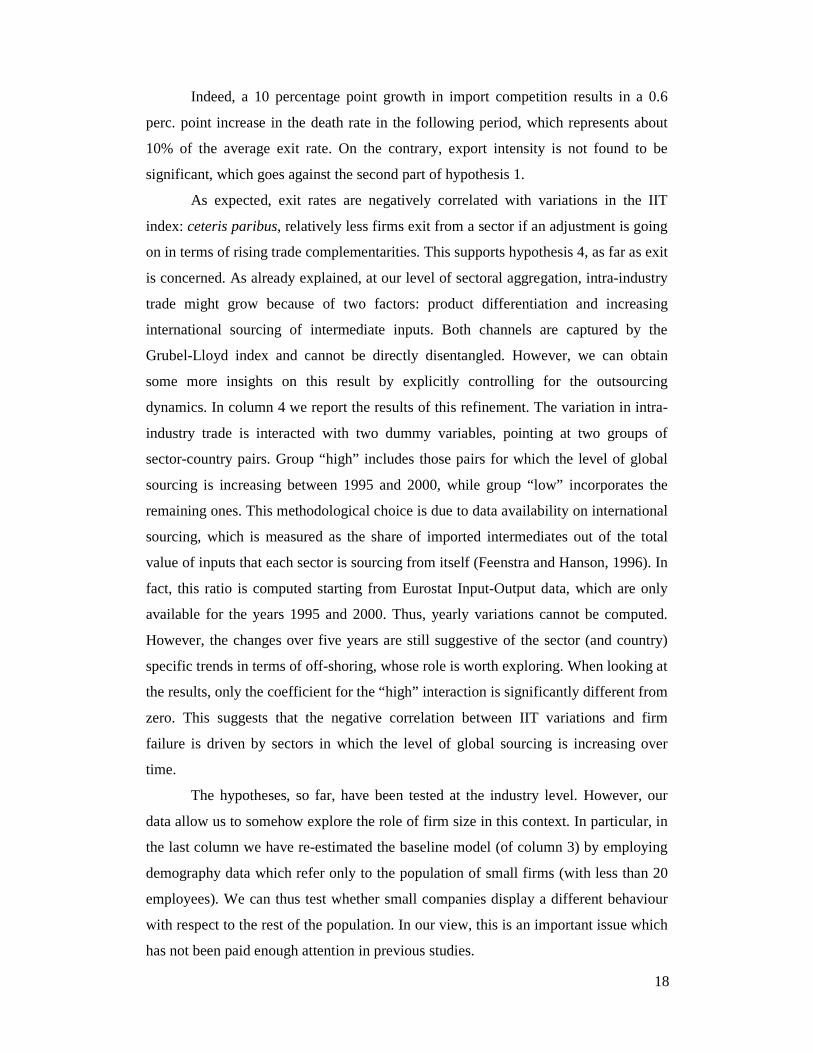
Indeed, a 10 percentage point growth in import competition results in a 0.6
perc. point increase in the death rate in the following period, which represents about
10% of the average exit rate. On the contrary, export intensity is not found to be
significant, which goes against the second part of hypothesis 1.
As expected, exit rates are negatively correlated with variations in the IIT
index: ceteris paribus, relatively less firms exit from a sector if an adjustment is going
on in terms of rising trade complementarities. This supports hypothesis 4, as far as exit
is concerned. As already explained, at our level of sectoral aggregation, intra-industry
trade might grow because of two factors: product differentiation and increasing
international sourcing of intermediate inputs. Both channels are captured by the
Grubel-Lloyd index and cannot be directly disentangled. However, we can obtain
some more insights on this result by explicitly controlling for the outsourcing
dynamics. In column 4 we report the results of this refinement. The variation in intra-
industry trade is interacted with two dummy variables, pointing at two groups of
sector-country pairs. Group “high” includes those pairs for which the level of global
sourcing is increasing between 1995 and 2000, while group “low” incorporates the
remaining ones. This methodological choice is due to data availability on international
sourcing, which is measured as the share of imported intermediates out of the total
value of inputs that each sector is sourcing from itself (Feenstra and Hanson, 1996). In
fact, this ratio is computed starting from Eurostat Input-Output data, which are only
available for the years 1995 and 2000. Thus, yearly variations cannot be computed.
However, the changes over five years are still suggestive of the sector (and country)
specific trends in terms of off-shoring, whose role is worth exploring. When looking at
the results, only the coefficient for the “high” interaction is significantly different from
zero. This suggests that the negative correlation between IIT variations and firm
failure is driven by sectors in which the level of global sourcing is increasing over
time.
The hypotheses, so far, have been tested at the industry level. However, our
data allow us to somehow explore the role of firm size in this context. In particular, in
the last column we have re-estimated the baseline model (of column 3) by employing
demography data which refer only to the population of small firms (with less than 20
employees). We can thus test whether small companies display a different behaviour
with respect to the rest of the population. In our view, this is an important issue which
has not been paid enough attention in previous studies.
19
Indeed, both Bernard et al. (2006a, 2006b) and Coucke and Sleuwaegen
(forthcoming) control for firm size in their empirical analysis, but this variable is not
interacted with the crucial trade-related ones. The outcome suggests that increasing
import penetration affects small firms to the same extent as the rest of the population.
Indeed, the import competition coefficients in column 3 and 5 are not significantly
different from each other.
5.2 Trade integration and Entry
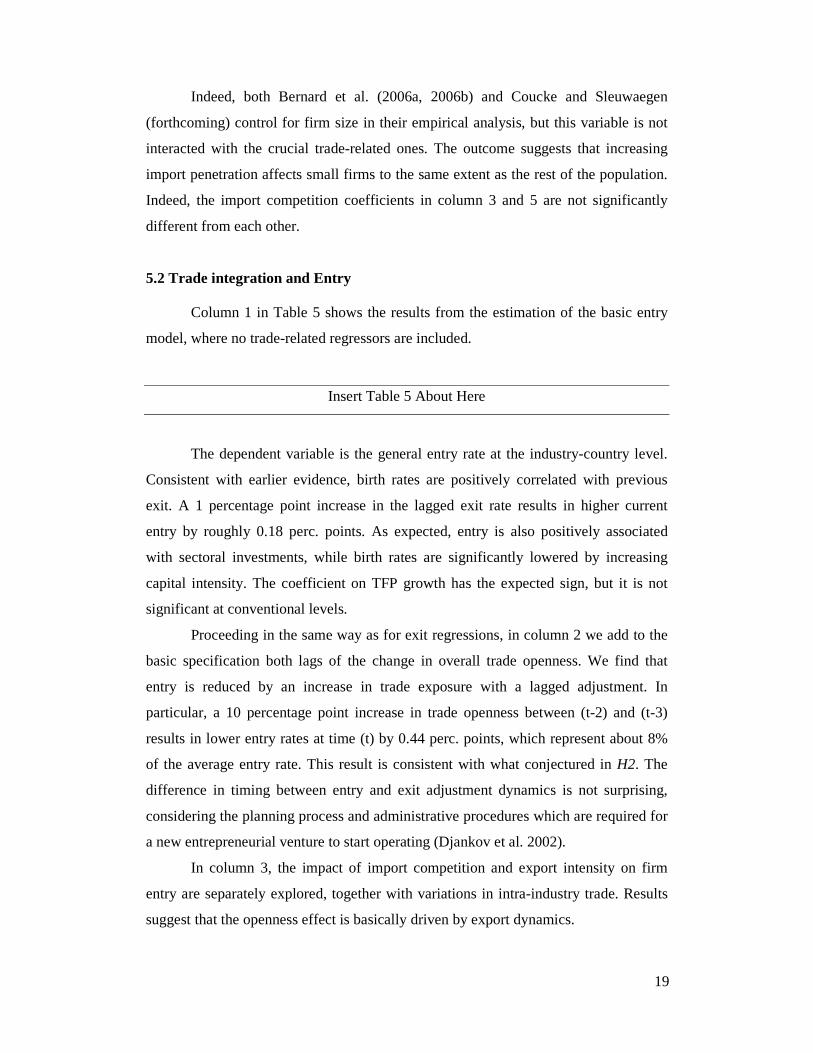
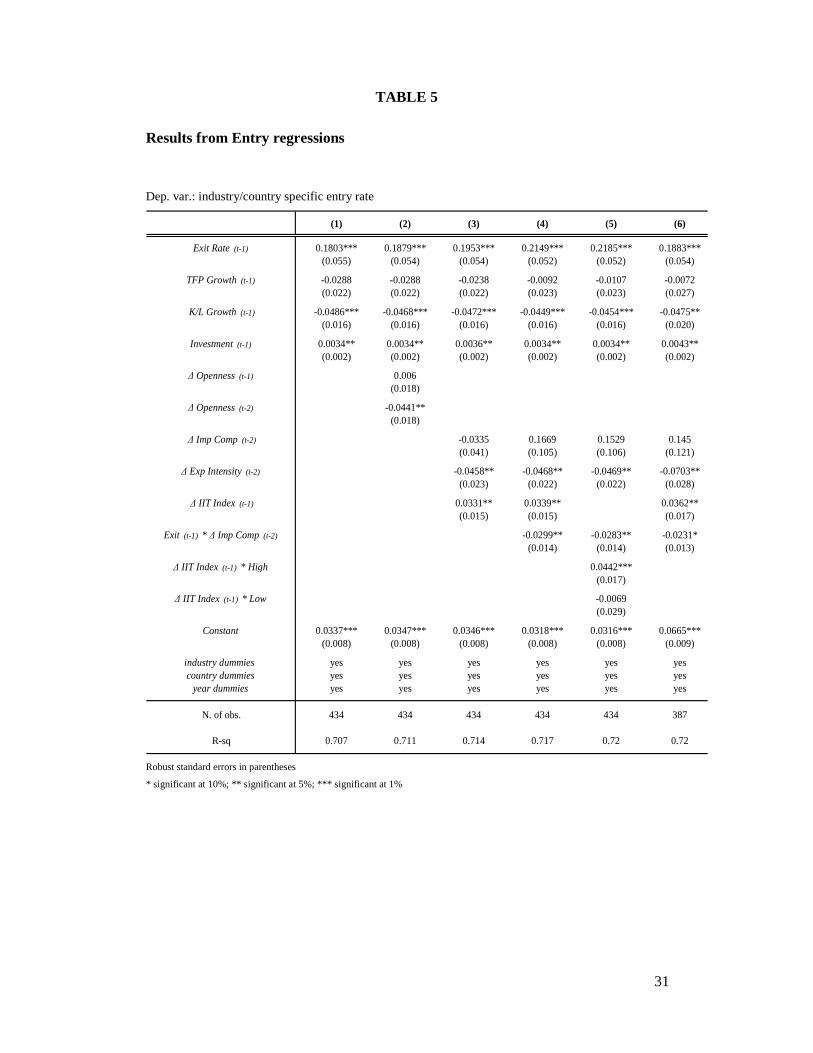
Column 1 in Table 5 shows the results from the estimation of the basic entry
model, where no trade-related regressors are included.
Insert Table 5 About Here
The dependent variable is the general entry rate at the industry-country level.
Consistent with earlier evidence, birth rates are positively correlated with previous
exit. A 1 percentage point increase in the lagged exit rate results in higher current
entry by roughly 0.18 perc. points. As expected, entry is also positively associated
with sectoral investments, while birth rates are significantly lowered by increasing
capital intensity. The coefficient on TFP growth has the expected sign, but it is not
significant at conventional levels.
Proceeding in the same way as for exit regressions, in column 2 we add to the
basic specification both lags of the change in overall trade openness. We find that
entry is reduced by an increase in trade exposure with a lagged adjustment. In
particular, a 10 percentage point increase in trade openness between (t-2) and (t-3)
results in lower entry rates at time (t) by 0.44 perc. points, which represent about 8%
of the average entry rate. This result is consistent with what conjectured in H2. The
difference in timing between entry and exit adjustment dynamics is not surprising,
considering the planning process and administrative procedures which are required for
a new entrepreneurial venture to start operating (Djankov et al. 2002).
In column 3, the impact of import competition and export intensity on firm
entry are separately explored, together with variations in intra-industry trade. Results
suggest that the openness effect is basically driven by export dynamics.
20
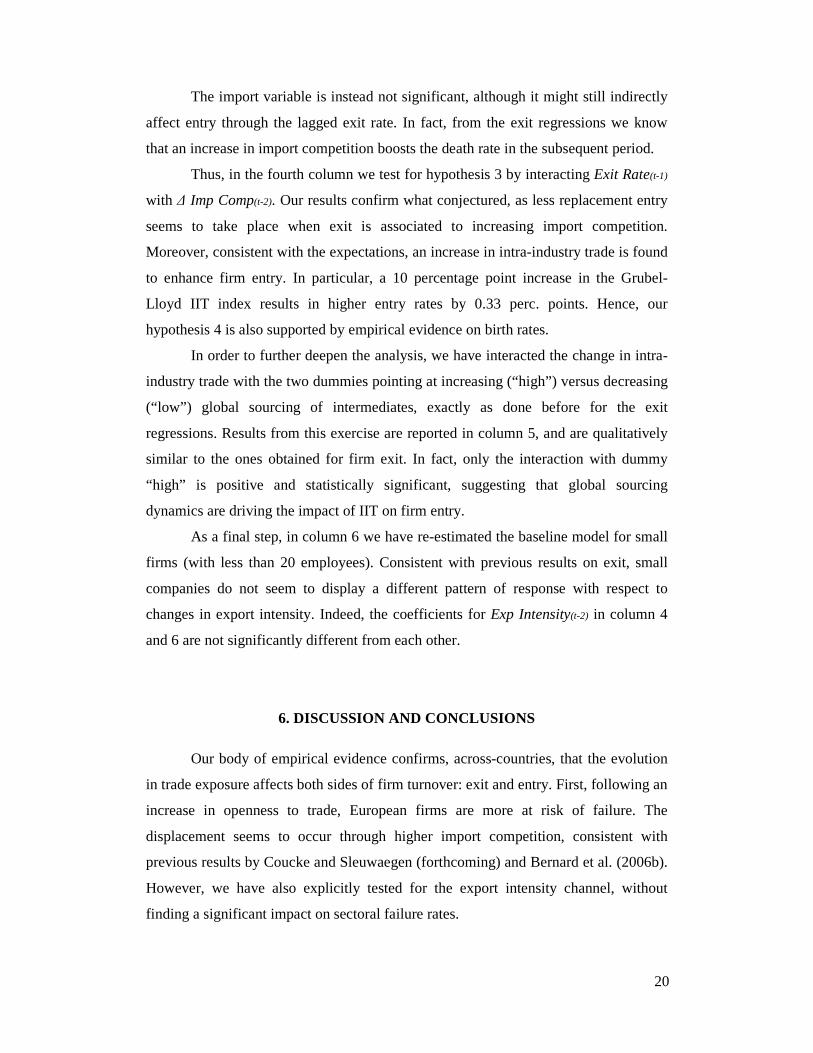
The import variable is instead not significant, although it might still indirectly
affect entry through the lagged exit rate. In fact, from the exit regressions we know
that an increase in import competition boosts the death rate in the subsequent period.
Thus, in the fourth column we test for hypothesis 3 by interacting Exit Rate(t-1)
with ∆ Imp Comp(t-2). Our results confirm what conjectured, as less replacement entry
seems to take place when exit is associated to increasing import competition.
Moreover, consistent with the expectations, an increase in intra-industry trade is found
to enhance firm entry. In particular, a 10 percentage point increase in the Grubel-
Lloyd IIT index results in higher entry rates by 0.33 perc. points. Hence, our
hypothesis 4 is also supported by empirical evidence on birth rates.
In order to further deepen the analysis, we have interacted the change in intra-
industry trade with the two dummies pointing at increasing (“high”) versus decreasing
(“low”) global sourcing of intermediates, exactly as done before for the exit
regressions. Results from this exercise are reported in column 5, and are qualitatively
similar to the ones obtained for firm exit. In fact, only the interaction with dummy
“high” is positive and statistically significant, suggesting that global sourcing
dynamics are driving the impact of IIT on firm entry.
As a final step, in column 6 we have re-estimated the baseline model for small
firms (with less than 20 employees). Consistent with previous results on exit, small
companies do not seem to display a different pattern of response with respect to
changes in export intensity. Indeed, the coefficients for Exp Intensity(t-2) in column 4
and 6 are not significantly different from each other.
6. DISCUSSION AND CONCLUSIONS
Our body of empirical evidence confirms, across-countries, that the evolution
in trade exposure affects both sides of firm turnover: exit and entry. First, following an
increase in openness to trade, European firms are more at risk of failure. The
displacement seems to occur through higher import competition, consistent with
previous results by Coucke and Sleuwaegen (forthcoming) and Bernard et al. (2006b).
However, we have also explicitly tested for the export intensity channel, without
finding a significant impact on sectoral failure rates.
21
This suggests that higher competition on the product markets (Melitz and
Ottaviano, 2005) rather than displacement on the factor markets (Melitz, 2003) is
driving the effect. Industry-level exit rates are negatively correlated with intra-industry
trade growth.
All else equal, relatively less firms exit from sectors in which an adjustment is
going on in terms of rising trade complementarities with respect to the partner
countries. When explicitly controlling for global sourcing of intermediates, the latter
correlation seems to be determined by off-shoring dynamics. This result is consistent
with the findings by Coucke and Sleuwaegen (forthcoming) pointing to international
sourcing as a strategy resulting in higher firm survival probabilities in Belgium.
Regarding firm entry, we find that an increase in trade openness results in
lower birth rates (with a lagged adjustment), through both drivers of import
competition and export intensity. First, import penetration has an indirect effect on
birth rates through the replacement entry channel, i.e. the component of entry which is
directly related to previous exit. Indeed, we find that relatively less replacement entry
takes place when exit is associated to increasing import competition. Many studies
have shown that firm entry is positively related with exit in earlier periods, as new
business ventures may take advantage of market shares and resources which are
released by exiting incumbents (Dunne et al., 1988; Siegfried and Evans, 1994; Mata
and Portugal, 1994; Caves, 1998; De Backer and Sleuwaegen, 2003). Pe’er and
Vertinsky (forthcoming) show that such a process of replacement entry also leads to
aggregate productivity growth, as new entrants re-employ existing resources in more
productive ways. Our results warn that these dynamics might be less relevant when
firm exit is due to increasing import pressure. In fact, import displaced firms are more
likely to be involved in activities which are at odds with a country’s comparative
advantages, and thus not appealing for potential new entrepreneurs. Export intensity
has instead a direct negative impact on firm entry, which can be interpreted as follows:
as trade exposure increases, the market selects the most efficient firms, which grow by
expanding in the export markets (Melitz, 2003; Melitz and Ottaviano, 2005; Bernard
et al., 2007). This dynamic is captured by an increase in the export intensity index, and
intuitively results in higher barriers to entry for new business ventures. The relevant
market for a potential entrepreneur becomes in fact more competitive, inducing a
decline in entry rates.
22
Finally, relatively more firms enter those sectors in which the level of intra-
industry trade is increasing. Also in this case the effect seems to be driven by
international off-shoring dynamics.
Our results convey important implications on entrepreneurship policy in times
of globalization. First of all, public authorities should favour firm restructuring
processes.
Indeed, reorganization of production seems to be an effective strategy leading to lower
exit and higher firm entry at the industry level. Restructuring may be supported
through flexible labour market regulation and a general simplification of bureaucratic
requirements on doing business. Secondly, following the shift in comparative
advantages towards knowledge intensive activities, technological innovation has
become “the” crucial factor in determining the growth potential of European countries.
Consequently, investments in research and development should be enhanced, for
instance through fiscal incentives and by favouring partnerships between companies,
universities and public research institutes. Finally, there is evidence that globalization
is associated to higher risk, tougher competitive pressure and increasing barriers to
entry for potential entrepreneurs, resulting in declining entry rates in the analysed
countries. In this context, an effective entrepreneurship policy should focus on helping
entrepreneurs in exploiting the new opportunities which become available on the
international markets. This primarily involves the provision of information and the
engagement of public institutions in network building between domestic and foreign
entrepreneurs. Moreover, as the entry level of capital commitment increases,
improving access to finance must be a key policy goal in order for entrepreneurial
energies to develop. This requires liberalization and appropriate regulation of the
financial sector in the first place. In addiction, efforts should focus on the development
of venture capital markets and investment funds, whose risk pooling facilitates the
financing of a wider range of entrepreneurial projects.
To conclude, our findings contribute to the understanding of the relation
between trade and firm exit, and provide some first insights on entry dynamics in
globalizing industries. Further research efforts should explore the effects of trade
integration on the characteristics of new business ventures and their survival
perspectives. The role of country-specific institutions in this context should be
analysed as well.
23
REFERENCES
Audretsch, D.B., Mahmood, T., 1995. New Firm Survival: New Results Using a
Hazard Function. Review of Economics and Statistics 77 (1), 97-103.
Audretsch, D.B., Thurik, A.R., 2001. What is new about the new economy: sources of
growth in the managed and entrepreneurial economies. Industrial and Corporate
Change 19, 795-821.
Bernard, A.B., Eaton, J., Jensen, J.B., Kortum, S.S., 2003. Plants and Productivity in
International Trade. American Economic Review 93 (4), 1268-1290.
Bernard, A.B., Jensen, J.B., Schott, P. K., 2006a. Trade costs, Firms and Productivity.
Journal of Monetary Economics 53 (5), 917-937.
Bernard, A.B., Jensen, J.B., Schott, P.K., 2006b. Survival of the Best Fit: Exposure to
Low Wage Countries and the (Uneven) Growth of US Manufacturing Plants. Journal
of International Economics 68 (1), 219-237.
Bernard, A.B., Redding, S. J., Schott, P. K., 2007. Comparative Advantage and
Heterogeneous Firms. Review of Economic Studies 74 (1), 31-66.
Bernard, A.B., Jensen, J.B., Redding, S.J., Schott, P.K., forthcoming. Firms in
International Trade. Journal of Economic Perspectives.
Carree, M.A., Thurik, A.R., 1999. Industrial Structure and Economic Growth. In
Audretsch, D.B., Thurik, A.R. (Eds.), Innovation, Industry Evolution and
Employment. Cambridge University Press, Cambridge.
Caves, R.E., 1998. Industrial Organization and New Findings on the Turnover and
Mobility of Firms. Journal of Economic Literature 36 (4), 1947-1982.
Coucke, K., Sleuwaegen, L., forthcoming. Exit in Globalizing Industries: the Role of
International (out)sourcing. Journal of International Business Studies.
Davis, S.J., Haltiwanger, J.C., Schuh, S., 1996. Job Creation and Destruction. MIT
Press, Cambridge, MA.
24
De Backer, K., Sleuwaegen, L., 2003. Does Foreign Direct Investment Crowd Out
Domestic Entrepreneurship?. Review of Industrial Organization 22 (1), 67-84.
Djankov, S., La Porta, R., Lopez-De-Silanes, F., Shleifer, A., 2002. The Regulation of
Entry. The Quarterly Journal of Economics 117 (1), 1-37.
Dunne, T., Roberts, M.J., Samuelson, L., 1988. Patterns of Firm Entry and Exit in
U.S. Manufacturing Industries. The RAND Journal of Economics 19 (4), 495-515.
Feenstra, R.C., Hanson, G.H., 1996. Globalization, Outsourcing, and Wage Inequality.
American Economic Review 86 (2), 240-245.
Geroski, P.A., 1995. What Do We Know About Entry?. International Journal of
Industrial Organization 13 (4), 421-440.
Grossman, G.M., 1984. International Trade, Foreign Investment, and the Formation of
the Entrepreneurial Class. American Economic Review 74 (4), 605-614.
Grubel, H.G., Lloyd, P.J., 1975. Intra-Industry Trade: the Theory and Measurement of
International Trade in Differentiated Products. John Wiley & Sons, New York.
Klein, M.W., Schuh, S., Triest, R.K., 2003. Job Creation, Job Destruction and the Real
Exchange Rate. Journal of International Economics 59 (2), 239-265.
Marvel, H.J., Ray, E.J., 1987. Intra-Industry Trade: Sources and Effects on Protection.
Journal of Political Economy 95 (6), 1278-1291.
Mata, J., Portugal, P., 1994. Life Duration of New Firms. The Journal of Industrial
Economics 42 (3), 227-245.
Melitz, M.J., 2003. The Impact of Trade on Intra-Industry Reallocations and
Aggregate Industry Productivity. Econometrica 71 (6), 1695-1725.
Melitz, M.J., Ottaviano, G., 2005. Market Size, Trade, and Productivity. Mimeo.
OECD, 2006. Draft Synthesis Report on Global Value Chains.
Pe’er, A., Vertinsky, I., forthcoming. Firm exits as a determinant of new entry: Is there
evidence of local creative destruction?. Journal of Business Venturing.
25
Siegfried, J.J., Evans, L.B., 1994. Empirical Studies of Entry and Exit: A Survey of
the Evidence. Review of Industrial Organization 9 (2), 121-155.
Timmer, M., van Moergastel, T., Stuivenwold, E., Ypma, G., O’Mahony, M.,
Kangasniemi, M., 2007. EU KLEMS Growth and Productivity Accounts, Version 1.0.
Part 1 Methodology. EU KLEMS Consortium methodology paper.
Tybout, J., 2003. Plant- and Firm-level Evidence on the ‘New’ Trade Theories. In:
Choi, E.K., Harrigan, J. (Eds.), Handbook of International Trade. Basil-Blackwell,
Oxford.
26
Graph 1: Variation in trade openness: 1995-2003
0.00
0.20
0.40
0.60
0.80
1.00
1.20
Belgiu
m
Nethe
rland
s
Denmar
k
Sweden UK
Finlan
d
Spain
Italy
Openness 03
Openness 95
Graph 2: Variation in import competition: 1995-2003
0.00
0.10
0.20
0.30
0.40
0.50
0.60
Belgium
Nethe
rland
s
Denmark
UK
Sweden
Spain
Finlan
dIta
ly
impcomp 03
impcomp 95
Graph 3: Variation in export intensity: 1995-2003
0.00
0.10
0.20
0.30
0.40
0.50
0.60
Belgium
Nethe
rland
s
Denmark
Sweden
Finlan
dIta
lyUK
Spain
exp int 03
exp int 95
27
TABLE 1
Nace (revision 1.1) manufacturing sub-sections
DA Manufacture of food products, beverages and tobacco
15 Manufacture of food products and beverages 16 Manufacture of tobacco products
DB Manufacture of textiles and textile products
17 Manufacture of textiles 18 Manufacture of wearing apparel; dressing and dyeing of fur
DC 19 Manufacture of leather and leather products DD 20 Manufacture of wood and wood products
DE Manufacture of pulp, paper and paper products; publishing and printing 21 Manufacture of pulp, paper and paper products 22 Publishing, printing and reproduction of recorded media DF 23 Manufacture of coke, refined petroleum products and nuclear fuel DG 24 Manufacture of chemicals, chemical products and man-made fibres DH 25 Manufacture of rubber and plastic products DI 26 Manufacture of other non-metallic mineral products DJ Manufacture of basic metals and fabricated metal products
27 Manufacture of basic metals 28 Manufacture of fabricated metal products, except machinery and equipment
DK 29 Manufacture of machinery and equipment n.e.c. DL Manufacture of electrical and optical equipment
30 Manufacture of office machinery and computers 31 Manufacture of electrical machinery and apparatus n.e.c. 32 Manufacture of radio, television and communication equipment and apparatus 33 Manufacture of medical, precision and optical instruments, watches and clocks
DM Manufacture of transport equipment
34 Manufacture of motor vehicles, trailers and semi-trailers 35 Manufacture of other transport equipment
DN Manufacturing n.e.c.
36 Manufacture of furniture; manufacturing n.e.c. 37 Recycling
28
TABLE 2
Entry and Exit rates (country averages)
Country Entry rate Exit rate Entry rate Exit rate
Belgium 4.8% 5.7% 5.6% 7.0%Denmark 5.8% 6.2% 6.6% 7.0%Finland 5.1% 5.7% 5.7% 6.3%
Italy 5.7% 5.9% 6.1% 6.5%Netherlands 5.6% 6.3% 6.7% 7.3%
Spain 6.8% 6.1% 7.9% 7.0%Sweden 4.7% 4.8% 5.1% 5.2%
UK 8.3% 9.8% 9.5% 10.9%
Mean 5.8% 6.3% 6.7% 7.1%
Overall figures Small firms (<20 empl)
29
TABLE 3
Entry and Exit rates (yearly averages)
year Entry rate Exit rate Entry rate Exit rate
1997 6.2% 6.8%1998 6.9% 6.4% 7.9% 7.3%1999 6.0% 6.4% 7.0% 7.1%2000 5.8% 6.3% 6.7% 7.0%2001 5.8% 6.1% 6.6% 6.8%2002 5.5% 6.4% 6.3% 7.2%2003 5.4% 6.5% 6.1% 7.4%
Overall figures Small firms (<20 empl)
30
TABLE 4
Results from Exit regressions
Dep. var.: industry/country specific exit rate
(1) (2) (3) (4) (5)
Entry Rate (t-1) 0.2538*** 0.2505*** 0.2473*** 0.2497*** 0.2471***(0.046) (0.045) (0.045) (0.046) (0.048)
TFP Growth (t-1) 0.0292 0.028 0.0217 0.02 0.0228(0.025) (0.025) (0.025) (0.025) (0.029)
K/L Growth (t-1) -0.001 0.0025 -0.001 -0.0009 -0.0057(0.015) (0.016) (0.015) (0.015) (0.020)
Investment (t-1) 0.0028* 0.0027 0.0026* 0.0026* 0.0033(0.001) (0.002) (0.001) (0.001) (0.002)
∆ Openness (t-1) 0.0362*(0.021)
∆ Openness (t-2) -0.0185(0.022)
∆ Imp Comp (t-1) 0.0604* 0.0641* 0.0957**(0.036) (0.036) (0.045)
∆ Exp Intensity (t-1) 0.0235 0.0247 0.0166(0.025) (0.025) (0.030)
∆ IIT Index -0.0477** -0.0551**(0.020) (0.025)
∆ IIT Index * High -0.0579***(0.022)
∆ IIT Index * Low -0.0113(0.053)
Constant 0.0616*** 0.0615*** 0.0617*** 0.0613*** 0.0675***(0.007) (0.007) (0.007) (0.007) (0.009)
industry dummies yes yes yes yes yescountry dummies yes yes yes yes yes
year dummies yes yes yes yes yes
N. of obs. 331 331 331 331 302
R-sq 0.865 0.867 0.87 0.87 0.87
Robust standard errors in parentheses
* significant at 10%; ** significant at 5%; *** significant at 1%
31
TABLE 5
Results from Entry regressions
Dep. var.: industry/country specific entry rate
(1) (2) (3) (4) (5) (6)
Exit Rate (t-1) 0.1803*** 0.1879*** 0.1953*** 0.2149*** 0.2185*** 0.1883***(0.055) (0.054) (0.054) (0.052) (0.052) (0.054)
TFP Growth (t-1) -0.0288 -0.0288 -0.0238 -0.0092 -0.0107 -0.0072(0.022) (0.022) (0.022) (0.023) (0.023) (0.027)
K/L Growth (t-1) -0.0486*** -0.0468*** -0.0472*** -0.0449*** -0.0454*** -0.0475**(0.016) (0.016) (0.016) (0.016) (0.016) (0.020)
Investment (t-1) 0.0034** 0.0034** 0.0036** 0.0034** 0.0034** 0.0043**(0.002) (0.002) (0.002) (0.002) (0.002) (0.002)
∆ Openness (t-1) 0.006(0.018)
∆ Openness (t-2) -0.0441**(0.018)
∆ Imp Comp (t-2) -0.0335 0.1669 0.1529 0.145(0.041) (0.105) (0.106) (0.121)
∆ Exp Intensity (t-2) -0.0458** -0.0468** -0.0469** -0.0703**(0.023) (0.022) (0.022) (0.028)
∆ IIT Index (t-1) 0.0331** 0.0339** 0.0362**(0.015) (0.015) (0.017)
Exit (t-1) * ∆ Imp Comp (t-2) -0.0299** -0.0283** -0.0231*(0.014) (0.014) (0.013)
∆ IIT Index (t-1) * High 0.0442***(0.017)
∆ IIT Index (t-1) * Low -0.0069(0.029)
Constant 0.0337*** 0.0347*** 0.0346*** 0.0318*** 0.0316*** 0.0665***(0.008) (0.008) (0.008) (0.008) (0.008) (0.009)
industry dummies yes yes yes yes yes yescountry dummies yes yes yes yes yes yes
year dummies yes yes yes yes yes yes
N. of obs. 434 434 434 434 434 387
R-sq 0.707 0.711 0.714 0.717 0.72 0.72
Robust standard errors in parentheses
* significant at 10%; ** significant at 5%; *** significant at 1%