Embed Size (px)
Citation preview

Entrepreneurship, Gender and Job Creation European dynamics
Marc Cowling Principal Economist Institute for Employment Studies Mantell Building University of Sussex Campus Brighton BN1 9RF UK
Abstract
Since the seminal Birch job creation study (1979) policy-makers across the world have been keen to promote entrepreneurship as a mechanism for creating new employment opportunities. In parallel with this political desire, researchers have sought to isolate what types of people become entrepreneurs and what types of entrepreneurs create the most jobs. At the basic level, we observe that men constitute the majority of the total entrepreneurial stock. But our research finds that (a) much of the observed differential is easily accounted for by differences in sector and occupational characteristics of men and women, and (b) the true gender difference is diminishing rapidly over time. But it still remains the case that male entrepreneurs have a 9.5 per cent higher probability of creating jobs. However, in certain countries, notably Germany and Denmark, female entrepreneurs have an impressive record of job creation.
October 2008 ISBN: 9 781 85184 404 3 IES Working Paper: WP18
2 Entrepreneurship, Gender and Job Creation
1. Introduction
Since the seminal Birch (1979) job generation study researchers have become interested in quantifying the numbers of jobs created by smaller firms and the nature of entrepreneurs who create these jobs. Early empirical papers focused explicitly on relative shares of net new jobs (see for example, Davis et al, 1996; Davidsson et al, 1998), whilst others (Westhead and Cowling, 1995) focused on the relative impact of new technology based versus more conventional small firms. A related strand of research focused explicitly on identifying the characteristics that differentiated job creating entrepreneurs from lifestyle orientated businesses (Carroll et al, 1996; Cowling et al, 2004; Burke et al, 2001).
In parallel with this body of job generation work, researchers have become increasingly interested in two potentially related issues; that of gender differences in the propensity to become an entrepreneur, and; potential gender impacts on business performance (see Kalleberg and Leicht, 1991, for an early seminal work). On the former the evidence is fairly consistent across countries and time and broadly finds that males have a higher basic propensity to start their own business. Yet even this has been shown not to hold across all countries (Cowling, 2000; 2003), with Finland identified as a notable exception in terms of having a higher propensity for females to become entrepreneurs holding other key demographic factors constant. Marlow et al. (2008) also point out the important influences of history and culture in determining the relative prevalence of female entrepreneurship across countries. On the latter, we find contrasting evidence. For example, Cowling and Bygrave (2007) find that differences in institutional arrangements and welfare systems have little impact on entrepreneurship rates across countries. Evidence on female under‐performance is provided by Brusch (1992), Cowling and Taylor (2001), Watson and Robinson (2003) and Rosa et al. (1996). Du Rietz and Henrekson (2000) find evidence to the contrary.
So what does previous research tell us about observed differences between male and female entrepreneurs and the reasons for any observed female under‐performance? Early work tended to focus on discrimination. Coate and Tennyson (1992), for example, argued that general labour market discrimination can spill over into markets relevant to entrepreneurs. Yet others (Moore, 1983; Sowell, 1981) argue that this labour market discrimination in the formal waged sector is precisely why females move into entrepreneurship. Research has also focused explicitly on the effect of family roles and time allocation between home and market production (Dolton and Makepeace, 1987), and argued that women, in particular, with child care responsibilities actively seek out employment that complements these roles. On the entrepreneurial propensity of women, Langowitz and Minniti (2007) argue that subjective perceptual variables have a crucial influence on women, as they perceive themselves and the environment in a less favourable light. This is supported by
Institute for Employment Studies 3
Wagner (2007), in a German study, who shows that fear of failure deters women from pursuing an entrepreneurial career. In contrast, Verheul et al. (2006), in a multi‐country study, find that, for the most part, female and male entrepreneurs are influenced by the same factors. However, Jennings and McDougald (2007) find that work‐family interface experiences can explain much of the persistence in under‐performance by male and female run businesses. Morris et al. (2006) also contend that the growth choice for female entrepreneurs is a much more serious and deliberate decision and is associated with women who value wealth more highly. But Watson and Robinson (2003) argue that lower growth amongst female businesses simply reflects an unwillingness to tolerate high risk in the form of income and profit variability. Finally, Parker (2008), explores a relatively new avenue of investigation by considering how household relationships impact on the propensity of women to run their own businesses. Interestingly, using US data, he finds that knowledge transfer between husbands and wives increases the probability that the spouse will also become an entrepreneur.
Thus the evidence to date broadly shows that entrepreneurs are important agents in the process of job creation, and that there are many potential explanations for women to be less likely to (a) enter entrepreneurial activity, and (b) under‐perform relative to men.
In the remainder of this paper we econometrically explore five questions:
■ Are men more likely to become entrepreneurs than women?
■ Are male and female entrepreneurs different?
■ Are male entrepreneurs more likely to create jobs than women?
■ Are male and female job creating entrepreneurs different?
And in addition:
■ Do the answers to all these questions depend on what country you live in?
4 Entrepreneurship, Gender and Job Creation
2. The Data and Methodology
The data we use to investigate these research questions are derived from 3 EU wide surveys of the working populations (waged + self‐employed) across each member state. For consistency across the three surveys we focus on the core EU‐15 countries and exclude the accession states. The surveys were carried out in 1995, 2000 and 2005, and involved face‐to‐face interviews with working adults. The minimum requirement for each country survey was 1,000 working adults, with the exception of Luxembourg which has a very small population. We have data, for each individual on:
■ Personal demographics (age, gender, marital status, presence of children, country of residence etc.)
■ Job characteristics (occupational classification, sector of employment, legal status of employment etc.)
Each country level survey is weighted to ensure that it is representative of the working population within each country and at the relevant point in time. We also choose to focus the bulk of our econometric investigation on the 2000 data set as it contains larger samples for the relevant countries, and also more detailed demographic data. It also reduced the volume of data generated and to be discussed. But for comparative purposes, and to explore how gender effects play out over time, we also estimate similar sets of equations using the 1995 and 2005 data sets but suppress the reporting of other findings unrelated to gender.
In terms of our methodological approach, we initially present the basic descriptive statistics of interest, namely entrepreneurial propensity and type by gender and country. We then proceed to estimate a series of probit models for each research question of interest. This reflects the binary nature of our responses to our key variables (eg are you working in the waged or self‐employed sector? Are you are job creating entrepreneur?). In each case we estimate a full model with gender included as an explanatory variable in the right‐hand‐side of our equation, and then estimate separate equations for men and women. The basic models can be written thus:
Pr (Y) = f (gender, age, marital status, children, occupation, sector, country)
For ease of interpretation, we report the marginal effects. This allows us to say, for example, that women are 3.1 per cent less likely to be self‐employed than waged employed, holding other factors constant.
Institute for Employment Studies 5
3. Basic Country Differences in Entrepreneurial Propensity
Here we present the base data which simply describes the proportions of men and women in each of our fifteen EU countries are (a) engaged in entrepreneurial activity, and (b) are job creating.
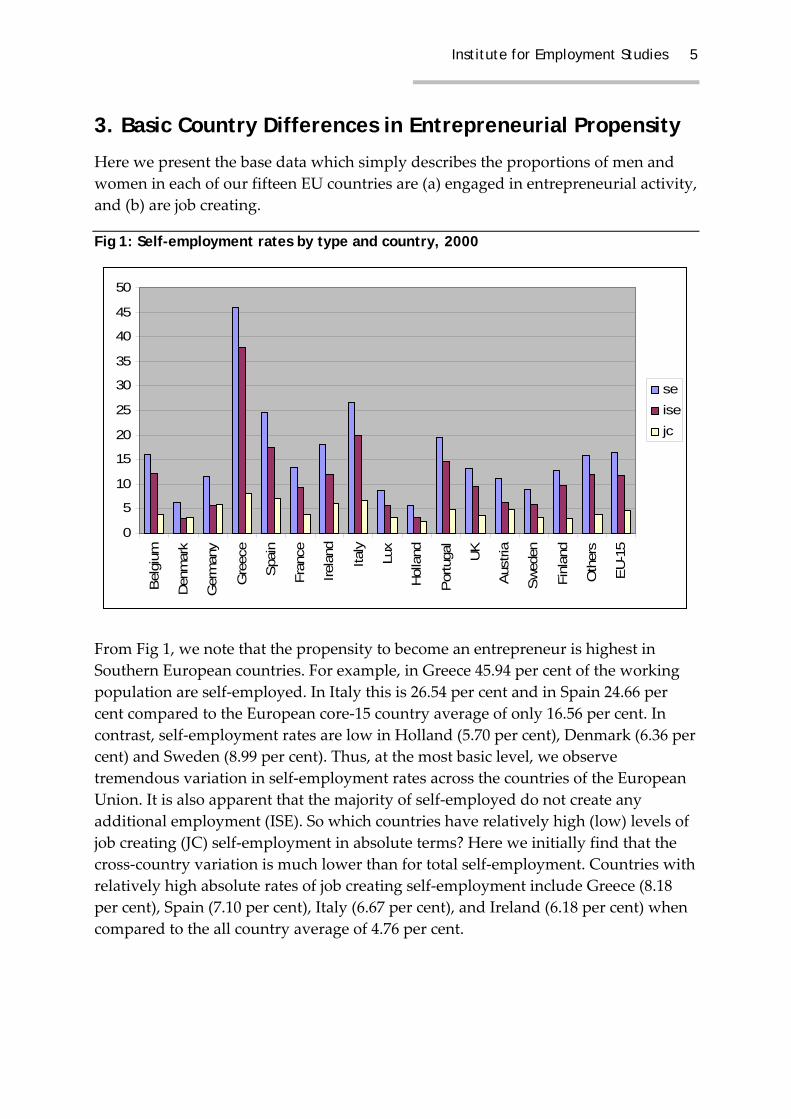
Fig 1: Self-employment rates by type and country, 2000
0
5
10
15
20
25
30
35
40
45
50
Bel
gium
Den
mar
k
Ger
man
y
Gre
ece
Spa
in
Fran
ce
Irela
nd
Italy
Lux
Hol
land
Por
tuga
l
UK
Aus
tria
Sw
eden
Finl
and
Oth
ers
EU
-15
seisejc
From Fig 1, we note that the propensity to become an entrepreneur is highest in Southern European countries. For example, in Greece 45.94 per cent of the working population are self‐employed. In Italy this is 26.54 per cent and in Spain 24.66 per cent compared to the European core‐15 country average of only 16.56 per cent. In contrast, self‐employment rates are low in Holland (5.70 per cent), Denmark (6.36 per cent) and Sweden (8.99 per cent). Thus, at the most basic level, we observe tremendous variation in self‐employment rates across the countries of the European Union. It is also apparent that the majority of self‐employed do not create any additional employment (ISE). So which countries have relatively high (low) levels of job creating (JC) self‐employment in absolute terms? Here we initially find that the cross‐country variation is much lower than for total self‐employment. Countries with relatively high absolute rates of job creating self‐employment include Greece (8.18 per cent), Spain (7.10 per cent), Italy (6.67 per cent), and Ireland (6.18 per cent) when compared to the all country average of 4.76 per cent.
6 Entrepreneurship, Gender and Job Creation
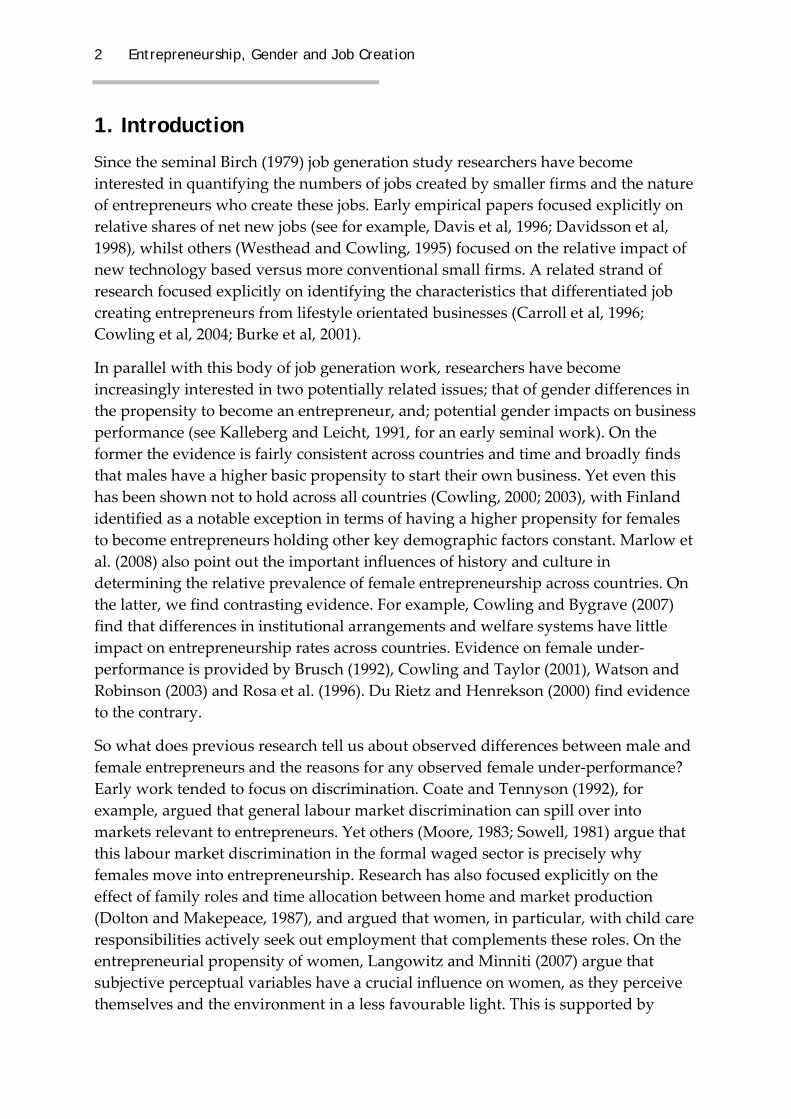
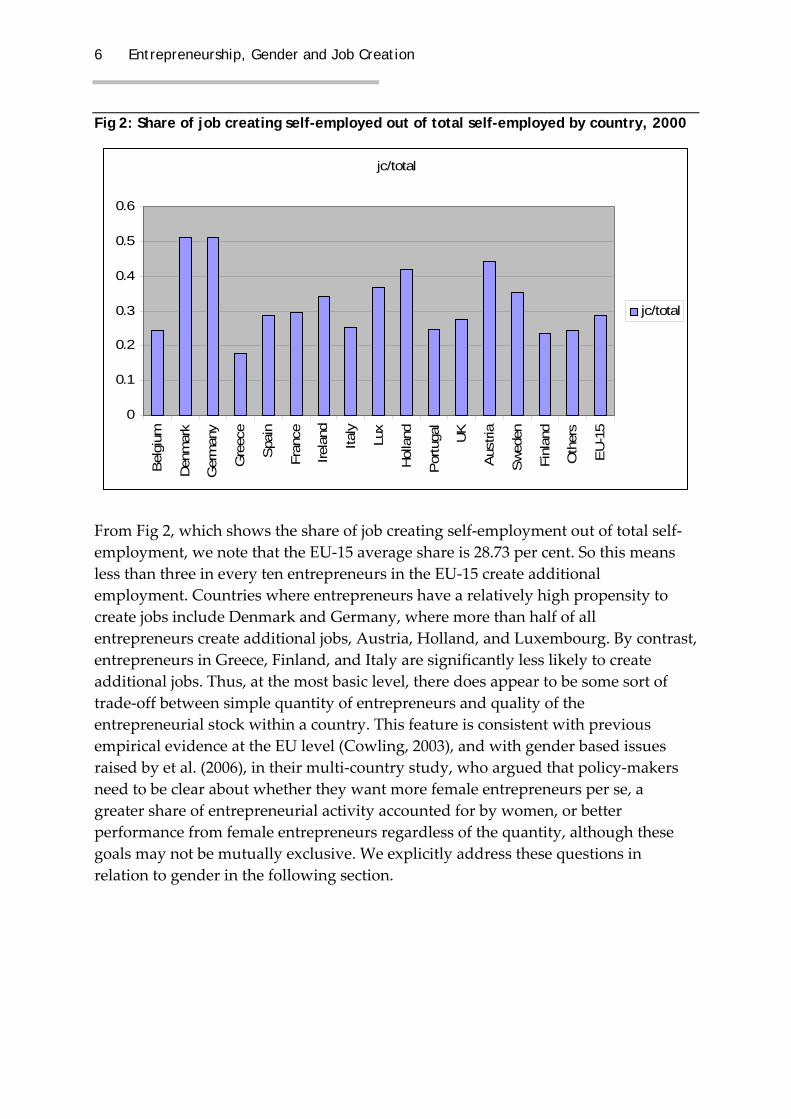
Fig 2: Share of job creating self-employed out of total self-employed by country, 2000
jc/total
0
0.1
0.2
0.3
0.4
0.5
0.6
Bel
gium
Den
mar
k
Ger
man
y
Gre
ece
Spa
in
Fran
ce
Irela
nd
Italy
Lux
Hol
land
Por
tuga
l
UK
Aus
tria
Sw
eden
Finl
and
Oth
ers
EU
-15
jc/total
From Fig 2, which shows the share of job creating self‐employment out of total self‐employment, we note that the EU‐15 average share is 28.73 per cent. So this means less than three in every ten entrepreneurs in the EU‐15 create additional employment. Countries where entrepreneurs have a relatively high propensity to create jobs include Denmark and Germany, where more than half of all entrepreneurs create additional jobs, Austria, Holland, and Luxembourg. By contrast, entrepreneurs in Greece, Finland, and Italy are significantly less likely to create additional jobs. Thus, at the most basic level, there does appear to be some sort of trade‐off between simple quantity of entrepreneurs and quality of the entrepreneurial stock within a country. This feature is consistent with previous empirical evidence at the EU level (Cowling, 2003), and with gender based issues raised by et al. (2006), in their multi‐country study, who argued that policy‐makers need to be clear about whether they want more female entrepreneurs per se, a greater share of entrepreneurial activity accounted for by women, or better performance from female entrepreneurs regardless of the quantity, although these goals may not be mutually exclusive. We explicitly address these questions in relation to gender in the following section.
Institute for Employment Studies 7
4. Basic Gender Differences in Entrepreneurial Propensity
Here we present the similar data as above, but separate our data by gender, and present our discussion as a within and across gender comparisons.
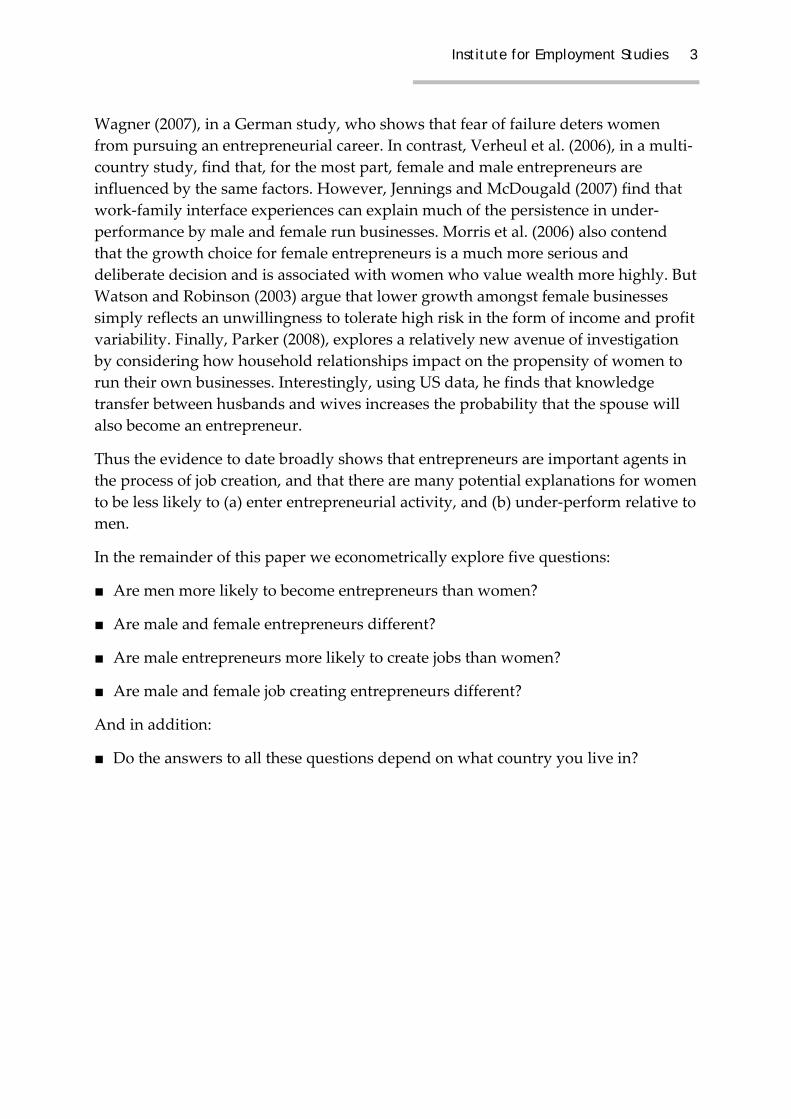
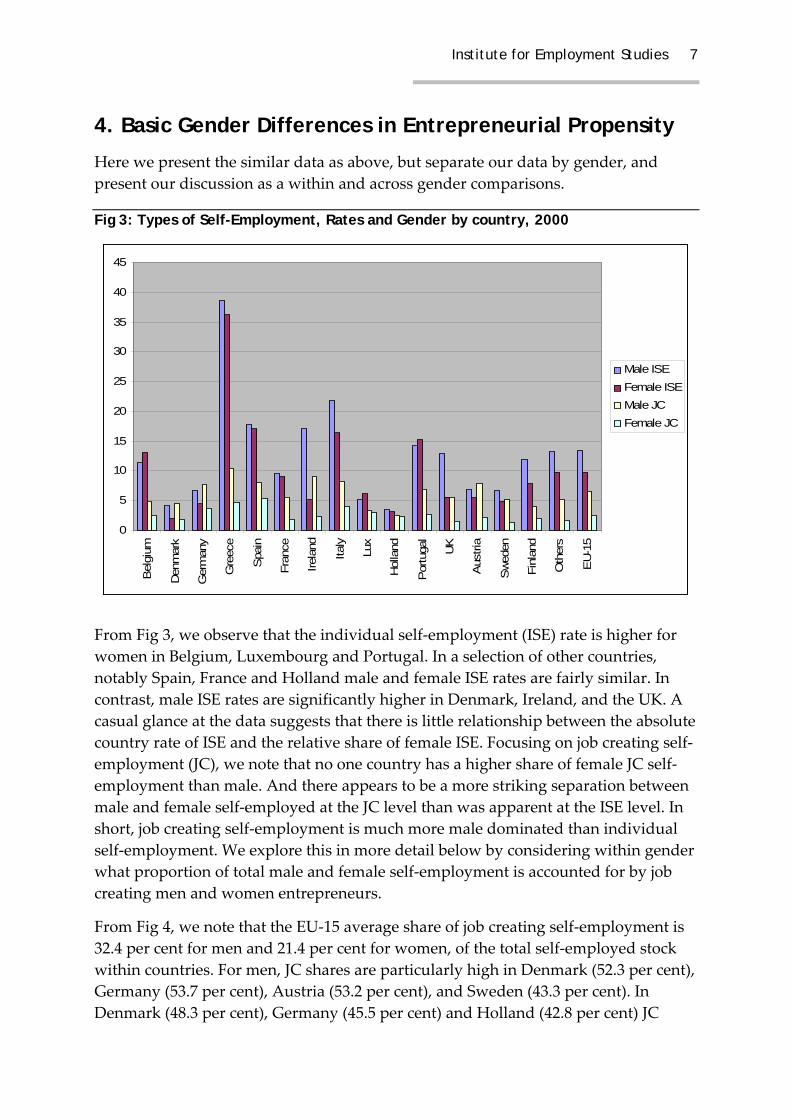
Fig 3: Types of Self-Employment, Rates and Gender by country, 2000
0
5
10
15
20
25
30
35
40
45
Bel
gium
Den
mar
k
Ger
man
y
Gre
ece
Spa
in
Fran
ce
Irela
nd
Italy
Lux
Hol
land
Por
tuga
l
UK
Aus
tria
Sw
eden
Finl
and
Oth
ers
EU
-15
Male ISEFemale ISEMale JCFemale JC
From Fig 3, we observe that the individual self‐employment (ISE) rate is higher for women in Belgium, Luxembourg and Portugal. In a selection of other countries, notably Spain, France and Holland male and female ISE rates are fairly similar. In contrast, male ISE rates are significantly higher in Denmark, Ireland, and the UK. A casual glance at the data suggests that there is little relationship between the absolute country rate of ISE and the relative share of female ISE. Focusing on job creating self‐employment (JC), we note that no one country has a higher share of female JC self‐employment than male. And there appears to be a more striking separation between male and female self‐employed at the JC level than was apparent at the ISE level. In short, job creating self‐employment is much more male dominated than individual self‐employment. We explore this in more detail below by considering within gender what proportion of total male and female self‐employment is accounted for by job creating men and women entrepreneurs.
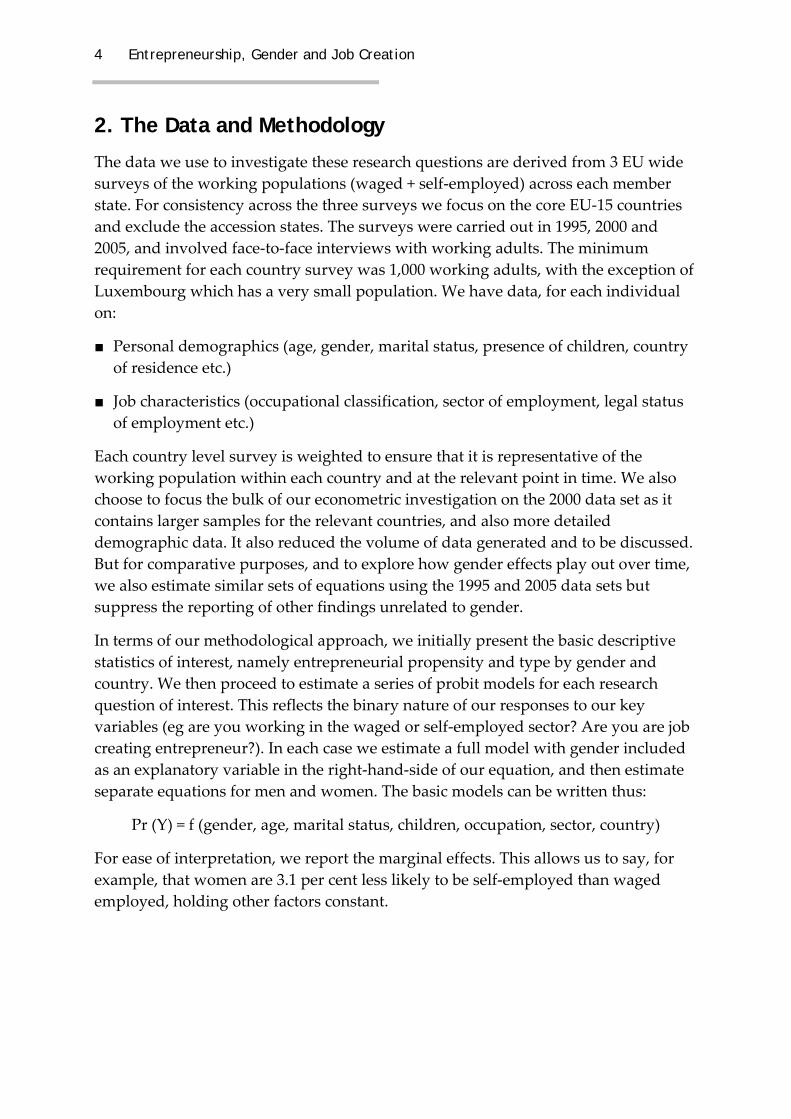
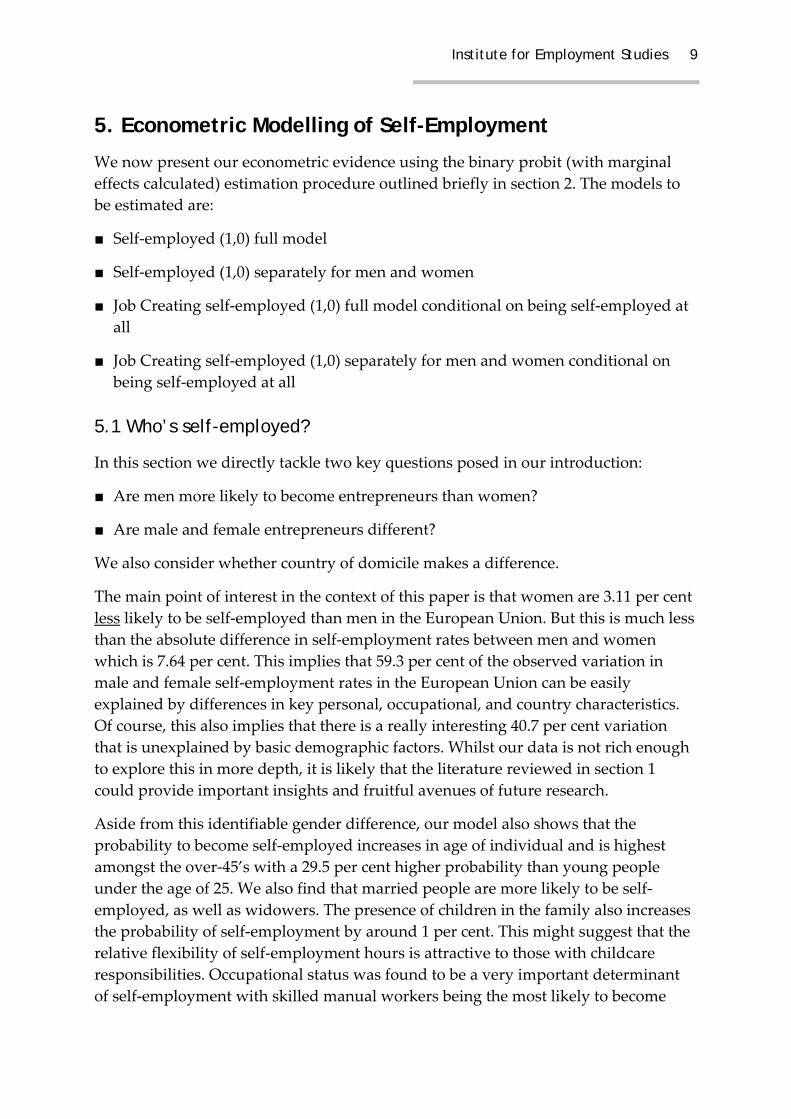
From Fig 4, we note that the EU‐15 average share of job creating self‐employment is 32.4 per cent for men and 21.4 per cent for women, of the total self‐employed stock within countries. For men, JC shares are particularly high in Denmark (52.3 per cent), Germany (53.7 per cent), Austria (53.2 per cent), and Sweden (43.3 per cent). In Denmark (48.3 per cent), Germany (45.5 per cent) and Holland (42.8 per cent) JC

8 Entrepreneurship, Gender and Job Creation
shares are also very high for women entrepreneurs. The disparity in job creating potential across EU countries appears large when we consider that only 21.1 per cent of Greek male entrepreneurs, 25.2 per cent of Finnish male entrepreneurs, 11.7 per cent of Greek female entrepreneurs, and 15.0 per cent of Portuguese female entrepreneurs create jobs. What is clear so far is that simply having lots of entrepreneurs in the labour force does not easily translate into additional job creation. In short, there appears to be a trade‐off between quantity and quality of the entrepreneurial stock in a country.
Fig 4: Gender shares of job creating self-employment by country, 2000
0
0.1
0.2
0.3
0.4
0.5
0.6
Bel
gium
Den
mar
k
Ger
man
y
Gre
ece
Spa
in
Fran
ce
Irela
nd
Italy
Lux
Hol
land
Por
tuga
l
UK
Aus
tria
Sw
eden
Finl
and
Oth
ers
EU
-15
Male JC/totalFemale JC/total
To recap on what we have uncovered so far:
■ The basic propensity to become an entrepreneur is highest in Southern Europe.
■ There is tremendous cross‐country variation in self‐employment rates.
■ Only a minority of the self‐employed create jobs.
■ Differences between male and female self‐employment rates are more marked at the job creating level than for individual self‐employed.
■ Female entrepreneurs in Denmark and Germany have the highest job creating capacity, and this is superior to male entrepreneurs in most countries.
Institute for Employment Studies 9
5. Econometric Modelling of Self-Employment
We now present our econometric evidence using the binary probit (with marginal effects calculated) estimation procedure outlined briefly in section 2. The models to be estimated are:
■ Self‐employed (1,0) full model
■ Self‐employed (1,0) separately for men and women
■ Job Creating self‐employed (1,0) full model conditional on being self‐employed at all
■ Job Creating self‐employed (1,0) separately for men and women conditional on being self‐employed at all
5.1 Who’s self-employed?
In this section we directly tackle two key questions posed in our introduction:
■ Are men more likely to become entrepreneurs than women?
■ Are male and female entrepreneurs different?
We also consider whether country of domicile makes a difference.
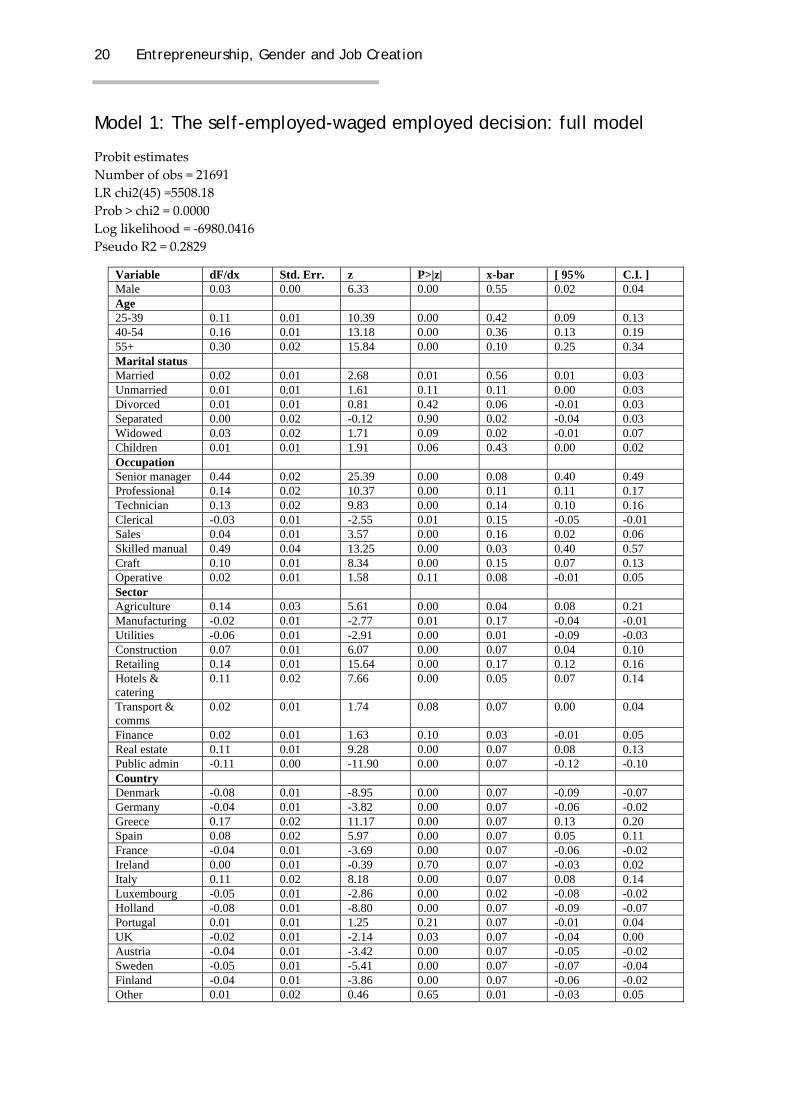
The main point of interest in the context of this paper is that women are 3.11 per cent less likely to be self‐employed than men in the European Union. But this is much less than the absolute difference in self‐employment rates between men and women which is 7.64 per cent. This implies that 59.3 per cent of the observed variation in male and female self‐employment rates in the European Union can be easily explained by differences in key personal, occupational, and country characteristics. Of course, this also implies that there is a really interesting 40.7 per cent variation that is unexplained by basic demographic factors. Whilst our data is not rich enough to explore this in more depth, it is likely that the literature reviewed in section 1 could provide important insights and fruitful avenues of future research.
Aside from this identifiable gender difference, our model also shows that the probability to become self‐employed increases in age of individual and is highest amongst the over‐45’s with a 29.5 per cent higher probability than young people under the age of 25. We also find that married people are more likely to be self‐employed, as well as widowers. The presence of children in the family also increases the probability of self‐employment by around 1 per cent. This might suggest that the relative flexibility of self‐employment hours is attractive to those with childcare responsibilities. Occupational status was found to be a very important determinant of self‐employment with skilled manual workers being the most likely to become
10 Entrepreneurship, Gender and Job Creation
self‐employed and clerical workers the least likely. Sector was also found to have an effect on self‐employment, although its influence was generally not as strong as occupation or age. Sectors with a higher probability of self‐employment include agriculture and retailing whilst energy and manufacturing had comparatively low self‐employment probabilities. These findings are fairly consistent with differences in scale economies and barriers to entry across sectors with the latter sectors having high start‐up costs and requiring large scale production to become efficient. At the country level, we find that Greece, Italy and Spain all had much higher self‐employment probabilities, although the differences here were much smaller than the raw differences. Countries with low probabilities of self‐employment include Denmark and Holland.
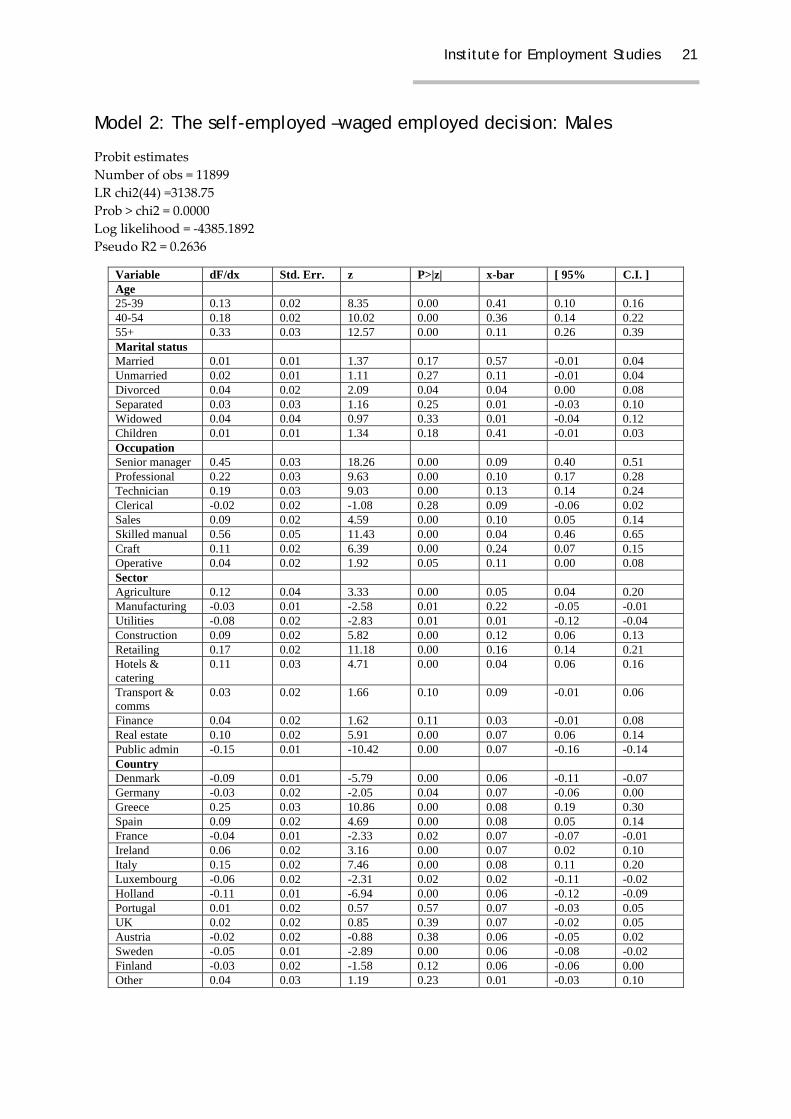
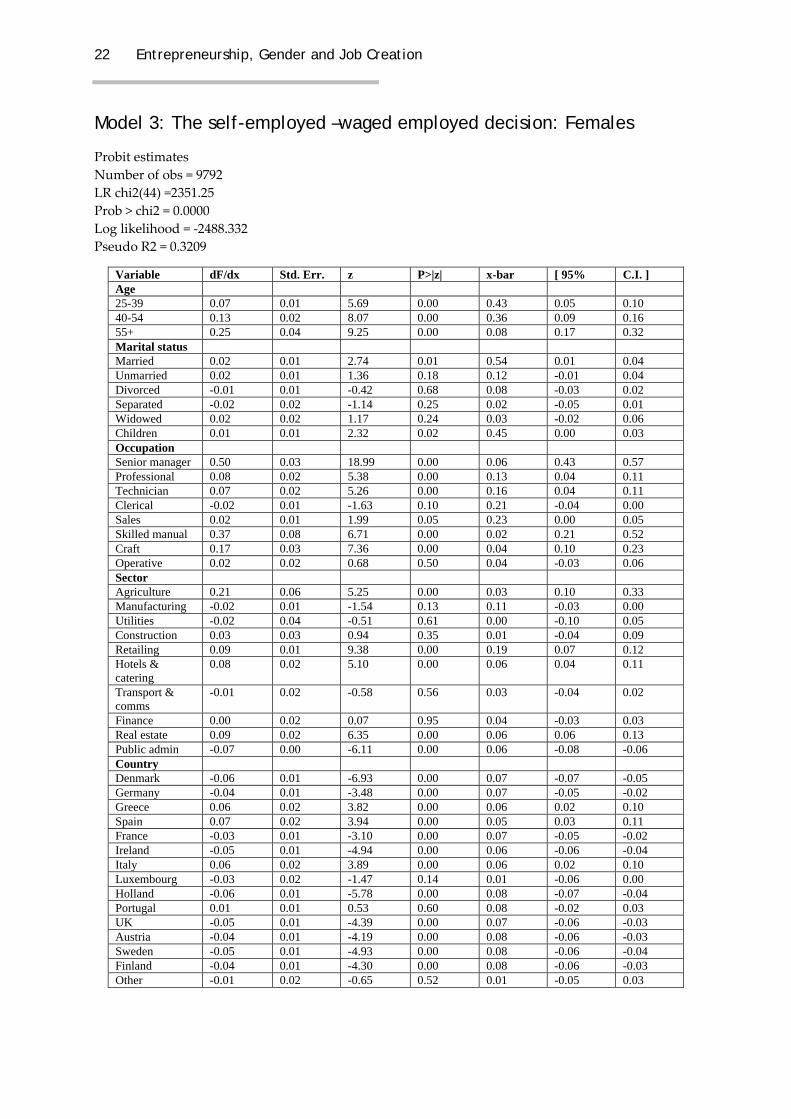
Having looked initially at general differences in terms of who becomes self‐employed, we now focus our attention on which types of men and women become self‐employed by estimating separate models for men and women. This will help us answer the question of whether male and female entrepreneurs are fundamentally different. The first point of interest is that the positive age effect on the propensity to become self‐employed is much stronger for men than women. Turning this around, age is less important in the determination of self‐employment for women, although it still matters. On marital status we find some key differences between male and females. For men, we find that divorce increases the probability of self‐employment by 4.1 per cent. For women, we find that being married increases the probability of self‐employment by 2.3 per cent. Whilst we do not explicitly observe the timing of these events, our evidence might suggest different motivations for self‐employment. It was also found to be the case that the presence of children increases the probability of self‐employment for women by 1.4 per cent, but had no effect on men. Again this is suggestive of different motivations for self‐employment between men and women.
On occupation we generally find that the same occupations are more (less) associated with self‐employment for men and women. However, the strength of these effects is quite different. For example, professional males have a 22.1 per cent higher probability of self‐employment compared to only 7.8 per cent for women. Further, male skilled manual workers have a 55.6 per cent higher probability of self‐employment whilst for female skilled manual workers this was only 36.6 per cent. Thus we might conclude that occupation is a key determinant of self‐employment and that it is more important for men than women. In terms of sector effects, we find that there is much more variation in self‐employment probabilities for men than women. For women we find that agriculture was associated with a 21.5 per cent increase in the probability of self‐employment compared to only an 11.6 per cent difference for men. We also observe that female self‐employment is concentrated in retailing, hotels and catering sectors, albeit to a lesser degree than was the case for men.

Institute for Employment Studies 11
Finally, we note that there are significant country differences in the propensity for self‐employment. But the cross‐country variation is significantly lower (with a maximum difference of only 6.6 per cent) for women than men. A comparison would be for Greek males who had a 24.8 per cent higher probability of self‐employment. Taking all this gender evidence together we might suggest that similar characteristics influence the male and female probability of self‐employment, but the strength of these effects are typically larger for men with the notable exceptions of having young children and being married which impact on the female decision but not the male decision. In a more econometric sense, it is easier to explain which women will become self‐employed on the basis of core personal and job demographics than it is for men.
Thus far we have presented econometric models of the general labour market status decision and the male and female decision separately. To answer our two research questions:
■ Are men more likely to become entrepreneurs than women? Yes, men are more likely to become entrepreneurs than women. But much of this observed difference can be easily explained by occupational differences and other basic characteristics. The true difference in propensities is only 3.1 per cent.
■ Are male and female entrepreneurs different? Not as different as some commentators have implied. Although the presence of young children is a key defining characteristic for women.
■ Do the answers to all these questions depend on what country you live in? Yes, countries with a high propensity to self‐employment include Greece and Italy and those with a low propensity include Denmark and Holland. And country effects are greater for men than women.
5.2 Which entrepreneurs create jobs?
Here we focus solely on the self‐employed and provide evidence relating to a further two questions posed in our introduction:
■ Are male entrepreneurs more likely to create jobs than women?
■ Are male and female job creating entrepreneurs different?
We also consider whether country of domicile makes a difference.
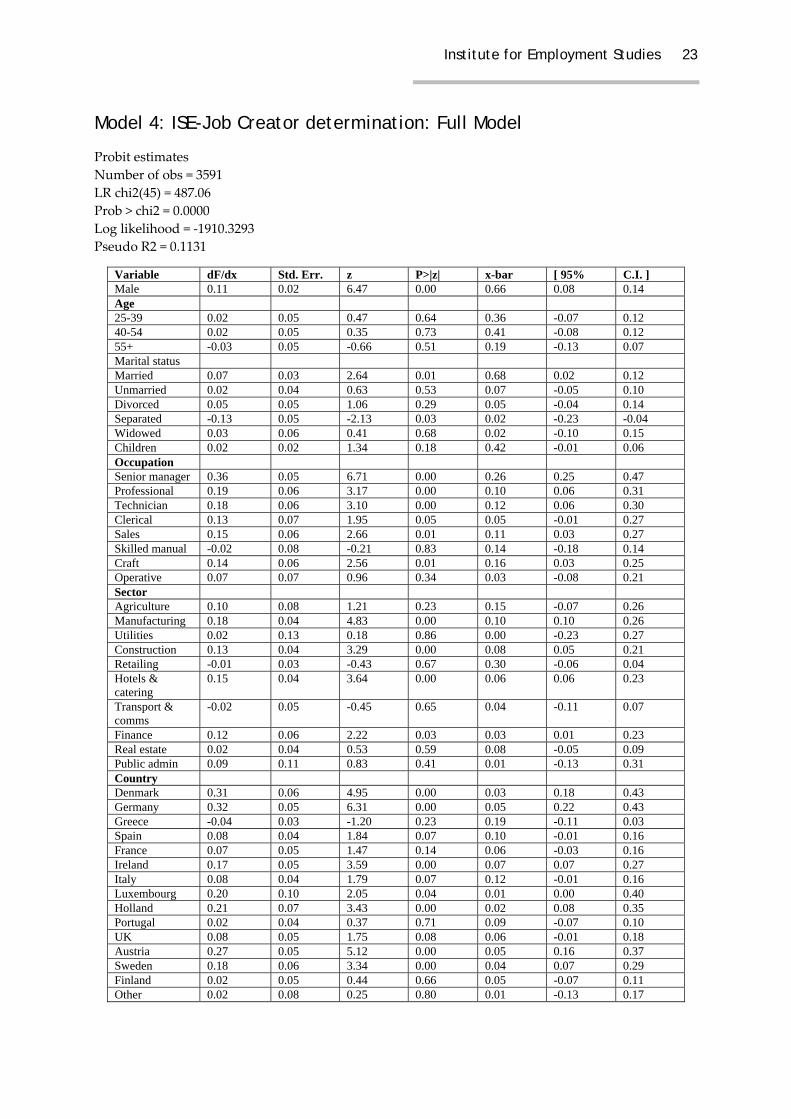
In response to the first question as to whether or not male entrepreneurs are more likely to be job creators (JC), we find that this is indeed the case. Our model shows that male entrepreneurs have an 11.1 per cent higher probability of being a job creator. This is much larger than the raw absolute difference which is 3.8 per cent, but equivalent to the difference in raw shares of JC out of total self‐employment. This
12 Entrepreneurship, Gender and Job Creation
implies that virtually all of the observed difference in probabilities of being a job creating entrepreneur are easily explained by core personal and job characteristics, and differences in these between men and women entrepreneurs.
In a more general sense we observe that age is no barrier to job creating self‐employment. But we also find that married people are 6.9 per cent more likely to be job creators, whereas individuals who have undergone a marital separation are 13.3 per cent less likely to be JCs. Here again we also find occupation matters with senior management staff, professionals, technicians and sales staff having particularly high probabilities of being job creators. At the sector level, we note that manufacturing, hotels & catering, construction and financial services all have higher probabilities of job creating self‐employment. Interestingly we find in this case that the relative contributions of sector and occupation are much closer than was the case for total self‐employment where occupational effects dominated sector effects. At the country level we also observe tremendous variation. Countries with very much higher probabilities of JC self‐employment include, Denmark (+30.6 per cent), Austria (+26.6 per cent), Germany (+32.3 per cent), and Holland (+21.4 per cent).
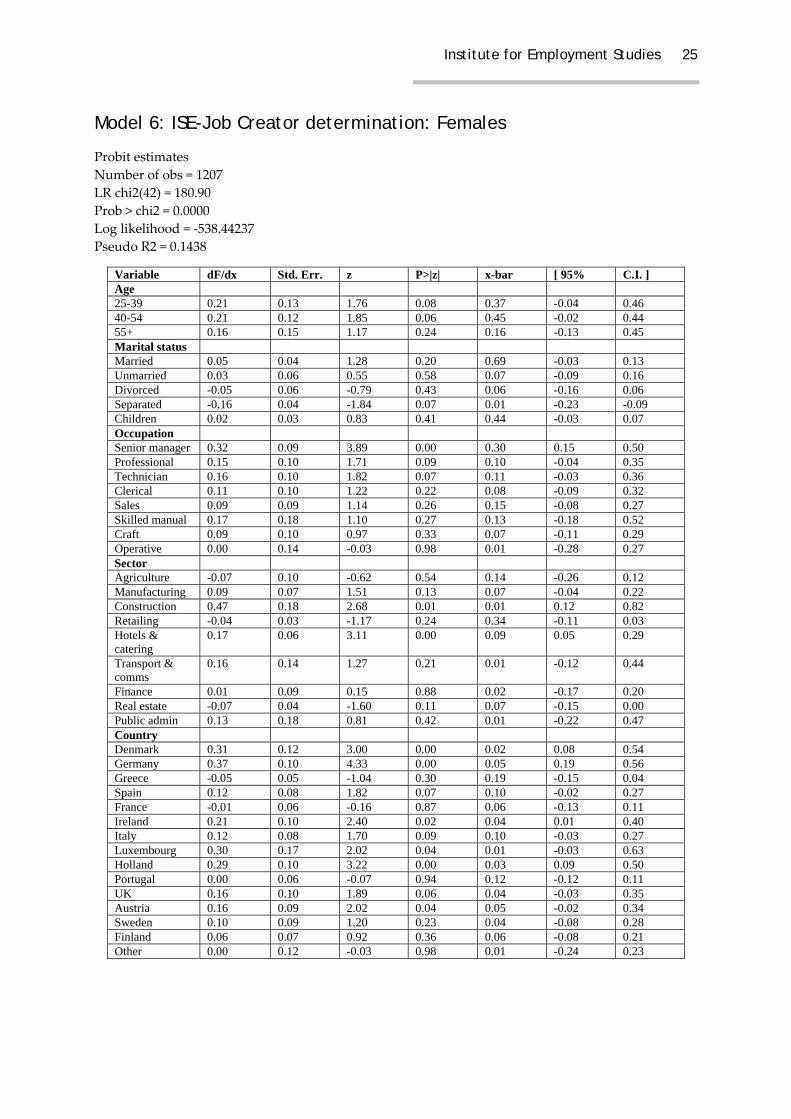
As to potential differences between male and female job creators (JCs) compared to their respective ISE counterparts, we note firstly that male JCs are equally likely to be found across all age groups. For women, our evidence shows that the 25‐54 years age range is when the probability of being a JC is highest. Again we observe that marital status is important, but acts in different ways for males and females. For males, we note that married men have a 7.1 per cent higher probability of being a JC, and divorced men a 11.7 per cent higher probability. For females we find that marital separation gives them a 16.2 per cent lower probability of being a JC.
On occupation, we find that the three occupations with the highest probability of being JCs in are senior managers, professionals and technicians. But the strength of these effects in larger for men than women. Further, additional occupations such as skilled manual and craft related also increase the JC probability for men but not women. The same was true for sectors, with men and women in construction and hotels & catering both being more likely to be JCs, although here the female effect was more than three times as strong for women than men. But again we find that more sectors differentiated between male ISEs and JCs than was the case for women, including financial services and real estate.
On country effects, we also observe substantial gender differences. For men we find that JC probabilities are particularly high in Denmark (+30.5 per cent), Germany (+30.3 per cent), and Austria (+31.4 per cent), and high in France, Ireland, Holland and Sweden. For women we note that JC probabilities are also highest in Germany and Denmark at +37.3 per cent and +31.0 per cent respectively, and higher than was the case for their male peers. Other countries with high JC probabilities for women entrepreneurs include Luxembourg (+29.8 per cent), Holland (+29.3 per cent), and
Institute for Employment Studies 13
Ireland (+20.5 per cent). Thus country level effects are very large for men and women in terms of the determination of job creating self‐employment, and, importantly, are generally more important for women entrepreneurs than their male counterparts.
Thus far we have presented a general econometric model of the probability, once becoming self‐employed, of being a job creator. We then estimated this equation separately for male and female self‐employed. To answer our third, fourth, and fifth research questions:
■ Are men more likely to become job creating entrepreneurs than women? Yes, men are much more likely to become entrepreneurs than women.
■ Are male and female job creating entrepreneurs different? Yes and the differences are more widely affected by occupation and sector for men.
■ Do the answers to all these questions depend on what country you live in? Yes, countries with a high propensity to job creating self‐employment include Denmark, Germany, Holland, and Austria. And on this, we find that country effects are greater for women than men.
5.3 Can we shed more light on the unexplained part of the differences in the propensity of men and women to enter self-employment and create jobs?
In our estimated models to date, of the self‐employment probability, and the job creating probability of the self‐employed, we chose to focus on a core set of basic personal and job characteristics and allowed for variations across countries. Our core results suggest that much of the absolute difference in self‐employment can be easily explained by differences in the types of occupations and sectors that men and women enter into and have work experience in. Thus we might conclude at this stage that as women increasingly enter into sectors and jobs that they might traditionally have had low representation in, then the observed gender gap in self‐employment might naturally diminish over time. But we also found that things like the presence of children and marital status tended to be more influential on the female labour market decision, suggesting that socio‐economic variables and time‐allocation might be the key to understanding more about the female labour market decision. And this is supported by some of the literature discussed in the introduction.
So how can we explore these issues further to enhance our understanding of what is driving the self‐employment decision for women? The survey contains an interesting array of time‐allocation variables including involvement in activities such as voluntary activity, political activity, childcare, household duties, elder care, education, and cultural activities. All have the potential to shed more light on time‐allocation decisions. The econometric method we adopt is to save the residuals (the

14 Entrepreneurship, Gender and Job Creation
unexplained variation) from our base models and then estimate new models with our time‐allocation variables as explanatory variables on the right‐hand‐side.
From our residual estimation, we initially find that women who undertake work in the voluntary sector are less likely to choose self‐employment over waged employment. The same is true for women involved in training or further education. But we do observe that women with childcare or eldercare responsibilities have a higher propensity to become self‐employed than accept waged employment. This is fairly strong evidence that flexibility in employment patterns, particularly time‐allocation is important in the female decision to choose self‐employment rather than waged employment.
In terms of job creating self‐employment, we note that our key time‐allocation variables, childcare and eldercare, both act in a positive way on the probability of being a job creating entrepreneur. And, importantly, these effects are four times stronger in the determination of being a job creator, as opposed to a single self‐employed, than simply choosing self‐employment over waged employment. Taken together, these two findings might suggest that women who choose self‐employment over a waged job appreciate the time flexibility that this form of working gives them, but also have a desire to build their businesses at the same time and make a success of them. These findings are consistent with Dolton and Makepeace (1987) who argue that self‐employment can complement childcare responsibilities, with Jennings and McDougald (2007), who stress the importance of the work‐family interface, and Morris et al. (2006), who suggest that because the growth decision has more serious implications for women, only those women that choose self‐employment as a positive career decision are orientated towards growing their businesses. In this sense, choosing self‐employment is a positive decision to balance work and family commitments.
5.4 Has the propensity of men and women to enter self-employment and create jobs changed over time?
In this final section before we draw together our findings and summarise our results, we present our evidence covering the three survey periods from 1995, 2000, and 2005. Fig 5 below shows the estimated ‘true’ differences in the probabilities of women and men becoming (a) self‐employed, and (b) job creating self‐employed once they have entered self‐employment.

Institute for Employment Studies 15
Fig 5: Changes over time in the relative male-female propensity to become self-employed and create jobs
0
2
4
6
8
10
12
14
16
1995 2000 2005
SEJC
From Fig 5 the evidence is striking. In 1995, the probability of a male being a self‐employed job creator was 14.85 per cent higher for men than women. By 2000, this differential had fallen to 11.1 per cent, and by 2005 had fallen again to only 9.51 per cent. Over just a decade, this narrowing of the ‘true’ gender differential is a remarkable labour market dynamic. And a similar pattern was also found for self‐employment per se. Here we find that in 1995, males were 3.37 per cent more likely to become self‐employed. By 2000, this ‘gap’ had fallen to only 3.11 per cent, and by 2005 the ‘gap’ had narrowed again to only 1.53 per cent. If this latter dynamic, in particular, continued over the next decade, we might expect that the ‘true’ gender gap might all but disappear.

16 Entrepreneurship, Gender and Job Creation
6. Summary
We have used EU data to explore five basic questions relating to gender differences in the propensity to become self‐employed, and once self‐employed to create additional jobs. Firstly, we presented the raw data and found that gender differences in both cases were large, with men being significantly more likely to choose self‐employment over waged employment, and to be job creating self‐employed. But on further, econometric investigation we found that the basic reason for the observed difference in self employment rates between men and women were easily explained by differences in the nature of jobs they enter and the sectors they work in. This means that the ‘true’ difference was substantially smaller than the raw difference. In terms of job creating self‐employment, again there is a gender gap, and this is virtually all explained by occupational choice, sector of employment and country level effects. So we might easily conclude that historical legacy (in terms of what jobs and sectors women are more (less) represented in), and differences in culture across countries tell most of the story about gender differences in quantity and quality of self‐employment.
But other strands of evidence tell us the story is much more complex. For example, we find that the presence of children and marital status are much more important in the female decision to become self‐employed. And having children increases the propensity for women to become self‐employed. Further investigation of the data shows that childcare and eldercare responsibilities actually increase the probability that women will choose self‐employment, and create jobs in self‐employment. This suggests two things. Firstly, that women seeking to manage the work‐family‐interface value the time flexibility that self‐employment affords them. And secondly, that once this decision has been made, they have the commitment and ability to grow their businesses. This implies some sort of self‐selection of goal orientated women with familial responsibilities into job creating self‐employment, as opposed to women with children at school who tend to opt for lifestyle self‐employment for the time flexibility it gives them.
We also questioned how important country of domicile was in the self‐employment decision. And we find that it is very important, but more so for men. But when we looked at job creating self‐employment this was reversed. Here we found that country effects were much more important for women, hinting that cultural and historical differences were important. If we were particularly concerned about quality of women’s self‐employment, defined as their ability to create jobs, then Germany, Denmark, and Holland stand as exemplars and merit further investigation in future research.
Finally, we posed the question as to whether gender differences persist, increase, or diminish over time. On this our evidence is striking. On a quantity and quality level,

Institute for Employment Studies 17
and within a decade, the ‘true’ gender gap in terms of the propensity to become self‐employed, and to create jobs subsequently, has diminished substantially in the European Union. If these dynamics persist, it is likely that the only remaining gender differences we will observe in self‐employment rates will relate to differences in the occupational distribution of men and women. And these are likely to be very small. For those interested in promoting female self‐employment, our evidence strongly suggests that activity should focus on growth not start‐up or entry. Broader policies aimed at increasing women’s participation in non‐traditional sectors and occupations will naturally close this gender gap.
18 Entrepreneurship, Gender and Job Creation
References and Appendices
Birch D (1979), The Job Generation Process. MIT Press.
Brusch C (1992), ‘Research on women business owners: Past trends, a new perspective and future directions’, Entrepreneurship, Theory and Practice, (summer). 5‐30.
Burke A, Fitzroy F, Nolan M (2001), ‘When less is more: distinguishing between entrepreneurial choice and performance’, Oxford Bulletin of Economics and Statistics, 62 (5). 565‐587.
Carroll R, Holtz‐Eakin D, Rider M, Rosen H (1996), Income taxes and entrepreneurs use of labour. Centre for Economic Policy Studies, Working Paper No.32.
Coates S, Tennyson S (1992), Labour market discrimination, imperfect information and self‐employment. Oxford Economic Papers, 44. 272‐288.
Cowling M, Bygrave W (2007), ‘Entrepreneurship, Welfare Provision and Unemployment’, Comparative Labor Law and Policy Journal, 28 (4), Summer. 617‐636.
Cowling M, Taylor M, Mitchell P (2004), Job Creators. Manchester School, 72 (5), September. 601‐617.
Cowling M, Taylor M (2001), ‘Entrepreneurial Women and Men: Two different species?’, Small Business Economics, 6 (3). 167‐175.
Cowling M (2000), ‘Are Entrepreneurs Different Across Countries?’ Applied Economics Letters, 7 (12), December.785‐789.
Cowling M (2003), The Employment Contribution of the Self‐Employed in the EU. Small Business Service. Research Report URN 03/539. www.sbs.gov.uk/research/ http://berr.gov.uk /files/file38300.pdf
Davidsson P, Lindmark L, Oloffson C (1998), ‘The extent of overestimation of small firm job creation – an empirical examination of the regression bias’, Small Business Economics, 11. 87‐100.
Davis S, Haltiwanger J, Shuh S (1996), ‘Small business job creation: Dissecting the myth and reassessing the facts’, Small Business Economics, 8. 297‐315.
Institute for Employment Studies 19
Dolton P, Makepeace G (1987), ‘Marital status, child rearing and earnings differentials in the graduate labour market’, The Economic Journal, 97. 897‐921.
Du Rietz A, Henrekson M (2000), ‘Testing the female under‐performance hypothesis’, Small Business Economics, 14. 1‐10.
Jennings J, McDougald M (2007), ‘Work‐family interface experiences and coping strategies: Implications for entrepreneurship research and practice’, Academy of Management Review, 32 (3). 747‐760.
Kalleberg A, Leicht K (1991), ‘Gender and organisational performance: Determinants of small business survival and success’, Academy of Management Journal, 34 (1). 136‐161.
Langovitz N, Minniti M (2007), ‘The entrepreneurial propensity of women’, Entrepreneurship, Theory and Practice, 31 (3). 341‐364.
Marlow S, Carter S, Shaw E (2008), ‘Constructing female entrepreneurship in the UK: Is the US a relevant benchmark?’, Environment and Planning C, 26 (2). 335‐351.
Moore I (1983), ‘Employer discrimination: Evidence from self‐employed workers’, The Review of Economics and Statistics, 65. 570‐579.
Morris M, Miyasaki N, Watters C, Coombes S (2006), ‘The dilemma of growth: Understanding venture size choices of women entrepreneurs’, Journal of Small Business Management, 44 (2). 221‐244.
Parker S (2008), ‘Entrepreneurship among married couples in the US’, Labour Economics, 15 (3). 459‐481.
Rosa P, Carter S, Hamilton D (1996), ‘Gender as a determinant of small business performance’, Small Business Economics, 8. 463‐478.
Sowell I (1981), Markets and Minorities. Basic Books Inc.
Verheul I, Van Stel A, Thurik R (2006), ‘Explaining female and male entrepreneurship at the country level’, Entrepreneurship and Regional Development, 18 (2). 151‐183.
Wagner J (2007), ‘What a difference a Y makes: Female and male nascent entrepreneurs in Germany’, Small Business Economics, 28 (1). 1‐21.
Watson J, Robinson S (2003), ‘Adjusting for risk in comparing the performance of male and female controlled SMEs’, Journal of Business Venturing, 18 (6). 773‐788.
Westhead P, Cowling M (1995), ‘Employment Change in Independent Owner Managed High Technology Firms in Great Britain’, Small Business Economics, 7 (2). 111‐140.
20 Entrepreneurship, Gender and Job Creation
Model 1: The self-employed-waged employed decision: full model
Probit estimates Number of obs = 21691 LR chi2(45) =5508.18 Prob > chi2 = 0.0000 Log likelihood = ‐6980.0416 Pseudo R2 = 0.2829
Variable dF/dx Std. Err. z P>|z| x-bar [ 95% C.I. ] Male 0.03 0.00 6.33 0.00 0.55 0.02 0.04 Age 25-39 0.11 0.01 10.39 0.00 0.42 0.09 0.13 40-54 0.16 0.01 13.18 0.00 0.36 0.13 0.19 55+ 0.30 0.02 15.84 0.00 0.10 0.25 0.34 Marital status Married 0.02 0.01 2.68 0.01 0.56 0.01 0.03 Unmarried 0.01 0.01 1.61 0.11 0.11 0.00 0.03 Divorced 0.01 0.01 0.81 0.42 0.06 -0.01 0.03 Separated 0.00 0.02 -0.12 0.90 0.02 -0.04 0.03 Widowed 0.03 0.02 1.71 0.09 0.02 -0.01 0.07 Children 0.01 0.01 1.91 0.06 0.43 0.00 0.02 Occupation Senior manager 0.44 0.02 25.39 0.00 0.08 0.40 0.49 Professional 0.14 0.02 10.37 0.00 0.11 0.11 0.17 Technician 0.13 0.02 9.83 0.00 0.14 0.10 0.16 Clerical -0.03 0.01 -2.55 0.01 0.15 -0.05 -0.01 Sales 0.04 0.01 3.57 0.00 0.16 0.02 0.06 Skilled manual 0.49 0.04 13.25 0.00 0.03 0.40 0.57 Craft 0.10 0.01 8.34 0.00 0.15 0.07 0.13 Operative 0.02 0.01 1.58 0.11 0.08 -0.01 0.05 Sector Agriculture 0.14 0.03 5.61 0.00 0.04 0.08 0.21 Manufacturing -0.02 0.01 -2.77 0.01 0.17 -0.04 -0.01 Utilities -0.06 0.01 -2.91 0.00 0.01 -0.09 -0.03 Construction 0.07 0.01 6.07 0.00 0.07 0.04 0.10 Retailing 0.14 0.01 15.64 0.00 0.17 0.12 0.16 Hotels & catering
0.11 0.02 7.66 0.00 0.05 0.07 0.14
Transport & comms
0.02 0.01 1.74 0.08 0.07 0.00 0.04
Finance 0.02 0.01 1.63 0.10 0.03 -0.01 0.05 Real estate 0.11 0.01 9.28 0.00 0.07 0.08 0.13 Public admin -0.11 0.00 -11.90 0.00 0.07 -0.12 -0.10 Country Denmark -0.08 0.01 -8.95 0.00 0.07 -0.09 -0.07 Germany -0.04 0.01 -3.82 0.00 0.07 -0.06 -0.02 Greece 0.17 0.02 11.17 0.00 0.07 0.13 0.20 Spain 0.08 0.02 5.97 0.00 0.07 0.05 0.11 France -0.04 0.01 -3.69 0.00 0.07 -0.06 -0.02 Ireland 0.00 0.01 -0.39 0.70 0.07 -0.03 0.02 Italy 0.11 0.02 8.18 0.00 0.07 0.08 0.14 Luxembourg -0.05 0.01 -2.86 0.00 0.02 -0.08 -0.02 Holland -0.08 0.01 -8.80 0.00 0.07 -0.09 -0.07 Portugal 0.01 0.01 1.25 0.21 0.07 -0.01 0.04 UK -0.02 0.01 -2.14 0.03 0.07 -0.04 0.00 Austria -0.04 0.01 -3.42 0.00 0.07 -0.05 -0.02 Sweden -0.05 0.01 -5.41 0.00 0.07 -0.07 -0.04 Finland -0.04 0.01 -3.86 0.00 0.07 -0.06 -0.02 Other 0.01 0.02 0.46 0.65 0.01 -0.03 0.05
Institute for Employment Studies 21
Model 2: The self-employed –waged employed decision: Males
Probit estimates Number of obs = 11899 LR chi2(44) =3138.75 Prob > chi2 = 0.0000 Log likelihood = ‐4385.1892 Pseudo R2 = 0.2636
Variable dF/dx Std. Err. z P>|z| x-bar [ 95% C.I. ] Age 25-39 0.13 0.02 8.35 0.00 0.41 0.10 0.16 40-54 0.18 0.02 10.02 0.00 0.36 0.14 0.22 55+ 0.33 0.03 12.57 0.00 0.11 0.26 0.39 Marital status Married 0.01 0.01 1.37 0.17 0.57 -0.01 0.04 Unmarried 0.02 0.01 1.11 0.27 0.11 -0.01 0.04 Divorced 0.04 0.02 2.09 0.04 0.04 0.00 0.08 Separated 0.03 0.03 1.16 0.25 0.01 -0.03 0.10 Widowed 0.04 0.04 0.97 0.33 0.01 -0.04 0.12 Children 0.01 0.01 1.34 0.18 0.41 -0.01 0.03 Occupation Senior manager 0.45 0.03 18.26 0.00 0.09 0.40 0.51 Professional 0.22 0.03 9.63 0.00 0.10 0.17 0.28 Technician 0.19 0.03 9.03 0.00 0.13 0.14 0.24 Clerical -0.02 0.02 -1.08 0.28 0.09 -0.06 0.02 Sales 0.09 0.02 4.59 0.00 0.10 0.05 0.14 Skilled manual 0.56 0.05 11.43 0.00 0.04 0.46 0.65 Craft 0.11 0.02 6.39 0.00 0.24 0.07 0.15 Operative 0.04 0.02 1.92 0.05 0.11 0.00 0.08 Sector Agriculture 0.12 0.04 3.33 0.00 0.05 0.04 0.20 Manufacturing -0.03 0.01 -2.58 0.01 0.22 -0.05 -0.01 Utilities -0.08 0.02 -2.83 0.01 0.01 -0.12 -0.04 Construction 0.09 0.02 5.82 0.00 0.12 0.06 0.13 Retailing 0.17 0.02 11.18 0.00 0.16 0.14 0.21 Hotels & catering
0.11 0.03 4.71 0.00 0.04 0.06 0.16
Transport & comms
0.03 0.02 1.66 0.10 0.09 -0.01 0.06
Finance 0.04 0.02 1.62 0.11 0.03 -0.01 0.08 Real estate 0.10 0.02 5.91 0.00 0.07 0.06 0.14 Public admin -0.15 0.01 -10.42 0.00 0.07 -0.16 -0.14 Country Denmark -0.09 0.01 -5.79 0.00 0.06 -0.11 -0.07 Germany -0.03 0.02 -2.05 0.04 0.07 -0.06 0.00 Greece 0.25 0.03 10.86 0.00 0.08 0.19 0.30 Spain 0.09 0.02 4.69 0.00 0.08 0.05 0.14 France -0.04 0.01 -2.33 0.02 0.07 -0.07 -0.01 Ireland 0.06 0.02 3.16 0.00 0.07 0.02 0.10 Italy 0.15 0.02 7.46 0.00 0.08 0.11 0.20 Luxembourg -0.06 0.02 -2.31 0.02 0.02 -0.11 -0.02 Holland -0.11 0.01 -6.94 0.00 0.06 -0.12 -0.09 Portugal 0.01 0.02 0.57 0.57 0.07 -0.03 0.05 UK 0.02 0.02 0.85 0.39 0.07 -0.02 0.05 Austria -0.02 0.02 -0.88 0.38 0.06 -0.05 0.02 Sweden -0.05 0.01 -2.89 0.00 0.06 -0.08 -0.02 Finland -0.03 0.02 -1.58 0.12 0.06 -0.06 0.00 Other 0.04 0.03 1.19 0.23 0.01 -0.03 0.10
22 Entrepreneurship, Gender and Job Creation
Model 3: The self-employed –waged employed decision: Females
Probit estimates Number of obs = 9792 LR chi2(44) =2351.25 Prob > chi2 = 0.0000 Log likelihood = ‐2488.332 Pseudo R2 = 0.3209
Variable dF/dx Std. Err. z P>|z| x-bar [ 95% C.I. ] Age 25-39 0.07 0.01 5.69 0.00 0.43 0.05 0.10 40-54 0.13 0.02 8.07 0.00 0.36 0.09 0.16 55+ 0.25 0.04 9.25 0.00 0.08 0.17 0.32 Marital status Married 0.02 0.01 2.74 0.01 0.54 0.01 0.04 Unmarried 0.02 0.01 1.36 0.18 0.12 -0.01 0.04 Divorced -0.01 0.01 -0.42 0.68 0.08 -0.03 0.02 Separated -0.02 0.02 -1.14 0.25 0.02 -0.05 0.01 Widowed 0.02 0.02 1.17 0.24 0.03 -0.02 0.06 Children 0.01 0.01 2.32 0.02 0.45 0.00 0.03 Occupation Senior manager 0.50 0.03 18.99 0.00 0.06 0.43 0.57 Professional 0.08 0.02 5.38 0.00 0.13 0.04 0.11 Technician 0.07 0.02 5.26 0.00 0.16 0.04 0.11 Clerical -0.02 0.01 -1.63 0.10 0.21 -0.04 0.00 Sales 0.02 0.01 1.99 0.05 0.23 0.00 0.05 Skilled manual 0.37 0.08 6.71 0.00 0.02 0.21 0.52 Craft 0.17 0.03 7.36 0.00 0.04 0.10 0.23 Operative 0.02 0.02 0.68 0.50 0.04 -0.03 0.06 Sector Agriculture 0.21 0.06 5.25 0.00 0.03 0.10 0.33 Manufacturing -0.02 0.01 -1.54 0.13 0.11 -0.03 0.00 Utilities -0.02 0.04 -0.51 0.61 0.00 -0.10 0.05 Construction 0.03 0.03 0.94 0.35 0.01 -0.04 0.09 Retailing 0.09 0.01 9.38 0.00 0.19 0.07 0.12 Hotels & catering
0.08 0.02 5.10 0.00 0.06 0.04 0.11
Transport & comms
-0.01 0.02 -0.58 0.56 0.03 -0.04 0.02
Finance 0.00 0.02 0.07 0.95 0.04 -0.03 0.03 Real estate 0.09 0.02 6.35 0.00 0.06 0.06 0.13 Public admin -0.07 0.00 -6.11 0.00 0.06 -0.08 -0.06 Country Denmark -0.06 0.01 -6.93 0.00 0.07 -0.07 -0.05 Germany -0.04 0.01 -3.48 0.00 0.07 -0.05 -0.02 Greece 0.06 0.02 3.82 0.00 0.06 0.02 0.10 Spain 0.07 0.02 3.94 0.00 0.05 0.03 0.11 France -0.03 0.01 -3.10 0.00 0.07 -0.05 -0.02 Ireland -0.05 0.01 -4.94 0.00 0.06 -0.06 -0.04 Italy 0.06 0.02 3.89 0.00 0.06 0.02 0.10 Luxembourg -0.03 0.02 -1.47 0.14 0.01 -0.06 0.00 Holland -0.06 0.01 -5.78 0.00 0.08 -0.07 -0.04 Portugal 0.01 0.01 0.53 0.60 0.08 -0.02 0.03 UK -0.05 0.01 -4.39 0.00 0.07 -0.06 -0.03 Austria -0.04 0.01 -4.19 0.00 0.08 -0.06 -0.03 Sweden -0.05 0.01 -4.93 0.00 0.08 -0.06 -0.04 Finland -0.04 0.01 -4.30 0.00 0.08 -0.06 -0.03 Other -0.01 0.02 -0.65 0.52 0.01 -0.05 0.03
Institute for Employment Studies 23
Model 4: ISE-Job Creator determination: Full Model
Probit estimates Number of obs = 3591 LR chi2(45) = 487.06 Prob > chi2 = 0.0000 Log likelihood = ‐1910.3293 Pseudo R2 = 0.1131
Variable dF/dx Std. Err. z P>|z| x-bar [ 95% C.I. ] Male 0.11 0.02 6.47 0.00 0.66 0.08 0.14 Age 25-39 0.02 0.05 0.47 0.64 0.36 -0.07 0.12 40-54 0.02 0.05 0.35 0.73 0.41 -0.08 0.12 55+ -0.03 0.05 -0.66 0.51 0.19 -0.13 0.07 Marital status Married 0.07 0.03 2.64 0.01 0.68 0.02 0.12 Unmarried 0.02 0.04 0.63 0.53 0.07 -0.05 0.10 Divorced 0.05 0.05 1.06 0.29 0.05 -0.04 0.14 Separated -0.13 0.05 -2.13 0.03 0.02 -0.23 -0.04 Widowed 0.03 0.06 0.41 0.68 0.02 -0.10 0.15 Children 0.02 0.02 1.34 0.18 0.42 -0.01 0.06 Occupation Senior manager 0.36 0.05 6.71 0.00 0.26 0.25 0.47 Professional 0.19 0.06 3.17 0.00 0.10 0.06 0.31 Technician 0.18 0.06 3.10 0.00 0.12 0.06 0.30 Clerical 0.13 0.07 1.95 0.05 0.05 -0.01 0.27 Sales 0.15 0.06 2.66 0.01 0.11 0.03 0.27 Skilled manual -0.02 0.08 -0.21 0.83 0.14 -0.18 0.14 Craft 0.14 0.06 2.56 0.01 0.16 0.03 0.25 Operative 0.07 0.07 0.96 0.34 0.03 -0.08 0.21 Sector Agriculture 0.10 0.08 1.21 0.23 0.15 -0.07 0.26 Manufacturing 0.18 0.04 4.83 0.00 0.10 0.10 0.26 Utilities 0.02 0.13 0.18 0.86 0.00 -0.23 0.27 Construction 0.13 0.04 3.29 0.00 0.08 0.05 0.21 Retailing -0.01 0.03 -0.43 0.67 0.30 -0.06 0.04 Hotels & catering
0.15 0.04 3.64 0.00 0.06 0.06 0.23
Transport & comms
-0.02 0.05 -0.45 0.65 0.04 -0.11 0.07
Finance 0.12 0.06 2.22 0.03 0.03 0.01 0.23 Real estate 0.02 0.04 0.53 0.59 0.08 -0.05 0.09 Public admin 0.09 0.11 0.83 0.41 0.01 -0.13 0.31 Country Denmark 0.31 0.06 4.95 0.00 0.03 0.18 0.43 Germany 0.32 0.05 6.31 0.00 0.05 0.22 0.43 Greece -0.04 0.03 -1.20 0.23 0.19 -0.11 0.03 Spain 0.08 0.04 1.84 0.07 0.10 -0.01 0.16 France 0.07 0.05 1.47 0.14 0.06 -0.03 0.16 Ireland 0.17 0.05 3.59 0.00 0.07 0.07 0.27 Italy 0.08 0.04 1.79 0.07 0.12 -0.01 0.16 Luxembourg 0.20 0.10 2.05 0.04 0.01 0.00 0.40 Holland 0.21 0.07 3.43 0.00 0.02 0.08 0.35 Portugal 0.02 0.04 0.37 0.71 0.09 -0.07 0.10 UK 0.08 0.05 1.75 0.08 0.06 -0.01 0.18 Austria 0.27 0.05 5.12 0.00 0.05 0.16 0.37 Sweden 0.18 0.06 3.34 0.00 0.04 0.07 0.29 Finland 0.02 0.05 0.44 0.66 0.05 -0.07 0.11 Other 0.02 0.08 0.25 0.80 0.01 -0.13 0.17

24 Entrepreneurship, Gender and Job Creation
Model 5: ISE-Job Creator determination: Males
Probit estimates Number of obs = 2380 LR chi2(44) = 312.86 Prob > chi2 = 0.0000 Log likelihood = ‐1343.2524 Pseudo R2 = 0.1043
Variable dF/dx Std. Err. z P>|z| x-bar [ 95% C.I. ] Age 25-39 -0.01 0.06 -0.20 0.84 0.36 -0.12 0.10 40-54 -0.03 0.06 -0.49 0.63 0.39 -0.15 0.09 55+ -0.07 0.06 -1.09 0.27 0.20 -0.19 0.05 Marital status Married 0.07 0.03 2.13 0.03 0.68 0.01 0.13 Unmarried 0.02 0.05 0.39 0.70 0.07 -0.07 0.11 Divorced 0.12 0.06 1.99 0.05 0.04 0.00 0.24 Separated -0.11 0.07 -1.38 0.17 0.02 -0.25 0.03 Widowed 0.04 0.11 0.35 0.72 0.01 -0.18 0.26 Children 0.03 0.02 1.23 0.22 0.41 -0.02 0.08 Occupation Senior manager 0.37 0.07 5.36 0.00 0.24 0.24 0.51 Professional 0.19 0.08 2.46 0.01 0.10 0.03 0.35 Technician 0.17 0.08 2.33 0.02 0.12 0.02 0.33 Clerical 0.10 0.10 1.04 0.30 0.03 -0.09 0.29 Sales 0.19 0.08 2.53 0.01 0.09 0.04 0.35 Skilled manual -0.10 0.10 -0.94 0.35 0.14 -0.29 0.09 Craft 0.15 0.07 2.17 0.03 0.20 0.01 0.29 Operative 0.08 0.09 0.95 0.34 0.04 -0.09 0.26 Sector Agriculture 0.20 0.11 1.89 0.06 0.15 -0.02 0.42 Manufacturing 0.23 0.05 4.70 0.00 0.12 0.13 0.32 Utilities 0.11 0.16 0.70 0.49 0.00 -0.20 0.41 Construction 0.15 0.05 3.10 0.00 0.12 0.05 0.25 Retailing 0.02 0.04 0.44 0.66 0.27 -0.06 0.09 Hotels & catering
0.13 0.06 2.28 0.02 0.05 0.01 0.25
Transport & comms
-0.03 0.06 -0.56 0.57 0.06 -0.15 0.08
Finance 0.17 0.07 2.58 0.01 0.03 0.04 0.31 Real estate 0.08 0.05 1.75 0.08 0.08 -0.01 0.18 Public admin 0.09 0.16 0.60 0.55 0.00 -0.22 0.40 Country Denmark 0.31 0.08 3.96 0.00 0.03 0.15 0.46 Germany 0.30 0.06 4.73 0.00 0.05 0.18 0.43 Greece -0.03 0.05 -0.67 0.51 0.19 -0.12 0.06 Spain 0.06 0.06 1.16 0.25 0.10 -0.05 0.17 France 0.13 0.07 2.02 0.04 0.05 0.00 0.25 Ireland 0.17 0.06 2.93 0.00 0.09 0.05 0.29 Italy 0.07 0.06 1.23 0.22 0.13 -0.04 0.17 Luxembourg 0.15 0.13 1.18 0.24 0.01 -0.11 0.41 Holland 0.14 0.09 1.66 0.10 0.02 -0.03 0.32 Portugal 0.04 0.06 0.74 0.46 0.07 -0.07 0.16 UK 0.07 0.06 1.18 0.24 0.06 -0.05 0.19 Austria 0.31 0.07 4.76 0.00 0.05 0.19 0.44 Sweden 0.23 0.07 3.28 0.00 0.04 0.09 0.37 Finland -0.01 0.06 -0.11 0.91 0.05 -0.13 0.12 Other 0.02 0.10 0.20 0.84 0.01 -0.17 0.21
Institute for Employment Studies 25
Model 6: ISE-Job Creator determination: Females
Probit estimates Number of obs = 1207 LR chi2(42) = 180.90 Prob > chi2 = 0.0000 Log likelihood = ‐538.44237 Pseudo R2 = 0.1438
Variable dF/dx Std. Err. z P>|z| x-bar [ 95% C.I. ] Age 25-39 0.21 0.13 1.76 0.08 0.37 -0.04 0.46 40-54 0.21 0.12 1.85 0.06 0.45 -0.02 0.44 55+ 0.16 0.15 1.17 0.24 0.16 -0.13 0.45 Marital status Married 0.05 0.04 1.28 0.20 0.69 -0.03 0.13 Unmarried 0.03 0.06 0.55 0.58 0.07 -0.09 0.16 Divorced -0.05 0.06 -0.79 0.43 0.06 -0.16 0.06 Separated -0.16 0.04 -1.84 0.07 0.01 -0.23 -0.09 Children 0.02 0.03 0.83 0.41 0.44 -0.03 0.07 Occupation Senior manager 0.32 0.09 3.89 0.00 0.30 0.15 0.50 Professional 0.15 0.10 1.71 0.09 0.10 -0.04 0.35 Technician 0.16 0.10 1.82 0.07 0.11 -0.03 0.36 Clerical 0.11 0.10 1.22 0.22 0.08 -0.09 0.32 Sales 0.09 0.09 1.14 0.26 0.15 -0.08 0.27 Skilled manual 0.17 0.18 1.10 0.27 0.13 -0.18 0.52 Craft 0.09 0.10 0.97 0.33 0.07 -0.11 0.29 Operative 0.00 0.14 -0.03 0.98 0.01 -0.28 0.27 Sector Agriculture -0.07 0.10 -0.62 0.54 0.14 -0.26 0.12 Manufacturing 0.09 0.07 1.51 0.13 0.07 -0.04 0.22 Construction 0.47 0.18 2.68 0.01 0.01 0.12 0.82 Retailing -0.04 0.03 -1.17 0.24 0.34 -0.11 0.03 Hotels & catering
0.17 0.06 3.11 0.00 0.09 0.05 0.29
Transport & comms
0.16 0.14 1.27 0.21 0.01 -0.12 0.44
Finance 0.01 0.09 0.15 0.88 0.02 -0.17 0.20 Real estate -0.07 0.04 -1.60 0.11 0.07 -0.15 0.00 Public admin 0.13 0.18 0.81 0.42 0.01 -0.22 0.47 Country Denmark 0.31 0.12 3.00 0.00 0.02 0.08 0.54 Germany 0.37 0.10 4.33 0.00 0.05 0.19 0.56 Greece -0.05 0.05 -1.04 0.30 0.19 -0.15 0.04 Spain 0.12 0.08 1.82 0.07 0.10 -0.02 0.27 France -0.01 0.06 -0.16 0.87 0.06 -0.13 0.11 Ireland 0.21 0.10 2.40 0.02 0.04 0.01 0.40 Italy 0.12 0.08 1.70 0.09 0.10 -0.03 0.27 Luxembourg 0.30 0.17 2.02 0.04 0.01 -0.03 0.63 Holland 0.29 0.10 3.22 0.00 0.03 0.09 0.50 Portugal 0.00 0.06 -0.07 0.94 0.12 -0.12 0.11 UK 0.16 0.10 1.89 0.06 0.04 -0.03 0.35 Austria 0.16 0.09 2.02 0.04 0.05 -0.02 0.34 Sweden 0.10 0.09 1.20 0.23 0.04 -0.08 0.28 Finland 0.06 0.07 0.92 0.36 0.06 -0.08 0.21 Other 0.00 0.12 -0.03 0.98 0.01 -0.24 0.23