Embed Size (px)
Citation preview
ENTREPRENEURSHIP EDUCATION ANDTRAINING IN INDIA:
An Assessment of SME Training Needs against CurrentPractices
Jay MitraUniversity of Essex, UKMathew J. Manimala
Indian Institute of Management Bangalore, India
‘AC 21 International Forum:Global Education: Universities in the 21 Century’
University of Warwick4-6 July, 2006
Structure of Presentation
• Background – push and pull factors
• SMEs in India
• Entrepreneurship and SME Training Infrastructure
• SME Training Survey
• A Novel International Scheme
• Some Concluding Observations
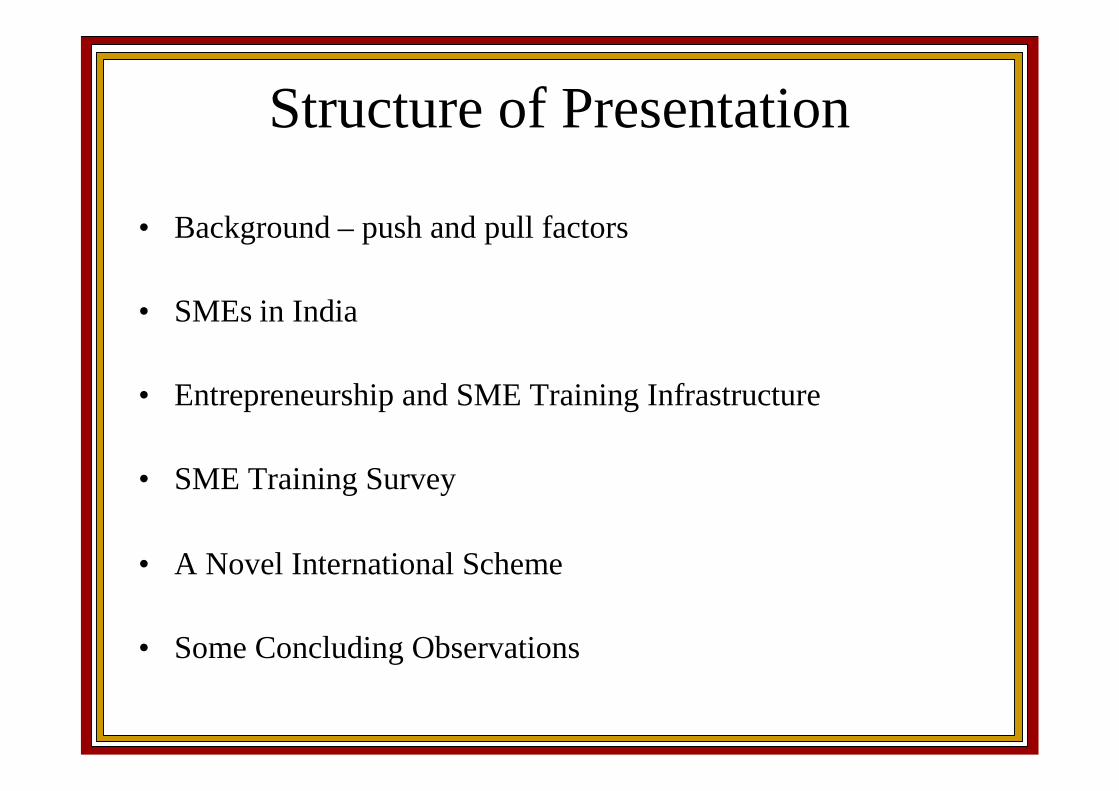
322.8386.1
422464.9
510.2
673.4
782.8
1994 1996 1998 2000 2002 2004e 2005f
N o m in a l G D P G ro w th in In d ia (U S D b illio n )10,871
6 ,436
3,583 3,0962,279
U S A China Japan India G erm any
G lo b a l G D P R a n k in g at P P P (U S D b illio n )
• One of the worlds fastestgrowing economies over thelast decade
• Consistent growth inproduction and domesticdemand
• Currently ranked 4th in a PPPcomparison
Source: DB Research
4.8
6.66.1
4.4
5.8
4.0
8.3
6 .4 6 .66.7
4.1
6.7
5
2.7
5.7
6.97 .7
6 .1
4.9
6.7
9.1
2.6
5.0 4.8
5.9 6 .0 6 .0
1997 1998 1999 2000 2001 2002 2003 2004e 2005f
R ea l G D P G ro w th
Indus tria l P ro duc tion
D omes tic D e ma nd
G row th Tren ds in K e y E c on om ic Ind ic a to rs (% )
Source: DB Research
Source: World Bank
Source: Nasscom, 2005 and various
Background: Push and Pull Factors -
G ro w th in K e y S erv ic es S eg m en ts
4.8 4.87.2 6.7
4.25.9 6.5
11.9
6.1
13.5
7.39.3
12.7 13.6
19.8
T r ad e Ho te ls Ban k in g C o m m u n icat io n Bu s in e s ss e r vice s
1950s -1970s
1980s1990s
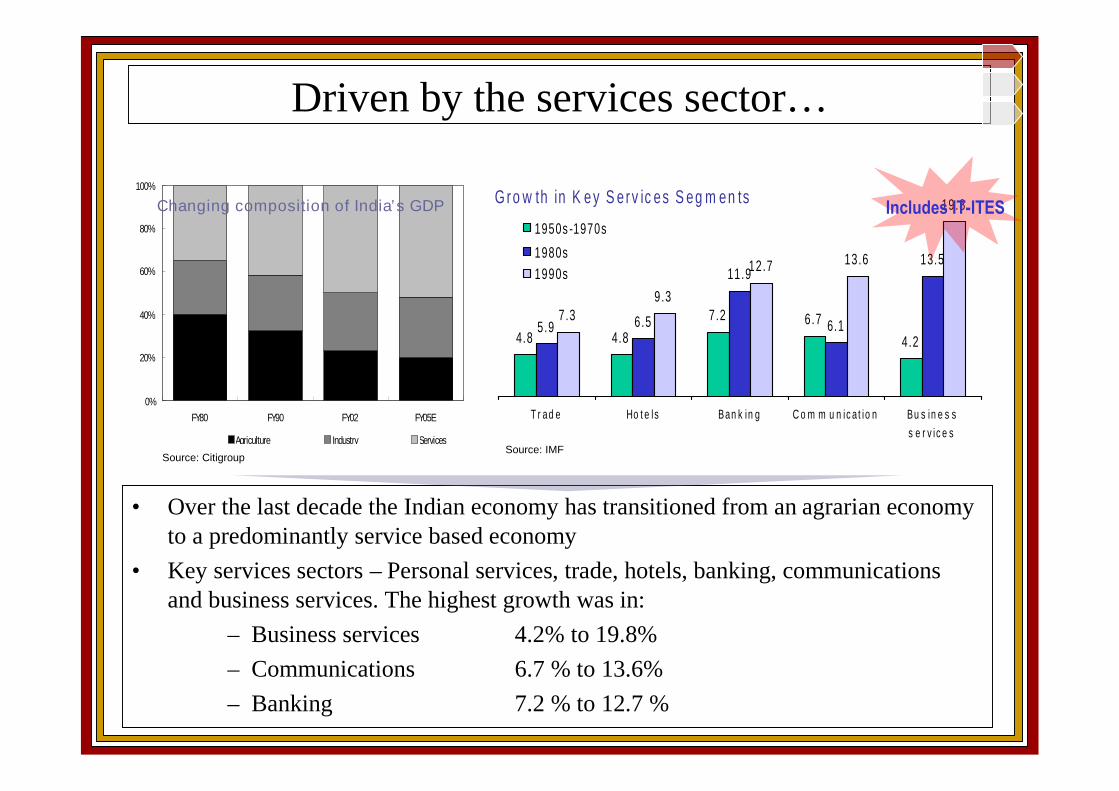
Driven by the services sector…
• Over the last decade the Indian economy has transitioned from an agrarian economyto a predominantly service based economy
• Key services sectors – Personal services, trade, hotels, banking, communicationsand business services. The highest growth was in:
– Business services 4.2% to 19.8%– Communications 6.7 % to 13.6%– Banking 7.2 % to 12.7 %
Source: IMF
0%
20%
40%
60%
80%
100%
FY80 FY90 FY02 FY05E
Agriculture Industry Services
Source: Citigroup
Changing composition of India’s GDP Includes IT-ITES
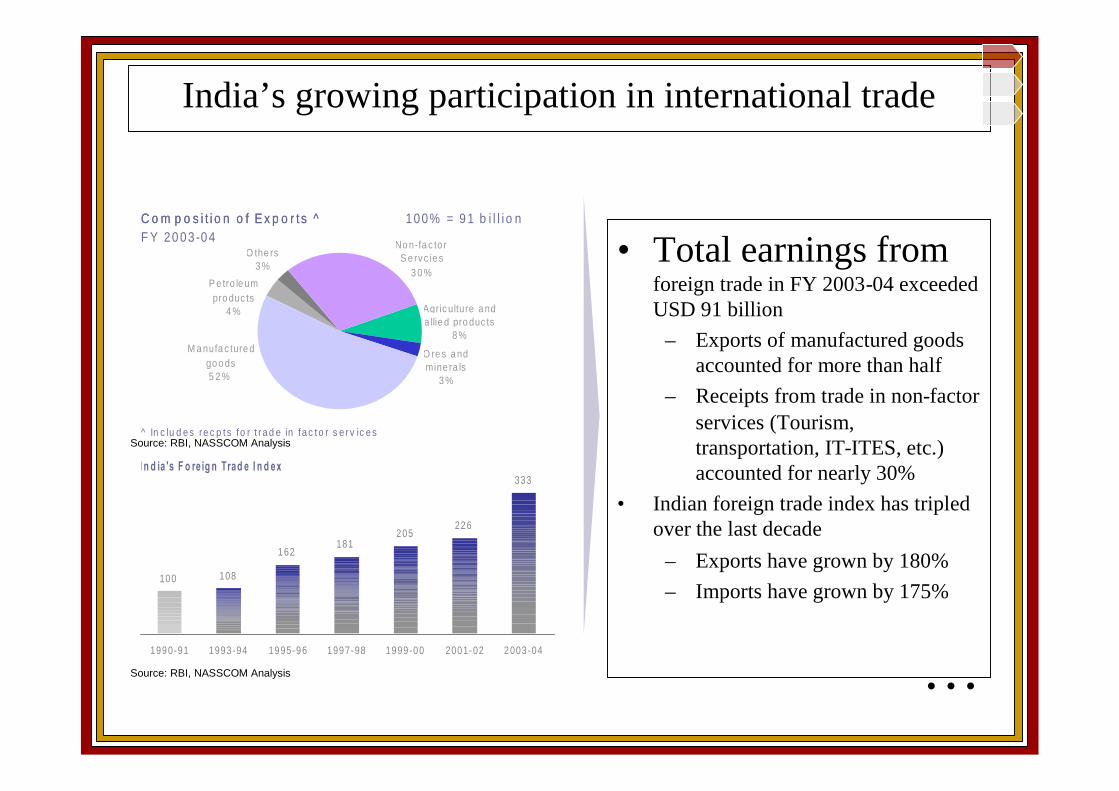
India’s growing participation in international trade
P e tro le umpro duc ts
4 %
O the rs3 %
No n-fa c to rS e rvc ie s
3 0 %
Agric ulture a nda llie d pro duc ts
8 %
O re s a ndmine ra ls
3 %
M a nufa c ture dgo o ds5 2 %
C o m p o sitio n o f E xp o rts ^ 100% = 9 1 b ill io nF Y 20 03-04
^ In c lu d e s re c p ts fo r tra d e in fa c to r s e rv ic e s
C o m p o sitio n o f E xp o rts ^
100 108
162181
205226
333
1990-91 1993-94 1995-96 1997-98 1999-00 2001-02 2003-04
I n d ia 's F o re ig n Trad e I n d ex
• Total earnings fromforeign trade in FY 2003-04 exceededUSD 91 billion
– Exports of manufactured goodsaccounted for more than half
– Receipts from trade in non-factorservices (Tourism,transportation, IT-ITES, etc.)accounted for nearly 30%
• Indian foreign trade index has tripledover the last decade
– Exports have grown by 180%– Imports have grown by 175%
Source: RBI, NASSCOM Analysis
Source: RBI, NASSCOM Analysis …
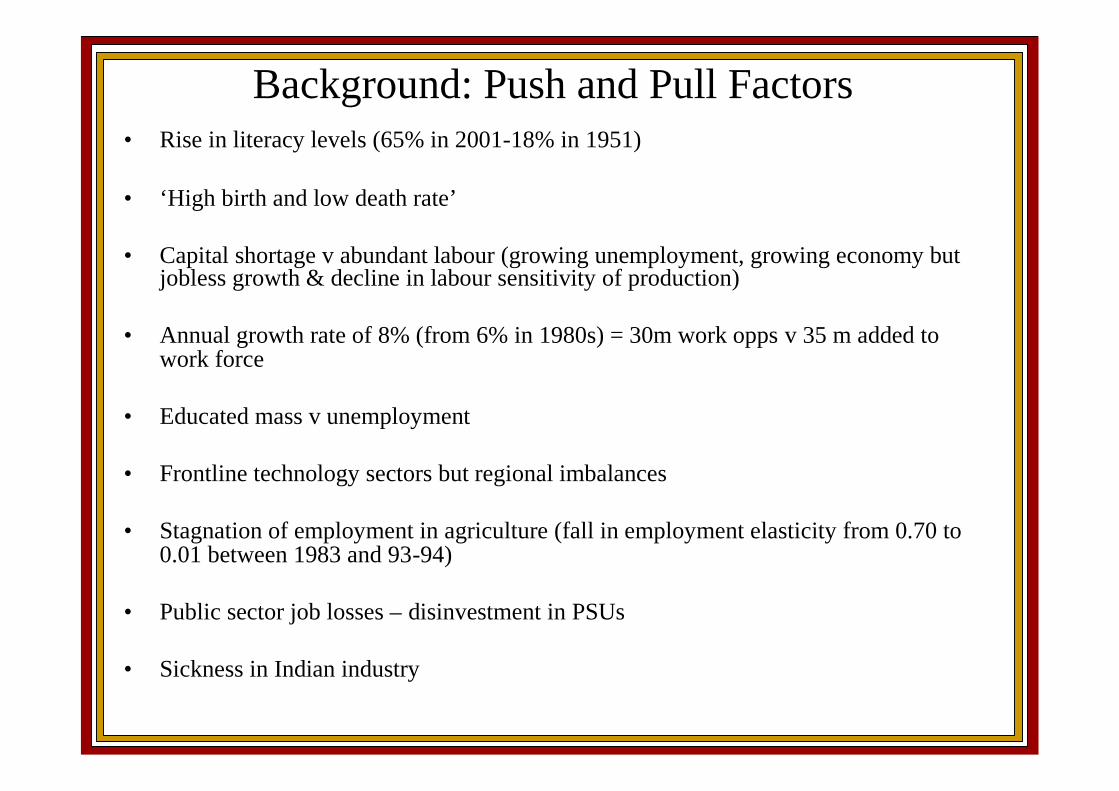
Background: Push and Pull Factors• Rise in literacy levels (65% in 2001-18% in 1951)
• ‘High birth and low death rate’
• Capital shortage v abundant labour (growing unemployment, growing economy butjobless growth & decline in labour sensitivity of production)
• Annual growth rate of 8% (from 6% in 1980s) = 30m work opps v 35 m added towork force
• Educated mass v unemployment
• Frontline technology sectors but regional imbalances
• Stagnation of employment in agriculture (fall in employment elasticity from 0.70 to0.01 between 1983 and 93-94)
• Public sector job losses – disinvestment in PSUs
• Sickness in Indian industry
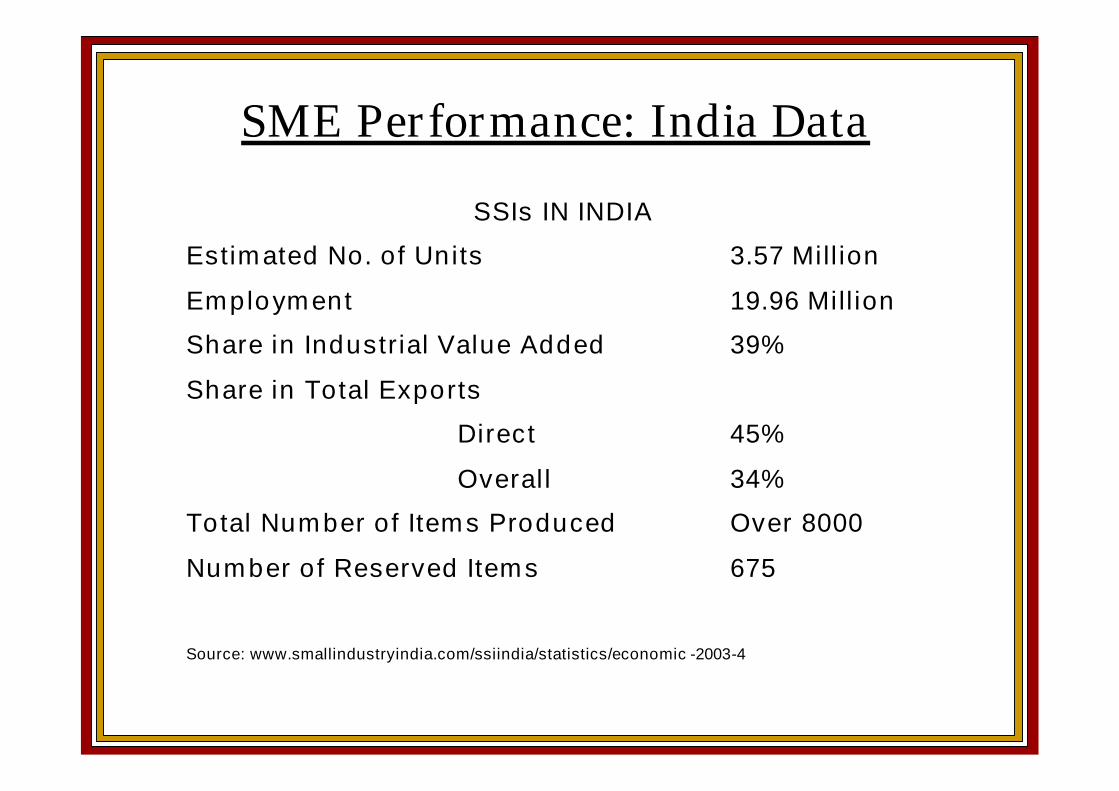
SME Performance: India Data
Source: www.smallindustryindia.com/ssiindia/statistics/economic -2003-4
SSIs IN INDIA
Estimated No. of Units 3.57 Million
Employment 19.96 Million
Share in Industrial Value Added 39%
Share in Total Exports
Direct 45%
Overall 34%
Total Number of Items Produced Over 8000
Number of Reserved Items 675
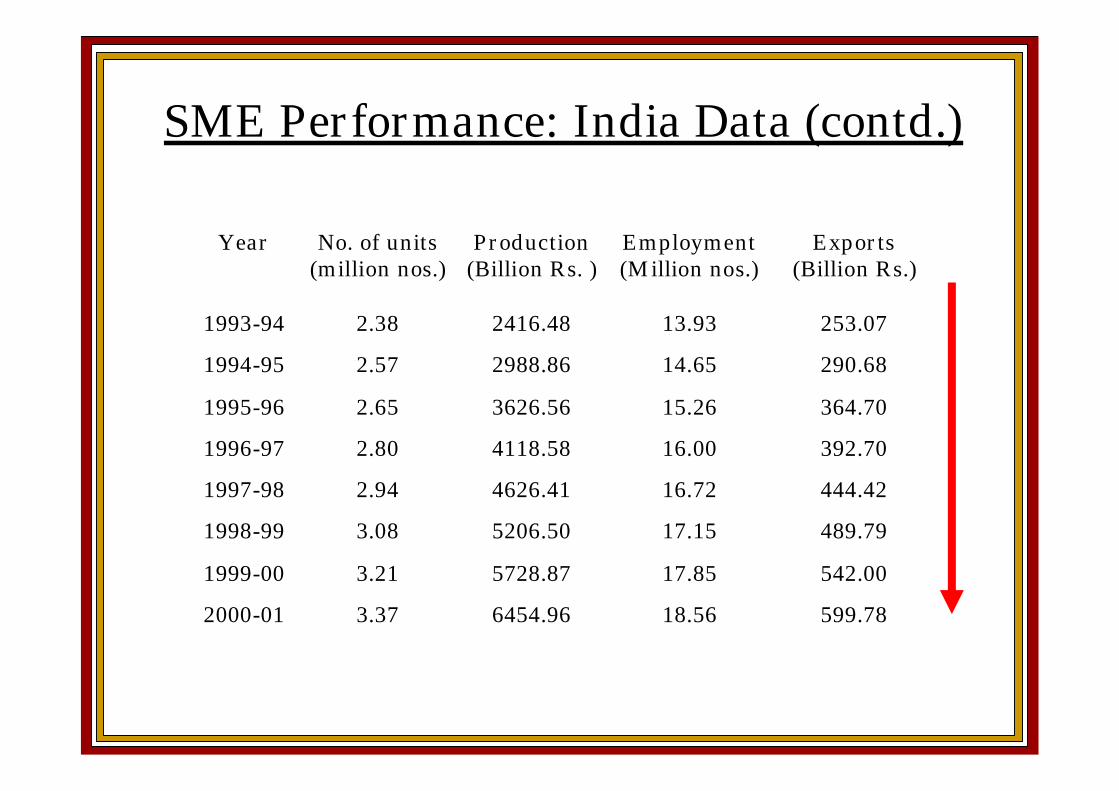
SME Performance: India Data (contd.)
Year No. of units(million nos.)
Production(Billion Rs. )
Employment(Million nos.)
Exports(Billion Rs.)
1993-94 2.38 2416.48 13.93 253.07
1994-95 2.57 2988.86 14.65 290.68
1995-96 2.65 3626.56 15.26 364.70
1996-97 2.80 4118.58 16.00 392.70
1997-98 2.94 4626.41 16.72 444.42
1998-99 3.08 5206.50 17.15 489.79
1999-00 3.21 5728.87 17.85 542.00
2000-01 3.37 6454.96 18.56 599.78
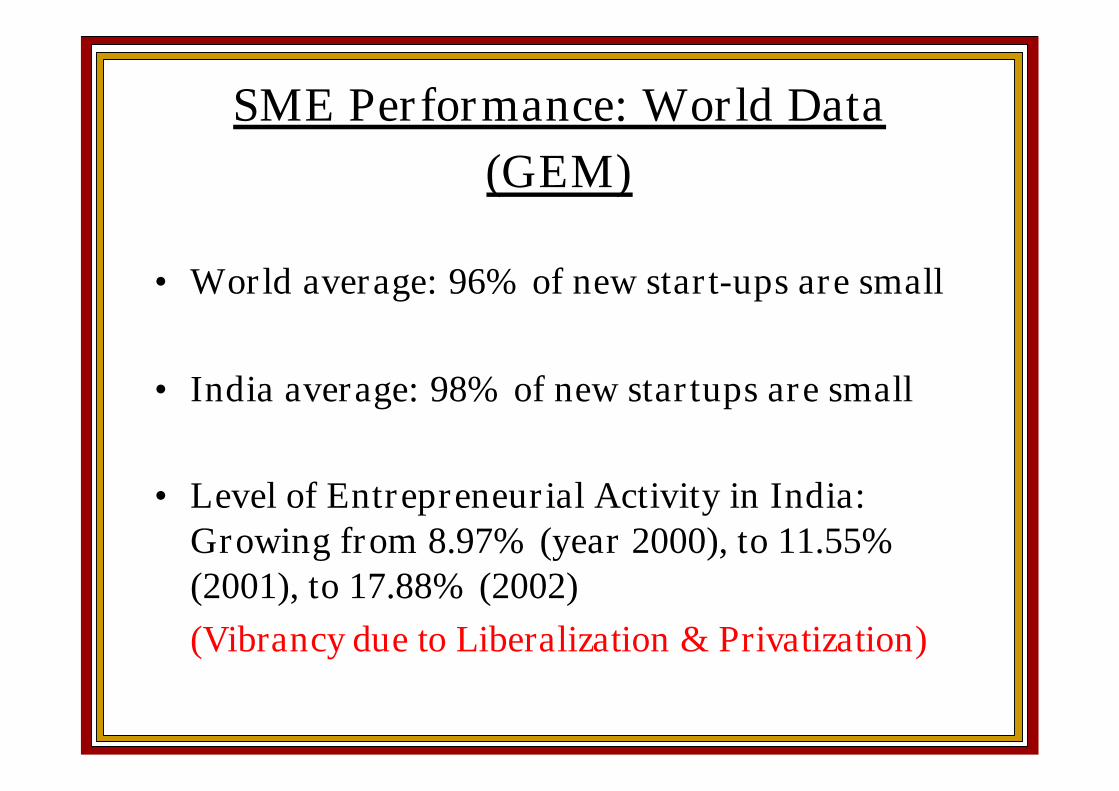
• World average: 96% of new start-ups are small
• India average: 98% of new startups are small
• Level of Entrepreneurial Activity in India:Growing from 8.97% (year 2000), to 11.55%(2001), to 17.88% (2002)(Vibrancy due to Liberalization & Privatization)
SME Performance: World Data(GEM)
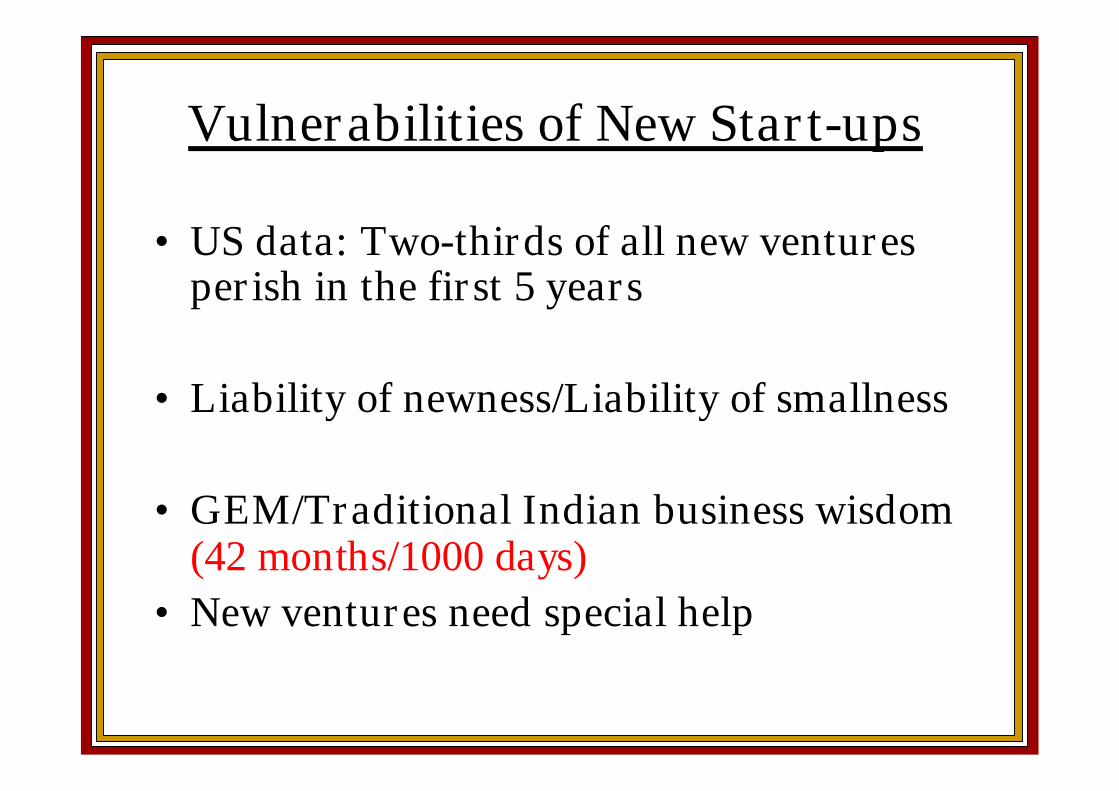
Vulnerabilities of New Start-ups
• US data: Two-thirds of all new venturesperish in the first 5 years
• Liability of newness/Liability of smallness
• GEM/Traditional Indian business wisdom(42 months/1000 days)
• New ventures need special help
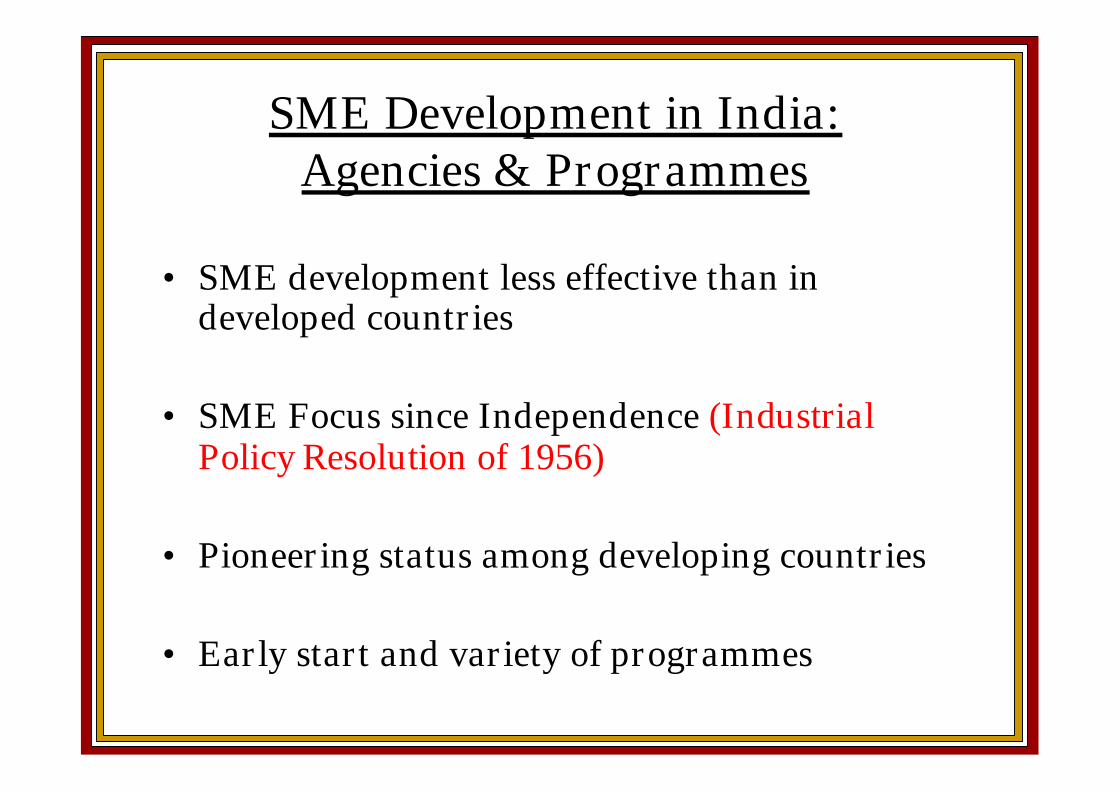
• SME development less effective than indeveloped countries
• SME Focus since Independence (IndustrialPolicy Resolution of 1956)
• Pioneering status among developing countries
• Early start and variety of programmes
SME Development in India:Agencies & Programmes
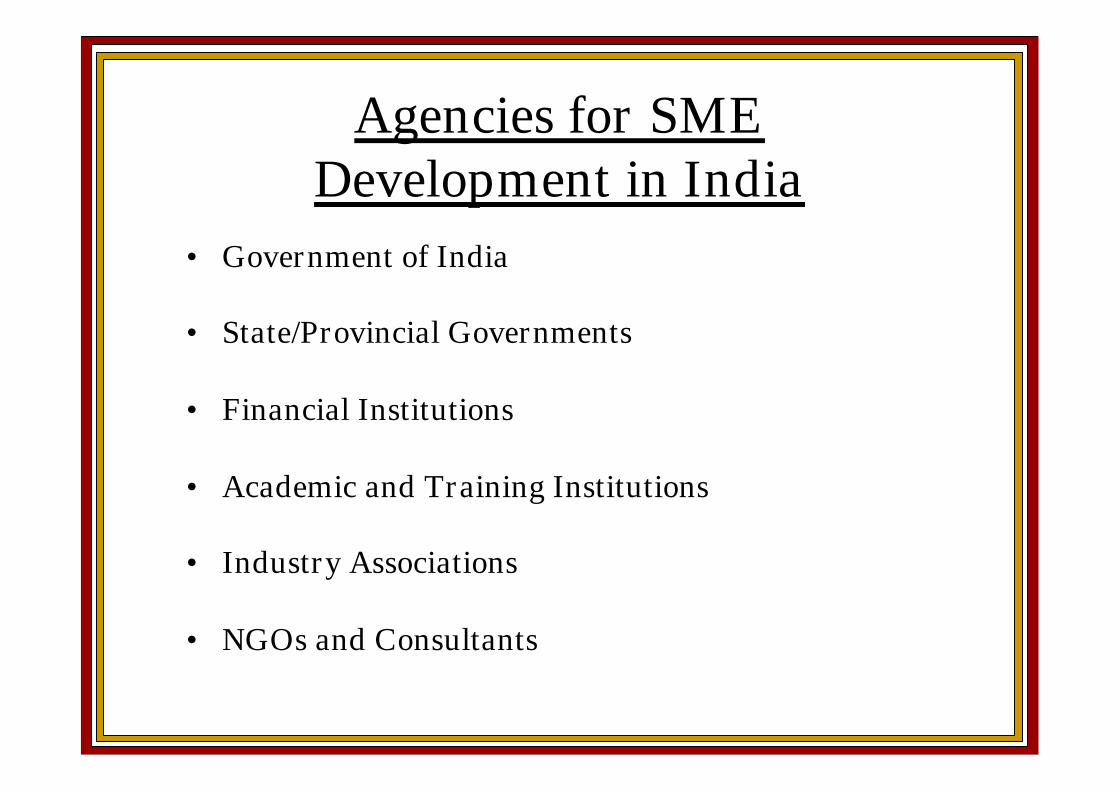
• Government of India
• State/Provincial Governments
• Financial Institutions
• Academic and Training Institutions
• Industry Associations
• NGOs and Consultants
Agencies for SMEDevelopment in India
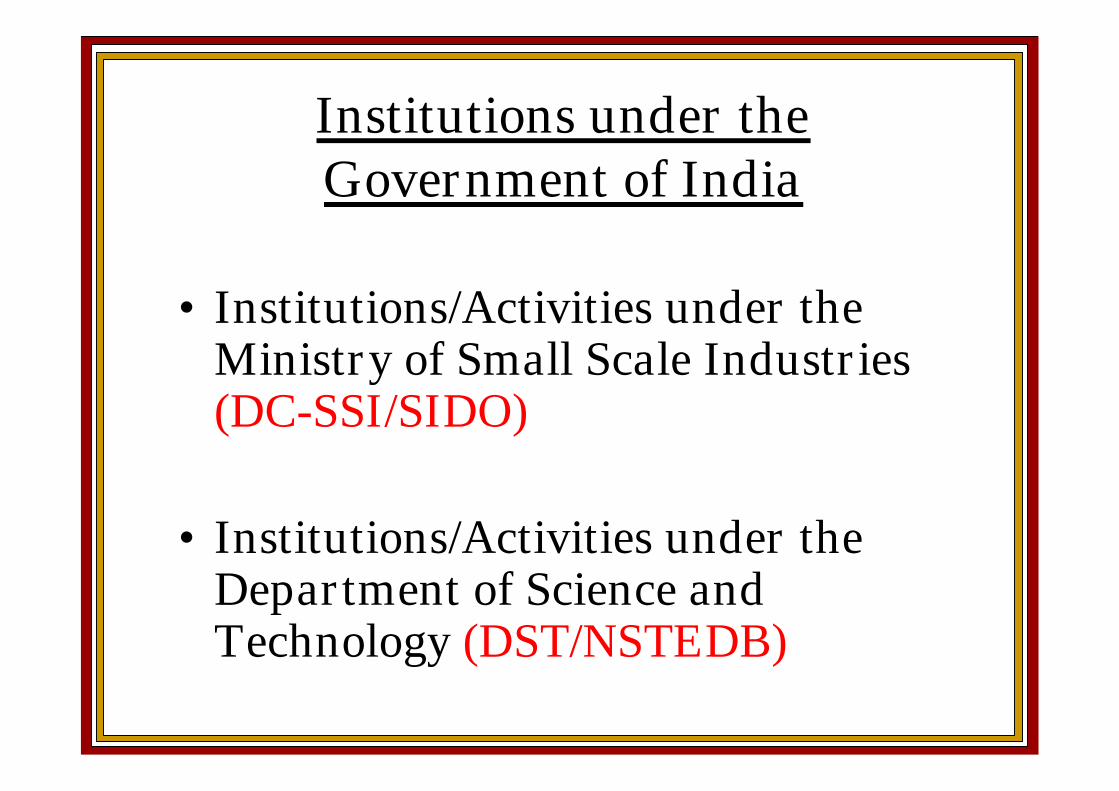
• Institutions/Activities under theMinistry of Small Scale Industries(DC-SSI/SIDO)
• Institutions/Activities under theDepartment of Science andTechnology (DST/NSTEDB)
Institutions under theGovernment of India
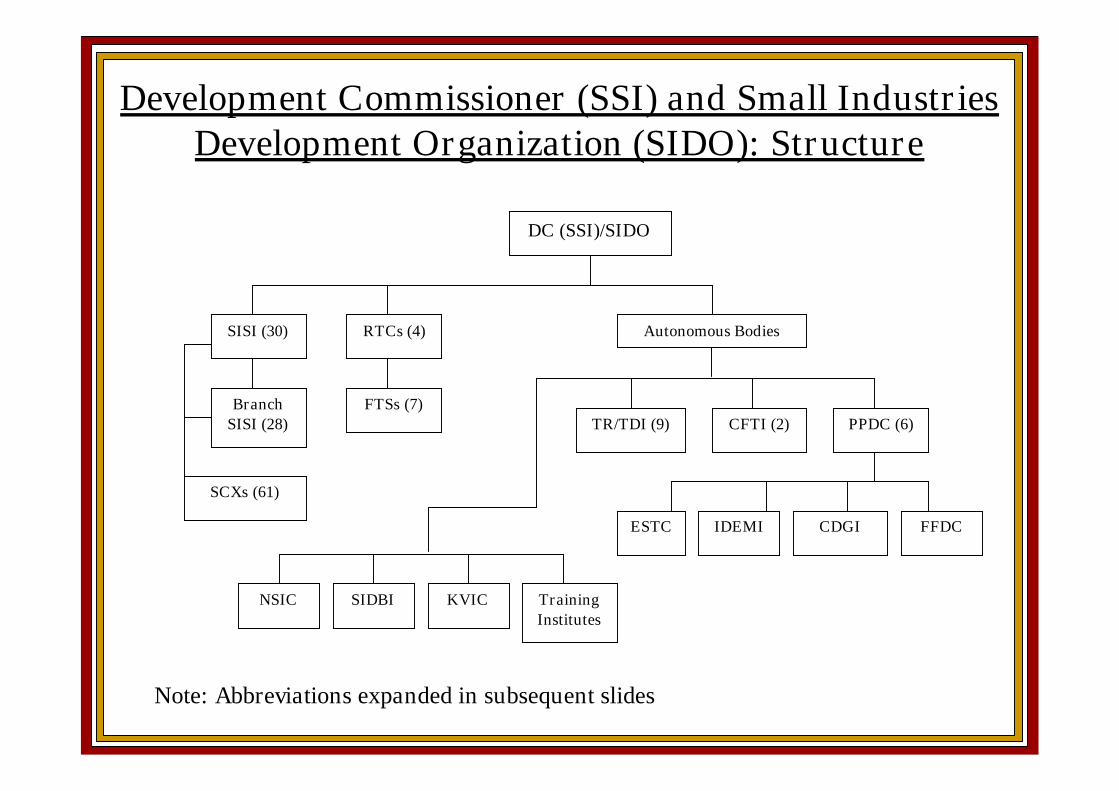
Development Commissioner (SSI) and Small IndustriesDevelopment Organization (SIDO): Structure
DC (SSI)/SIDO
SISI (30) RTCs (4)
BranchSISI (28)
FTSs (7)
SCXs (61)
TR/TDI (9) CFTI (2) PPDC (6)
NSIC SIDBI TrainingInstitutes
ESTC IDEMI CDGI FFDC
KVIC
Autonomous Bodies
Note: Abbreviations expanded in subsequent slides
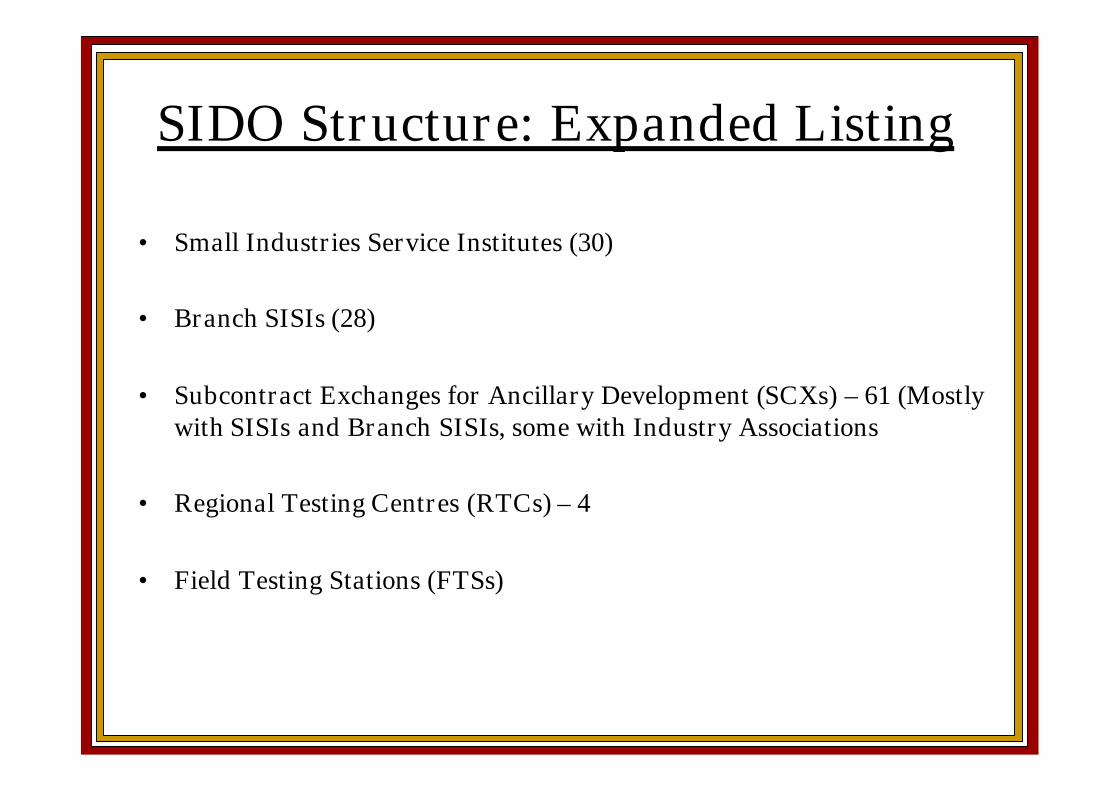
• Small Industries Service Institutes (30)
• Branch SISIs (28)
• Subcontract Exchanges for Ancillary Development (SCXs) – 61 (Mostlywith SISIs and Branch SISIs, some with Industry Associations
• Regional Testing Centres (RTCs) – 4
• Field Testing Stations (FTSs)
SIDO Structure: Expanded Listing
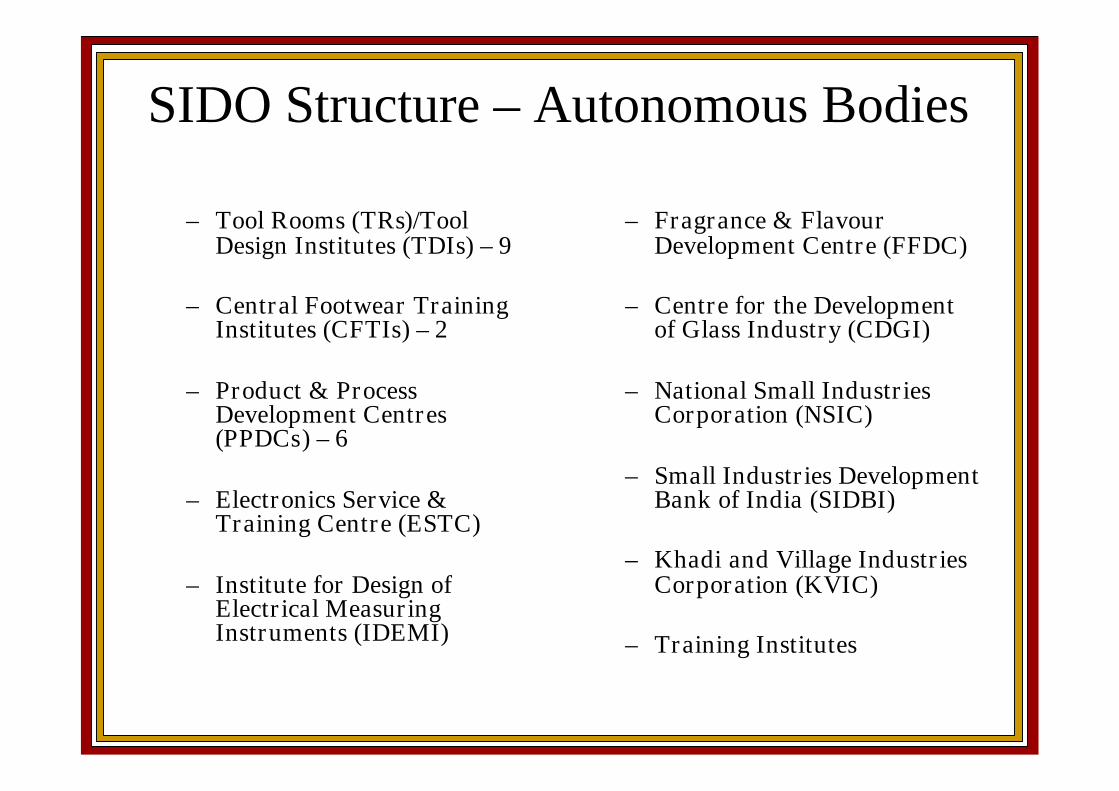
SIDO Structure – Autonomous Bodies
– Tool Rooms (TRs)/ToolDesign Institutes (TDIs) – 9
– Central Footwear TrainingInstitutes (CFTIs) – 2
– Product & ProcessDevelopment Centres(PPDCs) – 6
– Electronics Service &Training Centre (ESTC)
– Institute for Design ofElectrical MeasuringInstruments (IDEMI)
– Fragrance & FlavourDevelopment Centre (FFDC)
– Centre for the Developmentof Glass Industry (CDGI)
– National Small IndustriesCorporation (NSIC)
– Small Industries DevelopmentBank of India (SIDBI)
– Khadi and Village IndustriesCorporation (KVIC)
– Training Institutes
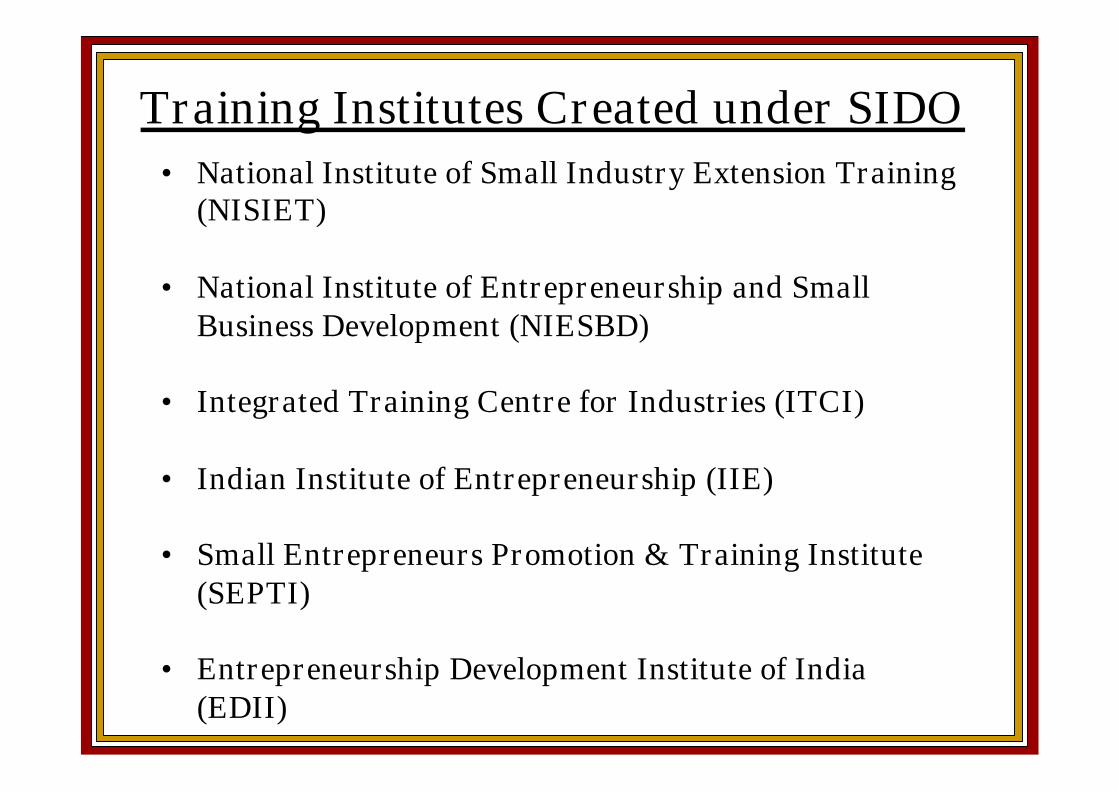
Training Institutes Created under SIDO• National Institute of Small Industry Extension Training
(NISIET)
• National Institute of Entrepreneurship and SmallBusiness Development (NIESBD)
• Integrated Training Centre for Industries (ITCI)
• Indian Institute of Entrepreneurship (IIE)
• Small Entrepreneurs Promotion & Training Institute(SEPTI)
• Entrepreneurship Development Institute of India(EDII)
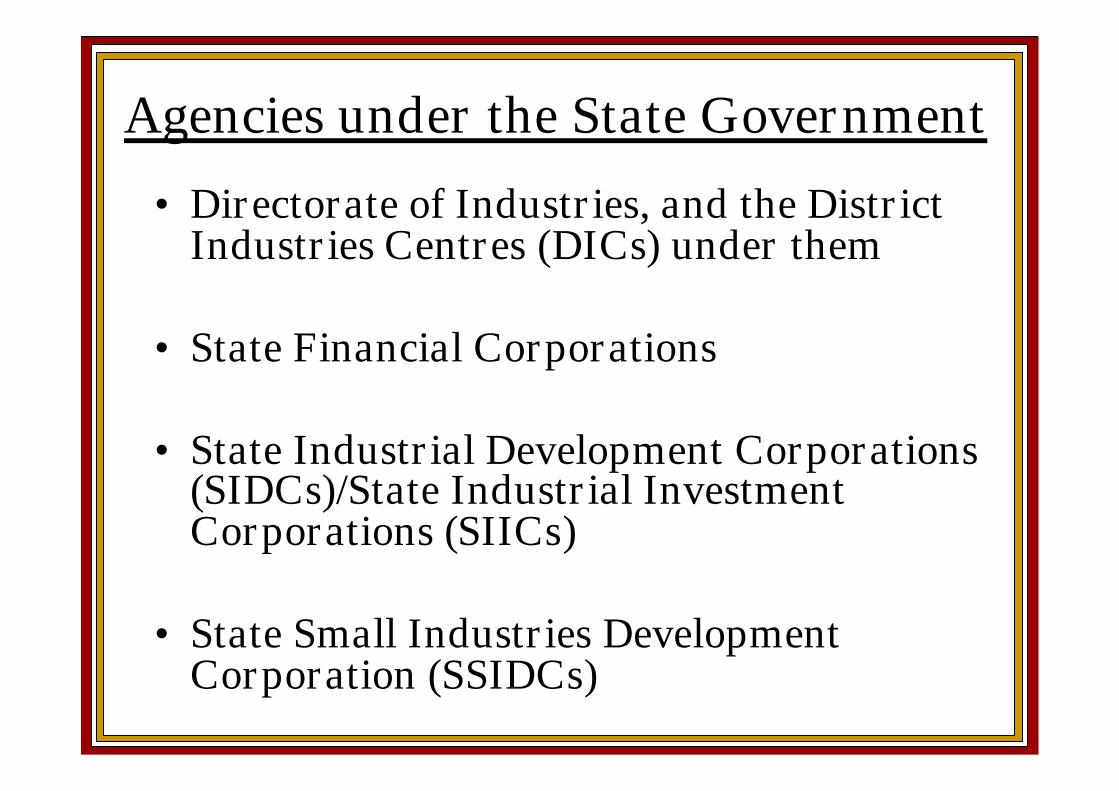
• Directorate of Industries, and the DistrictIndustries Centres (DICs) under them
• State Financial Corporations
• State Industrial Development Corporations(SIDCs)/State Industrial InvestmentCorporations (SIICs)
• State Small Industries DevelopmentCorporation (SSIDCs)
Agencies under the State Government
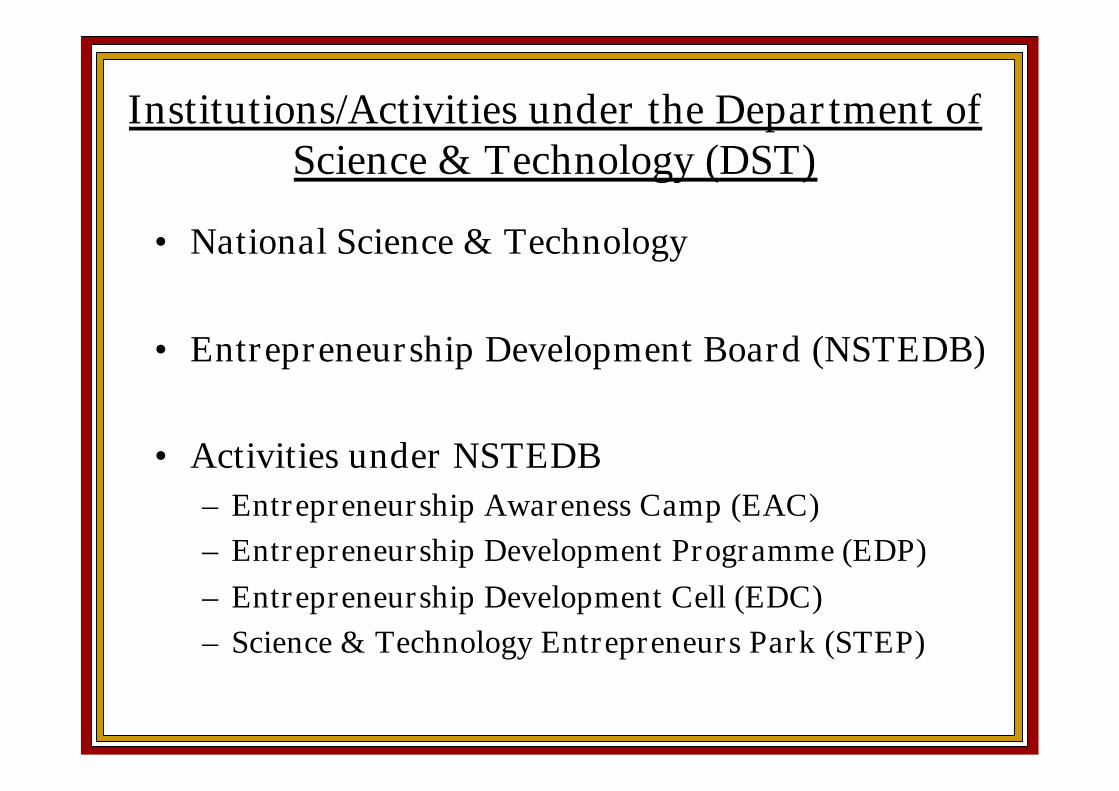
• National Science & Technology
• Entrepreneurship Development Board (NSTEDB)
• Activities under NSTEDB– Entrepreneurship Awareness Camp (EAC)– Entrepreneurship Development Programme (EDP)– Entrepreneurship Development Cell (EDC)– Science & Technology Entrepreneurs Park (STEP)
Institutions/Activities under the Department ofScience & Technology (DST)
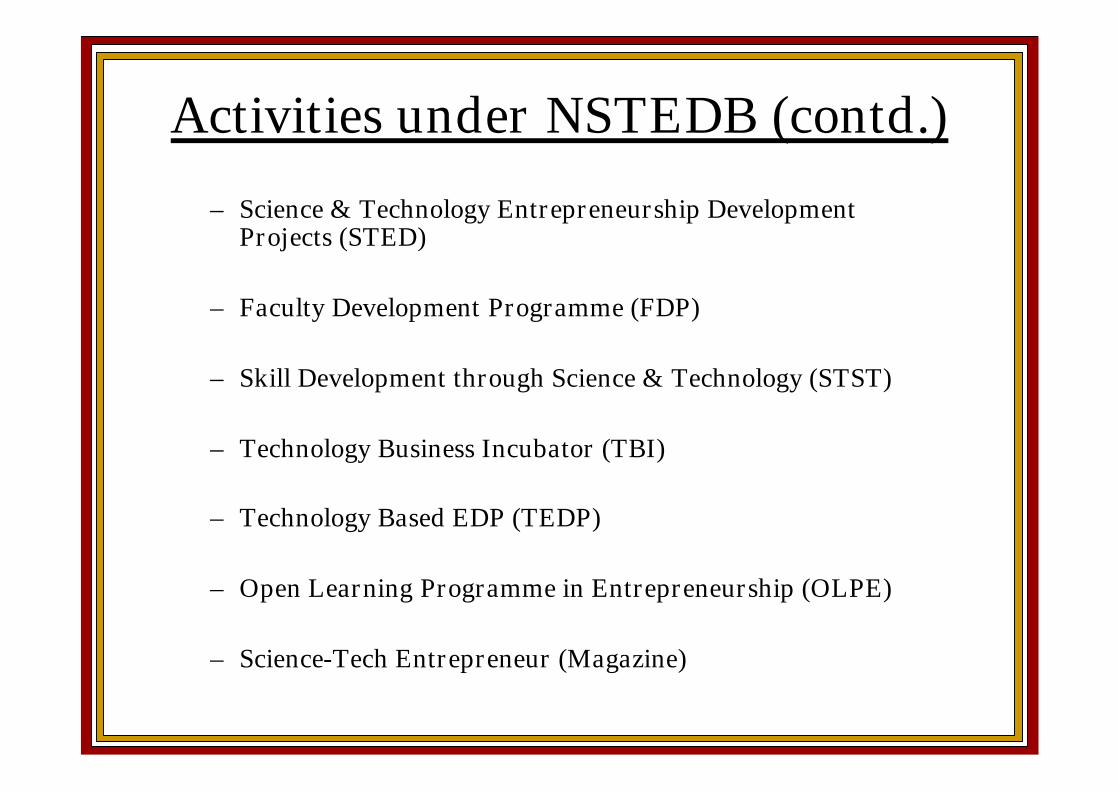
– Science & Technology Entrepreneurship DevelopmentProjects (STED)
– Faculty Development Programme (FDP)
– Skill Development through Science & Technology (STST)
– Technology Business Incubator (TBI)
– Technology Based EDP (TEDP)
– Open Learning Programme in Entrepreneurship (OLPE)
– Science-Tech Entrepreneur (Magazine)
Activities under NSTEDB (contd.)
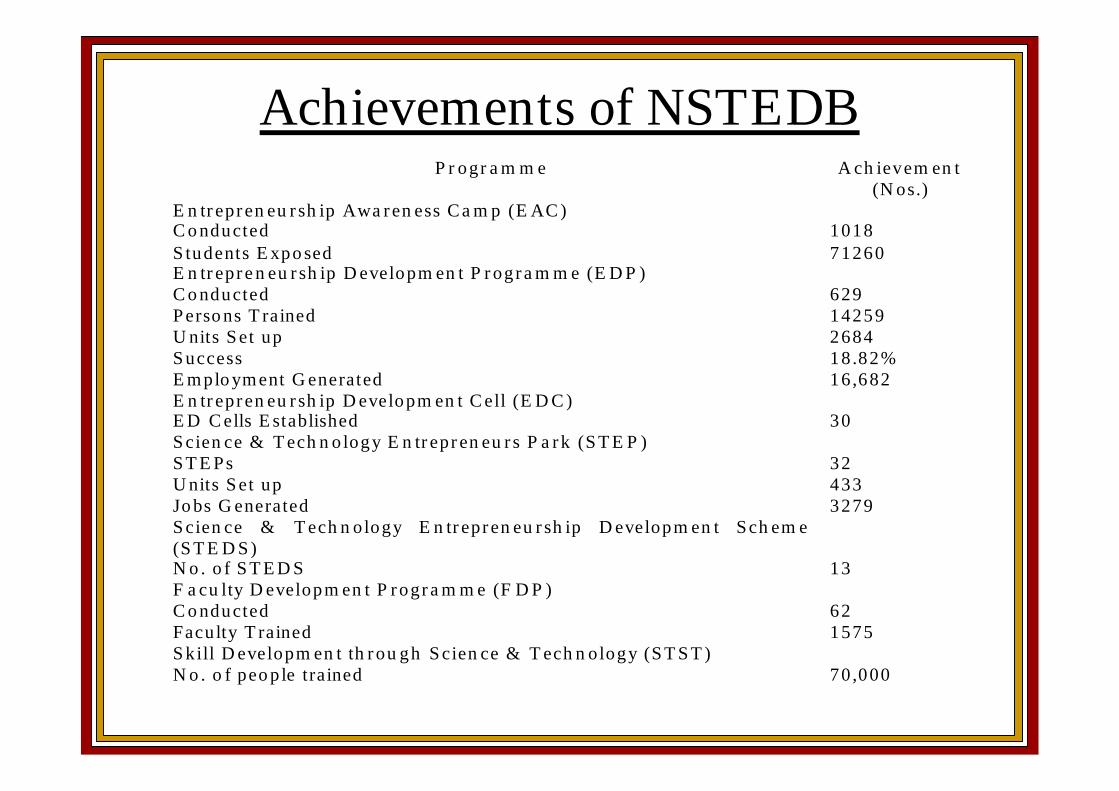
Achievements of NSTEDBProgram m e A ch ievem en t
(N os.)E n trepren eu rsh ip A w aren ess C am p (E A C )C o nductedS tudents E xpo sed
101871260
E n trepre n eu rsh ip D evelopm en t P rogram m e (E D P )C o nductedP erso ns T rainedU nits S et upS uccessE m plo ym ent G enerated
62914259268418.82%16,682
E n trepren eu rsh ip D evelopm en t C ell (E D C )E D C ells E stablished 30S cien ce & T ech nology E n trepren eu rs P ark (S T E P )S T E PsU nits S et upJo bs G enerated
324333279
S cien ce & T ech n ology E n trepren eu rsh ip D evelopm en t Sch em e(S T E D S )N o . o f S T E D S 13F acu lty D evelopm en t P rogram m e (F D P )C o nductedFaculty T rained
621575
S kill D evelopm en t th rou gh S cien ce & T echn ology (S T S T )N o . o f peo p le trained 70,000
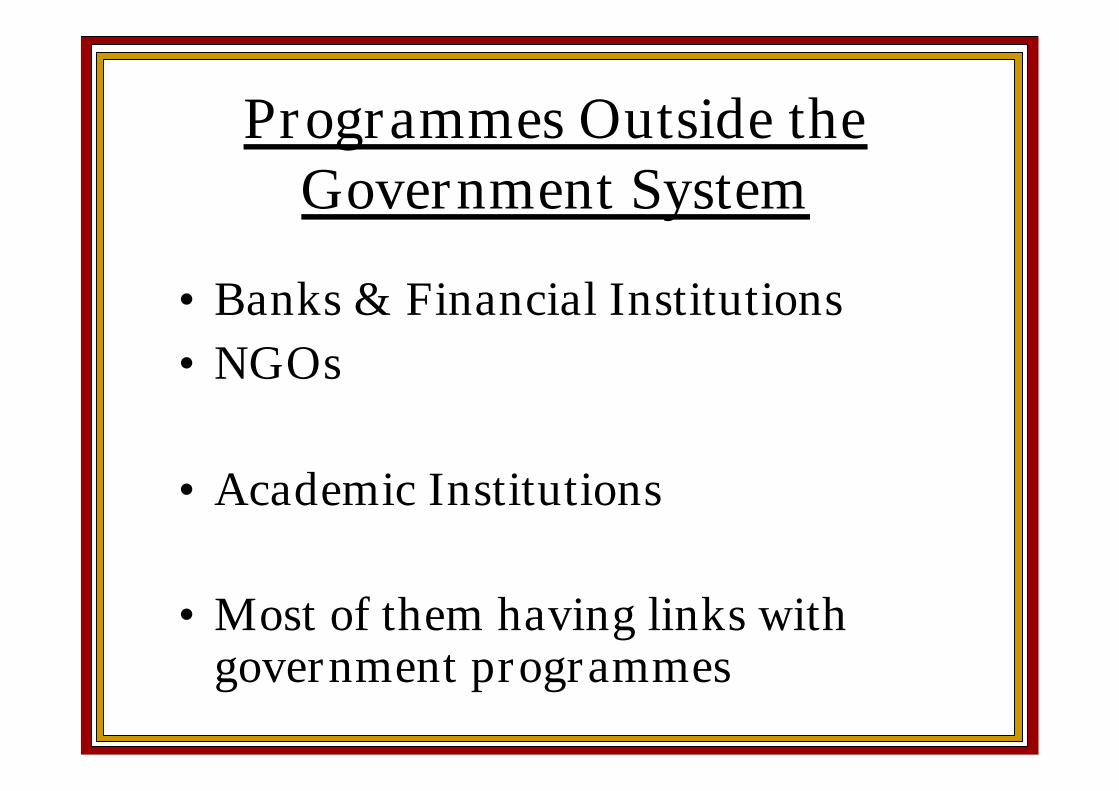
• Banks & Financial Institutions• NGOs
• Academic Institutions
• Most of them having links withgovernment programmes
Programmes Outside theGovernment System
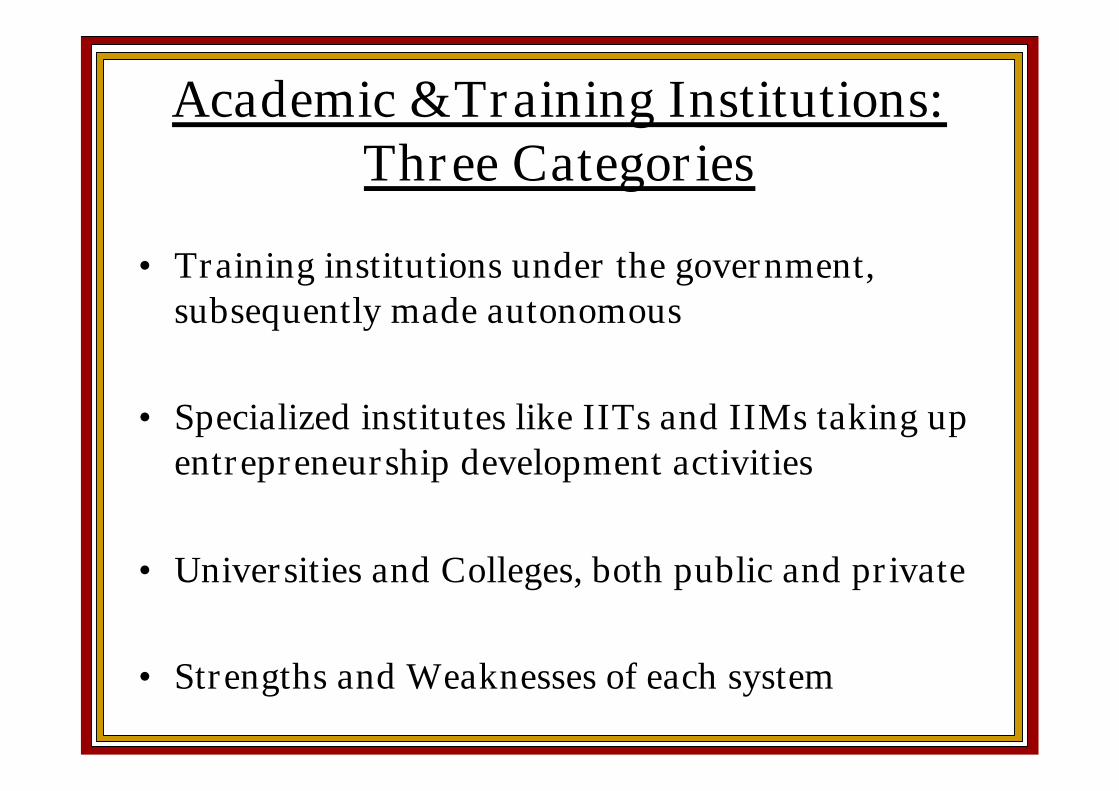
• Training institutions under the government,subsequently made autonomous
• Specialized institutes like IITs and IIMs taking upentrepreneurship development activities
• Universities and Colleges, both public and private
• Strengths and Weaknesses of each system
Academic &Training Institutions:Three Categories
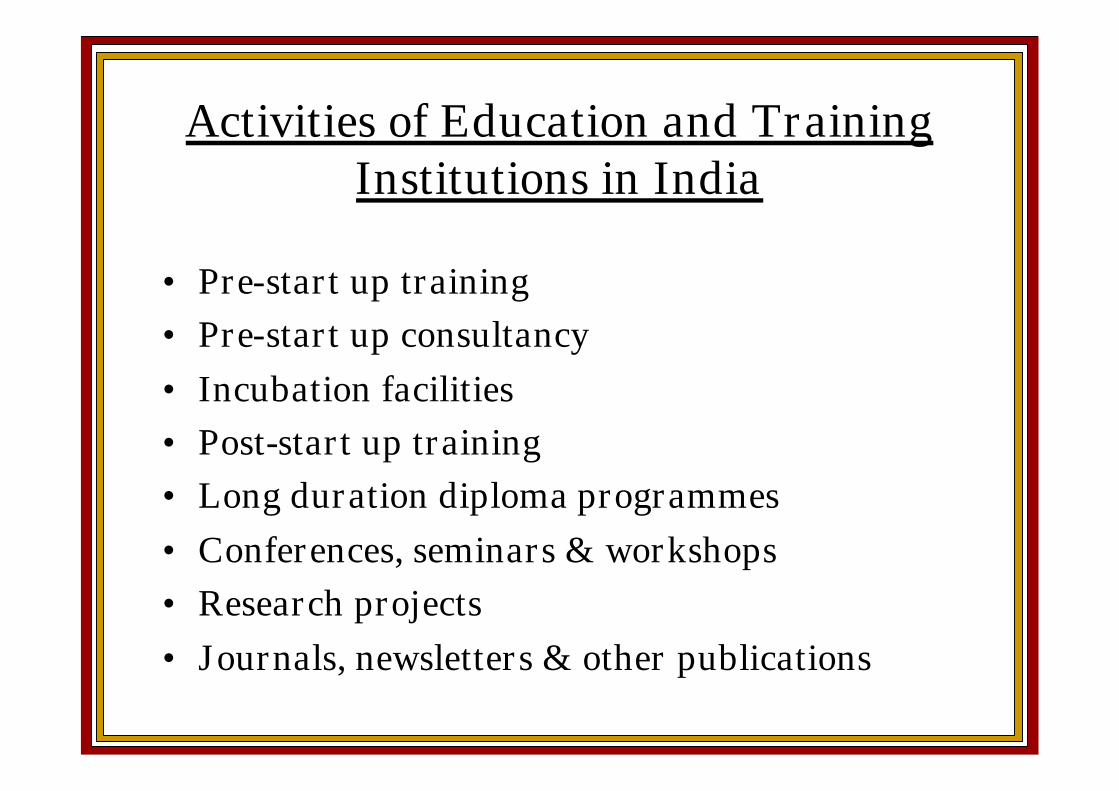
Activities of Education and TrainingInstitutions in India
• Pre-start up training• Pre-start up consultancy• Incubation facilities• Post-start up training• Long duration diploma programmes• Conferences, seminars & workshops• Research projects• Journals, newsletters & other publications
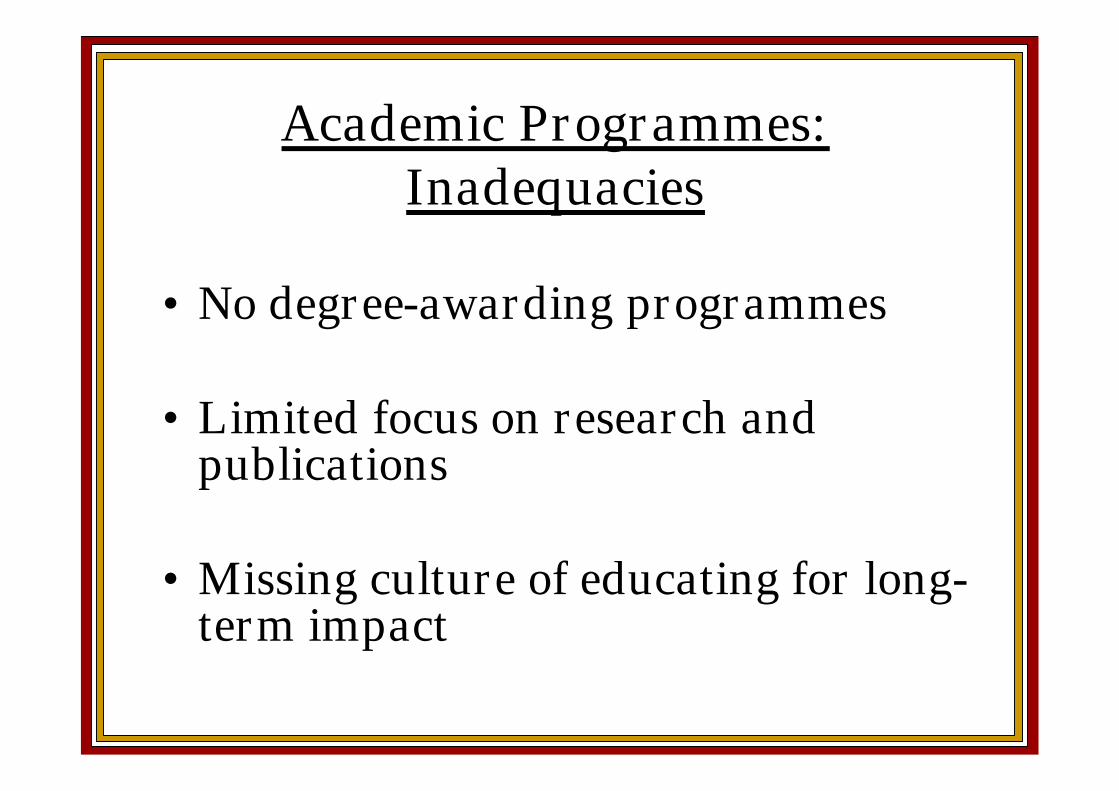
• No degree-awarding programmes
• Limited focus on research andpublications
• Missing culture of educating for long-term impact
Academic Programmes:Inadequacies
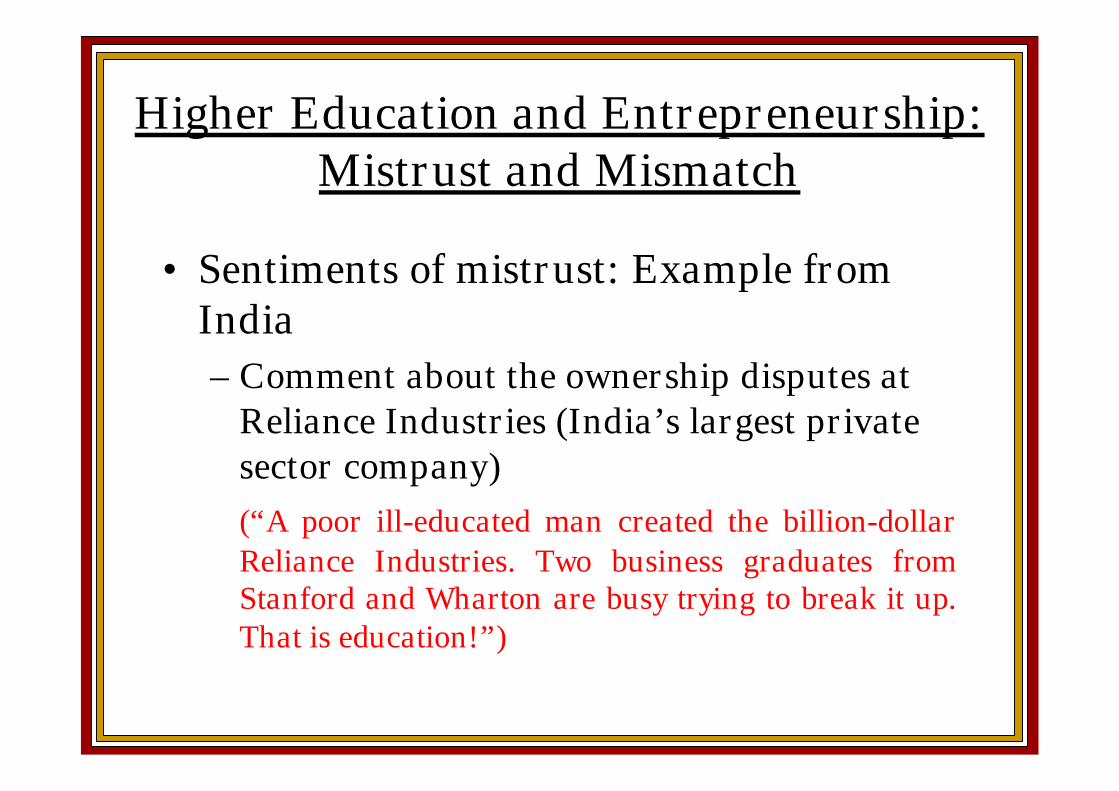
• Sentiments of mistrust: Example fromIndia– Comment about the ownership disputes at
Reliance Industries (India’s largest privatesector company)(“A poor ill-educated man created the billion-dollarReliance Industries. Two business graduates fromStanford and Wharton are busy trying to break it up.That is education!”)
Higher Education and Entrepreneurship:Mistrust and Mismatch
SME Training Survey
Some Findings
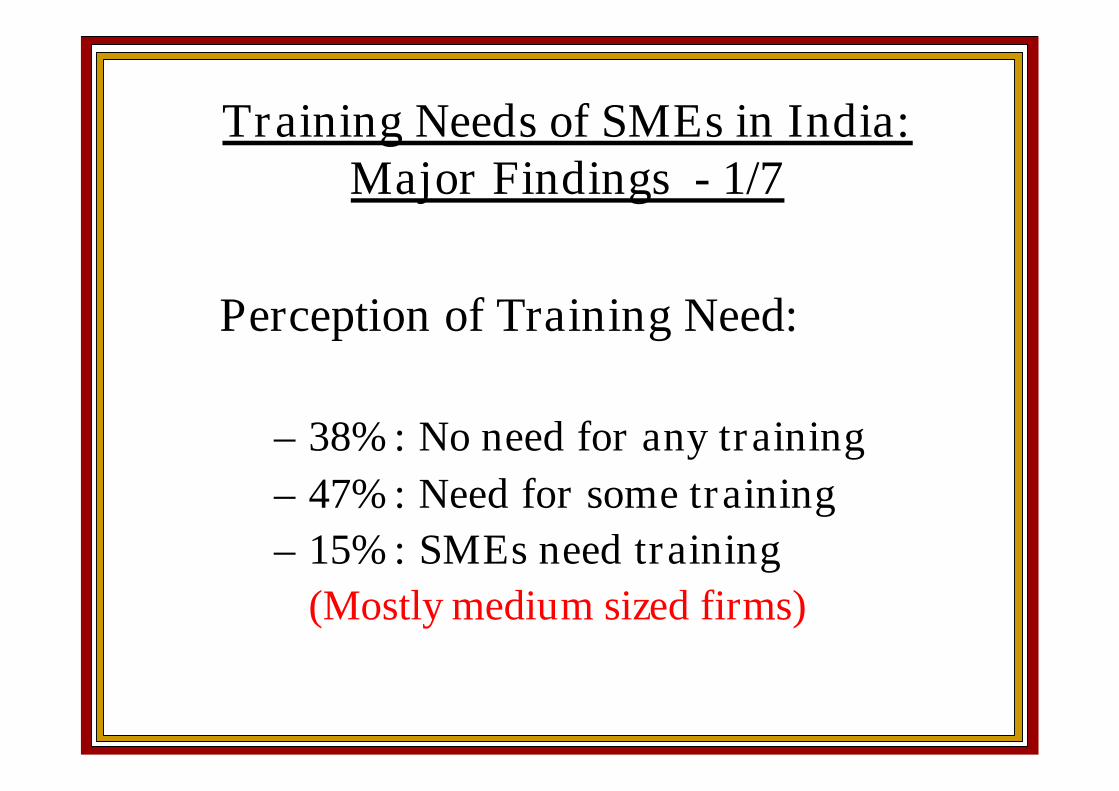
Training Needs of SMEs in India:Major Findings - 1/7
Perception of Training Need:
– 38%: No need for any training– 47%: Need for some training– 15%: SMEs need training
(Mostly medium sized firms)
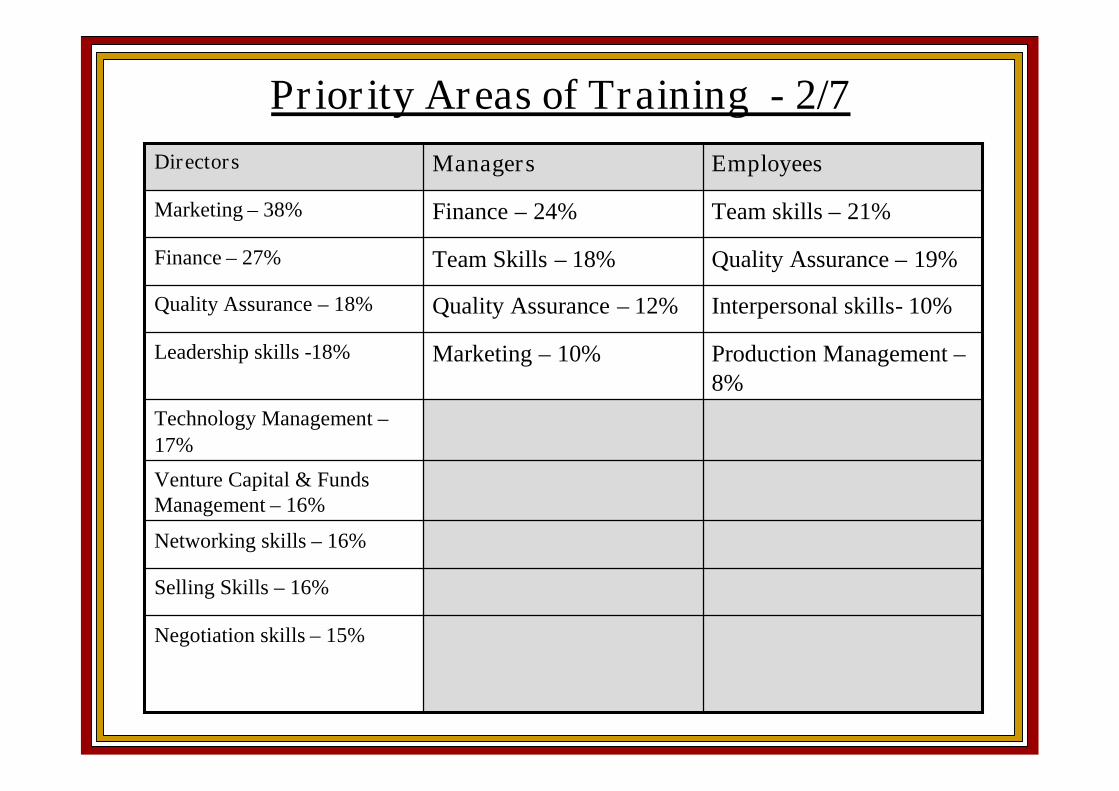
Priority Areas of Training - 2/7
Negotiation skills – 15%
Selling Skills – 16%
Networking skills – 16%
Venture Capital & FundsManagement – 16%
Technology Management –17%
Production Management –8%
Marketing – 10%Leadership skills -18%
Interpersonal skills- 10%Quality Assurance – 12%Quality Assurance – 18%
Quality Assurance – 19%Team Skills – 18%Finance – 27%
Team skills – 21%Finance – 24%Marketing – 38%
EmployeesManagersDirectors
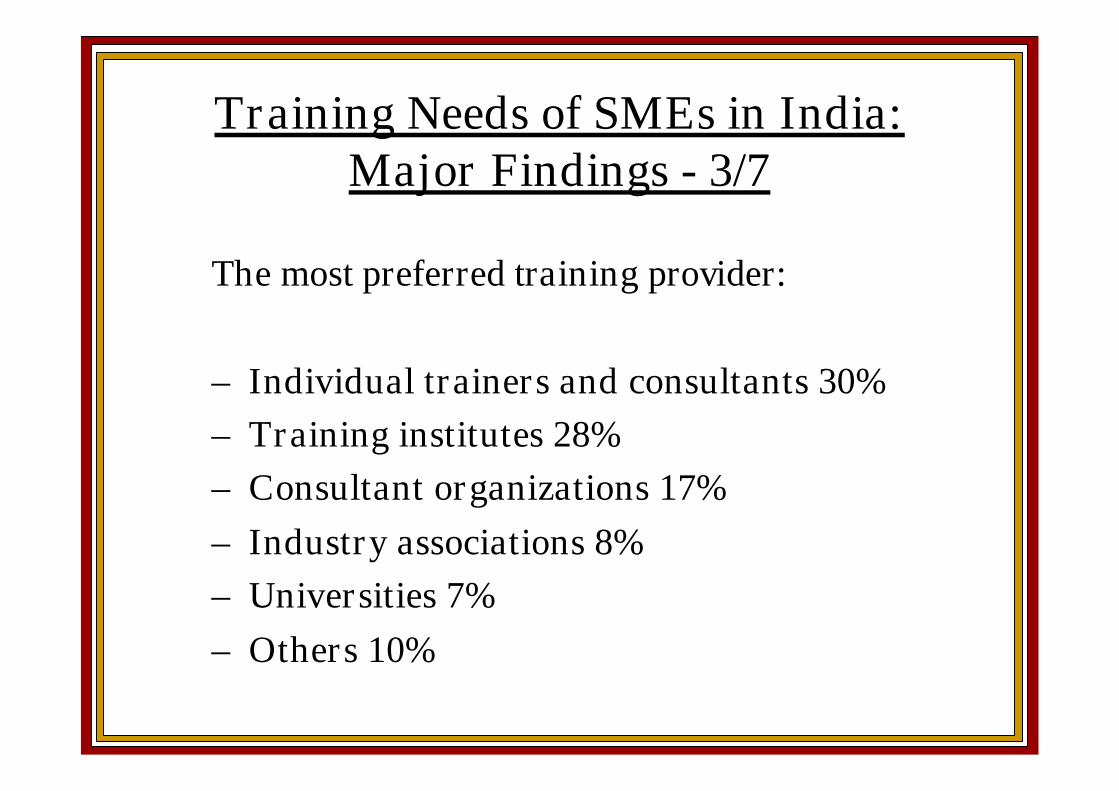
The most preferred training provider:
– Individual trainers and consultants 30%– Training institutes 28%– Consultant organizations 17%– Industry associations 8%– Universities 7%– Others 10%
Training Needs of SMEs in India:Major Findings - 3/7
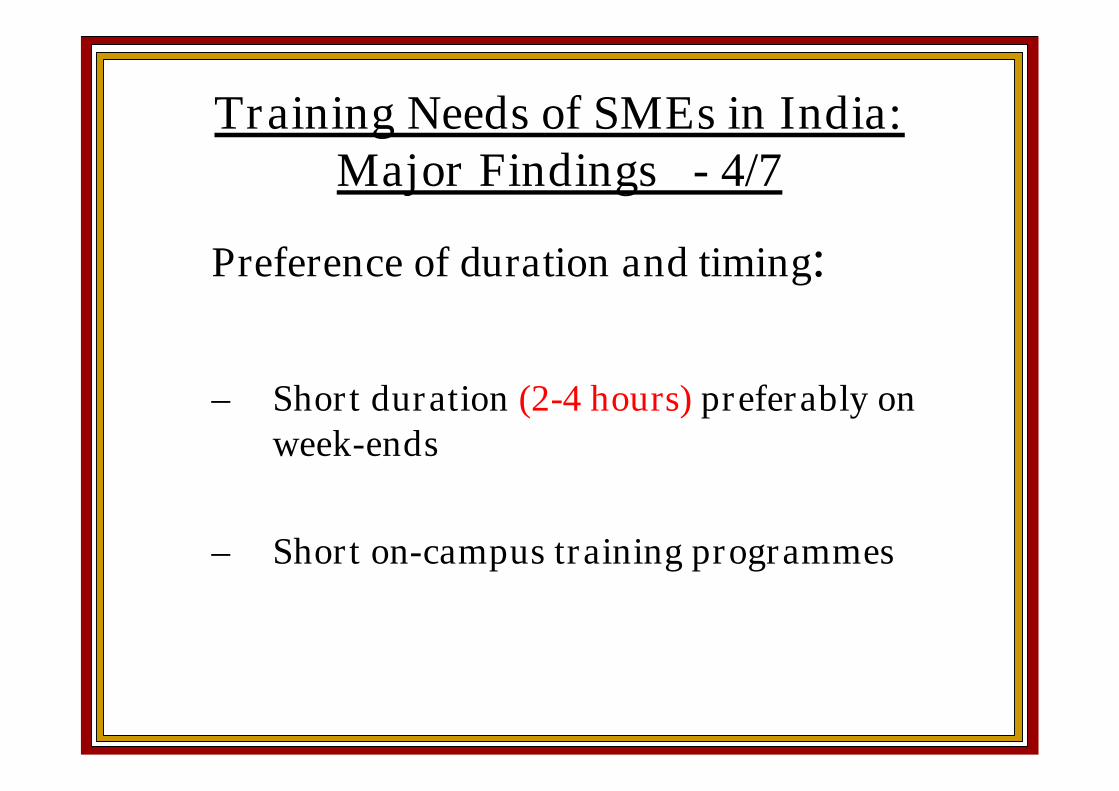
Preference of duration and timing:
– Short duration (2-4 hours) preferably onweek-ends
– Short on-campus training programmes
Training Needs of SMEs in India:Major Findings - 4/7
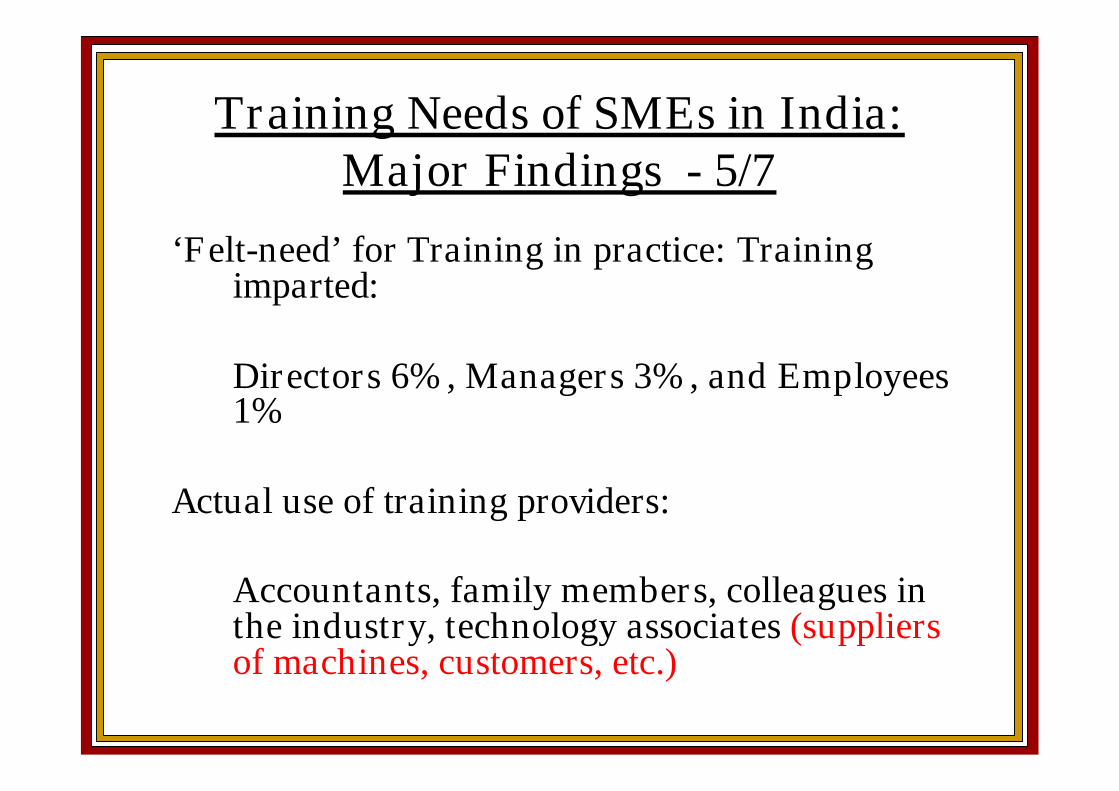
‘Felt-need’ for Training in practice: Trainingimparted:
Directors 6%, Managers 3%, and Employees1%
Actual use of training providers:
Accountants, family members, colleagues inthe industry, technology associates (suppliersof machines, customers, etc.)
Training Needs of SMEs in India:Major Findings - 5/7
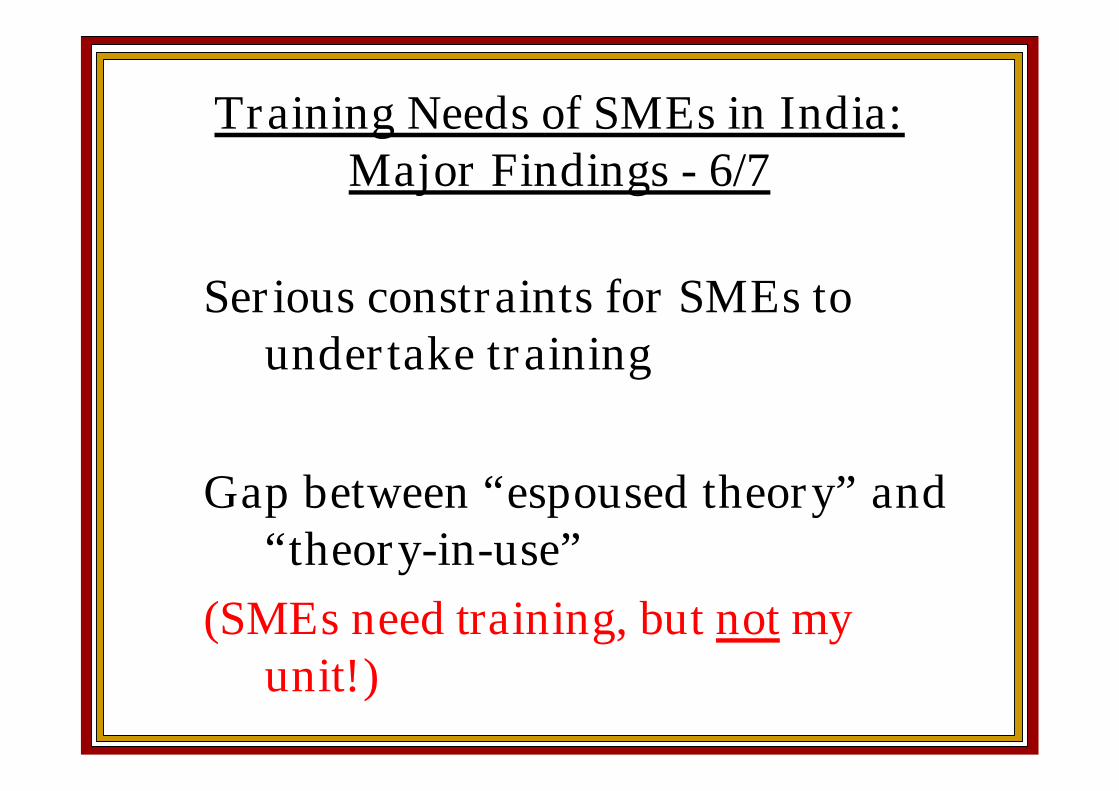
Serious constraints for SMEs toundertake training
Gap between “espoused theory” and“theory-in-use”
(SMEs need training, but not myunit!)
Training Needs of SMEs in India:Major Findings - 6/7
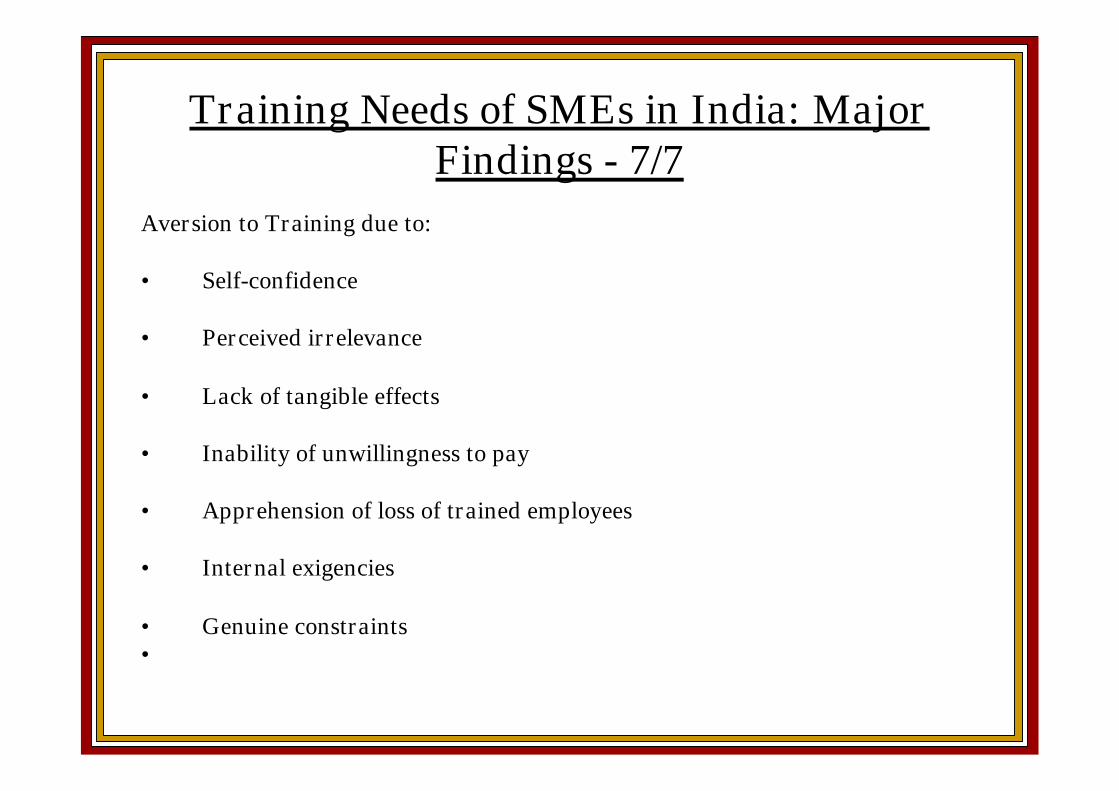
Aversion to Training due to:
• Self-confidence
• Perceived irrelevance
• Lack of tangible effects
• Inability of unwillingness to pay
• Apprehension of loss of trained employees
• Internal exigencies
• Genuine constraints•
Training Needs of SMEs in India: MajorFindings - 7/7
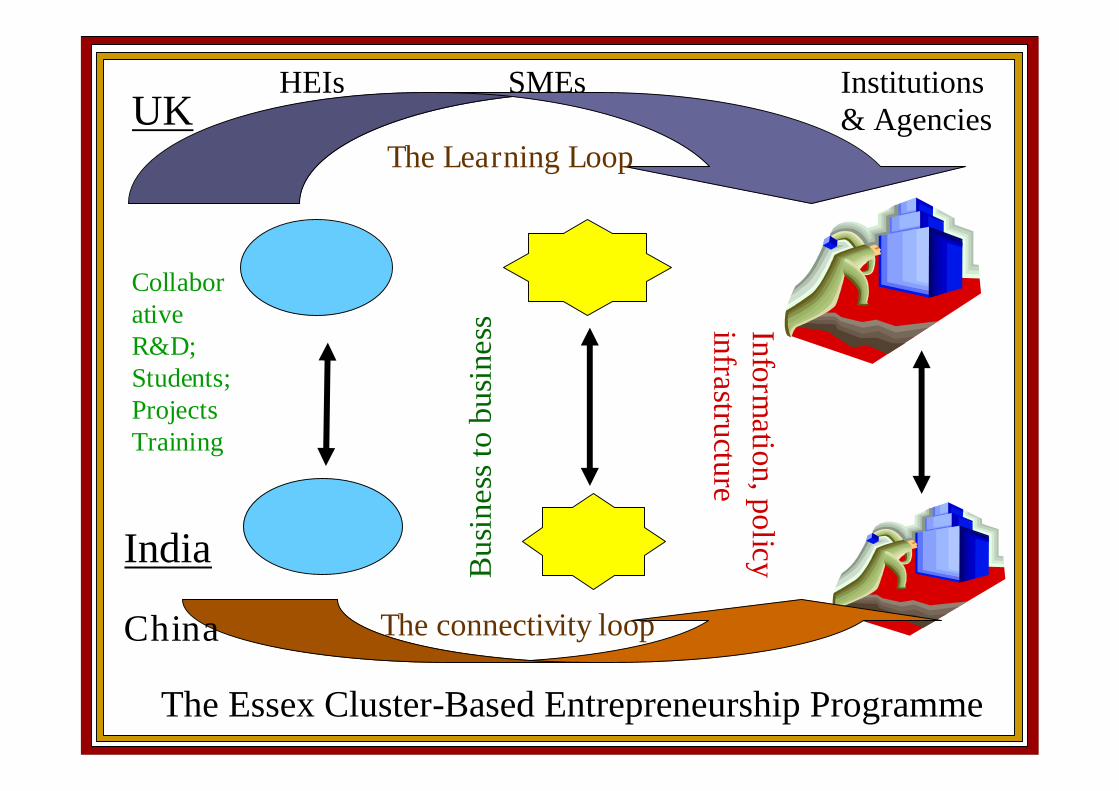
UK
India
HEIs SMEs Institutions& Agencies
Bus
ines
sto
busi
ness
CollaborativeR&D;Students;ProjectsTraining
Information,policy
infrastructure
The Learning Loop
The connectivity loopChina
The Essex Cluster-Based Entrepreneurship Programme
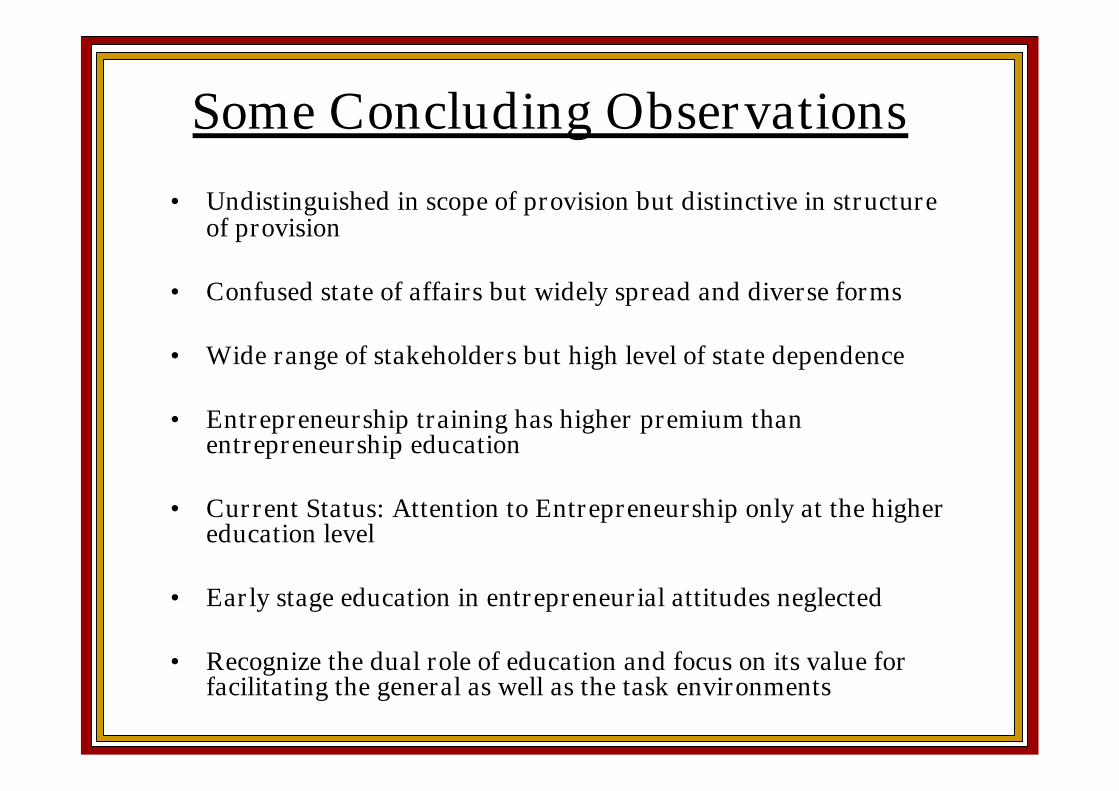
Some Concluding Observations
• Undistinguished in scope of provision but distinctive in structureof provision
• Confused state of affairs but widely spread and diverse forms
• Wide range of stakeholders but high level of state dependence
• Entrepreneurship training has higher premium thanentrepreneurship education
• Current Status: Attention to Entrepreneurship only at the highereducation level
• Early stage education in entrepreneurial attitudes neglected
• Recognize the dual role of education and focus on its value forfacilitating the general as well as the task environments
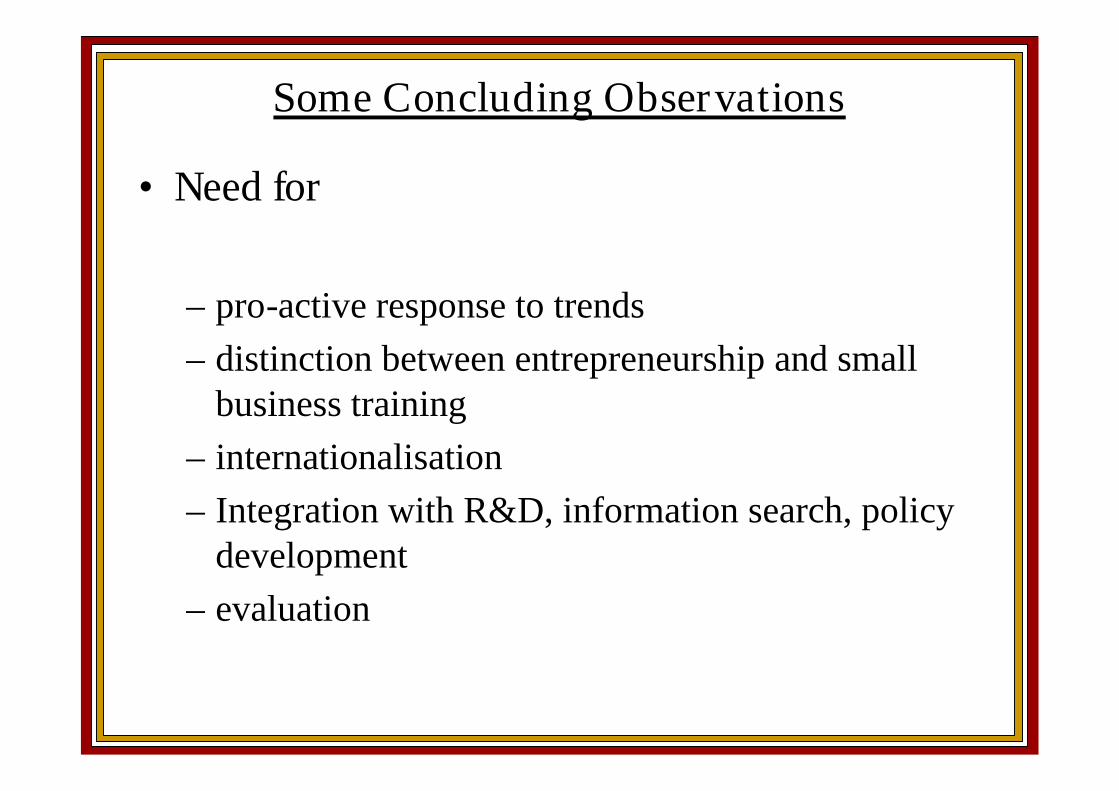
Some Concluding Observations
• Need for
– pro-active response to trends– distinction between entrepreneurship and small
business training– internationalisation– Integration with R&D, information search, policy
development– evaluation
Contacts• Professor Jay Mitra• Head of School of
Entrepreneurship and Business• University of Essex• Princess Caroline House• 1 High Street• Southend-on-Sea• Essex SS1 1JE• UK
• Tel: +44(0) 1702 238649• Fax: +44 (0) 1702 238659• E-mail: [email protected]
• Professor Mathew J Manimala• Professor of OBand Jamuna
Raghavan Chair ofEntrepreneurship
• Indian Institute of Management,• Bannerghatta Road Bangalore-76• India
• Tel: +91-80-26993107• Fax: +91-80-26584050• Email: [email protected]•