Embed Size (px)
Citation preview
Entrepreneurship, culture, and the epigenetic revolution:a research note
Zoltan Acs & Emma Lappi
Accepted: 5 July 2019# The Author(s) 2019
Abstract We show how the type of alcohol consumedis related to the type of entrepreneurship present foreconomies in Europe. We differentiate between beer-,wine-, and spirit-drinking countries and distinguish be-tween productive, unproductive, and destructive entre-preneurship. The underlying links do not emerge fromdrinking per se but rather the drinking habits and tastefor beverage types capture deep cultural features andcultural similarities amongst the countries. Societies thatprefer to drink beer are closer to each other culturallythan those which prefer drinking wine or spirits. There-fore, the taste for alcohol type is merely an instrument inexplaining cultural and institutional differences acrossentrepreneurship. Broadly speaking, beer-drinkingcountries are characterized by higher shares of produc-tive entrepreneurship, wine-drinking countries with un-productive entrepreneurship, and spirit-drinking coun-tries with destructive entrepreneurship. We discussmechanisms in which the results are found and highlighta new research agenda, emphasizing the potential role ofepigenetics.
Keywords Entrepreneurship . Informal institutions .
Culture . Europe . Epigenetics
JEL classification E02 . E14 . L26 . O52 . Z10
1 Introduction
Baumol (1990) contributed to the body of entrepreneur-ship literature by differentiating between three entrepre-neurship types; productive, unproductive, and destruc-tive entrepreneurship. The productive entrepreneurshipincludes activities that are wealth creating, unproductivecovers activities that merely re-distribute existing rents,and destructive one destroys economic rents and wealth.His thesis largely is a product of Schumpeter’s (1934)idea that the long-run growth of an economy is depen-dent on its ability to exploit innovations. Baumol theo-rized that across countries, the total supply of entrepre-neurs can vary but the productive contribution of thevarious types of entrepreneurial activities varies even
https://doi.org/10.1007/s11187-019-00230-0
Electronic supplementary material The online version of thisarticle (https://doi.org/10.1007/s11187-019-00230-0) containssupplementary material, which is available to authorized users.
Z. Acs (*)George Mason University, 3351 Fairfax Dr., MS 3B1, Arlington,VA 22201, USAe-mail: [email protected]
E. LappiCenter for Entrepreneurship and Spatial Economics (CEnSe),Jönköping International Business School, P.O. Box 1026, 551
11 Jönköping, Swedene-mail: [email protected]
E. LappiSwedish Entrepreneurship Forum, Grevgatan 34, 3 tr, 11453 Stockholm, Sweden
Small Bus Econ (2021) 56:1287–1307
/Published online: 14 August 2019
more, and it is the rules of the game created by institu-tions that influence the distribution of those activities ina society. The institutions refer to the quality of prevail-ing economic, political, and legal institutions whichincentivize individuals to choose where to allocate theirefforts. The prevailing economic environment also com-prises of the cultural climate which takes part in deter-mining the distribution of the individuals’ efforts andthus the type of entrepreneurship present in an economy,and this is where our paper provides a contribution.
What we know up to this day about entrepreneurshipis plenty. We have research showing that entrepreneur-ship is linked to economic growth through innovations,employment, and productivity (Hopenhayn 1992;Wennekers and Thurik 1999). It has also been proposedthat the relative stability of the differences in entrepre-neurial activity across countries suggests that other fac-tors, such as culture, drive the difference (Grilo andThurik 2005; Blanchflower 2000). Much on the earlierresearch focuses on determining the economy-wide dif-ferences in the level of entrepreneurship instead of, inline with our interest, differences in the type of entrepre-neurship. The emergence of, for example, the GlobalEntrepreneurshipMonitor (GEM) data (Acs et al. 2004),has recently made possible to distinguish between op-portunity and necessity entrepreneurship which is posi-tive progress in accounting for the diverse types ofentrepreneurship, but much is still to be known on whatdetermines the allocative efficiency of different entre-preneurial activities.
Baumol himself noted, the rules of the game changeslowly, and he circumvented this by providing historicalcases on the matter. We do not use different cases acrosshistorical points in time rather than link the types ofentrepreneurship with a measurement that approximatesthe rules of the game, or cultural similarity. What weargue is that a country’s culture can be approximated bythe alcohol type they consume the most, i.e., their tastefor the alcohol type, and link this to the type of entre-preneurship found most in that economy. We group thecountries based on whether they consume the most inper capita terms beer, wine, or spirits as well as furthergroup them according to also their second choice ofbeverage. The idea of this paper is not to provide evi-dence using advanced econometric methods to squeezeout convincing causal links, since we are not arguingthat drinking beer will make you a productive entrepre-neur. What we argue is that what we measure is some-thing more fundamental; measuring culture in broad
terms as the taste for specific alcohol types is deeplyrooted in the culture and history of a given society. So, atits core, what we are measuring is not alcohol consump-tion, but rather we more fundamentally measure howinformal institutions, i.e., culture or cultural similarity, isrelated to the productivity of entrepreneurship. By doingso, we also capture potentially other common featuresthe countries have, such as regulatory, development, orother institutional similarities.
Our paper provides a contribution in focusing on adirect channel in which culture is important for eco-nomic outcomes, such as entrepreneurship. This sug-gests that culture—in a broad sense—is related to thedistribution of entrepreneurial efforts in an economy.What our results show is that in countries where themain type of alcohol consumed is beer, there is moreproductive entrepreneurship present than in othercountries. On a similar note, economies where indi-viduals mostly consume wine are dominated withunproductive entrepreneurship, and countries thatmostly consume spirits have a larger share of destruc-tive entrepreneurship. This entails that all activitiesare found in each country groups, but they are mostpredominant in countries according to the prevalentculture. The relationships hold in general when weexpand our groupings of countries to differentiatebetween first and second choices of the beveragetypes which is more refined grouping of countriesand of cultural and other institutional similarities andin addition when we look at countries across theglobe.
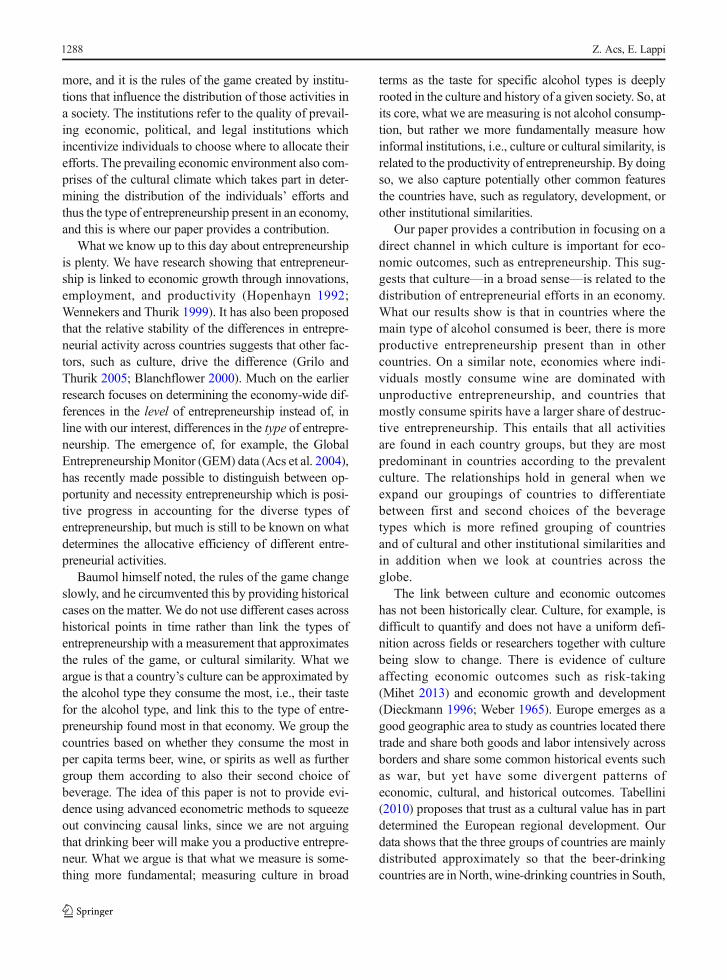
The link between culture and economic outcomeshas not been historically clear. Culture, for example, isdifficult to quantify and does not have a uniform defi-nition across fields or researchers together with culturebeing slow to change. There is evidence of cultureaffecting economic outcomes such as risk-taking(Mihet 2013) and economic growth and development(Dieckmann 1996; Weber 1965). Europe emerges as agood geographic area to study as countries located theretrade and share both goods and labor intensively acrossborders and share some common historical events suchas war, but yet have some divergent patterns ofeconomic, cultural, and historical outcomes. Tabellini(2010) proposes that trust as a cultural value has in partdetermined the European regional development. Ourdata shows that the three groups of countries are mainlydistributed approximately so that the beer-drinkingcountries are in North, wine-drinking countries in South,
Z. Acs, E. Lappi1288
and the spirit-drinking countries in East Europe (seeFig. 1 in Section 3). This entails a geographical concen-tration of cultural proximity for Europe.
Finally, we provide a discussion in which we providealternative micro-mechanisms which might be drivingour results and provide a fruitful research agenda whereresearch is scant and future research effort should putemphasis on. We discuss the relationship between insti-tutions and culture, then go into the genome-wide evi-dence on entrepreneurship and lastly introduce albeit notdirectly test that epigenetics being the underlying mech-anism in how culture affects entrepreneurship. We pro-pose that institutions, culture, and genetics are all linkedthrough epigenetics, a scientific field which has gainedincreasing attention by biologists, medicine, and thelikes in the recent decade, and suggest that we needmore evidence on how the environment changes howthe genes are expressed which has implications forentrepreneurship and growth (Carey 2012).1
2 Background and literature
Baumol (1990) theorizes that entrepreneurship is pres-ent, in one form or another, at all times, and it alwaysplays a role in an economy. He defines productiveentrepreneurship as a set of entrepreneurial activitiesthat create economic value such as innovative actions.On the other hand, unproductive entrepreneurship in-cludes activities which merely redistribute alreadyexisting rents, such as tax evasion and other redistribu-tive activities, and destructive entrepreneurship as “dis-covery of a previously unused legal gambit that is ef-fective in diverting rents to those who are first inexploiting it.” (Baumol 1990, p. 897). Those includeactivities which destroy economic value, such as crimeand terrorism. One plausible way for an entrepreneur todestroy inputs is through gaining political power andtherefore influencing institutions (Desai et al. 2013).Ever recently, in line with our interest, there has been agrowing interest in explaining and investigating theallocation of entrepreneurship (Bowen and De Clercq2008; Sobel 2008; Weitzel et al. 2010). However, manyhave concentrated on the differentiation between pro-ductive and unproductive entrepreneurship and neglectthe destructive one, with exceptions such as, e.g., Desai
et al. (2013), who propose a theoretical model on de-structive entrepreneurship.
It is important and interesting to look at Baumol’sdistinction of the three types of entrepreneurship asentrepreneurship is a complex phenomenon. Productiveentrepreneurship is mostly predominant in the countriesclosest to the technological frontier, and thus, if onlylooking at these countries, it might be sufficient to focussolely on this type of entrepreneurship. However, forquestions interested in explaining the development gapof countries and understanding why countries grow, thedistinction of the entrepreneurship types is vastlyimportant as the different entrepreneurship types canpossibly be attributed at least partly to explain growth,or the lack of it; for example, Huggins and Thompson(2014) propose that the link between culture and devel-opment is mediated by entrepreneurship. This is also thereason fundamentally why understanding the allocationof productive activities in a society and possible reasonsfor them, such as culture, is valuable.
2.1 Informal institutions and entrepreneurship
The notion that institutions incentivize and support hu-man behavior has been widely researched in the past(Acemoglu and Robinson 2012; North 1990; Hall andJones 1999). The rules of the game change both acrosstime and differ across countries. The rules of the gamepresent in a society comprise both of formal and infor-mal institutions in which we focus on the informalinstitutions, namely, culture.2 However, culture as aterm does not have a universal definition. Inglehart(1997) defines culture as the set of basic common valueswhich contributes to shaping people’s behavior in asociety. A complementary definition by Guiso et al.(2006) states that culture includes those customary be-liefs and values that ethnic, religious, and social groupstransmit fairly unchanged from generation to genera-tion. This implies that culture is slow to change(Roland 2004).3 Economists (and other researchers)have measured culture largely by utilizing survey data,looking at second-generation immigrants, and collectingexperimental evidence (Alesina and Giuliano 2015).
1 https://www.youtube.com/watch?v=kp1bZEUgqVI
2 This is given we take North (1990) definition of formal and informalinstitutions. As written previously, we also however possibly alsocapture some similarities in the formal institutions.3 See Alesina and Giuliano (2015) for a deep discussion on theoreticaland empirical definitions of culture.
Entrepreneurship, culture, and the epigenetic revolution: a research note 1289
In general, institutions impacting entrepreneurshiphas been recognized by quite some time now (Parker2009; Davidsson and Henrekson 2002; Blau 1987).Much of this line of research focuses on tax incentivesor different labor market polices and their relation toentrepreneurship. However, Wennekers et al. (2002)argue that the cross-country variations in the level ofentrepreneurship are the result of differences ininstitutional and that of cultural components. On theother hand, Elert and Henrekson (2017) andHenrekson and Sanandaji (2010) argue that entrepre-neurship is also a driver for institutional change, andtherefore, the relationship between institutions and en-trepreneurship is bilateral.
There has been work explicitly focusing on the impactof culture to entrepreneurship and entrepreneurialoutcomes for quite some time now; see Hayton et al.(2002) and Cacciotti and Hayton (2017) for reviews ofthe literature. Therefore, it is not a new idea that cultureaffects entrepreneurship, For example, Chakraborty et al.(2016) present a formal model of the evolution of culture
and entrepreneurship. Frederking (2004) shows that it isthe organization of culture that is relevant for entrepreneursand their business activities. Complementarily, Hugginsand Thompson (2015) find that local social values playan important role in fostering entrepreneurial resilience.Davidsson (1995) defines two ways in which culture canaffect entrepreneurship: (i) a supportive culture would leadto social legitimation, which makes the entrepreneurialcareer more valued and socially recognized, and (ii) aculture sharing more pro-entrepreneurial values and pat-terns of thinking can lead to more individuals showingpsychological traits and attitudes consistent withentrepreneurship.
Culture and entrepreneurship have gained attention atthe regional level (e.g., Krueger et al. 2013; Davidsson1995), and there also exists cross-country evidencelinking national culture and entrepreneurship. Forexample, Freytag and Thurik (2007) show that individ-uals in post-communist countries are less likely to preferbeing self-employed. Wennekers et al. (2007) provideevidence for a large set of OECD countries and find
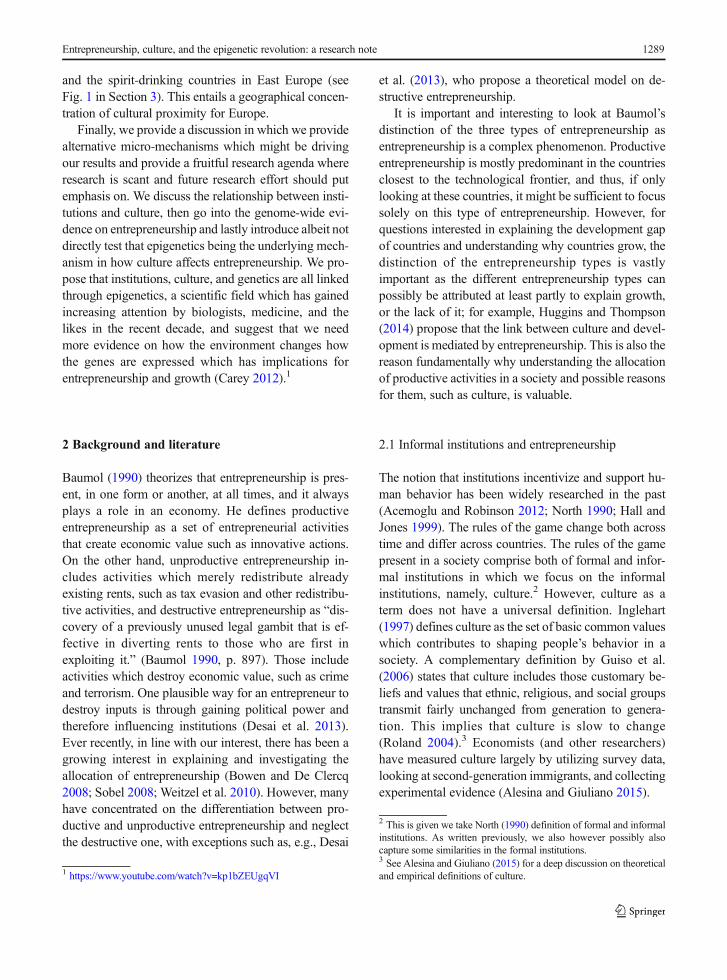
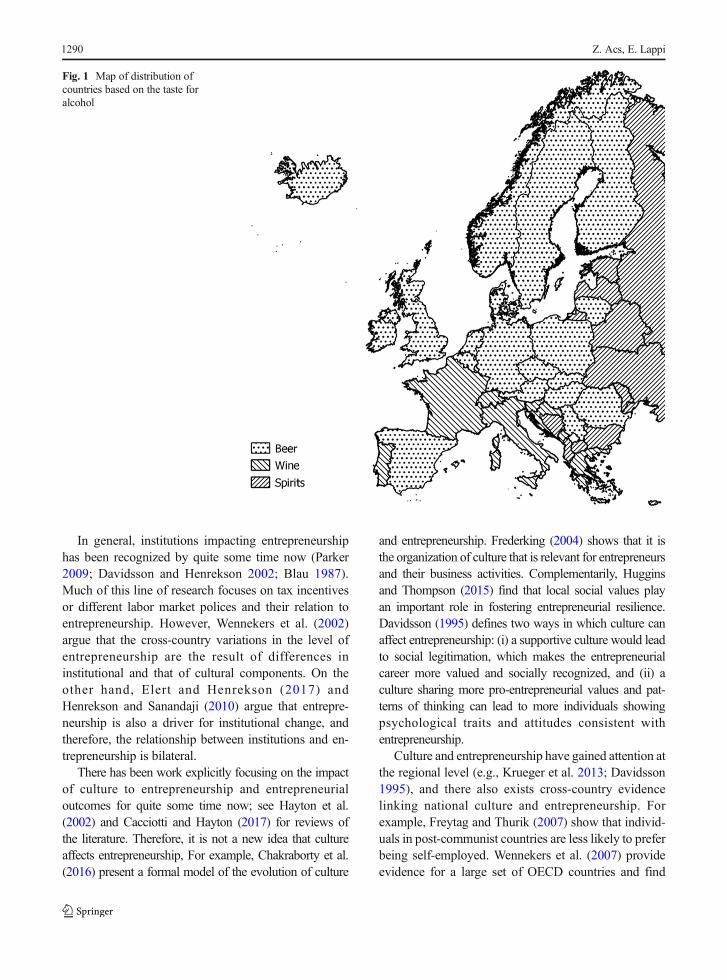
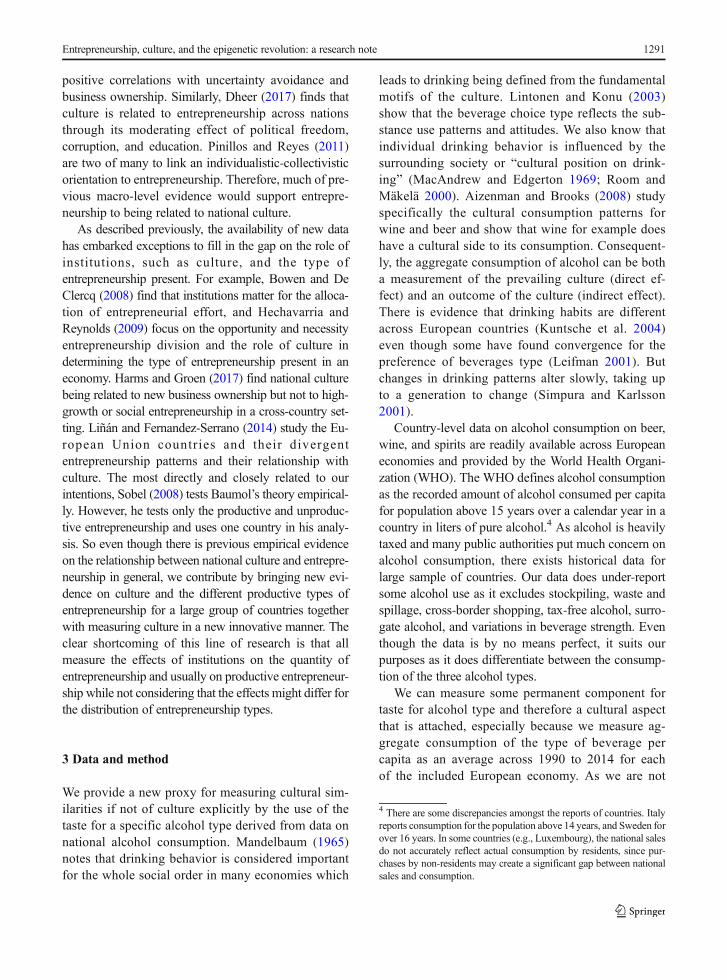
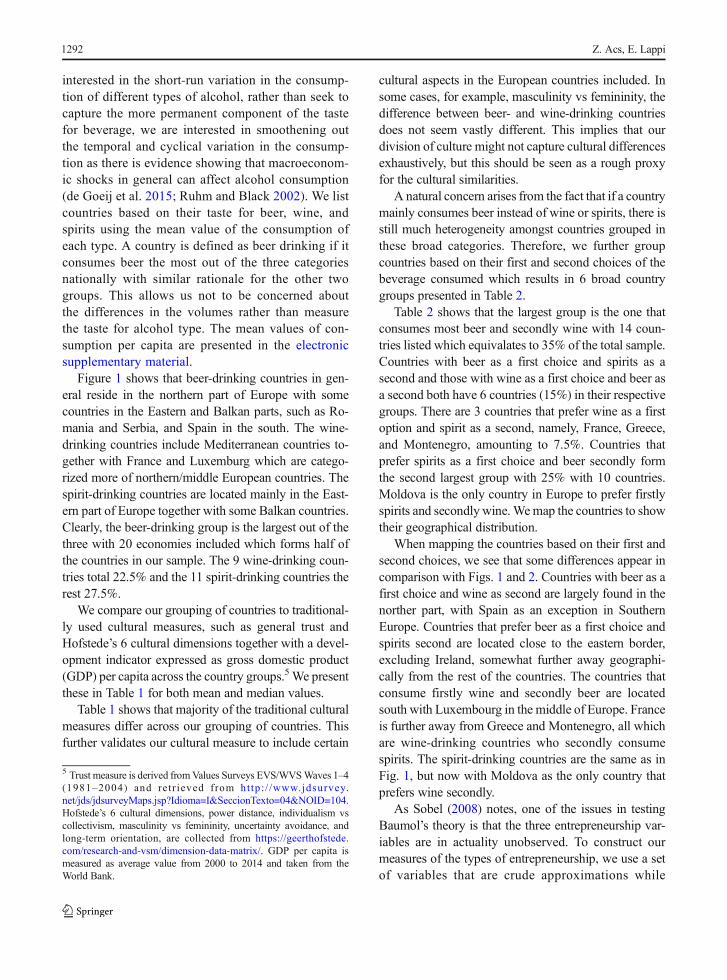
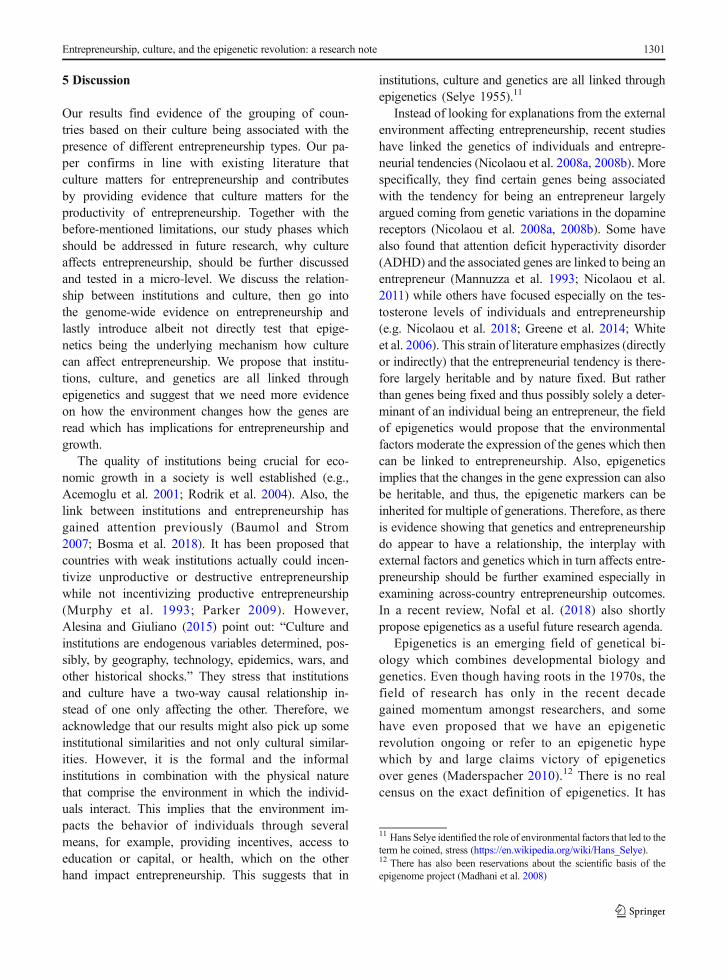
Fig. 1 Map of distribution ofcountries based on the taste foralcohol
Z. Acs, E. Lappi1290
positive correlations with uncertainty avoidance andbusiness ownership. Similarly, Dheer (2017) finds thatculture is related to entrepreneurship across nationsthrough its moderating effect of political freedom,corruption, and education. Pinillos and Reyes (2011)are two of many to link an individualistic-collectivisticorientation to entrepreneurship. Therefore, much of pre-vious macro-level evidence would support entrepre-neurship to being related to national culture.
As described previously, the availability of new datahas embarked exceptions to fill in the gap on the role ofinstitutions, such as culture, and the type ofentrepreneurship present. For example, Bowen and DeClercq (2008) find that institutions matter for the alloca-tion of entrepreneurial effort, and Hechavarria andReynolds (2009) focus on the opportunity and necessityentrepreneurship division and the role of culture indetermining the type of entrepreneurship present in aneconomy. Harms and Groen (2017) find national culturebeing related to new business ownership but not to high-growth or social entrepreneurship in a cross-country set-ting. Liñán and Fernandez-Serrano (2014) study the Eu-ropean Union countr ies and their divergententrepreneurship patterns and their relationship withculture. The most directly and closely related to ourintentions, Sobel (2008) tests Baumol’s theory empirical-ly. However, he tests only the productive and unproduc-tive entrepreneurship and uses one country in his analy-sis. So even though there is previous empirical evidenceon the relationship between national culture and entrepre-neurship in general, we contribute by bringing new evi-dence on culture and the different productive types ofentrepreneurship for a large group of countries togetherwith measuring culture in a new innovative manner. Theclear shortcoming of this line of research is that allmeasure the effects of institutions on the quantity ofentrepreneurship and usually on productive entrepreneur-ship while not considering that the effects might differ forthe distribution of entrepreneurship types.
3 Data and method
We provide a new proxy for measuring cultural sim-ilarities if not of culture explicitly by the use of thetaste for a specific alcohol type derived from data onnational alcohol consumption. Mandelbaum (1965)notes that drinking behavior is considered importantfor the whole social order in many economies which
leads to drinking being defined from the fundamentalmotifs of the culture. Lintonen and Konu (2003)show that the beverage choice type reflects the sub-stance use patterns and attitudes. We also know thatindividual drinking behavior is influenced by thesurrounding society or “cultural position on drink-ing” (MacAndrew and Edgerton 1969; Room andMäkelä 2000). Aizenman and Brooks (2008) studyspecifically the cultural consumption patterns forwine and beer and show that wine for example doeshave a cultural side to its consumption. Consequent-ly, the aggregate consumption of alcohol can be botha measurement of the prevailing culture (direct ef-fect) and an outcome of the culture (indirect effect).There is evidence that drinking habits are differentacross European countries (Kuntsche et al. 2004)even though some have found convergence for thepreference of beverages type (Leifman 2001). Butchanges in drinking patterns alter slowly, taking upto a generation to change (Simpura and Karlsson2001).
Country-level data on alcohol consumption on beer,wine, and spirits are readily available across Europeaneconomies and provided by the World Health Organi-zation (WHO). The WHO defines alcohol consumptionas the recorded amount of alcohol consumed per capitafor population above 15 years over a calendar year in acountry in liters of pure alcohol.4 As alcohol is heavilytaxed and many public authorities put much concern onalcohol consumption, there exists historical data forlarge sample of countries. Our data does under-reportsome alcohol use as it excludes stockpiling, waste andspillage, cross-border shopping, tax-free alcohol, surro-gate alcohol, and variations in beverage strength. Eventhough the data is by no means perfect, it suits ourpurposes as it does differentiate between the consump-tion of the three alcohol types.
We can measure some permanent component fortaste for alcohol type and therefore a cultural aspectthat is attached, especially because we measure ag-gregate consumption of the type of beverage percapita as an average across 1990 to 2014 for eachof the included European economy. As we are not
4 There are some discrepancies amongst the reports of countries. Italyreports consumption for the population above 14 years, and Sweden forover 16 years. In some countries (e.g., Luxembourg), the national salesdo not accurately reflect actual consumption by residents, since pur-chases by non-residents may create a significant gap between nationalsales and consumption.
Entrepreneurship, culture, and the epigenetic revolution: a research note 1291
interested in the short-run variation in the consump-tion of different types of alcohol, rather than seek tocapture the more permanent component of the tastefor beverage, we are interested in smoothening outthe temporal and cyclical variation in the consump-tion as there is evidence showing that macroeconom-ic shocks in general can affect alcohol consumption(de Goeij et al. 2015; Ruhm and Black 2002). We listcountries based on their taste for beer, wine, andspirits using the mean value of the consumption ofeach type. A country is defined as beer drinking if itconsumes beer the most out of the three categoriesnationally with similar rationale for the other twogroups. This allows us not to be concerned aboutthe differences in the volumes rather than measurethe taste for alcohol type. The mean values of con-sumption per capita are presented in the electronicsupplementary material.
Figure 1 shows that beer-drinking countries in gen-eral reside in the northern part of Europe with somecountries in the Eastern and Balkan parts, such as Ro-mania and Serbia, and Spain in the south. The wine-drinking countries include Mediterranean countries to-gether with France and Luxemburg which are catego-rized more of northern/middle European countries. Thespirit-drinking countries are located mainly in the East-ern part of Europe together with some Balkan countries.Clearly, the beer-drinking group is the largest out of thethree with 20 economies included which forms half ofthe countries in our sample. The 9 wine-drinking coun-tries total 22.5% and the 11 spirit-drinking countries therest 27.5%.
We compare our grouping of countries to traditional-ly used cultural measures, such as general trust andHofstede’s 6 cultural dimensions together with a devel-opment indicator expressed as gross domestic product(GDP) per capita across the country groups.5We presentthese in Table 1 for both mean and median values.
Table 1 shows that majority of the traditional culturalmeasures differ across our grouping of countries. Thisfurther validates our cultural measure to include certain
cultural aspects in the European countries included. Insome cases, for example, masculinity vs femininity, thedifference between beer- and wine-drinking countriesdoes not seem vastly different. This implies that ourdivision of culture might not capture cultural differencesexhaustively, but this should be seen as a rough proxyfor the cultural similarities.
A natural concern arises from the fact that if a countrymainly consumes beer instead of wine or spirits, there isstill much heterogeneity amongst countries grouped inthese broad categories. Therefore, we further groupcountries based on their first and second choices of thebeverage consumed which results in 6 broad countrygroups presented in Table 2.
Table 2 shows that the largest group is the one thatconsumes most beer and secondly wine with 14 coun-tries listed which equivalates to 35% of the total sample.Countries with beer as a first choice and spirits as asecond and those with wine as a first choice and beer asa second both have 6 countries (15%) in their respectivegroups. There are 3 countries that prefer wine as a firstoption and spirit as a second, namely, France, Greece,and Montenegro, amounting to 7.5%. Countries thatprefer spirits as a first choice and beer secondly formthe second largest group with 25% with 10 countries.Moldova is the only country in Europe to prefer firstlyspirits and secondly wine.Wemap the countries to showtheir geographical distribution.
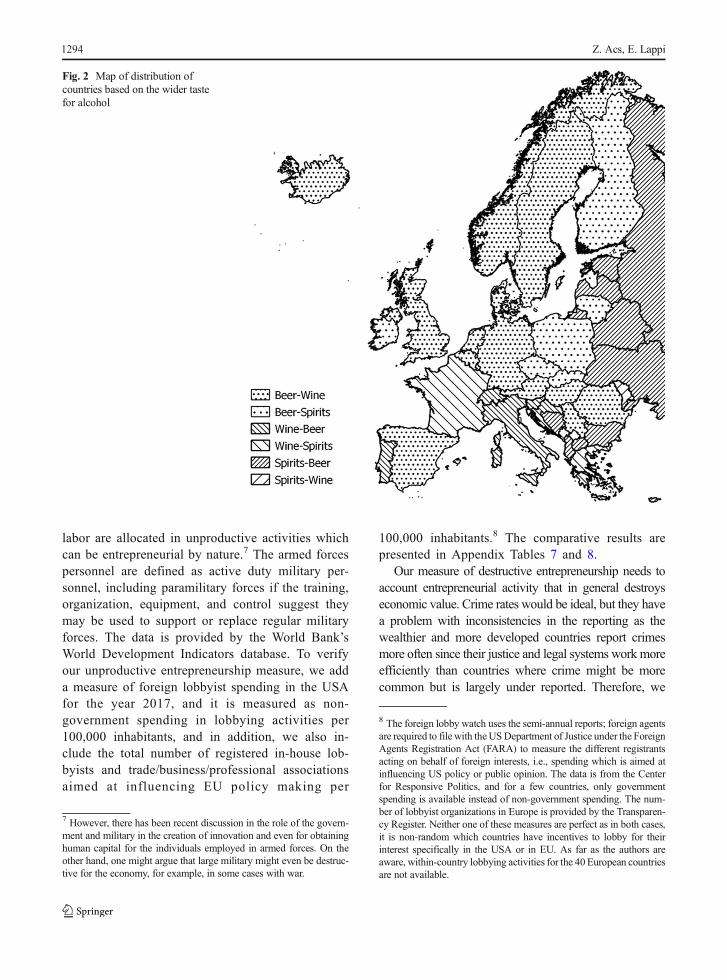
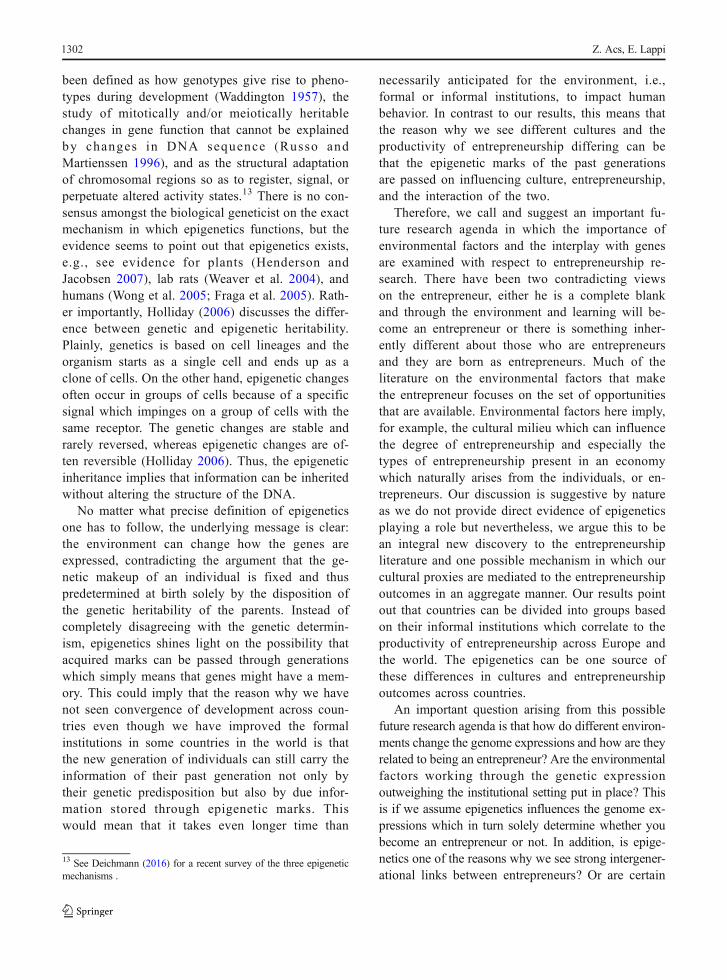
When mapping the countries based on their first andsecond choices, we see that some differences appear incomparison with Figs. 1 and 2. Countries with beer as afirst choice and wine as second are largely found in thenorther part, with Spain as an exception in SouthernEurope. Countries that prefer beer as a first choice andspirits second are located close to the eastern border,excluding Ireland, somewhat further away geographi-cally from the rest of the countries. The countries thatconsume firstly wine and secondly beer are locatedsouth with Luxembourg in the middle of Europe. Franceis further away from Greece and Montenegro, all whichare wine-drinking countries who secondly consumespirits. The spirit-drinking countries are the same as inFig. 1, but now with Moldova as the only country thatprefers wine secondly.
As Sobel (2008) notes, one of the issues in testingBaumol’s theory is that the three entrepreneurship var-iables are in actuality unobserved. To construct ourmeasures of the types of entrepreneurship, we use a setof variables that are crude approximations while
5 Trust measure is derived fromValues Surveys EVS/WVSWaves 1–4(1981–2004) and re tr ieved from http: / /www.jdsurvey.net/jds/jdsurveyMaps.jsp?Idioma=I&SeccionTexto=04&NOID=104.Hofstede’s 6 cultural dimensions, power distance, individualism vscollectivism, masculinity vs femininity, uncertainty avoidance, andlong-term orientation, are collected from https://geerthofstede.com/research-and-vsm/dimension-data-matrix/. GDP per capita ismeasured as average value from 2000 to 2014 and taken from theWorld Bank.
Z. Acs, E. Lappi1292
optimizing the country coverage as many commonlyused data sources cover mostly the beer-drinking econ-omies. The three measures of entrepreneurship are allcalculated by using their average value of each type for2000 to 2014 nationally but there are differences in thedata coverage across the countries. We use average
values because we do not wish to identify how changesin culture affect the changes in our entrepreneurshipmeasures as culture changes slowly. We wish to com-pare values across countries, and thus, the time period isselected as data for most countries is available duringthe time period, and it is long enough to cover fluctua-tions in the business cycle. We also run alternativeestimations with other possible proxies for the entrepre-neurship variables, and the alternative measures arealigned with Sobel (2008).
We measure productive entrepreneurship by the re-search and development (R&D) expenditure both in theprivate and public sectors. The very idea of spending onR&D is to invest resources in innovative activitieswhich in the future will provide a return. Even thoughsome of the investments of R&D do not result in beingsuccessful, the intention to begin with is to create some-thing new (wealth). The R&D expenditure is measuredas a share of gross domestic product and provided by theWorld Bank’s World Development Indicators database.To validate our measure of productive entrepreneurship,we instead use patents per capita and opportunity-driventotal early stage entrepreneurship, and comparative re-sults are presented in Appendix Tables 7 and 8.6
As a measure of a county’s unproductive entre-preneurship, we add the percentage of personnel inthe armed forces from the total labor force. Thevariable captures the overall military activity of aneconomy and the higher the total employment inthe armed forces, the more resources in terms of
6 The number of patent applications is from the World Bank andopportunity-driven total early stage entrepreneurship from Global En-trepreneurship Monitor (GEM).
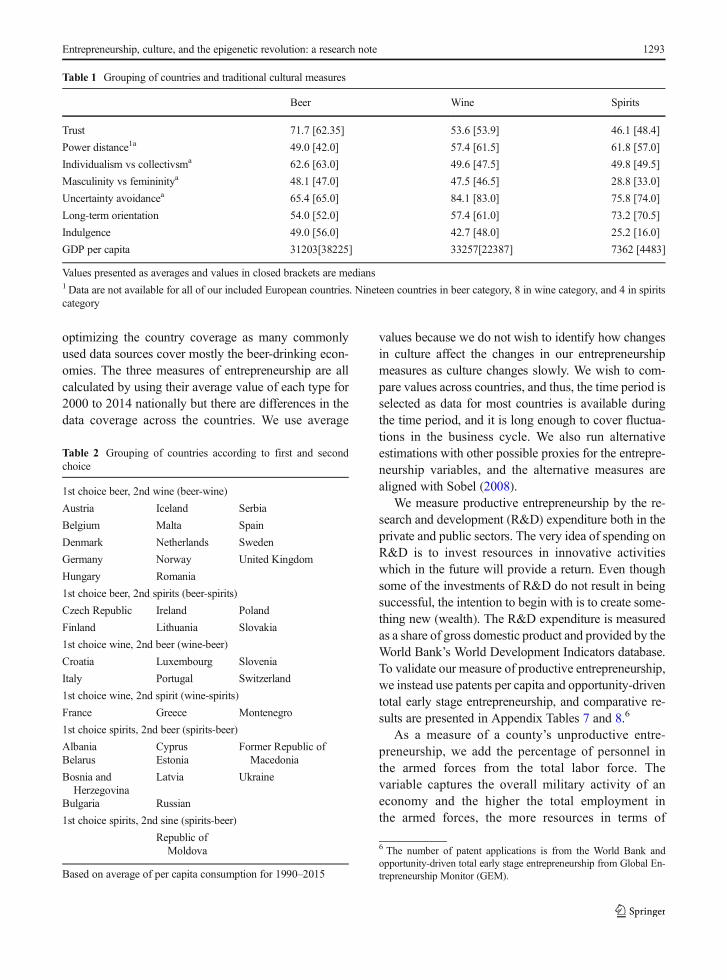
Table 1 Grouping of countries and traditional cultural measures
Beer Wine Spirits
Trust 71.7 [62.35] 53.6 [53.9] 46.1 [48.4]
Power distance1a 49.0 [42.0] 57.4 [61.5] 61.8 [57.0]
Individualism vs collectivsma 62.6 [63.0] 49.6 [47.5] 49.8 [49.5]
Masculinity vs femininitya 48.1 [47.0] 47.5 [46.5] 28.8 [33.0]
Uncertainty avoidancea 65.4 [65.0] 84.1 [83.0] 75.8 [74.0]
Long-term orientation 54.0 [52.0] 57.4 [61.0] 73.2 [70.5]
Indulgence 49.0 [56.0] 42.7 [48.0] 25.2 [16.0]
GDP per capita 31203[38225] 33257[22387] 7362 [4483]
Values presented as averages and values in closed brackets are medians1Data are not available for all of our included European countries. Nineteen countries in beer category, 8 in wine category, and 4 in spiritscategory
Table 2 Grouping of countries according to first and secondchoice
1st choice beer, 2nd wine (beer-wine)
Austria Iceland Serbia
Belgium Malta Spain
Denmark Netherlands Sweden
Germany Norway United Kingdom
Hungary Romania
1st choice beer, 2nd spirits (beer-spirits)
Czech Republic Ireland Poland
Finland Lithuania Slovakia
1st choice wine, 2nd beer (wine-beer)
Croatia Luxembourg Slovenia
Italy Portugal Switzerland
1st choice wine, 2nd spirit (wine-spirits)
France Greece Montenegro
1st choice spirits, 2nd beer (spirits-beer)
Albania Cyprus Former Republic ofMacedoniaBelarus Estonia
Bosnia andHerzegovina
Latvia Ukraine
Bulgaria Russian
1st choice spirits, 2nd sine (spirits-beer)
Republic ofMoldova
Based on average of per capita consumption for 1990–2015
Entrepreneurship, culture, and the epigenetic revolution: a research note 1293
labor are allocated in unproductive activities whichcan be entrepreneurial by nature.7 The armed forcespersonnel are defined as active duty military per-sonnel, including paramilitary forces if the training,organization, equipment, and control suggest theymay be used to support or replace regular militaryforces. The data is provided by the World Bank’sWorld Development Indicators database. To verifyour unproductive entrepreneurship measure, we adda measure of foreign lobbyist spending in the USAfor the year 2017, and it is measured as non-government spending in lobbying activities per100,000 inhabitants, and in addition, we also in-clude the total number of registered in-house lob-byists and trade/business/professional associationsaimed at influencing EU policy making per
100,000 inhabitants.8 The comparative results arepresented in Appendix Tables 7 and 8.
Our measure of destructive entrepreneurship needs toaccount entrepreneurial activity that in general destroyseconomic value. Crime rates would be ideal, but they havea problem with inconsistencies in the reporting as thewealthier and more developed countries report crimesmore often since their justice and legal systems work moreefficiently than countries where crime might be morecommon but is largely under reported. Therefore, we
7 However, there has been recent discussion in the role of the govern-ment and military in the creation of innovation and even for obtaininghuman capital for the individuals employed in armed forces. On theother hand, one might argue that large military might even be destruc-tive for the economy, for example, in some cases with war.
Fig. 2 Map of distribution ofcountries based on the wider tastefor alcohol
8 The foreign lobby watch uses the semi-annual reports; foreign agentsare required to file with theUSDepartment of Justice under the ForeignAgents Registration Act (FARA) to measure the different registrantsacting on behalf of foreign interests, i.e., spending which is aimed atinfluencing US policy or public opinion. The data is from the Centerfor Responsive Politics, and for a few countries, only governmentspending is available instead of non-government spending. The num-ber of lobbyist organizations in Europe is provided by the Transparen-cy Register. Neither one of these measures are perfect as in both cases,it is non-random which countries have incentives to lobby for theirinterest specifically in the USA or in EU. As far as the authors areaware, within-country lobbying activities for the 40 European countriesare not available.
Z. Acs, E. Lappi1294
approximate destructive entrepreneurship by corruption.Corruption can not only be seen as an institution butcorruption also is a destructive action itself. Broadly, thismeasures the possibility for actions that are destructive butcorruption itself is a form of destructive entrepreneurshipas political corruption is entrepreneurial. The data comefrom Transparency International who publishes a yearlyindex for perceived corruption called the Corruption Per-ceptions Index (CPI). The index is constructed by usingsurveys on corruption from various sources and aggregat-ing them to a single index.We subtract the index from 100to make the values more easily interpretable. These resultsindicate that a higher value of the index indicates morecorruption.
We summarize each of the three entrepreneurshiptypes for the included European countries in our sample.
As Table 3 shows, the share of R&D is the largest inSweden (3.40%), Finland (3.39%), Denmark (2.70%),and Germany (2.59%) and the smallest in Bosnia andHerzegovina (0.099%), Albania (0.121%), the formerYugoslav Republic of Macedonia (0.276%), and Cyprus(0.374%). The average value for R&D investments forour whole data set is 1.29% implying that there is varia-tion across the European countries in their investment inproductive entrepreneurship. For the share of labor inarmed forces, we see that the highest shares arise fromMontenegro (5.33%), Belarus (3.53%), Greece (3.24%),and Bulgaria (2.19%). On the other hand, the smallest arein Iceland (0.076%), Ireland (0.486%), Netherlands(0.562%), Germany (0.590%), and the UK (0.593%).One explanation to these differences can also beaccounted to their relative position, i.e., presence of Amer-ican military bases, NATO, as well as historical reasonssuch as civil war. Some of these countries, Belarus, Cy-prus, and Greece, are amongst the few in Europe withmandatory military service.9 On average, for the wholedataset, 1.35% of the labor is employed in armed forcesimplying yet again variation across European countries.Countries that have the highest corruption (highest CPIscore) are Montenegro, Ukraine, Russia, and Albaniaimplying that countries with the most corruption in Eu-rope seem to be in East Europe and the Balkan area.Meanwhile, the least corrupt (lowest CPI score) countriesare Finland, Denmark, Sweden, Iceland, and Switzerland.
We show the distribution of these three differententrepreneurship measures is grouped over our culturedistinctions by using box-and-whisker plots or so called
box plots which originate from the work of Tukey(1977). The box plots are a non-parametric way todescribe the distribution of the underlying data by theuse of quartiles. The boxes are presented so that thespacings between the different parts show the spreadand skewness of the data at the same time indicatingpossible outliers that exist using dots. The band withinthe box shows the median of the data. We also runordinary least squares (OLS) estimates of the form:
yi ¼ αþ γ1Wi þ γ2Si þ εi ð1Þwhere outcome variables yi are the three entrepre-
neurship types and are run in separate estimations. Wi
and Si denote whether county i is a wine- or spirit-drinking country, respectively. As the variables are di-chotomous, the base is defined as the beer-drinkingcountries, i.e., the estimated coefficients are with respectto the base group. εi is the conventional error term. Allthe variables are measured as averages across a timehorizon, as described earlier, and thus, the estimationsprovide correlations across the averages. When we lookat first and second preferences, the equation then be-comes:
yi ¼ β þ δ1BSi þ δ2WBi þ δ3WSi þ δ4SBi
þ δ5SWi þ εi ð2Þwhere now the base is beer-drinking economies that
secondly prefer wine. The variables are denoted as Bindicating for beer, W for wine, and S for spirit, and theorder of the letter denoting first and second preferences.
4 Results
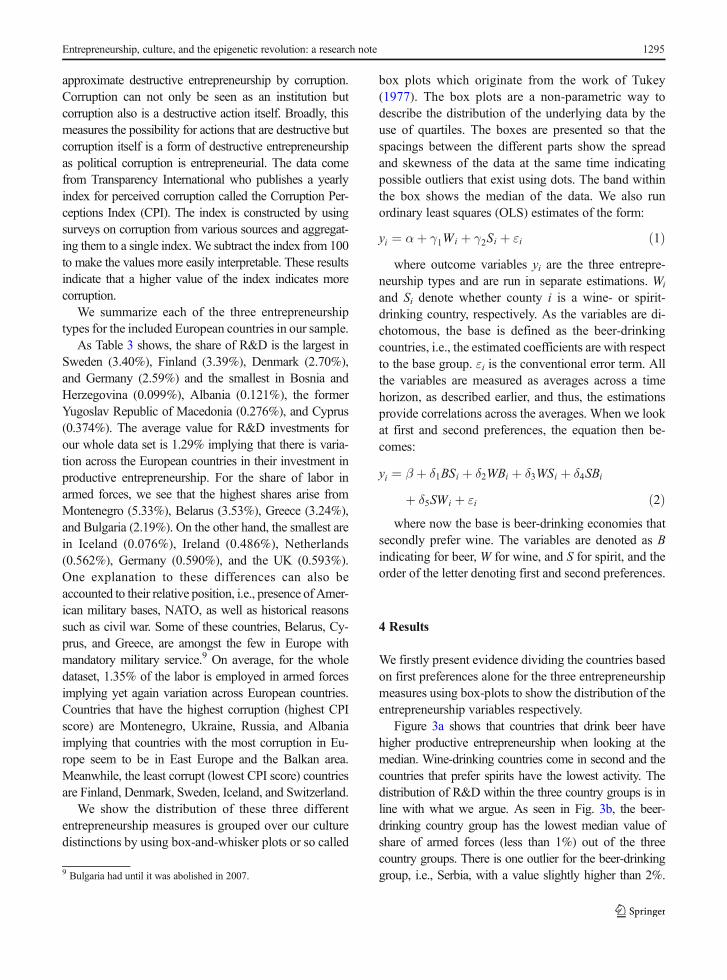
We firstly present evidence dividing the countries basedon first preferences alone for the three entrepreneurshipmeasures using box-plots to show the distribution of theentrepreneurship variables respectively.
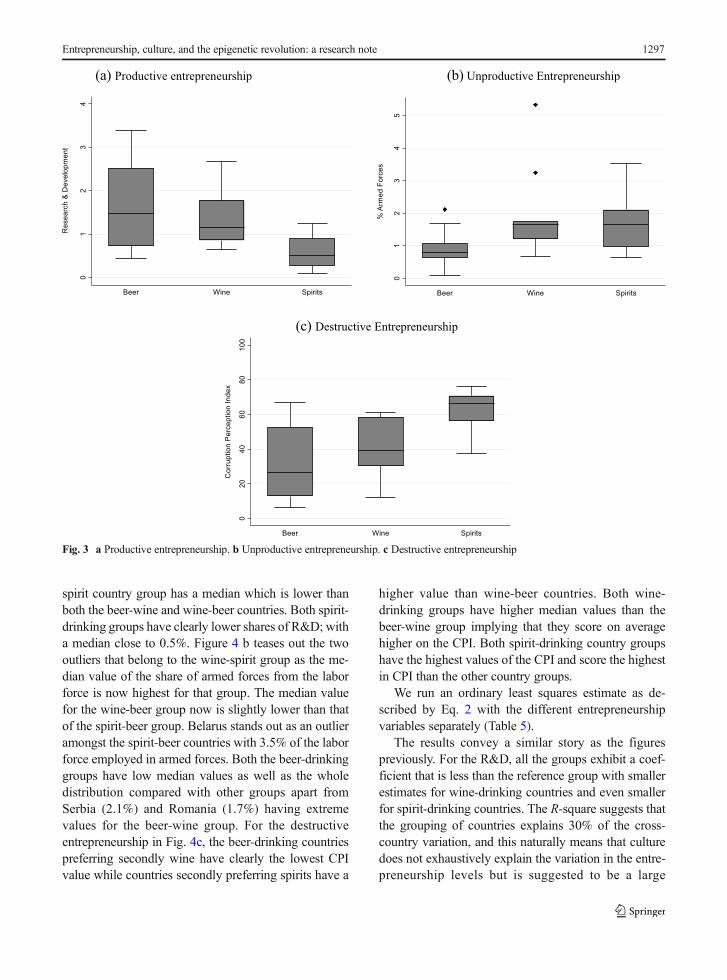
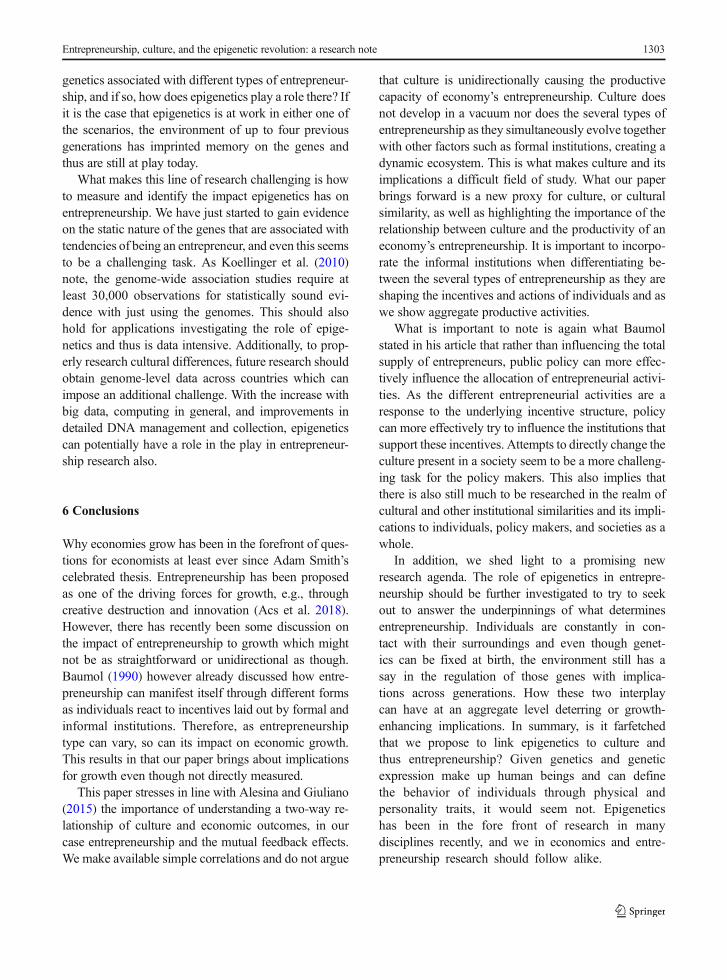
Figure 3a shows that countries that drink beer havehigher productive entrepreneurship when looking at themedian. Wine-drinking countries come in second and thecountries that prefer spirits have the lowest activity. Thedistribution of R&D within the three country groups is inline with what we argue. As seen in Fig. 3b, the beer-drinking country group has the lowest median value ofshare of armed forces (less than 1%) out of the threecountry groups. There is one outlier for the beer-drinkinggroup, i.e., Serbia, with a value slightly higher than 2%.9 Bulgaria had until it was abolished in 2007.
Entrepreneurship, culture, and the epigenetic revolution: a research note 1295
For the wine-drinking group, there appear two outliers:Montenegro with 5.3% and Greece with 3.2% of employ-ment in armed forces. The wine- and spirit-drinking coun-tries have approximately the same median value of theshare of labor in armed forces even though the rest of thedistribution diverges. On the other hand, Fig. 3c shows thatthe countries that consume spirits have a median value thatis well above the other two groups, i.e., are more corrupt.The differences between the groups seem relatively pro-nounced with beer-drinking countries having the medianvalue clearly below the others. The distribution of the beer-drinking countries and their values of CPI is howeverwidespread.
Instead of looking at the distribution of the entrepre-neurship types based on box plots, we estimate Eq. 1 bythe use of ordinary least squares.
From Table 4, it is rather clear that especially thespirit-drinking country groups are largely and signifi-cantly different from the beer-drinking group for all ofthe entrepreneurship variables. In addition, they are alsostatistically different from the wine-drinking countrygroup all except for the unproductive entrepreneurshipvariable, share of labor in armed forces. The wine-drinking group however is statistically significantly dif-ferent from the beer-drinking group only when lookingat the share of labor in armed forces.10 For the produc-tive entrepreneurship, the coefficient is negative imply-ing that there is less research and development in thewine-drinking country on average. For the corruptionperception index, the wine-drinking country group doeshave a higher value than the beer-drinking group.
4.1 Second preferences
However, one could argue that it is too crude to dividethe countries based on only their first preferred bever-age. We therefore further divide the countries based ontheir first and second choices of alcohol type and pro-vide similar box plots as above.
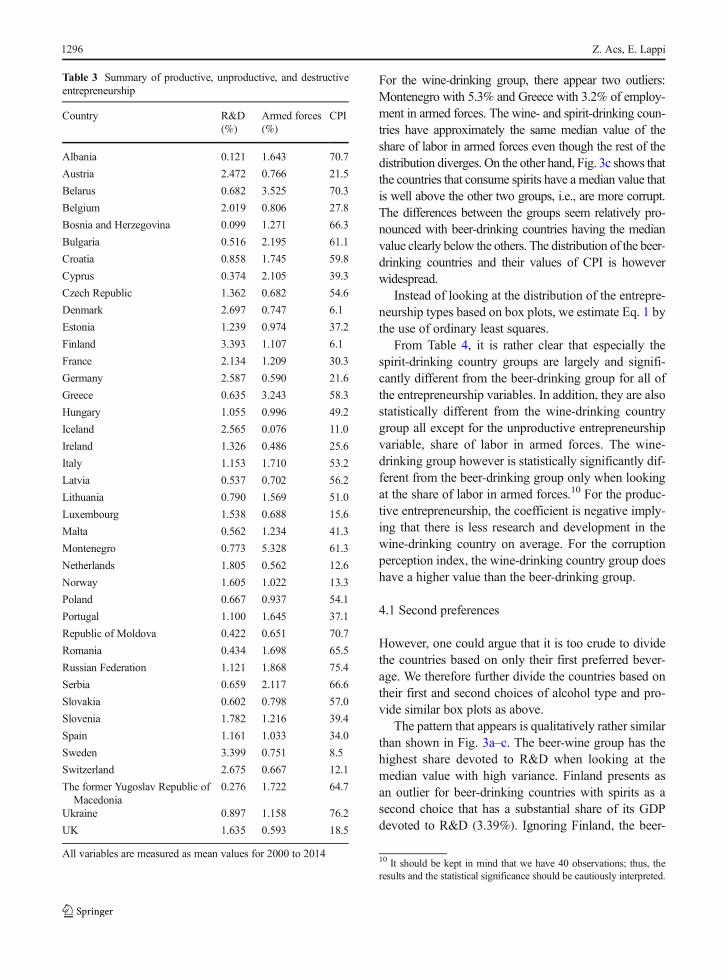
The pattern that appears is qualitatively rather similarthan shown in Fig. 3a–c. The beer-wine group has thehighest share devoted to R&D when looking at themedian value with high variance. Finland presents asan outlier for beer-drinking countries with spirits as asecond choice that has a substantial share of its GDPdevoted to R&D (3.39%). Ignoring Finland, the beer-
10 It should be kept in mind that we have 40 observations; thus, theresults and the statistical significance should be cautiously interpreted.
Table 3 Summary of productive, unproductive, and destructiveentrepreneurship
Country R&D(%)
Armed forces(%)
CPI
Albania 0.121 1.643 70.7
Austria 2.472 0.766 21.5
Belarus 0.682 3.525 70.3
Belgium 2.019 0.806 27.8
Bosnia and Herzegovina 0.099 1.271 66.3
Bulgaria 0.516 2.195 61.1
Croatia 0.858 1.745 59.8
Cyprus 0.374 2.105 39.3
Czech Republic 1.362 0.682 54.6
Denmark 2.697 0.747 6.1
Estonia 1.239 0.974 37.2
Finland 3.393 1.107 6.1
France 2.134 1.209 30.3
Germany 2.587 0.590 21.6
Greece 0.635 3.243 58.3
Hungary 1.055 0.996 49.2
Iceland 2.565 0.076 11.0
Ireland 1.326 0.486 25.6
Italy 1.153 1.710 53.2
Latvia 0.537 0.702 56.2
Lithuania 0.790 1.569 51.0
Luxembourg 1.538 0.688 15.6
Malta 0.562 1.234 41.3
Montenegro 0.773 5.328 61.3
Netherlands 1.805 0.562 12.6
Norway 1.605 1.022 13.3
Poland 0.667 0.937 54.1
Portugal 1.100 1.645 37.1
Republic of Moldova 0.422 0.651 70.7
Romania 0.434 1.698 65.5
Russian Federation 1.121 1.868 75.4
Serbia 0.659 2.117 66.6
Slovakia 0.602 0.798 57.0
Slovenia 1.782 1.216 39.4
Spain 1.161 1.033 34.0
Sweden 3.399 0.751 8.5
Switzerland 2.675 0.667 12.1
The former Yugoslav Republic ofMacedonia
0.276 1.722 64.7
Ukraine 0.897 1.158 76.2
UK 1.635 0.593 18.5
All variables are measured as mean values for 2000 to 2014
Z. Acs, E. Lappi1296
spirit country group has a median which is lower thanboth the beer-wine and wine-beer countries. Both spirit-drinking groups have clearly lower shares of R&D; witha median close to 0.5%. Figure 4 b teases out the twooutliers that belong to the wine-spirit group as the me-dian value of the share of armed forces from the laborforce is now highest for that group. The median valuefor the wine-beer group now is slightly lower than thatof the spirit-beer group. Belarus stands out as an outlieramongst the spirit-beer countries with 3.5% of the laborforce employed in armed forces. Both the beer-drinkinggroups have low median values as well as the wholedistribution compared with other groups apart fromSerbia (2.1%) and Romania (1.7%) having extremevalues for the beer-wine group. For the destructiveentrepreneurship in Fig. 4c, the beer-drinking countriespreferring secondly wine have clearly the lowest CPIvalue while countries secondly preferring spirits have a
higher value than wine-beer countries. Both wine-drinking groups have higher median values than thebeer-wine group implying that they score on averagehigher on the CPI. Both spirit-drinking country groupshave the highest values of the CPI and score the highestin CPI than the other country groups.
We run an ordinary least squares estimate as de-scribed by Eq. 2 with the different entrepreneurshipvariables separately (Table 5).
The results convey a similar story as the figurespreviously. For the R&D, all the groups exhibit a coef-ficient that is less than the reference group with smallerestimates for wine-drinking countries and even smallerfor spirit-drinking countries. The R-square suggests thatthe grouping of countries explains 30% of the cross-country variation, and this naturally means that culturedoes not exhaustively explain the variation in the entre-preneurship levels but is suggested to be a large
(a) Productive entrepreneurship
(c) Destructive Entrepreneurship
(b) Unproductive Entrepreneurship
Fig. 3 a Productive entrepreneurship. b Unproductive entrepreneurship. c Destructive entrepreneurship
Entrepreneurship, culture, and the epigenetic revolution: a research note 1297
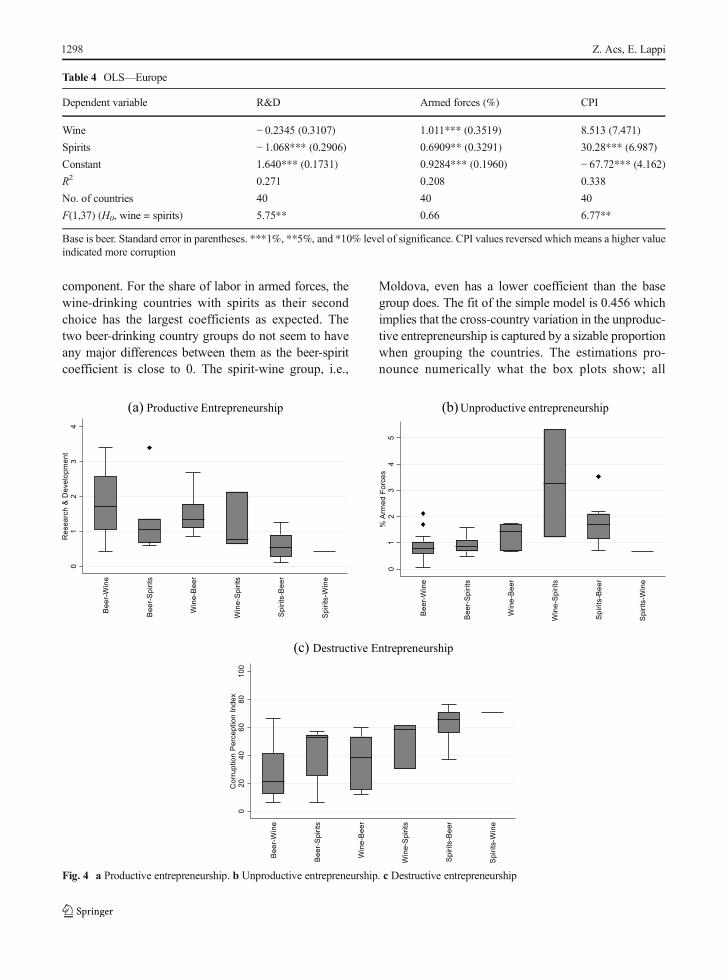
component. For the share of labor in armed forces, thewine-drinking countries with spirits as their secondchoice has the largest coefficients as expected. Thetwo beer-drinking country groups do not seem to haveany major differences between them as the beer-spiritcoefficient is close to 0. The spirit-wine group, i.e.,
Moldova, even has a lower coefficient than the basegroup does. The fit of the simple model is 0.456 whichimplies that the cross-country variation in the unproduc-tive entrepreneurship is captured by a sizable proportionwhen grouping the countries. The estimations pro-nounce numerically what the box plots show; all
Table 4 OLS—Europe
Dependent variable R&D Armed forces (%) CPI
Wine − 0.2345 (0.3107) 1.011*** (0.3519) 8.513 (7.471)
Spirits − 1.068*** (0.2906) 0.6909** (0.3291) 30.28*** (6.987)
Constant 1.640*** (0.1731) 0.9284*** (0.1960) − 67.72*** (4.162)R2 0.271 0.208 0.338
No. of countries 40 40 40
F(1,37) (H0, wine = spirits) 5.75** 0.66 6.77**
Base is beer. Standard error in parentheses. ***1%, **5%, and *10% level of significance. CPI values reversed which means a higher valueindicated more corruption
(a) Productive Entrepreneurship
(c) Destructive Entrepreneurship
(b) Unproductive entrepreneurship
Fig. 4 a Productive entrepreneurship. b Unproductive entrepreneurship. c Destructive entrepreneurship
Z. Acs, E. Lappi1298
countries have more corruption on average than thebaseline, beer-wine. Moldova has the largest positivecoefficient with spirit-beer and wine-spirits following.
Here the R-square is nearly 0.40 which would imply thatcultural differences are important in explaining differ-ences in also destructive entrepreneurship.
Table 5 OLS
Dependent variable R&D Armed forces (%) CPI
Beer-spirits − 0.4045 (0.3856) 0.0019 (0.3700) 12.98 (9.036)
Wine-beer − 0.2435 (0.3856) 0.3506 (0.3700) 7.822 (9.036)
Wine-spirits − 0.5804 (0.5028) 2.332*** (0.4825) 21.58* (11.78)
Spirits-beer − 1.175*** (0.3272) 0.7884** (0.3140) 33.36*** (7.667)
Spirits-wine − 1.339 (0.8180) − 0.2771 (0.7850) 42.29** (19.17)
Constant 1.761*** (0.2112) 0.9279*** (0.2027) − 71.61*** (4.949)R2 0.302 0.456 0.398
No. of countries 40 40 40
Base is beer-wine. Standard error in parentheses. ***1%, **5%, and *10% level of significance. CPI values reversed which means a highervalue indicated more corruption
(a) Productive Entrepreneurship
(c) Destructive Entrepreneurship
(b) Unproductive Entrepreneurship
Fig. 5 a Productive entrepreneurship. b Unproductive entrepreneurship. c Destructive entrepreneurship
Entrepreneurship, culture, and the epigenetic revolution: a research note 1299
4.2 The whole world
A natural question arising after our evidence is that howgeneralizable are our findings? Are the results arisingbecause of the specific European context? What does thismean for countries where alcohol is banned altogether orsimply individuals do not consume alcohol? We conductthe same exercise for all countries that have available datafrom the used data sources across the world. We includecountries that have data on alcohol consumption and atleast one entrepreneurship variable. This means that wehave maximum of 180 countries, and a list of the countriesincluded and data availability and associated numericalvalues of the entrepreneurship variables are provided inthe electronic supplementary material. The countries thatreport zero sales on at least two of the alcohol types arecoded as countries without alcohol sales.
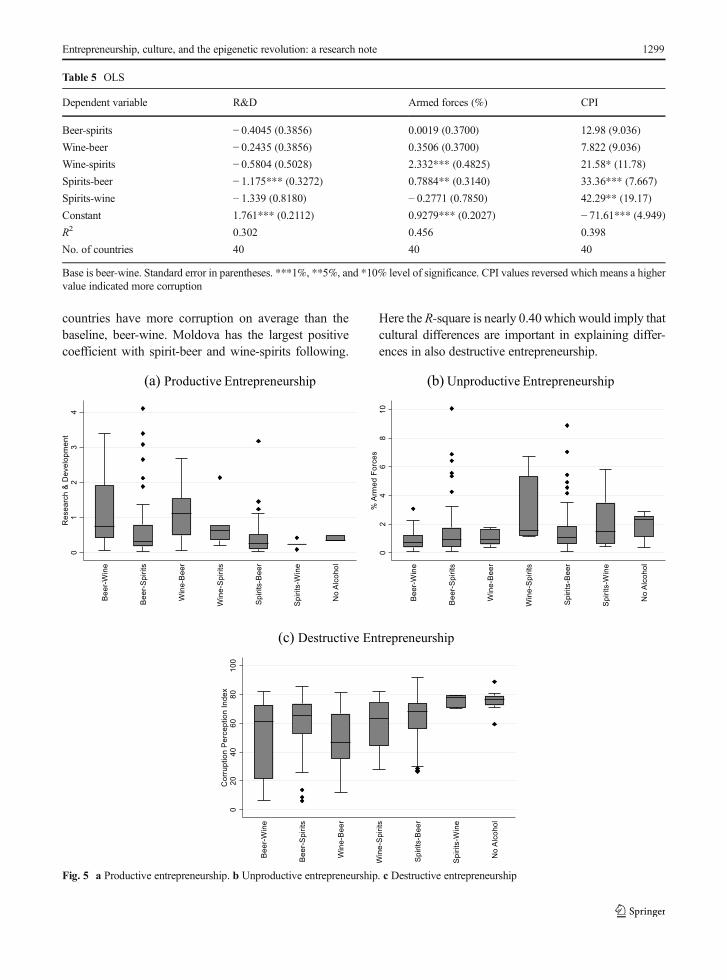
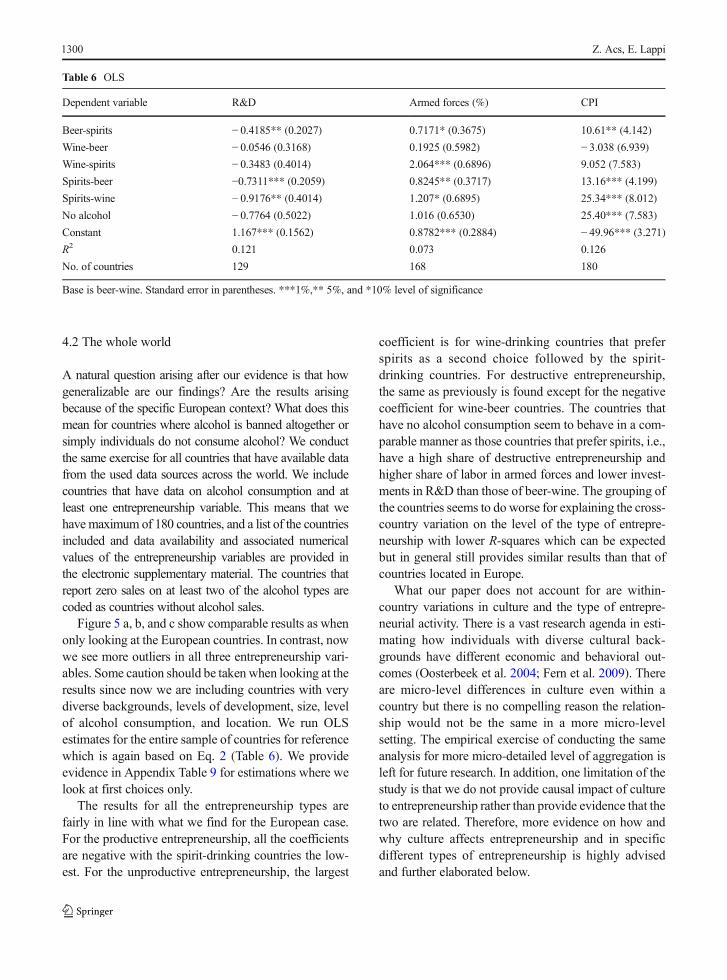
Figure 5 a, b, and c show comparable results as whenonly looking at the European countries. In contrast, nowwe see more outliers in all three entrepreneurship vari-ables. Some caution should be taken when looking at theresults since now we are including countries with verydiverse backgrounds, levels of development, size, levelof alcohol consumption, and location. We run OLSestimates for the entire sample of countries for referencewhich is again based on Eq. 2 (Table 6). We provideevidence in Appendix Table 9 for estimations where welook at first choices only.
The results for all the entrepreneurship types arefairly in line with what we find for the European case.For the productive entrepreneurship, all the coefficientsare negative with the spirit-drinking countries the low-est. For the unproductive entrepreneurship, the largest
coefficient is for wine-drinking countries that preferspirits as a second choice followed by the spirit-drinking countries. For destructive entrepreneurship,the same as previously is found except for the negativecoefficient for wine-beer countries. The countries thathave no alcohol consumption seem to behave in a com-parable manner as those countries that prefer spirits, i.e.,have a high share of destructive entrepreneurship andhigher share of labor in armed forces and lower invest-ments in R&D than those of beer-wine. The grouping ofthe countries seems to do worse for explaining the cross-country variation on the level of the type of entrepre-neurship with lower R-squares which can be expectedbut in general still provides similar results than that ofcountries located in Europe.
What our paper does not account for are within-country variations in culture and the type of entrepre-neurial activity. There is a vast research agenda in esti-mating how individuals with diverse cultural back-grounds have different economic and behavioral out-comes (Oosterbeek et al. 2004; Fern et al. 2009). Thereare micro-level differences in culture even within acountry but there is no compelling reason the relation-ship would not be the same in a more micro-levelsetting. The empirical exercise of conducting the sameanalysis for more micro-detailed level of aggregation isleft for future research. In addition, one limitation of thestudy is that we do not provide causal impact of cultureto entrepreneurship rather than provide evidence that thetwo are related. Therefore, more evidence on how andwhy culture affects entrepreneurship and in specificdifferent types of entrepreneurship is highly advisedand further elaborated below.
Table 6 OLS
Dependent variable R&D Armed forces (%) CPI
Beer-spirits − 0.4185** (0.2027) 0.7171* (0.3675) 10.61** (4.142)
Wine-beer − 0.0546 (0.3168) 0.1925 (0.5982) − 3.038 (6.939)
Wine-spirits − 0.3483 (0.4014) 2.064*** (0.6896) 9.052 (7.583)
Spirits-beer −0.7311*** (0.2059) 0.8245** (0.3717) 13.16*** (4.199)
Spirits-wine − 0.9176** (0.4014) 1.207* (0.6895) 25.34*** (8.012)
No alcohol − 0.7764 (0.5022) 1.016 (0.6530) 25.40*** (7.583)
Constant 1.167*** (0.1562) 0.8782*** (0.2884) − 49.96*** (3.271)R2 0.121 0.073 0.126
No. of countries 129 168 180
Base is beer-wine. Standard error in parentheses. ***1%,** 5%, and *10% level of significance
Z. Acs, E. Lappi1300
5 Discussion
Our results find evidence of the grouping of coun-tries based on their culture being associated with thepresence of different entrepreneurship types. Our pa-per confirms in line with existing literature thatculture matters for entrepreneurship and contributesby providing evidence that culture matters for theproductivity of entrepreneurship. Together with thebefore-mentioned limitations, our study phases whichshould be addressed in future research, why cultureaffects entrepreneurship, should be further discussedand tested in a micro-level. We discuss the relation-ship between institutions and culture, then go intothe genome-wide evidence on entrepreneurship andlastly introduce albeit not directly test that epige-netics being the underlying mechanism how culturecan affect entrepreneurship. We propose that institu-tions, culture, and genetics are all linked throughepigenetics and suggest that we need more evidenceon how the environment changes how the genes areread which has implications for entrepreneurship andgrowth.
The quality of institutions being crucial for eco-nomic growth in a society is well established (e.g.,Acemoglu et al. 2001; Rodrik et al. 2004). Also, thelink between institutions and entrepreneurship hasgained attention previously (Baumol and Strom2007; Bosma et al. 2018). It has been proposed thatcountries with weak institutions actually could incen-tivize unproductive or destructive entrepreneurshipwhile not incentivizing productive entrepreneurship(Murphy et al. 1993; Parker 2009). However,Alesina and Giuliano (2015) point out: “Culture andinstitutions are endogenous variables determined, pos-sibly, by geography, technology, epidemics, wars, andother historical shocks.” They stress that institutionsand culture have a two-way causal relationship in-stead of one only affecting the other. Therefore, weacknowledge that our results might also pick up someinstitutional similarities and not only cultural similar-ities. However, it is the formal and the informalinstitutions in combination with the physical naturethat comprise the environment in which the individ-uals interact. This implies that the environment im-pacts the behavior of individuals through severalmeans, for example, providing incentives, access toeducation or capital, or health, which on the otherhand impact entrepreneurship. This suggests that in
institutions, culture and genetics are all linked throughepigenetics (Selye 1955).11
Instead of looking for explanations from the externalenvironment affecting entrepreneurship, recent studieshave linked the genetics of individuals and entrepre-neurial tendencies (Nicolaou et al. 2008a, 2008b). Morespecifically, they find certain genes being associatedwith the tendency for being an entrepreneur largelyargued coming from genetic variations in the dopaminereceptors (Nicolaou et al. 2008a, 2008b). Some havealso found that attention deficit hyperactivity disorder(ADHD) and the associated genes are linked to being anentrepreneur (Mannuzza et al. 1993; Nicolaou et al.2011) while others have focused especially on the tes-tosterone levels of individuals and entrepreneurship(e.g. Nicolaou et al. 2018; Greene et al. 2014; Whiteet al. 2006). This strain of literature emphasizes (directlyor indirectly) that the entrepreneurial tendency is there-fore largely heritable and by nature fixed. But ratherthan genes being fixed and thus possibly solely a deter-minant of an individual being an entrepreneur, the fieldof epigenetics would propose that the environmentalfactors moderate the expression of the genes which thencan be linked to entrepreneurship. Also, epigeneticsimplies that the changes in the gene expression can alsobe heritable, and thus, the epigenetic markers can beinherited for multiple of generations. Therefore, as thereis evidence showing that genetics and entrepreneurshipdo appear to have a relationship, the interplay withexternal factors and genetics which in turn affects entre-preneurship should be further examined especially inexamining across-country entrepreneurship outcomes.In a recent review, Nofal et al. (2018) also shortlypropose epigenetics as a useful future research agenda.
Epigenetics is an emerging field of genetical bi-ology which combines developmental biology andgenetics. Even though having roots in the 1970s, thefield of research has only in the recent decadegained momentum amongst researchers, and somehave even proposed that we have an epigeneticrevolution ongoing or refer to an epigenetic hypewhich by and large claims victory of epigeneticsover genes (Maderspacher 2010).12 There is no realcensus on the exact definition of epigenetics. It has
11 Hans Selye identified the role of environmental factors that led to theterm he coined, stress (https://en.wikipedia.org/wiki/Hans_Selye).12 There has also been reservations about the scientific basis of theepigenome project (Madhani et al. 2008)
Entrepreneurship, culture, and the epigenetic revolution: a research note 1301
been defined as how genotypes give rise to pheno-types during development (Waddington 1957), thestudy of mitotically and/or meiotically heritablechanges in gene function that cannot be explainedby changes in DNA sequence (Russo andMartienssen 1996), and as the structural adaptationof chromosomal regions so as to register, signal, orperpetuate altered activity states.13 There is no con-sensus amongst the biological geneticist on the exactmechanism in which epigenetics functions, but theevidence seems to point out that epigenetics exists,e.g., see evidence for plants (Henderson andJacobsen 2007), lab rats (Weaver et al. 2004), andhumans (Wong et al. 2005; Fraga et al. 2005). Rath-er importantly, Holliday (2006) discusses the differ-ence between genetic and epigenetic heritability.Plainly, genetics is based on cell lineages and theorganism starts as a single cell and ends up as aclone of cells. On the other hand, epigenetic changesoften occur in groups of cells because of a specificsignal which impinges on a group of cells with thesame receptor. The genetic changes are stable andrarely reversed, whereas epigenetic changes are of-ten reversible (Holliday 2006). Thus, the epigeneticinheritance implies that information can be inheritedwithout altering the structure of the DNA.
No matter what precise definition of epigeneticsone has to follow, the underlying message is clear:the environment can change how the genes areexpressed, contradicting the argument that the ge-netic makeup of an individual is fixed and thuspredetermined at birth solely by the disposition ofthe genetic heritability of the parents. Instead ofcompletely disagreeing with the genetic determin-ism, epigenetics shines light on the possibility thatacquired marks can be passed through generationswhich simply means that genes might have a mem-ory. This could imply that the reason why we havenot seen convergence of development across coun-tries even though we have improved the formalinstitutions in some countries in the world is thatthe new generation of individuals can still carry theinformation of their past generation not only bytheir genetic predisposition but also by due infor-mation stored through epigenetic marks. Thiswould mean that it takes even longer time than
necessarily anticipated for the environment, i.e.,formal or informal institutions, to impact humanbehavior. In contrast to our results, this means thatthe reason why we see different cultures and theproductivity of entrepreneurship differing can bethat the epigenetic marks of the past generationsare passed on influencing culture, entrepreneurship,and the interaction of the two.
Therefore, we call and suggest an important fu-ture research agenda in which the importance ofenvironmental factors and the interplay with genesare examined with respect to entrepreneurship re-search. There have been two contradicting viewson the entrepreneur, either he is a complete blankand through the environment and learning will be-come an entrepreneur or there is something inher-ently different about those who are entrepreneursand they are born as entrepreneurs. Much of theliterature on the environmental factors that makethe entrepreneur focuses on the set of opportunitiesthat are available. Environmental factors here imply,for example, the cultural milieu which can influencethe degree of entrepreneurship and especially thetypes of entrepreneurship present in an economywhich naturally arises from the individuals, or en-trepreneurs. Our discussion is suggestive by natureas we do not provide direct evidence of epigeneticsplaying a role but nevertheless, we argue this to bean integral new discovery to the entrepreneurshipliterature and one possible mechanism in which ourcultural proxies are mediated to the entrepreneurshipoutcomes in an aggregate manner. Our results pointout that countries can be divided into groups basedon their informal institutions which correlate to theproductivity of entrepreneurship across Europe andthe world. The epigenetics can be one source ofthese differences in cultures and entrepreneurshipoutcomes across countries.
An important question arising from this possiblefuture research agenda is that how do different environ-ments change the genome expressions and how are theyrelated to being an entrepreneur? Are the environmentalfactors working through the genetic expressionoutweighing the institutional setting put in place? Thisis if we assume epigenetics influences the genome ex-pressions which in turn solely determine whether youbecome an entrepreneur or not. In addition, is epige-netics one of the reasons why we see strong intergener-ational links between entrepreneurs? Or are certain
13 See Deichmann (2016) for a recent survey of the three epigeneticmechanisms .
Z. Acs, E. Lappi1302
genetics associated with different types of entrepreneur-ship, and if so, how does epigenetics play a role there? Ifit is the case that epigenetics is at work in either one ofthe scenarios, the environment of up to four previousgenerations has imprinted memory on the genes andthus are still at play today.
What makes this line of research challenging is howto measure and identify the impact epigenetics has onentrepreneurship. We have just started to gain evidenceon the static nature of the genes that are associated withtendencies of being an entrepreneur, and even this seemsto be a challenging task. As Koellinger et al. (2010)note, the genome-wide association studies require atleast 30,000 observations for statistically sound evi-dence with just using the genomes. This should alsohold for applications investigating the role of epige-netics and thus is data intensive. Additionally, to prop-erly research cultural differences, future research shouldobtain genome-level data across countries which canimpose an additional challenge. With the increase withbig data, computing in general, and improvements indetailed DNA management and collection, epigeneticscan potentially have a role in the play in entrepreneur-ship research also.
6 Conclusions
Why economies grow has been in the forefront of ques-tions for economists at least ever since Adam Smith’scelebrated thesis. Entrepreneurship has been proposedas one of the driving forces for growth, e.g., throughcreative destruction and innovation (Acs et al. 2018).However, there has recently been some discussion onthe impact of entrepreneurship to growth which mightnot be as straightforward or unidirectional as though.Baumol (1990) however already discussed how entre-preneurship can manifest itself through different formsas individuals react to incentives laid out by formal andinformal institutions. Therefore, as entrepreneurshiptype can vary, so can its impact on economic growth.This results in that our paper brings about implicationsfor growth even though not directly measured.
This paper stresses in line with Alesina and Giuliano(2015) the importance of understanding a two-way re-lationship of culture and economic outcomes, in ourcase entrepreneurship and the mutual feedback effects.We make available simple correlations and do not argue
that culture is unidirectionally causing the productivecapacity of economy’s entrepreneurship. Culture doesnot develop in a vacuum nor does the several types ofentrepreneurship as they simultaneously evolve togetherwith other factors such as formal institutions, creating adynamic ecosystem. This is what makes culture and itsimplications a difficult field of study. What our paperbrings forward is a new proxy for culture, or culturalsimilarity, as well as highlighting the importance of therelationship between culture and the productivity of aneconomy’s entrepreneurship. It is important to incorpo-rate the informal institutions when differentiating be-tween the several types of entrepreneurship as they areshaping the incentives and actions of individuals and aswe show aggregate productive activities.
What is important to note is again what Baumolstated in his article that rather than influencing the totalsupply of entrepreneurs, public policy can more effec-tively influence the allocation of entrepreneurial activi-ties. As the different entrepreneurial activities are aresponse to the underlying incentive structure, policycan more effectively try to influence the institutions thatsupport these incentives. Attempts to directly change theculture present in a society seem to be a more challeng-ing task for the policy makers. This also implies thatthere is also still much to be researched in the realm ofcultural and other institutional similarities and its impli-cations to individuals, policy makers, and societies as awhole.
In addition, we shed light to a promising newresearch agenda. The role of epigenetics in entrepre-neurship should be further investigated to try to seekout to answer the underpinnings of what determinesentrepreneurship. Individuals are constantly in con-tact with their surroundings and even though genet-ics can be fixed at birth, the environment still has asay in the regulation of those genes with implica-tions across generations. How these two interplaycan have at an aggregate level deterring or growth-enhancing implications. In summary, is it farfetchedthat we propose to link epigenetics to culture andthus entrepreneurship? Given genetics and geneticexpression make up human beings and can definethe behavior of individuals through physical andpersonality traits, it would seem not. Epigeneticshas been in the fore front of research in manydisciplines recently, and we in economics and entre-preneurship research should follow alike.
Entrepreneurship, culture, and the epigenetic revolution: a research note 1303
Funding Information Open access funding provided byJönköping University.
Appendix
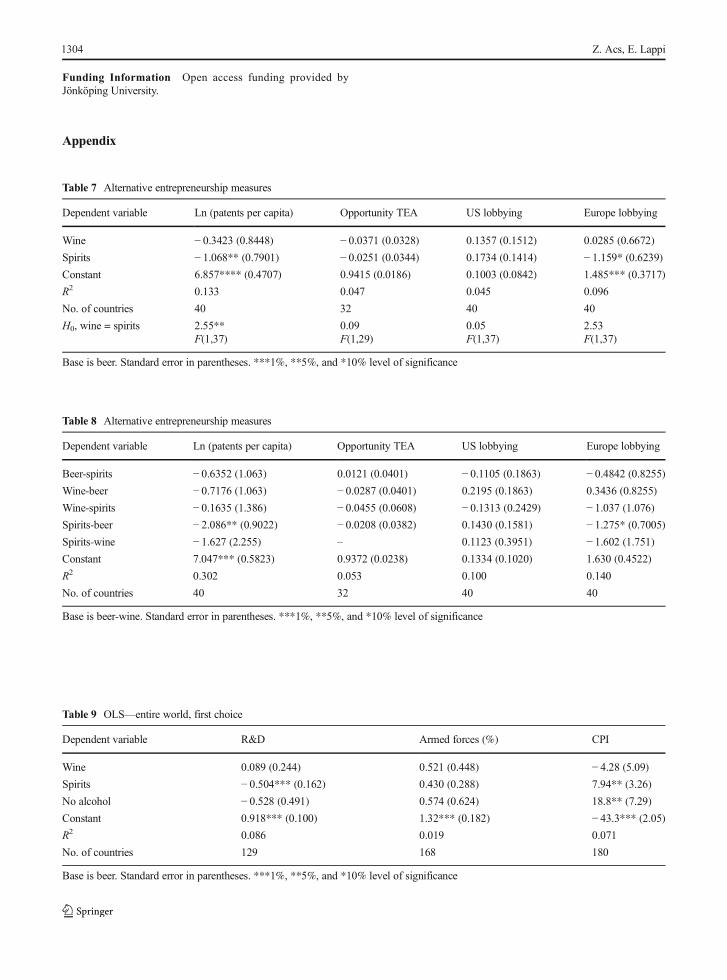
Table 7 Alternative entrepreneurship measures
Dependent variable Ln (patents per capita) Opportunity TEA US lobbying Europe lobbying
Wine − 0.3423 (0.8448) − 0.0371 (0.0328) 0.1357 (0.1512) 0.0285 (0.6672)
Spirits − 1.068** (0.7901) − 0.0251 (0.0344) 0.1734 (0.1414) − 1.159* (0.6239)Constant 6.857**** (0.4707) 0.9415 (0.0186) 0.1003 (0.0842) 1.485*** (0.3717)
R2 0.133 0.047 0.045 0.096
No. of countries 40 32 40 40
H0, wine = spirits 2.55**F(1,37)
0.09F(1,29)
0.05F(1,37)
2.53F(1,37)
Base is beer. Standard error in parentheses. ***1%, **5%, and *10% level of significance
Table 8 Alternative entrepreneurship measures
Dependent variable Ln (patents per capita) Opportunity TEA US lobbying Europe lobbying
Beer-spirits − 0.6352 (1.063) 0.0121 (0.0401) − 0.1105 (0.1863) − 0.4842 (0.8255)Wine-beer − 0.7176 (1.063) − 0.0287 (0.0401) 0.2195 (0.1863) 0.3436 (0.8255)
Wine-spirits − 0.1635 (1.386) − 0.0455 (0.0608) − 0.1313 (0.2429) − 1.037 (1.076)
Spirits-beer − 2.086** (0.9022) − 0.0208 (0.0382) 0.1430 (0.1581) − 1.275* (0.7005)Spirits-wine − 1.627 (2.255) – 0.1123 (0.3951) − 1.602 (1.751)
Constant 7.047*** (0.5823) 0.9372 (0.0238) 0.1334 (0.1020) 1.630 (0.4522)
R2 0.302 0.053 0.100 0.140
No. of countries 40 32 40 40
Base is beer-wine. Standard error in parentheses. ***1%, **5%, and *10% level of significance
Table 9 OLS—entire world, first choice
Dependent variable R&D Armed forces (%) CPI
Wine 0.089 (0.244) 0.521 (0.448) − 4.28 (5.09)Spirits − 0.504*** (0.162) 0.430 (0.288) 7.94** (3.26)
No alcohol − 0.528 (0.491) 0.574 (0.624) 18.8** (7.29)
Constant 0.918*** (0.100) 1.32*** (0.182) − 43.3*** (2.05)
R2 0.086 0.019 0.071
No. of countries 129 168 180
Base is beer. Standard error in parentheses. ***1%, **5%, and *10% level of significance
Z. Acs, E. Lappi1304
Open Access This article is distributed under the terms of theCreative Commons Attribution 4.0 International License (http://creativecommons.org/licenses/by/4.0/), which permits unrestrict-ed use, distribution, and reproduction in any medium, providedyou give appropriate credit to the original author(s) and the source,provide a link to the Creative Commons license, and indicate ifchanges were made.
References
Acemoglu, D., & Robinson, J. A. (2012). Why nations fail: theorigins of power, prosperity and poverty (1st ed.). New York:Crown.
Acemoglu, D., Johnson, S., & Robinson, J. A. (2001). The colo-nial origins of comparative development: an empirical inves-tigation. The American Economic Review, 91(5), 1369–1401.
Acs, Z. J., Arenius, P., Hay, M., & Minniti, M. (2004). Globalentrepreneurship monitor. London Business School, Babson:Executive Report.
Acs, Z., Estrin, S., Mickiewiczs, T., & Szerb, L. (2018).Entrepreneurship, institutional economics and economicgrowth: an ecosystem perspective. Small BusinessEconomics 51(2), 501–514.
Aizenman, J., & Brooks, E. (2008). Globalization and taste con-vergence: the cases of wine and beer. Review of InternationalEconomics, 16(2), 217–233. https://doi.org/10.1111/j.1467-9396.2007.00659.x.
Alesina, A., & Giuliano, P. (2015). Culture and institutions.Journal of Economic Literature, 53(4), 898–944.https://doi.org/10.1257/jel.53.4.898.
Baumol, W. J. (1990). Entrepreneurship: Productive, unproduc-tive, and destructive. Journal of Political Economy, 98(5,Part 1), 893–921.
Baumol, W. J., & Strom, R. J. (2007). Entrepreneurship andeconomic growth. Strategic Entrepreneurship Journal, 1(3–4), 233–237. https://doi.org/10.1002/sej.26.
Blanchflower, D. G. (2000). Self-employment in OECD countries.Labour Economics, 7(5), 471–505.
Blau, D. M. (1987). A time-series analysis of self-employment inthe United States. Journal of Political Economy, 95(3), 445–467. https://doi.org/10.1086/261466.
Bosma, N., Content, J., Sanders, M., & Stam, E. (2018).Institutions, entrepreneurship, and economic growth inEurope. Small Business Economics, 51(2), 483–499.https://doi.org/10.1007/s11187-018-0012-x.
Bowen, H. P., & De Clercq, D. (2008). Institutional context andthe allocation of entrepreneurial effort. Journal ofInternational Business Studies, 39(4), 747–767. https://doi.org/10.1057/palgrave.jibs.8400343.
Cacciotti, G., & Hayton, J. C. (2017). National culture and entre-preneurship. In The Wiley Handbook of Entrepreneurship,401–422.
Carey, N. (2012). The epigenetic revolution: how modern biologyis rewriting our understanding of genetics, disease and inher-itance. Columbia University Press.
Chakraborty, S., Thompson, J. C., & Yehoue, E. B. (2016). Theculture of entrepreneurship. Journal of Economic Theory,163, 288–317. https://doi.org/10.1016/j.jet.2015.12.007.
Davidsson, P. (1995). Culture, structure and regional levels ofentrepreneurship. Entrepreneurship and RegionalDevelopment, 7(1), 41–62. https://doi.org/10.1080/08985629500000003.
Davidsson, P., & Henrekson, M. (2002). Determinants of theprevalance of start-ups and high-growth firms. SmallBusiness Economics, 19(2), 81–104. https://doi.org/10.1023/a:1016264116508.
de Goeij, M. C. M., Suhrcke, M., Toffolutti, V., van deMheen, D.,Schoenmakers, T. M., & Kunst, A. E. (2015). How economiccrises affect alcohol consumption and alcohol-related healthproblems: a realist systematic review. Social Science &Medicine, 131, 131–146. https://doi.org/10.1016/j.socscimed.2015.02.025.
Deichmann, U. (2016). Epigenetics: the origins and evolution of afashionable topic. Developmental Biology, 416(1), 249–254.https://doi.org/10.1016/j.ydbio.2016.06.005.
Desai, S., Acs, Z. J., & Weitzel, U. (2013). A model of destructiveentrepreneurship: insight for conflict and postconflict recov-ery. The Journal of Conflict Resolution, 57(1), 20–40.
Dheer, R. J. S. (2017). Cross-national differences in entrepreneur-ial activity: role of culture and institutional factors. SmallBusiness Economics, 48(4), 813–842. https://doi.org/10.1007/s11187-016-9816-8.
Dieckmann, O. (1996). Cultural determinants of economicgrowth: theory and evidence. Journal of CulturalEconomics, 20(4), 297–320. https://doi.org/10.1007/bf00149234.
Elert, N., & Henrekson, M. (2017). Entrepreneurship and institu-tions: a bidirectional relationship. Foundations and Trends inEntrepreneurship, 13(3), 191–263. https://doi.org/10.1561/0300000073.
Fern, X., Ndez, R., & Fogli, A. (2009). Culture: an empiricalinvestigation of beliefs, work, and fertility. AmericanEconomic Journal: Macroeconomics, 1(1), 146–177.
Fraga, M. F., Ballestar, E., Paz, M. F., Ropero, S., Setien, F.,Ballestar, M. L., Heine-Suñer, D., Cigudosa, J. C., Urioste,M., Benitez, J., Boix-Chornet, M., Sanchez-Aguilera, A.,Ling, C., Carlsson, E., Poulsen, P., Vaag, A., Stephan, Z.,Spector, T. D., Wu, Y.-Z., Plass, C., & Esteller, M. (2005).Epigenetic differences arise during the lifetime of monozy-gotic twins. Proceedings of the National Academy ofSciences of the United States of America, 102(30), 10604–10609. https://doi.org/10.1073/pnas.0500398102.
Frederking, L. C. (2004). A cross-national study of culture, orga-nization and entrepreneurship in three neighbourhoods.Entrepreneurship and Regional Development, 16(3), 197–215. https://doi.org/10.1080/0898562042000197126.
Freytag, A., & Thurik, R. (2007). Entrepreneurship and its deter-minants in a cross-country setting. Journal of EvolutionaryEconomics, 17(2), 117–131. https://doi.org/10.1007/s00191-006-0044-2.
Greene, F. J., Liang, H., Martin, S., Zhang, S., & Wittert, G.(2014). Testosterone is associated with self-employmentamong Australian men. Economics and Human Biology,13, 76–84. https://doi.org/10.1016/j.ehb.2013.02.003.
Grilo, I., & Thurik, R. (2005). Latent and actual entrepreneurshipin Europe and the US: some recent developments. The
Entrepreneurship, culture, and the epigenetic revolution: a research note 1305
International Entrepreneurship and Management Journal,1(4), 441–459. https://doi.org/10.1007/s11365-005-4772-9.
Guiso, L., Sapienza, P., & Zingales, L. (2006). Does culture affecteconomic outcomes? The Journal of Economic Perspectives,20(2), 23–48.
Hall, R. E., & Jones, C. I. (1999). Why do some countries produceso much more output per worker than others?*. TheQuarterly Journal of Economics, 114(1), 83–116.https://doi.org/10.1162/003355399555954.
Harms, R., & Groen, A. (2017). Loosen up? Cultural tightness andnational entrepreneurial activity. Technological Forecastingand Social Change, 121, 196–204. https://doi.org/10.1016/j.techfore.2016.04.013.
Hayton, J. C., George, G., & Zahra, S. A. (2002). National Cultureand entrepreneurship : a review of behavioral research.Entrepreneurship Theory and Practice, 26(4), 33–52.https://doi.org/10.1177/104225870202600403.
Hechavarria, D. M., & Reynolds, P. D. (2009). Cultural norms &business start-ups: the impact of national values on opportu-ni ty and necessi ty entrepreneurs . Internat ionalEntrepreneurship and Management Journal, 5(4), 417.https://doi.org/10.1007/s11365-009-0115-6.
Henderson, I. R., & Jacobsen, S. E. (2007). Epigenetic inheritancein plants. Nature, 447, 418. https://doi.org/10.1038/nature05917.
Henrekson, M., & Sanandaji, T. (2010). The interaction of entre-preneurship and institutions. Journal of InstitutionalEconomics, 7(1), 47–75. https://doi.org/10.1017/S1744137410000342.
Holliday, R. (2006). Epigenetics: a historical overview.Epigenetics, 1(2), 76–80. https://doi.org/10.4161/epi.1.2.2762.
Hopenhayn, H. A. (1992). Entry, exit, and firm dynamics in longrun equilibrium. Econometrica: Journal of the EconometricSociety, 1127–1150.
Huggins, R., & Thompson, P. (2014). Culture, entrepreneurshipand uneven deve lopmen t : a spa t i a l ana ly s i s .Entrepreneurship and Regional Development, 26(9–10),726–752. https://doi.org/10.1080/08985626.2014.985740.
Huggins, R., & Thompson, P. (2015). Local entrepreneurial resil-ience and culture: the role of social values in fostering eco-nomic recovery. Cambridge Journal of Regions, Economyand Society, 8(2), 313–330. https://doi.org/10.1093/cjres/rsu035.
Inglehart, Ronald. 1997. Modernization and postmodernization:cultural, economic, and political change in 43 societies:Princeton University Press.
Koellinger, P. D., van der Loos, M. J. H. M., Groenen, P. J. F.,Thurik, A. R., Rivadeneira, F., van Rooij, F. J. A.,Uitterlinden, A. G., & Hofman, A. (2010). Genome-wideassociation studies in economics and entrepreneurship re-search: promises and limitations. Small BusinessEconomics, 35(1), 1–18. https://doi.org/10.1007/s11187-010-9286-3.
Krueger, N., Liñán, F., & Nabi, G. (2013). Cultural values andentrepreneurship. Entrepreneurship and RegionalDevelopment, 25(9–10), 703–707. https://doi.org/10.1080/08985626.2013.862961.
Kuntsche, E., Rehm, J., & Gmel, G. (2004). Characteristics ofbinge drinkers in Europe. Social Science & Medicine, 59(1),113–127. https://doi.org/10.1016/j.socscimed.2003.10.009.
Leifman, H. (2001). Homogenisation in alcohol consumption inthe European Union. Nordic Studies on Alcohol and Drugs,18 ( 1_ supp l ) , 1 5–30 . h t t p s : / / d o i . o rg / 10 . 1177/145507250101801S06.
Liñán, F., & Fernandez-Serrano, J. (2014). National culture, en-trepreneurship and economic development: different patternsacross the European Union. Small Business Economics,42(4), 685–701. https://doi.org/10.1007/s11187-013-9520-x.
Lintonen, T. P., &Konu, A. I. (2003). Adolescent alcohol beveragetype choices reflect their substance use patterns and attitudes.Journal of Youth and Adolescence, 32(4), 279–289.https://doi.org/10.1023/a:1023084927465.
MacAndrew, Craig, and Robert B. Edgerton. 1969. Drunken com-portment: a social explanation, Drunken comportment: asocial explanation. Oxford: Aldine.
Maderspacher, F. (2010). Lysenko rising.Current Biology, 20(19),R835–R837. https://doi.org/10.1016/j.cub.2010.09.009.
Madhani, H. D., Francis, N. J., Kingston, R. E., Kornberg, R. D.,Moazed, D., Narlikar, G. J., Panning, B., & Struhl, K. (2008).Epigenomics: a roadmap, but to where? Science, 322(5898),43–44. https://doi.org/10.1126/science.322.5898.43b.
Mandelbaum, D. G. (1965). Alcohol and culture. CurrentAnthropology, 6(3), 281–293.
Mannuzza, S., Klein, R. G., Bessler, A., Malloy, P., & LaPadula,M. (1993). Adult outcome of hyperactive boys: educationalachievement, occupational rank, and psychiatric status.Archives of General Psychiatry, 50(7), 565–576. https://doi.org/10.1001/archpsyc.1993.01820190067007.
Mihet, R. (2013). Effects of culture on firm risk-taking: a cross-country and cross-industry analysis. Journal of CulturalEconomics, 37(1), 109–151. https://doi.org/10.1007/s10824-012-9186-2.
Murphy, K. M., Shleifer, A., & Vishny, R.W. (1993). Why is rent-seeking so costly to growth? The American EconomicReview, 83(2), 409–414.
Nicolaou, N., Shane, S., Cherkas, L., Hunkin, J., & Spector, T. D.(2008a). Is the tendency to engage in entrepreneurship ge-netic? Management Science, 54(1), 167–179. https://doi.org/10.1287/mnsc.1070.0761.
Nicolaou, N., Shane, S., Cherkas, L., & Spector, T. D. (2008b).The influence of sensation seeking in the heritability ofentrepreneurship. Strategic Entrepreneurship Journal, 2(1),7–21. https://doi.org/10.1002/sej.37.
Nicolaou, N., Shane, S., Adi, G., Mangino, M., & Harris, J.(2011). A polymorphism associated with entrepreneurship:evidence from dopamine receptor candidate genes. SmallBusiness Economics, 36(2), 151–155. https://doi.org/10.1007/s11187-010-9308-1.
Nicolaou, N., Patel, P. C., &Wolfe, M. T. (2018). Testosterone andtendency to engage in self-employment. ManagementScience, 64(4), 1825–1841. https://doi.org/10.1287/mnsc.2016.2664.
Nofal, A. M., Nicolaou, N., Symeonidou, N., & Shane, S. (2018).Biology and management: a review, critique, and researchagenda. Journal of Management, 44(1), 7–31. https://doi.org/10.1177/0149206317720723.
North, Douglass C. 1990. Institutions, institutional change andeconomic performance: Cambridge university press.
Oosterbeek, H., Sloof, R., & van de Kuilen, G. (2004). Culturaldifferences in ultimatum game experiments: evidence from a
Z. Acs, E. Lappi1306
meta-analysis. Experimental Economics, 7(2), 171–188.https://doi.org/10.1023/b:exec.0000026978.14316.74.
Parker, Simon C. 2009. The economics of entrepreneurship:Cambridge University Press.
Pinillos, M.-J., & Reyes, L. (2011). Relationship betweenindividualist–collectivist culture and entrepreneurial activity:evidence from Global Entrepreneurship Monitor data. SmallBusiness Economics, 37(1), 23–37. https://doi.org/10.1007/s11187-009-9230-6.
Rodrik, D., Subramanian, A., & Trebbi, F. (2004). Institutionsrule: the primacy of institutions over geography and integra-tion in economic development. Journal of Economic Growth,9 ( 2 ) , 1 3 1 – 1 6 5 . h t t p s : / / d o i . o r g / 1 0 . 1 0 2 3/b:Joeg.0000031425.72248.85.
Roland, G. (2004). Understanding institutional change: fast-moving and slow-moving institutions. Studies inComparative International Development, 38(4), 109–131.
Room, R., & Mäkelä, K. (2000). Typologies of the cultural posi-tion of drinking. Journal of Studies on Alcohol, 61(3), 475–483. https://doi.org/10.15288/jsa.2000.61.475.
Ruhm, Christopher J., and William E. Black. 2002. “Does drink-ing really decrease in bad times?” Journal of HealthEconomics 21 (4):659-678. doi: https://doi.org/10.1016/S0167-6296(02)00033-4.
Russo, V. E. A., R. A. Martienssen, and A. D Riggs. 1996.Epigenetic mechanisms of gene regulation. Woodbury:Woodbury.
Schumpeter, Joseph Alois. 1934. The theory of economic devel-opment: an inquiry into profits, capital, credit, interest, andthe business cycle. Vol. 55: Transaction publishers.
Simpura, J., & Karlsson, T. (2001). Trends in drinking patternsamong adult population in 15 European countries, 1950 to2000: a review. Nordic Studies on Alcohol and Drugs,18 ( 1_ supp l ) , 3 1–53 . h t t p s : / / d o i . o rg / 10 . 1177/145507250101801S08.
Sobel, R. S. (2008). Testing Baumol: institutional quality and theproductivity of entrepreneurship. Journal of BusinessVenturing, 23(6), 641–655. https://doi.org/10.1016/j.jbusvent.2008.01.004.
Tabellini, G. (2010). Culture and institutions: economic develop-ment in the regions of Europe. Journal of the EuropeanEconomic Association, 8(4), 677–716. https://doi.org/10.1111/j.1542-4774.2010.tb00537.x.
Tukey, John W. 1977. Exploratory data analysis. Vol. 2: Reading,Mass.
Waddington, C. H. 1957.Weaver, I. C. G., Cervoni, N., Champagne, F. A., D’Alessio, A. C.,
Sharma, S., Seckl, J. R., Dymov, S., Szyf, M., &Meaney, M.J. (2004). Epigenetic programming by maternal behavior.Nature Neuroscience, 7, 847. https://doi.org/10.1038/nn1276 https://www.nature.com/art icles/nn1276#supplementary-information.
Weber, M. (1965). The protestant ethic and the spirit of capitalism.In 7th impression (first published in 1930). London: UnwinUniversity Books.
Wennekers, S., & Thurik, R. (1999). Linking entrepreneurship andeconomic growth. Small Business Economics, 13(1), 27–56.
Wennekers, S., Uhlaner, L., & Thurik, R. (2002). Entrepreneurshipand its conditions: a macro perspective. InternationalJournal of Entrepreneurship Education, 1(1), 25–64.
Wennekers, S., Thurik, R., van Stel, A., & Noorderhaven, N.(2007). Uncertainty avoidance and the rate of business own-ership across 21 OECD countries, 1976–2004. Journal ofEvolutionary Economics, 17(2), 133–160. https://doi.org/10.1007/s00191-006-0045-1.
White, Roderick E., Stewart Thornhill, and Elizabeth Hampson.2006. “Entrepreneurs and evolutionary biology: the relation-ship between testosterone and new venture creation.”Organizational Behavior and Human Decision Processes100 (1) :21-34 . do i : h t tps : / /do i .o rg /10 .1016 / j .obhdp.2005.11.001.
Wong, A. H., Gottesman, I. I., & Petronis, A. (2005). Phenotypicdifferences in genetically identical organisms: the epigeneticperspective. Human Molecular Genetics, 14, R11–R18.
Weitzel, U., Urbig, D., Desai, S., Sanders, M., & Acs, Z. (2010).The good, the bad, and the talented: entrepreneurial talent andselfish behavior. Journal of Economic Behavior &Organization, 76(1), 64–81. https://doi.org/10.1016/j.jebo.2010.02.013.
Publisher’s note Springer Nature remains neutral with regard tojurisdictional claims in published maps and institutionalaffiliations.
Entrepreneurship, culture, and the epigenetic revolution: a research note 1307