Embed Size (px)
Citation preview
Entrepreneurial Team Evolution in Technology-based
Firms: The case of IST Spin-off Community
Gonçalo Quinta Lourenço Marques Mendes
Master dissertation for the achievement of a Masters Degree in
Industrial Engineering and Management
Jury
Chairman: Prof. Rui Miguel Loureiro Nobre Baptista
Supervisor: Prof. António Miguel Areias Dias Amaral
Member: Dr. Daniela Andreia dos Santos Couto
November 2012
1
Agradecimentos
É com muita satisfação que posso agora escrever na língua de Camões, dando por terminada a
minha Dissertação de Mestrado em bom Português, um ano e muito esforço depois de ter começado
a escrever as primeiras palavras, em inglês. Muitas são as pessoas a quem a devo, e a quem ficarei
para sempre grato.
Em primeiro lugar, quero agradecer em especial à minha Mãe e ao meu Pai por todo o apoio e
carinho que me deram ao longo da vida, possibilitando-me estar aqui e agora a escrever as
derradeiras linhas desta Dissertação. Quero agradecer também em especial à Joana, minha
namorada, por todo o amor e força que me dá. Deixo aqui também uma homenagem aos meus
amigos de sempre, com quem partilhei aventuras e projectos, e que sempre me apoiaram. Aos meus
colegas de curso, agradeço também, em especial ao Vasco, que me tem acompanhado nas actuais
aventuras empreendedoras em que me encontro.
Ao Professor Miguel Amaral, meu orientador e professor, agradeço fortemente por todo o apoio dado
neste último ano, e sem o qual esta dissertação não seria realidade. Agradeço também a todos os
fundadores e empreendedores que participaram neste estudo, e que despenderam o seu precioso
tempo para me ajudar e partilhar comigo a sua experiência empreendedora.
A Todos, o meu Obrigado
2
Resumo
A presente Tese de Mestrado tem como principal objectivo a investigação da evolução da
composição de equipas empreendedoras ao longo das várias fases de desenvolvimento de uma start-
up de base universitária. Com base na literatura (Vohora et al., 2004), foram definidas três fases de
desenvolvimento: (1) Investigação & Desenvolvimento (pré start-up), Viabilidade do Negócio (pós
start-up) e Maturidade (pós start-up), sendo a empresa oficialmente criada entre a primeira e segunda
fase. Com o objectivo de criar sinergias e ligações fortes e activas entre novas empresas e a
universidade, o Instituto Superior Técnico criou através do seu gabinete de transferência de
tecnologia (TT@IST) uma comunidade de empresas Spinoff. Este facto permitiu-nos focar numa
população específica de empresas já bem identificadas para elaborar o presente estudo. Para esse
efeito foram construídos dois questionários, um para obter informação geral da empresa e outro para
obter informação pessoal sobre cada empreendedor envolvido nestas Start-ups.
Relativamente à metodologia, em conjunto com os questionários foram realizadas entrevistas com os
fundadores ou CEOs de cada empresa envolvida no estudo tendo-se preenchido os questionários em
conjunto com os mesmos da forma mais rigorosa e completa possível. Devido a este facto a taxa de
respostas bem-sucedidas aumentou, garantindo informação rigorosa e de qualidade.
Desta forma a nossa pergunta de investigação será: Como é que as equipas empreendedoras
evoluem ao longo das diferentes fases do processo de spin-out? A contribuição da nossa
investigação incidirá não só no facto de considerarmos uma perspetiva dinâmica na evolução da
composição das equipas, permitindo a identificação da evolução da heterogeneidade, assim como a
sua análise sob diferentes condições de investigação onde estas empresas desenvolveram a sua
I&D. Em linha com a literatura (Vanaelst et al., 2006), as nossas conclusões sugerem que as equipas
não são entidades imutáveis, sendo que estas evoluem ao longo das várias fases de
desenvolvimento, mudando a sua composição. A nossa análise sugere que a heterogeneidade muda
à medida que as equipas vão progredindo ao longo das várias fases de desenvolvimento,
aumentando particularmente no momento em que a empresa é oficialmente criada.
Palavras-chave (keywords): Empreendedorismo de base tecnológica; Empreendedorismo Académico;
Equipas Empreendedoras; Heterogeneidade de Equipas
3
Abstract
This Master Thesis investigates how the composition of entrepreneurial teams evolves over the
various phases of development of a university-based start-up firm. Based on the literature we defined
three development phases, which are: (1) Research & Opportunity Screening (pre-startup), (2) Proof
of Viability (post-startup) and (3) Maturity Phase (post-startup), being the firm officially created
between the first and second phases. With the objective of creating synergies and active links
between new ventures and the university, IST – Technical University of Lisbon has created a
community of spinoff firms through its TTO. This allowed us to focus on a very specific and already
well identified population for the present study. A pair of questionnaires was built, one to collect the
company’s general information and another to collect personal information on the entrepreneurs that
were involved in these new ventures.
Regarding the methodology, along with the questionnaires we scheduled an interview with the founder
or CEO of each company involved in the study and conjointly filled out the answers in the more
complete and rigorous way possible. By doing this we increased the response rate, guaranteeing good
and reliable information.
Therefore our research question is: How do entrepreneurial teams evolve along the different phases of
a spin-out process? The contribution of our research will not only lie in the fact that we will take a
dynamic team perspective, allowing for the identification of the team heterogeneity evolution, but also
on its analysis under the different research conditions were these companies developed their R&D. In
line with the literature’s findings (Vanaelst et al., 2006), our findings suggest that teams are not
immutable entities, as they evolve along the various phases of development, changing in composition.
Our analysis suggests that the team’s heterogeneity changes as it evolves throughout the various
phases of development, increasing particularly when the firm is officially created.
Keywords: Academic Entrepreneurship, Entrepreneurial Teams; Team Heterogeneity
4
Table of Contents
Abstract .................................................................................................................................................. 3
Tables List .............................................................................................................................................. 7
Figures List ............................................................................................................................................ 8
Acronyms ............................................................................................................................................... 9
1 Introduction .................................................................................................................................. 10
2 Knowledge Spillovers and University-based Entrepreneurship ............................................ 13
2.1 Knowledge Spill-over ............................................................................................................. 13
2.1.1 Innovation in Academia ................................................................................................. 13
2.1.2 Technology Transfer Efforts: US & Europe ................................................................... 13
2.1.3 Modeling a Technology Transfer Office ........................................................................ 15
2.1.4 Dimensions on Knowledge Spill-over ............................................................................ 16
2.1.5 TTO’s Licensing Strategies ........................................................................................... 16
2.2 University Entrepreneurship .................................................................................................. 17
2.2.1 Introduction to University Entrepreneurship .................................................................. 17
2.2.2 Factors influencing Start-up Survival ............................................................................. 17
2.2.3 Technology & Patent Protection .................................................................................... 18
2.2.4 Venture Capital .............................................................................................................. 18
2.2.5 Regional Environment ................................................................................................... 19
2.2.6 Career Experience ......................................................................................................... 19
2.2.7 Intellectual Human Capital ............................................................................................. 19
2.2.8 Distinct Universities Policies .......................................................................................... 20
2.3 New Firm Creation ................................................................................................................. 21
2.3.1 Better Managing New Firm Creation ............................................................................. 21
2.3.2 Degree of University Involvement.................................................................................. 22
2.3.3 Future Contributions ...................................................................................................... 23
3 Entrepreneurial Teams: Conceptual Background.................................................................... 24
3.1.1 Introduction .................................................................................................................... 24
3.1.2 Teams & Spinoff Performance ...................................................................................... 24
3.1.3 Entrepreneurial Team Definition .................................................................................... 24
5
3.1.4 Phases of Development ................................................................................................ 25
3.1.5 Entrepreneurial Team Development and Data Collection ............................................. 26
3.1.6 Team Evolution .............................................................................................................. 27
4 Data Collection and Methodology ............................................................................................. 29
4.1 Data Collection ...................................................................................................................... 30
4.1.1 Company’s Questionnaire ............................................................................................. 30
4.1.2 Personal Questionnaire ................................................................................................. 31
4.2 Methodology .......................................................................................................................... 32
4.2.1 Team Heterogeneity ...................................................................................................... 33
4.2.2 ANOVA One way factor analysis ................................................................................... 34
5 Descriptive Analysis ................................................................................................................... 35
5.1 Companies............................................................................................................................. 35
5.1.1 Introduction .................................................................................................................... 35
5.1.2 Area ............................................................................................................................... 35
5.1.3 Juridical Form ................................................................................................................ 36
5.1.4 Venture Capital .............................................................................................................. 36
5.1.5 Initial Investment ............................................................................................................ 36
5.1.6 Development Phases Transition Time .......................................................................... 37
5.1.7 Employees Evolution (2009-2012) ................................................................................ 37
5.1.8 Universities .................................................................................................................... 38
5.1.9 Economic Perspective ................................................................................................... 39
5.1.10 Innovation ...................................................................................................................... 40
5.1.11 Research Units .............................................................................................................. 41
5.1.12 University Support ......................................................................................................... 42
5.1.13 University’s Reputation .................................................................................................. 43
5.1.14 Established Partnerships ............................................................................................... 44
5.1.15 Internationalization ........................................................................................................ 45
5.1.16 University's Infrastructures and Services ...................................................................... 45
5.1.17 University’s Technology Transfer Office: TT@IST ........................................................ 49
6
5.1.18 Entrepreneurs’ Comments on the role played by Universities on technology-based
Entrepreneurship and its importance for Team Composition ........................................................ 52
5.2 Teams .................................................................................................................................... 54
5.2.1 Gender and Nationality .................................................................................................. 54
5.2.2 Team Size ...................................................................................................................... 54
5.2.3 Education: Degree Level, Scientific Area, Course and University ................................ 55
5.2.4 Professional Experience: Prior Situation, Area of Activity and Duration ....................... 57
5.2.5 Entrepreneurial Experience ........................................................................................... 59
6 Results: Team Heterogeneity ..................................................................................................... 60
6.1 Human Capital and Heterogeneity ........................................................................................ 60
6.1.1 Heterogeneity Evolution ................................................................................................ 61
6.2 Research Unit and Heterogeneity ......................................................................................... 64
6.2.1 Experience Heterogeneity ............................................................................................. 64
6.2.2 Course Heterogeneity .................................................................................................... 65
6.2.3 Entrepreneurial Experience Heterogeneity ................................................................... 66
6.2.4 Development Phases Transition Time .......................................................................... 66
7 Conclusions ................................................................................................................................. 68
8 References ................................................................................................................................... 72
9 Annexes ........................................................................................................................................ 76
9.1 List of Companies Interviewed- IST’s Spinoff Community .................................................... 77
9.2 Questionnaire to IST’s spinoff firms: Company Questionnaire ............................................. 78
9.3 Questionnaire to IST’s spinoff firms: Personal Questionnaire ............................................... 83
9.4 List of Companies Interviewed- Area of Activity Description ................................................. 86
7
Tables List
Table 1 - Initial Investment in Euros at the time of constitution of the society ...................................... 36
Table 2- Number of Companies per Sales Interval (with Development Phase) .................................... 39
Table 3- Companies Sales Variation (%) in 2011 (with depicted development phases) ...................... 40
Table 4- R&D: Research Units .............................................................................................................. 41
Table 5- University Support Importance: Development Phases ........................................................... 42
Table 6- Internationalization: Company’s Export Rate .......................................................................... 45
Table 7- Entrepreneur’s Nationalities .................................................................................................... 54
Table 8- Education: Entrepreneurs Degree Level ................................................................................. 55
Table 9- Education: Entrepreneurs Scientific Area ............................................................................... 56
Table 10- Education: Entrepreneurs University of Studies ................................................................... 57
Table 11- Professional Experience: Entrepreneurs Prior Situation ....................................................... 57
Table 12- Professional Experience: Area of Activity ............................................................................. 58
Table 13- Heterogeneity Mean Values throughout the 3 Development Phases ................................... 61
Table 14- Experience Heterogeneity per Research Unit (ANOVA one-way factor analysis) ................ 64
Table 15- Course Heterogeneity per Research Unit (ANOVA one-way factor analysis) ...................... 65
Table 16- Entrepreneurial Experience Heterogeneity per Research Unit (ANOVA one-way factor
analysis)................................................................................................................................................. 66
Table 17- Development Phases Transition Time per Research Unit (ANOVA one-way factor analysis)
............................................................................................................................................................... 66
Table 18- Tukey Test: Research Unit Factor on the Development Phases Transition Time (Research
and Opportunity Screening)................................................................................................................... 67
8
Figures List
Figure 1- Development Phases in the Spin-Out Process ...................................................................... 26
Figure 2 - Companies Areas of Activity (Nº of Companies per Area of Activity) ................................... 35
Figure 3 - Medium number of Employees per Company in the period 2009-2012 ............................... 37
Figure 4 - Total number of Employees for the entire population of Companies in the period 2009-2012
............................................................................................................................................................... 38
Figure 5 - Main Universities referenced as the main source for their Work Force (Nº of Companies that
referenced each University)................................................................................................................... 38
Figure 8 - University Support Level of Importance ................................................................................ 42
Figure 8 - University Reputation on Company’s Credibility Level of Importance .................................. 43
Figure 9 - University Reputation on Company’s Growth Level of Importance ...................................... 44
Figure 13 - University’s Infrastructures and Services: Coaching and Advices Level of Importance ..... 48
Figure 14 - University’s Infrastructures and Services: Workshops, Seminars or Congresses Level of
Importance ............................................................................................................................................. 49
Figure 15 - TT@IST: Intellectual Property Level of Importance ............................................................ 50
Figure 16 - TT@IST: Access to Business Networks Level of Importance ............................................ 51
Figure 17 - TT@IST: Access to Financing Sources Level of Importance ............................................. 51
Figure 18 - Entrepreneurial Team Size Evolution (Mean Values per Company for each Development
Phase) ................................................................................................................................................... 55
Figure 19 - Education: Entrepreneurs Courses ..................................................................................... 56
Figure 20 - Professional Experience: Previous Experience Duration ................................................... 58
Figure 21 - Entrepreneurial Teams Heterogeneity Evolution (throughout the various Development
Phases considered) ............................................................................................................................... 61
9
Acronyms
AUTM- Association of University Technology Managers
CEO- Chief Executive Officer
DNA- Deoxyribonucleic Acid
FCTUNL- Faculdade de Ciências e Tecnologias da Universidade Nova de Lisboa (Portuguese)
INESC- Instituto de Engenharia de Sistemas e Computadores
IP- Intellectual Property
IPO- Initial Public Offering
IST- Instituto Superior Técnico (Portuguese), Faculty of Engineering integrated within the Technical
University of Lisbon. Established in 2012, the new international term for IST is “Lisbon Tech”.
MIT- Massachusetts Institute of Technology
NRU– No Research Unit (Acronym created to name the group of companies that did not develop its
research in any Research Unit)
TLO- Technology Licensing Office
TTO- Technology Transfer Office
TUL- Technical University of Lisbon
UCP- Universidade Católica Portuguesa (Portuguese)
UK- United Kingdom
UNL- Universidade Nova de Lisboa (Portuguese)
UTL- Universidade Técnica de Lisboa (Portuguese)
US- United States of America
VC- Venture Capital
10
1 Introduction
Entrepreneurship as re-emerged as a vital factor in modern economies (Audretsch, 2003), mainly due
to the reduction of the extent of scale economies in manufacturing and the increasing importance of
innovation, reducing the relative importance of large-scale production (Brock and Evans, 1989).
Furthermore, the re-emergence of entrepreneurship has also been explained with increasing
globalization, which has contributed significantly to the emergence of comparative advantage in
knowledge-based activities (Audretsch and Thurik, 2001).
Recently, national governments have begun to restructure their policies regarding science funding in
order to encourage universities to commercialize their research results, as academic science is
increasingly being defined by national policy makers as a highly contributing factor to international
competitiveness (Johansson et al., 2005).
At a country level, being knowledge the most important raw material, and if its use depends on
institutional, organizational and cultural factors, a certain dynamism has to be expected by the public
research stream, which feels the need to keep up with the economic evolution (Chiesa and Piccaluga,
2000). This fact is of extreme importance, as there is considered to exist a problem in Europe which is
not exclusively the scientific production in itself but in its results transformation into new products
(Chiesa and Piccaluga, 2000).
One of the mechanisms to transform scientific knowledge into commercially viable products and
processes is the founding of new firms using the scientific results (e.g. university entrepreneurship,
university spinoffs, research based spinoff) achieved at universities (Johansson et al., 2005). In fact,
university entrepreneurship is an extremely important factor in the job creation, as according to the
Association of University Technology Managers (AUTM), spinoffs from American academic institutions
between 1980 and 1999 have contributed with 280.000 jobs to the U.S. economy (O’Shea et al.,
2005).
According to Klofsten and Jones-Evans (2000), one of the greatest challenges facing European
economies is the comparatively limited capacity to convert scientific breakthroughs and technological
achievements into industrial and commercial successes. As a direct consequence there is growing
awareness of the proactive approach being undertaken by academic institutions, with many adopting a
direct entrepreneurial role in collaborating with the industry (Klofsten and Jones-Evans, 2000).
As a part of entrepreneurship, university intellectual property based start-up firms have become an
important economic phenomenon. Across universities these start-up firms are an important vehicle for
the transfer of technology to the market, being an important mechanism for economic activity (Di
Gregorio and Shane, 2003). These start-up firms are disproportionately successful, as of the 2578
firms studied by Fini et al. (2010) created in the US since 1980, 70% are still in operation. In fact, the
number of start-up firms created to commercialize university inventions has grown from less than 200
in 1996 to nearly 500 in 2006 (Fini et al., 2010).
During the 19th Century, Cardinal John Newman defined the ideal university as one that would be
dedicated to the pursuit of knowledge for its own sake (Klofsten and Jones-Evans, 2000). However,
11
looking forward to the next centuries, the perception and role of universities has changed, as they are
no longer seen as mere institutions of higher learning. Nowadays universities are becoming important
engines of technological development and economic growth, being this fact more prominent in the
U.S. than in the E.U.
In the medium to long term, sustained competitiveness in the global economy will depend on
technological-based strengths and capabilities. These will include the ability to apply new
technologies, to develop new products and to access new markets in a successful way. Additionally,
these will help to incorporate best practices in the management of enterprises and the development of
skill levels across the full spectrum of the labor force (Klofsten and Jones-Evans, 2000).
Therefore, it is important to understand the entrepreneurial process and, particularly the
characteristics and behavior of technology-based entrepreneurs. According to the Schumpeterian
tradition (Schumpeter, The Theory of Economic Development, 1934), the entrepreneur is viewed as
part of a disequilibrium phenomenon, where new firms with entrepreneurial spirit are surpassing and
displacing less innovative players, renewing and accelerating economic growth. For Hebert and Link
(1989), an entrepreneur “is someone who specializes in taking responsibility for and making
judgmental decisions that affect the location, form and the use of goods, resources or institutions (…)”,
which is a more managerial approach, gathering an entire spectrum of different functions in the
individual. According with the OECD (1998), “Entrepreneurs are agents of change and growth in a
market economy and they can act to accelerate the generation, dissemination and application of
innovative ideas (…), but are also willing to take risks to see if their hunches are right”.
Previous research argues that entrepreneurship should be viewed not as an individual endeavor but
as a result of team work (Vanaelst et al., 2006; Clarysse and Moray, 2004). In this sense, it is
important to understand the role played – not only by the individual entrepreneur, but – by
entrepreneurial teams in the start-up process. Hence the purpose of this research is to study,
understand and analyze the process of team composition on academic start-up firms, with a special
focus on firms created within the scope of the Technical University of Lisbon (TUL), in particular in one
of its faculties, Instituto Superior Técnico (IST). The choice for IST relates, on one hand with the fact
entrepreneurial activities engaged in an engineering school have a very strong technological basis (for
example Di Gregorio and Shane, 2003, find that approximately 12% of university-assigned inventions
are transferred to the market through the creation of new organizations/firms); on the other hand, the
existence of a “Spin-off Community” composed of start-ups whose previous founders are IST alumni
acted as a strong motivation for bringing new knowledge on team homogeneity and heterogeneity
regarding founders academic backgrounds and labor market experience.
Throughout the following pages (Chapters 1- Introduction; 2- Knowledge spillovers and University-
based Entrepreneurship and 3- Entrepreneurial Teams: Conceptual Background) a clarification of
some very important concepts will take place, namely entrepreneurship, knowledge spill-overs,
entrepreneurial teams and many others. The methodologies used to collect and analyze the
information gathered are carefully exposed in Chapter 4- Data Collection and Methodology. Following
this chapter, a descriptive analysis of the data is exposed on two general topics (Chapter 5-

12
Descriptive Analysis): the companies and the entrepreneurial teams. The locus of this Master Thesis
is drawn in Chapter 6 (Results: Team Heterogeneity), where the evolution of the entrepreneurial
team’s heterogeneities are analyzed with depth. Finally, our conclusions will be drawn on Chapter 7
(Conclusions).
13
2 Knowledge Spillovers and University-based Entrepreneurship
2.1 Knowledge Spill-over
2.1.1 Innovation in Academia
Innovation has been highlighted as a key concept for entrepreneurship, being an integral aspect of
industry evolution (Parker, 2004), having its performance been positively affected by the use of
scientific knowledge by setting up and maintaining good industry-science relations (Macho-Stadler and
Veugelers, 2007).
In addition, scientific knowledge is considered to be the most important raw material concerning the
generation of economic growth, being large firms and public research labs presently it’s most
important producers (Chiesa and Piccaluga, 2000). Chiesa and Piccaluga consider that universities
are almost in every country the “largest national R&D laboratory”, being characterized by very high
spillovers.
Academic institutions are no longer considered to be isolated islands of knowledge, as governments at
European, national and local level are increasingly seeing higher education as a very significant force
in regional economies (Klofsten and Jones-Evans, 2000). Universities are increasingly considered to
be an integral part of the city or regional network of public facilities in many European countries, acting
as centers of attraction for individuals and enterprises.
Academic institutions are also increasingly being seen as a source of income and employment,
making a contribution to cultural life ultimately supporting economic development. Universities act as
catalysts enhancing the development of employment opportunities for the local industry. Regional and
National governments view emerging sectors such as knowledge based high technology as a crucial
source to generate employment opportunities, both direct and indirect, in the future (Klofsten and
Jones-Evans, 2000).
The knowledge spill-over coming from university’s research and technology has traditionally been
considered an important source of new technology (Nerkar and Shane, 2003). The technology transfer
is both important to entrepreneurial companies (Shane, 2002a) as for established companies, as in
some industrial sectors characterized by relevant scientific processes, some research results are
easily used by firms as components or products which are ready for use (Chiesa and Piccaluga,
2000). To make this point clear, a new discovery in biotechnology is directly usable by the
pharmaceutical companies as on the other hand a new theory or a new material may still need
research activities before reaching the stage of launching in the market (Chiesa and Piccaluga, 2000).
2.1.2 Technology Transfer Efforts: US & Europe
Some empirical evidences have showed that interactions between universities and the industry have
intensified in recent years (Macho-Stadler and Veugelers, 2007). The inventions developed within the
context of universities have experienced a substantial commercial growth, resulting in the generation
of increasing revenues and the creation of technology transfer offices (TTO’s) in universities in the
14
United States of America (US) (Chukumba and Jensen, 2005). These results are consequence of the
efforts of both government officials and university administrators, which have increasingly stimulated
and supported these activities (Fini et al., 2010).
Legislation as been undertaken to further support these interactions, as the Bayh-Dole Act of 1980 in
the US, which since its passage has caused universities to experience tremendous growth in the
number of companies formed around academic inventions, as well as a significant increase in
contracted research sponsored by the industry’s established firms (Shane, 2002a). This fact has also
contributed to an explosion on the growth of technology transfer offices in U.S. universities
(Chukumba and Jensen, 2005), as can be observed by Shane’s recent study (2010) where in his
sample 77% of TTO’s were created after the passage of the Bayh-Dole Act (Fini et al., 2010), further
proving this increase as almost a direct consequence of the passage of the Act.
The Act was intended, not to redirect faculty research but to facilitate the industrial application of
university research, by expanding university rights to patent and license inventions from federally
funded research (Thursby and Thursby, 2002). Combined with the Bayh-Dole Act, the 1985 Federal
Technology Act lead to a fundamental change in the way scientific discoveries at universities and
Federal laboratories were commercially exploited (Markman et al., 2005). Despite these facts, an
analysis of the overall US university patenting suggests that the patents issued to institutions that
entered into patenting and licensing after the Bayh-Dole act are less important and less general than
the patents issued before and after 1980 to the universities with longer experience in patenting
(Mowery and Ziedonis, 2002).
In fact, according to the Association of University Technology Managers (AUTM) annual surveys, the
royalties paid to US universities for the commercialization of its inventions increased 284% between
1993 and 2002, from 238$ to 915$ million (Chukumba and Jensen, 2005), as this increased licensing
reflects a greater willingness of faculty and university administrators to facilitate technology transfer,
being this surge in licensing a reflection of the intended effect of the legislation (Thursby and Thursby,
2002).
Nevertheless, a concomitant rise in university entrepreneurship can also be observed in Europe, as
The European Commission has launched several direct initiatives in an effort to proactively enhance
the transfer of university technology to the industry. However behind in their efficiency of technology
transfer when compared to their U.S. counterparts (largely due to differing legal systems), some
European universities, particularly in Germany, Italy, Sweden and the UK are rich sources of
technology (Rothaermel et al., 2007). Some initiatives are planned by the European Union for the
future decade which might produce interesting and positive implications, such as the Horizon 2020,
which is a financial instrument for research and innovation that is part of a flagship imitative aimed at
securing Europe’s global competitiveness. This instrument will run from 2014 to 2020 not only with a
80€ billion budget, but also providing a major simplification and a new set of rules (European
Commission, 2011).
15
2.1.3 Modeling a Technology Transfer Office
Generally the efforts to commercialize university´s inventions are made by the university’s technology
transfer offices (TTO´s), which are increasingly functioning like “technology intermediates”,
transmitting technological innovations from the lab bench to the industry (Markman et al., 2005). To
better understand and expose the entire process, we will model a three stage production process
involving multiple inputs in each stage (Thursby and Thursby, 2002), as these follow a sequence of
steps typically involved in the licensing of university inventions. The first stage starts with an invention
being disclosed (input) by a university member when he believes that his research results have
potential in a commercial perspective. In addition, first stage inputs also include federal and industry
research support as well as the contribution of TTO personnel. These disclosures are intermediate
inputs to a second stage in which the TTO applies for patents on the disclosures they believe to have
the characteristics to be patented and licensed, also being included as inputs to this stage a measure
of faculty quality to capture patent potential. Finally and as part of the third stage, patent applications
and disclosures are used along with other licensing inputs to produce license and option agreements
(Thursby and Thursby, 2002).
When the TTO is unable to capture significant interest in an established firm to acquire the license for
the new invention, it shelves the invention (Chukumba and Jensen, 2005). When the invention is
shelved, it is returned to the inventor, who may then seek to fund a start-up firm in order to explore its
invention. The TTO can also return the invention to its creator before even trying to find an established
firm to license it, having the ability to assist the inventor in the search for investors to fund a start-up
company (Chukumba and Jensen, 2005).
2.1.3.1 Technology Transfer Conditions
TTO’s play a key role in economic development by adopting various structural configurations and
enacting different transfer strategies that appear to correlate with varying levels of new venture
formation (Markman et al., 2005). Even though many universities are engaging in large efforts to
license developed innovations, there are conditions under which licensing can be more effective and
generate more positive externalities to the university itself.
In Shane’s study (2002b) he finds that inventions are more likely to be licensed when patents are an
effective mechanism for appropriating the returns to innovation, because the patent system reduces
the transaction costs of technology transfer. Additionally he finds that when patents are effective,
university technology transfer is generally licensed to non-inventors, as in the same scenario licensing
back to inventors increases the likelihood of license termination and reduces the likelihood of invention
commercialization.
Furthermore, the effectiveness of patents increases royalties earned for inventions licensed to non-
inventors (Shane, 2002b). In fact, the greatest growth in university commercial activity is on patent
applications, as this growth is attributed to increasingly entrepreneurial university administrators
(Thursby and Thursby, 2002).
16
2.1.4 Dimensions on Knowledge Spill-over
There are different dimensions on university – entrepreneurial firm collaboration, as researchers have
suggested a variety of ways in which universities interact with the private sector over technology
(Shane, 2002a).
These differences can be categorized along four dimensions, namely the industry-sponsored contract
research (1), consulting (2), the licensing of technology (3), and the university involvement in
technology development and commercialization (4). Relating to contracted research (1),
entrepreneurial companies are less likely than established firms to engage in this type of interaction as
the proportion of contract research made by entrepreneurial companies in minuscule (Government
agencies provide 70% of the funding, being the remainder funded by large firms and foundations)
(Shane, 2002a).
2.1.5 TTO’s Licensing Strategies
To further improve technology licensing activity many universities have adopted specific policies and
procedures to encourage technology licensing activities, as including rules on information disclosure,
royalty payments, consulting arrangements and equity investments, as several universities have even
incorporated into their strategic plans the technology licensing issue (Shane, 2002b).
In fact, universities that are most interested in generating short-term cash flows through their
Intellectual Property (IP) licensing strategies along with the motivation to minimize financial and legal
risks often lead to a strategic choice that does not support long term wealth trough the creation of new
ventures (Markman et al., 2005).
In Markman et al. study (2005), intended to measure the role of TTO’s in business incubation and new
venture formation, they interviewed 128 TTO directors, finding that for-profit TTO’s structures and
licensing in exchange for equity are most positively related to new venture formation, as nonprofit
TTO’s are unrelated to the generation of new ventures. Furthermore, they find that licensing in
exchange for sponsored research is negatively related to new venture formation, as well as TTO’s that
license in exchange for cash (approximately 72% of the studied TTOs choose this transfer strategy)
are least related to new venture creation.
17
2.2 University Entrepreneurship
2.2.1 Introduction to University Entrepreneurship
The research on this topic is clearly burgeoning, yet remaining a fragmented field (Rothaermel et al.,
2007), as no literature review existed that specifically focuses on university entrepreneurship. To take
stock of the current knowledge and to provide directions for future research and guideposts for policy
makers Rothaermel et al. (2007) developed a literature review (University entrepreneurship: a
taxonomy of the literature) focusing on this topic, providing an overarching framework to encompass
the different pieces making up university entrepreneurship.
From their analysis emerged four research areas inside university entrepreneurship, which are the (1)
entrepreneurial research university, (2) productivity of TTOs, (3) new firm creation and the (4)
environmental context including networks of innovation.
2.2.1.1 Significant Literature Facts
The creation of university start-ups varies significantly across universities, as some institutions like the
Massachusetts Institute of Technology (MIT) routinely transfer their technology through the formation
of new firms, while others like Columbia University rarely generate new firms (Di Gregorio and Shane,
2003). Technology licensing office (TLO) start-up firms are founded when a licensee of a university
assigned invention creates a new firm to explore it (Di Gregorio and Shane, 2003).
Additionally, research on the TLO start-ups from MIT indicates that roughly 20% of these companies
experienced an initial public offering (IPO) (Di Gregorio and Shane, 2003), in fact many university
technologies, from Genentech´s use of recombinant DNA to Lycos Internet search engines have led to
the creation of highly successful technological companies (Nerkar and Shane, 2003).
Furthermore, by encouraging faculty members to pursue private ventures outside the research lab,
Bank Boston Economics Department (1997) has calculated that MIT start-up companies generated
232 billion dollars worth of sales per year to the US economy (O’Shea et al., 2005).
2.2.2 Factors influencing Start-up Survival
2.2.2.1 Factors Overview
There are several factors influencing university start-up survival, ranging from the psychology of the
founders (Roberts, 1991) to their social ties (Shane and Stuart, 2002) and the regional environment of
their creation (Saxenian, 1990). The nature of a firm’s technology base also influences its survival, as
new firm survival in fragmented industries is enhanced by radical technology and broad scope patent
protection (Nerkar and Shane, 2003).
Moreover, the decision to create a new company to explore university invention is influenced by both
micro and macro-level factors (Di Gregorio and Shane, 2003), being some of them coincident with the
factors influencing start-up survival.
At a micro-level, the influences on this decision are the shown research on attributes of technological
inventions (Shane, 2001a), inventors career experience (Levin and Stephan, 1991; Shane and
18
Khurana, 2000), psychological make-up (Roberts, 1991) which is also considered a start-up survival
factor, and their research skills (Zucker et al., 1998). At a macro-level, the decision is also influenced
by research on technology regimes (Shane, 2001b), the strength of patent protection in a line of
business (Shane, 2002b), university’s intellectual property (Goldfarb et al., 2001) and human resource
policies (Kenney, 1986).
2.2.3 Technology & Patent Protection
In relation to patent protection, Shane (2002a) argues that entrepreneurial companies are more reliant
than large firms on intellectual property protection, since they lack on the complementary assets in
manufacturing and distributing that large firms use to obtain competitive advantage from new
technology.
As briefly referenced before in this Master Thesis, Shane (2001a) stakes that the attributes of
technological inventions are also a factor influencing the decision to create a start-up, more
particularly the effect of technological opportunities on the probability that they would be
commercialized through the creation of new firms.
He finds that technologically more important inventions are more likely to be commercialized through
the creation of new firms, as in addition inventions are more likely to be commercialized through the
creation of new organizations when the scope of patent rights is broader, enabling the inventor to
protect the development against imitation from a broader range of competing technologies.
Finally, his findings also point out that when inventions are technologically more radical they are more
likely to be commercialized through the creation of new firms (Shane, 2001a).
2.2.4 Venture Capital
Furthermore, when comparing the effects of many different firm and industry characteristics, Shane
and Stuart (2002) found that the presence of venture capitalist funding is the single largest contributor
to the likelihood of the firm to experience an IPO. They ultimately conclude that these social capital
endowments trough their impact on fund-raising have long-term positive influences on the
performance of new ventures (Shane and Stuart, 2002).
For Di Gregorio and Shane (2003) there are four macro-level explanations for cross-university
variation in TLO start-up activity.
In the first place they find that universities located in geographically rich areas in venture capital could
be more likely to generate TLO start-ups, because the abundance of venture capital makes resource
acquisition easier for entrepreneurs.
On the other hand the number of local venture capitalists, which generally is considered to be a
positive determinant, may have a baffling effect, as it is found to depress the firm rate in a determined
area, perhaps due to the role that these venture capitalist firms have in packing a considerable
number of scientists into one large firm, which is likely to go public sooner (Zucker et al., 1998).
19
2.2.5 Regional Environment
The success of several companies built in the Silicon Valley region, described by A. Saxenian, is
inseparable from a regional environment rich in skills and know-how, fostering new firm formation and
collective learning (Saxenian, 1990). She also stakes that these capabilities don’t distinguish the
region of Silicon Valley by itself, but are also combined with the existence of a variety of regional
institutions such as Stanford University, trade associations, local business organizations, including a
myriad of specialized consulting and venture capitalists.
The social relationships with shared professional experiences and repeated interaction allows
technical and market information to be exchanged between individuals, allowing the establishment of
business contacts and even the conceiving of new enterprises (Saxenian, 1990).
2.2.5.1 Incubators
Di Gregorio and Shane´s (2003) results show that there are many policies which are advocated as
mechanisms to enhance the creation of new ventures, but appear to have in fact little effect.
Particularly, they stake that the effects of university affiliated incubators and university venture capital
funds are insignificant. Regarding the presence of incubators, these have insignificant effect on start-
up rates because potential entrepreneurs do not consider the use of incubators when making the start-
up decision.
As a consequence, the existence of incubators is merely shifting start-up firms of location, instead of
increasing the amount of new firms created (Di Gregorio and Shane, 2003). The firms that remain
longer in the incubator tend to raise fewer funds, are less likely to graduate in a timely fashion and are
less likely to obtain venture capital funding (Rothaermel and Thursby, 2005). On the other hand, firms
that stay longer in the incubator tend to generate significantly higher revenues than their counterparts
(Rothaermel and Thursby, 2005).
2.2.6 Career Experience
The inventor’s prior career experience, described by Shane and Khurana (2000) enables potential
founders to mitigate problems associated with the liability of newness, as prior experience provides at
least three advantages that make people more likely to found firms in the future. First of all experience
provides existing social relationships easiness for founders to obtain the needed resources, as it also
provides firm organizing skills and role familiarity.
Additionally, when an opportunity departs from established categories or trajectories, career
experience provides the legitimacy necessary to motivate others to reallocate resources in ways that
are counter to the existing norms (Shane and Khurana, 2000).
2.2.7 Intellectual Human Capital
As for inventor’s research skills, there is a tight connection between intellectual human capital created
by frontier research and the founding of firms in the industry (Zucker et al., 1998). Zucker et al. (1998)
stake that at least for the biotechnology industry, which is a high technology industry, the growth and
20
location of intellectual human capital was the principal determinant of the growth and location of the
industry itself, as this industry is a testament to the value of basic scientific research.
Furthermore they conclude that even though intellectual human capital tended to flourish around great
universities, the existence of outstanding scientists measured in terms of research productivity played
a key role over, above and separate from those universities and government research funding.
2.2.7.1 Social Ties
As mentioned, one of the main factors influencing start-up survival are the founder’s social ties,
described by Shane and Stuart (2002), where particular emphasis was placed on how social capital
endowments affect the development of entrepreneurial ventures. They stake that the presence of
direct and indirect ties to venture investors prior to firm founding sharply decreases the hazard of firm
mortality, increasing the likelihood of start-ups to obtain funding.
2.2.8 Distinct Universities Policies
Di Gregorio and Shane (2003) argue that the particular university where the company is generated
also influences university start-up creation. Universities that conduct industry-funded research could
be more likely to generate TLO start-ups because they are more likely than other universities to make
commercially-oriented discoveries (Di Gregorio and Shane, 2003).
Another considered factor is that universities that are more intellectually imminent could be more likely
to generate TLO start-ups because intellectual imminence allows schools to produce new
technologies of actual or perceived higher quality.
In addition to intellectual imminence, O’Shea et al. (2005) find that as a function of a university’s
history and past success there are different resource stocks available, being these resource
combinations shown to be a relevant factor in explaining inter-university variation in spinoff activity.
Last but not the least, Di Gregorio and Shane (2003) also consider as a macro-level factor for cross-
university start-up variation that universities that adopt certain policies could generate more TLO start-
ups because those policies provide greater incentives for entrepreneurial activity.
Using data obtained through database and survey sources on 141 US universities, O’Shea et al.
(2005) find that there is a need to develop a commercially supportive culture within universities, as the
image of academic entrepreneurship as a career path for academics to pursue should be enhanced
through developing incentives for academics to participate in the entrepreneurial process.
Furthermore, they find critical importance on the recruitment and development of science and
engineering academic stars, as well as the need for an active partnership and financial support from
the industry’s and government funding agencies. In particular, they also argue in favor of the
development of a commercial infrastructure to enable the valorization of academic research to occur
(O’Shea et al., 2005).
21
2.3 New Firm Creation
This research stream focuses on university entrepreneurial activities in the form of the creation of new
firms. Among the various instruments available to research in this field, spinoffs appear to be one
where the recent literature exhibits the most understanding (Rothaermel et al., 2007).
2.3.1 Better Managing New Firm Creation
The research stream has progressively illuminated the knowledge on how to better manage the
process of creating new firms through two approaches (Rothaermel et al., 2007; Lockett et al., 2005).
The first approach refers to the factors that impede the formation and growth of spin-offs, such as
unrealistic expectations, informational gaps, resource scarcity, cultural problems and the lack of
competency in founding teams.
2.3.1.1 Success Factors
The other approach includes the identification of the success factors that are behind the process of
new firm creation, encompassing around four main themes (Rothaermel et al., 2007). These themes
are the intellectual property, resources, networking activities of the university spinoffs and the overall
university involvement.
Relating to intellectual property strategy, including policies such as making equity investments in TLO
start-ups and maintaining a low inventor´s share of royalties are associated with a higher number of
university spinoffs (Di Gregorio and Shane, 2003; Rothaermel et al., 2007).
A second theme focuses on resource endowments and the way they play an important factor in the
success of university spinoffs. Prior research on this topic shows that the quality of human resources
(i.e. such as founding teams, university faculty, TTO personnel), the technology endowments,
university funding, industry and venture capitalists play an important role on the success of new
ventures (Rothaermel et al., 2007).
These issues were previously discussed and exposed on this Master Thesis based on O’Shea et al.
(2005) and Shane and Stuart (2002) studies.
The third theme referenced focuses on the networking activities of university spinoffs, exploring the
impact on the success of new ventures of founder’s intention on networking as well as the frequency
of interaction with external parties such as other firms, public institutions, research organizations or
other external organizations (Grandi and Grimaldi, 2003; Rothaermel et al., 2007).
As discussed before, social ties with venture capitalists have been shown to increase funding rates at
the same time reducing the probability of failure (Shane and Stuart, 2002). Grandi and Grimaldi´s
(2003) conclusions point out that the articulation of roles positively affects the intention to set up
relations with external agents, and that a high degree of completeness in the team composition
undermines the intention to set up relations with external agents, as complete teams should be aware
of the risk they run by being in the absence of pressure to seek external interactions.
22
They point out that particularly in the start-up phases this situation can be dangerous since it may
prevent spinoffs from becoming well-known in the market (undermining the promotion of their
businesses and the attraction of clients) as well it can prevent companies from accessing the potential
external parties that could provide the needed resources for future growth (Grandi and Grimaldi,
2003).
Additionally, academic entrepreneurs bring into the new ventures their own social ties so that if they
were used to interact frequently with specific external agents before the spinoff, they are likely to
continue interacting in an equal or higher frequency than before with these external agents after the
establishment of the new firm (Grandi and Grimaldi, 2003).
In their study, Grandi and Grimaldi (2003) also found evidence that the reputation effect is operating in
the sense that several companies had benefited from their affiliation to a specific university,
particularly in the start-up phase, as the spun off from a credible university represents, in the eyes of
external parties, a guarantee of quality of the new venture.
The fourth and last theme considered on this approach concerns with the overall university system,
comprising university policies, incubation models and the research environments (Di Gregorio and
Shane, 2003; Rothaermel et al., 2007; Chiesa and Piccaluga, 2000). Chiesa and Piccaluga (2000)
stake that it seems possible to conclude that there is an Italian (and perhaps European) model for
research spinoff companies which differs from the American (Anglo-Saxon) one, as the Italian model
is characterized by low risk levels and modest growth rates in contrast with the American one.
In fact, the common thread along these factors is the degree to which university entrepreneurship
revolves around the creation of new ventures, being a factor that varies significantly between
universities (Rothaermel et al., 2007).
2.3.2 Degree of University Involvement
Most scholars find that a high degree of university involvement in the process of new venture creation
is highly beneficial, being associated with greater reputation effects and higher survival rates and
performance (Clarysse et al.,2005; Di Gregorio and Shane, 2003), as others expose that greater
university involvement can contribute to a certain dependency and delayed graduation from incubators
(Johansson et al., 2005; Rothaermel and Thursby, 2005).
For a university or research institution to engage in a strategy to commercialize its technology through
the creation of spinout companies can utilize a range of different support activities designed to provide
the venture with the resources and capabilities it needs to develop (Clarysse et al., 2005). Clarysse et
al, (2005) identified three different models for spinning-out companies, the low selective model, the
supportive model and the incubator model. Essential resource features (e.g. physical resources,
human resources, networking resources) are summarized for each model, providing a good picture of
the supportive models.
The continued dependency on the university for research may be problematic for the spinoff firm, as
the firm is dependent for its research on an organization that is in turn dependent on budget
allocations from the state (in the case of Europe, particularly Sweden) (Johansson et al, 2005).
23
2.3.3 Future Contributions
Rothaermel et al. recommend that future studies can fruitfully contribute to this debate by addressing
the varying conditions (e.g. effectiveness of intellectual property, firm development and technology
stage, and the founding team’s composition) under which the different levels of university involvement
prove to give an advantage or disadvantage for the newly created ventures.
Particularly, (with exceptions to the contributions of Nicolaou and Birley, 2003; Clarysse and Moray,
2004; Ensley and Hmieleski, 2005; and Vanaelst et al., 2006) they consider examining the founding
teams of university-based technology start-ups as the locus of analysis when explaining early firm
performance differences between firms as an under-studied area.
In the following pages (Chapter 3- Founding Teams) an extensive review of the literature is exposed
on the topic of entrepreneurial teams, clarifying aspects from the concept definition to the team’s
phases of development.
24
3 Entrepreneurial Teams: Conceptual Background
3.1.1 Introduction
The decision to create an academic start-up firm challenges the researchers since they have to enter
a business community that is different from the scientific community in which they had been active so
far (Vanaelst et al., 2006). There are different resources needed for a successful launch of the
venture, such as technology resources (which are usually in place) and of course the financial and
human resources, which often seem to be the most critical (Vanaelst et al., 2006).
Previous research shows in fact that these two resources (human and financial) are closely
interrelated, as early-stage venture capital funds use the “business experience” of the entrepreneurial
team as well as the question of a well-balanced team as a main criterion to allocate investment
(Vanaelst et al., 2006; Clarysse and Moray, 2004). Consequently many high technology start-ups do
not receive the needed funding because they lack of an experienced manager within the
entrepreneurial team (Clarysse and Moray, 2004).
3.1.2 Teams & Spinoff Performance
Relating to the relationship between teams and firm overall performance the literature has examined
this issue on the “upper echelon perspective” (Hambrick and Mason, 1984), stating that general
organizational outcomes (performance levels and strategic choices) are partially predicted by the
managerial background characteristics of the firm’s top management team.
Nevertheless, there is a key difference between the large firms and spinoffs being that the former are
already established firms in the market, whereas spinoffs are emerging new ventures passing through
various stages before becoming an established organization in the market (Vanaelst et al., 2006).
As referenced by Rothaermel et al. (2007), current issues on founder teams revolve around issues
concerning team composition and its effect on new firm performance, being team composition
observed in relation to the founder´s affiliation, business experience and education profile.
This research has so far fruitfully informed us about the importance of team heterogeneity (Ensley and
Hmieleski, 2005), inviting future researchers to further identify how university spin-outs can more
effectively develop a founding team that will conduct to a superior firm performance (Rothaermel et al.,
2007).
3.1.3 Entrepreneurial Team Definition
In order to define the concept of an “entrepreneurial team” there has been a considerable debate of
what this concept exactly means (Vanaelst et al., 2006).
There is a most frequently used definition which states that an entrepreneurial team is composed of
two or more individuals who jointly establish a business in which they have equal financial interest
(Kamm et al., 1990), as these individuals are present from the pre-start-up phase of the venture,
before it has even begun to build goods or services commercially available in the market.
25
However, according to Cooney (2005), two substantive elements of the previous definition are subject
to disagreement, as the inclusion of the term “equal” financial interest and the focus on “pre-start-up”.
A more open interpretation of financial interest is required, as well as the fact that an individual can
become part of the entrepreneurial team at any stage of the maturation of the firm (Cooney, 2005).
Summarizing, following the lines of Cooney, 2005, we shall define entrepreneurial teams as “two or
more individuals who have significant financial interest and participate actively in the development of
the enterprise”.
3.1.4 Phases of Development
Furthermore, in order to investigate the entrepreneurial events of the spinout process, the dynamic
composition and changes in spin-out teams will be addressed.
Drawing on the work of Vohora et al., 2004, spinoffs are bound to encounter “critical junctures” that
must be overcome in order to make an evolutionary transition from one phase of development to
another. These phases of development or growth are identified as the (1) research, (2) opportunity
framing, (3) pre-organization, (4) re-orientation stage, and last but not the least, the (5) sustainable
returns phase (Vohora et al., 2004).
At the interstices between these phases Vohora et al. (2004) identified four critical junctures that spin-
out companies have to overcome if they are to be successful, which are opportunity recognition,
entrepreneurial commitment, threshold of credibility, and finally the threshold of sustainability.
The first phase is composed upon scientific research (1) that has to take place within the university
academic departments over a number of years, as during the second phase (2) the transition between
a recognized opportunity and the formative steps to creating a new venture mainly focuses on the
academic and the TTO.
In this phase, either independently or together, the academic and the TTO work together towards
examining if the opportunity has sufficient overall value to warrant further effort in pursuing its
commercialization.
In the third phase, which is pre-organization (3), the management of the new venture will start to
implement strategic plans, involving decision-making for the present moment and the future regarding
the resources and capabilities to develop, the resources and knowledge to acquire as well as were
and when to access them. In the re-orientation phase (4), the new ventures attempt to generate
returns by offering their product(s) or service(s) of value to potential customers.
As a consequence of these attempts, entrepreneurial teams face the challenges of continuously
identifying, acquiring and integrating different resources, and reconfiguring them. The last phase in
this framework is the sustainable returns phase (5), were new ventures are characterized by attaining
the capability to have sustainable returns.
Reaching such a phase is the fundamental objective of entrepreneurial teams, as these have to
access and reconfigure their resources to assemble the capabilities enabling the firm to reach
sustainable returns.
26
Clarysse and Moray (2004) described a similar classification of the development phases, having
identified a research phase (during which the project is prepared to undergo incorporation into a
spinout) and a phase of external capitalization.
Vanaelst et al. (2006) modified the delineation of the different stages of development by taking the
research phase and opportunity framing phase together as the first phase in the spinout process,
simultaneously using a comparable delineation for the other development phases.
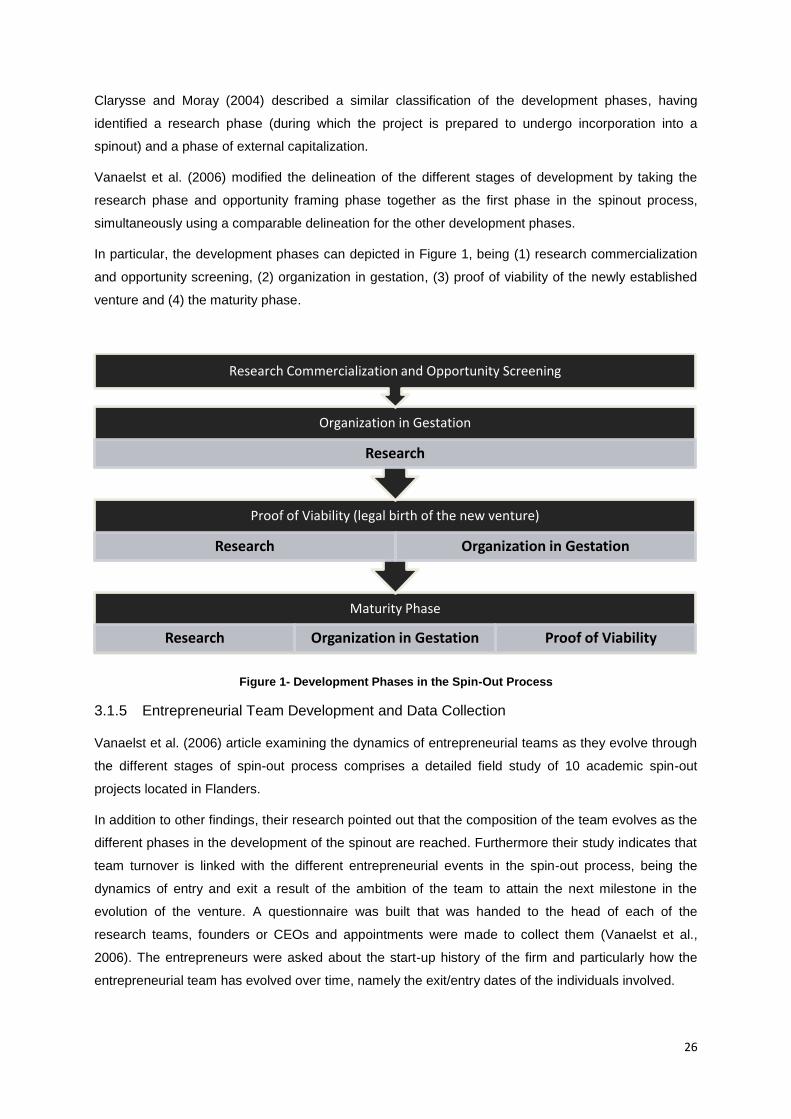
In particular, the development phases can depicted in Figure 1, being (1) research commercialization
and opportunity screening, (2) organization in gestation, (3) proof of viability of the newly established
venture and (4) the maturity phase.
Figure 1- Development Phases in the Spin-Out Process
3.1.5 Entrepreneurial Team Development and Data Collection
Vanaelst et al. (2006) article examining the dynamics of entrepreneurial teams as they evolve through
the different stages of spin-out process comprises a detailed field study of 10 academic spin-out
projects located in Flanders.
In addition to other findings, their research pointed out that the composition of the team evolves as the
different phases in the development of the spinout are reached. Furthermore their study indicates that
team turnover is linked with the different entrepreneurial events in the spin-out process, being the
dynamics of entry and exit a result of the ambition of the team to attain the next milestone in the
evolution of the venture. A questionnaire was built that was handed to the head of each of the
research teams, founders or CEOs and appointments were made to collect them (Vanaelst et al.,
2006). The entrepreneurs were asked about the start-up history of the firm and particularly how the
entrepreneurial team has evolved over time, namely the exit/entry dates of the individuals involved.
Maturity Phase
Research Organization in Gestation Proof of Viability
Proof of Viability (legal birth of the new venture)
Research Organization in Gestation
Organization in Gestation
Research
Research Commercialization and Opportunity Screening
27
For cases still in the project stage all members of the research team were asked to fill out the
questionnaire as for the established ventures each member of the management team had to do the
same. They also collected background information on all individuals entering and exiting the team in
terms of age, gender, education and other factors, allowing the evaluation of the diversity of the team
during the different stages of firm development (Vanaelst et al., 2006). Some of these procedures
were followed in our own study, as is exposed ahead in Chapter 4- Data Collection and Methodology.
The individual questionnaire consisted on two parts, the first aimed at asking background information
and a second part focused on the identification of personal orientation required to realize venture
success, being this questionnaire based on the Focus questionnaire of Van Muijen et al. (1999).
Depending on the phase in which the venture was, the number of persons filling out this study ranged
from two to eight, being all members of the entrepreneurial team directly involved in the study.
To measure the heterogeneity of categorical variables: (H) = - ∑ , they followed Ucbasaran et
al. (2003) using the Teachman’s (1980) scale. This measure took into account how team members are
distributed among the different categories of a variable, being the total number of categories of a
variable equal to n, and is the fraction of team members falling into each category.
For purposes of entrepreneurial experience in the terms of heterogeneity, yes (1) and no (0) were
used. To collect information on experience heterogeneity several categories were taken into account,
beginning with (1) research and development, (2) marketing, (3) management, (4) consulting and
engineering and (5) other experience (e.g. legal) (Vanaelst et al., 2006).
3.1.6 Team Evolution
Throughout the different phases in the development of spinouts team evolution is identified, showing
that the concept of “team” evolves through the different entrepreneurial events in the spin-out process
(Vanaelst et al., 2006).
3.1.6.1 Research Commercialization & Opportunity Screening
Referring to this first phase of spinout development, Vanaelst et al. (2006) stake that at the heart of
every spinout lie research activities which are mostly performed by a research team or within a
department. In the locus of strengthening research activities, researchers establish contacts within the
scientific community, leading sometimes to jointly research projects.
As researchers may find it necessary to protect their intellectual property they get in touch with the
TTO who will then guide them through the needed procedures to fill a patent.
When the screening of market opportunities starts to unravel, researchers may rely on coaches or
consultants which will then take the advisory function in the spinout trajectory. Vanaelst et al. (2006)
name these people as privileged witnesses due to their involvement in the creation of the spinout but
simultaneously distanced from the creation activities. The privileged witness along with the
researchers form together the prefounding team (Vanaelst et al., 2006). As mentioned before, the
establishment of a spinout is one of several possible options through which one can commercialize
research.
28
3.1.6.2 Organization in Gestation
Taking on the decision to commercialize the research being made with the creation of a spinout the
prefounding team evolves to the second phase in the framework established by Vanaelst et al. (2006).
They found that not all the researchers aspire to be part of a new venture, as some of them leave the
prefounding team, typically taking the option of having an exclusive career in academia.
In addition they found that in several cases the TTO or even the researchers found the need to attract
a surrogate entrepreneur, as this new actor plays the role of actively leading the legal establishment of
the company.
The combination of the researchers and the surrogate entrepreneurs composes what can be
considered as the founding team. After the legal creation of the firm two major teams are born, the
board of directors and the management team (Vanaelst et al., 2006). As exposed by Vanaelst et al.
(2006), the researchers are in most cases members of both teams, but can also be members of only
one of the two, being this situation comparable for the surrogate entrepreneurs.
As for the privileged witness from the first phase (TTO and other scientists), he may be seated on the
board but he is less likely to be on the management team. The board of directors may naturally
include representatives from financial partners (e.g. venture capitalists, seed funds from universities).
3.1.6.3 Proof of Viability
In this third phase both the teams earlier described strive together to strengthen the overall viability of
the newly created venture. A change in the composition of the board may occur as venture capitalists
may be attracted as additional external financial resources are often needed to pursue the success of
the new firm.
A change in the management team may also take place as a business developer or CEO can be
appointed by the venture capitalists. Further can occur in this phase, as venture capitalists may want
to withdrawal from the new firm, or members of the management team may take a seat on the board
as consequence of obtaining shares of the company (Vanaelst et al., 2006).
3.1.6.4 Maturity Phase
As on the previous phase the management team and the board may suffer changes due to several
rounds of integrating venture capitalists. In post-start-up teams more formal terms are used to indicate
the roles performed within the team, as the marking out of different roles is more pronounced than for
pre-start-up teams (Vanaelst et al., 2006).
29
4 Data Collection and Methodology
The target population of companies for our study is a particular set of spinoffs that originated from IST
(Annex 8.1- List of Companies Interviewed- IST’s Spinoff Community). Through its TTO (TT@IST),
IST managed to create a community of spinoffs, successfully maintaining a linkage between these
companies and the university. This fact did not allow us to seize this privileged contact, but
nevertheless a direct contact between us and the companies was established with the objective to
schedule a meeting for an interview. All the companies belonging to the community were contacted.
Of the total of 37 companies officially composing the IST’s Spinoff Community, we managed to collect
reliable information for 23 companies, representing a 62,16% success rate. The list of companies
successfully interviewed are in the Annex 8.1- List of Companies Interviewed- IST’s Spinoff
Community.
Additionally, we collected information on two other companies that don’t belong to the community yet
(as they are very recent), but were created in the same environment and by entrepreneurs from IST.
These companies are Talkdesk and Cell2B.
30
4.1 Data Collection
In order to collect the necessary data we took on the method of the questionnaire, using a particular
population of university spinoffs. As was often stated before, with the objective of creating synergies
and active contact between new ventures and the university, the faculty IST of the Technical
University of Lisbon has created a community of spinoff firms through its TTO.
We scheduled an interview with the founder or CEO of each company involved in the study and
conjointly filled out the answers in the more complete and rigorous way possible. By doing this we
increased the response rate, guaranteeing good and reliable information. The first option to collect the
data was through personal interviews with one of the founders of these companies, having been
conducted by telephone when a personal meeting was not possible. When accepted, the
conversations were recorded for future analysis.
As predicted, our interviews unfolded in a more close relationship with the entrepreneur, potentially
broadening the scope and increasing the quality of our study. In fact, some contributions for future
entrepreneurial policies were made by the entrepreneurs, as is exposed in the sub-chapter “5.1.18
Entrepreneurs’ Comments on the role played by Universities on technology-based Entrepreneurship
and its importance for Team Composition”.
Two distinct questionnaires were built, one to obtain general information about the company itself (e.g.
history, evolution, area of activity, dates involved) and the evolution of the team (entry and exit of
members, dates involved), and another to collect basic personal information of each member of the
entrepreneurial team, such as background information, education and past experience. Following
Vanaelst et al. (2006) we also collected the personal basic information of past members of the
entrepreneurial team, allowing us to evaluate the experimental diversity of the team at different stages
of the spin-out process.
4.1.1 Company’s Questionnaire
The company’s questionnaire (Annex 8.2- Questionnaire to IST’s spinoff firms: Company
Questionnaire) was written in Portuguese, being divided in 4 different sections. The first is for general
basic information of the company (I- Company’s Identification), allowing us to know its name, location
(district), area of activity, number of partners and the juridical form of the company.
The second section (II- Generic Company Characterization) goes into more quantitative detail, such
as the initial investment made, the number of employees in the past 4 years (and the universities were
they made their studies), and the volume of sales (by interval) and its variation. On what concerns the
number of employees, Birch et al. (1997) claimed that between 1969 and 1976, small firms employing
fewer than twenty workers generated 66 per cent of all new US jobs, and firms with fewer than 100
employees accounted for 82 per cent of net job gains. The collection of the evolution of the number of
employees for these companies is in fact important for future studies to understand if the OECD
(1998) claim that there is now ‘general agreement’ that the share of jobs accounted for by small firms
has steadily increased since the early 1970s in most developed economies (Parker, 2004) is found in
our population of companies.
31
On profits information we could only collect if the company was having profits or losses, as for some
companies this is privileged information being very hard to disclose it. In this same section we
registered the dates when each company progressed throughout each development phase (Vanaelst
et al., 2006), as well the number of patents requested or registered in these phase to measure
innovation. To measure innovation, a narrow definition uses the number of patents registered with
national or international patent office’s (Parker, 2004).
However, there are some limitations of patent count measures, as many innovative contributions are
not registered. Nevertheless, we choose this approach as these are technology firms from an
engineering school, being this a population of companies were patents may play a vital role. On the
other hand, broader definitions might include any method or marketing ploy that helps to create
competitive advantage (Parker, 2004), which was not assessed by our questionnaire.
The third section of the questionnaire (III- Characterization of the Entrepreneurial Team) was built to
control for the various entrepreneurs that were involved in the company’s creation, registering the
phases in which they were present. This chapter produces key information for the computation of the
team’s heterogeneity (this section was drawn on the needed inputs to conduct a heterogeneity
analysis of the entrepreneurial teams described by Vanaelst et al. (2006)).
The fourth section (IV- Interaction with the University) collects information related on where the
company was developing its research (which Research Unit) at the same time it collects qualitative
information not only on the degree of importance given by the companies to the university support and
its reputation, but also on some the Research Unit’s infrastructures and services provided to the
entrepreneurial teams. In this section information was collected on the scope of the companies
established partnerships as well as on the internationalization of the businesses.
Finally, in the end of the section, there was also promoted an open discussion with the founders on
what concerns the role that the university should play on the subject of entrepreneurship in the future,
as well as an open discussion on the entrepreneurial teams and the main characteristics conducive to
success on the point of view of these entrepreneurs, based on their accumulated experience.
4.1.2 Personal Questionnaire
The personal questionnaire (Annex 8.3- Questionnaire to IST’s spinoff firms: Personal Questionnaire)
was also written in Portuguese, being composed of only one section. At first, basic information was
collected, such as the entrepreneurs name, nationality, age and gender (Parker, 2004), as well the
post that he holds in the company, and also the dates involved with the entrance and exit (if
necessary) in the company. The fact that the entrepreneur is a partner was also controlled (yes or no),
nevertheless all these entrepreneurs had a determinant role in the creation of these new ventures,
independently of the fact if they were partners or not.
The basic human capital information was collected to conduct the heterogeneity analysis proposed by
this Master Thesis, such as past professional experience, education (Parker, 2004; Vanaelst et al.,
2006) and also entrepreneurial experience (Vanaelst et al., 2006).
32
4.2 Methodology
Our analysis will begin focusing on a descriptive analysis of the data collected, namely the data
collected with general information from the companies but also the data collected on personal
information on each one of the entrepreneurs ever involved in the creation of these companies. To
accomplish this analysis we not only used basic descriptive statistics but also crossed the main data,
pointing out some trends and particularities of this population of spinoffs.
The locus of our analysis is the dynamics and evolution of entrepreneurial teams as they climb
through the different stages (milestones) considered for a spin-out process. The contribution of our
research will lie in the fact that we will take a dynamic team perspective, allowing for the identification
of team heterogeneity along the spin-out process. The team’s heterogeneities will also be analyzed
under the Research Unit were their R&D was conducted to analyze the implications that this factor
may have on team’s heterogeneity. This analysis will be conducted with the ANOVA One way factor
analysis, which is a method that will be carefully exposed ahead in this chapter.
First of all, and after an extensive description of team evolution throughout the phases of development
considered by Vanaelst et al. (2006) we will clarify how we will take on this aspect in our work by
defining our own phases of development.
In order to further simplify these phases of development we will take the organization in gestation and
the proof of viability phases together, ending up with three final phases as basis for our analysis.
These phases will be (1) Research & Opportunity Screening (pre-startup), (2) Proof of Viability (post-
startup) and (3) Maturity Phase (post-startup).
We will consider that the formal creation of the new venture will occur between the first and second
phases of development. Following the work of Vanaelst et al. (2006) we will take the inspiration of
Vohora et al. (2004), considering that each new venture must pass through the previous phase in
order to climb the several development stages, involving each phase an iterative and nonlinear
process of development.
Therefore our research question is: How do entrepreneurial teams evolve along the different phases of
a spin-out process? The contribution of our research will not only lie in the fact that we will take a
dynamic team perspective, allowing for the identification of the team heterogeneity evolution, but also
on its analysis under the various Research Units were these companies developed their R&D.
33
4.2.1 Team Heterogeneity
As an indicative of a broad range of human capital within a team, Heterogeneity facilitates the
gathering of information from a variety of sources, inducing alternative interpretations and
perspectives (Ucbasaran et al., 2003). Some studies exploring heterogeneity have generally tended to
focus on demographic heterogeneity as a proxy for cognitive characteristics (Hambrick and Mason.,
1984). Within a team, higher levels of heterogeneity are expected to be associated with less
duplication of specific skills and human capital.
Team member’s functional background can be viewed as a more appropriate surrogate indicator of
the heterogeneity of human capital that is necessary for a new venture’s development. Seeking to
ensure a good business development, owners of private firms with a small pool and array of resources
may seek to increase the overall human capital of the firm (Ucbasaran et al., 2003).
Taking on the words of Vanaelst et al. (2006), teams are not immutable entities, evolving over the
different stages of the spinout process. In fact, as their research points out to the fact that teams are
not immutable entities, they conjecture that when individuals join a team at some stage in the spin-out
process, they bring more heterogeneity to the team (Vanaelst et al., 2006).
To measure the heterogeneity of categorical variables, we followed Ucbasaran et al. (2003) using the
Teachman’s (1980) scale:
(H) = - ∑
H – Heterogeneity
n – Total number of categories
- Fraction of team members falling in the category i
This measure takes into account how team members are distributed among the different categories of
a variable, being the total number of categories of a variable equal to n. The parcel is the fraction of
team members falling into each category.
Four different heterogeneity categories were considered for analysis and computation, scientific area
heterogeneity, course heterogeneity, experience heterogeneity and entrepreneurial experience
heterogeneity. In accordance to the literature, we computed experience heterogeneity and
entrepreneurial experience heterogeneity (Vanaelst et al., 2006; Ucbasaran et al., 2003). Additionally,
we followed the same method (Ucbasaran et al., 2003) to compute scientific area heterogeneity and
the course heterogeneity.
These four heterogeneity categories were calculated for each company in each development stage
considered (Research and Opportunity Screening; Proof of Viability; Maturity), giving us a dynamic
perspective of heterogeneity.
34
4.2.2 ANOVA One way factor analysis
When only one factor is at study (independent variable), the analysis of the variance is designated as
“One Way ANOVA”. In the analysis that is performed in this Master Thesis recurring to this method the
factor will be the Research Unit factor, which is composed of three groups (k=3). The behavior of the
dependent variable (e.g. experience heterogeneity) may be explained by the following model (Barnes,
1994; Marôco, 2010):
Where i=1,…, dimension of the sample; j = 1,…,k , is the global mean, αi is an effect of the treatment
of the sample i, and which is an error associated with the observation.
In this method, the following hypotheses are considered:
vs.
These hypotheses test if the factor in study (in our case, the Research Unit were each team
conducted its R&D) has (or not) a significant effect on the dependent variable.
The hypothesis considers = =…= = 0, while the hypothesis considers that at least one
is different from 0. The ANOVA test statistics is given by F, which is the division between the variance
of the factor in study and the variance of the errors (Marôco, 2010).
The hypothesis is rejected if F is greater or equal (F ≥) than the critical value of the Snedecor
distribution in the first percentile (for this study we considered ). The ANOVA F statistics has
the F-Snedecor distribution when the dependent variable has a normal distribution in all the groups
and the population variances are homogeneous (Welch, 1951). If the dependent variable has a normal
distribution and the variances are heterogeneous the Welch (1951) statistical test is used.
The process by which the decision for the rejection or non rejection of the hypothesis H0 begins with
the Levene test of the homogeneity of the variances, verifying if the p-value is above (considered
homogeneous) or below (considered not homogeneous) =0,05. If this test is verified as
homogeneous we proceed to the ANOVA analysis to obtain the level of significance. Otherwise (if it is
considered as not homogeneous), we proceed to the Welch’s robustness test to obtain the level of
significance (Marôco, 2010).
When the obtained significance value is above 0,05, we consider the non rejection of the hypothesis
H0,otherwise, this hypothesis is rejected. In this last case we can conclude that there are different
behaviors between the groups for the issue being analyzed. On this stage, in order to identify which
group or groups have a different behavior, the multiple comparisons Tukey test should be made
(Marôco, 2010).
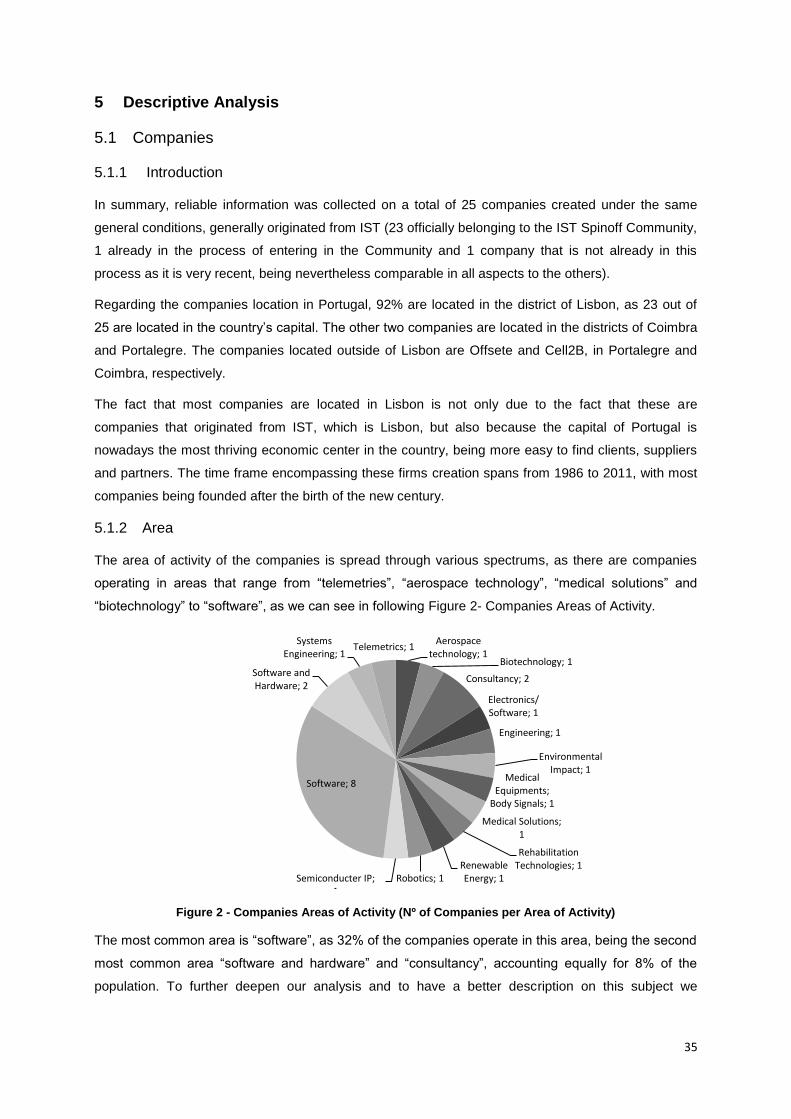
35
5 Descriptive Analysis
5.1 Companies
5.1.1 Introduction
In summary, reliable information was collected on a total of 25 companies created under the same
general conditions, generally originated from IST (23 officially belonging to the IST Spinoff Community,
1 already in the process of entering in the Community and 1 company that is not already in this
process as it is very recent, being nevertheless comparable in all aspects to the others).
Regarding the companies location in Portugal, 92% are located in the district of Lisbon, as 23 out of
25 are located in the country’s capital. The other two companies are located in the districts of Coimbra
and Portalegre. The companies located outside of Lisbon are Offsete and Cell2B, in Portalegre and
Coimbra, respectively.
The fact that most companies are located in Lisbon is not only due to the fact that these are
companies that originated from IST, which is Lisbon, but also because the capital of Portugal is
nowadays the most thriving economic center in the country, being more easy to find clients, suppliers
and partners. The time frame encompassing these firms creation spans from 1986 to 2011, with most
companies being founded after the birth of the new century.
5.1.2 Area
The area of activity of the companies is spread through various spectrums, as there are companies
operating in areas that range from “telemetries”, “aerospace technology”, “medical solutions” and
“biotechnology” to “software”, as we can see in following Figure 2- Companies Areas of Activity.
Figure 2 - Companies Areas of Activity (Nº of Companies per Area of Activity)
The most common area is “software”, as 32% of the companies operate in this area, being the second
most common area “software and hardware” and “consultancy”, accounting equally for 8% of the
population. To further deepen our analysis and to have a better description on this subject we
Aerospace technology; 1
Biotechnology; 1
Consultancy; 2
Electronics/ Software; 1
Engineering; 1
Environmental Impact; 1
Medical Equipments;
Body Signals; 1
Medical Solutions; 1
Rehabilitation Technologies; 1 Renewable
Energy; 1 Robotics; 1 Semiconducter IP; 1
Software; 8
Software and Hardware; 2
Systems Engineering; 1
Telemetrics; 1
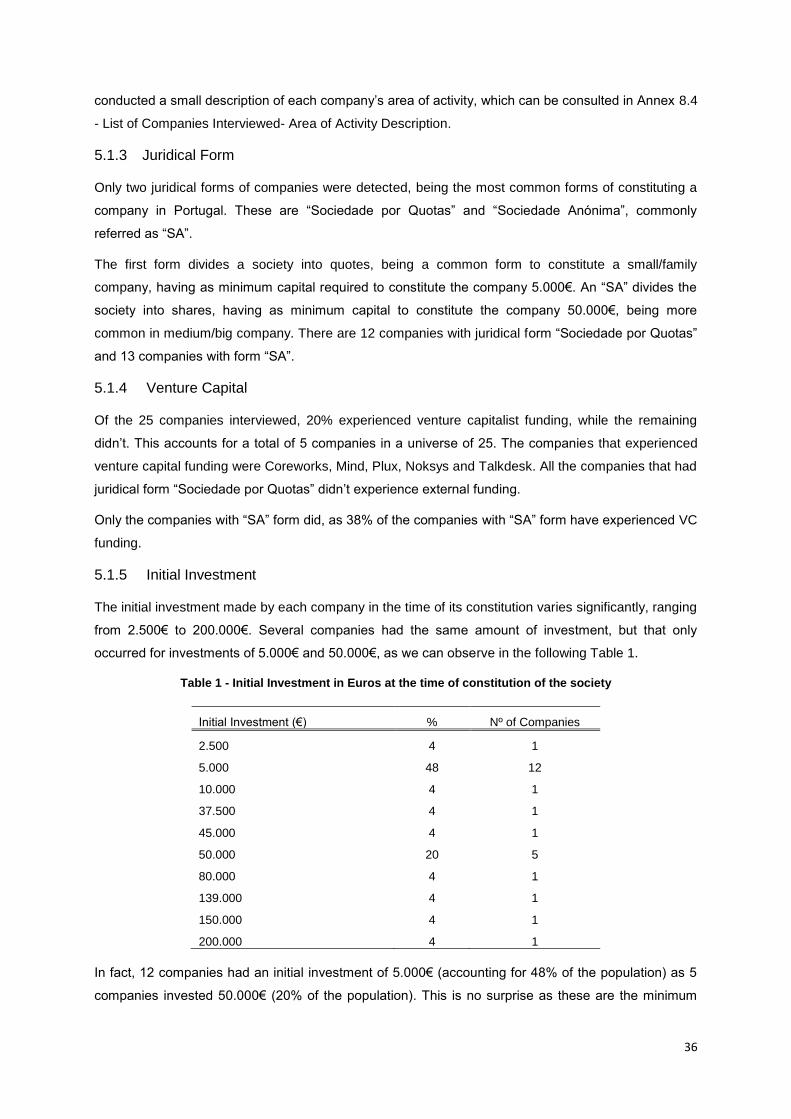
36
conducted a small description of each company’s area of activity, which can be consulted in Annex 8.4
- List of Companies Interviewed- Area of Activity Description.
5.1.3 Juridical Form
Only two juridical forms of companies were detected, being the most common forms of constituting a
company in Portugal. These are “Sociedade por Quotas” and “Sociedade Anónima”, commonly
referred as “SA”.
The first form divides a society into quotes, being a common form to constitute a small/family
company, having as minimum capital required to constitute the company 5.000€. An “SA” divides the
society into shares, having as minimum capital to constitute the company 50.000€, being more
common in medium/big company. There are 12 companies with juridical form “Sociedade por Quotas”
and 13 companies with form “SA”.
5.1.4 Venture Capital
Of the 25 companies interviewed, 20% experienced venture capitalist funding, while the remaining
didn’t. This accounts for a total of 5 companies in a universe of 25. The companies that experienced
venture capital funding were Coreworks, Mind, Plux, Noksys and Talkdesk. All the companies that had
juridical form “Sociedade por Quotas” didn’t experience external funding.
Only the companies with “SA” form did, as 38% of the companies with “SA” form have experienced VC
funding.
5.1.5 Initial Investment
The initial investment made by each company in the time of its constitution varies significantly, ranging
from 2.500€ to 200.000€. Several companies had the same amount of investment, but that only
occurred for investments of 5.000€ and 50.000€, as we can observe in the following Table 1.
Table 1 - Initial Investment in Euros at the time of constitution of the society
In fact, 12 companies had an initial investment of 5.000€ (accounting for 48% of the population) as 5
companies invested 50.000€ (20% of the population). This is no surprise as these are the minimum
Initial Investment (€) % Nº of Companies
2.500 4 1
5.000 48 12
10.000 4 1
37.500 4 1
45.000 4 1
50.000 20 5
80.000 4 1
139.000 4 1
150.000 4 1
200.000 4 1
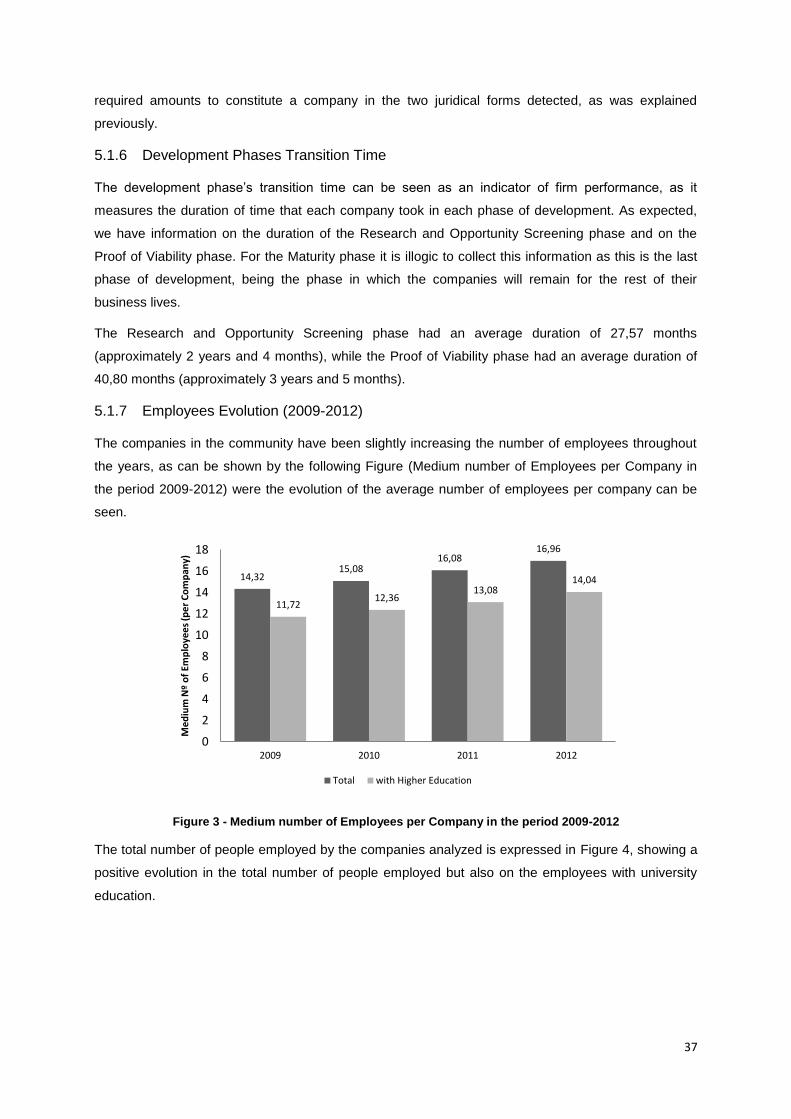
37
required amounts to constitute a company in the two juridical forms detected, as was explained
previously.
5.1.6 Development Phases Transition Time
The development phase’s transition time can be seen as an indicator of firm performance, as it
measures the duration of time that each company took in each phase of development. As expected,
we have information on the duration of the Research and Opportunity Screening phase and on the
Proof of Viability phase. For the Maturity phase it is illogic to collect this information as this is the last
phase of development, being the phase in which the companies will remain for the rest of their
business lives.
The Research and Opportunity Screening phase had an average duration of 27,57 months
(approximately 2 years and 4 months), while the Proof of Viability phase had an average duration of
40,80 months (approximately 3 years and 5 months).
5.1.7 Employees Evolution (2009-2012)
The companies in the community have been slightly increasing the number of employees throughout
the years, as can be shown by the following Figure (Medium number of Employees per Company in
the period 2009-2012) were the evolution of the average number of employees per company can be
seen.
Figure 3 - Medium number of Employees per Company in the period 2009-2012
The total number of people employed by the companies analyzed is expressed in Figure 4, showing a
positive evolution in the total number of people employed but also on the employees with university
education.
14,32 15,08
16,08 16,96
11,72 12,36
13,08 14,04
0
2
4
6
8
10
12
14
16
18
2009 2010 2011 2012
Me
diu
m N
º o
f Em
plo
yee
s (p
er
Co
mp
any)
Total with Higher Education
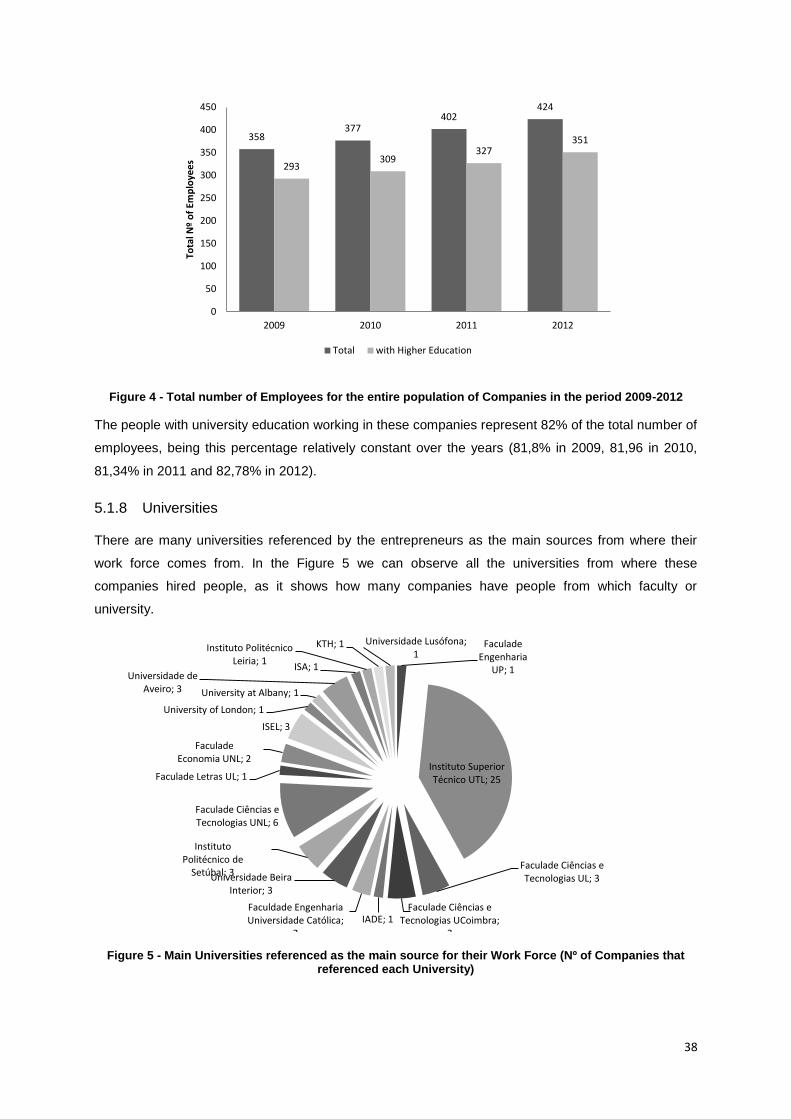
38
Figure 4 - Total number of Employees for the entire population of Companies in the period 2009-2012
The people with university education working in these companies represent 82% of the total number of
employees, being this percentage relatively constant over the years (81,8% in 2009, 81,96 in 2010,
81,34% in 2011 and 82,78% in 2012).
5.1.8 Universities
There are many universities referenced by the entrepreneurs as the main sources from where their
work force comes from. In the Figure 5 we can observe all the universities from where these
companies hired people, as it shows how many companies have people from which faculty or
university.
Figure 5 - Main Universities referenced as the main source for their Work Force (Nº of Companies that referenced each University)
358 377
402 424
293 309
327 351
0
50
100
150
200
250
300
350
400
450
2009 2010 2011 2012
Tota
l Nº
of
Emp
loye
es
Total with Higher Education
Faculade Engenharia
UP; 1
Instituto Superior Técnico UTL; 25
Faculade Ciências e Tecnologias UL; 3
Faculade Ciências e Tecnologias UCoimbra;
3
IADE; 1 Faculdade Engenharia Universidade Católica;
2
Universidade Beira Interior; 3
Instituto Politécnico de
Setúbal; 3
Faculade Ciências e Tecnologias UNL; 6
Faculade Letras UL; 1
Faculade Economia UNL; 2
ISEL; 3
University of London; 1
University at Albany; 1
Universidade de Aveiro; 3
ISA; 1
Instituto Politécnico Leiria; 1
KTH; 1 Universidade Lusófona; 1
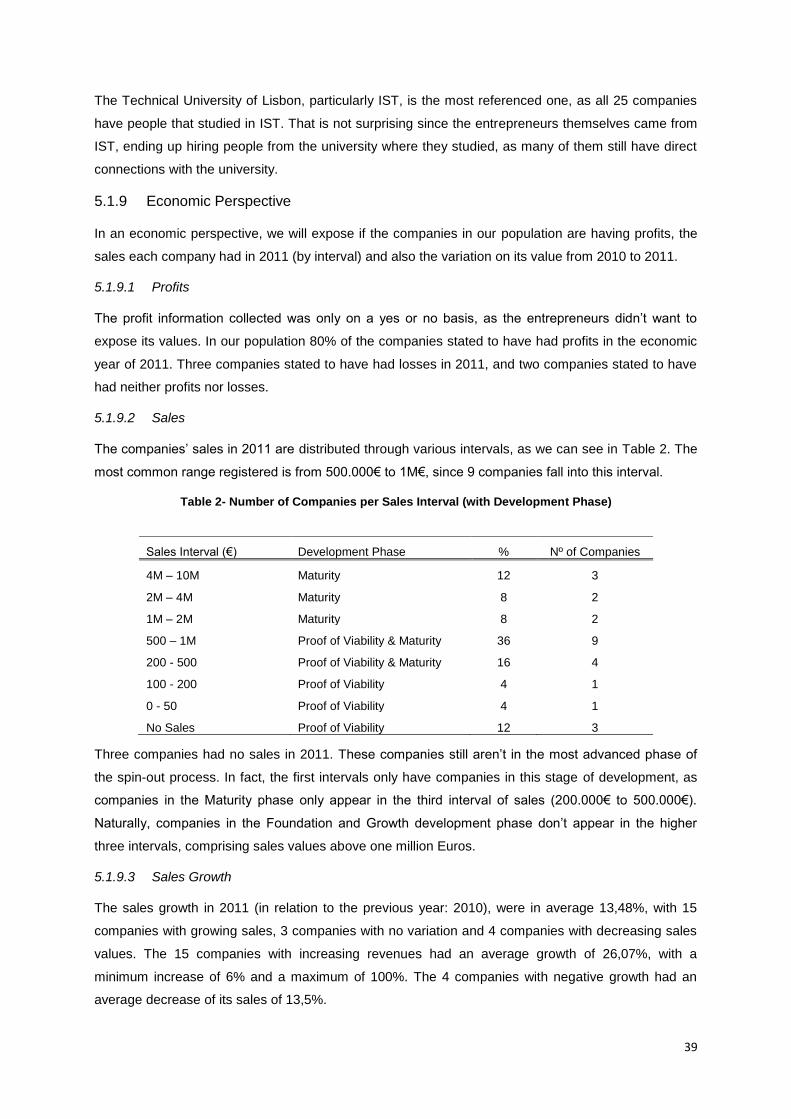
39
The Technical University of Lisbon, particularly IST, is the most referenced one, as all 25 companies
have people that studied in IST. That is not surprising since the entrepreneurs themselves came from
IST, ending up hiring people from the university where they studied, as many of them still have direct
connections with the university.
5.1.9 Economic Perspective
In an economic perspective, we will expose if the companies in our population are having profits, the
sales each company had in 2011 (by interval) and also the variation on its value from 2010 to 2011.
5.1.9.1 Profits
The profit information collected was only on a yes or no basis, as the entrepreneurs didn’t want to
expose its values. In our population 80% of the companies stated to have had profits in the economic
year of 2011. Three companies stated to have had losses in 2011, and two companies stated to have
had neither profits nor losses.
5.1.9.2 Sales
The companies’ sales in 2011 are distributed through various intervals, as we can see in Table 2. The
most common range registered is from 500.000€ to 1M€, since 9 companies fall into this interval.
Table 2- Number of Companies per Sales Interval (with Development Phase)
Three companies had no sales in 2011. These companies still aren’t in the most advanced phase of
the spin-out process. In fact, the first intervals only have companies in this stage of development, as
companies in the Maturity phase only appear in the third interval of sales (200.000€ to 500.000€).
Naturally, companies in the Foundation and Growth development phase don’t appear in the higher
three intervals, comprising sales values above one million Euros.
5.1.9.3 Sales Growth
The sales growth in 2011 (in relation to the previous year: 2010), were in average 13,48%, with 15
companies with growing sales, 3 companies with no variation and 4 companies with decreasing sales
values. The 15 companies with increasing revenues had an average growth of 26,07%, with a
minimum increase of 6% and a maximum of 100%. The 4 companies with negative growth had an
average decrease of its sales of 13,5%.
Sales Interval (€) Development Phase % Nº of Companies
4M – 10M Maturity 12 3
2M – 4M Maturity 8 2
1M – 2M Maturity 8 2
500 – 1M Proof of Viability & Maturity 36 9
200 - 500 Proof of Viability & Maturity 16 4
100 - 200 Proof of Viability 4 1
0 - 50 Proof of Viability 4 1
No Sales Proof of Viability 12 3
40
As we can observe from Table 3, only the companies in the Maturity phase of development had
decreasing sales in 2011.
Table 3- Companies Sales Variation (%) in 2011 (with depicted development phases)
Nevertheless the average growth of the companies in the Foundation and Growth phase (excluding
the companies with no sales), was of 14,88%, being the same value for the companies in the Maturity
phase of 15,57%, although all the companies with decreasing sales are in this phase.
This is due to the fact that all three companies with 0% variation in sales are in the Foundation and
Growth phase, combined with that fact several companies in the Maturity phase have considerable
high values in sales growth (6 companies with sales growth ≥ 20%).
5.1.10 Innovation
Innovation was deemed by Schumpeter to be a central aspect of entrepreneurship. In what concerns
innovation, we measured the number of patents requests and registrations made by each company in
each development phase (to control for its evolution).
There are several reasons why small firms might possess an advantage over large firms at innovating
(Parker, 2004). In the population analyzed, we conclude that 10 different companies requested or
registered a patent. In fact, most companies didn’t opt by patent applications for various reasons.
Sales Variation (%) Development Phase % Nº of Companies
100 Maturity 4 1
50 Proof of Viability & Maturity 8 2
20 Proof of Viability & Maturity 24 6
19 Proof of Viability 4 1
16 Maturity 4 1
10 Proof of Viability & Maturity 12 3
6 Maturity 4 1
0 Proof of Viability & Maturity 24 6
- 2 Maturity 4 1
-10 Maturity 4 1
-12 Maturity 4 1
-30 Maturity 4 1
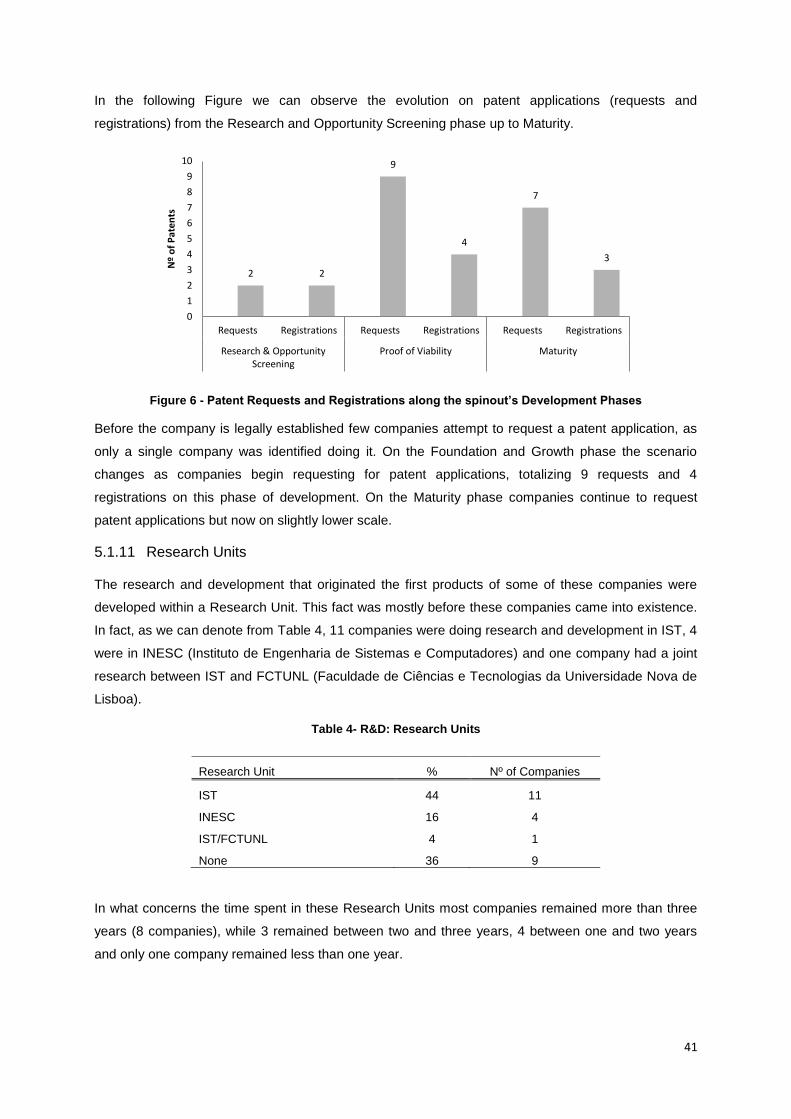
41
In the following Figure we can observe the evolution on patent applications (requests and
registrations) from the Research and Opportunity Screening phase up to Maturity.
Figure 6 - Patent Requests and Registrations along the spinout’s Development Phases
Before the company is legally established few companies attempt to request a patent application, as
only a single company was identified doing it. On the Foundation and Growth phase the scenario
changes as companies begin requesting for patent applications, totalizing 9 requests and 4
registrations on this phase of development. On the Maturity phase companies continue to request
patent applications but now on slightly lower scale.
5.1.11 Research Units
The research and development that originated the first products of some of these companies were
developed within a Research Unit. This fact was mostly before these companies came into existence.
In fact, as we can denote from Table 4, 11 companies were doing research and development in IST, 4
were in INESC (Instituto de Engenharia de Sistemas e Computadores) and one company had a joint
research between IST and FCTUNL (Faculdade de Ciências e Tecnologias da Universidade Nova de
Lisboa).
Table 4- R&D: Research Units
In what concerns the time spent in these Research Units most companies remained more than three
years (8 companies), while 3 remained between two and three years, 4 between one and two years
and only one company remained less than one year.
2 2
9
4
7
3
0
1
2
3
4
5
6
7
8
9
10
Requests Registrations Requests Registrations Requests Registrations
Research & OpportunityScreening
Proof of Viability Maturity
Nº
of
Pat
en
ts
Research Unit % Nº of Companies
IST 44 11
INESC 16 4
IST/FCTUNL 4 1
None 36 9
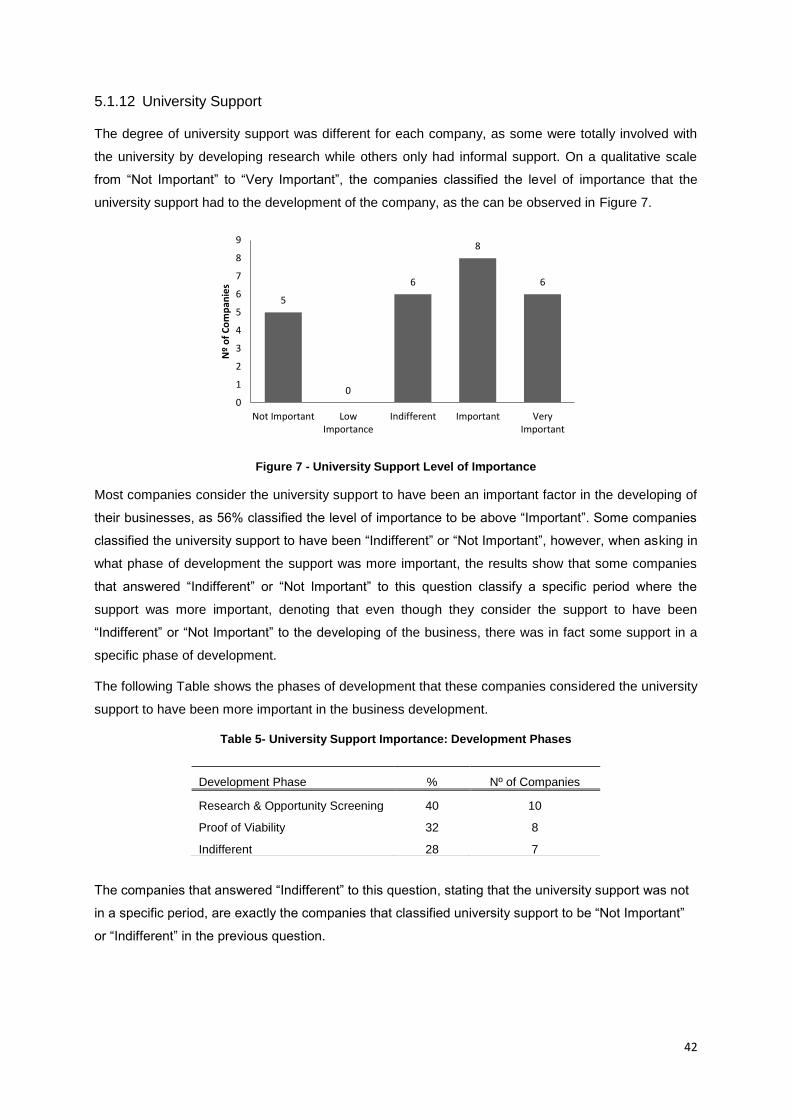
42
5.1.12 University Support
The degree of university support was different for each company, as some were totally involved with
the university by developing research while others only had informal support. On a qualitative scale
from “Not Important” to “Very Important”, the companies classified the level of importance that the
university support had to the development of the company, as the can be observed in Figure 7.
Figure 7 - University Support Level of Importance
Most companies consider the university support to have been an important factor in the developing of
their businesses, as 56% classified the level of importance to be above “Important”. Some companies
classified the university support to have been “Indifferent” or “Not Important”, however, when asking in
what phase of development the support was more important, the results show that some companies
that answered “Indifferent” or “Not Important” to this question classify a specific period where the
support was more important, denoting that even though they consider the support to have been
“Indifferent” or “Not Important” to the developing of the business, there was in fact some support in a
specific phase of development.
The following Table shows the phases of development that these companies considered the university
support to have been more important in the business development.
Table 5- University Support Importance: Development Phases
The companies that answered “Indifferent” to this question, stating that the university support was not
in a specific period, are exactly the companies that classified university support to be “Not Important”
or “Indifferent” in the previous question.
5
0
6
8
6
0
1
2
3
4
5
6
7
8
9
Not Important LowImportance
Indifferent Important VeryImportant
Nº
of
Co
mp
anie
s
Development Phase % Nº of Companies
Research & Opportunity Screening 40 10
Proof of Viability 32 8
Indifferent 28 7
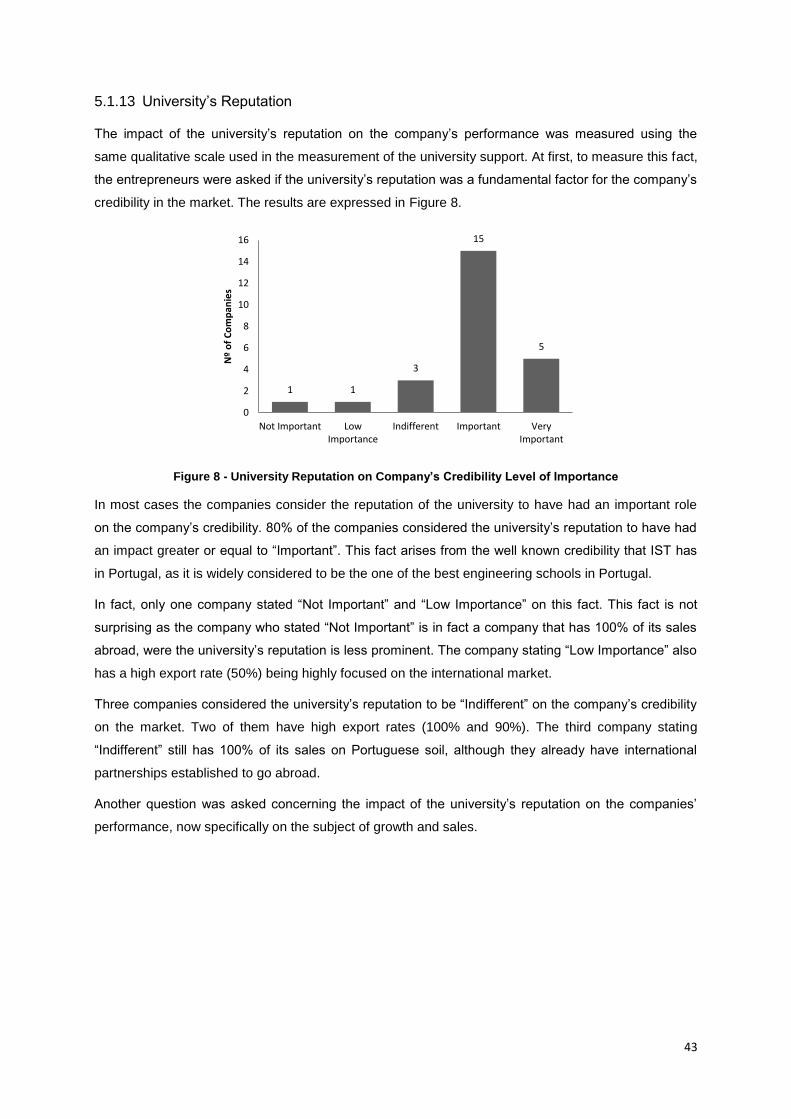
43
5.1.13 University’s Reputation
The impact of the university’s reputation on the company’s performance was measured using the
same qualitative scale used in the measurement of the university support. At first, to measure this fact,
the entrepreneurs were asked if the university’s reputation was a fundamental factor for the company’s
credibility in the market. The results are expressed in Figure 8.
Figure 8 - University Reputation on Company’s Credibility Level of Importance
In most cases the companies consider the reputation of the university to have had an important role
on the company’s credibility. 80% of the companies considered the university’s reputation to have had
an impact greater or equal to “Important”. This fact arises from the well known credibility that IST has
in Portugal, as it is widely considered to be the one of the best engineering schools in Portugal.
In fact, only one company stated “Not Important” and “Low Importance” on this fact. This fact is not
surprising as the company who stated “Not Important” is in fact a company that has 100% of its sales
abroad, were the university’s reputation is less prominent. The company stating “Low Importance” also
has a high export rate (50%) being highly focused on the international market.
Three companies considered the university’s reputation to be “Indifferent” on the company’s credibility
on the market. Two of them have high export rates (100% and 90%). The third company stating
“Indifferent” still has 100% of its sales on Portuguese soil, although they already have international
partnerships established to go abroad.
Another question was asked concerning the impact of the university’s reputation on the companies’
performance, now specifically on the subject of growth and sales.
1 1
3
15
5
0
2
4
6
8
10
12
14
16
Not Important LowImportance
Indifferent Important VeryImportant
Nº
of
Co
mp
anie
s
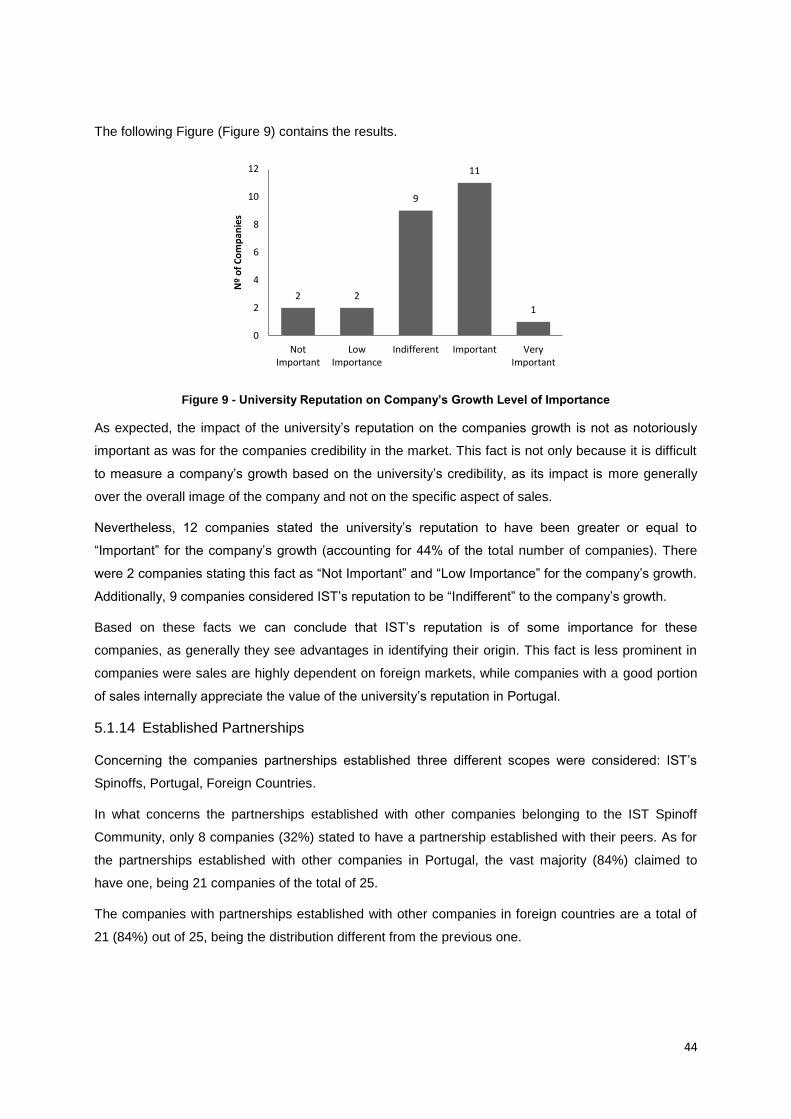
44
The following Figure (Figure 9) contains the results.
Figure 9 - University Reputation on Company’s Growth Level of Importance
As expected, the impact of the university’s reputation on the companies growth is not as notoriously
important as was for the companies credibility in the market. This fact is not only because it is difficult
to measure a company’s growth based on the university’s credibility, as its impact is more generally
over the overall image of the company and not on the specific aspect of sales.
Nevertheless, 12 companies stated the university’s reputation to have been greater or equal to
“Important” for the company’s growth (accounting for 44% of the total number of companies). There
were 2 companies stating this fact as “Not Important” and “Low Importance” for the company’s growth.
Additionally, 9 companies considered IST’s reputation to be “Indifferent” to the company’s growth.
Based on these facts we can conclude that IST’s reputation is of some importance for these
companies, as generally they see advantages in identifying their origin. This fact is less prominent in
companies were sales are highly dependent on foreign markets, while companies with a good portion
of sales internally appreciate the value of the university’s reputation in Portugal.
5.1.14 Established Partnerships
Concerning the companies partnerships established three different scopes were considered: IST’s
Spinoffs, Portugal, Foreign Countries.
In what concerns the partnerships established with other companies belonging to the IST Spinoff
Community, only 8 companies (32%) stated to have a partnership established with their peers. As for
the partnerships established with other companies in Portugal, the vast majority (84%) claimed to
have one, being 21 companies of the total of 25.
The companies with partnerships established with other companies in foreign countries are a total of
21 (84%) out of 25, being the distribution different from the previous one.
2 2
9
11
1
0
2
4
6
8
10
12
NotImportant
LowImportance
Indifferent Important VeryImportant
Nº
of
Co
mp
anie
s
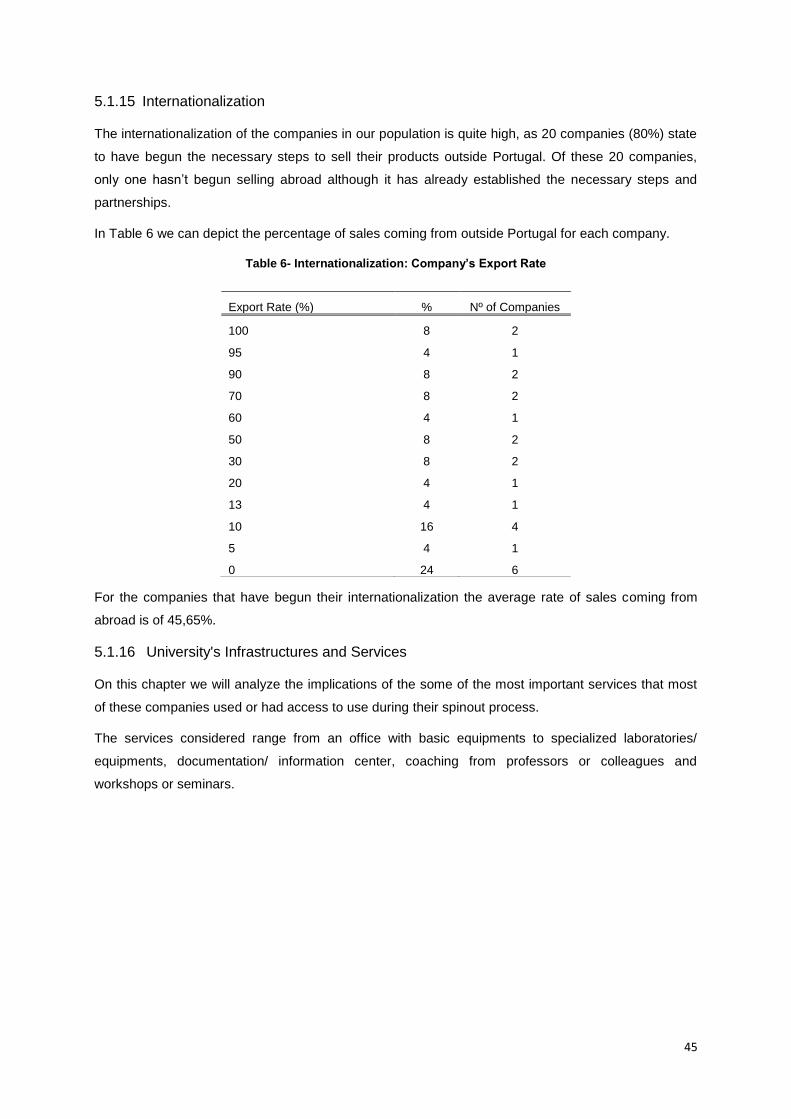
45
5.1.15 Internationalization
The internationalization of the companies in our population is quite high, as 20 companies (80%) state
to have begun the necessary steps to sell their products outside Portugal. Of these 20 companies,
only one hasn’t begun selling abroad although it has already established the necessary steps and
partnerships.
In Table 6 we can depict the percentage of sales coming from outside Portugal for each company.
Table 6- Internationalization: Company’s Export Rate
For the companies that have begun their internationalization the average rate of sales coming from
abroad is of 45,65%.
5.1.16 University's Infrastructures and Services
On this chapter we will analyze the implications of the some of the most important services that most
of these companies used or had access to use during their spinout process.
The services considered range from an office with basic equipments to specialized laboratories/
equipments, documentation/ information center, coaching from professors or colleagues and
workshops or seminars.
Export Rate (%) % Nº of Companies
100 8 2
95 4 1
90 8 2
70 8 2
60 4 1
50 8 2
30 8 2
20 4 1
13 4 1
10 16 4
5 4 1
0 24 6
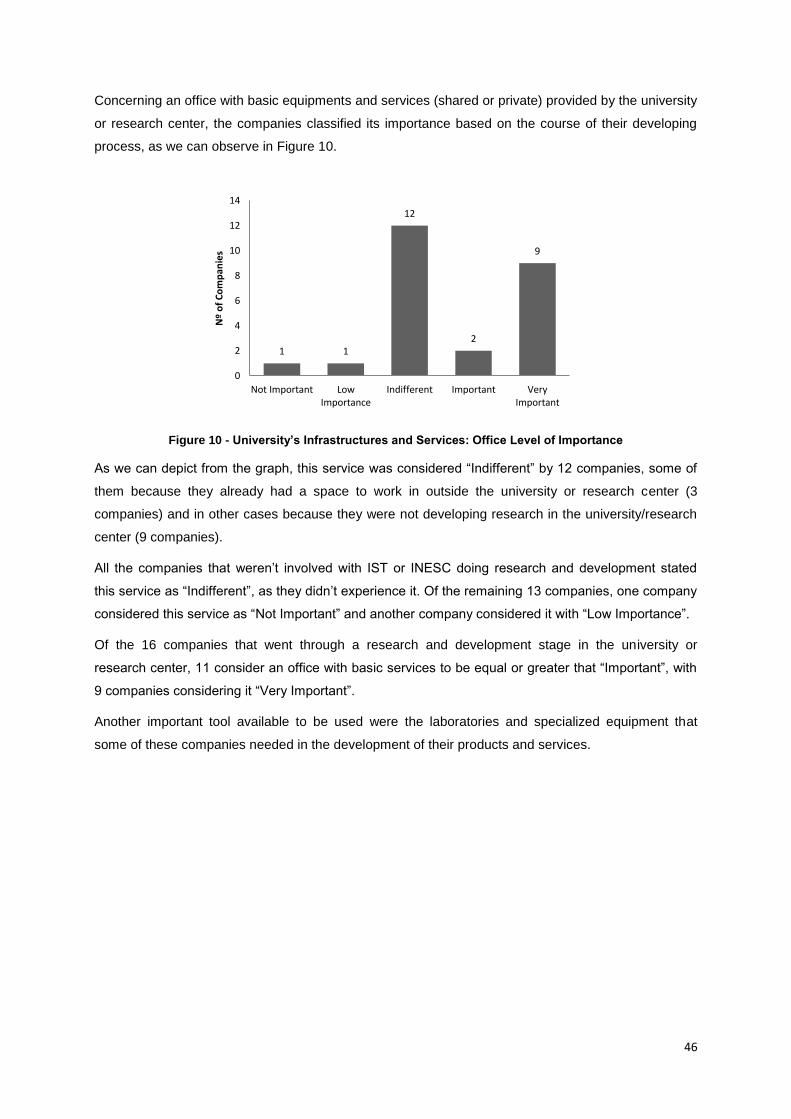
46
Concerning an office with basic equipments and services (shared or private) provided by the university
or research center, the companies classified its importance based on the course of their developing
process, as we can observe in Figure 10.
Figure 10 - University’s Infrastructures and Services: Office Level of Importance
As we can depict from the graph, this service was considered “Indifferent” by 12 companies, some of
them because they already had a space to work in outside the university or research center (3
companies) and in other cases because they were not developing research in the university/research
center (9 companies).
All the companies that weren’t involved with IST or INESC doing research and development stated
this service as “Indifferent”, as they didn’t experience it. Of the remaining 13 companies, one company
considered this service as “Not Important” and another company considered it with “Low Importance”.
Of the 16 companies that went through a research and development stage in the university or
research center, 11 consider an office with basic services to be equal or greater that “Important”, with
9 companies considering it “Very Important”.
Another important tool available to be used were the laboratories and specialized equipment that
some of these companies needed in the development of their products and services.
1 1
12
2
9
0
2
4
6
8
10
12
14
Not Important LowImportance
Indifferent Important VeryImportant
Nº
of
Co
mp
anie
s
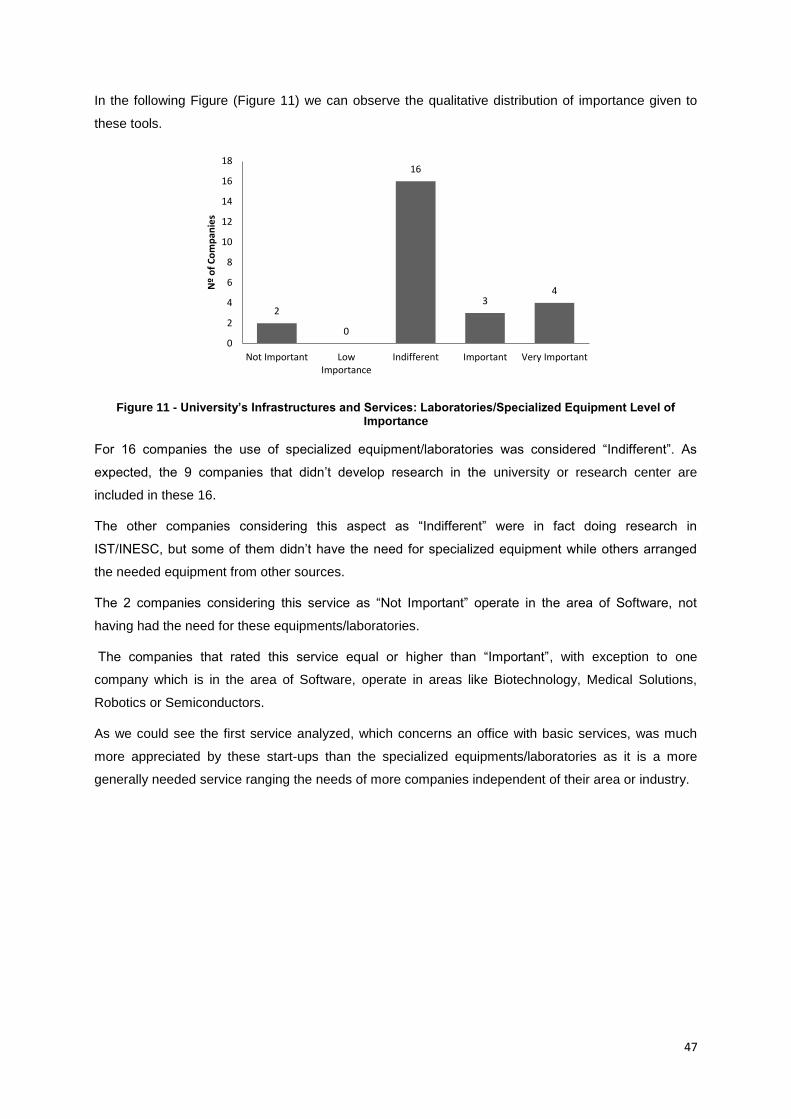
47
In the following Figure (Figure 11) we can observe the qualitative distribution of importance given to
these tools.
Figure 11 - University’s Infrastructures and Services: Laboratories/Specialized Equipment Level of Importance
For 16 companies the use of specialized equipment/laboratories was considered “Indifferent”. As
expected, the 9 companies that didn’t develop research in the university or research center are
included in these 16.
The other companies considering this aspect as “Indifferent” were in fact doing research in
IST/INESC, but some of them didn’t have the need for specialized equipment while others arranged
the needed equipment from other sources.
The 2 companies considering this service as “Not Important” operate in the area of Software, not
having had the need for these equipments/laboratories.
The companies that rated this service equal or higher than “Important”, with exception to one
company which is in the area of Software, operate in areas like Biotechnology, Medical Solutions,
Robotics or Semiconductors.
As we could see the first service analyzed, which concerns an office with basic services, was much
more appreciated by these start-ups than the specialized equipments/laboratories as it is a more
generally needed service ranging the needs of more companies independent of their area or industry.
2
0
16
3 4
0
2
4
6
8
10
12
14
16
18
Not Important LowImportance
Indifferent Important Very Important
Nº
of
Co
mp
anie
s
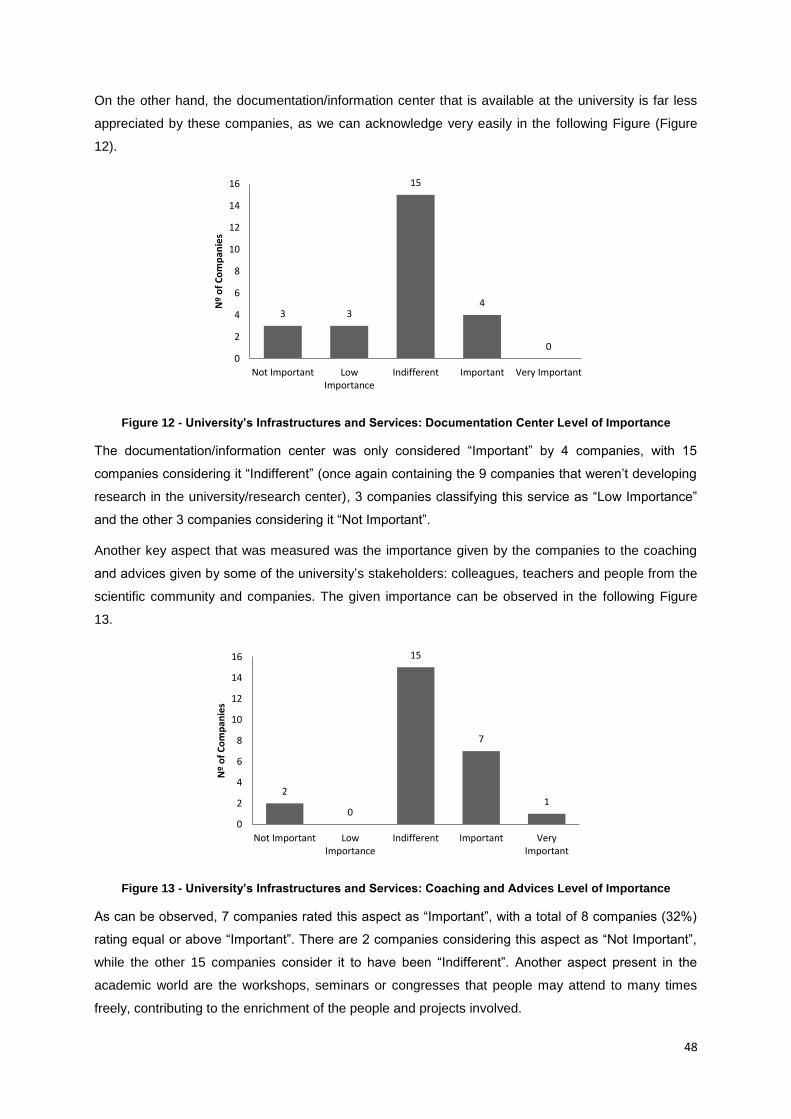
48
On the other hand, the documentation/information center that is available at the university is far less
appreciated by these companies, as we can acknowledge very easily in the following Figure (Figure
12).
Figure 12 - University’s Infrastructures and Services: Documentation Center Level of Importance
The documentation/information center was only considered “Important” by 4 companies, with 15
companies considering it “Indifferent” (once again containing the 9 companies that weren’t developing
research in the university/research center), 3 companies classifying this service as “Low Importance”
and the other 3 companies considering it “Not Important”.
Another key aspect that was measured was the importance given by the companies to the coaching
and advices given by some of the university’s stakeholders: colleagues, teachers and people from the
scientific community and companies. The given importance can be observed in the following Figure
13.
Figure 13 - University’s Infrastructures and Services: Coaching and Advices Level of Importance
As can be observed, 7 companies rated this aspect as “Important”, with a total of 8 companies (32%)
rating equal or above “Important”. There are 2 companies considering this aspect as “Not Important”,
while the other 15 companies consider it to have been “Indifferent”. Another aspect present in the
academic world are the workshops, seminars or congresses that people may attend to many times
freely, contributing to the enrichment of the people and projects involved.
3 3
15
4
0 0
2
4
6
8
10
12
14
16
Not Important LowImportance
Indifferent Important Very Important
Nº
of
Co
mp
anie
s
2
0
15
7
1
0
2
4
6
8
10
12
14
16
Not Important LowImportance
Indifferent Important VeryImportant
Nº
of
Co
mp
anie
s
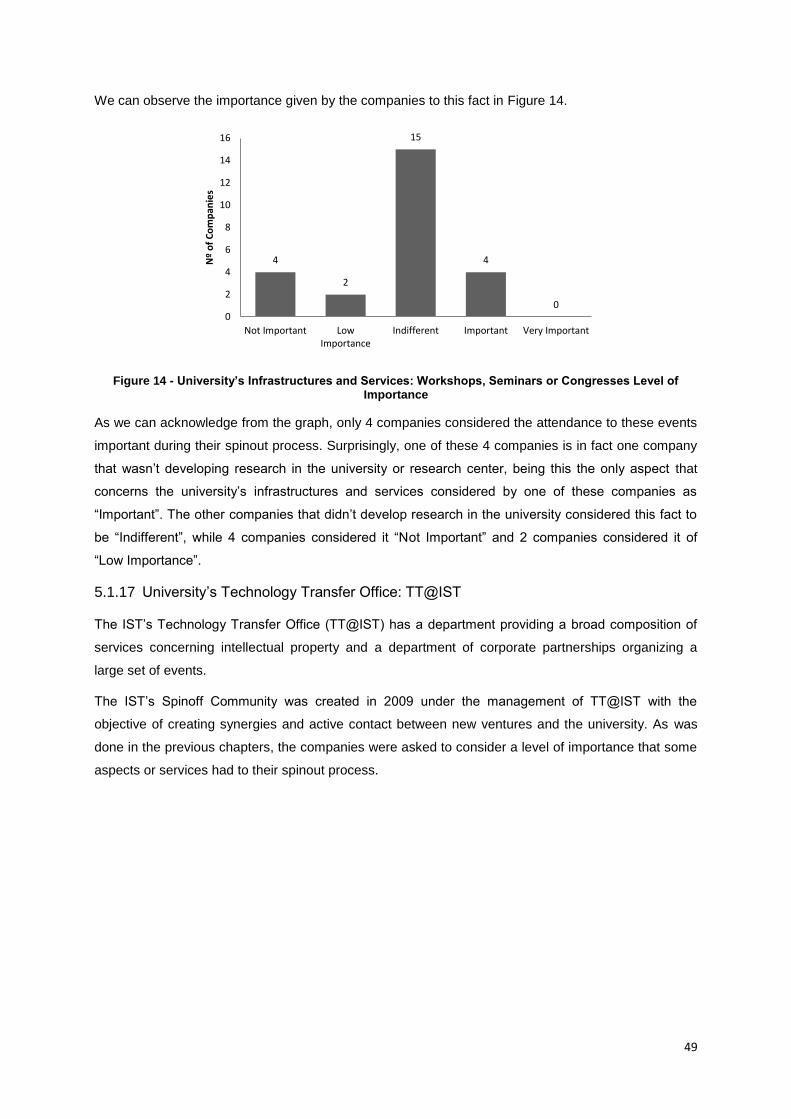
49
We can observe the importance given by the companies to this fact in Figure 14.
Figure 14 - University’s Infrastructures and Services: Workshops, Seminars or Congresses Level of Importance
As we can acknowledge from the graph, only 4 companies considered the attendance to these events
important during their spinout process. Surprisingly, one of these 4 companies is in fact one company
that wasn’t developing research in the university or research center, being this the only aspect that
concerns the university’s infrastructures and services considered by one of these companies as
“Important”. The other companies that didn’t develop research in the university considered this fact to
be “Indifferent”, while 4 companies considered it “Not Important” and 2 companies considered it of
“Low Importance”.
5.1.17 University’s Technology Transfer Office: TT@IST
The IST’s Technology Transfer Office (TT@IST) has a department providing a broad composition of
services concerning intellectual property and a department of corporate partnerships organizing a
large set of events.
The IST’s Spinoff Community was created in 2009 under the management of TT@IST with the
objective of creating synergies and active contact between new ventures and the university. As was
done in the previous chapters, the companies were asked to consider a level of importance that some
aspects or services had to their spinout process.
4
2
15
4
0 0
2
4
6
8
10
12
14
16
Not Important LowImportance
Indifferent Important Very Important
Nº
of
Co
mp
anie
s
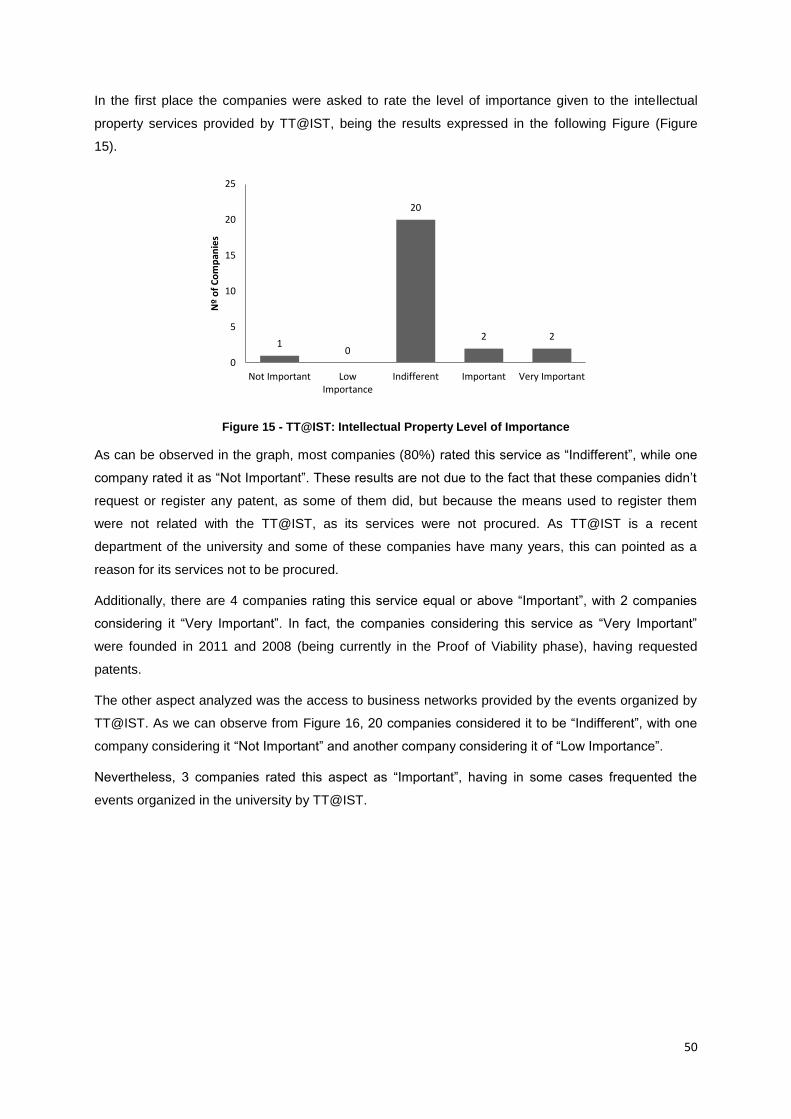
50
In the first place the companies were asked to rate the level of importance given to the intellectual
property services provided by TT@IST, being the results expressed in the following Figure (Figure
15).
Figure 15 - TT@IST: Intellectual Property Level of Importance
As can be observed in the graph, most companies (80%) rated this service as “Indifferent”, while one
company rated it as “Not Important”. These results are not due to the fact that these companies didn’t
request or register any patent, as some of them did, but because the means used to register them
were not related with the TT@IST, as its services were not procured. As TT@IST is a recent
department of the university and some of these companies have many years, this can pointed as a
reason for its services not to be procured.
Additionally, there are 4 companies rating this service equal or above “Important”, with 2 companies
considering it “Very Important”. In fact, the companies considering this service as “Very Important”
were founded in 2011 and 2008 (being currently in the Proof of Viability phase), having requested
patents.
The other aspect analyzed was the access to business networks provided by the events organized by
TT@IST. As we can observe from Figure 16, 20 companies considered it to be “Indifferent”, with one
company considering it “Not Important” and another company considering it of “Low Importance”.
Nevertheless, 3 companies rated this aspect as “Important”, having in some cases frequented the
events organized in the university by TT@IST.
1 0
20
2 2
0
5
10
15
20
25
Not Important LowImportance
Indifferent Important Very Important
Nº
of
Co
mp
anie
s
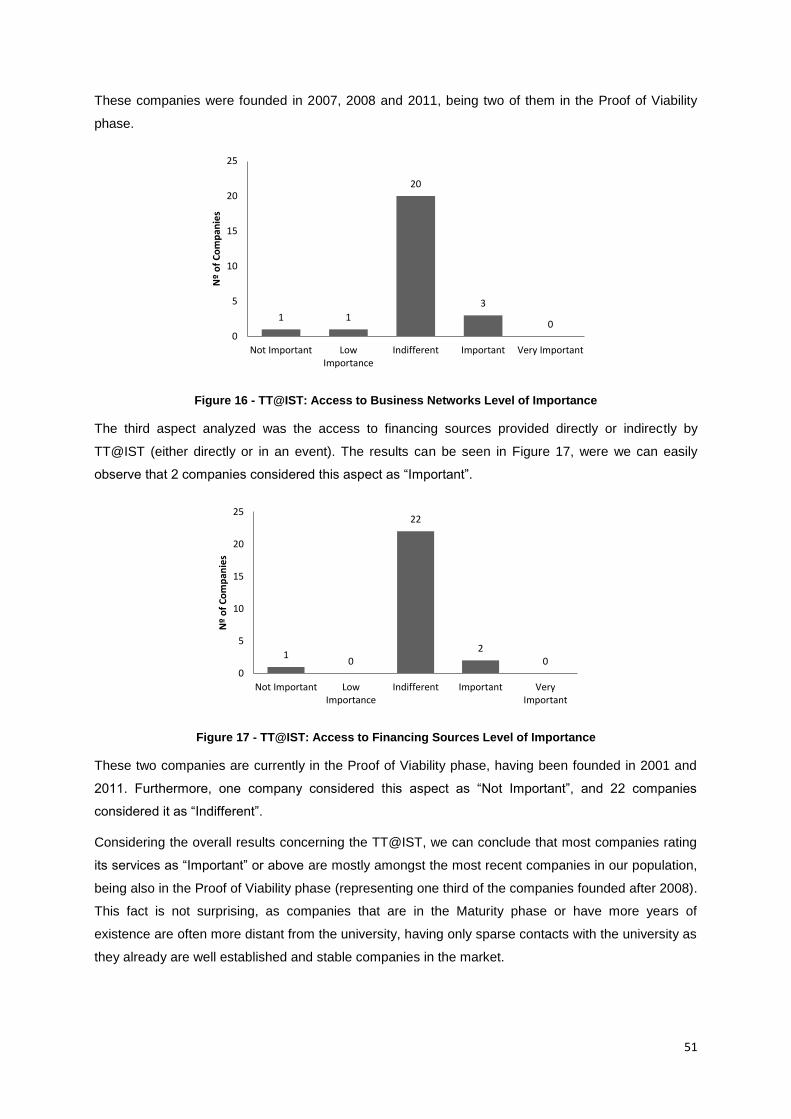
51
These companies were founded in 2007, 2008 and 2011, being two of them in the Proof of Viability
phase.
Figure 16 - TT@IST: Access to Business Networks Level of Importance
The third aspect analyzed was the access to financing sources provided directly or indirectly by
TT@IST (either directly or in an event). The results can be seen in Figure 17, were we can easily
observe that 2 companies considered this aspect as “Important”.
Figure 17 - TT@IST: Access to Financing Sources Level of Importance
These two companies are currently in the Proof of Viability phase, having been founded in 2001 and
2011. Furthermore, one company considered this aspect as “Not Important”, and 22 companies
considered it as “Indifferent”.
Considering the overall results concerning the TT@IST, we can conclude that most companies rating
its services as “Important” or above are mostly amongst the most recent companies in our population,
being also in the Proof of Viability phase (representing one third of the companies founded after 2008).
This fact is not surprising, as companies that are in the Maturity phase or have more years of
existence are often more distant from the university, having only sparse contacts with the university as
they already are well established and stable companies in the market.
1 1
20
3
0 0
5
10
15
20
25
Not Important LowImportance
Indifferent Important Very Important
Nº
of
Co
mp
anie
s
1 0
22
2 0
0
5
10
15
20
25
Not Important LowImportance
Indifferent Important VeryImportant
Nº
of
Co
mp
anie
s
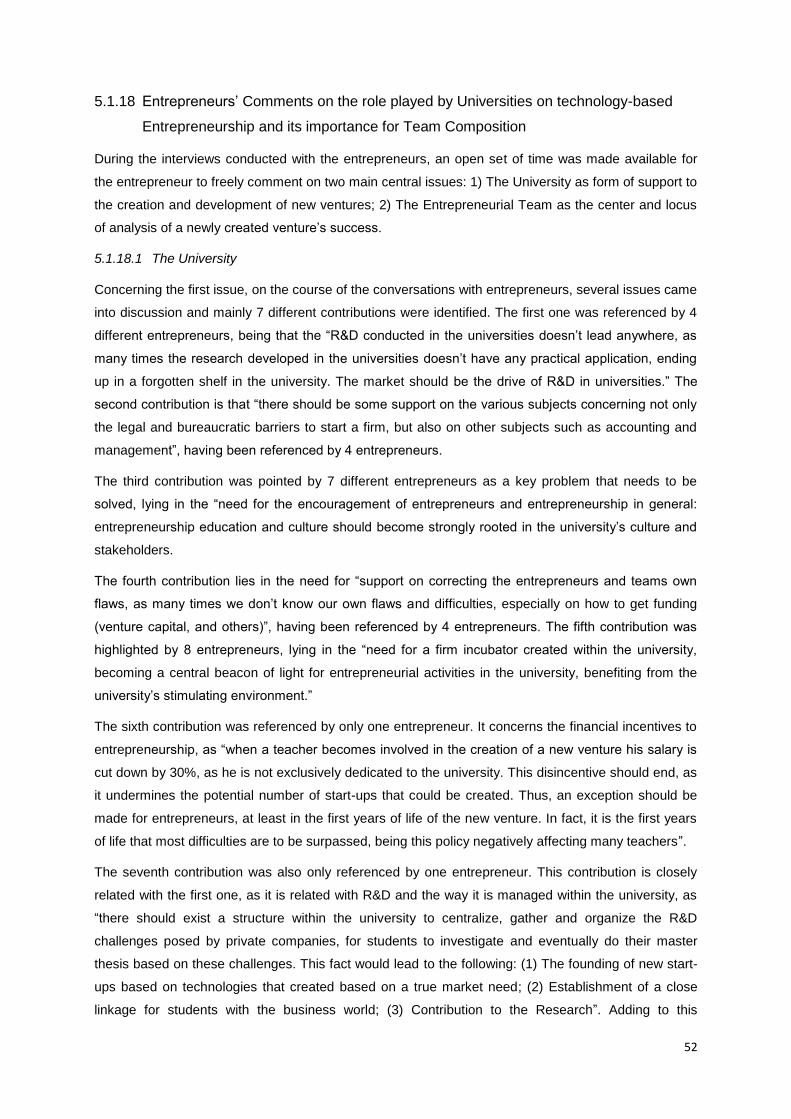
52
5.1.18 Entrepreneurs’ Comments on the role played by Universities on technology-based
Entrepreneurship and its importance for Team Composition
During the interviews conducted with the entrepreneurs, an open set of time was made available for
the entrepreneur to freely comment on two main central issues: 1) The University as form of support to
the creation and development of new ventures; 2) The Entrepreneurial Team as the center and locus
of analysis of a newly created venture’s success.
5.1.18.1 The University
Concerning the first issue, on the course of the conversations with entrepreneurs, several issues came
into discussion and mainly 7 different contributions were identified. The first one was referenced by 4
different entrepreneurs, being that the “R&D conducted in the universities doesn’t lead anywhere, as
many times the research developed in the universities doesn’t have any practical application, ending
up in a forgotten shelf in the university. The market should be the drive of R&D in universities.” The
second contribution is that “there should be some support on the various subjects concerning not only
the legal and bureaucratic barriers to start a firm, but also on other subjects such as accounting and
management”, having been referenced by 4 entrepreneurs.
The third contribution was pointed by 7 different entrepreneurs as a key problem that needs to be
solved, lying in the “need for the encouragement of entrepreneurs and entrepreneurship in general:
entrepreneurship education and culture should become strongly rooted in the university’s culture and
stakeholders.
The fourth contribution lies in the need for “support on correcting the entrepreneurs and teams own
flaws, as many times we don’t know our own flaws and difficulties, especially on how to get funding
(venture capital, and others)”, having been referenced by 4 entrepreneurs. The fifth contribution was
highlighted by 8 entrepreneurs, lying in the “need for a firm incubator created within the university,
becoming a central beacon of light for entrepreneurial activities in the university, benefiting from the
university’s stimulating environment.”
The sixth contribution was referenced by only one entrepreneur. It concerns the financial incentives to
entrepreneurship, as “when a teacher becomes involved in the creation of a new venture his salary is
cut down by 30%, as he is not exclusively dedicated to the university. This disincentive should end, as
it undermines the potential number of start-ups that could be created. Thus, an exception should be
made for entrepreneurs, at least in the first years of life of the new venture. In fact, it is the first years
of life that most difficulties are to be surpassed, being this policy negatively affecting many teachers”.
The seventh contribution was also only referenced by one entrepreneur. This contribution is closely
related with the first one, as it is related with R&D and the way it is managed within the university, as
“there should exist a structure within the university to centralize, gather and organize the R&D
challenges posed by private companies, for students to investigate and eventually do their master
thesis based on these challenges. This fact would lead to the following: (1) The founding of new start-
ups based on technologies that created based on a true market need; (2) Establishment of a close
linkage for students with the business world; (3) Contribution to the Research”. Adding to this
53
statement, the entrepreneur also said “these types of interaction already exist, but it is only possible
through a direct connection with someone already within the university. An organized structure for this
purpose should exist”.
5.1.18.2 The Entrepreneurial Team
On what concerns the entrepreneurial team, the first contribution made was that entrepreneurs should
have the “capacity to work with people from complementary areas of study”, as it is extremely
important that a team is “complete in skills” in order for a company to thrive. This fact was referenced
by 3 entrepreneurs.
The second contribution was the most referenced one, with 16 entrepreneurs referencing it as an
extremely important aspect of being an entrepreneur: “resilience, effort and hard work” were the words
mainly used to describe it. Also, some entrepreneurs said that it is important to “believe” in the work
being made, “keeping the spirits up”, “even though we don’t know if it is going to work”.
The third contribution is the fact that an entrepreneur building a technology company from scratch
must have “high technical capabilities”, having this fact been referenced by 6 entrepreneurs.
The fourth contribution was pointed by 3 entrepreneurs, and it is the need for entrepreneurs to have
general “marketing and management skills”, as “many entrepreneurs are to centered in technology
and forget that selling is equally important”.
Another contribution (5th) pointed was that entrepreneurs should have risk tolerance, as many times
“we are dedicating a lot of effort and time to a project which has a great deal of uncertainty”. This fact
was referenced by 5 entrepreneurs, being referenced as a crucial factor for success, as some
entrepreneurs left these ventures because they were not risk tolerant. The sixth contribution is the
heterogeneity of skills and knowledge (which is related with the first and fourth contributions) that a
team should have in order to reach success, having this fact been referenced by 4 entrepreneurs. The
seventh and last contribution was pointed out by two entrepreneurs, being that entrepreneurs should
know how a start-up works, “specifically how some instruments function, such as stock options,
accounting, legal, and others”, as “decisions have to be made with good information and knowledge of
how these operations are performed”.
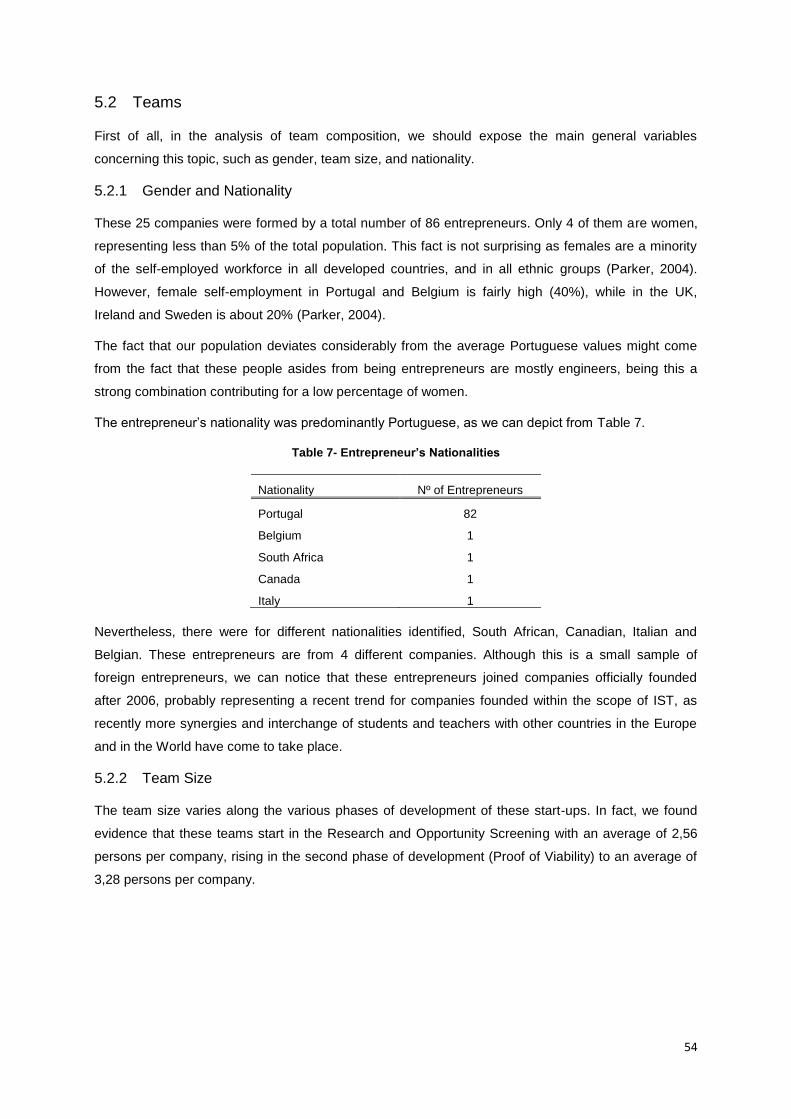
54
5.2 Teams
First of all, in the analysis of team composition, we should expose the main general variables
concerning this topic, such as gender, team size, and nationality.
5.2.1 Gender and Nationality
These 25 companies were formed by a total number of 86 entrepreneurs. Only 4 of them are women,
representing less than 5% of the total population. This fact is not surprising as females are a minority
of the self-employed workforce in all developed countries, and in all ethnic groups (Parker, 2004).
However, female self-employment in Portugal and Belgium is fairly high (40%), while in the UK,
Ireland and Sweden is about 20% (Parker, 2004).
The fact that our population deviates considerably from the average Portuguese values might come
from the fact that these people asides from being entrepreneurs are mostly engineers, being this a
strong combination contributing for a low percentage of women.
The entrepreneur’s nationality was predominantly Portuguese, as we can depict from Table 7.
Table 7- Entrepreneur’s Nationalities
Nevertheless, there were for different nationalities identified, South African, Canadian, Italian and
Belgian. These entrepreneurs are from 4 different companies. Although this is a small sample of
foreign entrepreneurs, we can notice that these entrepreneurs joined companies officially founded
after 2006, probably representing a recent trend for companies founded within the scope of IST, as
recently more synergies and interchange of students and teachers with other countries in the Europe
and in the World have come to take place.
5.2.2 Team Size
The team size varies along the various phases of development of these start-ups. In fact, we found
evidence that these teams start in the Research and Opportunity Screening with an average of 2,56
persons per company, rising in the second phase of development (Proof of Viability) to an average of
3,28 persons per company.
Nationality Nº of Entrepreneurs
Portugal 82
Belgium 1
South Africa 1
Canada 1
Italy 1
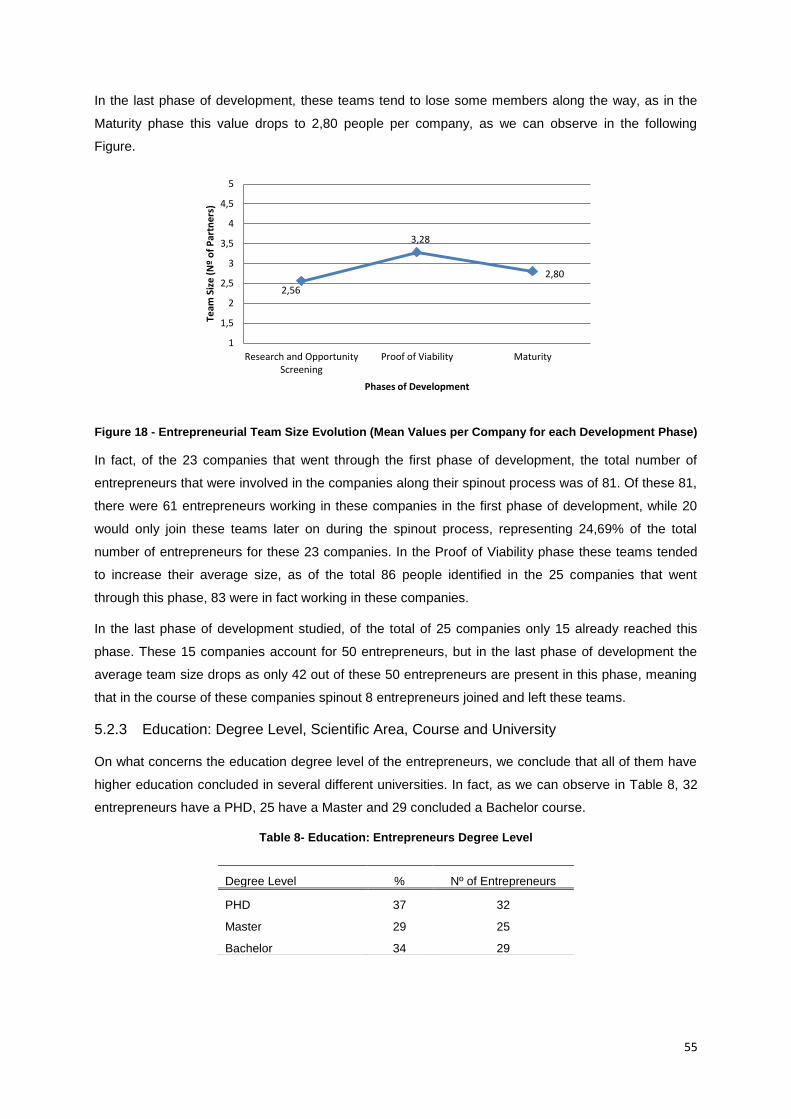
55
In the last phase of development, these teams tend to lose some members along the way, as in the
Maturity phase this value drops to 2,80 people per company, as we can observe in the following
Figure.
Figure 18 - Entrepreneurial Team Size Evolution (Mean Values per Company for each Development Phase)
In fact, of the 23 companies that went through the first phase of development, the total number of
entrepreneurs that were involved in the companies along their spinout process was of 81. Of these 81,
there were 61 entrepreneurs working in these companies in the first phase of development, while 20
would only join these teams later on during the spinout process, representing 24,69% of the total
number of entrepreneurs for these 23 companies. In the Proof of Viability phase these teams tended
to increase their average size, as of the total 86 people identified in the 25 companies that went
through this phase, 83 were in fact working in these companies.
In the last phase of development studied, of the total of 25 companies only 15 already reached this
phase. These 15 companies account for 50 entrepreneurs, but in the last phase of development the
average team size drops as only 42 out of these 50 entrepreneurs are present in this phase, meaning
that in the course of these companies spinout 8 entrepreneurs joined and left these teams.
5.2.3 Education: Degree Level, Scientific Area, Course and University
On what concerns the education degree level of the entrepreneurs, we conclude that all of them have
higher education concluded in several different universities. In fact, as we can observe in Table 8, 32
entrepreneurs have a PHD, 25 have a Master and 29 concluded a Bachelor course.
Table 8- Education: Entrepreneurs Degree Level
2,56
3,28
2,80
1
1,5
2
2,5
3
3,5
4
4,5
5
Research and OpportunityScreening
Proof of Viability Maturity
Team
Siz
e (
Nº
of
Par
tne
rs)
Phases of Development
Degree Level % Nº of Entrepreneurs
PHD 37 32
Master 29 25
Bachelor 34 29
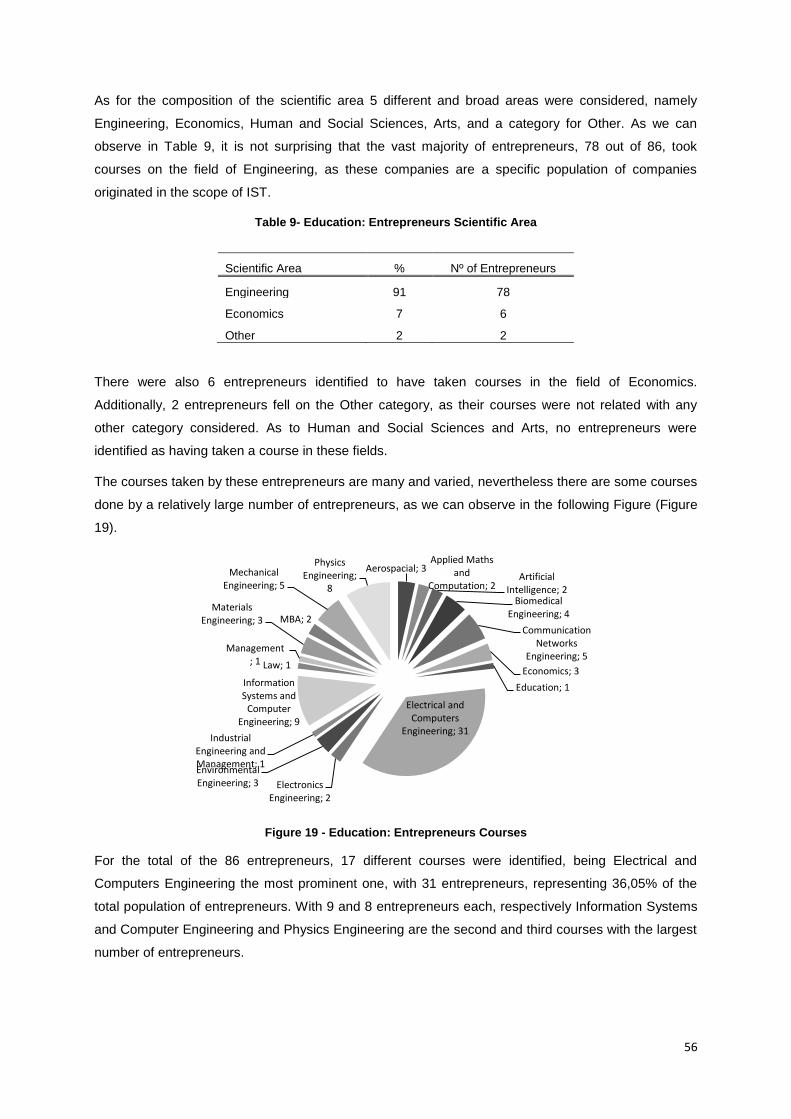
56
As for the composition of the scientific area 5 different and broad areas were considered, namely
Engineering, Economics, Human and Social Sciences, Arts, and a category for Other. As we can
observe in Table 9, it is not surprising that the vast majority of entrepreneurs, 78 out of 86, took
courses on the field of Engineering, as these companies are a specific population of companies
originated in the scope of IST.
Table 9- Education: Entrepreneurs Scientific Area
There were also 6 entrepreneurs identified to have taken courses in the field of Economics.
Additionally, 2 entrepreneurs fell on the Other category, as their courses were not related with any
other category considered. As to Human and Social Sciences and Arts, no entrepreneurs were
identified as having taken a course in these fields.
The courses taken by these entrepreneurs are many and varied, nevertheless there are some courses
done by a relatively large number of entrepreneurs, as we can observe in the following Figure (Figure
19).
Figure 19 - Education: Entrepreneurs Courses
For the total of the 86 entrepreneurs, 17 different courses were identified, being Electrical and
Computers Engineering the most prominent one, with 31 entrepreneurs, representing 36,05% of the
total population of entrepreneurs. With 9 and 8 entrepreneurs each, respectively Information Systems
and Computer Engineering and Physics Engineering are the second and third courses with the largest
number of entrepreneurs.
Aerospacial; 3 Applied Maths
and Computation; 2
Artificial Intelligence; 2
Biomedical Engineering; 4
Communication Networks
Engineering; 5
Economics; 3
Education; 1
Electrical and Computers
Engineering; 31
Electronics Engineering; 2
Environmental Engineering; 3
Industrial Engineering and Management; 1
Information Systems and
Computer Engineering; 9
Law; 1
Management; 1
Materials Engineering; 3 MBA; 2
Mechanical Engineering; 5
Physics Engineering;
8
Scientific Area % Nº of Entrepreneurs
Engineering 91 78
Economics 7 6
Other 2 2
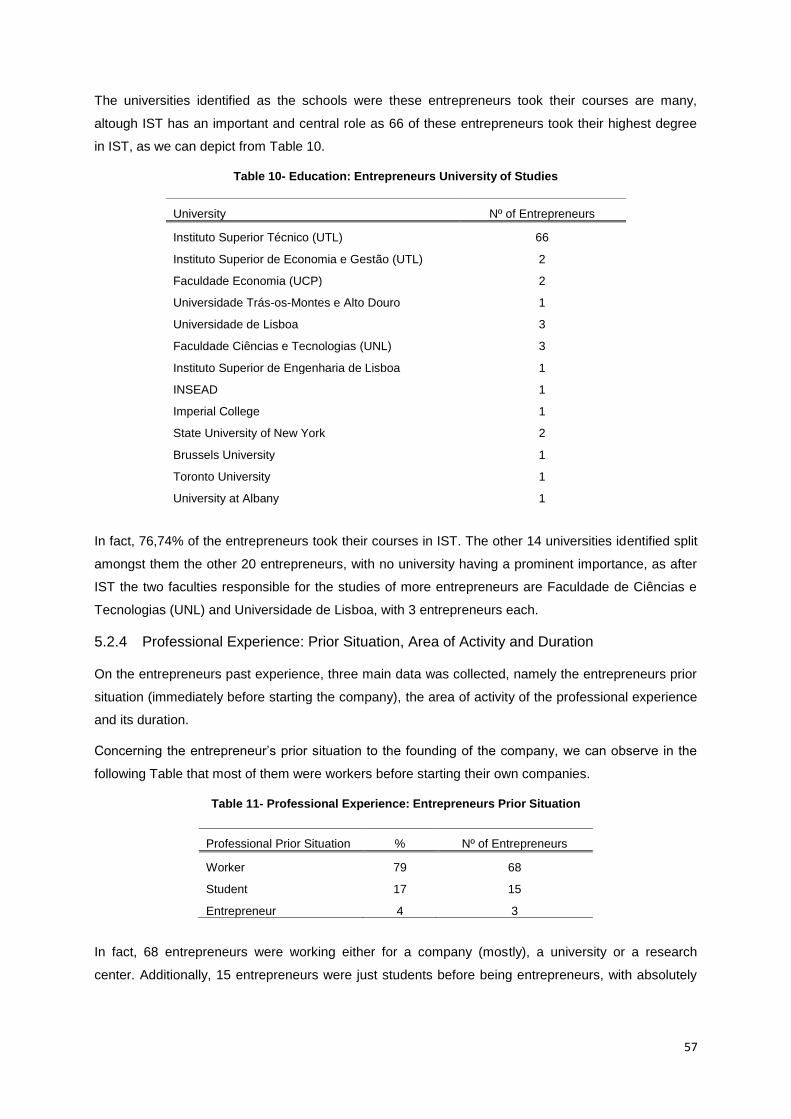
57
The universities identified as the schools were these entrepreneurs took their courses are many,
altough IST has an important and central role as 66 of these entrepreneurs took their highest degree
in IST, as we can depict from Table 10.
Table 10- Education: Entrepreneurs University of Studies
In fact, 76,74% of the entrepreneurs took their courses in IST. The other 14 universities identified split
amongst them the other 20 entrepreneurs, with no university having a prominent importance, as after
IST the two faculties responsible for the studies of more entrepreneurs are Faculdade de Ciências e
Tecnologias (UNL) and Universidade de Lisboa, with 3 entrepreneurs each.
5.2.4 Professional Experience: Prior Situation, Area of Activity and Duration
On the entrepreneurs past experience, three main data was collected, namely the entrepreneurs prior
situation (immediately before starting the company), the area of activity of the professional experience
and its duration.
Concerning the entrepreneur’s prior situation to the founding of the company, we can observe in the
following Table that most of them were workers before starting their own companies.
Table 11- Professional Experience: Entrepreneurs Prior Situation
In fact, 68 entrepreneurs were working either for a company (mostly), a university or a research
center. Additionally, 15 entrepreneurs were just students before being entrepreneurs, with absolutely
University Nº of Entrepreneurs
Instituto Superior Técnico (UTL) 66
Instituto Superior de Economia e Gestão (UTL) 2
Faculdade Economia (UCP) 2
Universidade Trás-os-Montes e Alto Douro 1
Universidade de Lisboa 3
Faculdade Ciências e Tecnologias (UNL) 3
Instituto Superior de Engenharia de Lisboa 1
INSEAD 1
Imperial College 1
State University of New York 2
Brussels University 1
Toronto University 1
University at Albany 1
Professional Prior Situation % Nº of Entrepreneurs
Worker 79 68
Student 17 15
Entrepreneur 4 3
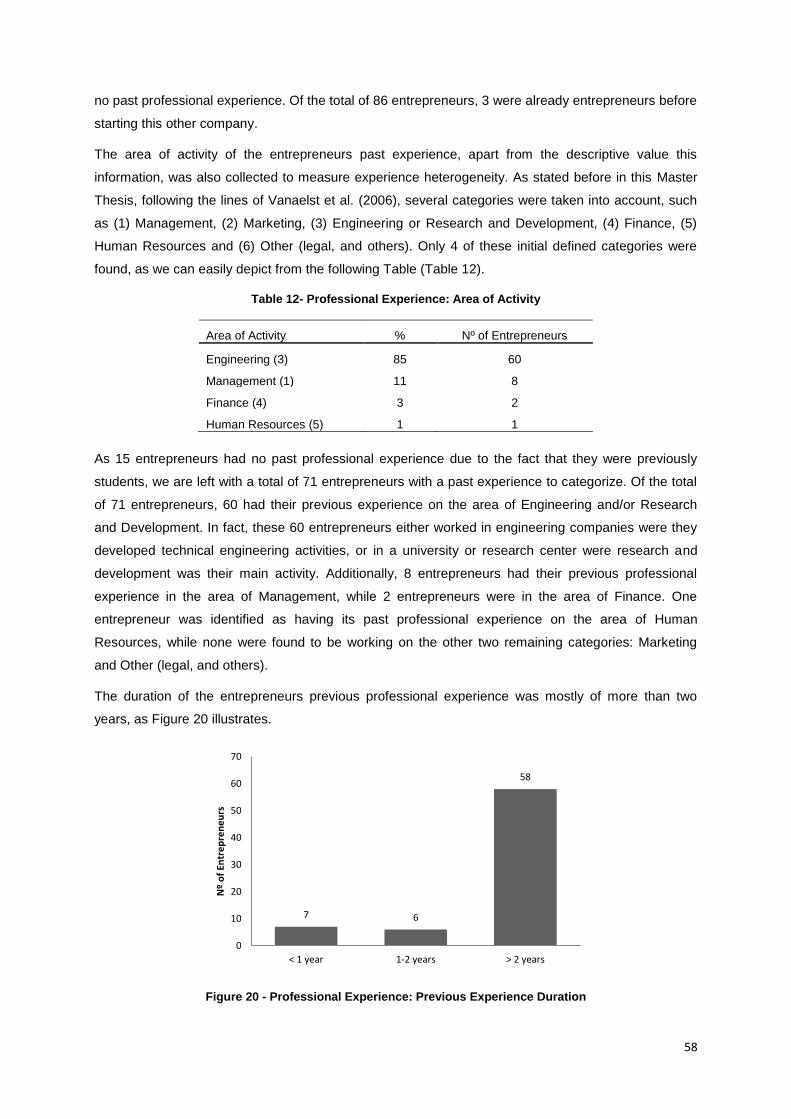
58
no past professional experience. Of the total of 86 entrepreneurs, 3 were already entrepreneurs before
starting this other company.
The area of activity of the entrepreneurs past experience, apart from the descriptive value this
information, was also collected to measure experience heterogeneity. As stated before in this Master
Thesis, following the lines of Vanaelst et al. (2006), several categories were taken into account, such
as (1) Management, (2) Marketing, (3) Engineering or Research and Development, (4) Finance, (5)
Human Resources and (6) Other (legal, and others). Only 4 of these initial defined categories were
found, as we can easily depict from the following Table (Table 12).
Table 12- Professional Experience: Area of Activity
As 15 entrepreneurs had no past professional experience due to the fact that they were previously
students, we are left with a total of 71 entrepreneurs with a past experience to categorize. Of the total
of 71 entrepreneurs, 60 had their previous experience on the area of Engineering and/or Research
and Development. In fact, these 60 entrepreneurs either worked in engineering companies were they
developed technical engineering activities, or in a university or research center were research and
development was their main activity. Additionally, 8 entrepreneurs had their previous professional
experience in the area of Management, while 2 entrepreneurs were in the area of Finance. One
entrepreneur was identified as having its past professional experience on the area of Human
Resources, while none were found to be working on the other two remaining categories: Marketing
and Other (legal, and others).
The duration of the entrepreneurs previous professional experience was mostly of more than two
years, as Figure 20 illustrates.
Figure 20 - Professional Experience: Previous Experience Duration
7 6
58
0
10
20
30
40
50
60
70
< 1 year 1-2 years > 2 years
Nº
of
Entr
ep
ren
eu
rs
Area of Activity % Nº of Entrepreneurs
Engineering (3) 85 60
Management (1) 11 8
Finance (4) 3 2
Human Resources (5) 1 1
59
Of the total of 71 entrepreneurs with a past professional experience, 58 had a duration superior to two
years, representing 81,69%. The duration between one and two years was the time that 6
entrepreneurs spent in their last professional experience, while 7 entrepreneurs had an experience
with the duration of less than a year. In fact, some of these 7 entrepreneurs were doing internships,
which mostly have limited time spans.
Additionally, these 7 entrepreneurs have their current ages comprised between 24 and 29 years old,
with a group average of 26,3 years old. The 6 entrepreneurs with a professional experience with its
duration from one to two years, have their ages comprised between 34 and 46 years old, with a group
average of 39,3 years old. The entrepreneurs with past professional experience with a duration
superior to two years have their ages comprised between 27 and 75 years old, with a group average
of 45,0 years old.
The average age for these 71 entrepreneurs is 42,7 years old, being easy to conclude that the amount
of years of the entrepreneurs previous professional experience is related with its age, as older
entrepreneurs tend to have a higher duration in their professional experience.
Surprisingly, the entrepreneurs with no past professional experience have an average age of 36,4
years old, being a value higher than the average age of the entrepreneurs with a past professional
experience with a duration of less than year. This is due to the fact that these entrepreneurs with no
past professional experience are often students for a long period of their lives, as they are doing their
Masters and PHD studies. Additionally, as we are analyzing companies that were founded in a period
spanning from the 1980’s to 2012, some of these entrepreneurs are from companies founded several
years ago, virtually increasing the average.
5.2.5 Entrepreneurial Experience
Entrepreneurial experience was mainly measured for purposes of entrepreneurial heterogeneity. To
accomplish this yes (1) and no (0) answers were used (Vanaelst et al., 2006). Additionally, to collect
more enriched information on entrepreneurial experience, for the entrepreneurs who had been
involved in the creation of a new venture in the past were also asked what occurred to their previous
venture.
Of the total 86 entrepreneurs, 65 had no past entrepreneurial experience, representing 75,58% of the
total number of entrepreneurs, while 21 had a past entrepreneurial experience (24,42%). For these 21
entrepreneurs, 13 have their previous venture still in activity (representing 61,90% of these 21
entrepreneurs). Four entrepreneurs sold their participation in the previous venture to another partner
or company, while the other 4 entrepreneur’s companies eventually closed.
60
6 Results: Team Heterogeneity
On this chapter we will examine teams’ human capital through their heterogeneity values on several
different categories. This analysis is made considering the evolutionary dynamics of the various
phases of development considered for the spinouts. Additionally, we will analyze how far the Research
Unit where each company was developing its R&D relates with teams’ heterogeneity . The Research
Unit factor will also be examined in this chapter as a potential influence for the time duration that each
company took to evolve throughout the various development phases.
6.1 Human Capital and Heterogeneity
As described before, information was collected to allow us to calculate four different heterogeneity
categories. These categories are scientific area heterogeneity, course heterogeneity, experience
heterogeneity and entrepreneurial experience heterogeneity.
Scientific Area Heterogeneity
The scientific area heterogeneity allows us to observe the evolution of a team’s heterogeneity
throughout the various phases of development concerning the scientific area of studies of its
members. To collect information on this topic 5 different and broad areas of studies were considered,
namely: (1) Engineering, (2) Economics, (3) Human and Social Sciences, (4) Arts and (5) Other (e.g.
law).
Course Heterogeneity
In our sample – and given that our unit of analysis is an engineering school – most entrepreneurs took
their courses in the scientific area of engineering. This partially explains the fact we have low mean
values of scientific area heterogeneity. This is the reason contributing mostly to our methodological
decision to calculate the course heterogeneity, given that many courses within the engineering field
are very different, implicating that the entrepreneurs have in fact different skills and knowledge. To
compute course heterogeneity the 17 courses previously identified (in sub-chapter 5.2.3 - Education:
Degree Level, Scientific Area, Course and University) were taken into account.
Experience Heterogeneity
Experience heterogeneity allows us to evaluate the evolution of a team’s overall experience based on
the entrepreneurs past professional experience. To collect information on experience heterogeneity
the past professional records of the entrepreneurs were grouped into several categories: (1)
Management, (2) Marketing, (3) Engineering or Research and Development, (4) Finance, (5) Human
Resources and (6) Other (e.g. legal).
Entrepreneurial Experience Heterogeneity
According with Parker (2004) previous self-employment experience has a positive and significant
impact on the probability of individuals entering self-employment. Therefore, in the present research
we use a binary variable (1 for founders with a prior entrepreneurial experience and 0 otherwise), to
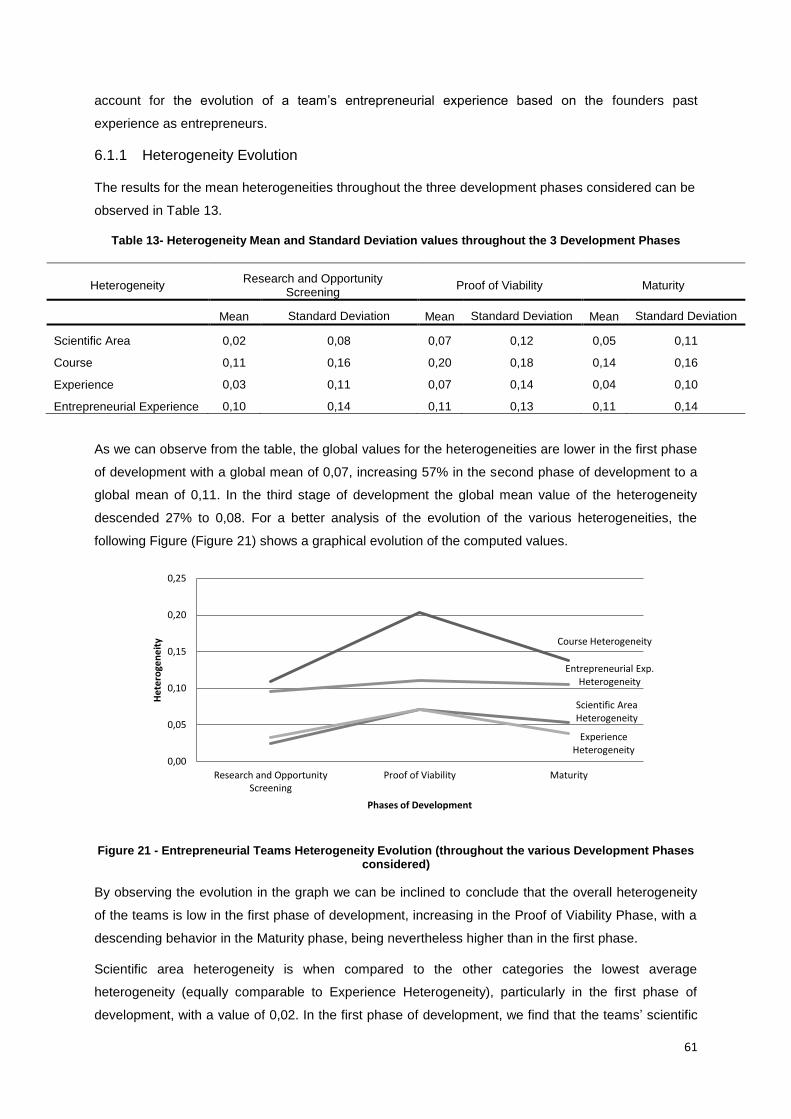
61
account for the evolution of a team’s entrepreneurial experience based on the founders past
experience as entrepreneurs.
6.1.1 Heterogeneity Evolution
The results for the mean heterogeneities throughout the three development phases considered can be
observed in Table 13.
Table 13- Heterogeneity Mean and Standard Deviation values throughout the 3 Development Phases
As we can observe from the table, the global values for the heterogeneities are lower in the first phase
of development with a global mean of 0,07, increasing 57% in the second phase of development to a
global mean of 0,11. In the third stage of development the global mean value of the heterogeneity
descended 27% to 0,08. For a better analysis of the evolution of the various heterogeneities, the
following Figure (Figure 21) shows a graphical evolution of the computed values.
Figure 21 - Entrepreneurial Teams Heterogeneity Evolution (throughout the various Development Phases considered)
By observing the evolution in the graph we can be inclined to conclude that the overall heterogeneity
of the teams is low in the first phase of development, increasing in the Proof of Viability Phase, with a
descending behavior in the Maturity phase, being nevertheless higher than in the first phase.
Scientific area heterogeneity is when compared to the other categories the lowest average
heterogeneity (equally comparable to Experience Heterogeneity), particularly in the first phase of
development, with a value of 0,02. In the first phase of development, we find that the teams’ scientific
Course Heterogeneity
Scientific Area Heterogeneity
Entrepreneurial Exp. Heterogeneity
Experience Heterogeneity
0,00
0,05
0,10
0,15
0,20
0,25
Research and OpportunityScreening
Proof of Viability Maturity
He
tero
gen
eit
y
Phases of Development
Heterogeneity Research and Opportunity
Screening Proof of Viability Maturity
Mean Standard Deviation Mean Standard Deviation Mean Standard Deviation
Scientific Area 0,02 0,08 0,07 0,12 0,05 0,11
Course 0,11 0,16 0,20 0,18 0,14 0,16
Experience 0,03 0,11 0,07 0,14 0,04 0,10
Entrepreneurial Experience 0,10 0,14 0,11 0,13 0,11 0,14
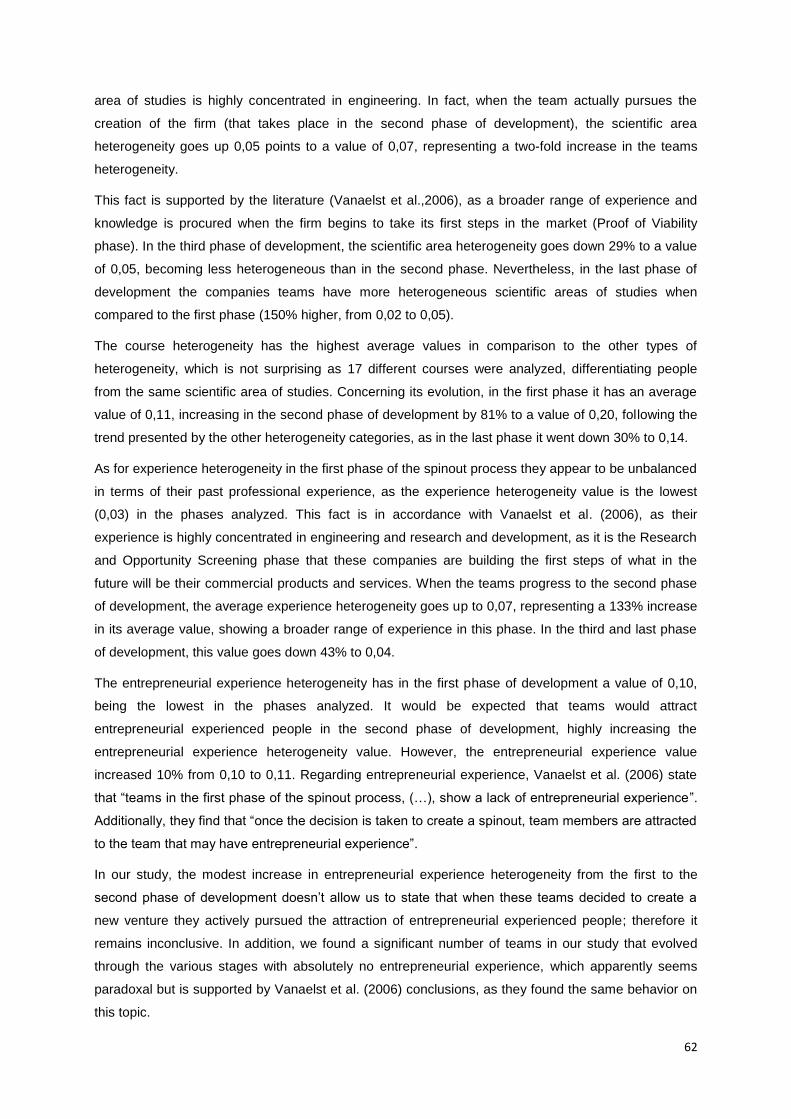
62
area of studies is highly concentrated in engineering. In fact, when the team actually pursues the
creation of the firm (that takes place in the second phase of development), the scientific area
heterogeneity goes up 0,05 points to a value of 0,07, representing a two-fold increase in the teams
heterogeneity.
This fact is supported by the literature (Vanaelst et al.,2006), as a broader range of experience and
knowledge is procured when the firm begins to take its first steps in the market (Proof of Viability
phase). In the third phase of development, the scientific area heterogeneity goes down 29% to a value
of 0,05, becoming less heterogeneous than in the second phase. Nevertheless, in the last phase of
development the companies teams have more heterogeneous scientific areas of studies when
compared to the first phase (150% higher, from 0,02 to 0,05).
The course heterogeneity has the highest average values in comparison to the other types of
heterogeneity, which is not surprising as 17 different courses were analyzed, differentiating people
from the same scientific area of studies. Concerning its evolution, in the first phase it has an average
value of 0,11, increasing in the second phase of development by 81% to a value of 0,20, following the
trend presented by the other heterogeneity categories, as in the last phase it went down 30% to 0,14.
As for experience heterogeneity in the first phase of the spinout process they appear to be unbalanced
in terms of their past professional experience, as the experience heterogeneity value is the lowest
(0,03) in the phases analyzed. This fact is in accordance with Vanaelst et al. (2006), as their
experience is highly concentrated in engineering and research and development, as it is the Research
and Opportunity Screening phase that these companies are building the first steps of what in the
future will be their commercial products and services. When the teams progress to the second phase
of development, the average experience heterogeneity goes up to 0,07, representing a 133% increase
in its average value, showing a broader range of experience in this phase. In the third and last phase
of development, this value goes down 43% to 0,04.
The entrepreneurial experience heterogeneity has in the first phase of development a value of 0,10,
being the lowest in the phases analyzed. It would be expected that teams would attract
entrepreneurial experienced people in the second phase of development, highly increasing the
entrepreneurial experience heterogeneity value. However, the entrepreneurial experience value
increased 10% from 0,10 to 0,11. Regarding entrepreneurial experience, Vanaelst et al. (2006) state
that “teams in the first phase of the spinout process, (…), show a lack of entrepreneurial experience”.
Additionally, they find that “once the decision is taken to create a spinout, team members are attracted
to the team that may have entrepreneurial experience”.
In our study, the modest increase in entrepreneurial experience heterogeneity from the first to the
second phase of development doesn’t allow us to state that when these teams decided to create a
new venture they actively pursued the attraction of entrepreneurial experienced people; therefore it
remains inconclusive. In addition, we found a significant number of teams in our study that evolved
through the various stages with absolutely no entrepreneurial experience, which apparently seems
paradoxal but is supported by Vanaelst et al. (2006) conclusions, as they found the same behavior on
this topic.
63
Regarding the period after the firm legal establishment (second and third phases), the average
entrepreneurial experience heterogeneity doesn’t change, as its value remains on 0,11 for both
phases. This fact is in line with Vanaelst et al. (2006) findings as they state that “after the legal
establishment of the firm, no clear finding on the nature of entrepreneurial experience was identified”.
We find evidence that the teams’ overall scientific, entrepreneurial and professional experience skills,
based on the four categories of heterogeneity considered in our analysis, have an increase when the
decision to create a spinout is taken. In other words, the teams become one average more
heterogeneous when the firm is officially created, finding the need for people with other skills and
knowledge, as different activities from research and development are needed (e.g. management,
marketing). This fact is in line with the literature’s conclusions on this topic (Vanaelst et al.,2006).
On the other hand, we find no evidence that the teams continuously have their experience and
knowledge more balanced and broadened the further they move along the spinout process. In the
Maturity phase all the heterogeneity values are lower than in the Proof of Viability phase. This fact
may be due to the exit of team members in the last phase of development (which often sold their
shares to the other partners), as in the maturity phase the companies already have a good number of
employees, which now fulfill the needed experience and knowledge.
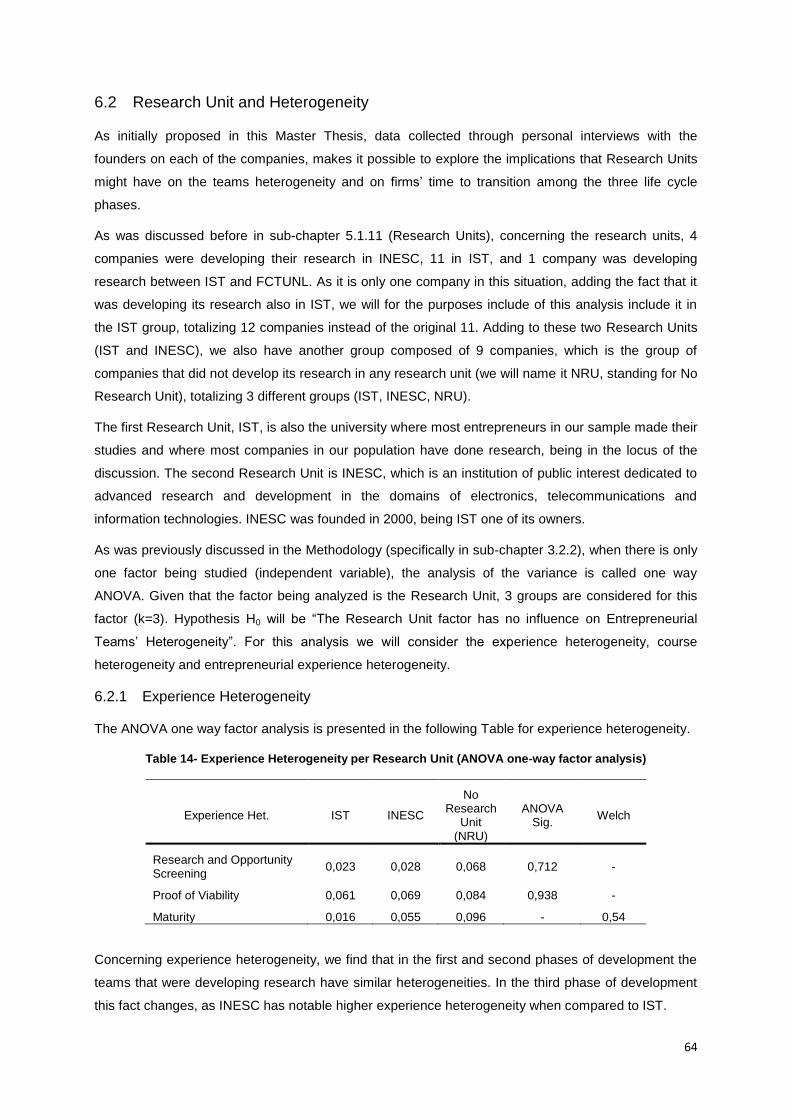
64
6.2 Research Unit and Heterogeneity
As initially proposed in this Master Thesis, data collected through personal interviews with the
founders on each of the companies, makes it possible to explore the implications that Research Units
might have on the teams heterogeneity and on firms’ time to transition among the three life cycle
phases.
As was discussed before in sub-chapter 5.1.11 (Research Units), concerning the research units, 4
companies were developing their research in INESC, 11 in IST, and 1 company was developing
research between IST and FCTUNL. As it is only one company in this situation, adding the fact that it
was developing its research also in IST, we will for the purposes include of this analysis include it in
the IST group, totalizing 12 companies instead of the original 11. Adding to these two Research Units
(IST and INESC), we also have another group composed of 9 companies, which is the group of
companies that did not develop its research in any research unit (we will name it NRU, standing for No
Research Unit), totalizing 3 different groups (IST, INESC, NRU).
The first Research Unit, IST, is also the university where most entrepreneurs in our sample made their
studies and where most companies in our population have done research, being in the locus of the
discussion. The second Research Unit is INESC, which is an institution of public interest dedicated to
advanced research and development in the domains of electronics, telecommunications and
information technologies. INESC was founded in 2000, being IST one of its owners.
As was previously discussed in the Methodology (specifically in sub-chapter 3.2.2), when there is only
one factor being studied (independent variable), the analysis of the variance is called one way
ANOVA. Given that the factor being analyzed is the Research Unit, 3 groups are considered for this
factor (k=3). Hypothesis H0 will be “The Research Unit factor has no influence on Entrepreneurial
Teams’ Heterogeneity”. For this analysis we will consider the experience heterogeneity, course
heterogeneity and entrepreneurial experience heterogeneity.
6.2.1 Experience Heterogeneity
The ANOVA one way factor analysis is presented in the following Table for experience heterogeneity.
Table 14- Experience Heterogeneity per Research Unit (ANOVA one-way factor analysis)
Experience Het. IST INESC
No Research
Unit (NRU)
ANOVA Sig.
Welch
Research and Opportunity Screening
0,023 0,028 0,068 0,712 -
Proof of Viability 0,061 0,069 0,084 0,938 -
Maturity 0,016 0,055 0,096 - 0,54
Concerning experience heterogeneity, we find that in the first and second phases of development the
teams that were developing research have similar heterogeneities. In the third phase of development
this fact changes, as INESC has notable higher experience heterogeneity when compared to IST.
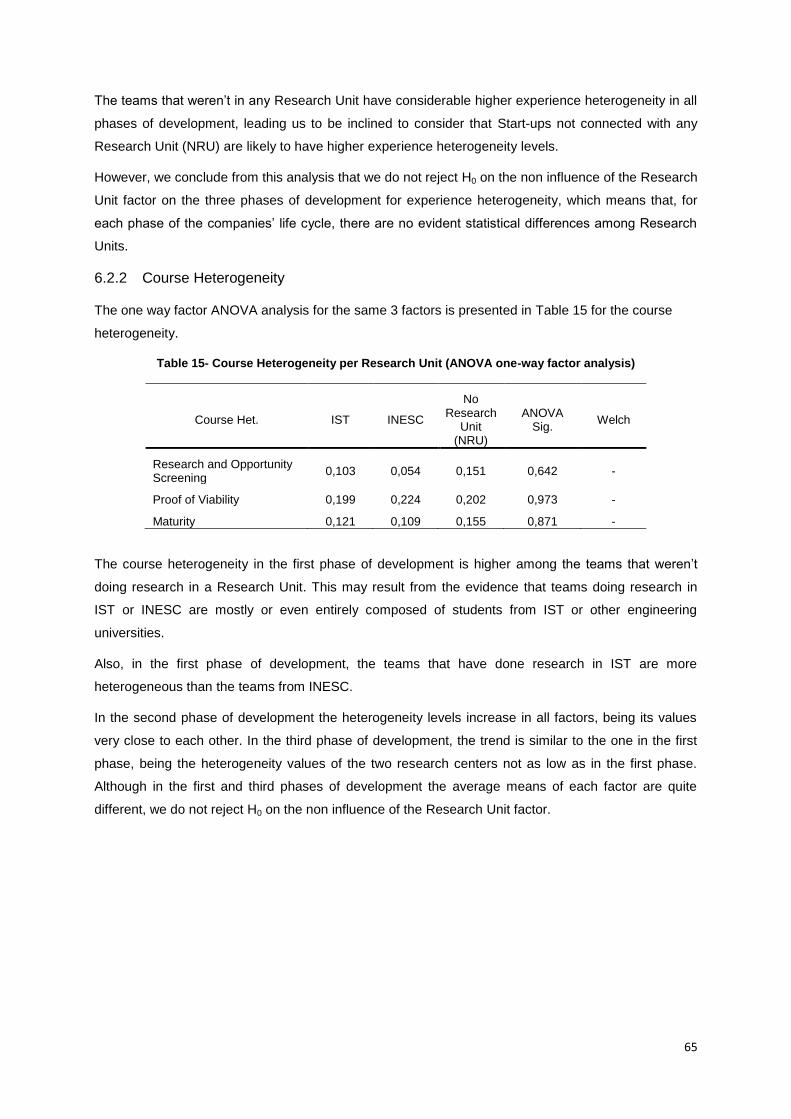
65
The teams that weren’t in any Research Unit have considerable higher experience heterogeneity in all
phases of development, leading us to be inclined to consider that Start-ups not connected with any
Research Unit (NRU) are likely to have higher experience heterogeneity levels.
However, we conclude from this analysis that we do not reject H0 on the non influence of the Research
Unit factor on the three phases of development for experience heterogeneity, which means that, for
each phase of the companies’ life cycle, there are no evident statistical differences among Research
Units.
6.2.2 Course Heterogeneity
The one way factor ANOVA analysis for the same 3 factors is presented in Table 15 for the course
heterogeneity.
Table 15- Course Heterogeneity per Research Unit (ANOVA one-way factor analysis)
Course Het. IST INESC
No Research
Unit (NRU)
ANOVA Sig.
Welch
Research and Opportunity Screening
0,103 0,054 0,151 0,642 -
Proof of Viability 0,199 0,224 0,202 0,973 -
Maturity 0,121 0,109 0,155 0,871 -
The course heterogeneity in the first phase of development is higher among the teams that weren’t
doing research in a Research Unit. This may result from the evidence that teams doing research in
IST or INESC are mostly or even entirely composed of students from IST or other engineering
universities.
Also, in the first phase of development, the teams that have done research in IST are more
heterogeneous than the teams from INESC.
In the second phase of development the heterogeneity levels increase in all factors, being its values
very close to each other. In the third phase of development, the trend is similar to the one in the first
phase, being the heterogeneity values of the two research centers not as low as in the first phase.
Although in the first and third phases of development the average means of each factor are quite
different, we do not reject H0 on the non influence of the Research Unit factor.
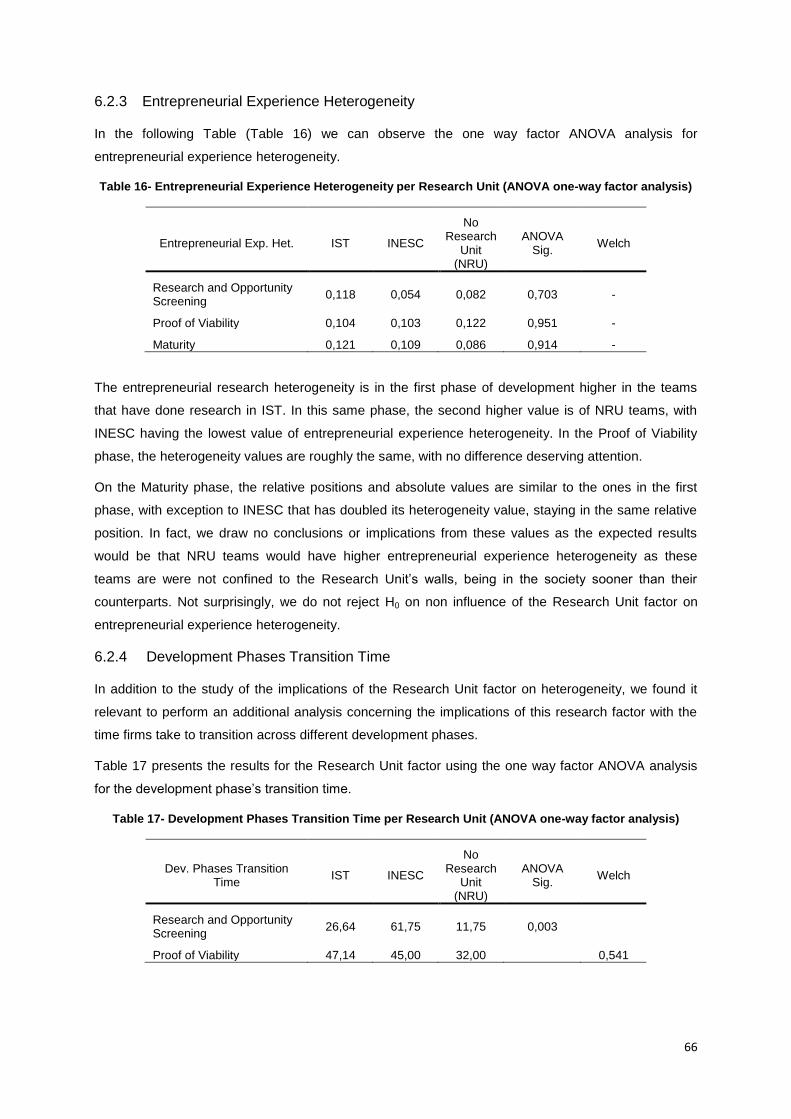
66
6.2.3 Entrepreneurial Experience Heterogeneity
In the following Table (Table 16) we can observe the one way factor ANOVA analysis for
entrepreneurial experience heterogeneity.
Table 16- Entrepreneurial Experience Heterogeneity per Research Unit (ANOVA one-way factor analysis)
Entrepreneurial Exp. Het. IST INESC
No Research
Unit (NRU)
ANOVA Sig.
Welch
Research and Opportunity Screening
0,118 0,054 0,082 0,703 -
Proof of Viability 0,104 0,103 0,122 0,951 -
Maturity 0,121 0,109 0,086 0,914 -
The entrepreneurial research heterogeneity is in the first phase of development higher in the teams
that have done research in IST. In this same phase, the second higher value is of NRU teams, with
INESC having the lowest value of entrepreneurial experience heterogeneity. In the Proof of Viability
phase, the heterogeneity values are roughly the same, with no difference deserving attention.
On the Maturity phase, the relative positions and absolute values are similar to the ones in the first
phase, with exception to INESC that has doubled its heterogeneity value, staying in the same relative
position. In fact, we draw no conclusions or implications from these values as the expected results
would be that NRU teams would have higher entrepreneurial experience heterogeneity as these
teams are were not confined to the Research Unit’s walls, being in the society sooner than their
counterparts. Not surprisingly, we do not reject H0 on non influence of the Research Unit factor on
entrepreneurial experience heterogeneity.
6.2.4 Development Phases Transition Time
In addition to the study of the implications of the Research Unit factor on heterogeneity, we found it
relevant to perform an additional analysis concerning the implications of this research factor with the
time firms take to transition across different development phases.
Table 17 presents the results for the Research Unit factor using the one way factor ANOVA analysis
for the development phase’s transition time.
Table 17- Development Phases Transition Time per Research Unit (ANOVA one-way factor analysis)
Dev. Phases Transition Time
IST INESC
No Research
Unit (NRU)
ANOVA Sig.
Welch
Research and Opportunity Screening
26,64 61,75 11,75 0,003
Proof of Viability 47,14 45,00 32,00
0,541
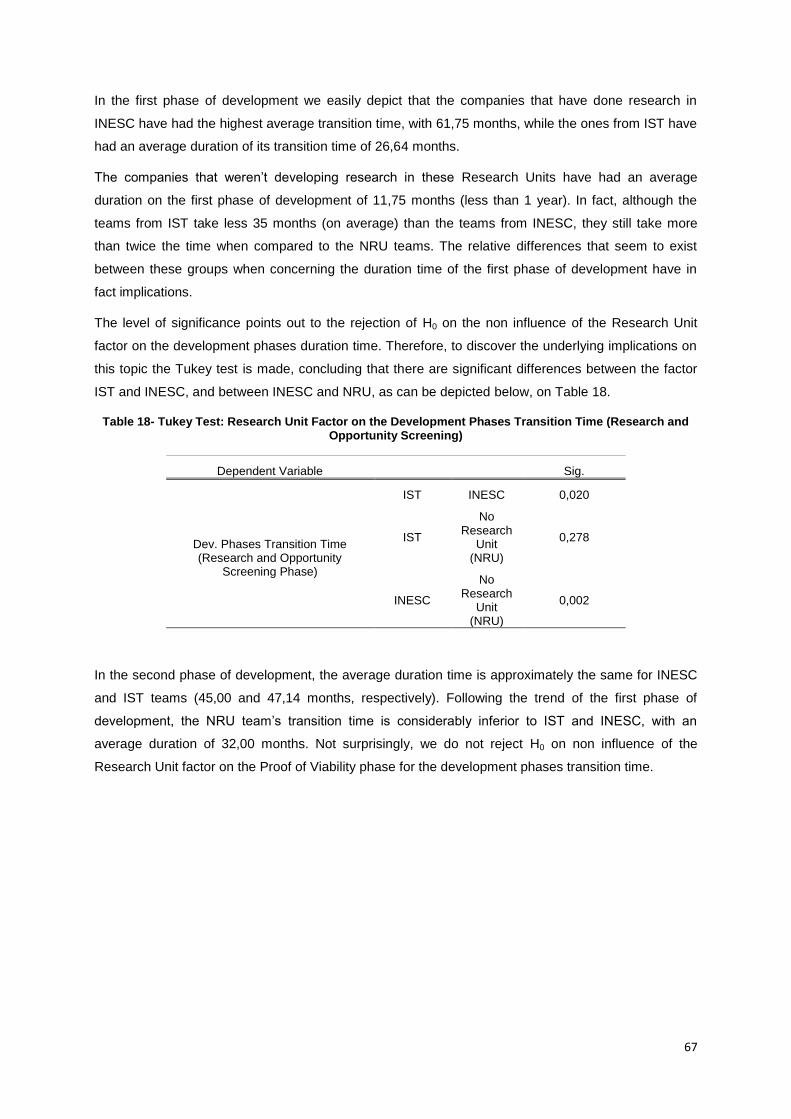
67
In the first phase of development we easily depict that the companies that have done research in
INESC have had the highest average transition time, with 61,75 months, while the ones from IST have
had an average duration of its transition time of 26,64 months.
The companies that weren’t developing research in these Research Units have had an average
duration on the first phase of development of 11,75 months (less than 1 year). In fact, although the
teams from IST take less 35 months (on average) than the teams from INESC, they still take more
than twice the time when compared to the NRU teams. The relative differences that seem to exist
between these groups when concerning the duration time of the first phase of development have in
fact implications.
The level of significance points out to the rejection of H0 on the non influence of the Research Unit
factor on the development phases duration time. Therefore, to discover the underlying implications on
this topic the Tukey test is made, concluding that there are significant differences between the factor
IST and INESC, and between INESC and NRU, as can be depicted below, on Table 18.
Table 18- Tukey Test: Research Unit Factor on the Development Phases Transition Time (Research and Opportunity Screening)
Dependent Variable
Sig.
Dev. Phases Transition Time (Research and Opportunity
Screening Phase)
IST INESC 0,020
IST
No Research
Unit (NRU)
0,278
INESC
No Research
Unit (NRU)
0,002
In the second phase of development, the average duration time is approximately the same for INESC
and IST teams (45,00 and 47,14 months, respectively). Following the trend of the first phase of
development, the NRU team’s transition time is considerably inferior to IST and INESC, with an
average duration of 32,00 months. Not surprisingly, we do not reject H0 on non influence of the
Research Unit factor on the Proof of Viability phase for the development phases transition time.
68
7 Conclusions
Using a particular population of companies and a scope comprising all the team members, this Master
Thesis was built to understand how entrepreneurial teams evolve along the different phases of a
spinout process. Based on the literature (Vohora et al., 2004; Vanaelst et al., 2006), we defined three
phases of development for academic spinouts. These phases are (1) Research & Opportunity
Screening (pre-startup), (2) Proof of Viability (post-startup) and (3) Maturity Phase (post-startup).
As this is the first study built on data collected from the start-ups created in the scope of Instituto
Superior Técnico, we made an extensive descriptive analysis, as we found it most important for a first
general picture of these companies to be revealed.
These companies operate in various areas of activity, ranging from Aerospace Technology to
Biotechnology, being Software the most common area of activity found. For a total of 25 companies, 5
experienced external investment (venture capital or similar). The initial investment made by these
companies ranged from 2.500€ to 250.000€, being 5.000€ and 50.000€ the most common amounts of
investment made as these values represent the minimum required capital for the two main juridical
forms of societies, “Sociedade por Quotas” and “Sociedade Anónima”, respectively.
Despite the present negative economical trend in Portugal, the number of employees working in these
companies has increased from 358 in 2009 to 424 in 2012. This work force comprises a high
percentage of people with higher education, representing more than 81% of the employees in the four
years analyzed. These workers made their academic courses on various different universities. Given
the characteristics of our sample (“IST Spin-off Community”) 25 companies stated they employ
workers (and have entrepreneurs) that graduated in IST.
An economic perspective on our study shows that 80% of these companies are currently having
profits, with 3 companies with sales varying between 4 and 10 million Euros (economic year of 2011).
The most common sales interval is from 500.000€ to 1 million Euros, were 9 companies are situated.
No company in the Proof of Viability phase has sales above this interval. The sales variation (from
2010 to 2011) were in average 13,48%, with 15 companies with growing sales (26,07%), 3 companies
with no variation (0%) and 4 companies with decreasing sales values (-13,50%). Only the companies
in the Maturity phase have had decreasing sales values.
In terms of innovation, out of the total 25 companies, only 10 requested or registered a patent. Patent
requests and registration are more common on the Proof of Viability and Maturity phases – only a total
of two patents were requested (by a single company) in the Research and Opportunity Screening
phase.
The entrepreneurial teams, the locus of our analysis, were composed of a total of 86 entrepreneurs
along the various phases of development. Of these 82 are Portuguese, and only 4 are women, being
this fact not surprising as females are a minority of the self-employed workforce in all developed
countries, and in all ethnic groups, being this fact consistent with the literature (Parker, 2004).
69
Our study shows that not all the researchers and entrepreneurs involved in the original team are
actively involved in the spinout at the time when our survey was conducted, as many original founders
have left, particularly when the company reaches its Maturity phase. In fact, these teams change
during the spinout process, with both new members joining the team as others abandon it, being these
results in line with the Vanaelst et al. (2006) conclusions. We find no consistent evidence that
members tend to leave before the formal creation of the spinout, as Vanaelst et al. (2006) suggests.
On the other hand, we find evidence that members tend to leave the spinout before it enters the
Maturity phase for a possible variety of reasons, namely the amount of time the company is taking to
reach sustainable earnings (Maturity phase), or even the discouragement posed by IST’s policy which
doesn’t allow the combination of full academic tenure and a position in a venture.
After the venture is in the Maturity phase, most entrepreneurs stay in the company, while very few
abandon the company. In other cases a surrogate entrepreneur is attracted to the team, even though
the venture is already in Maturity. These facts are consistent with the previous findings (Vanaelst et
al., 2006). With exclusion to Vanaelst et al. (2006) study, we provide an important extension to the
previous research on entrepreneurial teams, as this subject is often viewed in a static framework
(because traditionally different teams are analyzed at a certain moment in time), whereas we analyze
the same teams in different moments in time, taking a dynamic perspective throughout the various
phases of development.
The team’s structure was analyzed at one point in time before the formal establishment (Research and
Opportunity Screening) of the venture and at two points in time after this event (Proof of Viability and
Maturity). In line with the literature and the overall expectations we found that new team members
brought in different kinds of experience to the technology-based companies under study. We analyzed
the team’s heterogeneity in four different categories: Course, Scientific Area of Studies, Experience
and Entrepreneurial Experience. Based on these categories, we find evidence that the teams overall
scientific, entrepreneurial and professional experience skills suffer an increase when the decision to
create a spinout is taken. In other words, the teams become on average more heterogeneous when
the firm is officially created, finding the need for people with other skills and knowledge, as different
activities from research and development are required (e.g. management, marketing). This fact is in
line with the literature’s conclusions on this topic (Vanaelst et al.,2006).
On the other hand, we find no evidence that the teams continuously have their experience and
knowledge more balanced and broadened the further they move along the spinout process, because
in the Maturity phase all the heterogeneity values are lower than in the Proof of Viability phase. This
fact may be due the exit of team members in the last phase of development (which often sold their
shares to the other partners), as in the Maturity phase the companies already have a good number of
employees, which at that phase fulfill the needed experience and knowledge within the organization.
Additionally, an analysis of these heterogeneities was also built concerning the Research Unit were
each firm developed its R&D. Although no significant statistical evidence was found on this subject to
prove that this factor has an actual influence on the various heterogeneities, the companies that
weren’t in any Research Unit (NRU) have considerable higher experience heterogeneity in all phases
70
of development, sugesting that NRU may have a certain influence on experience heterogeneity. This
fact could be because the companies doing research in IST and INESC are less open to newcomers
from other areas of experience. Nevertheless, this fact remained inconclusive.
Following another stream of research, we found it relevant to do one additional analysis concerning
the implications of the Research Unit factor on the development phase’s transition time. In the
Research and Opportunity Screening phase the companies that have done research in INESC have
had the highest average transition time, with 61,75 months, while the ones from IST have had an
average duration of its transition time of 26,64 months. The companies that weren’t developing
research in these Research Units have had an average duration on the first phase of development of
11,75 months (less than 1 year). In fact, although the teams from IST take fewer 35 months (on
average) than the teams from INESC, they still take more than twice the time when compared to the
NRU teams.
Based on these facts conclusions were drawn (based on the Tukey test) stating that there are
significant differences between the factor IST and INESC, and between INESC and NRU. This fact
can have implications on future university policies, as the companies that have done research in
INESC take significantly more time to make a transition into the next phase of development. This
conclusion has limitations on a statistical point of view, due the small size of our sample.
In fact, there are some limitations in our study that should be carefully exposed. The population of
companies analyzed is very stretched in time, as the time frame encompassing these firms ’ creation
spans from 1986 to 2011. This fact might have implications that we could not predict, as not only the
social and economic conditions but also the policies surrounding entrepreneurship have significantly
changed in these 25 years. Additionally, this fact arouse complications on the analysis of the team
composition in the older firms, as for some entrepreneurs some occurrences were partially forgotten.
Because of this fact not only a good degree of precision in the dates involved was harder to obtain as
their past partners personal information was often hard to remember.
Additionally, our study focused only on the development of spinoffs in one geographical area,
particularly in one university. Different institutional and geographical environments may due to various
aspects have different impacts on the availability of potential incoming team members and university
policies. These facts open the need for further research that examines the development of teams in
different institutional contexts. The limited number of companies analyzed and with the focus on a
limited set of issues, we were unable to analyze the relationships that could exist between the team
size, heterogeneity and financial data. Although we analyzed the companies that were more formal
spinoffs, as they were doing research in IST and INESC, and the companies that didn’t develop formal
research, our entire population is composed of academic spinoffs. Due to this fact, in terms of future
research, there is a need for studies that compare the development of academic spinouts and of
similar nonacademic spinouts, uncovering the differences that may exist not only on the team’s
heterogeneity but also on other issues (e.g. development phases duration time).
71
Finally, during the interviews conducted with the entrepreneurs, an open set of time was made
available for the entrepreneurs to freely comment on two main central issues. The facts referenced in
this conversation may have implications on advices for future policies. The University as form of
support to the creation and development of new ventures and the Entrepreneurial Team as the center
and locus of analysis of a newly created venture’s success were the two main central issues.
Concerning the Entrepreneurial Teams the most referenced contribution was the fact that
entrepreneurs have to be resilient and risk tolerant in order to thrive. Having a team with good and
balanced skills (heterogeneous) was also referenced, with some referencing the importance of the
technical capabilities and others referencing the importance of commercial capabilities.
The main contributions made concerning the University, point out to the fact that the market should be
the drive of R&D in universities, as mostly the research developed in the universities doesn’t have any
practical application. The encouragement to entrepreneurship and entrepreneurs in general was
referenced as a very important factor to stimulate the creation of new ventures, particularly the
creation of a firm incubator within the university, and the financial disincentives (that should cease to
exist) to teachers that start a new venture were also mentioned. These facts can open a stream of
policies covering various areas that the University can follow to build strong incentives to
entrepreneurship and the creation of new ventures, creating a vibrant entrepreneurial culture within
the university.
72
8 References
Audretsch, D. B. (2003), ‘Entrepreneurship: A survey of the literature’, Enterprise Papers, Nº
14, Brussels: European Commission, Enterprise Directorate-General.
Audretsch, D. B. (1995a), ‘Innovation and Industry Evolution’, Cambridge: MIT Press.
Audretsch, D. B. and R. Thurik (2001), ‘What´s New about the New Economy? Sources of
Growth in the Managed and Entrepreneurial Economies’, Industrial and Corporate Change,
10(1), 267-315.
Barnes, J. W. (1994), ‘Statistical Analysis for Engineers and Scientists. A computer based
approach’, New York, McGraw-Hill.
Birch, D. L., A. Haggerty and W. Parsons (1997), ‘Who’s Creating Jobs?’, Cambridge, MA,
Cognetics Inc.
Brock, W. A. and D. S. Evans (1989), ‘Small Business Economics’, Small Business
Economics, 1(1), 7-20.
Chiesa, V. and A. Piccaluga (2000), ‘Exploitation and diffusion of public research: the case of
academic spin-off companies in Italy’, R & D Management, 30(4), 329-339.
Chukumba, C. O. and R. A. Jensen (2005), ‘University Invention, Entrepreneurship, and
Start-ups’, Department of Economics and Econometrics, The University of Notre Dame.
Clarysse, B. and N. Moray (2004), ‘A process study of entrepreneurial team formation: the
case of a research-based spin-off’, Journal of Business Venturing, 19(1), 55-79.
Clarysse, B., Wright, M., Lockett, A., Van de Velde, E. and Vohora, A. (2005), ‘Spinning out
new ventures: a typology of incubation strategies from European research institutions’,
Journal of Business Venturing, 20(2), 183-216.
Cooney, T. M. (2005), ‘Editorial: What is an Entrepreneurial Team?’, International Small
Business Journal, 23(3), 226-235.
Di Gregorio, D. and S. Shane (2003), ‘Why some universities generate more start-ups than
others?’, Research Policy, 32(2), 209-227.
Ensley, M. D. and K. M. Hmieleski (2005), ‘A comparative study of new venture top
management team composition, dynamics and performance between university-based and
independent start-ups’, Research Policy, 34(7), 1091-1105.
European Commission (2011), ‘Horizon 2020 - The Framework Programme for Research
and Innovation’, Communication from the Commission to the European Parliament, the
73
Council, the European Economic and Social Committee and the Committee of the Regions,
Brussels, Available at: http://ec.europa.eu/research/horizon2020/index_en.cfm
Fini, R., N. Lacetera and S. Shane (2010), ‘Inside or outside the IP system? Business
Creation in academia’, Research Policy, 39, 1060-1069.
Goldfarb, B., M. Henreksson and N. Rosenberg (2001), ‘Demand versus supply-driven
innovations: US and Swedish experiences in academic entrepreneurship’, Working Paper,
Stockholm School of Economics.
Grandi, A. and R. Grimaldi (2003), ‘Exploring the networking characteristics of new venture
founding teams’, Small Business Economics, 21(4), 329-341.
Hambrick, D. C. and P. A. Mason (1984), ‘Upper echelons: The organization as a reflexion of
its top managers’, Academy of Management Review, 9(2), 193-207.
Hebert, R. F. and A. N. Link (1989), ‘In Search of the Meaning of Entrepreneurship’, Small
Business Economics, 1(1), 39-49.
Johansson, M., M. Jacob and T. Hellstrom (2005), ‘The strength of strong ties: university
spin-offs and the significance of historical relations’, Journal of Technology Transfer, 30(3),
271-286.
Kamm, J. B., J. C. Schuman, J. A. Seeger and A. J. Nurick (1990), ‘Entrepreneurial teams in
new venture creation: A research agenda’, Entrepreneurship Theory and Practice, 14(4), 7-
17.
Kenney, M. (1986), ‘Biotechnology: The University-Industrial Complex’, Yale University
Press, New Haven.
Klofsten, M. and D. Jones-Evans (2000), ‘Comparing academic entrepreneurship in Europe-
the case of Sweden and Ireland’, Small Business Economics, 14(4), 229-309.
Levin, S. and P. Stephan (1991), ‘Research productivity over the life cycle: evidence for
academic scientists’, American Economic Review, 81(4), 114-132.
Lockett, A., D. Siegel, M. Wright and D. M. Ensley (2005), ‘The creation of spin-off firms at
public research institutions: managerial and policy implications’, Research Policy, 34(7), 981.
Macho-Stadler, I., D. Pérez-Castrillo and R. Veugelers (2007), ‘Licensing of university
inventions: The role of a technology transfer office’, International Journal of Industrial
Organization, 25, 483-510.
Markman, G. D., P. H. Phan, D. B. Balkin and P. T. Gianiodis (2005), ‘Entrepreneurship and
university-based technology transfer’, Journal of Business Venturing, 20 (2), 241-263.
74
Marôco, J. (2010), ‘Análise Estatística com o PASW Statistics (ex-SPSS)’, Pêro Pinheiro:
Report Number - Análise e Gestão de Informação.
Mowery, D. C. and A. A. Ziedonis (2002), ‘Academic patent quality and quantity before and
after the BayhDole act in the United States’, Research Policy, 31 (3), 399-418.
Nerkar, A. and S. Shane (2003), ‘When do start-ups that exploit academic knowledge
survive?’, International Journal of Industrial Organization, 21(9), 1391-1410.
Nicolaou, N. and S. Birley (2003), ‘Social networks in organizational emergence: the
university spinout phenomenon’, Management Science, 49 (12), 1702-1725.
Organization for Economic Co-Operation and Development (OECD), (1998), Fostering
Entrepreneurship, Paris: OECD.
Parker, S. (2004), ‘The Economics of Self-Employment and Entrepreneurship’, Cambridge:
Cambridge University Press.
O´Shea, R. P., T. J. Allen, A. Chevalier and F. Roche (2005), ‘Entrepreneurial orientation,
technology transfer and spinoff performance of U.S. universities’, Research Policy, 34(7),
994-1009.
Roberts, E. (1991), ‘Entrepreneurs in High Technology - Lessons from MIT and Beyond’,
Oxford University Press, New York.
Rothaermel, F. T. and M. C. Thursby (2005), ‘University – incubator firm knowledge flows:
assessing their impact on incubator firm performance’, Research Policy, 34(3), 305-320.
Rothaermel, F. T., S. D. Agung and L. Jiang (2007), ‘University entrepreneurship: a
taxonomy of the literature’, Industrial and Corporate Change, Oxford University Press.
Saxenian, A. (1990), ‘Regional Networks and the resurgence of Silicon Valley’, Management
Review, 33(1), 89-113.
Schumpeter, J. A. (1934), ‘The Theory of Economic Development’, Cambridge, MA: Harvard
University Press.
Shane, S. (2002a), ‘Executive Forum: University technology transfer to entrepreneurial
companies’, Journal of Business Venturing, 17(6), 537-552.
Shane, S. (2002b), ‘Selling University Technology: Patterns from MIT’, Management
Science, 48(1), 122-137.
Shane, S. (2001a), ‘Technology opportunity and firm formation’, Management Science,
47(2), 205-220.
75
Shane, S. (2001b), ‘Technology regimes and new firm formation’, Management Science,
47(9), 1173-1190.
Shane, S. and R. Khurana (2000), ‘Career Experience and firm founding’, Academy of
Management Best Paper Proceedings.
Shane, S. and T. Stuart (2002), ‘Organizational endowments and the performance of
university start-ups’, Management Science, 48(1), 154-170.
Teachman, J. D. (1980), ‘Analysis of population diversity’, Sociological Methods and
Research, 1, 149-177.
Thursby, J. G. and M. C. Thursby (2002), ‘Who is selling in the ivory tower? Sources of
growth in university licensing’, Management Science, 48(1), 90-104.
Ucbasaran, D., A. Lockett, M. Wright and P. Westhead (2003), ‘Entrepreneurial founder
teams: Factors associated with members entry and exit’, Entrepreneurship Theory and
Practice, 28(2), 107-128.
Van Muijen, J. J., P. Koopman, K. De Witte, G. De Cock, Z. Susanj and C. Lemoine (1999),
‘Organizational culture: The focus questionnaire’, European Journal of Work and
Organizational Psychology, 8(4), 551-568.
Vanaelst, I., B. Clarysse, M. Wright, A. Lockett, N. Moray and R. S´Jegers (2006),
‘Entrepreneurial team development in academic spinouts: an examination of team
heterogeneity’, Entrepreneurship Theory and Practice, 30(2), 249-271.
Vohora, A., M. Wright and A. Lockett (2004), ‘Critical junctures in the development of
university high-tech spinout companies’, Research Policy, 33(1), 147-175.
Welch, B. L. (1951), ‘On the comparison of several mean values: An alternative approach’,
Biometrika, 38, 330-336.
Zucker, L., M. Darby and M. Brewer (1998), ‘Intellectual human capital and the birth of US
biotechnology enterprises’, American Economic Review, 88(1), 290-305.

76
9 Annexes
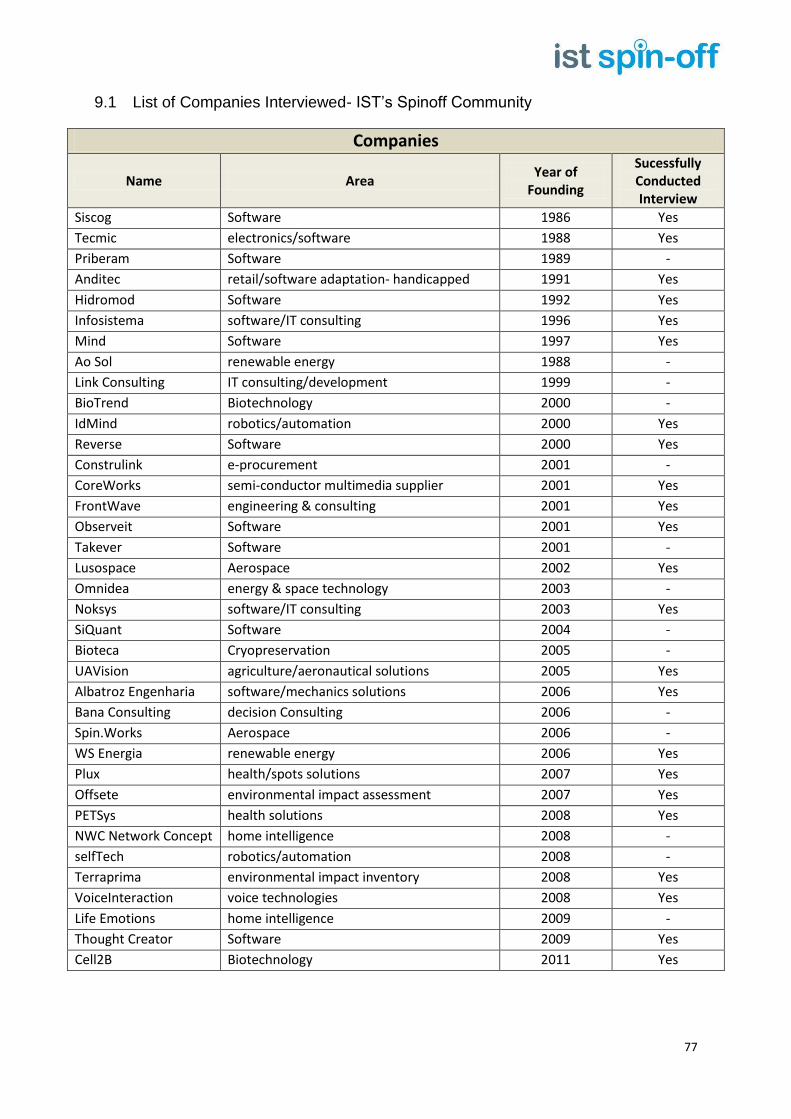
77
9.1 List of Companies Interviewed- IST’s Spinoff Community
Companies
Name Area Year of
Founding
Sucessfully Conducted Interview
Siscog Software 1986 Yes
Tecmic electronics/software 1988 Yes
Priberam Software 1989 -
Anditec retail/software adaptation- handicapped 1991 Yes
Hidromod Software 1992 Yes
Infosistema software/IT consulting 1996 Yes
Mind Software 1997 Yes
Ao Sol renewable energy 1988 -
Link Consulting IT consulting/development 1999 -
BioTrend Biotechnology 2000 -
IdMind robotics/automation 2000 Yes
Reverse Software 2000 Yes
Construlink e-procurement 2001 -
CoreWorks semi-conductor multimedia supplier 2001 Yes
FrontWave engineering & consulting 2001 Yes
Observeit Software 2001 Yes
Takever Software 2001 -
Lusospace Aerospace 2002 Yes
Omnidea energy & space technology 2003 -
Noksys software/IT consulting 2003 Yes
SiQuant Software 2004 -
Bioteca Cryopreservation 2005 -
UAVision agriculture/aeronautical solutions 2005 Yes
Albatroz Engenharia software/mechanics solutions 2006 Yes
Bana Consulting decision Consulting 2006 -
Spin.Works Aerospace 2006 -
WS Energia renewable energy 2006 Yes
Plux health/spots solutions 2007 Yes
Offsete environmental impact assessment 2007 Yes
PETSys health solutions 2008 Yes
NWC Network Concept home intelligence 2008 -
selfTech robotics/automation 2008 -
Terraprima environmental impact inventory 2008 Yes
VoiceInteraction voice technologies 2008 Yes
Life Emotions home intelligence 2009 -
Thought Creator Software 2009 Yes
Cell2B Biotechnology 2011 Yes
78
9.2 Questionnaire to IST’s spinoff firms: Company
Questionnaire
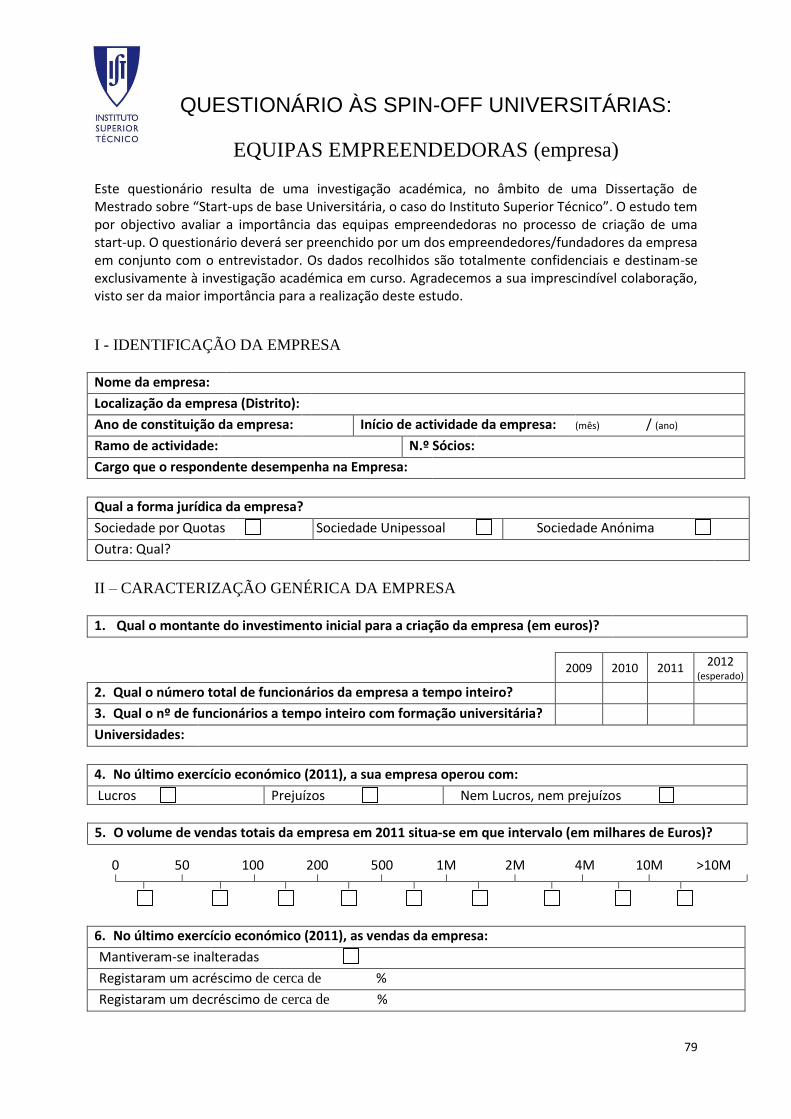
79
QUESTIONÁRIO ÀS SPIN-OFF UNIVERSITÁRIAS:
EQUIPAS EMPREENDEDORAS (empresa) Este questionário resulta de uma investigação académica, no âmbito de uma Dissertação de Mestrado sobre “Start-ups de base Universitária, o caso do Instituto Superior Técnico”. O estudo tem por objectivo avaliar a importância das equipas empreendedoras no processo de criação de uma start-up. O questionário deverá ser preenchido por um dos empreendedores/fundadores da empresa em conjunto com o entrevistador. Os dados recolhidos são totalmente confidenciais e destinam-se exclusivamente à investigação académica em curso. Agradecemos a sua imprescindível colaboração, visto ser da maior importância para a realização deste estudo.
I - IDENTIFICAÇÃO DA EMPRESA
Nome da empresa:
Localização da empresa (Distrito):
Ano de constituição da empresa: Início de actividade da empresa: (mês) / (ano)
Ramo de actividade: N.º Sócios:
Cargo que o respondente desempenha na Empresa:
Qual a forma jurídica da empresa?
Sociedade por Quotas Sociedade Unipessoal Sociedade Anónima
Outra: Qual?
II – CARACTERIZAÇÃO GENÉRICA DA EMPRESA
1. Qual o montante do investimento inicial para a criação da empresa (em euros)?
2009 2010 2011 2012 (esperado)
2. Qual o número total de funcionários da empresa a tempo inteiro?
3. Qual o nº de funcionários a tempo inteiro com formação universitária?
Universidades:
4. No último exercício económico (2011), a sua empresa operou com:
Lucros Prejuízos Nem Lucros, nem prejuízos
5. O volume de vendas totais da empresa em 2011 situa-se em que intervalo (em milhares de Euros)?
0 50 100 200 500 1M 2M 4M 10M >10M
6. No último exercício económico (2011), as vendas da empresa:
Mantiveram-se inalteradas
Registaram um acréscimo de cerca de %
Registaram um decréscimo de cerca de %
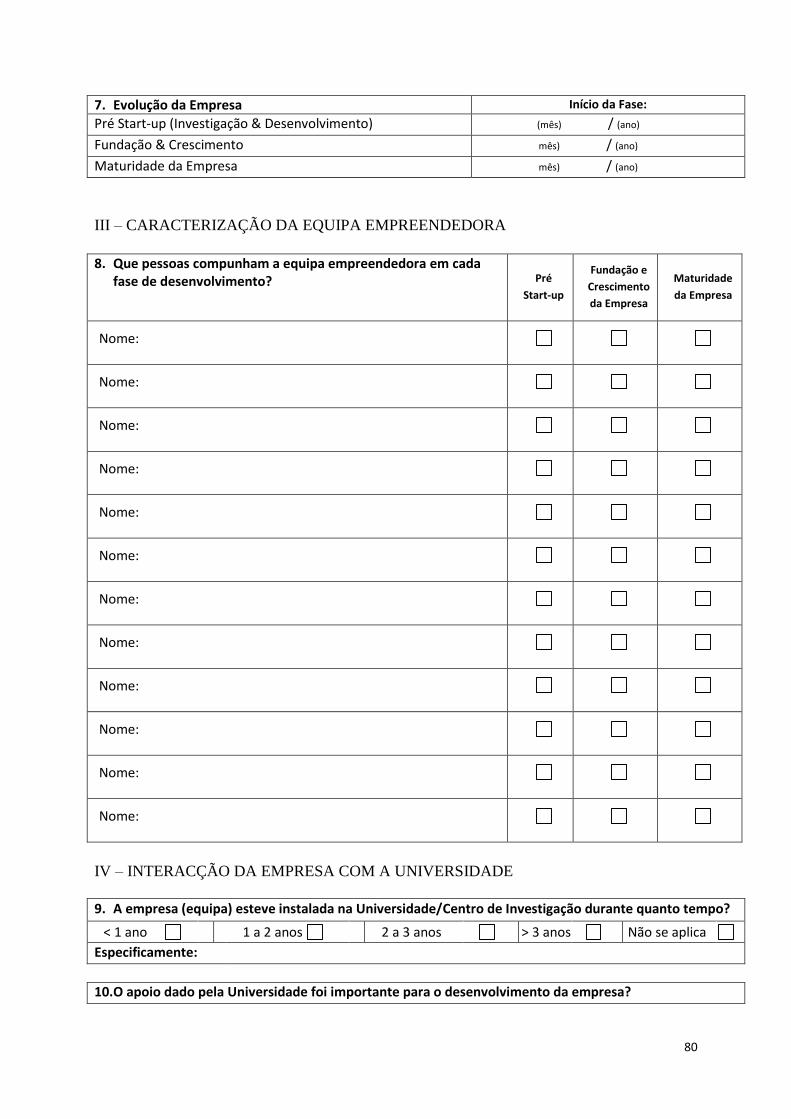
80
III – CARACTERIZAÇÃO DA EQUIPA EMPREENDEDORA
8. Que pessoas compunham a equipa empreendedora em cada
fase de desenvolvimento? Pré
Start-up
Fundação e
Crescimento
da Empresa
Maturidade
da Empresa
Nome:
Nome:
Nome:
Nome:
Nome:
Nome:
Nome:
Nome:
Nome:
Nome:
Nome:
Nome:
IV – INTERACÇÃO DA EMPRESA COM A UNIVERSIDADE
9. A empresa (equipa) esteve instalada na Universidade/Centro de Investigação durante quanto tempo?
< 1 ano 1 a 2 anos 2 a 3 anos > 3 anos Não se aplica
Especificamente:
10. O apoio dado pela Universidade foi importante para o desenvolvimento da empresa?
7. Evolução da Empresa Início da Fase:
Pré Start-up (Investigação & Desenvolvimento) (mês) / (ano)
Fundação & Crescimento mês) / (ano)
Maturidade da Empresa mês) / (ano)
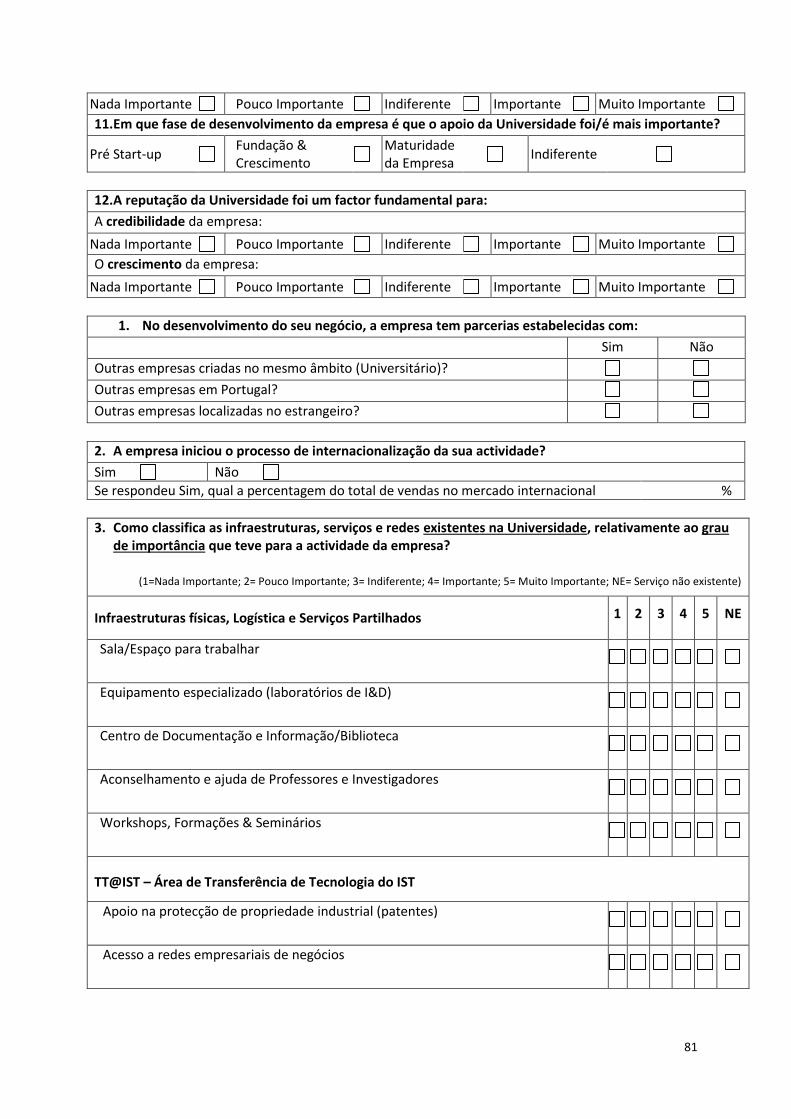
81
Nada Importante Pouco Importante Indiferente Importante Muito Importante
11. Em que fase de desenvolvimento da empresa é que o apoio da Universidade foi/é mais importante?
Pré Start-up Fundação & Crescimento
Maturidade da Empresa
Indiferente
12. A reputação da Universidade foi um factor fundamental para:
A credibilidade da empresa:
Nada Importante Pouco Importante Indiferente Importante Muito Importante
O crescimento da empresa:
Nada Importante Pouco Importante Indiferente Importante Muito Importante
1. No desenvolvimento do seu negócio, a empresa tem parcerias estabelecidas com:
Sim Não
Outras empresas criadas no mesmo âmbito (Universitário)?
Outras empresas em Portugal?
Outras empresas localizadas no estrangeiro?
2. A empresa iniciou o processo de internacionalização da sua actividade?
Sim Não
Se respondeu Sim, qual a percentagem do total de vendas no mercado internacional %
3. Como classifica as infraestruturas, serviços e redes existentes na Universidade, relativamente ao grau de importância que teve para a actividade da empresa?
(1=Nada Importante; 2= Pouco Importante; 3= Indiferente; 4= Importante; 5= Muito Importante; NE= Serviço não existente)
Infraestruturas físicas, Logística e Serviços Partilhados 1 2 3 4 5 NE
Sala/Espaço para trabalhar
Equipamento especializado (laboratórios de I&D)
Centro de Documentação e Informação/Biblioteca
Aconselhamento e ajuda de Professores e Investigadores
Workshops, Formações & Seminários
TT@IST – Área de Transferência de Tecnologia do IST
Apoio na protecção de propriedade industrial (patentes)
Acesso a redes empresariais de negócios
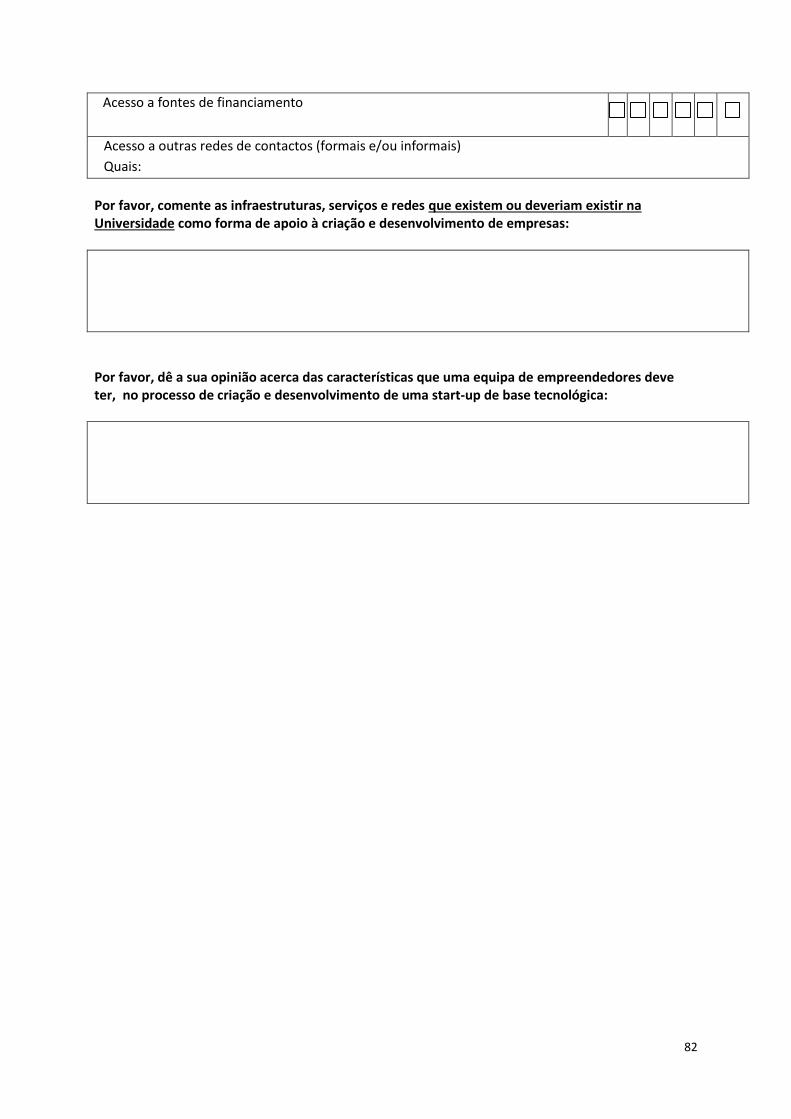
82
Acesso a fontes de financiamento
Acesso a outras redes de contactos (formais e/ou informais)
Quais:
Por favor, comente as infraestruturas, serviços e redes que existem ou deveriam existir na Universidade como forma de apoio à criação e desenvolvimento de empresas:
Por favor, dê a sua opinião acerca das características que uma equipa de empreendedores deve ter, no processo de criação e desenvolvimento de uma start-up de base tecnológica:

83
9.3 Questionnaire to IST’s spinoff firms: Personal
Questionnaire
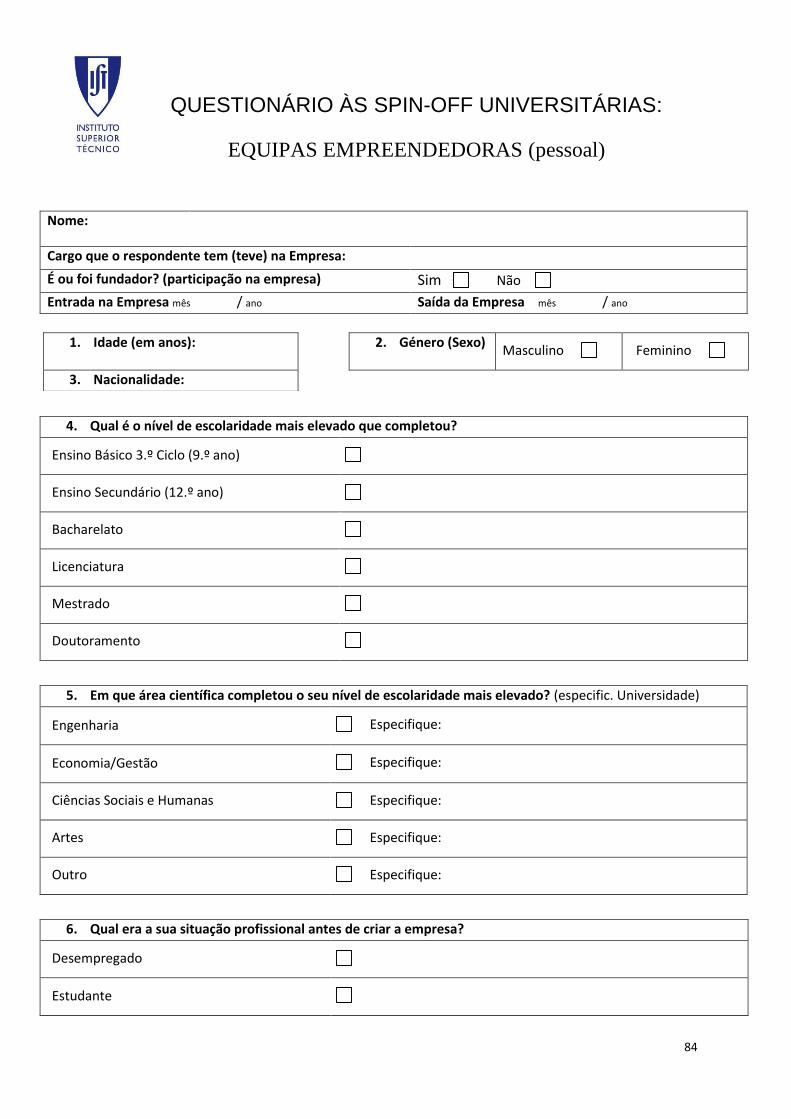
84
QUESTIONÁRIO ÀS SPIN-OFF UNIVERSITÁRIAS:
EQUIPAS EMPREENDEDORAS (pessoal)
Nome:
Cargo que o respondente tem (teve) na Empresa:
É ou foi fundador? (participação na empresa) Sim Não
Entrada na Empresa mês / ano Saída da Empresa mês / ano
4. Qual é o nível de escolaridade mais elevado que completou?
Ensino Básico 3.º Ciclo (9.º ano)
Ensino Secundário (12.º ano)
Bacharelato
Licenciatura
Mestrado
Doutoramento
5. Em que área científica completou o seu nível de escolaridade mais elevado? (especific. Universidade)
Engenharia Especifique:
Economia/Gestão Especifique:
Ciências Sociais e Humanas Especifique:
Artes Especifique:
Outro Especifique:
6. Qual era a sua situação profissional antes de criar a empresa?
Desempregado
Estudante
1. Idade (em anos):
2. Género (Sexo) Masculino Feminino
3. Nacionalidade:
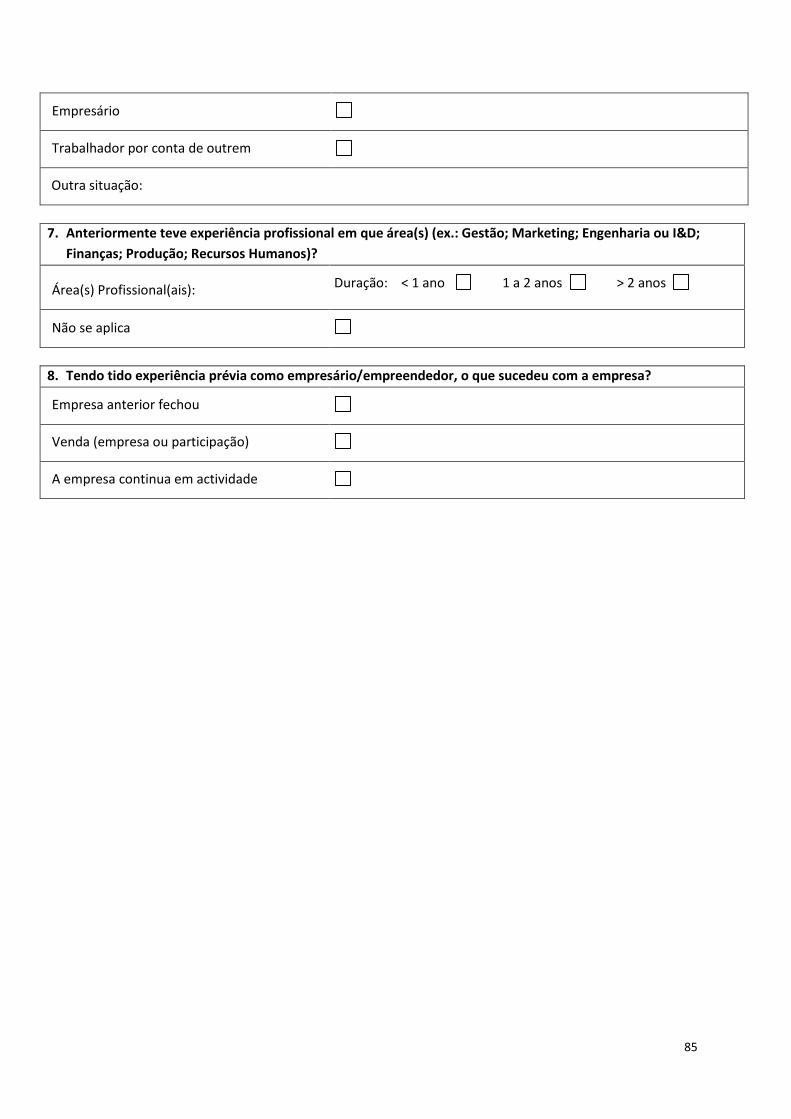
85
Empresário
Trabalhador por conta de outrem
Outra situação:
7. Anteriormente teve experiência profissional em que área(s) (ex.: Gestão; Marketing; Engenharia ou I&D;
Finanças; Produção; Recursos Humanos)?
Área(s) Profissional(ais): Duração: < 1 ano 1 a 2 anos > 2 anos
Não se aplica
8. Tendo tido experiência prévia como empresário/empreendedor, o que sucedeu com a empresa?
Empresa anterior fechou
Venda (empresa ou participação)
A empresa continua em actividade
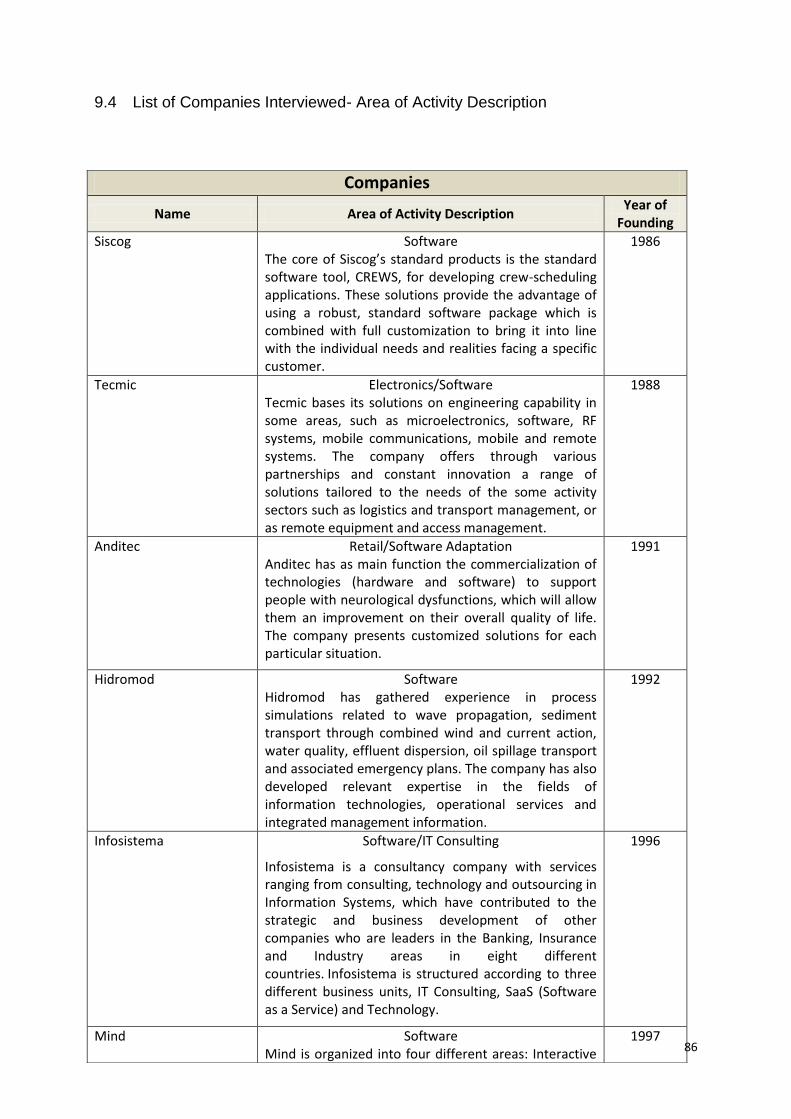
86
9.4 List of Companies Interviewed- Area of Activity Description
Companies
Name Area of Activity Description Year of
Founding
Siscog Software The core of Siscog’s standard products is the standard software tool, CREWS, for developing crew-scheduling applications. These solutions provide the advantage of using a robust, standard software package which is combined with full customization to bring it into line with the individual needs and realities facing a specific customer.
1986
Tecmic Electronics/Software Tecmic bases its solutions on engineering capability in some areas, such as microelectronics, software, RF systems, mobile communications, mobile and remote systems. The company offers through various partnerships and constant innovation a range of solutions tailored to the needs of the some activity sectors such as logistics and transport management, or as remote equipment and access management.
1988
Anditec Retail/Software Adaptation Anditec has as main function the commercialization of technologies (hardware and software) to support people with neurological dysfunctions, which will allow them an improvement on their overall quality of life. The company presents customized solutions for each particular situation.
1991
Hidromod Software Hidromod has gathered experience in process simulations related to wave propagation, sediment transport through combined wind and current action, water quality, effluent dispersion, oil spillage transport and associated emergency plans. The company has also developed relevant expertise in the fields of information technologies, operational services and integrated management information.
1992
Infosistema Software/IT Consulting
Infosistema is a consultancy company with services ranging from consulting, technology and outsourcing in Information Systems, which have contributed to the strategic and business development of other companies who are leaders in the Banking, Insurance and Industry areas in eight different countries. Infosistema is structured according to three different business units, IT Consulting, SaaS (Software as a Service) and Technology.
1996
Mind Software Mind is organized into four different areas: Interactive
1997
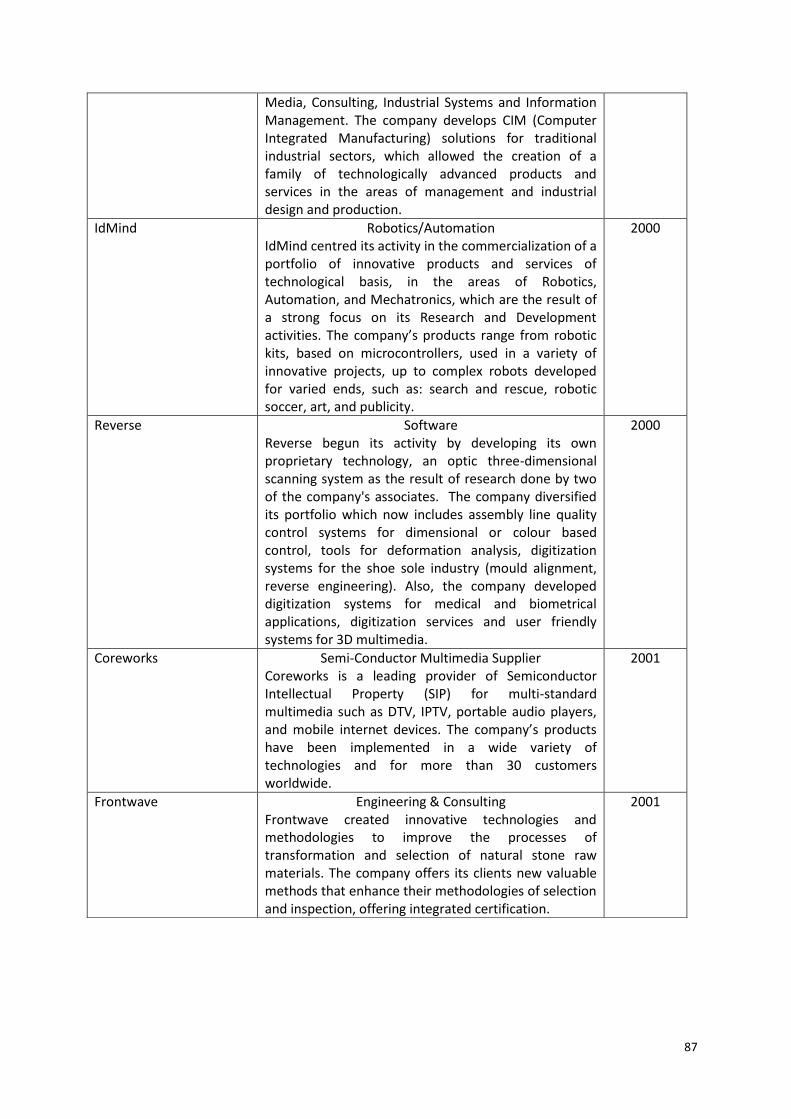
87
Media, Consulting, Industrial Systems and Information Management. The company develops CIM (Computer Integrated Manufacturing) solutions for traditional industrial sectors, which allowed the creation of a family of technologically advanced products and services in the areas of management and industrial design and production.
IdMind Robotics/Automation IdMind centred its activity in the commercialization of a portfolio of innovative products and services of technological basis, in the areas of Robotics, Automation, and Mechatronics, which are the result of a strong focus on its Research and Development activities. The company’s products range from robotic kits, based on microcontrollers, used in a variety of innovative projects, up to complex robots developed for varied ends, such as: search and rescue, robotic soccer, art, and publicity.
2000
Reverse Software Reverse begun its activity by developing its own proprietary technology, an optic three-dimensional scanning system as the result of research done by two of the company's associates. The company diversified its portfolio which now includes assembly line quality control systems for dimensional or colour based control, tools for deformation analysis, digitization systems for the shoe sole industry (mould alignment, reverse engineering). Also, the company developed digitization systems for medical and biometrical applications, digitization services and user friendly systems for 3D multimedia.
2000
Coreworks Semi-Conductor Multimedia Supplier Coreworks is a leading provider of Semiconductor Intellectual Property (SIP) for multi-standard multimedia such as DTV, IPTV, portable audio players, and mobile internet devices. The company’s products have been implemented in a wide variety of technologies and for more than 30 customers worldwide.
2001
Frontwave Engineering & Consulting Frontwave created innovative technologies and methodologies to improve the processes of transformation and selection of natural stone raw materials. The company offers its clients new valuable methods that enhance their methodologies of selection and inspection, offering integrated certification.
2001
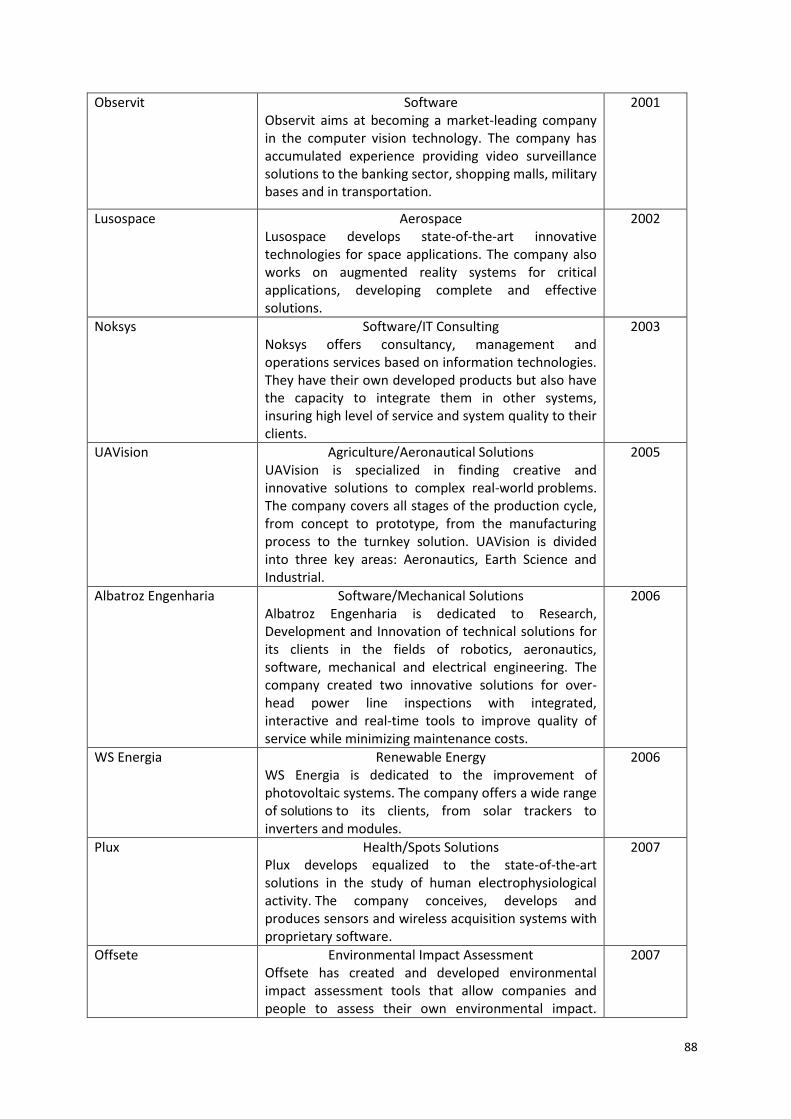
88
Observit Software Observit aims at becoming a market-leading company in the computer vision technology. The company has accumulated experience providing video surveillance solutions to the banking sector, shopping malls, military bases and in transportation.
2001
Lusospace Aerospace Lusospace develops state-of-the-art innovative technologies for space applications. The company also works on augmented reality systems for critical applications, developing complete and effective solutions.
2002
Noksys Software/IT Consulting Noksys offers consultancy, management and operations services based on information technologies. They have their own developed products but also have the capacity to integrate them in other systems, insuring high level of service and system quality to their clients.
2003
UAVision Agriculture/Aeronautical Solutions UAVision is specialized in finding creative and innovative solutions to complex real-world problems. The company covers all stages of the production cycle, from concept to prototype, from the manufacturing process to the turnkey solution. UAVision is divided into three key areas: Aeronautics, Earth Science and Industrial.
2005
Albatroz Engenharia Software/Mechanical Solutions Albatroz Engenharia is dedicated to Research, Development and Innovation of technical solutions for its clients in the fields of robotics, aeronautics, software, mechanical and electrical engineering. The company created two innovative solutions for over-head power line inspections with integrated, interactive and real-time tools to improve quality of service while minimizing maintenance costs.
2006
WS Energia Renewable Energy WS Energia is dedicated to the improvement of photovoltaic systems. The company offers a wide range of solutions to its clients, from solar trackers to inverters and modules.
2006
Plux Health/Spots Solutions Plux develops equalized to the state-of-the-art solutions in the study of human electrophysiological activity. The company conceives, develops and produces sensors and wireless acquisition systems with proprietary software.
2007
Offsete Environmental Impact Assessment Offsete has created and developed environmental impact assessment tools that allow companies and people to assess their own environmental impact.
2007
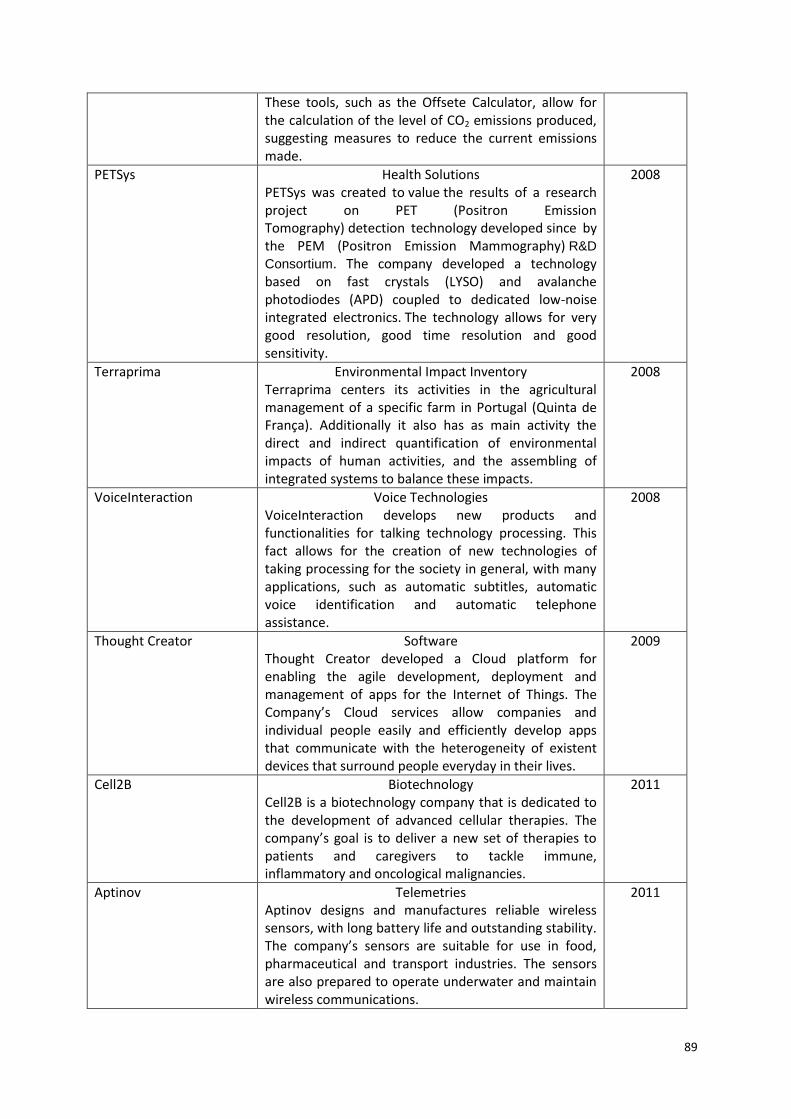
89
These tools, such as the Offsete Calculator, allow for the calculation of the level of CO2 emissions produced, suggesting measures to reduce the current emissions made.
PETSys Health Solutions PETSys was created to value the results of a research project on PET (Positron Emission Tomography) detection technology developed since by the PEM (Positron Emission Mammography) R&D
Consortium. The company developed a technology based on fast crystals (LYSO) and avalanche photodiodes (APD) coupled to dedicated low-noise integrated electronics. The technology allows for very good resolution, good time resolution and good sensitivity.
2008
Terraprima Environmental Impact Inventory Terraprima centers its activities in the agricultural management of a specific farm in Portugal (Quinta de França). Additionally it also has as main activity the direct and indirect quantification of environmental impacts of human activities, and the assembling of integrated systems to balance these impacts.
2008
VoiceInteraction Voice Technologies VoiceInteraction develops new products and functionalities for talking technology processing. This fact allows for the creation of new technologies of taking processing for the society in general, with many applications, such as automatic subtitles, automatic voice identification and automatic telephone assistance.
2008
Thought Creator Software Thought Creator developed a Cloud platform for enabling the agile development, deployment and management of apps for the Internet of Things. The Company’s Cloud services allow companies and individual people easily and efficiently develop apps that communicate with the heterogeneity of existent devices that surround people everyday in their lives.
2009
Cell2B Biotechnology Cell2B is a biotechnology company that is dedicated to the development of advanced cellular therapies. The company’s goal is to deliver a new set of therapies to patients and caregivers to tackle immune, inflammatory and oncological malignancies.
2011
Aptinov Telemetries Aptinov designs and manufactures reliable wireless sensors, with long battery life and outstanding stability. The company’s sensors are suitable for use in food, pharmaceutical and transport industries. The sensors are also prepared to operate underwater and maintain wireless communications.
2011

90
Talkdesk Software Talkdesk has created a call center cloud platform, enabling their clients to have their own call center without the high costs in infrastructures and hardware that are typical to the establishment of this service.
2011