Embed Size (px)
Citation preview
Entrepreneurial Intentions and the Theory of Planned Behaviour
Dylan Rusteberg
12366758
A research project submitted to the Gordon Institute of Business Science,
University of Pretoria, in partial fulfilment of the requirements for the degree of
Masters of Business Administration
11 November 2013
© 2014 University of Pretoria. All rights reserved. The copyright in this work vests in the University of Pretoria.
2
I. ABSTRACT
The study aimed to validate the applicability of the Theory of Planned Behaviour
and to test its sufficiency within a contextual setting that has seemingly received
limited prior focus. The sample comprised of 134 part-time learners from a
university business school within South Africa; who are arguably older, hold more
work experience and who are more ethnically diverse than subjects in most prior
research. Importantly, this study combined construct measurement scales from
two other studies in an attempt to improve measurement reliability.
Findings suggest that the Theory of Planned Behaviour was a significant predictor
of entrepreneurial intention within the context of an emerging economy, explaining
21.1% of the variation in student‟s entrepreneurial intention. Further analysis
revealed that demographic variables were found to have a significant residual
effect beyond the predictor variables within the Theory of Planned Behaviour,
explaining 6.9% more of the total variation in student‟s entrepreneurial intention
when added to the Theory of Planned Behaviour. Closer investigation revealed
that a particular racial group (black individuals) was solely responsible for the
significant influence on intentions, thus rendering age, gender and all other racial
groups as weak, insignificant contributors. These results suggest that the Theory
of Planned Behaviour is not sufficient in capturing all the variation in
entrepreneurial intention.
© 2014 University of Pretoria. All rights reserved. The copyright in this work vests in the University of Pretoria.

3
II. KEYWORDS
Entrepreneurial Intent; The Theory of Planned Behaviour; Emerging Economy
III. DECLARATION
I declare that this research project is my own work. It is submitted in partial
fulfilment of the requirements for the degree of Master of Business Administration
at the Gordon Institute of Business Science, University of Pretoria. It has not been
submitted before for any degree or examination in any other University. I further
declare that I have obtained the necessary authorization and consent to carry out
this research.
……………………………………. Date: 11 November 2013
Dylan Rusteberg
© 2014 University of Pretoria. All rights reserved. The copyright in this work vests in the University of Pretoria.

4
IV. ACKNOWLEDGEMENTS
My sincere and wholehearted thanks and appreciation go to the following people:
My supervisor, Dr. Jonathan Marks for his guidance and support throughout
the research process. His words of wisdom ‘don’t get too caught up; get it
down’ stood me in good stead and will likely continue into the future.
To Prof. Albert Wocke, without whom my data collection would likely have
failed. I thank him for his support by allowing me to address his classes
within his scheduled lecture time.
My Mom, Anne Rusteberg, for her continuous support despite her not
knowing what ‘the MBA or research thing is all about’.
My Dad, Brian Rusteberg for his words of encouragement reminding me to
‘vasbyt’
To „me‟ for persisting with this marathon and staying true to myself throughout
the process. What you read within this write-up is Dylan Rusteberg
unplugged; no statisticians and no editors.
Last, but not least to Lindsay Bartlett, without whom I would likely not have
made it through this final hurdle. For her unfaltering support despite her plate
being full; she continues to be my biggest fan. For that, I thank her with all of
my heart.
© 2014 University of Pretoria. All rights reserved. The copyright in this work vests in the University of Pretoria.
5
V. TABLE OF CONTENTS
I. ABSTRACT .................................................................................................. 2
II. KEYWORDS ................................................................................................. 3
III. DECLARATION ............................................................................................ 3
IV. ACKNOWLEDGEMENTS ............................................................................. 4
V. TABLE OF CONTENTS................................................................................ 5
VI. LIST OF TABLES ......................................................................................... 8
VII. LIST OF FIGURES ..................................................................................... 10
VIII. LIST OF ABBREVIATIONS ........................................................................ 11
1. RESEARCH PROBLEM AND PURPOSE .................................................. 13
1.1. Introduction .......................................................................................... 13
1.2. Entrepreneurial Activity for Economic Development ............................ 14
1.3. Significance of Entrepreneurial Intentions within South Africa ............. 16
1.4. Conclusion ........................................................................................... 18
2. LITERATURE REVIEW .............................................................................. 20
2.1. Introduction .......................................................................................... 20
2.2. The Focus of Prior Entrepreneurial Research ...................................... 20
2.3. The Theory of Planned Behaviour ....................................................... 24
2.3.1. Background ................................................................................... 24
2.3.2. Theoretical Constructs ................................................................... 25
2.3.3. Empirical Research ....................................................................... 28
2.4. Closing Remarks and Formulation of Propositions .............................. 37
2.4.1. Proposition 1 ................................................................................. 38
2.4.2. Proposition 2 ................................................................................. 38
© 2014 University of Pretoria. All rights reserved. The copyright in this work vests in the University of Pretoria.
6
3. RESEARCH HYPOTHESES ...................................................................... 39
3.1. Introduction .......................................................................................... 39
3.2. Research Question 1 ........................................................................... 39
3.3. Research Question 2 ........................................................................... 39
3.4. Research Objective .............................................................................. 40
3.4.1. Hypothesis 1 .................................................................................. 40
3.4.2. Hypothesis 2 .................................................................................. 40
4. METHODOLOGY ....................................................................................... 41
4.1. Introduction .......................................................................................... 41
4.2. Research Design ................................................................................. 41
4.3. Population ............................................................................................ 42
4.4. Sampling .............................................................................................. 43
4.5. Unit of Analysis .................................................................................... 44
4.6. Survey Design and Pilot Study ............................................................. 44
4.7. Data Gathering Procedure ................................................................... 45
4.8. Principle of Validity and Reliability ....................................................... 46
4.9. Construct Measurements ..................................................................... 47
4.9.1. Construct: Attitude ........................................................................ 49
4.9.2. Construct: Subjective Norm .......................................................... 51
4.9.3. Construct: Perceived Behavioural Control .................................... 52
4.9.4. Construct: Intention ...................................................................... 54
4.10. Data Analysis Process ......................................................................... 55
4.11. Limitations ............................................................................................ 59
5. RESULTS ................................................................................................... 60
5.1. Introduction .......................................................................................... 60
5.2. Descriptive Statistics ............................................................................ 60
5.3. Initial Screening ................................................................................... 63
© 2014 University of Pretoria. All rights reserved. The copyright in this work vests in the University of Pretoria.
7
5.3.1. Outlier Analysis - Individual Measurement Items ........................... 63
5.3.2. Dimensionality - Individual Measurement Items ............................ 66
5.3.3. Correlation Analysis - Individual Measurement Items .................... 69
5.3.4. Scale Reliability - Individual Measurement Items .......................... 72
5.3.5. Regression Assumptions - Aggregate Construct Scale ................. 73
5.3.6. Correlation Analysis - Aggregate Construct Scales ....................... 74
5.4. Results for Hypothesis 1 ...................................................................... 76
5.5. Results for Hypothesis 2 ...................................................................... 78
6. DISCUSSION ............................................................................................. 80
6.1. Introduction .......................................................................................... 80
6.2. Discussion of Hypothesis 1 .................................................................. 80
6.3. Discussion of Hypothesis 2 .................................................................. 84
6.4. Conclusion ........................................................................................... 88
7. CONCLUSION ............................................................................................ 90
7.1. Introduction .......................................................................................... 90
7.2. Background and Objectives ................................................................. 90
7.3. Summary of Key Findings .................................................................... 91
7.4. Implications of Research Findings ....................................................... 93
7.5. Research Limitations............................................................................ 94
7.6. Suggestions for Future Research ........................................................ 95
7.7. Conclusion ........................................................................................... 96
8. References ................................................................................................. 97
9. APPENDICES .......................................................................................... 107
Appendix A: Regression Assumptions – Normality ...................................... 107
Appendix B: Survey Questionnaire ............................................................... 109
Appendix C: SPSS Syntax ............................................................................ 112
© 2014 University of Pretoria. All rights reserved. The copyright in this work vests in the University of Pretoria.
8
VI. LIST OF TABLES
Table 5-1 Descriptive Statistics: Gender, Racial Group, and Employment Sector 61
Table 5-2 Descriptive Statistics: Industry .............................................................. 62
Table 5-3 Descriptive Statistics: Age, Years of Experience, Number of Direct
Reports ................................................................................................................. 63
Table 5-4 KMO and Bartlett's Test ........................................................................ 67
Table 5-5 Rotated Component Matrixa .................................................................. 69
Table 5-6 Pearson's Correlation: Individual Measurement Items .......................... 71
Table 5-7 Scale Reliability: Individual Measurement Items ................................... 73
Table 5-8 Pearson's Correlation: Aggregate Construct Scales ............................. 75
Table 5-9 Multicollinearity: Regressing independent variables on each other ....... 75
Table 5-10 Regression: Model Summary .............................................................. 77
Table 5-11 Regression: ANOVAa .......................................................................... 77
Table 5-12 Regression: Coeffientsa ...................................................................... 77
Table 5-13 Hierarchical Regression: TPB and Demographic Variables ................ 78
© 2014 University of Pretoria. All rights reserved. The copyright in this work vests in the University of Pretoria.

9
Table 5-14 Hierarchical Regression: ANOVAa ...................................................... 78
Table 5-15 Hierarchical Regression: Coeffientsa ................................................... 79
© 2014 University of Pretoria. All rights reserved. The copyright in this work vests in the University of Pretoria.
10
VII. LIST OF FIGURES
Figure 2-1 Theory of Planned Behaviour as proposed by Ajzen (1991) ................ 27
Figure 5-1 Boxplot Outlier Analysis: Perceived behavioural control ...................... 63
Figure 5-2 Boxplot Outlier Analysis: Subjective norm ........................................... 64
Figure 5-3 Boxplot Outlier Analysis: Attitude ......................................................... 65
Figure 5-4 Boxplot Outlier Analysis: Intention ....................................................... 66
Figure 5-5 Scree Plot: Principle Components Analysis ......................................... 67
Figure 5-6 Scatterplot: Regression Assumptions - Linearity ................................. 74
© 2014 University of Pretoria. All rights reserved. The copyright in this work vests in the University of Pretoria.

11
VIII. LIST OF ABBREVIATIONS
SA South Africa
NDP National Development Plan
GDP Gross Domestic Product
GEM The Global Entrepreneur Monitors
TPB Theory of Planned Behaviour
HEI Higher Educational Institutions
SEE Shapero‟s Entrepreneurial Event
MBA Master of Business Administration
VIF Variance Inflation Factor
© 2014 University of Pretoria. All rights reserved. The copyright in this work vests in the University of Pretoria.

12
‘If you are going to go through hell, keep going.’
~ Winston Churchill
© 2014 University of Pretoria. All rights reserved. The copyright in this work vests in the University of Pretoria.

13
1. RESEARCH PROBLEM AND PURPOSE
1.1. Introduction
Despite the dawn of democracy for South Africa (SA) in 1994, the country remains
an economy with one of the highest inequality rates within the world (WorldBank,
2013). These authors claim that with unresolved complex economic challenges,
the country appears locked into a low level equilibrium of low growth, poverty and
social exclusion, alongside high unemployment. Real domestic output according
the SARB (2013), contracted in the final quarter of 2012 settling at 2.5% (down
from 3.5% in 2011); unemployment levels remain unchanged at 25.2% (StatsSA.,
2013) with no immediate signs of recovery.
According to the World Bank (2013), the National Development Plan (NDP) calls
for a broad, multidimensional action framework for changing the current
development trajectory within SA. The three main strategic goals of the NDP 2030
vision, is to double the Gross Domestic Product (GDP), eliminate poverty and
reduce inequality, thus in turn decreasing the country‟s income Gini-Coefficient
from 0.70 to 0.60. In light of a decline in private sector employment and an
unsustainably bloated public sector acting as a counter balance, the NDP‟s
strategic goals are arguably desolate.
SA seems to be locked into a paradigm of unsustainable job creation. With the
public sector being the sole positive contributor to employment growth since 1994,
there seems to be little hope for altering the inequality situation among the
© 2014 University of Pretoria. All rights reserved. The copyright in this work vests in the University of Pretoria.

14
country‟s citizens. Whilst the private sector remains focussed on process
efficiencies and costs minimisation, it becomes glaringly obvious that the creation
of alternative sources of employment is of paramount importance to remedy the
existing challenge. A question to be examined is whether entrepreneurship is one
such alternative; and should this be true, then policy makers, including public and
private enterprise should be actively campaigning in its favour.
The economic benefit derived through entrepreneurship results in social upliftment
which is likely to benefit industry as a whole for obvious reasons. Upliftment brings
about inclusion, the opportunity for individuals to partake in economic activity which
in turn benefits industry. Enterprises then have the ability to penetrate a larger
customer base which brings about economies of scale, improving profitability or
enabling companies to reduce price which allows for greater subsequent inclusion.
With this in mind, it may suffice to say that there is a need for disruptive change
that signals the role of entrepreneurship and the importance of political and social
support. Importantly, stakeholders are not simply isolated to policy makers, but
rather to all citizens of an economy.
1.2. Entrepreneurial Activity for Economic Development
Entrepreneurship as discussed in the previous section was noted as a possible
solution to SA‟s unemployment challenges. At this point it would be useful to
explore the term in more detail to understand what entrepreneurship practically
entails.
© 2014 University of Pretoria. All rights reserved. The copyright in this work vests in the University of Pretoria.

15
Kao (1989) defines an entrepreneur as a person who is able to define a vision of
what is possible, attract people to rally around that vision and then transform that
vision into a reality. Two decades on, Nieman and Nieuwenhuizen (2009) claim
that an entrepreneur identifies and exploits opportunities in order to make a profit.
What becomes apparent is that entrepreneurship could be seen as a series of
activities that are carried out by an individual called an entrepreneur in order to
achieve certain objectives. There may be multiple objectives, but there is
seemingly always an underlying profit motive in order to sustain their activities.
Gartner (1988) shared similar views, suggesting that the focus should be on
entrepreneurship as a process and not so much about the unique characteristics
bestowed upon an individual who executes the process. Further, that the activity of
creating new organisations represents a process; and the entrepreneur as the
agent executing the process. If there is economic benefit to be derived from
entrepreneurial activity, then this could be seen as the critical ingredient to
encourage innovation, generate employment and build social and economic wealth
within an economy (Wong, Ho, & Autio, 2005).
On the other hand, Koster and Rai (2008) present a counter argument cautioning
that entrepreneurship has not proven to be positively related to economic growth
within the context of developing economies. They point out that previous research
has largely focussed on developed economies, which leaves a great deal of
uncertainty as to its applicability to developing nations. Sautet (2013) shares
similar views but clarifies that entrepreneurship will only contribute positively to
© 2014 University of Pretoria. All rights reserved. The copyright in this work vests in the University of Pretoria.

16
economic development when the activity spans beyond the confines of a local
context. He refers to local and systemic entrepreneurship, the former of which
lacks the economies of scale and scope of opportunity necessary for growth and
subsequent development. This provides a possible explanation as to why
entrepreneurial activity in developing nations, albeit productive, does not seem to
have the desired economic affect that most belief it should.
If entrepreneurial activity, in particular the scale and scope of activity is important
for growth, then it stands to reason that stakeholders should be encouraging
individuals to engage in venture creation that extends beyond the realm of a local
context. Sautet (2013) confirms a multiplicity of factors potentially stifling an
entrepreneurial transition, most being institutional in nature such as government
regulations, ill-defined and enforced property rights and regime uncertainty. This
apparent entrepreneurial quagmire may serve as a barrier to entry for individuals
with limited experience, knowledge or know-how. Of those already engaged in
local activity, it may be viewed as the safer option to avoid the risk exposure
inherent within the transition to systemic entrepreneurship.
1.3. Significance of Entrepreneurial Intentions within South Africa
According to Davies (2001) the larger vision of economic growth and job creation
within SA is directly linked to the level of entrepreneurial drive that fuels new
business start-ups and business expansion. Linking this to the age old question of
“what makes people start new business”, one can directly link entrepreneurial drive
© 2014 University of Pretoria. All rights reserved. The copyright in this work vests in the University of Pretoria.
17
as a precursor to firm creation. In some instances, venture creation could result by
accident, but Krueger, Reilly, and Carsrud (2000) report that entrepreneurial
activity is largely an intentionally planned behaviour. Should this be true, it seems
reasonable to suggest that entrepreneurial intention is closely related to
entrepreneurial drive and therefore in the absence of intentionality, entrepreneurial
drive would be weak.
SA‟s rate of entrepreneurial intentions for 2012 was 14%, down from 18% in 2011
and 17% in 2010 (Turton & Herrington, 2012). These authors report that the 2012
figure is significantly below the average of 27% for efficiency driven economies and
a cause for concern because of its close association with entrepreneurial activity.
Intentions are said to capture the emotional factors that influence behaviour,
representing the willingness and the degree of effort an individual is planning to
exert in order to perform the said behaviour (Ajzen, 1991). If venture creation is of
paramount importance for economic development; then stakeholders should be
concerned with the factors that are likely to influence an individual‟s intentionality.
If intentions can be developed, then one could design policies that are focussed on
supporting the antecedents responsible for influencing intentionality.
The Global Entrepreneurship Monitor Report (GEM) for 2012 refers to the Theory
of Planned Behaviour (TPB) as the model most frequently used to analyse
intentions. The model is a theoretical framework said to explain the influence of
explicit exogenous factors on an individual‟s intention and their indirect relationship
with a behaviour through intention (Krueger et al., 2000). At an elementary level,
© 2014 University of Pretoria. All rights reserved. The copyright in this work vests in the University of Pretoria.
18
an individual‟s entrepreneurial intention is influenced by the perceived desirability
and feasibility of the entrepreneurial behaviour; if entrepreneurship is viewed as
attractive and credible then one is more likely to have a positive attitude toward the
behaviour. Similarly if there is a high degree of perceived control over the
behaviour, one is likely to have a positive association with the behaviour in
question (Ajzen, 1991).
According to Turton and Herrington (2012), SA fares above average for attitude
toward entrepreneurship relative to other efficiency driven economies. However
they explain that a large deterrent to a favourable attitude is the extreme fear of
business failure and the subsequent humiliation among one‟s peers. On the other
hand their findings report that behavioural feasibility within SA hinges off education
and the subsequent belief of one‟s self-efficacy. Mitchell (2006) supports this
finding and proposes that higher educational institutions (HEI‟s) can play a role in
creating and increasing an entrepreneurial disposition among South African
citizens. HEI‟s can instil a clear understanding of the risks and rewards,
opportunity seeking and recognition skills, including the creation and destruction of
enterprises. Should this be true, then the TPB could be used as a framework for
all stakeholders to promote an entrepreneurial agenda.
1.4. Conclusion
In closing, SA faces a harsh reality of high levels of poverty, social exclusion and
unemployment. These structural headwinds are likely to stifle economic growth
© 2014 University of Pretoria. All rights reserved. The copyright in this work vests in the University of Pretoria.
19
into the foreseeable future emphasising the need for a formal intervention. The act
of entrepreneurship has proven to aid with economic growth and as such it stands
to reason that entrepreneurial support should be of paramount importance for all
citizens. Davies (2001) highlights the severity of SA‟s employment problem,
claiming that the country‟s ability to absorb new recruits into the formal sectors has
fallen significantly within the past three decades. If the trend is to be reversed,
then individuals need to be encouraged to become job-creators instead of job-
seekers (Mitchell, 2006). If SA is to become an entrepreneurially driven economy
(Louw et al., 2003), then it stands to reason that stakeholders should be concerned
with those factors that are likely to lead to entrepreneurial activity.
© 2014 University of Pretoria. All rights reserved. The copyright in this work vests in the University of Pretoria.
20
2. LITERATURE REVIEW
2.1. Introduction
The following chapter serves to review and evaluate the literature informing this
study. The chapter is organised into two parts, commencing with a synopsis of
prior entrepreneurial research and will be titled The Focus of Prior Entrepreneurial
Research. It then continues to the Theory of Planned Behaviour where the
theoretical constructs are introduced and then followed by a section dedicated to
prior empirical research. The prior empirical research is centred on studies with a
predominant focus on the TPB; however it includes studies that used various
integrated models and components to illustrate how research had evolved to
eventually settle on the TPB as the best predictor of entrepreneurial intentions. All
research findings and recommendations for future studies were detailed within
each of their relevant sections.
2.2. The Focus of Prior Entrepreneurial Research
Over recent years, entrepreneurial studies have centred on the intentional,
expectancy-driven and situational nature of the entrepreneurial decision rather than
the traditional deterministic view of trait and demographic research (Autio, Keeley,
Klofsten, Parker, & Hay, 2001). Trait studies according to Gartner (1988) were
approaching a saturation point in the late 1980‟s and were likely to have
diminishing returns as far as predictive ability was concerned. Krueger et al.
(2000) some twelve years later confirmed this prediction, noting that the trait
© 2014 University of Pretoria. All rights reserved. The copyright in this work vests in the University of Pretoria.
21
research had failed to provide any additional insight to what was already known
about the entrepreneurial decision. These authors concluded that studies
concerning situational and personal factors alone had resulted in disappointingly
poor explanatory power and had spurred researchers to investigate alternative
approaches.
Although it was generally accepted that trait research had contributed to the body
of knowledge, Autio et al. (2001) went a step further and questioned the statistical
validity of prior findings. These authors claimed that the method of examination
was potentially flawed; suggesting that by examining individuals after the
entrepreneurial event, it assumed that the learning‟s within the entrepreneurial
process had no influence on the individual‟s traits, attitudes and beliefs. Additional
to the methodological concern, the trait and demographic approach assumed a
fairy strong deterministic outcome. According to Autio et al. (2001), it suggests that
if a person possesses a specific trait, then by design they will behave in a particular
way; they continue to explain that it fails to appreciate the dynamics of personal
expectations, situational factors and social valuations that influence an individual‟s
decision making.
This could explain why Davidsson (1995) focussed on integrated models that
included an array of variables ranging from situational, demographic, personal
background, and domain specific attitudes. What becomes evident is that
entrepreneurial research within the 1990‟s was trending toward psychological
literature which would eventually settle on intentions as being the best predictor of
© 2014 University of Pretoria. All rights reserved. The copyright in this work vests in the University of Pretoria.
22
planned behaviour (Autio et al., 2001). Interestingly, entrepreneurial intention
theories had made their debut a decade earlier (Ajzen, 1991; Shapero & Sokol,
1982) but were only gaining popularity a number of years later, despite it originally
being reported that entrepreneurial activity was exactly the type of planned
behaviour for which intentions models were ideally suited (Bird, 1988; Katz &
Gartner, 1988).
The intentions model in question are said to reveal why exogenous factors that are
situational or individual in nature (e.g. traits and demographics) result in poor
explanatory power when analysed in isolation (Krueger et al., 2000). Ajzen (1991)
explains that exogenous variables only influence intentions and behaviour
indirectly through their influence on an individual‟s attitude toward the behaviour.
In this particular case, the behaviour is entrepreneurship. Simplistically,
exogenous variables influence attitude; a person‟s attitude in turn is related to
intentions and intentions thereafter predict the behaviour in question (Krueger et
al., 2000). Attitude effectively acts as a mediator between exogenous factors and
the intention to engage in the behaviour. This indirect relationship could therefore
explain why prior research has yielded insignificant results.
Van Gelderen et al. (2008) discuss two models that have dominated literature over
recent years. Firstly, Ajzen‟s (1991) TPB explains behavioural intentions and its
antecedent factors namely attitudes, subjective norm and perceived behavioural
control; and secondly, Shapero and Sokol‟s (1982) Shapero Entrepreneurial Event
(SEE) model which is largely identical to the TPB with exception that subjective
© 2014 University of Pretoria. All rights reserved. The copyright in this work vests in the University of Pretoria.
23
norm is replaced with a variable called propensity to act. Krueger et al. (2000)
compares these two models in terms of their ability to predict entrepreneurial
intentions and concludes that both receive empirical support as valid predictors.
Their findings support earlier research (Krueger & Brazeal, 1994) that reports a
considerable degree of overlap between the TPB and SEE models.
Despite having presented two intentions models in the preceding paragraph, the
researcher has chosen to refine the focus of this study to one model, namely the
TPB. This decision follows from van Gelderen et al. (2008) who claimed that the
theoretical specification of the TPB is more detailed and consistent than the SEE
and therefore likely to aid with successful construct operationalization. Following
on and in part leading to the purpose of this study, Ajzen (1991) states that the
TPB is said to be sufficient [emphasis added] in that it sufficiently captures the
influence of the external factors through its predictor variables, perceived
behavioural control, subjective norm and attitude. The author explain that if any
given external factor significantly predicts intention along with the model‟s predictor
variables, then it would indicate that the TPB is not a sufficient theory as it would
have failed to include variables that are the most accurate predictors of intention.
In conclusion, the TPB offers the possibility of using a testable, theory driven
method to validate claims of external exogenous influences (Krueger & Carsrud,
1993), thereby supporting the decision to discard the SEE from here on forward.
© 2014 University of Pretoria. All rights reserved. The copyright in this work vests in the University of Pretoria.
24
2.3. The Theory of Planned Behaviour
2.3.1. Background
Intentions according to Ajzen (1991), are “indications of how hard people are
willing to try, of how much an effort they are planning to exert, in order to perform a
behaviour” (p. 181). It follows then that as an individual‟s intention to perform a
behaviour strengthens, so the likelihood of acting upon the decision is increased.
Similarly, Bird (1988) describes intentionality as a state of mind that directs a
person‟s attention toward a specific object or a path in order to achieve an intended
objective. This description conveniently resonates with the procedural nature of
entrepreneurship as earlier defined by (Gartner, 1988).
Following on, Ajzen‟s (1991) asserts that behavioural intention can only find
expression if the behaviour can be expressed under volitional control i.e. if the
person can decide at will to perform the behaviour or not. This implies that in order
for intentions to influence behaviour, there needs to be a degree of perceived
control over the behaviour. Autio et al.‟s (2001) research confirms that intention is
significantly influenced by perceived behavioural control, which is the aggregate of
the individual‟s actual control and perceptions of control over the behaviour.
Further, this author explains that although attitudes toward the behaviour and
subjective norm influence intention, they play a supportive role within the theory
because perceived behavioural control is seen as decisive for action.
© 2014 University of Pretoria. All rights reserved. The copyright in this work vests in the University of Pretoria.

25
Krueger et al. (2000) creates a link between the intentional model and
entrepreneurship, claiming that the act of starting a business is a planned and
intentional process. Their rationale was based on the large emphasis placed on
the business plan in every aspect of the academic and practical treatment of
starting a new business. Further, they claim that the entrepreneurial action is a
way of thinking that emphasises opportunities over threats and therefore that the
opportunity identification process is a planned and intentional process. These
findings were similar to earlier studies (Krueger & Carsrud, 1993) where it was
argued that entrepreneurial behaviour such as self-employment or starting a
business is intentional and best predicted by intentions toward the behaviour and
not by attitudes, beliefs, personality or demographics.
2.3.2. Theoretical Constructs
Intentionality according to Ajzen (1991) is the central construct within the TPB.
The framework details three antecedents of intentions namely attitude toward the
behaviour, subjective norm and perceived behavioural control. To recap on a
previous section, behaviour in the context of the present study can be seen as the
act of entrepreneurship. Importantly, all three of the aforementioned antecedents
are underpinned by salient information or beliefs relevant to the behaviour in
question (Ajzen, 1991).
Attitude toward the behaviour is detailed as the first antecedent of intention and
reflects the degree to which a person has a favourable assessment of the
© 2014 University of Pretoria. All rights reserved. The copyright in this work vests in the University of Pretoria.
26
behaviour in question. Behavioural beliefs are said to influence these attitudes and
are formed by associating attributes of a given behaviour to other objects or events
which are already valued positively or negatively. This therefore implies that
individuals immediately favour behaviours which they believe will have favourable
outcomes over those which do not. To illustrate by means of an example,
individuals who have witnessed a business failure and have experienced the
subsequent consequences that follow, may likely associate entrepreneurship with
negative connotations (and visa-versa).
Subjective norm is the second antecedent of intention and represents the
perceived social pressure to perform the behaviour or not. Normative beliefs are
then said to constitute the underlying determinants of subjective norms which
according to Ajzen (1991) are concerned with the likelihood that important referent
individuals or groups approve or disapprove of performing a given behaviour.
Individuals thus establish a belief as to whether these role models will regard the
outcome of the behaviour as socially acceptable or not, which ultimately influences
their intention to execute on the behaviour in question.
The third and final antecedent of intention according to the TPB is the perceived
behavioural control over the behaviour. Perceived behavioural control is
established through control beliefs that provide the basis for an individual‟s
perceptions which ultimately represents a perception of the ease or difficulty of
performing the behaviour in question (Ajzen, 1991). The author further explains
that these control beliefs may be based on past experiences (be it direct or indirect
© 2014 University of Pretoria. All rights reserved. The copyright in this work vests in the University of Pretoria.
27
through acquaintances or friends) or by the perceived difficulty of performing the
given behaviour as a consequence of resources availability or opportunity
recognition. Once again to illustrate by means of an example; individuals who
have completed a business qualification may thereafter believe that they have
developed the necessary competencies required to engage in new venture
creation. Confidence in their ability is thus the driving force in establishing
entrepreneurial intentions.
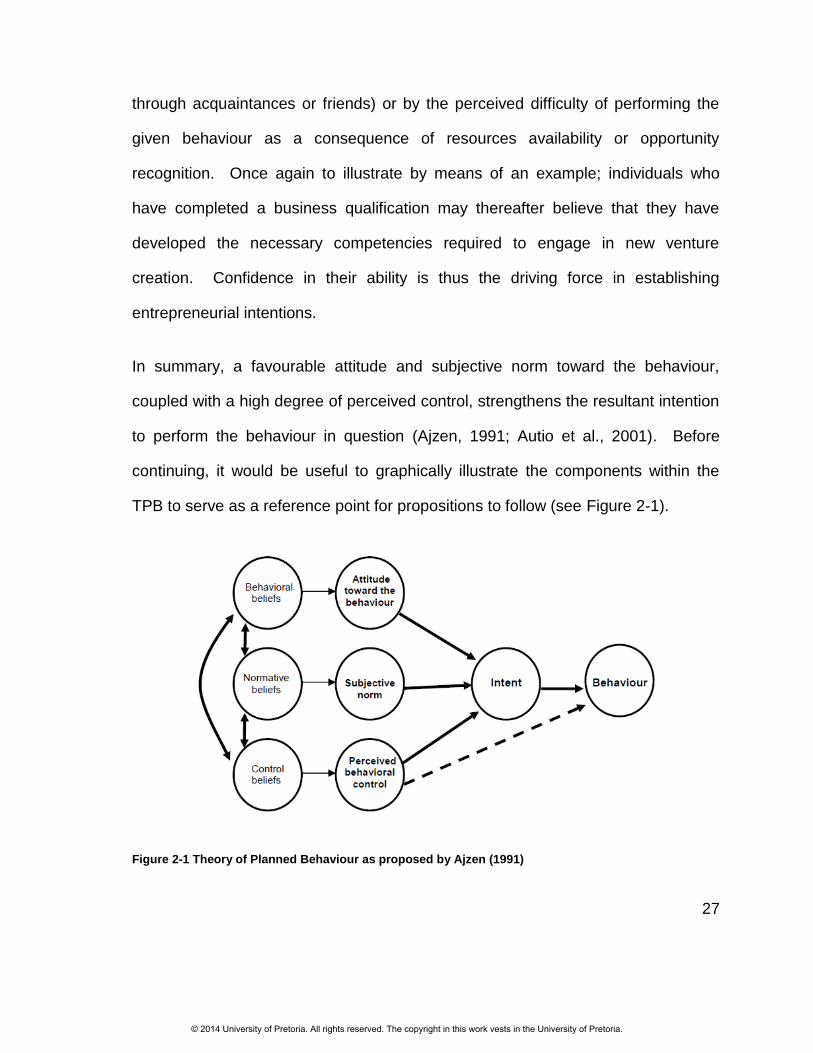
In summary, a favourable attitude and subjective norm toward the behaviour,
coupled with a high degree of perceived control, strengthens the resultant intention
to perform the behaviour in question (Ajzen, 1991; Autio et al., 2001). Before
continuing, it would be useful to graphically illustrate the components within the
TPB to serve as a reference point for propositions to follow (see Figure 2-1).
Figure 2-1 Theory of Planned Behaviour as proposed by Ajzen (1991)
© 2014 University of Pretoria. All rights reserved. The copyright in this work vests in the University of Pretoria.
28
2.3.3. Empirical Research
Davidsson (1995) authored one of the earlier studies to depart from the pure trait
and demographic lines of research. Although the study was not based solely on
the TPB, it does illustrate the shift to the psychological approach, which is en route
to the TPB. These authors proposed an economic-psychological model of factors
said to influence an individuals‟ intentions toward new venture creation. This
model integrated various components from other research including the TPB and
was modified for the study of entrepreneurial intentions. The central construct was
defined as Entrepreneurial conviction which according to Autio et al. (2001)
corresponds closely to perceived behavioural control within the TPB. Davidsson
(1995) found that entrepreneurial conviction presented the strongest direct
relationship with entrepreneurial intentions. In addition, general and domain
specific attitudes (e.g. attitude toward the behaviour itself) were found to mediate
the effect of personal background factors (e.g. age, education, vicarious
experience, radical change experience and gender) on an individual‟s
entrepreneurial conviction. Gender and vicarious experience on the other hand
were exceptions, proving to have a weak but direct relationship with convictions.
To summarise Davidsson‟s (1995) method and concluding discussion; the model
was tested on a large sample from the general Swedish population between the
age of 35 and 40 years. The objective was to select respondents who would be in
a life stage where founding of a firm would be relatively common. Email
questionnaires were distributed to 1800 individuals of which a total of 1313
© 2014 University of Pretoria. All rights reserved. The copyright in this work vests in the University of Pretoria.
29
ultimately responded. The results illustrated that demographic factors (as
represented within in the personal background factors), general attitudes, and
domain specific attitudes explained approximately 35% of the variation in
entrepreneurial conviction as measured by the coefficient of determination R2.
Furthermore, R2 for the entire model on entrepreneurial intention explained 50% of
the variation in entrepreneurial intention. An important lesson from the study was
that social reality is complex and that empirical results from single studies give little
basis for firm conclusion. The author therefore called for large studies and
replications thereof as well as more theoretical integration and interpretation.
Kolvereid (1996) later used the TPB to predict an individual‟s intention to enter an
occupation as either formally employed or self-employed. In addition to the
constructs derived from the TPB, their study included other variables such as
family background, gender and self-employment experience. Their findings
demonstrated that the TPB was the strongest predictor of employment status
intention and that demographic variables would influence employment status
intentions indirectly through attitudes, subjective norm and perceived behavioural
control. Their sampling data was collected from 143 first year undergraduate
students from a Norwegian business school who were between 18 and 47 years of
age. These authors call for future research to include measures of role models,
attitudes, norms and perceived behavioural control. Their suggestion includes the
extent to which education in entrepreneurship influences the determinants of
intentions.
© 2014 University of Pretoria. All rights reserved. The copyright in this work vests in the University of Pretoria.
30
Two years later, Tkachev and Kolvereid (1999) repeated the study in a Russian
context using the TPB to predict an individual‟s intention to enter an occupation as
either formally employed or self-employed. The study included an additional
measure referred to as tracking models that essentially determined the influence of
important role models within the participant‟s life. Their finding once again
demonstrated that the TPB was the strongest predictor of employment status
intention, explaining 45% of the variation in intention. In addition, the effect of role
models and demographic characters proved to have no influence on employment
status intention. Their study comprised of a sample of 512 undergraduate Russian
students (between their third and sixth year of study) and included three different
universities in St. Petersburg. Although demographics characters were proved to
be insignificant within this context, the authors recommend future studies should
include when studying entrepreneurial behaviour. Further, they highlight an
important point in that research in the context of emerging economies [emphasis
added] is an opportunity to test theories that were developed in advanced western
economies.
Following on, Krueger et al. (2000) compared Ajzen‟s (1991) TPB to Shapero and
Sokol (1982) SEE model. Within this research, Ajzen (1991) is quoted as saying
that intentions depend on the perceptions of personal attractiveness (e.g. attitude
toward the behaviour), feasibility (e.g. perceived behavioural control) and social
norms (subjective norms). Similarly and in comparison, Shapero and Sokol (1982)
claim that entrepreneurial intentions depend on the perceptions of personal
desirability, feasibility and the propensity to act. The research results suggest that
© 2014 University of Pretoria. All rights reserved. The copyright in this work vests in the University of Pretoria.

31
both models are statistically relevant in predicting entrepreneurial intentions and
follows with claims that intentions are said to be the single best predictor of
planned behaviour. Their sample comprised of 97 senior university business
students with a broad range of experiences and who were currently facing
important career decisions.
Krueger et al.‟s (2000) adjusted R2 for the TPB global regression model (comprised
of desirability, social norms and feasibility on intentions) was recorded as 0.35.
This can be interpreted as explaining 35% of the variation in intention. Although a
significant result, it is important to note that the social norm component (albeit
strongly correlated with intentions in isolation), is statistically insignificant when
combined with desirability and feasibility. In contrast, the adjusted R2 for the SEE
global regression model (which included desirability, propensity to act and
feasibility on intentions) was recorded as 0.408 and all components were reported
as statistically significant. The conclusion thereafter was that the SEE model offers
marginally higher predictive power over the TPB. These authors call for future
studies to test these models on samples of subjects who differ in age, experience
and ethnicity [emphasis added]; and are who are facing important career decisions.
Shortly thereafter, Autio et al. (2001) developed an application of the TPB in an
attempt to analyse the factors that influence entrepreneurial intent among
university students in Scandinavia and the United States of America (USA). Their
total sample comprised of 3445 undergraduate student from universities in Finland,
Sweden and the USA. This approach according to Autio et al. (2001) was the only
© 2014 University of Pretoria. All rights reserved. The copyright in this work vests in the University of Pretoria.
32
study that tested the robustness of the TPB using an international comparative
sample. Descriptive statistics yielded notable differences in the mean age for the
USA participants and their European counterparts. In addition, their work situation
differed significantly in that 82% of the USA participants were working either full
time or part time, this compared to 56% for Finland and 20% for Sweden. Lastly,
career preferences were similar across all three countries and demonstrated that
public sector and academic careers were the least preferred profession of choice.
Autio et al.‟s (2001) global regression model explained 21.4% of the variation in
intention for the Swedish group and 35.3% for the USA group. The findings
conclude that perceived behavioural control had the strongest influence on
intentions followed by attitude toward the behaviour and lastly a weak relationship
for subjective norm on entrepreneurial intention. Although these findings were
seemingly conclusive, the authors admit that the use of a single-item measurement
scale to record attitude toward the behaviour was an area of weakness within their
research. This then spurred the authors to repeat the study on 97 MBA students
from the London Business School using improved (more comprehensive)
measurement scales for both attitude and subjective norm. The findings were
similar to their original study suggesting that perceived behavioural control had the
most influence on intentions followed by attitude toward the behaviour.
Importantly, subjective norm did not feature as statistically significant in its ability to
influence entrepreneurial intention. The authors call for future research to validate
the extent to which entrepreneurial intent has been followed through with
entrepreneurial activity.
© 2014 University of Pretoria. All rights reserved. The copyright in this work vests in the University of Pretoria.
33
Lüthje and Franke (2003) later presented a modified structural model of the TPB
that integrated latent constructs categorised as personal traits and contextual
factors. Personal traits were comprised of risk taking propensity and an internal
locus of control whilst contextual factors comprised of perceived barriers and
perceived support for new venture creation. The structural design firstly proposed
that the influence of personality factors were moderated through ones attitude
toward entrepreneurship and secondly that contextual factors had a direct
influence on an individual‟s entrepreneurial intention. Their sample comprised of
512 students at the MIT School of Engineering, the majority whom were not
involved in any form of entrepreneurial activity at the time of this research.
Their findings demonstrate that attitude toward entrepreneurship had the strongest
relationship with entrepreneurial intentions and was influenced by both personality
constructs namely internal locus of control and risk taking propensity. This finding
supports the TPB which suggests that attitudes are influenced by exogenous
factors which ultimately determines the desirability of the behaviour in question.
On the other hand, the contextual factors proved to have a direct relationship with
entrepreneurial intentions; this once again aligning closely to the TPB which
suggests that the perceived behavioural control directly influences an individual‟s
perception of feasibility. Lüthje and Franke (2003) hypothesise that future research
in the area of attitude formation holds promise for an improved understanding of
entrepreneurial intention and the effective cultivation of a business founding spirit
among students.
© 2014 University of Pretoria. All rights reserved. The copyright in this work vests in the University of Pretoria.
34
Shortly thereafter, Kristiansen and Indarti (2004) attempted to identify determinants
of entrepreneurial intention among young people with a primary objective to
compare the impact of different economic and cultural contexts. Their proposed
model considered demographic and individual background factors (measured as
gender, age, educational background and work experience), personality and
attitudes (measured as need for achievement, locus of control and self-efficacy),
and contextual elements (measured as capital access, information access and
social networks), all of which were presumed to have an influence on
entrepreneurial intention. Their total sample comprised of 251 university students
that were drawn from the student population of two universities, one based in
Norway and the other in Indonesia. The researchers report that they employed a
judgement sampling method in an attempt to secure a minimum number of
economics and business administration students within their sample.
Their findings demonstrate that demographic and individual background variables
which were age, gender and previous employment experience have no significant
influence on entrepreneurial intentions. However, when added to the regression
model it increased the percentage of explained variance from 22.5% to 25.1% and
25.9% to 30% for the Norwegian and Indonesian sample respectively. Secondly,
personality factors such as the need for achievement and locus of control, only
affect entrepreneurial intentions if they affect self-efficacy. Finally self-efficacy and
a combination of contextual factors such as access to capital, information and
social networks (defined as instrumental readiness) all influence entrepreneurial
intentions in the expected direction. These findings once again align closely to the
© 2014 University of Pretoria. All rights reserved. The copyright in this work vests in the University of Pretoria.
35
perceived desirability and feasibility components of the TPB and therefore could be
viewed as supporting the well-established body of knowledge.
Following on, Van Gelderen et al. (2008) presented a detailed empirical
investigation of entrepreneurial intentions using the TPB as their testable, theory-
driven method. The attitude construct was comprised of Importance of autonomy,
Importance of wealth, Challenge, Financial security and Work load avoidance.
Perceived behavioural control was comprised of perseverance, creativity,
entrepreneurial alertness and self-efficacy; and lastly subjective norm comprised of
a single-item measure simply referred to as subjective norm. Their total sample
contained 1225 undergraduate students from four universities across the
Netherlands who were all within their second, third or fourth year of a business
administration curriculum.
Van Gelderen et al.‟s (2008) findings demonstrate that entrepreneurial alertness
which falls under perceived behavioural control and financial security under
attitudes towards the behaviour present the strongest influence on an individual‟s
entrepreneurial intentions. Subjective norm on the other hand shows the most
instability in their contribution which is a similar finding to Krueger‟s (2000)
comparison between the TPB and SEE model. The adjusted R2 for the model
within this study was 0.38, explaining 38% of the variation in individual‟s
entrepreneurial intention. These authors suggest future research to focus on
entrepreneurship from a career development perspective, for example employment
status choice. They claim that self-employment is fitting in the context of
© 2014 University of Pretoria. All rights reserved. The copyright in this work vests in the University of Pretoria.
36
boundaryless, fluctuating, or post-corporate careers, which require self-reliance of
individuals and which offer few career opportunities in large corporates.
Finally, Gird and Bagraim (2008) used the TPB as a predictor of entrepreneurial
intention among final year commerce students at two universities in SA. Their
intention was to test the sufficiency of the theoretical framework by including four
additional factors that are potentially related to entrepreneurial intention; these
factors being personality traits, situational factors, prior exposure to
entrepreneurship, and demographics. Their total sample comprised of 247
undergraduate students from two universities in the Western Cape province of SA
of which 168 were from a historically white university and 79 from a historically
black, disadvantaged university.
Gird and Bagraim‟s (2008) findings demonstrate that the TPB explains 27% of the
variation in student‟s entrepreneurial intentions. Prior exposure was the only
additional variable that significantly added to the predictive power of the TPB,
leaving personality traits, demographic factors, and situational factors all as
insignificant contributors to explaining entrepreneurial intention. According to Gird
and Bagraim (2008), this study was the only one of its kind in SA where the
application of the TPB and its sufficiency in explaining entrepreneurial intention has
been tested. They highlight implications of their study claiming that educational
initiatives should aim to promote entrepreneurship and provide opportunities to
experience entrepreneurship in a way that fosters positive attitudes as well as a
viable and practical career alternative. In closing, these authors suggest that their
© 2014 University of Pretoria. All rights reserved. The copyright in this work vests in the University of Pretoria.

37
findings should be treated with caution until future studies with more reliable
measures, longitudinal data and comprehensively defined external variables can
confirm their findings.
2.4. Closing Remarks and Formulation of Propositions
The theory contained in the literature discussed within this chapter unearths a
number of interesting observations suitable for further investigation. Davidsson
(1995) emphasised the importance of large replicable studies as well as more
theoretical integration and interpretation. This certainly spurred subsequent
research to incorporate and test the TPB but arguably not to the extent that one
could comfortably claim its applicability across cultural and economically diverse
contexts [emphasis added].
Tkachev and Kolvereid (1999) support this view, highlighting the importance of
research in the context of emerging economies as an opportunity to test theories
that were developed in advanced western economies. To the researcher‟s
knowledge, most studies have centred on samples from advanced economies
(Autio et al., 2001; Davidsson, 1995; Kolvereid, 1996; Kristiansen & Indarti, 2004;
Lüthje & Franke, 2003; Van Gelderen et al., 2008). This then provides an
opportunity to build on the limited literature (Gird & Bagraim, 2008) available for the
emerging market economies.
Following on, Krueger et al. (2000) called for future studies to include test subjects
who differed in age, experience and ethnicity. To the researcher‟s knowledge,
© 2014 University of Pretoria. All rights reserved. The copyright in this work vests in the University of Pretoria.

38
most studies prior and subsequent to these authors have focussed on younger
undergraduate students, with limited work experience and ethnic diversity. Finally,
Gird and Bagraim (2008) expressed concerns for the reliability of construct
measurement scales. They alluded to poor reliability measurements within their
study and emphasised the need for future studies to incorporate more reliable
measures of the theory‟s predictor variables. In light of the aforementioned, the
following two propositions are developed.
2.4.1. Proposition 1
The TPB will remain a statistically significant predictor of entrepreneurial intentions
within the context of an emerging economy.
2.4.2. Proposition 2
The TPB will remain a sufficient predictor of entrepreneurial intentions within the
context of an emerging economy.
© 2014 University of Pretoria. All rights reserved. The copyright in this work vests in the University of Pretoria.
39
3. RESEARCH HYPOTHESES
3.1. Introduction
Following on the review of the relevant literature and formulation of the
propositions, the present chapter serves to define the research questions and
detail the relevant hypotheses for investigation.
3.2. Research Question 1
Proposition 1 as detailed in the previous chapter leads one to question if the TPB is
truly a statistically significant predictor of entrepreneurial intentions within the
context of an emerging economy? The question originates from an observation
that the theoretical framework was developed and largely tested within advanced
economies and as such may not have application in countries less developed.
3.3. Research Question 2
Proposition 2 as detailed in the previous chapter leads one to question if the TPB is
a sufficient predictor of entrepreneurial intentions within the context of an emerging
economy? The question originates from the literature which suggests that if other
factors which are external to the TPB can be found to have a significant residual
effect beyond the predictor variables within the TPB, then it would imply that there
are other important factors that have not been accounted for within the theory that
have may serve to better predict intentions than the theoretical constructs of the
TPB.
© 2014 University of Pretoria. All rights reserved. The copyright in this work vests in the University of Pretoria.
40
3.4. Research Objective
The objectives of the present study are to validate the applicability of the TPB and
to test its sufficiency within a contextual setting which has seemingly received
limited prior focus. The study targets subjects who are arguably older; hold more
experience and who are more ethnically diverse than those in most prior research.
Importantly, this study intends to combine construct measurement scales from two
other studies in an attempt to improve measurement reliability.
3.4.1. Hypothesis 1
The TPB is a significant predictor of the entrepreneurial intention.
Ho: βi = 0; Regression equation is not significant
H1: One or more βi ≠ 0; Regression equation is significant
(i = 1,2,3; representing attitude, subjective norm, perceived behavioural control)
3.4.2. Hypothesis 2
Testing the sufficiency of the TPB, Demographic variables will not add predictive
ability to the TPB when predicting entrepreneurial intent.
Ho: R2TPB >= R2
TPB + DEM; Demographic variables do not add predictive ability to
the TPB
H1: R2TPB < R2
TPB + DEM; Demographic variables add predictive ability to the TPB
© 2014 University of Pretoria. All rights reserved. The copyright in this work vests in the University of Pretoria.
41
4. METHODOLOGY
4.1. Introduction
The previous chapter served to summarise the research purpose and detail the
research questions and hypotheses‟. The following chapter attempts to explain the
research methodology which will include the research design; population and
sampling; survey design and pilot study; data gathering procedure; discussion on
the principle of validity and reliability; construct measurement; data analysis
process; and finishes off with the research limitations.
4.2. Research Design
The study employed a cross-sectional survey design using self-report
questionnaires for the purpose of quantitative data analysis. Saunders and Lewis
(2012) explain that cross-sectional research is the study of a particular topic at a
particular point in time. The design permits the researcher to explain relationships
between variables of interest but importantly does not permit inferences relating to
causality. This approach according to Krueger et al (2000) is an appropriate
method for theoretical model testing and therefore suitable for the purpose of this
study. The quantitative approach to data analysis involves the collection data in
numerical form that allows statistical tests to be undertaken such as descriptive
statistics, correlation and inferential statistical analysis (Jupp, 2006).
The first hypothesis aimed to test the significance of the TPB and would be
accomplished by regressing intentions against attitudes, subjective norms and
© 2014 University of Pretoria. All rights reserved. The copyright in this work vests in the University of Pretoria.
42
perceived behavioural control. According to Cramer and Howitt (2004), a multiple
linear regression is a suitable method designed to analyse the linear relationship
between a dependent variable and two or more independent variables. These
authors explain that there are two general uses to multiple regression; firstly to
determine the strength and direction of the linear association between a dependent
and independent variables; and secondly to determine the amount of variation in
the dependent variable explained by the predictor variables (independent
variables).
Hypothesis two aimed to test the sufficiency of the TPB and would be
accomplished in a phased approach by regressing intentions against the theory‟s
antecedent variables, followed by a second regressive iteration that would include
demographic to the model. According to Vogt (2005), the phased approach is
termed a hierarchical regression in which independent variables are entered into a
regression equation in a sequence specified by the researcher. The authors
explain that the hierarchy of variables is determined by the researcher and are
typically entered into the equation in groups or blocks. In the present study,
demographic variables would comprise of an individual block for input.
4.3. Population
Saunders and Lewis (2012) define a population as „the complete set of group
members‟ (p. 132). The population for the present study consisted of all individuals
within SA who were likely to face important vocational decisions within the
© 2014 University of Pretoria. All rights reserved. The copyright in this work vests in the University of Pretoria.
43
foreseeable future. The sample frame as defined by Saunders and Lewis (2012) is
„the full list of all members of the population‟ (p. 133) which for all intents and
purposes could not be established within this study.
4.4. Sampling
According to Autio et al. (2001), universities are institutions through which students
pass on their way to future career opportunities. Further, as the date of their final
graduation approaches, so too will these students be faced with important career
decisions (Krueger et al., 2000) to enter (or re-enter if already employed) the
workforce as formally employed or self-employed individuals. Thus, in order to
gain access to individuals approaching an eminent career decision juncture, part-
time learners from a university business school were approached. These
individuals were all in full-time employ and represented a broad range of industries
within SA.
The study employed a non-probability purposive sampling technique. Non-
probability sampling according to Saunders and Lewis (2012) is an appropriate
sampling method when access to the complete list of the population is not
possible. Further, a purposive sampling technique is a method where the
researcher‟s judgement is used to select the members based on certain criteria. In
this study the criterion was twofold, starting with individuals who were likely to face
important vocational decisions within the foreseeable future; and secondly,
participants who were not already committed to entrepreneurial careers. Krueger
© 2014 University of Pretoria. All rights reserved. The copyright in this work vests in the University of Pretoria.
44
et al. (2000) emphasises the importance of the second criterion, claiming that by
including individuals who are already committed to entrepreneurial careers,
introduces potential biases that can censor data unpredictably.
4.5. Unit of Analysis
The unit of analysis according to Lewis-Beck, Bryman, and Liao (2004) is the most
basic element of a scientific research project about which the researcher may
generalise. In the present study it was defined as individuals within SA who were
likely to face vocational decisions. A total of 179 survey participants were
captured, all of whom were formally employed within the jurisdiction of SA. Of the
179 survey participants, 134 satisfied the criterion of not being involved in
entrepreneurial activity at the time when the survey was administered. The final
sample size of 134 according to Saunders and Lewis (2012) was sufficiently large
to meet the statistical requirements to commence with a multiple regression
analysis.
4.6. Survey Design and Pilot Study
The survey was designed using an online survey creation tool. This tool made it
particularly easy to design the survey layout, make amendments where required,
capture the survey responses (with limited opportunity for error), and then export
all responses to excel in the desired format.
© 2014 University of Pretoria. All rights reserved. The copyright in this work vests in the University of Pretoria.

45
A pilot test according to Saunders and Lewis (2012) is concerned with trying out a
questionnaire with a small group of individuals who are similar to the participants
one intends to use within the research. The objective is to address any
shortcomings within the survey questionnaire before deploying to all participants.
The preliminary questionnaire for the present study was sent out to five MBA
students for their participation and commentary on the design and wording of
particular items. This provided the opportunity to amend where applicable before
incurring significant printing and distribution costs.
4.7. Data Gathering Procedure
Data collection could only commence after the researcher had received the
necessary approval from the business school‟s ethical clearance committee.
Following the committees approval, the researcher approached the business
school program manager, registrar and certain faculty members to request their
support to approach the schools MBA students. The lecturers permitted the
researcher to approach their class for the first 15 minutes of the scheduled lecture.
A brief synopsis of the research purpose was communicated to the participants in
addition to highlighting the voluntary nature of the survey participation. The
approach could be described as a paper based intercept method under controlled
lecture room conditions which improves the standardisation of data capture,
decreases the non-response errors and increase response rates (Cooper &
Schindler, 1998).
© 2014 University of Pretoria. All rights reserved. The copyright in this work vests in the University of Pretoria.
46
4.8. Principle of Validity and Reliability
Validity and reliability are said to influence the extent to which one can learn
something about the phenomenon in a study, the probability that you will obtain
statistical significance in the data results, and the extent to which one can draw
meaningful conclusions from the data (Leedy & Ormrod, 2010).
According to Saunders and Lewis (2012), validity is the extent to which a data
collection method accurately measures what it intended to measure; and that the
research findings are what they profess to be about. Kimberlin and Winterstein
(2008), suggest that construct validity is a judgement based on the accumulation of
evidence from numerous studies that have used a specific measurement
instrument. These authors claim that there is no statistical test to conclusively
determine if a measure adequately covers a content area, or adequately
represents a construct in question. Validity is thus said to rely on the judgement
and endorsement of experts who provide a gold standard for other researchers to
adopt (Kimberlin & Winterstein, 2008).
Reliability on the other hand according to Leedy and Ormrod (2010) is „the
consistency with which a measuring instrument yields a certain result where the
entity being measured hasn‟t changed‟ (p. 29). According to Trobia (2008),
Cronbach‟s alpha is a statistic that measures the internal consistency among a set
of survey items believed to measure the same construct that could be formed into
© 2014 University of Pretoria. All rights reserved. The copyright in this work vests in the University of Pretoria.
47
one scale. These authors report that alpha coefficients range between zero and
one, with larger values denoting greater scale coherence and reliability.
In closing, Tavakol and Dennick (2011) explain that instrument reliability is closely
related to its validity, to the extent that validity is dependent on reliability. On the
other hand, these authors claim that instrument reliability does not necessarily
assume its validity. It implies that an instrument can be reliable but if it is
consistently measuring the incorrect construct, then it is said to have no validity. It
is therefore apparent that both scale validity and reliability were essential
prerequisites for the purposes of this research. The researcher in turn adopted
instruments that had been previously developed and validated by what could be
regarded as experts (Autio et al., 2001; Krueger et al., 2000) within the field of
entrepreneurship and thereafter recorded a Cronbach‟s alpha coefficient to test for
internal reliability.
4.9. Construct Measurements
The study employed the use of two independent measurement scales to record the
attitude, subjective norm and perceived behavioural control constructs. The
objective was to aggregate the results from both scales to improve the robustness
of the construct measurement, in turn addressing a notable limitation within Gird
and Bagraim‟s (2008) research. The measurement scales were adopted from
Krueger‟s (2000) study, comprised of a single statement measure for each
construct; and Autio et al. (2001), comprised of a multi-statement measure for each
© 2014 University of Pretoria. All rights reserved. The copyright in this work vests in the University of Pretoria.
48
respective construct. The intentions construct on the other hand did not follow this
dual approach and therefore relied solely on Autio et al.‟s (2001) multi-statement
measurement scale.
Autio et al.‟s (2001) multi-statement measures were each recorded on a Likert
scale and intended to be aggregated into a composite score representing the
associated construct. This resultant score would thereafter be aggregated with
Krueger‟s (2000) single item construct to result in the final composite score for
each construct in question. According to Norman (2010), although individual Likert
items are of the ordinal measurement scale, the process of aggregating individual
Likert items results in an interval scale suitable for parametric testing. In instances
where unitary scales differed among individual items (for example one item
recorded on a 5 point Likert scale and another of a 7 point Likert scale), the
researcher would standardise (z-score) recordings and proceeded to aggregate the
items as earlier explained.
A z-score according to Shapiro (2008) is a statistical transformation that specifies
how far a particular value lies from the mean of a normal distribution in terms of
standard deviations. This is particularly important because a z-score is unit-less
because it removes the varying units among variables, for example pounds or
kilograms (Taylor, 2008). After the transformation, all values within a variable will
be measured as the number of standard deviations from the variables mean, thus
making it easy for comparison with other standardised variables. Once this
© 2014 University of Pretoria. All rights reserved. The copyright in this work vests in the University of Pretoria.
49
process was complete, the researcher could continue with further statistical
analysis.
4.9.1. Construct: Attitude
Autio et al.‟s (2001) multi-statement attitude scale had successfully recorded a
Cronbach‟s alpha coefficient of 0.76 (using z-scores to standardise measurement
scales) when applied to their sample of MBA students from the London School of
Business. Gird and Bagraim (2008) on the other hand, after successfully loading
all items on the same component within their construct dimensionality test,
recorded a Cronbach‟s alpha coefficient of 0.62. This result according to Nunnally
and Bernstein (1994) is moderately weak but suitable for purposes of their
preliminary study. Gird and Bagraim (2008) cautioned that future research should
focus on developing robust measurement scales to address the reliability issues
they had experienced within their study.
The present study followed on from these authors to employ Autio et al.‟s (2001)
multi-statement measure, comprised of three questions (hereafter referred to as
individual measurement items); two of which were measured on a -3 to +3 bipolar
response scale and the other on a 7-point Likert scale ranging from 1 to 7. Rating
scale wording for the career alternative item was modified from „Not at all
desirable/Highly desirable‟ to „Highly undesirable/Highly desirable‟. Similarly, the
item relating to the your child‟s choice of profession was amended from „Bad/Good‟
to „Extremely bad/Extremely good‟ and the remaining questions amended from „Do
© 2014 University of Pretoria. All rights reserved. The copyright in this work vests in the University of Pretoria.

50
not agree/Agree‟ to „Strongly disagree/Strongly agree‟. The second measurement
scale was employed from Krueger et al. (2000) and measured attitude with a single
item statement (hereafter referred to as an individual measurement item) on a
rating scale ranging from 1 to 100.
All individual measurement items were standardised (z-score) and a Cronbach‟s
alpha coefficient thereafter recorded to test for internal reliability. The construct
would be calculated as the mean of the standardised scores for item combinations
that yielded the largest internal reliability coefficient and hereafter be referred to as
the aggregate construct scale. The questions and coding for each of the
aforementioned measurement items are detailed as follows:
1) ATT3 - An entrepreneurial career such as starting up and managing my own
firm is: Highly undesirable (-3)… Highly desirable (+3)
2) ATT5 - If my child decided to become an entrepreneur, I myself would
consider it to be: Extremely bad (-3)… Extremely good (+3)
3) ATT6 - I personally consider entrepreneurship to be a highly desirable career
alternative for people with my professional and educational background:
Strongly disagree (1)… Strongly agree (7)
4) ATT7 - Would family and friends want you to start your own business?: 1
(Disagree)…100 (Agree)
© 2014 University of Pretoria. All rights reserved. The copyright in this work vests in the University of Pretoria.
51
4.9.2. Construct: Subjective Norm
Autio et al.‟s (2001) multi-statement attitude scale had successfully recorded a
Cronbach‟s alpha coefficient of 0.80 when applied to their sample of MBA students
from the London School of Business. Similarly, Gird and Bagraim (2008) after
successfully loading all items on the same component within their construct
dimensionality test, recorded a Cronbach‟s alpha coefficient of 0.88 which was
markedly stronger than their predecessors.
The present study employed Autio et al.‟s (2001) multi-statement measure,
comprised of four questions (hereafter referred to as individual measurement
items), all of which were measured on a -3 to +3 bipolar response scale. Rating
scale wording was amended for all items from „Bad/Good‟ to „Highly
undesirable/Highly desirable‟. In addition, each item question was amended from
„If I became an entrepreneur…‟ to „If I were so start my own business…‟. The
second measurement scale was employed from Krueger et al. (2000) and
measured subjective norm with a single item statement (hereafter referred to as an
individual measurement item) on a rating scale ranging from 1 to 100.
All measurement items were standardised (z-score) and a Cronbach‟s alpha
coefficient thereafter recorded to test for internal reliability. The construct would be
calculated as the mean of the standardised scores for item combinations that
yielded the largest internal reliability coefficient and would thereafter be referred to
© 2014 University of Pretoria. All rights reserved. The copyright in this work vests in the University of Pretoria.

52
as the aggregate construct scale. The questions and coding for each of the
aforementioned measurement items are detailed as follows:
1) SN1 - If I become an entrepreneur, my family would consider it to be: Highly
undesirable (-3)… Highly desirable (+3)
2) SN2 - If I became an entrepreneur, my close friends would consider it to be:
Highly undesirable (-3)… Highly desirable (+3)
3) SN3 - If I became an entrepreneur, my colleagues would consider it to be:
Highly undesirable (-3)… Highly desirable (+3)
4) SN4 - If I became an entrepreneur, other people close to me would consider it
to be: Highly undesirable (-3)… Highly desirable (+3)
5) SN5 - Would family and friends want you to start your own business?: 1
(Disagree)…100 (Agree)
4.9.3. Construct: Perceived Behavioural Control
Autio et al.‟s (2001) multi-statement perceived behavioural control scale had
successfully recorded a Cronbach‟s alpha coefficient of 0.75 when applied to their
sample of MBA students from the London School of Business. Gird and Bagraim
(2008) on the other hand, after successfully loading all items on the same
component within their construct dimensionality test, recorded a Cronbach‟s alpha
coefficient of 0.68, once again supporting their call for future studies to improve on
measurement scales.
© 2014 University of Pretoria. All rights reserved. The copyright in this work vests in the University of Pretoria.

53
The present study employed Autio et al.‟s (2001) multi-statement measure
comprised of four questions (hereafter referred to as individual measurement
items), each measured on a scale ranging from +1 to +5. The second
measurement item was employed from Krueger et al. (2000) and measured
perceived behavioural control with a single item statement (hereafter referred to as
an individual measurement item) on a rating scale ranging from 1 to 100. All
measurement items were standardised (z-score) and a Cronbach‟s alpha
coefficient thereafter recorded to test for internal reliability. The construct would be
calculated as the mean of the standardised scores for item combinations that
yielded the largest internal reliability coefficient and would thereafter be referred to
as the aggregate construct scale. The questions and coding for each of the
aforementioned measurement items are detailed as follows:
1) PBC1 - I am confident that I would succeed if I started my own firm: Disagree
(+1)… Agree (+5)
2) PBC2 - It would be easy for me to start my own firm: Disagree (+1)… Agree
(+5)
3) PBC3 - To start my own firm would probably be the best way for me to take
advantage of my education: Disagree (+1)… Agree (+5)
4) PBC4 - I have the skills and capabilities required to succeed as an
entrepreneur: Disagree (+1)… Agree (+5)
5) PBC5 - How practical is it for you to start you own business?: 1
(Disagree)…100 (Agree)
© 2014 University of Pretoria. All rights reserved. The copyright in this work vests in the University of Pretoria.

54
4.9.4. Construct: Intention
Autio et al.‟s (2001) multi-item intention scale had successfully recorded a
Cronbach‟s alpha coefficient of 0.82 (using z-scores to standardise measurement
scales) when applied to their sample of MBA students from the London School of
Business. Importantly, the measurement scale recorded the perceived likelihood
of an individual starting a business on either a full-time or part-time basis within a
period of one or five years from when the research was conducted. Gird and
Bagraim (2008) later recorded a Cronbach‟s alpha coefficient of 0.7, which again
illustrates the need for revised measurement scales, evidenced by the deterioration
reliability coefficients.
The present study employed Autio et al.‟s (2001) multi-statement measure
comprised of four-item statements (hereafter referred to as individual measurement
items), each measured on a scale ranging from +1 to +5. The scale wording was
modified to replace the word „firm‟ with „business‟, a term more familiar within a
South African context. Individuals who had recorded that they had „already started
a business‟ were thereafter excluded from the analysis for reasons detailed within
the sampling methodology. All measurement items were thereafter standardised
(z-score) and a Cronbach‟s alpha coefficient recorded to test for internal reliability.
The construct would be calculated as the mean of the standardised scores for item
combinations that yielded the largest internal reliability coefficient and would
thereafter be referred to as the aggregate construct scale. The questions and
coding for each of the aforementioned measurement items are detailed as follows:
© 2014 University of Pretoria. All rights reserved. The copyright in this work vests in the University of Pretoria.

55
For full-time occupation in own business:
1) INT1 - Start a business on a full-time basis within one year from now: Not at
all likely (+1)… Very likely (+4)… Already started a firm (+5)
2) INT2 - Start a business on a full-time basis within five years from now: Not at
all likely (+1)… Very likely (+4)… Already started a firm (+5)
For part-time occupation in own business
3) INT3 - Start a business on a part-time basis within one year from now: Not at
all likely (+1)… Very likely (+4)… Already started a firm (+5)
4) INT4 - Start a business on a part-time basis within five years from now: Not
at all likely (+1)… Very likely (+4)… Already started a firm (+5)
4.10. Data Analysis Process
The survey responses were imported into Microsoft Excel and visually inspected
for any obvious errors relating to the data importation and coding. The resultant
dataset was thereafter imported into IBM SPSS Statistics version 21 for further
statistical analysis.
Descriptive statistics were conducted prior to commencing with any statistical
analysis. According to Schwandt (2007), descriptive statistics are mathematical
techniques used to organise, display and summarise numerical data. Further,
these authors state that descriptive statistics can include the measure of central
tendency such as means, medians and mode; and measures of variability such as
© 2014 University of Pretoria. All rights reserved. The copyright in this work vests in the University of Pretoria.
56
standard deviation. This analysis provided important insight into the data
composition before commencing with the initial screening process in the following
sections.
Outlier analysis was performed to identify extreme cases that could interfere with
subsequent statistical analysis. Outliers according to Weiers (2010) are data
values that are very different from other values within their dataset; these authors
explain that if the outliers are not remedied, then the statistical results and
conclusions could be significantly misrepresented. A Box-and-Whiskers plot
representing the standardised (z-score) individual measurement items was
employed as the univariate method for outlier detection. This approach according
to Rodriguez (2007) is particularly useful for investigating the symmetry of a
distribution and to detect any inconsistent values and outliers.
A principle components analysis with varimax techniques of rotation was thereafter
performed on all standardised individual measurement items (before they were
aggregated) to validate scale dimensionality. PCA is multivariate data analysis to
reduce the dimensionality of data sets and simplify the representation of the data
under consideration (Salkind, 2010b). These authors explain that PCA assists with
validity confirmation that allows one to determine which items are working against
each other and possibly not measuring the same intended construct.
A Pearson product-moment correlation was performed for all individual
measurement items to determine the extent to which items were correlated among
© 2014 University of Pretoria. All rights reserved. The copyright in this work vests in the University of Pretoria.
57
each other. According to Bagiella (2008), the Pearson-moment correlation
coefficient is a measure of the strength of the linear relationship between two
continuous variables and allows for an individual to make accurate prediction about
one variable using another. This exercise served to support the findings from the
principle components analysis detailed in the previous paragraph.
Cronbach‟s alpha coefficients were calculated for all individual measurement items
in an attempt to demonstrate scale reliability. Individual item measures were then
combined into an aggregate construct scale based on the outcome of the reliability
test.
According to Segrin (2010) Normality, linearity and homoscedasticity are important
prerequisites for a multiple linear regression analysis. Aggregate construct scales
were thus visually inspected to confirm that the data was mound shaped and in
doing so approximately normally distributed. This approach, according to
University of Northern Iowa (2010) is acceptable because the unitary measurement
for Likert scales is not continuous in nature and therefore cannot strictly possess a
normal probability distribution. Scatterplots were thereafter used to visually assess
for the linear relationship between the dependent variable and each its predictor
variables. Finally, homescedasticity (antonym heteroscedasticity) which suggests
equal levels of variability between a quantitative dependent variable across a range
of independent variables (Fay, 2010) was measured using a Breusch-Pagan test
for Heteroscedasticity.
© 2014 University of Pretoria. All rights reserved. The copyright in this work vests in the University of Pretoria.
58
A Pearson product-moment correlation was thereafter performed for all aggregate
construct scales to determine the extent to which items were correlated among
each other. This correlation analysis was particularly important to identify strong
associations between independent variables that would inform a test for the
presence of multicollinearity. According to Gebotys (2010), multicollinearity exists
when independent variables are highly correlated with each other. Further, these
authors caution that if the degree of multicolinearity is not reduced, then statistical
results could include large standard errors, wide confidence intervals and
nonsignificant or incorrect t-statistcs.
According to Pearson (2010), the degree of multicollinearity can be measured with
a tolerance and variance inflation factor (VIF) test reported within SPSS. These
authors explain that tolerance is a measure of the amount of variance of each
independent variable that is not explained by other variables in the equation 1-R2.
Further, VIF is explained to be an alternative approach and is measured as a
function of tolerance, represented as by 1/(1-R2). A rule of thumb for their
interpretation suggests that if tolerance is 0.10 or less, or if the VIF is 10 or greater,
then one could have a problem of multicollinearity.
Upon conclusion of the preceding sections, the researcher could then proceed to
address hypothesis 1 and 2. Revisiting the research design, a multiple regression
analysis was used to test hypothesis 1 that aimed to confirm the TPB as a
statistically significant predictor of entrepreneurial intention. Hypothesis 2 on the
© 2014 University of Pretoria. All rights reserved. The copyright in this work vests in the University of Pretoria.
59
other hand employed a hierarchical regression analysis and aimed to confirm the
sufficiency of the TPB as predictor of entrepreneurial intention.
4.11. Limitations
The cross sectional design of the present study precludes a longitudinal design
that may have determined causality (Sutherland & Jordaan, 2004). Further, these
authors claim that due to the nature of non-probability samples, one cannot say
with certainty the extent to which the sample is representative of the population. In
addition, the sample excludes individuals who are currently not formally employed
and therefore the findings cannot be generalisable to this segment of the
population. Further, this limitation is an unfortunate consequence of attempting to
include mature (older) individuals who were facing vocational decisions. These
individuals have a higher propensity to already be in full-time employ.
© 2014 University of Pretoria. All rights reserved. The copyright in this work vests in the University of Pretoria.
60
5. RESULTS
5.1. Introduction
The previous chapter discussed the research methodology employed for this study.
This chapter serves to present the results from the statistical analysis. Descriptive
statistics were conducted on the sample detailing the number of participants,
gender, racial group, employment sector, industry, participant age, years of
experience and number to direct reports. Thereafter, initial screening was
conducted which comprised of outlier analysis, a test for dimensionality using
principle components analysis, correlation analysis for individual measurement
items, followed by tests for internal reliability, regression assumptions and lastly a
correlation analysis for the aggregate construct scale. A multiple regression
analysis was thereafter performed to test hypothesis one, followed by a
hierarchical regression analysis for hypothesis two and three.
5.2. Descriptive Statistics
One hundred and seventy nine participants completed the questionnaire of which
134 satisfied the criterion of being formally employed and not engaged with
entrepreneurial activity at the time of the survey capture. Two participants of the
134 failed to complete the entire questionnaire and were excluded from the
analysis going forward. A total of 132 cases were then used within all subsequent
analysis. The sample composition was detailed for gender, racial group,
© 2014 University of Pretoria. All rights reserved. The copyright in this work vests in the University of Pretoria.
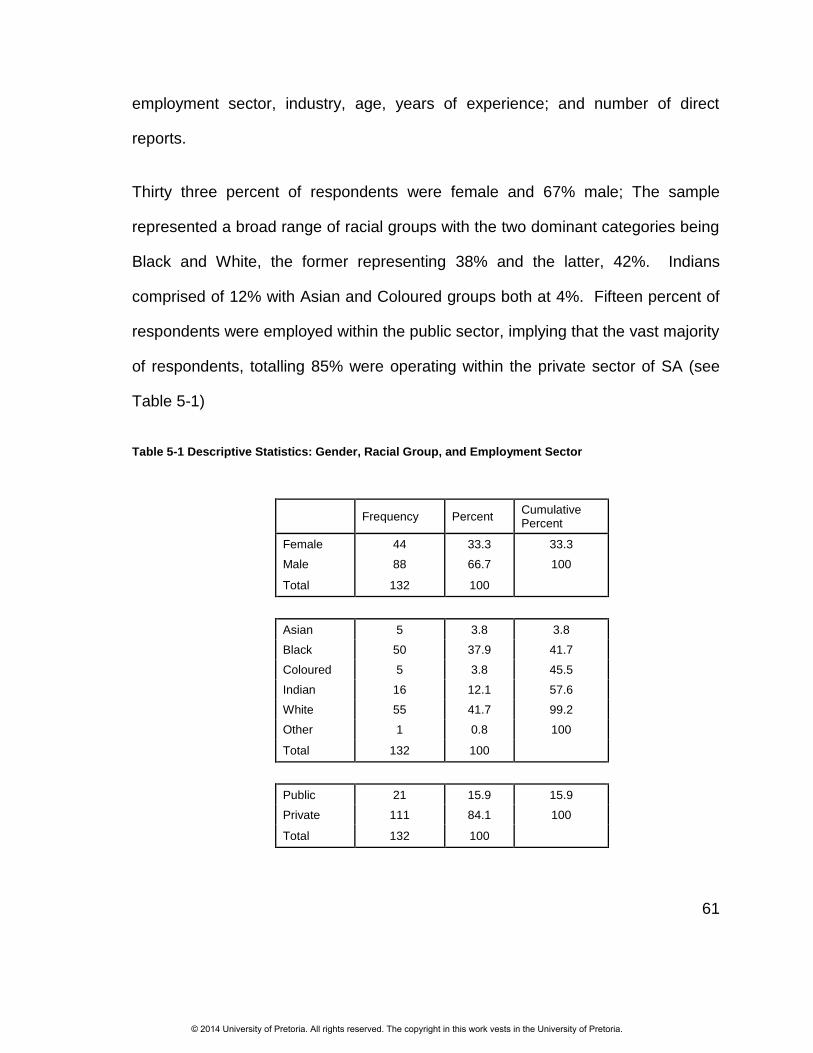
61
employment sector, industry, age, years of experience; and number of direct
reports.
Thirty three percent of respondents were female and 67% male; The sample
represented a broad range of racial groups with the two dominant categories being
Black and White, the former representing 38% and the latter, 42%. Indians
comprised of 12% with Asian and Coloured groups both at 4%. Fifteen percent of
respondents were employed within the public sector, implying that the vast majority
of respondents, totalling 85% were operating within the private sector of SA (see
Table 5-1)
Table 5-1 Descriptive Statistics: Gender, Racial Group, and Employment Sector
Frequency Percent Cumulative Percent
Female 44 33.3 33.3
Male 88 66.7 100
Total 132 100
Asian 5 3.8 3.8
Black 50 37.9 41.7
Coloured 5 3.8 45.5
Indian 16 12.1 57.6
White 55 41.7 99.2
Other 1 0.8 100
Total 132 100
Public 21 15.9 15.9
Private 111 84.1 100
Total 132 100
© 2014 University of Pretoria. All rights reserved. The copyright in this work vests in the University of Pretoria.
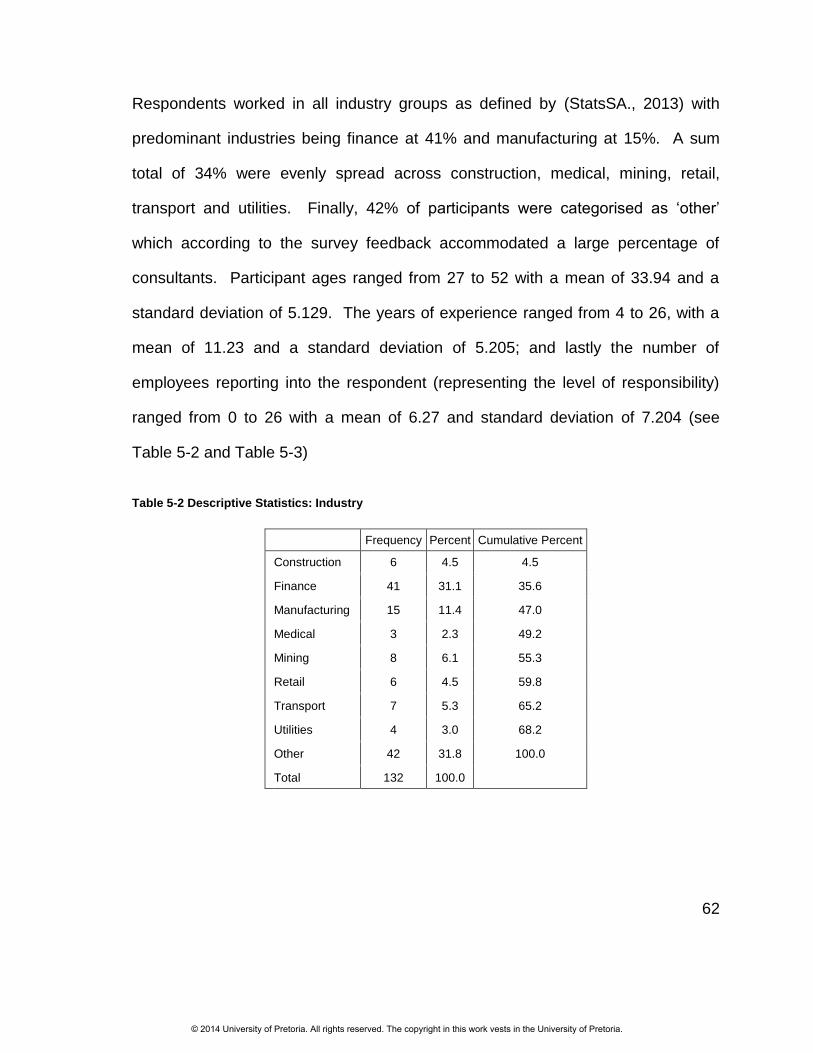
62
Respondents worked in all industry groups as defined by (StatsSA., 2013) with
predominant industries being finance at 41% and manufacturing at 15%. A sum
total of 34% were evenly spread across construction, medical, mining, retail,
transport and utilities. Finally, 42% of participants were categorised as „other‟
which according to the survey feedback accommodated a large percentage of
consultants. Participant ages ranged from 27 to 52 with a mean of 33.94 and a
standard deviation of 5.129. The years of experience ranged from 4 to 26, with a
mean of 11.23 and a standard deviation of 5.205; and lastly the number of
employees reporting into the respondent (representing the level of responsibility)
ranged from 0 to 26 with a mean of 6.27 and standard deviation of 7.204 (see
Table 5-2 and Table 5-3)
Table 5-2 Descriptive Statistics: Industry
Frequency Percent Cumulative Percent
Construction 6 4.5 4.5
Finance 41 31.1 35.6
Manufacturing 15 11.4 47.0
Medical 3 2.3 49.2
Mining 8 6.1 55.3
Retail 6 4.5 59.8
Transport 7 5.3 65.2
Utilities 4 3.0 68.2
Other 42 31.8 100.0
Total 132 100.0
© 2014 University of Pretoria. All rights reserved. The copyright in this work vests in the University of Pretoria.
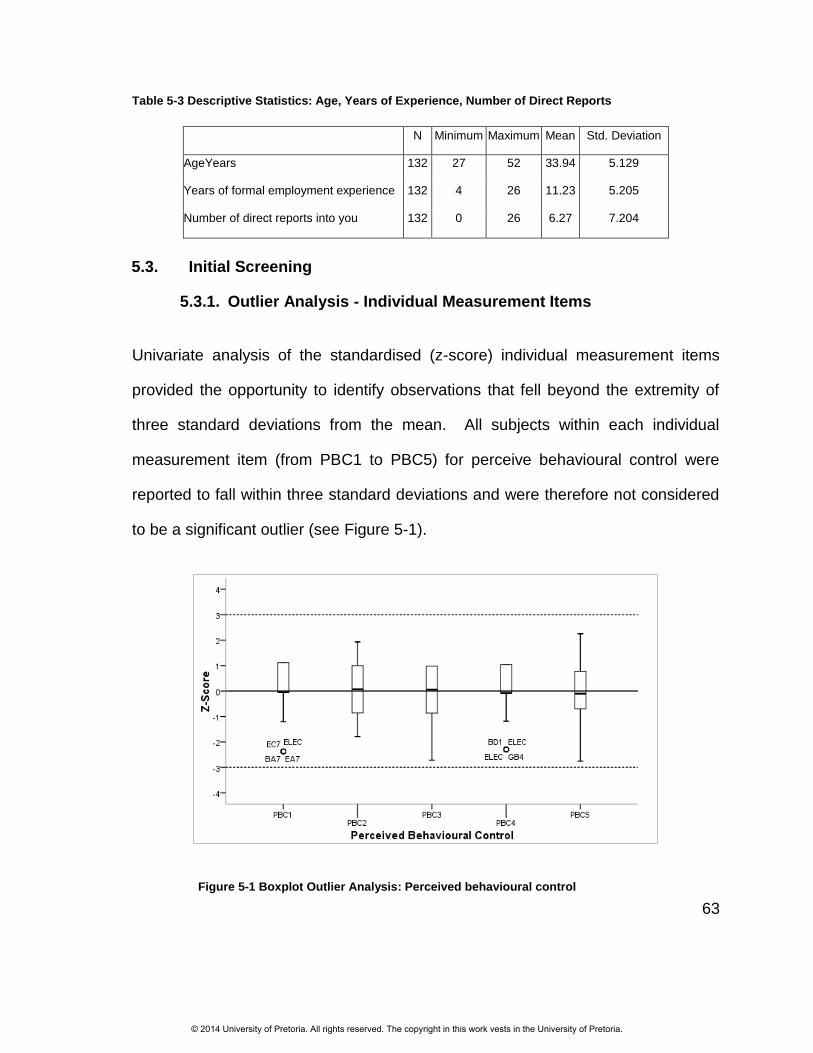
63
Table 5-3 Descriptive Statistics: Age, Years of Experience, Number of Direct Reports
N Minimum Maximum Mean Std. Deviation
AgeYears 132 27 52 33.94 5.129
Years of formal employment experience 132 4 26 11.23 5.205
Number of direct reports into you 132 0 26 6.27 7.204
5.3. Initial Screening
5.3.1. Outlier Analysis - Individual Measurement Items
Univariate analysis of the standardised (z-score) individual measurement items
provided the opportunity to identify observations that fell beyond the extremity of
three standard deviations from the mean. All subjects within each individual
measurement item (from PBC1 to PBC5) for perceive behavioural control were
reported to fall within three standard deviations and were therefore not considered
to be a significant outlier (see Figure 5-1).
Figure 5-1 Boxplot Outlier Analysis: Perceived behavioural control
© 2014 University of Pretoria. All rights reserved. The copyright in this work vests in the University of Pretoria.
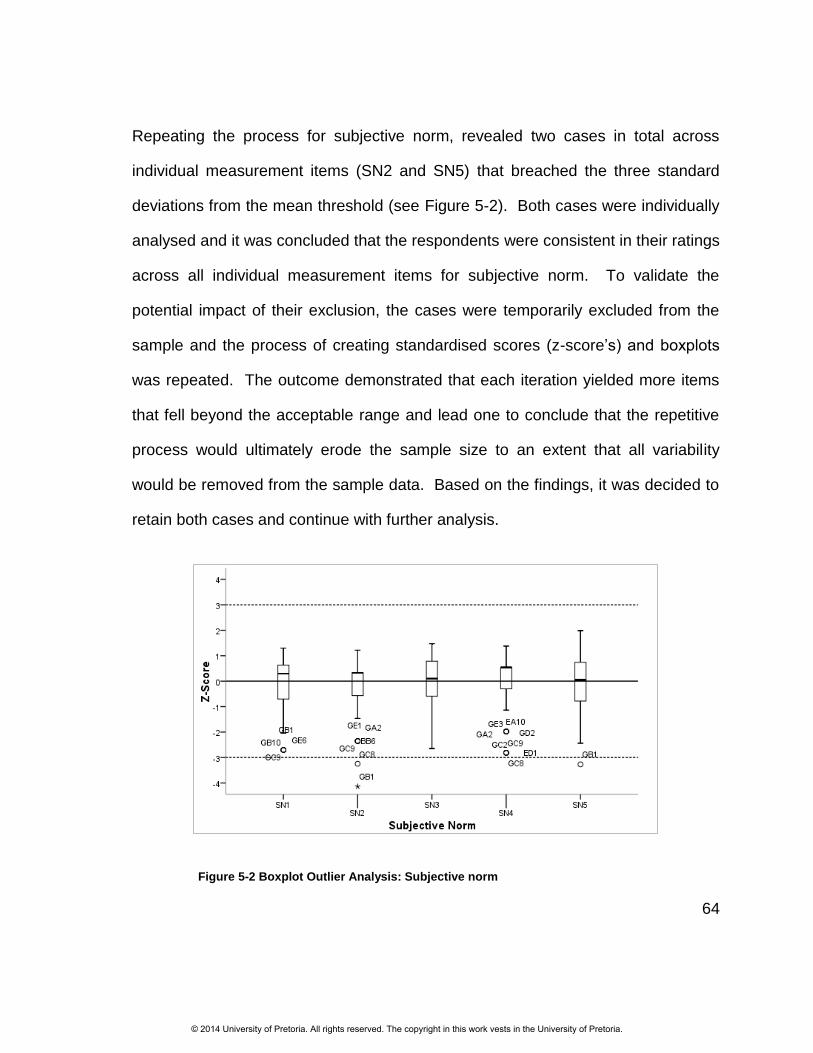
64
Repeating the process for subjective norm, revealed two cases in total across
individual measurement items (SN2 and SN5) that breached the three standard
deviations from the mean threshold (see Figure 5-2). Both cases were individually
analysed and it was concluded that the respondents were consistent in their ratings
across all individual measurement items for subjective norm. To validate the
potential impact of their exclusion, the cases were temporarily excluded from the
sample and the process of creating standardised scores (z-score‟s) and boxplots
was repeated. The outcome demonstrated that each iteration yielded more items
that fell beyond the acceptable range and lead one to conclude that the repetitive
process would ultimately erode the sample size to an extent that all variability
would be removed from the sample data. Based on the findings, it was decided to
retain both cases and continue with further analysis.
Figure 5-2 Boxplot Outlier Analysis: Subjective norm
© 2014 University of Pretoria. All rights reserved. The copyright in this work vests in the University of Pretoria.
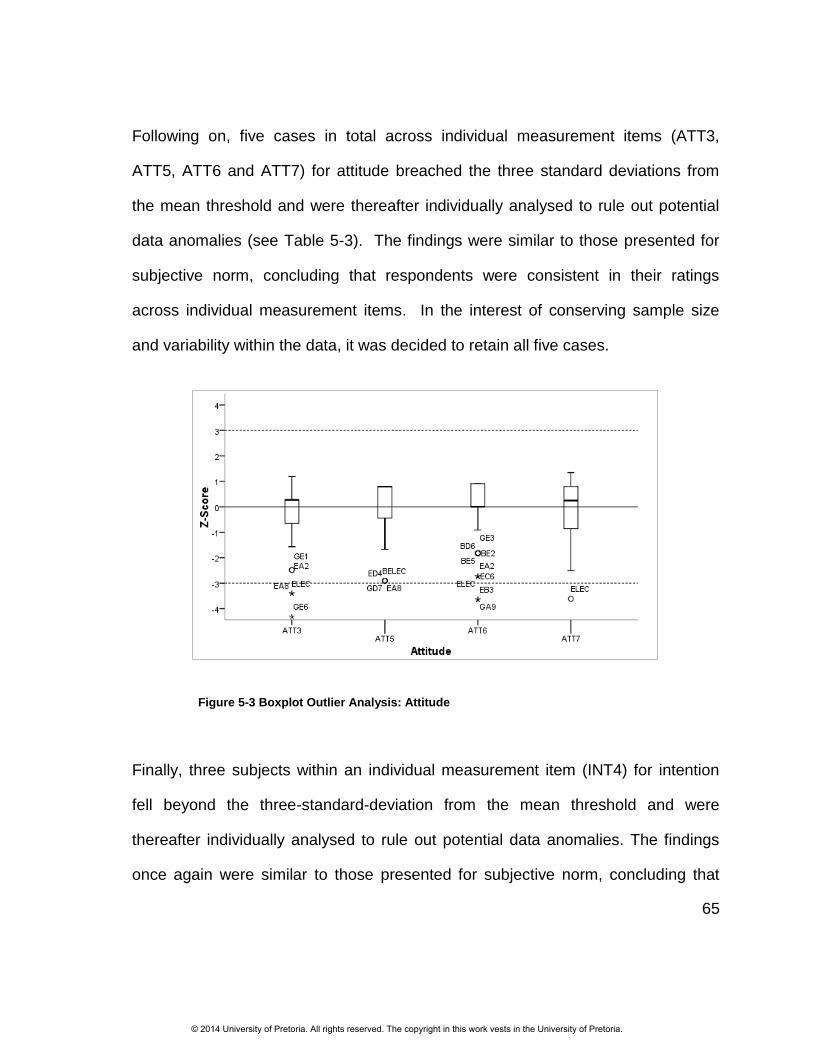
65
Following on, five cases in total across individual measurement items (ATT3,
ATT5, ATT6 and ATT7) for attitude breached the three standard deviations from
the mean threshold and were thereafter individually analysed to rule out potential
data anomalies (see Table 5-3). The findings were similar to those presented for
subjective norm, concluding that respondents were consistent in their ratings
across individual measurement items. In the interest of conserving sample size
and variability within the data, it was decided to retain all five cases.
Figure 5-3 Boxplot Outlier Analysis: Attitude
Finally, three subjects within an individual measurement item (INT4) for intention
fell beyond the three-standard-deviation from the mean threshold and were
thereafter individually analysed to rule out potential data anomalies. The findings
once again were similar to those presented for subjective norm, concluding that
© 2014 University of Pretoria. All rights reserved. The copyright in this work vests in the University of Pretoria.
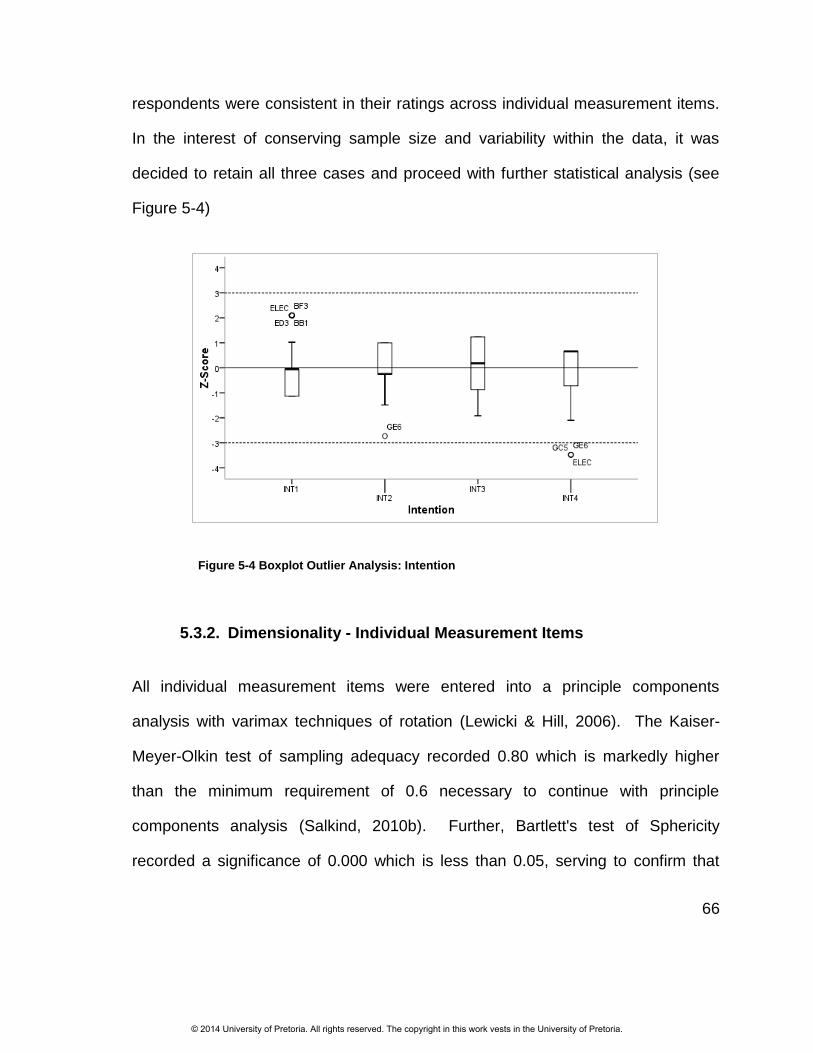
66
respondents were consistent in their ratings across individual measurement items.
In the interest of conserving sample size and variability within the data, it was
decided to retain all three cases and proceed with further statistical analysis (see
Figure 5-4)
Figure 5-4 Boxplot Outlier Analysis: Intention
5.3.2. Dimensionality - Individual Measurement Items
All individual measurement items were entered into a principle components
analysis with varimax techniques of rotation (Lewicki & Hill, 2006). The Kaiser-
Meyer-Olkin test of sampling adequacy recorded 0.80 which is markedly higher
than the minimum requirement of 0.6 necessary to continue with principle
components analysis (Salkind, 2010b). Further, Bartlett's test of Sphericity
recorded a significance of 0.000 which is less than 0.05, serving to confirm that
© 2014 University of Pretoria. All rights reserved. The copyright in this work vests in the University of Pretoria.
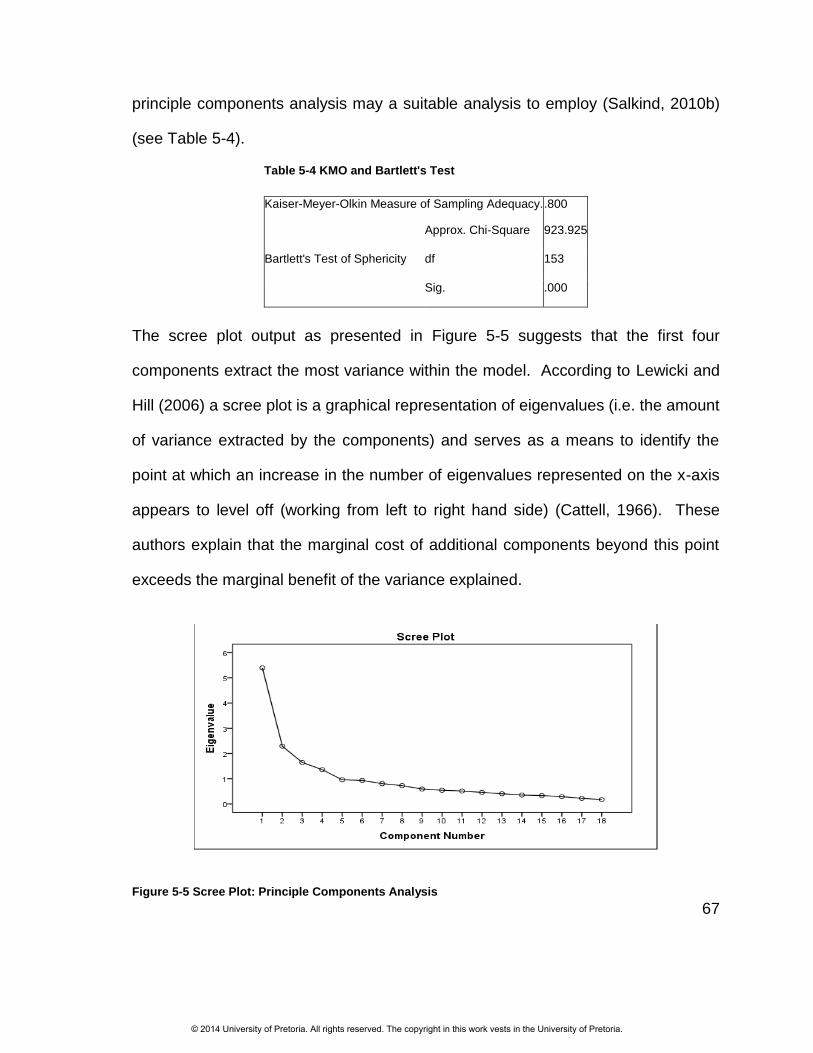
67
principle components analysis may a suitable analysis to employ (Salkind, 2010b)
(see Table 5-4).
Table 5-4 KMO and Bartlett's Test
Kaiser-Meyer-Olkin Measure of Sampling Adequacy. .800
Bartlett's Test of Sphericity
Approx. Chi-Square 923.925
df 153
Sig. .000
The scree plot output as presented in Figure 5-5 suggests that the first four
components extract the most variance within the model. According to Lewicki and
Hill (2006) a scree plot is a graphical representation of eigenvalues (i.e. the amount
of variance extracted by the components) and serves as a means to identify the
point at which an increase in the number of eigenvalues represented on the x-axis
appears to level off (working from left to right hand side) (Cattell, 1966). These
authors explain that the marginal cost of additional components beyond this point
exceeds the marginal benefit of the variance explained.
Figure 5-5 Scree Plot: Principle Components Analysis
© 2014 University of Pretoria. All rights reserved. The copyright in this work vests in the University of Pretoria.

68
The component analysis as presented in Table 5-5, demonstrated that most
individual measurement items were suitably measuring the same underlying
construct. Three individual measurement items for perceive behavioural control
(PBC1, PBC4 and PBC5) produced sufficient loadings on component two
suggesting that the remaining two attributes (PBC2 and PBC3) were not
adequately measuring the same latent construct. It was therefore decided to
disqualify both PBC2 and PBC3 as valid individual measurement items, eligible for
aggregate construct scale calculation going forward.
All individual measurement items for subjective norm loaded with significant
weightings on component one. SN5 (0.625) presented the lowest component
loading and was markedly different from SN1 to SN4 which ranged from 0.739 to
0.846 respectively. Despite the large differential, it was decided to retain SN5 as a
valid individual measurement item, eligible for aggregate construct scale
calculation going forward.
Similarly, all items for attitude and Intention loaded with significant weightings on
component three and four respectively. Although there was a large differential
between the smallest and largest loadings in both components, the smallest values
of 0.471 for INT4 and 0.527 for ATT3 according to Salkind (2010a) are acceptable.
These authors claim that there are three approaches to determine if a loading is
significant; one could either employ a cut-off value; apply a t-test, or lastly a
confidence interval. They go on to explain that the latter two options are not
© 2014 University of Pretoria. All rights reserved. The copyright in this work vests in the University of Pretoria.
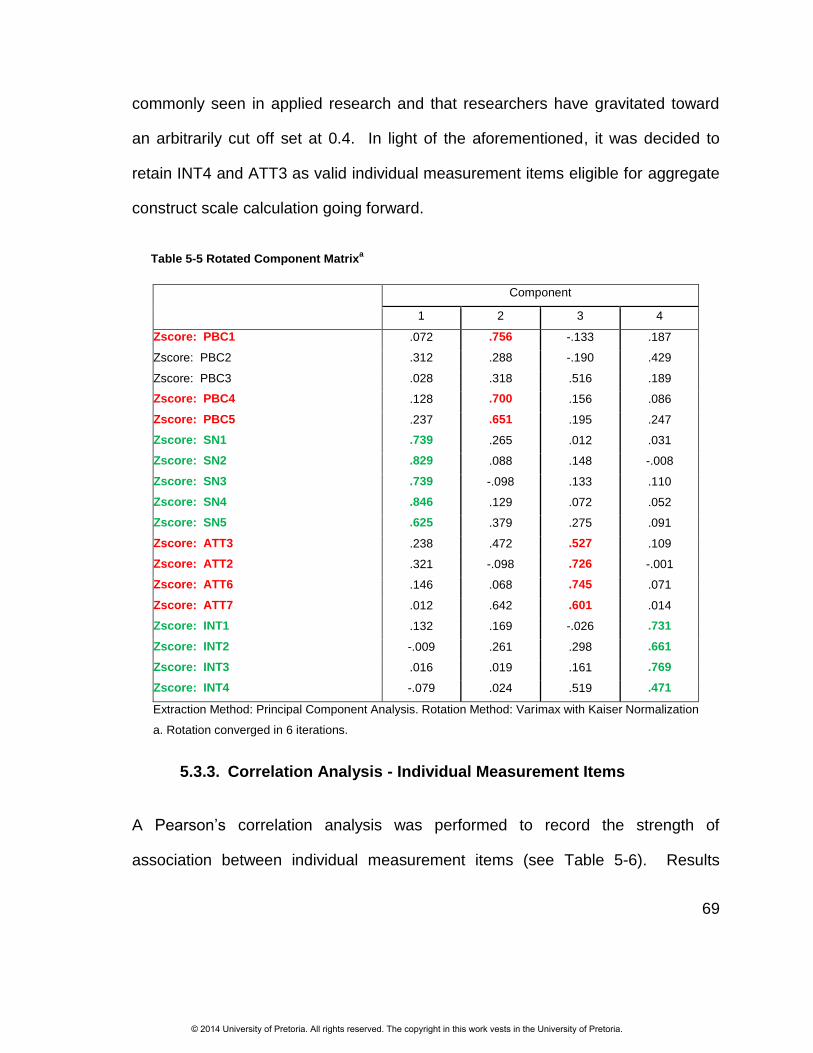
69
commonly seen in applied research and that researchers have gravitated toward
an arbitrarily cut off set at 0.4. In light of the aforementioned, it was decided to
retain INT4 and ATT3 as valid individual measurement items eligible for aggregate
construct scale calculation going forward.
Table 5-5 Rotated Component Matrixa
Component
1 2 3 4
Zscore: PBC1 .072 .756 -.133 .187
Zscore: PBC2 .312 .288 -.190 .429
Zscore: PBC3 .028 .318 .516 .189
Zscore: PBC4 .128 .700 .156 .086
Zscore: PBC5 .237 .651 .195 .247
Zscore: SN1 .739 .265 .012 .031
Zscore: SN2 .829 .088 .148 -.008
Zscore: SN3 .739 -.098 .133 .110
Zscore: SN4 .846 .129 .072 .052
Zscore: SN5 .625 .379 .275 .091
Zscore: ATT3 .238 .472 .527 .109
Zscore: ATT2 .321 -.098 .726 -.001
Zscore: ATT6 .146 .068 .745 .071
Zscore: ATT7 .012 .642 .601 .014
Zscore: INT1 .132 .169 -.026 .731
Zscore: INT2 -.009 .261 .298 .661
Zscore: INT3 .016 .019 .161 .769
Zscore: INT4 -.079 .024 .519 .471
Extraction Method: Principal Component Analysis. Rotation Method: Varimax with Kaiser Normalization
a. Rotation converged in 6 iterations.
5.3.3. Correlation Analysis - Individual Measurement Items
A Pearson‟s correlation analysis was performed to record the strength of
association between individual measurement items (see Table 5-6). Results
© 2014 University of Pretoria. All rights reserved. The copyright in this work vests in the University of Pretoria.

70
indicate that the strength of associations among individual measurement items
PBC1 to PBC5 were relatively weak, corroborating their poor component loadings
from the principle components analysis. Statistically significant associations
among PBC1 to PBC5 were highlighted in red thereby providing a visual
representation of the extent to which items were strongly related.
All other individual measurement items namely SN1 to SN5, ATT3 and ATT5 to
ATT7; and INT1 to INT4, largely demonstrated a strong and statistically significant
association among the individual measurement items within each of their latent
construct groups (namely perceived behavioural control, subjective norm and
attitude). These associations can be visually inspected by referring to the red
highlighted cells for their respective groups.
Further, associations could be observed for individual measurement items between
construct groups, for example PBC2 to PBC5 being significantly correlated with
ATT3, ATT5, ATT6 and ATT7 (this illustrated by the blue highlighted cells).
Importantly, for purposes of this study, one would want to observe associations
with items belonging to intentions, namely INT1 to INT4. Despite the overall
consensus supporting a high degree of association within and between particular
construct groups, results show that the individual measurement items for subjective
norm have an extremely weak and non-significant association and with individual
measurement items from the intentions construct.
© 2014 University of Pretoria. All rights reserved. The copyright in this work vests in the University of Pretoria.
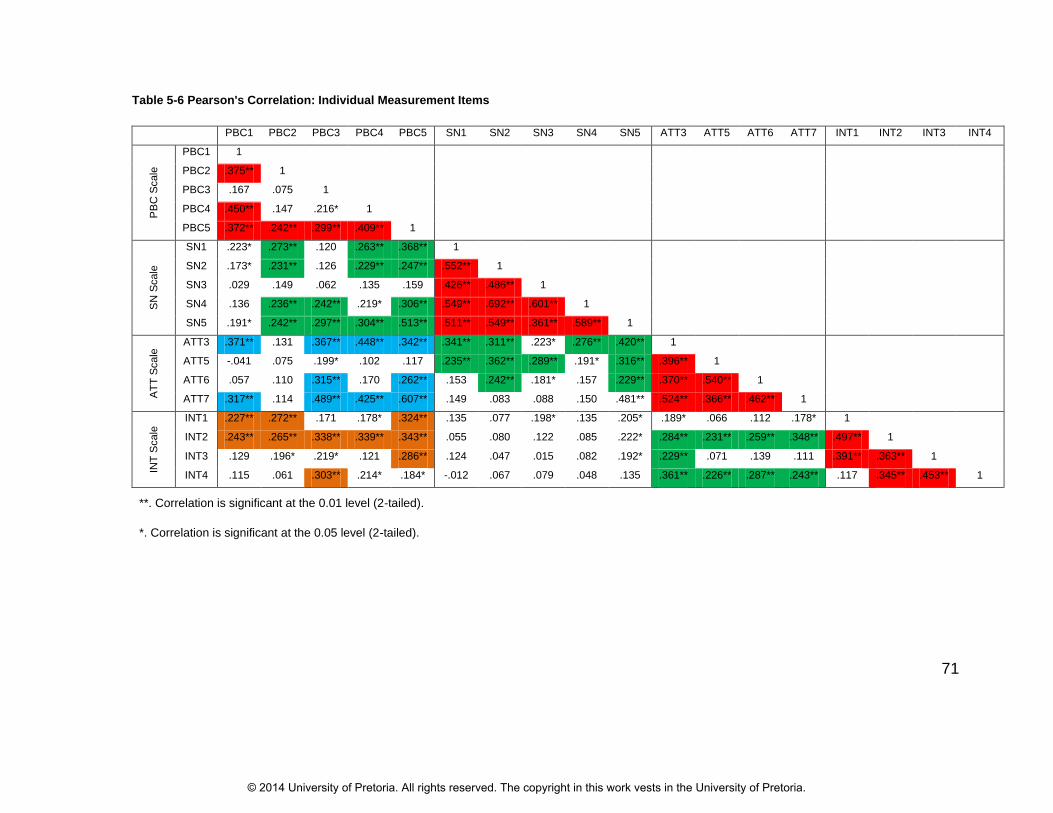
71
Table 5-6 Pearson's Correlation: Individual Measurement Items
PBC1 PBC2 PBC3 PBC4 PBC5 SN1 SN2 SN3 SN4 SN5 ATT3 ATT5 ATT6 ATT7 INT1 INT2 INT3 INT4
PB
C S
cale
PBC1 1
PBC2 .375** 1
PBC3 .167 .075 1
PBC4 .450** .147 .216* 1
PBC5 .372** .242** .299** .409** 1
SN
Scale
SN1 .223* .273** .120 .263** .368** 1
SN2 .173* .231** .126 .229** .247** .552** 1
SN3 .029 .149 .062 .135 .159 .426** .486** 1
SN4 .136 .236** .242** .219* .306** .549** .692** .601** 1
SN5 .191* .242** .297** .304** .513** .511** .549** .361** .589** 1
AT
T S
cale
ATT3 .371** .131 .367** .448** .342** .341** .311** .223* .276** .420** 1
ATT5 -.041 .075 .199* .102 .117 .235** .362** .289** .191* .316** .396** 1
ATT6 .057 .110 .315** .170 .262** .153 .242** .181* .157 .229** .370** .540** 1
ATT7 .317** .114 .489** .425** .607** .149 .083 .088 .150 .481** .524** .366** .462** 1
INT
Scale
INT1 .227** .272** .171 .178* .324** .135 .077 .198* .135 .205* .189* .066 .112 .178* 1
INT2 .243** .265** .338** .339** .343** .055 .080 .122 .085 .222* .284** .231** .259** .348** .497** 1
INT3 .129 .196* .219* .121 .286** .124 .047 .015 .082 .192* .229** .071 .139 .111 .391** .363** 1
INT4 .115 .061 .303** .214* .184* -.012 .067 .079 .048 .135 .361** .226** .287** .243** .117 .345** .453** 1
**. Correlation is significant at the 0.01 level (2-tailed).
*. Correlation is significant at the 0.05 level (2-tailed).
© 2014 University of Pretoria. All rights reserved. The copyright in this work vests in the University of Pretoria.

72
5.3.4. Scale Reliability - Individual Measurement Items
Cronbach‟s alpha coefficients were calculated for all individual measurement
items pertaining to each latent construct. The statistic records an alpha
coefficient for all possible combinations of individual measurement items per
latent construct (see Table 5-7). The researcher then chose the individual
measurement item combination that yielded the maximum alpha coefficient for
inclusion in the aggregate construct scale calculation.
PBC1, PBC4 and PBC5 representing perceived behavioural control recorded an
alpha at 0.676. Similarly, SN1 to SN5 representing subjective norm recorded
alpha at 0.850. ATT3, ATT5 to ATT7 representing attitude recorded alpha at
0.761 and lastly, INT1 to INT4 representing intention recorded alpha at 0.693.
According to George and Mallery (2003), the following rules of thumb can be
applied to interpret Cronbach‟s alpha: Alpha > .9 = Excellent, Alpha > .8 =
Good, Alpha > .7 = Acceptable, Alpha > .6 = Questionable, Alpha > .5 = Poor,
and Alpha < .5 = Unacceptable.
© 2014 University of Pretoria. All rights reserved. The copyright in this work vests in the University of Pretoria.

73
Table 5-7 Scale Reliability: Individual Measurement Items
Scale Code Scale Origin Standardised Cronbach‟s Alpha
Number of Items
Perceived behavioural control:
PBC1234 Using Autio (2001) standardised scale
.556 4
PBC12345 Using Autio (2001) and Krueger (2000) standardised scale
.655 5
PBC145 Using Krueger (2000) and reduced Autio (2001) standardised scale
.676 3
Subjective norm:
SN1234 Using Autio (2001) scale .831 4
Z_SN1234 Using Autio (2001) standardised scale
.831 4
Z_SN12345 Using Autio (2001) and Krueger (2000) standardised scale
.850 5
Attitude:
Z_ATT356 Using Autio (2001) scale .698 3
Z_ATT3567 Using Autio (2001) and Krueger (2000) standardised scale
.761 4
Intentions:
ZINT1234 Using Autio (2001) scale .693 4
George and Mallery (2003) provide the following rules of thumb for interpreting Cronbach‟s alpha: “>= 0.9
(Excellent), >= 0.8 (Good), >= 0.7 (Acceptable), >= 0.6 (Questionable), >= 0.5 (Poor) and <0.5
(Unacceptable)” (p. 231).
5.3.5. Regression Assumptions - Aggregate Construct Scale
Aggregate construct scales were visually inspected and confirmed to mound
shaped, thus confirming the assumption of normality (see Appendix A).
Similarly, linearity was confirmed though visual inspection of the scatterplot for
dependent and independent variables (see Figure 5-6, top three cells).
Thereafter, the Breusch-Pagan test for heteroscedasticity recorded a Chi-
squared statistic of 1.231 at a significance of 0.745, failing to reject the null
hypothesis that suggests homogeneity. The assumption of homoscedasticity
was thus satisfied.
© 2014 University of Pretoria. All rights reserved. The copyright in this work vests in the University of Pretoria.
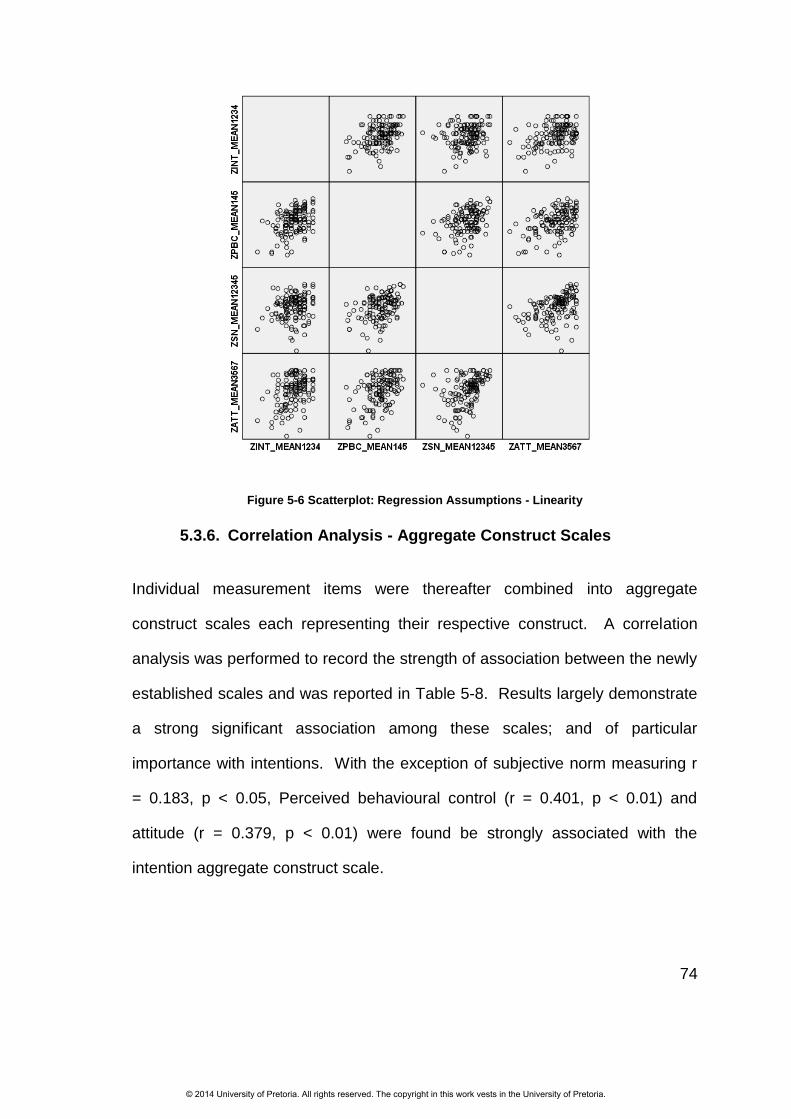
74
Figure 5-6 Scatterplot: Regression Assumptions - Linearity
5.3.6. Correlation Analysis - Aggregate Construct Scales
Individual measurement items were thereafter combined into aggregate
construct scales each representing their respective construct. A correlation
analysis was performed to record the strength of association between the newly
established scales and was reported in Table 5-8. Results largely demonstrate
a strong significant association among these scales; and of particular
importance with intentions. With the exception of subjective norm measuring r
= 0.183, p < 0.05, Perceived behavioural control (r = 0.401, p < 0.01) and
attitude (r = 0.379, p < 0.01) were found be strongly associated with the
intention aggregate construct scale.
© 2014 University of Pretoria. All rights reserved. The copyright in this work vests in the University of Pretoria.
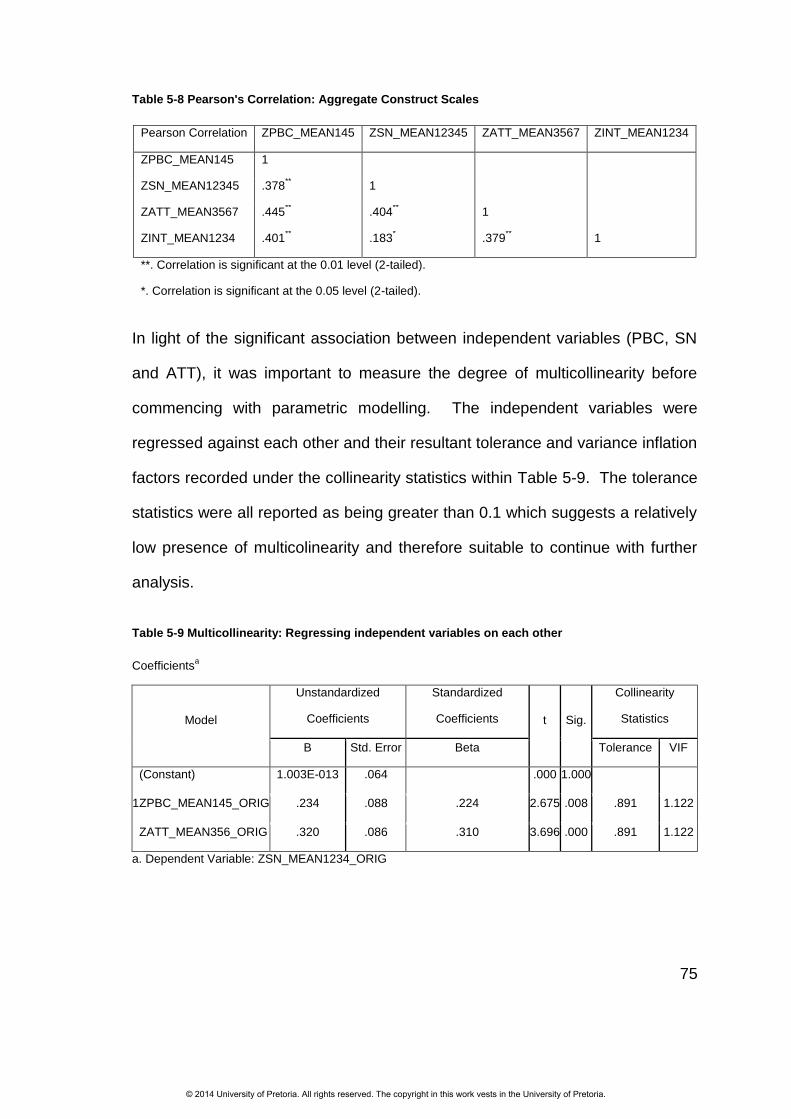
75
Table 5-8 Pearson's Correlation: Aggregate Construct Scales
Pearson Correlation ZPBC_MEAN145 ZSN_MEAN12345 ZATT_MEAN3567 ZINT_MEAN1234
ZPBC_MEAN145 1
ZSN_MEAN12345 .378** 1
ZATT_MEAN3567 .445** .404
** 1
ZINT_MEAN1234 .401** .183
* .379
** 1
**. Correlation is significant at the 0.01 level (2-tailed).
*. Correlation is significant at the 0.05 level (2-tailed).
In light of the significant association between independent variables (PBC, SN
and ATT), it was important to measure the degree of multicollinearity before
commencing with parametric modelling. The independent variables were
regressed against each other and their resultant tolerance and variance inflation
factors recorded under the collinearity statistics within Table 5-9. The tolerance
statistics were all reported as being greater than 0.1 which suggests a relatively
low presence of multicolinearity and therefore suitable to continue with further
analysis.
Table 5-9 Multicollinearity: Regressing independent variables on each other
Coefficientsa
Model
Unstandardized
Coefficients
Standardized
Coefficients t Sig.
Collinearity
Statistics
B Std. Error Beta Tolerance VIF
1
(Constant) 1.003E-013 .064 .000 1.000
ZPBC_MEAN145_ORIG .234 .088 .224 2.675 .008 .891 1.122
ZATT_MEAN356_ORIG .320 .086 .310 3.696 .000 .891 1.122
a. Dependent Variable: ZSN_MEAN1234_ORIG
© 2014 University of Pretoria. All rights reserved. The copyright in this work vests in the University of Pretoria.
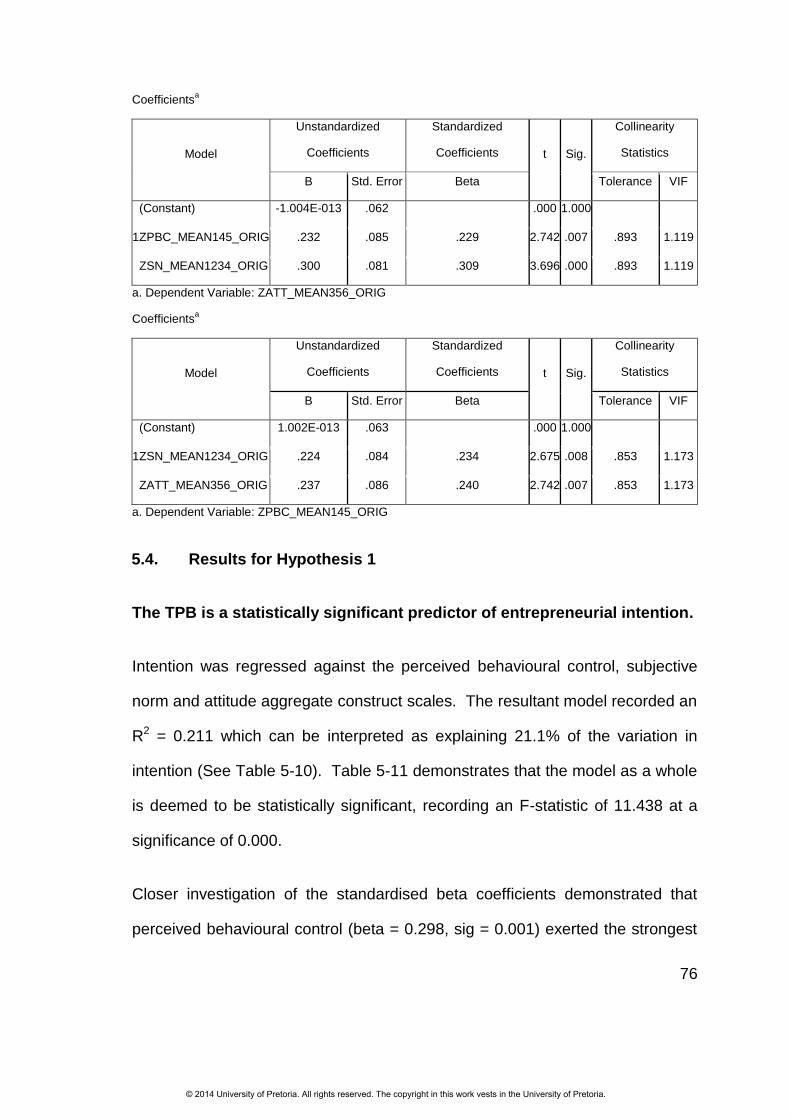
76
Coefficientsa
Model
Unstandardized
Coefficients
Standardized
Coefficients t Sig.
Collinearity
Statistics
B Std. Error Beta Tolerance VIF
1
(Constant) -1.004E-013 .062 .000 1.000
ZPBC_MEAN145_ORIG .232 .085 .229 2.742 .007 .893 1.119
ZSN_MEAN1234_ORIG .300 .081 .309 3.696 .000 .893 1.119
a. Dependent Variable: ZATT_MEAN356_ORIG
Coefficientsa
Model
Unstandardized
Coefficients
Standardized
Coefficients t Sig.
Collinearity
Statistics
B Std. Error Beta Tolerance VIF
1
(Constant) 1.002E-013 .063 .000 1.000
ZSN_MEAN1234_ORIG .224 .084 .234 2.675 .008 .853 1.173
ZATT_MEAN356_ORIG .237 .086 .240 2.742 .007 .853 1.173
a. Dependent Variable: ZPBC_MEAN145_ORIG
5.4. Results for Hypothesis 1
The TPB is a statistically significant predictor of entrepreneurial intention.
Intention was regressed against the perceived behavioural control, subjective
norm and attitude aggregate construct scales. The resultant model recorded an
R2 = 0.211 which can be interpreted as explaining 21.1% of the variation in
intention (See Table 5-10). Table 5-11 demonstrates that the model as a whole
is deemed to be statistically significant, recording an F-statistic of 11.438 at a
significance of 0.000.
Closer investigation of the standardised beta coefficients demonstrated that
perceived behavioural control (beta = 0.298, sig = 0.001) exerted the strongest
© 2014 University of Pretoria. All rights reserved. The copyright in this work vests in the University of Pretoria.
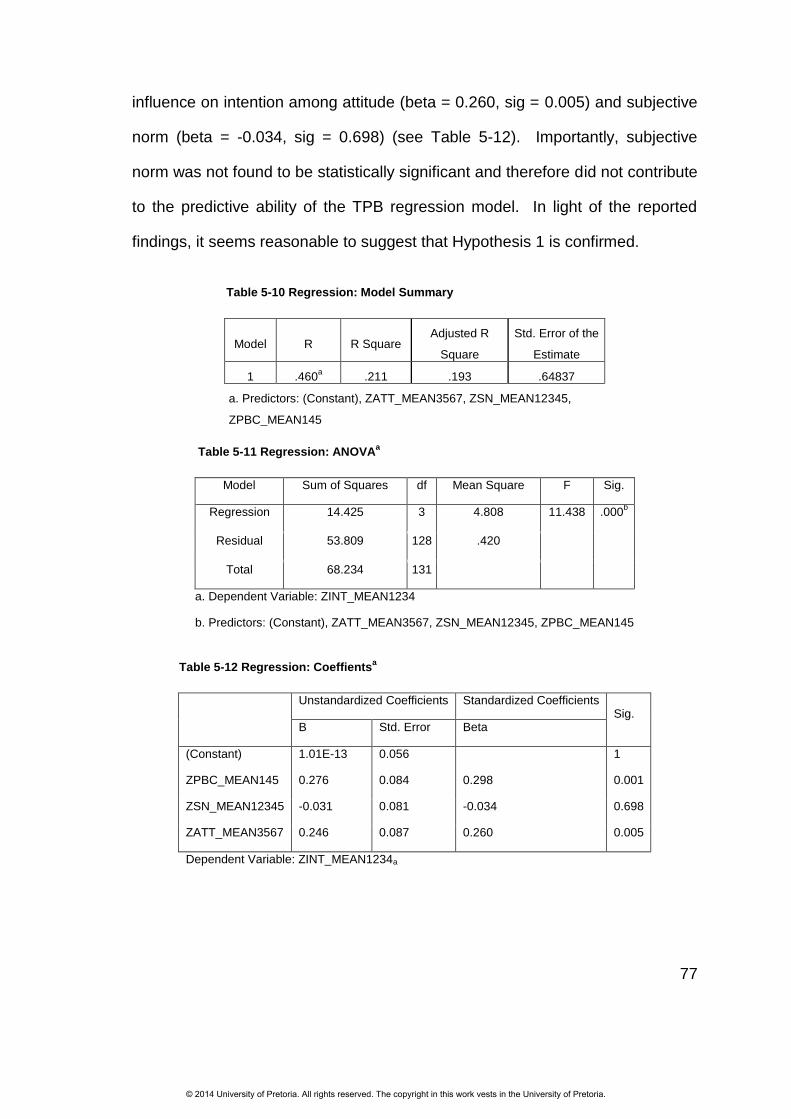
77
influence on intention among attitude (beta = 0.260, sig = 0.005) and subjective
norm (beta = -0.034, sig = 0.698) (see Table 5-12). Importantly, subjective
norm was not found to be statistically significant and therefore did not contribute
to the predictive ability of the TPB regression model. In light of the reported
findings, it seems reasonable to suggest that Hypothesis 1 is confirmed.
Table 5-10 Regression: Model Summary
Model R R Square Adjusted R
Square
Std. Error of the
Estimate
1 .460a .211 .193 .64837
a. Predictors: (Constant), ZATT_MEAN3567, ZSN_MEAN12345,
ZPBC_MEAN145
Table 5-11 Regression: ANOVAa
Model Sum of Squares df Mean Square F Sig.
Regression 14.425 3 4.808 11.438 .000b
Residual 53.809 128 .420
Total 68.234 131
a. Dependent Variable: ZINT_MEAN1234
b. Predictors: (Constant), ZATT_MEAN3567, ZSN_MEAN12345, ZPBC_MEAN145
Table 5-12 Regression: Coeffientsa
Unstandardized Coefficients Standardized Coefficients Sig.
B Std. Error Beta
(Constant) 1.01E-13 0.056 1
ZPBC_MEAN145 0.276 0.084 0.298 0.001
ZSN_MEAN12345 -0.031 0.081 -0.034 0.698
ZATT_MEAN3567 0.246 0.087 0.260 0.005
Dependent Variable: ZINT_MEAN1234a
© 2014 University of Pretoria. All rights reserved. The copyright in this work vests in the University of Pretoria.

78
5.5. Results for Hypothesis 2
Demographic variables will not add predictive ability to the TPB when
predicting entrepreneurial intent.
A hierarchical regression was performed to record the marginal benefit derived
from the addition of demographic variables to the TPB. The change in R2
explained 6.9% more of the total variation in intentions (new R2 = 0.281) as
indicated in Table 5-13. The result is statistically significant (Sig. F = 0.022 <
0.05) and is thus deemed to add to the explanatory power of the initial model.
Table 5-14 demonstrates that the model as a whole, comprised of TPB and
demographic variables is deemed to be statistically significant, recording an F-
statistic of 6.912 at a significance of 0.000
Table 5-13 Hierarchical Regression: TPB and Demographic Variables
Step R R Square Adjusted R
Square
Std. Error of the
Estimate
Change Statistics
R Square
Change F Change df1 df2
Sig. F
Change
1 .460a .211 .193 .64837 .211 11.438 3 128 .000
2 .530b .281 .240 .62915 .069 2.985 4 124 .022
a. Predictors: (Constant), ZATT_MEAN3567, ZSN_MEAN12345, ZPBC_MEAN145
b. Predictors: (Constant), ZATT_MEAN3567, ZSN_MEAN12345, ZPBC_MEAN145, AGE,
GENDER_GLOB, RACE_GLOB_B, RACE_GLOB_W
Table 5-14 Hierarchical Regression: ANOVAa
Model Sum of Squares df Mean Square F Sig.
Regression 19.151 7 2.736 6.912 .000c
Residual 49.083 124 .396
Total 68.234 131
a. Dependent Variable: ZINT_MEAN1234
© 2014 University of Pretoria. All rights reserved. The copyright in this work vests in the University of Pretoria.
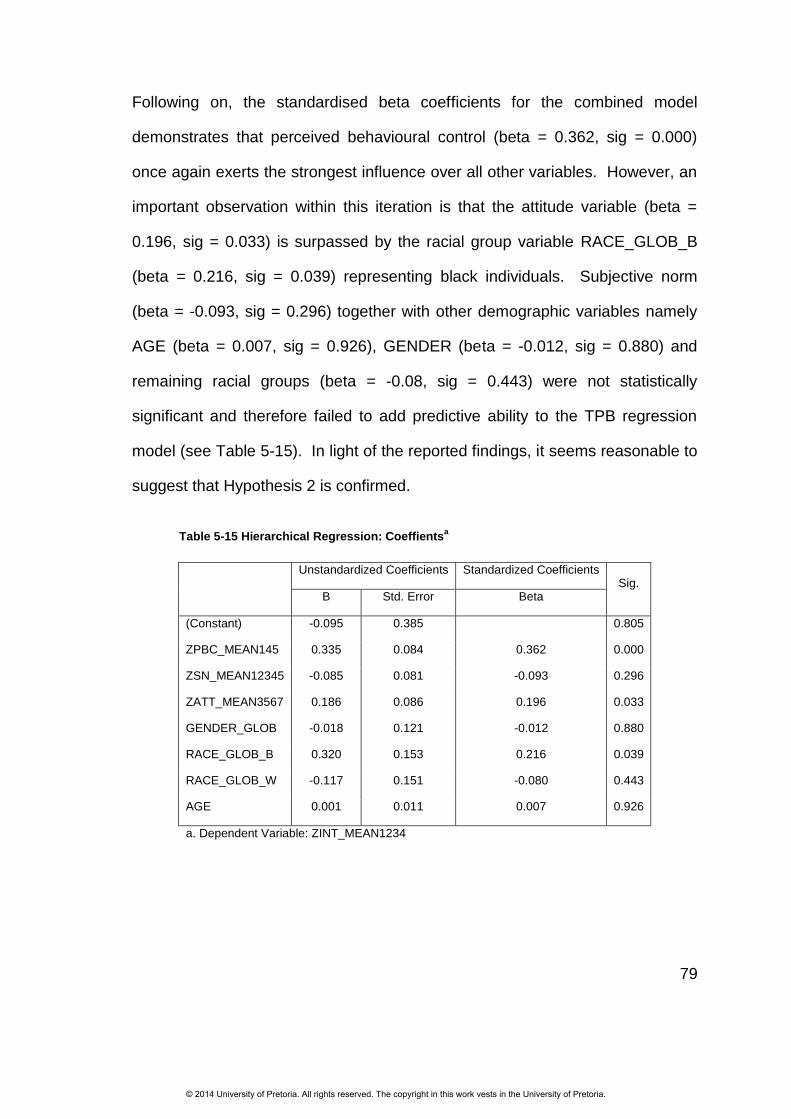
79
Following on, the standardised beta coefficients for the combined model
demonstrates that perceived behavioural control (beta = 0.362, sig = 0.000)
once again exerts the strongest influence over all other variables. However, an
important observation within this iteration is that the attitude variable (beta =
0.196, sig = 0.033) is surpassed by the racial group variable RACE_GLOB_B
(beta = 0.216, sig = 0.039) representing black individuals. Subjective norm
(beta = -0.093, sig = 0.296) together with other demographic variables namely
AGE (beta = 0.007, sig = 0.926), GENDER (beta = -0.012, sig = 0.880) and
remaining racial groups (beta = -0.08, sig = 0.443) were not statistically
significant and therefore failed to add predictive ability to the TPB regression
model (see Table 5-15). In light of the reported findings, it seems reasonable to
suggest that Hypothesis 2 is confirmed.
Table 5-15 Hierarchical Regression: Coeffientsa
Unstandardized Coefficients Standardized Coefficients Sig.
B Std. Error Beta
(Constant) -0.095 0.385
0.805
ZPBC_MEAN145 0.335 0.084 0.362 0.000
ZSN_MEAN12345 -0.085 0.081 -0.093 0.296
ZATT_MEAN3567 0.186 0.086 0.196 0.033
GENDER_GLOB -0.018 0.121 -0.012 0.880
RACE_GLOB_B 0.320 0.153 0.216 0.039
RACE_GLOB_W -0.117 0.151 -0.080 0.443
AGE 0.001 0.011 0.007 0.926
a. Dependent Variable: ZINT_MEAN1234
© 2014 University of Pretoria. All rights reserved. The copyright in this work vests in the University of Pretoria.
80
6. DISCUSSION
6.1. Introduction
The previous chapter served to present the results from the statistical analysis.
In this chapter, the findings of the research in relation to the research questions
will be discussed.
The research questions and hypotheses were developed from the propositions
that centred on a dominant theme within the literature. This theme was:
approaches to predicting entrepreneurial activity and ranged from trait to
demographic to psychological (intentional models) models. The research used
a mono method design with quantitative techniques of analysis applied to a
cross-sectional study sample.
Data gathering was achieved through survey questionnaires and were used to
validate the constructs identified within the literature. The purpose of the
research was to test the significance of a theoretical framework within a specific
contextual setting. The data analysis process was therefore designed to
address and answer all two hypotheses in hope to achieve the intended
research objective.
6.2. Discussion of Hypothesis 1
The TPB is a statistically significant predictor of entrepreneurial intention.
The TPB regression model as a whole comprised of perceived behavioural
control, subjective norm and attitude explained 21.1% of the variation in
intention. This result confirms much of the findings from prior research but it is
© 2014 University of Pretoria. All rights reserved. The copyright in this work vests in the University of Pretoria.
81
worth noting that the explanatory power of the model is markedly lower than
results from prior research. Recapping, Tkachev and Kolvereid (1999) recorded
an R2 = 0.45; Krueger et al.‟s (2000) R2 = 0.35; Autio et al.‟s (2001) R2 = 0.214
for their Swedish sub-group and 0.353 for the USA group; Van Gelderen et al.‟s
(2008) R2 = 0.38 and finally Gird and Bagraim‟s (2008) R2 = 0.27. These
findings potentially confirm statistics from the GEM report (Turton & Herrington,
2012) stating that SA‟s rate of entrepreneurial intention at 14% is markedly
lower than the average of 27% for efficiency driven economies. Alternatively it
could simply imply that the TBP‟s antecedent variables are less important
predictors of entrepreneurial intention within a South African context.
Results for the antecedent variables show that perceived behavioural control
significantly influences intentions beyond the contribution of subjective norm
and attitude. Perceived behavioural control as measured by the standardised
beta coefficients of the regression output recorded a beta of 0.298 at
significance level of 0.00. This result was expected given the strong and
significant bivariate correlation with intentions. Once again, the significant beta
weighting is not an uncommon findings within prior research (Autio et al., 2001;
Kolvereid, 1996; Krueger et al., 2000; Tkachev & Kolvereid, 1999; Van
Gelderen et al., 2008); it demonstrates that the degree of perceived control over
the behaviour for the population represented within this study is more important
than subjective norm and attitude in predicting entrepreneurial intentions.
Subjective norm on the other hand failed to contribute to the predictive ability of
the global model (beta = -0.034, sig = 0.698). The finding once again was not
surprising as the bivariate correlation with intention as explained in chapter 5
© 2014 University of Pretoria. All rights reserved. The copyright in this work vests in the University of Pretoria.
82
was reported to be weak. Similar findings have been recorded within prior
studies (Autio et al., 2001; Krueger et al., 2000) and in large there seems to be
little agreement on the significance of subjective norm as valuable contributor to
the TPB. Some studies go as far as suggesting that in its absence, the
remaining variables are synonymous with those within the SEE (Shapero‟s
Entrepreneurial Event model) (Krueger et al., 2000) and therefore question the
relevance of the TPB.
Interestingly, the samples within these studies comprised of participants who
were likely more mature (measured in age) than the undergraduate participants
typically employed within most other intentional oriented studies. More
specifically, Krueger et al. (2000) refers to senior business students with a
broad range of experiences, intentions and attitudes toward entrepreneurship.
Autio et al. (2001) on the other hand does not provide insight into the average
age of their MBA participants, but one could postulate that at a post graduate
level, individuals are likely to have developed a greater degree of critical
reasoning and are less likely to act upon a decision based on social pressure
from referent groups. If this is in fact the case, then one should find that
subjective norm is negatively correlated with age and would therefore have less
of an influence on intention for older individuals.
The attention construct on the other hand was found to have a statistically
significant influence on intentions. The relative strength of the variable as
measured by the standardised beta coefficients of the regression output
recorded a beta of 0.260 at a significance level of 0.005. Attitudes therefore
ranked second to perceived behavioural control and higher than subjective
© 2014 University of Pretoria. All rights reserved. The copyright in this work vests in the University of Pretoria.
83
norm. Once again this finding is not dissimilar to prior studies (Autio et al.,
2001; Kolvereid, 1996; Krueger et al., 2000; Tkachev & Kolvereid, 1999) where
the attitude variable demonstrated the second most predictive influence on
entrepreneurial intention. On the other hand, in a recent study Gird and
Bagraim (2008) found that attitude was significantly more predictive than PBC
and concluded that their participants were less perturbed about their ability to
start a business or the opinions of important referents with regard to new
venture creation. Reflecting on the earlier argument relating to participants age;
their findings could likely be a consequence of a sample comprised of younger
participants. Younger participants may not have developed their critical
reasoning to the extent that the risks and reward consequences of
entrepreneurship are thoroughly understood.
In summary, two of the TPB antecedent variables significantly explained
variations in intentions. Subjective norm representing the third antecedent
variable failed to provide any statistically significant contribution the theory.
Similar findings in prior studies have lead researchers to question if their results
disconfirm the TPB; however Ajzen (2011) explains that the relative importance
of each component within the theory is expected to vary across behaviours and
situations. Therefore in some applications, attitude alone may have a
significant impact on intentions; in others attitude and perceived behavioural
control will demonstrate significant impact and finally in others, all three
components namely attitude, subjective norm and perceived behavioural control
are likely to make significant contributions. In light of this observation, we will
© 2014 University of Pretoria. All rights reserved. The copyright in this work vests in the University of Pretoria.
84
continue on the premise that the theory holds as a testable theory driven
method.
In conclusion, the TPB and its antecedent variables as a whole explained a
significant amount of the variation in intention. These findings were
synonymous with those from prior research which serves as confirmatory
support for the TPB as a significant predictor of entrepreneurial intention. In
light of the aforementioned, hypothesis 1 is confirmed, concluding that the TPB
is a significant predictor of the entrepreneurial intention.
6.3. Discussion of Hypothesis 2
Demographic variables will not add predictive ability to the TPB when
predicting entrepreneurial intent.
As a prelude to this section, Ajzen (1991) explains that a model that is sufficient
contains all the important variables in the set of determinants and therefore
accounts for all the non-error variance in the behaviour. It then stands to
reason that if any other factor can be found to have a significant residual effect
beyond the predictor variables within the TPB, then it would imply that there are
other important factors that have not been accounted for within the theory.
Hypothesis 2 would be tested by adding demographic variables to the
regression equation that already contained the theory‟s antecedent variables.
To recap, the advantage of following this methodology is that it allowed for the
researcher to observe the marginal gain (in explained variation) derived from
the addition of demographics variables. The change in R2 from the addition of
© 2014 University of Pretoria. All rights reserved. The copyright in this work vests in the University of Pretoria.
85
demographic variables explained 6.9% more of the total variation in intentions
at a significance of Sig. F = 0.022 < 0.05. This is a substantial finding because
it suggests that the demographic variables have a significant residual effect
beyond the predictor variables within the TPB.
A close inspection of the individual regression coefficients, demonstrate that
RACE_GLOB_B (black individuals) is the only significant contributor for the
block of demographic variables. This is a significant finding and is seemingly
unique to the contextual setting of this research. Race (beta = 0.216, sig =
0.039) in this instance proves to have a stronger influence on intention than
attitude (beta = 0.196, sig = 0.033) as measured by their standardised beta
coefficients. To the researchers knowledge, there have been no studies
pertaining to the TPB that demonstrates race to have a greater direct influence
on intentions than any of the theory‟s antecedent variables.
Henley (2007) may offer an explanation for this finding, claiming that individual‟s
“…who are members from minority groups are more likely to display
entrepreneurial aspirations…” (p. 260). Hagen and Massachusetts Institute of
Technology, Center for International Studies (1962) suggest a possible
explanation for the relationship as being a consequence of discrimination and
deprivation. Although black citizens of SA are not a minority group, they were
subject to a system of racial segregation prior to 1994, whereby their rights
were severely curtailed. Theorising, could social and economic exclusion have
pushed black individuals to necessity-driven entrepreneurship and in doing so,
have fostered an entrepreneurial disposition within the group?
© 2014 University of Pretoria. All rights reserved. The copyright in this work vests in the University of Pretoria.
86
Preisendörfer, Bitz, and Bezuidenhout (2012) claim that there is a lack of black
entrepreneurship within SA which is likely explained by legacy constraints
imposed on financial, human, cultural and social capital under the segregation
regime. Their findings suggest that education plays an important role in
improving ones perception of self-efficacy that serves as a catalyst for black
entrepreneurial participation. Participants within this study are educated and in
the process of completing an MBA program which is designed to equip students
with an understanding of the business environment. That said, if education is
the common denominator, then one would expect all racial groups within this
study to have an equal entrepreneurial disposition and influence on intention.
The result then leads one to believe that there are other factors influencing a
greater entrepreneurial disposition above level of education.
The researcher postulates that the current economic environment within SA
provides favourable opportunities for black individuals to engage in economic
activity. Black economic empowerment is an example thereof, designed to
redress the imbalances of the past by transferring more ownership,
management and control of SA‟s financial and economic resources to the
majority of its citizens (Nieman & Nieuwenhuizen, 2009), more specifically
previously disadvantaged citizens. These authors go on to explain that black
economic empowerment is a reality of doing business within SA and if one
intends to do business with a government, parastatal or with a firm (or firms)
doing business with these entities, then it would be necessary to transform ones
business in order to maintain contracts into the future.
© 2014 University of Pretoria. All rights reserved. The copyright in this work vests in the University of Pretoria.
87
Recapping on the literature, Ajzen (1991) claims that the TPB captures the
influence of external factors on intention through its predictor variables, namely
perceived behavioural control, subjective norm and attitude. This author goes
on to explain that opportunities available to an individual, contributes to ones
perception of behavioural control. Supporters are thus likely to claim that the
influence of race (more specifically the opportunities available to black
individuals) is sufficiently captured within one of the TPB predictor variables. To
validate these claims, each of the TPB predictor variables was regressed on the
race variables and remaining TPB variables. Although the results prove that
race (black individuals) is statistically significant, it is distinctly weaker when
compared to the influence of race on intentions as measured by their
standardised beta coefficients. This then confirms that the influence of race
within the contextual setting of this research is not fully captured by the TPB
predictor variables.
Following on and addressing the outcome for the remaining demographic
variables; findings for age and gender are synonymous with prior studies having
largely shown that gender (Davidsson, 1995; Kristiansen & Indarti, 2004;
Tkachev & Kolvereid, 1999) and age (Gird & Bagraim, 2008; Kristiansen &
Indarti, 2004) are not significant predictors of entrepreneurial intention. Gird
and Bagraim (2008) on the other hand in a separate regression analysis of
entrepreneurial intent on demographic variables, reported a statistically
significant but extremely weak relationship with intentions. This weak
association is likely due to the fact that demographics are thought only to
influence intent through their effect on behavioural, normative, and control
© 2014 University of Pretoria. All rights reserved. The copyright in this work vests in the University of Pretoria.
88
beliefs (Ajzen, 1991). In light of the findings within this section, hypothesis 2 is
not confirmed. Demographic variables could possibly add predictive ability to
the TPB when predicting entrepreneurial intent within the context of an
emerging economy.
6.4. Conclusion
Hypothesis 1 was supported, concluding that the TPB was a significant
predictor of entrepreneurial intention. This finding was not dissimilar to those
from prior research (Autio et al., 2001; Gird & Bagraim, 2008; Krueger et al.,
2000; Tkachev & Kolvereid, 1999; Van Gelderen et al., 2008) and serves as
confirmatory support for its broad applicability within a diverse range of
contextual settings (e.g. applicability within developed and developing
economies).
Hypothesis 2 was not supported as it was found that race (black individual)
could possibly add to predictive ability to the TPB when predicting
entrepreneurial intent. Although a significant finding, it remains unclear if being
a black individual is more indicative of developing entrepreneurial intentions due
to inherent characteristics or qualities; or if being black in SA provides
opportunities created through economic privileges superior to those available to
other racial groups. If one considers that prior research has found little
evidence to support race as valid predictor (Ghazali, Ibrahim, & Zainol, 2012;
Wang & Wong, 2004), it leads one to believe that the South African political
intervention may have created a form of empowerment through favourable
opportunities only available to a specific group of individuals. These
© 2014 University of Pretoria. All rights reserved. The copyright in this work vests in the University of Pretoria.

89
opportunities could make entrepreneurship an attractive form of employment for
black individuals within SA.
In closing, this chapter served to discuss the result of the research in relation to
the literature and the proposed hypotheses. Important findings were noted and
possible explanations for their occurrence were proposed. The following
chapter will serve to recap on the research objective and limitations of the
study, thereafter highlighting the key findings and provide recommendation to
for future research.
© 2014 University of Pretoria. All rights reserved. The copyright in this work vests in the University of Pretoria.

90
7. CONCLUSION
7.1. Introduction
The previous chapter served the discuss the results of the research in relation
to the literature and hypotheses. The following chaper serves to recap on the
research objectives; highlights the key findings in turn providing
recommendations for key stakeholders. It then proceeds to recap on the
research limitations and suggestions for future research before closing with
concluding remarks.
7.2. Background and Objectives
SA seems to be locked into a paradigm of poor economic output with no
foreseeable end in plain sight. Despite optimistic goals set out within the
national development plan, the unemployment trends seem to be immune to
any form of intervention implemented to date. The country‟s employment
practices are highly unsustainable, evidenced by the bloated public service
sector and a private sector which has failed to positively contribute to
employment grow since 1994. In light of these circumstances it is evident that
an alternative source of job creation is of utmost importance for both individuals
and commercial enterprise.
Entrepreneurship could be seen as the alternative source for new job creation
within SA. Disappointingly however, findings from the GEM report suggest that
the general level of intention to engage in entrepreneurial activity within SA is
far below the average of other efficiency driven economies. If entrepreneurial
intention is truly a precursor for entrepreneurial activity, then it goes without
© 2014 University of Pretoria. All rights reserved. The copyright in this work vests in the University of Pretoria.
91
saying that stakeholders should be interested with the factors that influence
intentionality. The TPB according to Ajzen (1991) is widely reported to be a
significant predictor of entrepreneurial intentions and offers the opportunity of
using a testable, theory driven method to validate intentional oriented studies. If
the theory is proven to be a significant predictor within a diverse range of
contextual settings, then it could possibly be used as a frame work to tailor
policy design that promotes the entrepreneurial agenda in the most efficient way
possible.
With that said, the objective of the present study was to validate the TPB‟s
applicability i.e. if the model was a significant predictor of intentions; and
secondly to test its sufficiency i.e. are there any other factors that are more
important in predicting intentions than those accounted for within the theory.
The study targets subjects who are arguably older; hold more experience and
who are more ethnically diverse than those in most prior research. Importantly,
the study occurs within the context of a developing economy, and intends to
combine construct measurement scales from two studies in an attempt to
improve measurement reliability.
7.3. Summary of Key Findings
The TPB was proven to be a significant predictor of entrepreneurial intention.
An important finding was that the theory‟s antecedent variables failed to explain
as much of the variation in intention when compared to priors studies. This
likely corroborates claims that SA‟s level of entrepreneurial intention is below
that of other efficiency driven economies. A closer look at the antecedent
© 2014 University of Pretoria. All rights reserved. The copyright in this work vests in the University of Pretoria.
92
variables shows that perceived behavioural control exerts the strongest
influence on intention, followed shortly thereafter by attitude and finally,
subjective norm failing to contribute to the prediction of entrepreneurial
intentions.
Following on, demographic variables were found to have a significant residual
effect beyond the predictor variables of the TPB and as such could suggest that
the theory does not sufficiently predict intentions as expected. Upon closer
inspection of the individual demographic variables, it became evident that race,
in particular black individuals was the only statistically significant contributor
among age, gender and other racial groups to the prediction of entrepreneurial
intention.
This raised the question if being a black individual is more indicative of
developing entrepreneurial intentions due to some inherent characteristic or
quality; or if being a black individual in SA provides opportunities created
through economic privileges superior to those available to other racial groups.
The researcher postulates the South African political intervention may have
empowered black individuals by creating favourable opportunities not available
to individuals from other racial groups. These opportunities may have made
entrepreneurship an attractive form of employment for the group within SA and
are seemingly not captured by the TPB predictor variables as expected.
© 2014 University of Pretoria. All rights reserved. The copyright in this work vests in the University of Pretoria.
93
7.4. Implications of Research Findings
The implications of the research findings can broadly be categorised into three
key areas namely public policy, educational institutions and performance
management opportunities.
The TPB has proven to be a significant predictor of entrepreneurial intention
within the context of an emerging economy. The implication for public policy
makers is that entrepreneurship has to be perceived as both desirable and
feasible before individuals can develop intentions to engage in entrepreneurial
activity (Krueger et al., 2000). Gird and Bagraim (2008) suggest that the TPB
can be used as a diagnostic tool to identify areas in need of development that
could promote and in turn lead to an increase in entrepreneurial intention.
Explained by means of an example; if it was known that non-black racial groups
were not engaging in entrepreneurial activity then the TPB could be used as
tool to determine if perceived behavioural control, subjective norm or attitude
toward the behaviour were impeding their intentions. Appropriate measures
could thereafter be implemented to address any adverse perception of
entrepreneurship.
Implementation of these measures could settle within the educational system
where academic programs should be designed to reduce the adverse
perceptions of entrepreneurship. Autio et al. (2001) believes that the career
preferences of university students can be influenced and that students tend to
gravitate toward fashionable career options. It then stands to reason that if
academic programs could be implementation at a primary and secondary
© 2014 University of Pretoria. All rights reserved. The copyright in this work vests in the University of Pretoria.
94
school level, then the act of entrepreneurship could be institutionalised as a
legitimate career alternative from early childhood development. Finally, policy
design is only effective if delivers what it intends to deliver. The TPB could thus
be used as performance management tool to assess the efficiency of policy
design and operational execution. Antecedent variables could be measured on
a pre-test and post-test basis to observe improvements in attitudes toward
entrepreneurship.
7.5. Research Limitations
A review on the research limitations indicate that the cross sectional research
design precludes a longitudinal design that may have determined causality
(Sutherland & Jordaan, 2004). Further, the nature of the non-probability
sampling technique prohibited the assertion that the sample is representative of
the population. Similarly, although multiple regression analysis assumptions
were largely achieved, the non-probabilistic sampling technique violated a
multiple regression assumption and it was therefore advised to continue with
caution. Importantly, the sample excludes individuals who are currently not
formally employed and therefore the findings cannot be generalisable to this
segment of the population. This limitation is an unfortunate consequence of
accessing mature (older) individuals who are facing vocational decisions. It can
be explained that older individuals have a higher propensity to already be
employed in a formal capacity.
© 2014 University of Pretoria. All rights reserved. The copyright in this work vests in the University of Pretoria.

95
7.6. Suggestions for Future Research
Future studies could focus on improving operational limitations as discussed in
the preceding section, or attempt to build on the findings as presented within
study. Firstly, one could improve on aggregate measurement scales. The
study found that scale reliability in prior research had been deteriorating over
recent years and as such, the researcher tried to incorporate measurement
scales from multiple studies in an attempt to remedy. Unfortunately, results did
not demonstrate any improvement and should be used as cue for future studies
to develop and test new measurement scales.
Secondly, sampling could be extended to include full-time MBA students who
would usually be unemployed at the point in time when the research is
conducted. These individuals are unable to be formally employed as their study
curriculum requires their full-time attendance throughout the traditional work
week. The benefit of introducing these participants is that it would mitigate
concerns regarding applicability to a broad spectrum of South African citizens,
which in turn would strengthen the research findings.
Finally, findings from this research suggest that race (black individuals) present
a significant influence in the prediction of entrepreneurial intentions. Future
studies could validate if race (black South African‟s) presents a stronger
influence on intentions because of the unique personal qualities or
characteristics of the individual, or if it is a function of the opportunities that have
been made available to this group. One could possibly employ a conjoint
analysis which creates an experimental design to construct hypothetical
© 2014 University of Pretoria. All rights reserved. The copyright in this work vests in the University of Pretoria.
96
alternatives such that one can estimate the importance for each of the attributes
using statistical methods (Bakken & Frazier, 2006). This implies that
hypothetical opportunities could be presented to participants and their response
recorded and compared for differences across race groups.
7.7. Conclusion
The TPB was proven to be a significant predictor of entrepreneurial intention.
This suggests that policy makers have a theoretical framework to help identify
areas of policy weakness that are restricting the development of entrepreneurial
intentions. The TPB would then suffice to measure the efficiency of policy
interventions as by a pre and post-test comparison of attitudes toward
entrepreneurship.
Finally, further analysis revealed that demographic variables are found to have
a significant residual effect beyond the predictor variables within the TPB.
Closer investigation revealed that a particular racial group (black individuals)
was solely responsible for the significant influence on intentions, thus rendering
age, gender and all other racial groups as weak, insignificant contributors.
Strictly speaking, the results prove that the TPB is not sufficient in capturing all
variation in entrepreneurial intention.
© 2014 University of Pretoria. All rights reserved. The copyright in this work vests in the University of Pretoria.
97
8. REFERENCES
Ajzen, I. (1991). The theory of planned behavior. Organizational
Behavior and Human Decision Processes, 50(2), 179-211.
Ajzen, I. (2011). Icek Ajzen: Frequently asked questions. Retrieved
November 03, 2013, from
http://people.umass.edu/aizen/faq.html.
Autio, E., Keeley, R. H., Klofsten, M., Parker, G. C., & Hay, M.
(2001). Entrepreneurial intent among students in Scandinavia
and in the USA. Enterprise and Innovation Management Studies,
2(2), 145-160.
Bagiella, E. (2008). Pearson correlation coefficient. In S. Boslaugh, &
L. McNutt (Eds.), Encyclopedia of epidemiology (pp. 792-795).
Thousand Oaks, CA: SAGE Publications, Inc. doi:
10.4135/9781412953948.n342
Bakken, D., & Frazier, C. L. (2006). Conjoint analysis: Understanding
consumer decision making. In R. Grover, & M. Vriens (Eds.), The
handbook of marketing research (pp. 288-312). Thousand Oaks,
CA: SAGE Publications, Inc. doi: 10.4135/9781412973380.n15
Bird, B. (1988). Implementing entrepreneurial ideas: The case for
intention. Academy of Management Review, 13(3), 442-453.
© 2014 University of Pretoria. All rights reserved. The copyright in this work vests in the University of Pretoria.
98
Cattell, R. B. (1966). The scree test for the number of factors.
Multivariate Behavioural Research, 1(2), 245-276.
doi:10.1207/s15327906mbr0102_10
Cooper, D. R., & Schindler, P. S. (1998). Business research methods
Boston: McGraw-Hill.
Cramer, D., & Howitt, D. (2004). Multiple regression. In D. Cramer, &
D. Howitt (Eds.), The SAGE dictionary of statistics (pp. 106-108).
London: SAGE Publications, Ltd. doi: 10.4135/9780857020123
Davidsson, P. (1995). Determinants of entrepreneurial intentions.
RENT IX Workshop in Entrepreneurship Research, Piacenza,
Italy.
Davies, T. A. (2001). Entrepreneurship development in South Africa:
Redefining the role of tertiary institutions in a reconfigured higher
education system. South African Journal of Higher Education,
15(1), 32-39.
Fay, K. (2010). Homoscedasticity. In N. J. Salkind (Ed.),
Encyclopedia of research design (pp. 581-584). Thousand Oaks,
CA: SAGE Publications, Inc. doi: 10.4135/9781412961288
Gartner, W. B. (1988). "Who is an entrepreneur?" is the wrong
question. American Journal of Small Business, 12(4), 11-32.
© 2014 University of Pretoria. All rights reserved. The copyright in this work vests in the University of Pretoria.
99
Gebotys, R. (2010). Multicollinearity. In A. J. Mills, G. Durepos & E.
Wiebe (Eds.), Encyclopedia of case study research (pp. 573-
576). Thousand Oaks, CA: SAGE Publications, Inc. doi:
10.4135/9781412957397.n212
George, D., & Mallery, P. (2003). SPSS for windows step by step: A
simple guide and reference. (4th ed.). Boston: Allyn & Bacon.
Ghazali, Z., Ibrahim, N. A., & Zainol, F. A. (2012). Factors affecting
entrepreneurial intention among UniSZA students. Asian Social
Science, 9(1), 85-93. doi:10.5539/ass.v9n1p85
Gird, A., & Bagraim, J. J. (2008). The theory of planned behaviour as
predictor of entrepreneurial intent amongst final-year university
students. South African Journal of Psychology, 38(4), 711-724.
Hagen, E. E., & Massachusetts Institute of Technology. Center for
International Studies. (1962). On the theory of social change:
How economic growth begins. Homewood, Illinois: Dorsey
Press.
Henley, A. (2007). Entrepreneurial aspiration and transition into self-
employment: Evidence from British longitudinal data.
Entrepreneurship & Regional Development, 19(3), 253-280.
doi:10.1080/08985620701223080
© 2014 University of Pretoria. All rights reserved. The copyright in this work vests in the University of Pretoria.
100
Jupp, V. (2006). Quantitative research. The sage dictionary of social
research methods. London, England: SAGE Publications, Ltd.
doi:10.4135/9780857020116
Kao, R. W. (1989). Entrepreneurship and enterprise development.
Toronto: Holt, Rinehart & Winston of Canada Ltd.
Katz, J., & Gartner, W. B. (1988). Properties of emerging
organizations. Academy of Management Review, 13(3), 429-
441.
Kimberlin, C. L., & Winterstein, A. G. (2008). Validity and reliability of
measurement instruments used in research. American Journal of
Health-System Pharmacy, 65(23), 2276-2284.
Kolvereid, L. (1996). Prediction of employment status choice
intentions. Entrepreneurship: Theory & Practice, 21(1), 47-57.
Koster, S., & Rai, S. K. (2008). Entrepreneurship and economic
development in a developing country A case study of India.
Journal of Entrepreneurship, 17(2), 117-137.
doi:10.1177/097135570801700202
Kristiansen, S., & Indarti, N. (2004). Entrepreneurial intention among
Indonesian and Norwegian students. Journal of Enterprising
Culture, 12(1), 55-78.
© 2014 University of Pretoria. All rights reserved. The copyright in this work vests in the University of Pretoria.
101
Krueger, N. F., & Brazeal, D. V. (1994). Entrepreneurial potential and
potential entrepreneurs. Entrepreneurship: Theory & Practice,
18(3), 91-104.
Krueger, N. F., & Carsrud, A. L. (1993). Entrepreneurial intentions:
Applying the theory of planned behaviour. Entrepreneurship &
Regional Development, 5(4), 315-330.
Krueger, N. F., Reilly, M. D., & Carsrud, A. L. (2000). Competing
models of entrepreneurial intentions. Journal of Business
Venturing, 15(5), 411-432.
Leedy, P. D., & Ormrod, J. E. (2010). Practical research: Planning
and design (9th ed.). New Jersey: Merrill.
Lewicki, P., & Hill, T. (2006). Statistics: Methods and applications: A
comprehensive reference for science, industry, and data mining
(1st ed.). Tulsa, OK: Statsoft.
Lewis-Beck, M. S., Bryman, A., & Liao, T. F. (2004). Unit of analysis.
The sage encyclopedia of social science research methods (pp.
1158-1159) Sage.
Louw, L., Van Eeden, S., Bosch, J., & Venter, D. (2003).
Entrepreneurial traits of undergraduate students at selected
South African tertiary institutions. International Journal of
Entrepreneurial Behaviour & Research, 9(1), 5-26.
© 2014 University of Pretoria. All rights reserved. The copyright in this work vests in the University of Pretoria.
102
Lüthje, C., & Franke, N. (2003). The 'making' of an entrepreneur:
Testing a model of entrepreneurial intent among engineering
students at MIT. R&D Management, 33(2), 135-147.
doi:10.1111/1467-9310.00288
Mitchell, B. (2006). Entrepreneurship education in South Africa: A
nationwide survey. Education & Training, 48(5), 348-359.
Nieman, G., & Nieuwenhuizen, C. (2009). Entrepreneurship: A South
African perspective (2nd ed.). Pretoria: Van Schaik.
Norman, G. (2010). Likert scales, levels of measurement and the
“laws” of statistics. Advances in Health Sciences Education,
15(5), 625-632.
Nunnally, J. C., & Bernstein, I. H. (1994). Psychometric theory (3rd
ed.). New York: McGraw- Hill.
Pearson, R. W. (2010). Chapter 12 Detecting and correcting
violations of regression assumptions. Statistical persuasion: How
to collect, analyze, and present data… accurately, honestly, and
persuasively (pp. 287-305). Thousand Oaks, CA: SAGE
Publications, Inc. doi: 10.4135/9781452230122.n12
Preisendörfer, P., Bitz, A., & Bezuidenhout, F. J. (2012). In search of
black entrepreneurship: Why is there a lack of entrepreneurial
activity among the black population in South Africa? Journal of
© 2014 University of Pretoria. All rights reserved. The copyright in this work vests in the University of Pretoria.

103
Developmental Entrepreneurship, 17(1), 1-18. doi:
10.1142/S1084946712500069
Rodriguez, W. (2007). Box plot (box and whisker plot). In N. J.
Salkind, & K. Rasmussen (Eds.), Encyclopedia of measurement
and statistics (pp. 112-114). Thousand Oaks, CA: Sage
Publications, Inc. doi: 10.4135/9781412952644.n62
Salkind, N. J. (2010a). Factor loadings. Encyclopedia of research
design (pp. 481-484) Sage Publications, Inc.
doi:10.4135/9781412961288
Salkind, N. J. (2010b). Principal components analysis. Encyclopedia
of research design (pp. 1098-1103) Sage Publications, Inc. doi:
10.4135/9781412961288
SARB. (2013). South African Reserve Bank: Quarterly bulletin. ( No.
267).South African Reserve Bank.
Saunders, M., & Lewis, P. (2012). Doing research in business and
management: An essential guide to planning your project.
Harlow: Prentice Hall.
Sautet, F. (2013). Local and systemic entrepreneurship: Solving the
puzzle of entrepreneurship and economic development.
Entrepreneurship: Theory & Practice, 37(2), 387-402.
doi:10.1111/j.1540-6520.2011.00469.x
© 2014 University of Pretoria. All rights reserved. The copyright in this work vests in the University of Pretoria.

104
Schwandt, T. A. (2007). Descriptive statistics. The SAGE dictionary
of qualitative inquiry (pp. 67-67) SAGE Publications, Inc.
doi:10.4135/9781412986281
Segrin, C. (2010). Multiple regression. In N. J. Salkind (Ed.),
Encyclopedia of research design (pp. 845-850). Thousand Oaks,
CA: SAGE Publications, Inc. doi: 10.4135/9781412961288.n253
Shapero, A., & Sokol, L. (1982). The social dimensions of
entrepreneurship. In C. Kent (Ed.), Encyclopedia of
entrepreneurship (pp. 72-90). Englewood Cliffs: Prentice-Hall.
Shapiro, J. K. (2008). Z-score. In P. J. Lavrakas (Ed.), Encyclopedia
of survey research methods (pp. 969-970). Thousand Oaks, CA:
SAGE Publications, Inc. doi: 10.4135/9781412963947.n639
StatsSA. (2013). Quarterly labour force survey. (No.
P0211).Statistics South Africa.
Sutherland, M., & Jordaan, W. (2004). Factors affecting the retention
of knowledge workers. SA Journal of Human Resource
Management, 2(2), 55-64.
Tavakol, M., & Dennick, R. (2011). Making sense of Cronbach's
alpha. International Journal of Medical Education, 2, 53-55.
doi:10.5116/ijme.4dfb.8dfd
© 2014 University of Pretoria. All rights reserved. The copyright in this work vests in the University of Pretoria.
105
Taylor, S. E. (2008). Z score. In S. Boslaugh, & L. McNutt (Eds.),
Encyclopedia of epidemiology (pp. 1110-1112). Thousand Oaks,
CA: SAGE Publications, Inc. doi: 10.4135/9781412953948.n486
Tkachev, A., & Kolvereid, L. (1999). Self-employment intentions
among Russian students. Entrepreneurship & Regional
Development, 11(3), 269-280.
Trobia, A. (2008). Cronbach's alpha. In P. J. Lavrakas (Ed.),
Encyclopedia of survey research methods (pp. 169-171).
Thousand Oaks, CA: SAGE Publications, Inc. doi:
10.4135/9781412963947.n117
Turton, N., & Herrington, M. (2012). Global entrepreneurship monitor
2012 South Africa. Cape Town: UCT Graduate School of
Business.
University of Northern Iowa. (2010). SPSS techniques series:
Statistics on Likert scale surveys. Retrieved 03, 2013, from
http://www.uni.edu/its/support/article/604
Van Gelderen, M., Brand, M., van Praag, M., Bodewes, W.,
Poutsma, E., & van Gils, A. (2008). Explaining entrepreneurial
intentions by means of the theory of planned behaviour. Career
Development International, 13(6), 538-559.
Vogt, W. P. (2005). Hierarchical regression analysis. In W. Paul Vogt
(Ed.), Dictionary of statistics & methodology (pp. 144-144).
© 2014 University of Pretoria. All rights reserved. The copyright in this work vests in the University of Pretoria.

106
Thousand Oaks, CA: SAGE Publications, Inc. doi:
10.4135/9781412983907.n889
Wang, C. K., & Wong, P. K. (2004). Entrepreneurial interest of
university students in Singapore. Technovation, 24(2), 163-172.
doi: 10.1016/S0166-4972(02)00016-0
Weiers, R. M. (2010). Introductory to business statistics (7th ed.)
Cengage Learning.
Wong, P. K., Ho, Y. P., & Autio, E. (2005). Entrepreneurship,
innovation and economic growth: Evidence from GEM data.
Small Business Economics, 24(3), 335-350.
WorldBank. (2013). South Africa overview. Retrieved 06, 2013, from
www.worldbank.org/en/country/southafrica/overview
© 2014 University of Pretoria. All rights reserved. The copyright in this work vests in the University of Pretoria.
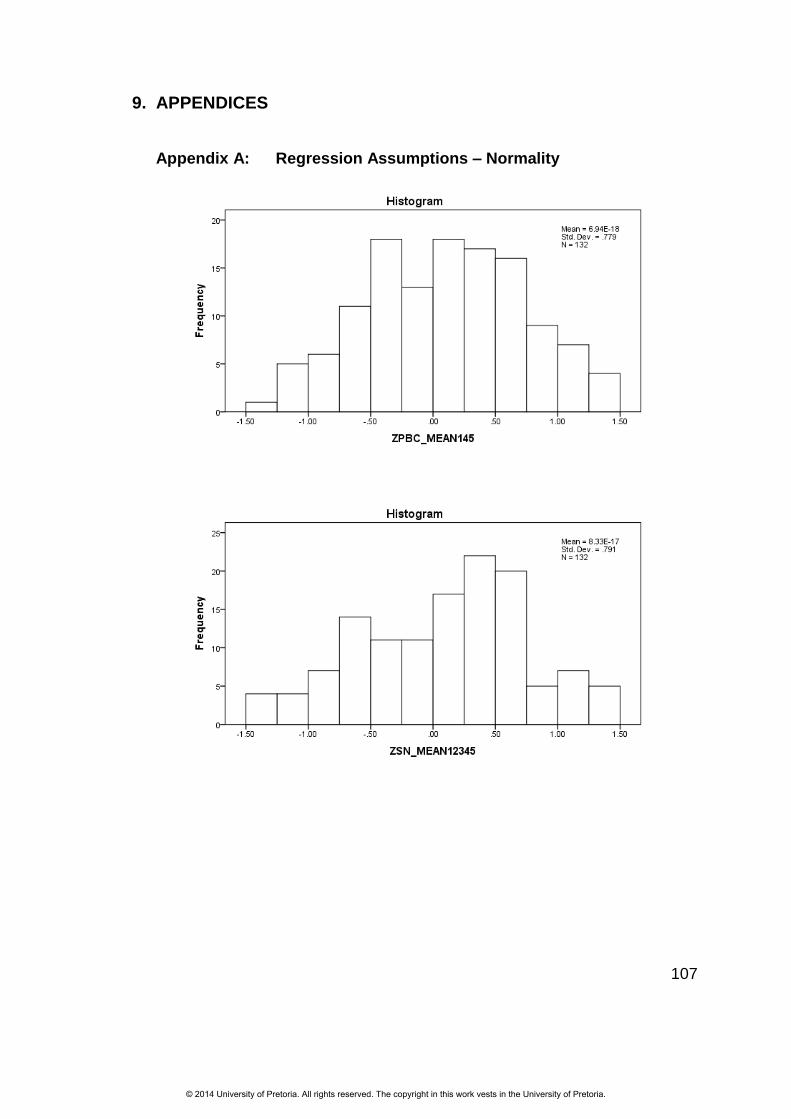
107
9. APPENDICES
Appendix A: Regression Assumptions – Normality
© 2014 University of Pretoria. All rights reserved. The copyright in this work vests in the University of Pretoria.
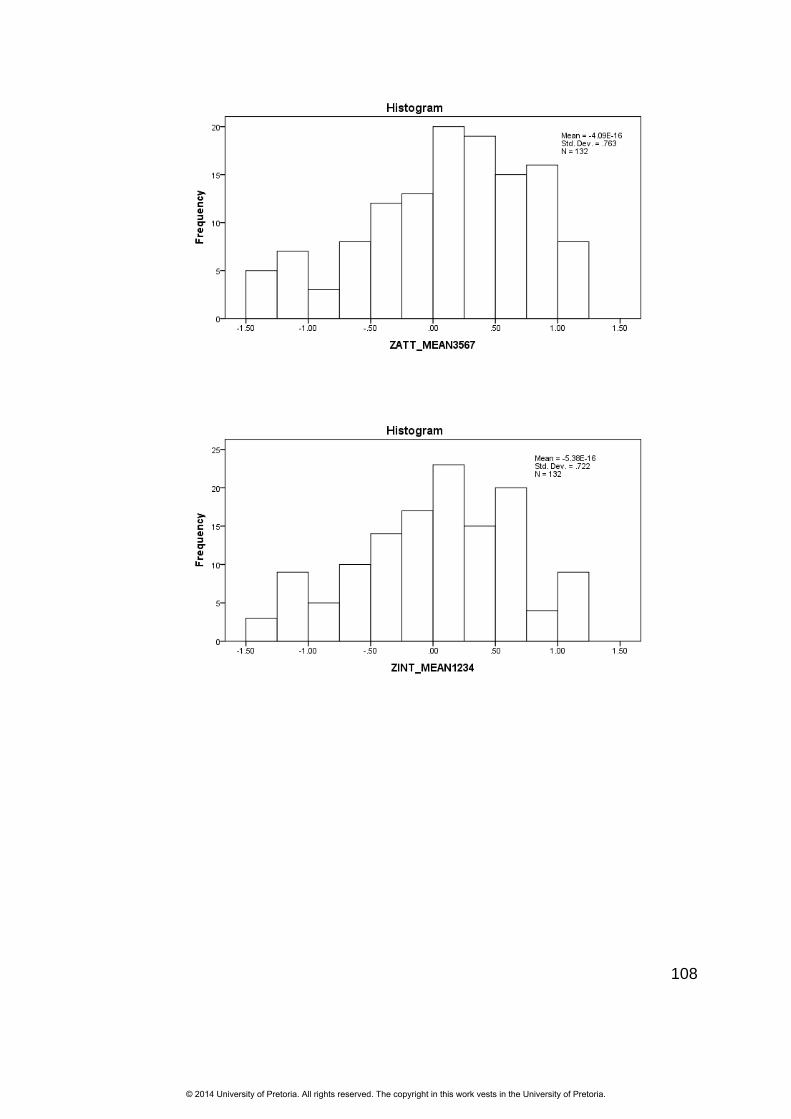
108
© 2014 University of Pretoria. All rights reserved. The copyright in this work vests in the University of Pretoria.

109
Appendix B: Survey Questionnaire
© 2014 University of Pretoria. All rights reserved. The copyright in this work vests in the University of Pretoria.
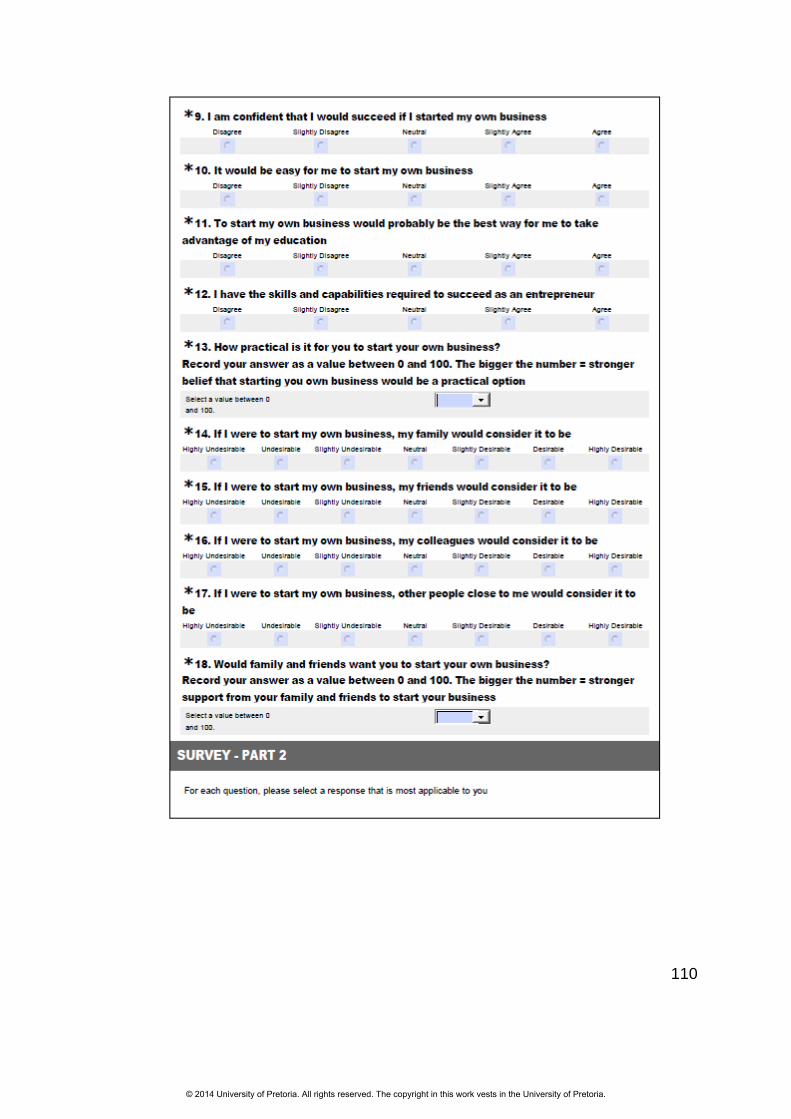
110
© 2014 University of Pretoria. All rights reserved. The copyright in this work vests in the University of Pretoria.
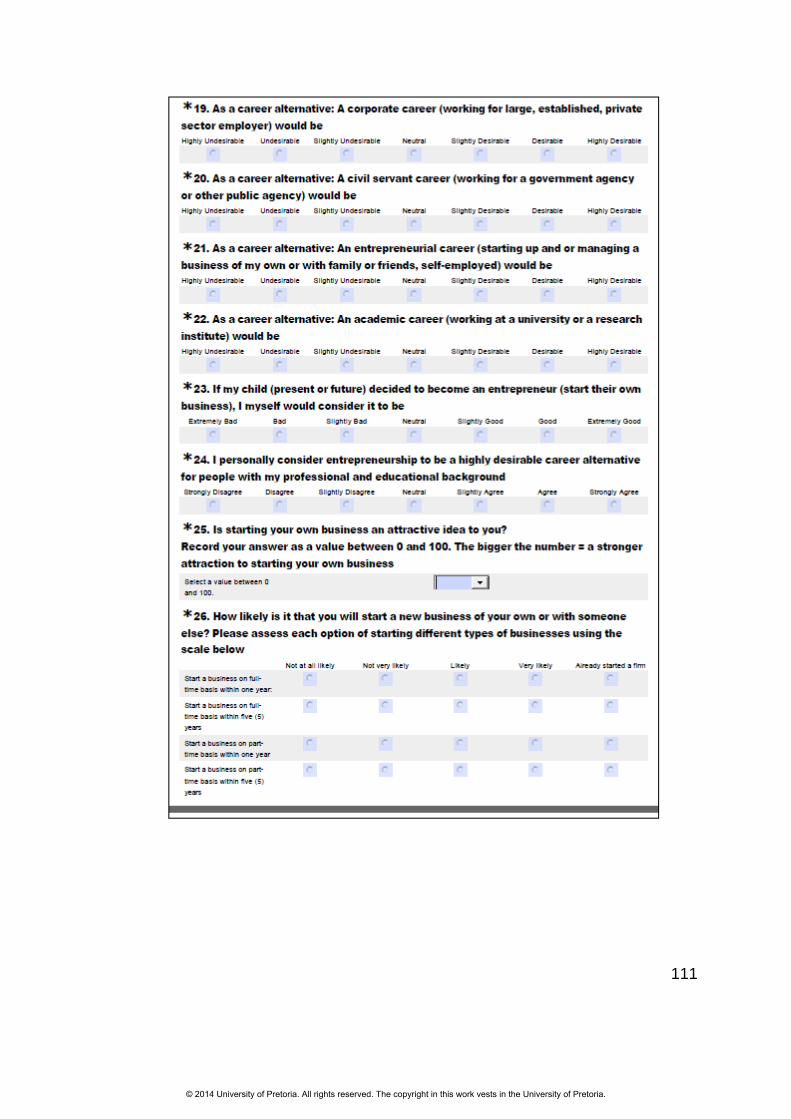
111
© 2014 University of Pretoria. All rights reserved. The copyright in this work vests in the University of Pretoria.

112
Appendix C: SPSS Syntax
**** RUN EXCLUSIONS.
USE ALL.
COMPUTE filter_$=(EActivity = 1 & Exclusion = 0).
VARIABLE LABELS filter_$ 'EActivity = 1 & Exclusion = 0
(FILTER)'.
VALUE LABELS filter_$ 0 'Not Selected' 1 'Selected'.
FORMATS filter_$ (f1.0).
FILTER BY filter_$.
EXECUTE.
**** DESCRIPTIVE STATISTICS.
**** CATEGORICAL VARIABLES.
FREQUENCIES VARIABLES=Gender Race SEC IND
/ORDER=ANALYSIS.
**** CONTINUOUS VARIABLES.
DESCRIPTIVES VARIABLES=Age YExperience NEmployees
/STATISTICS=MEAN STDDEV MIN MAX.
**** STANDARDISING ALL SCALES (FOR PURPOSES OF OUTLIER ANALYSIS).
**** CREATING Z-PBC’S (PERCEIVED BEHAVIOURAL CONTROL).
DESCRIPTIVES VARIABLES= PBC1 PBC2 PBC3 PBC4 PBC5
/SAVE
/STATISTICS=MEAN STDDEV MIN MAX.
**** CREATING Z-SN’S (SUBJECTIVE NORM).
DESCRIPTIVES VARIABLES= SN1 SN2 SN3 SN4 SN5
/SAVE
/STATISTICS=MEAN STDDEV MIN MAX.
**** CREATING Z-ATT’S (ATTITUDE TOWARD THE BEHAVIOUR).
DESCRIPTIVES VARIABLES=ATT1 ATT2 ATT3 ATT4 ATT5 ATT6 ATT7
/SAVE
/STATISTICS=MEAN STDDEV MIN MAX.
**** CREATING Z-INT’S (INTENTION).
DESCRIPTIVES VARIABLES= INT1 INT2 INT3 INT4
/SAVE
/STATISTICS=MEAN STDDEV MIN MAX.
**** OUTLIER ANALYSIS – INDIVIDUAL MEASUREMENT ITEMS.
**** ZPBC (PERCEIVED BEHAVIOURAL CONTROL).
EXAMINE VARIABLES=ZPBC1 ZPBC2 ZPBC3 ZPBC4 ZPBC5
/COMPARE VARIABLE
/PLOT=BOXPLOT
/STATISTICS=NONE
/NOTOTAL
/ID=SurveyCode
/MISSING=LISTWISE.
**** ZSN (SUBJECTIVE NORM).
EXAMINE VARIABLES=ZSN1 ZSN2 ZSN3 ZSN4 ZSN5
/COMPARE VARIABLE
/PLOT=BOXPLOT
/STATISTICS=NONE
/NOTOTAL
/ID=SurveyCode
/MISSING=LISTWISE.
**** ZATT (ATTITUDE TOWARD THE BEHAVIOUR).
EXAMINE VARIABLES=ZATT1 ZATT2 ZATT3 ZATT4 ZATT5 ZATT6 ZATT7
/COMPARE VARIABLE
/PLOT=BOXPLOT
© 2014 University of Pretoria. All rights reserved. The copyright in this work vests in the University of Pretoria.

113
/STATISTICS=NONE
/NOTOTAL
/ID=SurveyCode
/MISSING=LISTWISE.
**** ZINT (INTENTION).
EXAMINE VARIABLES=ZINT1 ZINT2 ZINT3 ZINT4
/COMPARE VARIABLE
/PLOT=BOXPLOT
/STATISTICS=NONE
/NOTOTAL
/ID=SurveyCode
/MISSING=LISTWISE.
**** PRINCIPLE COMPONENTS ANALYSIS WITH VERIMAX ROTATION –
INDIVIDUAL MEASUREMENT ITEMS.
FACTOR
/VARIABLES ZPBC1 ZPBC2 ZPBC3 ZPBC4 ZPBC5 ZSN1 ZSN2 ZSN3 ZSN4
ZSN5 ZATT3 ZATT5 ZATT6 ZATT7 ZINT1 ZINT2 ZINT3 ZINT4
/MISSING PAIRWISE
/ANALYSIS ZPBC1 ZPBC2 ZPBC3 ZPBC4 ZPBC5 ZSN1 ZSN2 ZSN3 ZSN4
ZSN5 ZATT3 ZATT5 ZATT6 ZATT7 ZINT1 ZINT2 ZINT3 ZINT4
/PRINT INITIAL KMO EXTRACTION ROTATION FSCORE
/PLOT EIGEN
/CRITERIA FACTORS(4) ITERATE(25)
/EXTRACTION PC
/CRITERIA ITERATE(25)
/ROTATION VARIMAX
/METHOD=CORRELATION.
**** CORRELATION ANALYSIS – INDIVIDUAL MEASUREMENT ITEMS.
CORRELATIONS
/VARIABLES=ZPBC1 ZPBC2 ZPBC3 ZPBC4 ZPBC5 ZSN1 ZSN2 ZSN3 ZSN4
ZSN5 ZATT3 ZATT5 ZATT6 ZATT7 ZINT1 ZINT2 ZINT3 ZINT4
/PRINT=TWOTAIL NOSIG
/STATISTICS DESCRIPTIVES
/MISSING=PAIRWISE.
**** INTERNAL RELIABILITY – CRONBACH’S ALPHA – INDIVIDUAL
MEASUREMENT ITEMS.
**** PERCEIVED BEHAVIOURAL CONTROL.
RELIABILITY
/VARIABLES=PBC1 PBC2 PBC3 PBC4
/SCALE('PBC1234') ALL
/MODEL=ALPHA
/STATISTICS=DESCRIPTIVE SCALE
/SUMMARY=TOTAL MEANS VARIANCE CORR.
RELIABILITY
/VARIABLES=ZPBC1 ZPBC2 ZPBC3 ZPBC4
/SCALE('Z_PBC1234') ALL
/MODEL=ALPHA
/STATISTICS=DESCRIPTIVE SCALE
/SUMMARY=TOTAL MEANS VARIANCE CORR.
RELIABILITY
/VARIABLES=ZPBC1 ZPBC2 ZPBC3 ZPBC4 ZPBC5
/SCALE('Z_PBC12345') ALL
/MODEL=ALPHA
/STATISTICS=DESCRIPTIVE SCALE
/SUMMARY=TOTAL MEANS VARIANCE CORR.
RELIABILITY
/VARIABLES=ZPBC1 ZPBC4 ZPBC5
© 2014 University of Pretoria. All rights reserved. The copyright in this work vests in the University of Pretoria.

114
/SCALE('Z_PBC145') ALL
/MODEL=ALPHA
/STATISTICS=DESCRIPTIVE SCALE
/SUMMARY=TOTAL MEANS VARIANCE CORR.
**** SUBJECTIVE NORM.
RELIABILITY
/VARIABLES=SN1 SN2 SN3 SN4
/SCALE('SN1234') ALL
/MODEL=ALPHA
/STATISTICS=DESCRIPTIVE SCALE
/SUMMARY=TOTAL MEANS VARIANCE CORR.
RELIABILITY
/VARIABLES=ZSN1 ZSN2 ZSN3 ZSN4
/SCALE('Z_SN1234') ALL
/MODEL=ALPHA
/STATISTICS=DESCRIPTIVE SCALE
/SUMMARY=TOTAL MEANS VARIANCE CORR.
RELIABILITY
/VARIABLES=ZSN1 ZSN2 ZSN3 ZSN4 ZSN5
/SCALE('Z_SN12345') ALL
/MODEL=ALPHA
/STATISTICS=DESCRIPTIVE SCALE
/SUMMARY=TOTAL MEANS VARIANCE CORR.
**** ATTENTION.
RELIABILITY
/VARIABLES=ZATT3 ZATT5 ZATT6
/SCALE('Z_ATT356') ALL
/MODEL=ALPHA
/STATISTICS=DESCRIPTIVE SCALE
/SUMMARY=TOTAL MEANS VARIANCE CORR.
RELIABILITY
/VARIABLES=ZATT3 ZATT5 ZATT6 ZATT7
/SCALE('Z_ATT3567') ALL
/MODEL=ALPHA
/STATISTICS=DESCRIPTIVE SCALE
/SUMMARY=TOTAL MEANS VARIANCE CORR.
**** INTENTION.
RELIABILITY
/VARIABLES=INT1 INT2
/SCALE('INT12') ALL
/MODEL=ALPHA
/STATISTICS=DESCRIPTIVE SCALE
/SUMMARY=TOTAL MEANS VARIANCE CORR.
RELIABILITY
/VARIABLES=INT3 INT4
/SCALE('INT34') ALL
/MODEL=ALPHA
/STATISTICS=DESCRIPTIVE SCALE
/SUMMARY=TOTAL MEANS VARIANCE CORR.
RELIABILITY
/VARIABLES=INT1 INT2 INT3 INT4
/SCALE('INT1234') ALL
/MODEL=ALPHA
/STATISTICS=DESCRIPTIVE SCALE
/SUMMARY=TOTAL MEANS VARIANCE CORR.
RELIABILITY
/VARIABLES=ZINT1 ZINT2
© 2014 University of Pretoria. All rights reserved. The copyright in this work vests in the University of Pretoria.

115
/SCALE('ZINT12') ALL
/MODEL=ALPHA
/STATISTICS=DESCRIPTIVE SCALE
/SUMMARY=TOTAL MEANS VARIANCE CORR.
RELIABILITY
/VARIABLES=ZINT3 ZINT4
/SCALE('ZINT34') ALL
/MODEL=ALPHA
/STATISTICS=DESCRIPTIVE SCALE
/SUMMARY=TOTAL MEANS VARIANCE CORR.
RELIABILITY
/VARIABLES=ZINT1 ZINT2 ZINT3 ZINT4
/SCALE('ZINT1234') ALL
/MODEL=ALPHA
/STATISTICS=DESCRIPTIVE SCALE
/SUMMARY=TOTAL MEANS VARIANCE CORR.
**** CREATING DEPENDENT AND INDEPENDENT VARIABLES (THERE IS NO
DIFFERENCE BETWEEN USING A MEAN OR SUM OF INDIVIDUAL LIKERT ITEMS IN
THE CORRELATION OR REGRESSION ANALYSIS. RESULTS ARE EQUAL).
**** INDEPENDENT VARIABLES ~ COMPOSITE MEASUREMENT SCALES (AUTIO AND
KRUEGER).
COMPUTE ZPBC_MEAN145 = MEAN(ZPBC1, ZPBC4, ZPBC5).
EXECUTE.
COMPUTE ZSN_MEAN12345 = MEAN(ZSN1, ZSN2, ZSN3, ZSN4, ZSN5).
EXECUTE.
COMPUTE ZATT_MEAN3567 = MEAN(ZATT3, ZATT5, ZATT6, ZATT7).
EXECUTE.
**** INDEPENDENT VARIABLES ~ AUTIO’S ORIGINAL MEASUREMENT SCALES.
COMPUTE ZPBC_MEAN145_ORIG = MEAN(ZPBC1, ZPBC4, ZPBC5).
EXECUTE.
COMPUTE ZSN_MEAN1234_ORIG = MEAN(ZSN1, ZSN2, ZSN3, ZSN4).
EXECUTE.
COMPUTE ZATT_MEAN356_ORIG = MEAN(ZATT3, ZATT5, ZATT6).
**** DEPENDENT VARIABLES ~ AUTIO’S ORIGINAL MEASUREMENT SCALE.
COMPUTE ZINT_MEAN1234 = MEAN(ZINT1, ZINT2, ZINT3, ZINT4).
EXECUTE.
**** CREATING DUMMY VARIABLES FOR NOMINAL VARIABLES (#DUMMY
VARIABLES = N-1).
RECODE GENDER (1=0) (2=1) INTO GENDER_GLOB.
EXECUTE.
RECODE SEC (1=0) (2=1) INTO SEC_GLOB.
EXECUTE.
RECODE RACE (1=0) (2=1) (3=0) (4=0) (5=0) (6=0) INTO
RACE_GLOB_B.
EXECUTE.
RECODE RACE (1=0) (2=0) (3=0) (4=0) (5=1) (6=0) INTO
RACE_GLOB_W.
EXECUTE.
COMPUTE RACE_GLOB_OTHER=1-RACE_GLOB_B - RACE_GLOB_W.
EXECUTE.
**** CORRELATION ANALYSIS – AGGREGATE CONSTRUCT SCALE.
CORRELATIONS
/VARIABLES=ZPBC_MEAN145 ZSN_MEAN12345 ZATT_MEAN3567
ZINT_MEAN1234
/PRINT=TWOTAIL NOSIG
/STATISTICS DESCRIPTIVES
/MISSING=PAIRWISE.
© 2014 University of Pretoria. All rights reserved. The copyright in this work vests in the University of Pretoria.

116
**** LINEARITY – REGRESSION ASSUMPTION – AGGREGATE CONSTRUCT SCALE.
GGRAPH
/GRAPHDATASET NAME="graphdataset" VARIABLES=ZPBC_MEAN145
ZSN_MEAN12345 ZATT_MEAN3567
ZINT_MEAN1234 MISSING=LISTWISE REPORTMISSING=NO
/GRAPHSPEC SOURCE=INLINE.
BEGIN GPL
SOURCE: s=userSource(id("graphdataset"))
DATA: ZPBC_MEAN145=col(source(s), name("ZPBC_MEAN145"))
DATA: ZSN_MEAN12345=col(source(s), name("ZSN_MEAN12345"))
DATA: ZATT_MEAN3567=col(source(s), name("ZATT_MEAN3567"))
DATA: ZINT_MEAN1234=col(source(s), name("ZINT_MEAN1234"))
GUIDE: axis(dim(1.1), ticks(null()))
GUIDE: axis(dim(2.1), ticks(null()))
GUIDE: axis(dim(1), gap(0px))
GUIDE: axis(dim(2), gap(0px))
TRANS: ZPBC_MEAN145_label = eval("ZPBC_MEAN145")
TRANS: ZSN_MEAN12345_label = eval("ZSN_MEAN12345")
TRANS: ZATT_MEAN3567_label = eval("ZATT_MEAN3567")
TRANS: ZINT_MEAN1234_label = eval("ZINT_MEAN1234")
ELEMENT:
point(position((ZPBC_MEAN145/ZPBC_MEAN145_label+ZSN_MEAN12345/
ZSN_MEAN12345_label+
ZATT_MEAN3567/ZATT_MEAN3567_label+ZINT_MEAN1234/ZINT_MEAN1234_
label)*
(ZPBC_MEAN145/ZPBC_MEAN145_label+ZSN_MEAN12345/ZSN_MEAN12345_l
abel+
ZATT_MEAN3567/ZATT_MEAN3567_label+ZINT_MEAN1234/ZINT_MEAN1234_
label)))
END GPL.
**** HOMOSCEDASTICITY – REGRESSION ASSUMPTION - AGGREGATE CONSTRUCT
SCALE.
* BREUSCH-PAGAN & KOENKER TEST MACRO *
* See 'Heteroscedasticity: Testing and correcting in SPSS'
* by Gwilym Pryce, for technical details.
* Code by Marta Garcia-Granero 2002/10/28.
* The MACRO needs 3 arguments:
* the dependent, the number of predictors and the list of predictors
* (if they are consecutive, the keyword TO can be used) .
* (1) MACRO definition (select an run just ONCE).
* Ho: Homoscedastic.
* H1: Not Homoscedastic
DEFINE bpktest(!POSITIONAL !TOKENS(1) /!POSITIONAL !TOKENS(1)
/!POSITIONAL !CMDEND).
* Regression to get the residuals and residual plots.
REGRESSION
/STATISTICS R ANOVA
/DEPENDENT !1
/METHOD=ENTER !3
/SCATTERPLOT=(*ZRESID,*ZPRED)
/RESIDUALS HIST(ZRESID) NORM(ZRESID)
/SAVE RESID(residual) .
do if $casenum=1.
print /"Examine the scatter plot of the residuals to detect"
© 2014 University of Pretoria. All rights reserved. The copyright in this work vests in the University of Pretoria.

117
/"model misspecification and/or heteroscedasticity"
/""
/"Also, check the histogram and np plot of residuals "
/"to detect non normality of residuals "
/"Skewness and kurtosis more than twice their SE indicate non-
normality ".
end if.
* Checking normality of residuals.
DESCRIPTIVES
VARIABLES=residual
/STATISTICS=KURTOSIS SKEWNESS .
* New dependent variable (g) creation.
COMPUTE sq_res=residual**2.
compute constant=1.
AGGREGATE
/OUTFILE='tempdata.sav'
/BREAK=constant
/rss = SUM(sq_res)
/N=N.
MATCH FILES /FILE=*
/FILE='tempdata.sav'.
EXECUTE.
if missing(rss) rss=lag(rss,1).
if missing(n) n=lag(n,1).
compute g=sq_res/(rss/n).
execute.
* BP&K tests.
* Regression of g on the predictors.
REGRESSION
/STATISTICS R ANOVA
/DEPENDENT g
/METHOD=ENTER !3
/SAVE RESID(resid) .
*Final report.
do if $casenum=1.
print /" BP&K TESTS"
/" ==========".
end if.
* Routine adapted from Gwilym Pryce.
matrix.
compute p=!2.
get g /variables=g.
get resid /variables=resid.
compute sq_res2=resid&**2.
compute n=nrow(g).
compute rss=msum(sq_res2).
compute ii_1=make(n,n,1).
compute i=ident(n).
compute m0=i-((1/n)*ii_1).
compute tss=transpos(g)*m0*g.
compute regss=tss-rss.
print regss
/format="f8.4"
/title="Regression SS".
print rss
/format="f8.4"
/title="Residual SS".
© 2014 University of Pretoria. All rights reserved. The copyright in this work vests in the University of Pretoria.

118
print tss
/format="f8.4"
/title="Total SS".
compute r_sq=1-(rss/tss).
print r_sq
/format="f8.4"
/title="R-squared".
print n
/format="f4.0"
/title="Sample size (N)".
print p
/format="f4.0"
/title="Number of predictors (P)".
compute bp_test=0.5*regss.
print bp_test
/format="f8.3"
/title="Breusch-Pagan test for Heteroscedasticity"
+ " (CHI-SQUARE df=P)".
compute sig=1-chicdf(bp_test,p).
print sig
/format="f8.4"
/title="Significance level of Chi-square df=P (H0:"
+ "homoscedasticity)".
compute k_test=n*r_sq.
print k_test
/format="f8.3"
/title="Koenker test for Heteroscedasticity"
+ " (CHI-SQUARE df=P)".
compute sig=1-chicdf(k_test,p).
print sig
/format="f8.4"
/title="Significance level of Chi-square df=P (H0:"
+ "homoscedasticity)".
end matrix.
!ENDDEFINE.
* x1 is the dependent and x2 TO x20 the predictors.
* (3) MACRO CALL (select and run).
BPKTEST ZINT_MEAN1234 3 ZPBC_MEAN145 ZSN_MEAN12345
ZATT_MEAN3567.
**** MULTICOLINEARITY – REGRESSION ASSUMPTION - AGGREGATE CONSTRUCT
SCALE.
**** TOLERANCE METHOD (WHERE TOLERANCE > 1-R2 = 0.1).
**** ZSN_MEAN12345 DEPENDENT VARIABLE.
REGRESSION
/DESCRIPTIVES MEAN STDDEV CORR SIG N
/MISSING LISTWISE
/STATISTICS COEFF OUTS R ANOVA ZPP COLLIN TOL
/CRITERIA=PIN(.05) POUT(.10)
/NOORIGIN
/DEPENDENT ZSN_MEAN12345
/METHOD=ENTER ZPBC_MEAN145 ZATT_MEAN3567.
**** ZATT_MEAN3567 DEPENDENT VARIABLE.
REGRESSION
/DESCRIPTIVES MEAN STDDEV CORR SIG N
/MISSING LISTWISE
© 2014 University of Pretoria. All rights reserved. The copyright in this work vests in the University of Pretoria.

119
/STATISTICS COEFF OUTS R ANOVA ZPP COLLIN TOL
/CRITERIA=PIN(.05) POUT(.10)
/NOORIGIN
/DEPENDENT ZATT_MEAN3567
/METHOD=ENTER ZPBC_MEAN145 ZSN_MEAN12345.
**** ZPBC_MEAN145 DEPENDENT VARIABLE.
REGRESSION
/DESCRIPTIVES MEAN STDDEV CORR SIG N
/MISSING LISTWISE
/STATISTICS COEFF OUTS R ANOVA ZPP COLLIN TOL
/CRITERIA=PIN(.05) POUT(.10)
/NOORIGIN
/DEPENDENT ZPBC_MEAN145
/METHOD=ENTER ZATT_MEAN3567 ZSN_MEAN12345.
**** MULTIPLE REGRESSION ANALYSIS.
**** REGRESSING TPB.
REGRESSION
/MISSING LISTWISE
/STATISTICS COEFF OUTS R ANOVA
/CRITERIA=PIN(.05) POUT(.10)
/NOORIGIN
/DEPENDENT ZINT_MEAN1234
/METHOD=ENTER ZPBC_MEAN145 ZSN_MEAN12345 ZATT_MEAN3567.
**** HIERARCHICAL MULTIPLE REGRESSION ANALYSIS.
REGRESSION
/DESCRIPTIVES MEAN STDDEV CORR SIG N
/MISSING LISTWISE
/STATISTICS COEFF OUTS R ANOVA CHANGE ZPP
/CRITERIA=PIN(.05) POUT(.10)
/NOORIGIN
/DEPENDENT ZINT_MEAN1234
/METHOD=ENTER ZPBC_MEAN145 ZSN_MEAN12345 ZATT_MEAN3567
/METHOD=ENTER Age GENDER_GLOB RACE_GLOB_B RACE_GLOB_W.
© 2014 University of Pretoria. All rights reserved. The copyright in this work vests in the University of Pretoria.