Embed Size (px)
Citation preview

Kennesaw State UniversityDigitalCommons@Kennesaw State University
PhD in Business Administration Dissertations Coles College of Business
Summer 5-22-2019
Entrepreneur-Venture Fit and Burnout:Moderating Effects of Entrepreneurial PassionDavid [email protected]
Follow this and additional works at: https://digitalcommons.kennesaw.edu/phdba_etd
Part of the Business Administration, Management, and Operations Commons
This Dissertation is brought to you for free and open access by the Coles College of Business at DigitalCommons@Kennesaw State University. It hasbeen accepted for inclusion in PhD in Business Administration Dissertations by an authorized administrator of DigitalCommons@Kennesaw StateUniversity. For more information, please contact [email protected].
Recommended CitationWitt, David, "Entrepreneur-Venture Fit and Burnout: Moderating Effects of Entrepreneurial Passion" (2019). PhD in BusinessAdministration Dissertations. 7.https://digitalcommons.kennesaw.edu/phdba_etd/7
ENTREPRENEUR-VENTURE FIT AND BURNOUT: MODERATING EFFECTS OF
ENTREPRENEURIAL PASSION
by
David L. Witt
A Dissertation
Presented in Partial Fulfillment of Requirements for the
Degree of
Doctor of Philosophy in Business Administration
in the Coles College of Business
Kennesaw State University
Kennesaw, GA
2019
TITLE
PAGE

Copyright by
David L. Witt
2019
COPY
RIGHT PAGE

SIGNATURE PAGE
Place Holder
SIGN
ATURE PAGE

iv
ABSTRACT
ENTREPRENEUR-VENTURE FIT AND BURNOUT: MODERATING EFFECTS OF
ENTREPRENEURIAL PASSION
by
David L. Witt
Entrepreneurial burnout is a worrying problem because it is related to reduced
performance and venture failures. Existing models do not adequately explain the causes
of burnout among entrepreneurs. Exploring the antecedents and mechanisms leading to
this significant issue can thus enhance our understanding and facilitate the design of
interventions.
This study proposes an entrepreneur-venture fit model to explain burnout among
entrepreneurs. Regulatory focus orientations of promotion and prevention are proposed as
defining the characteristics of entrepreneurs and their ventures that determine fit, and
passion is proposed to moderate fit effects.
The model was tested using a survey-based field study to collect data from a
broad range of entrepreneurs across the United States (n=308). Hierarchical linear
regression testing found that most of the proposed model is unsupported. The findings
support promotion-based fit effects on cynicism, but none on the exhaustion and
professional efficacy dimensions of burnout. The promotion focus of both the
entrepreneur and venture is found to directly reduce burnout. Prevention focus does not
affect burnout, which may be explained by a higher stressor tolerance or stronger coping
ABST
RACT

v
resources among entrepreneurs. Moderation by passion is not supported, but harmonious
passion directly affects burnout less than expected, and obsessive passion has no direct
effect. Unexpected passion effects are explained by established stressor factors from
outside the venture (i.e., work-family and family-work conflict).
The study results contribute to the extant literature and practice in several ways.
First, entrepreneurial burnout literature is expanded by this addition. Entrepreneurship
research on regulatory focus benefits from these findings regarding promotion and
prevention effects. Passion research in entrepreneurship is extended to highlight the
importance of controlling established relationships. Entrepreneurs also gain insight into
several fronts from this study. Maximizing promotion focus aspects in job design is
useful, and conflict from outside the firm, specifically from the family, is important to
address. Entrepreneurs may be more tolerant of stressors from within the firm, so less
attention may be warranted to mitigate those sources. Lastly, autonomy may be a critical
resource in defining entrepreneurs and stressor tolerance, and thus it may be important to
protect the control aspects of entrepreneurship.

vi
TABLE OF CONTENTS
TITLE PAGE ....................................................................................................................... i
COPYRIGHT PAGE .......................................................................................................... ii
SIGNATURE PAGE ......................................................................................................... iii
ABSTRACT ....................................................................................................................... iv
TABLE OF CONTENTS ................................................................................................... vi
LIST OF TABLES ............................................................................................................. ix
LIST OF FIGURES ........................................................................................................... xi
CHAPTER 1: INTRODUCTION ....................................................................................... 1
CHAPTER 2: LITERATURE REVIEW AND HYPOTHESES DEVELOPMENT ....... 10 Literature Review..................................................................................................... 11
Burnout ................................................................................................................ 11
Outcomes. ....................................................................................................... 12
Conceptualizations. ......................................................................................... 13 Maslach’s model. ...................................................................................... 13
Job demands-resources model. ................................................................. 17 Entrepreneurial burnout. ................................................................................. 21
Person-Environment Fit ...................................................................................... 26
Maslach fit model. .......................................................................................... 28 Perceived entrepreneurial fit model. ............................................................... 32
Passion ................................................................................................................. 35
Cardon: entrepreneurial passion. .................................................................... 37 Dualistic model of passion. ............................................................................. 39 Entrepreneurial passion. .................................................................................. 43
Summary ............................................................................................................. 52
Theory and Hypothesis Development ...................................................................... 53 Entrepreneur-Venture Fit .................................................................................... 54 Regulatory focus theory ...................................................................................... 55
Regulatory focus orientations. ........................................................................ 56 Hypothesis development ..................................................................................... 59
Direct promotion fit. ....................................................................................... 60 Direct prevention fit. ....................................................................................... 61 Passion as a moderator. ................................................................................... 62
TABL
E OF CONTENTS

vii
Promotion fit moderation by passion. ....................................................... 63 Prevention fit moderation by passion. ...................................................... 65
Research model ................................................................................................... 68
CHAPTER 3: RESEARCH METHODOLOGY .............................................................. 69 Research Design and Data Collection...................................................................... 69
Research Setting .................................................................................................. 69 Data Collection .................................................................................................... 71
Measures .................................................................................................................. 78 Dependent Variable ............................................................................................. 79
Burnout. .......................................................................................................... 79 Independent Variables ......................................................................................... 80
Trait regulatory foci. ....................................................................................... 80 Work regulatory foci. ...................................................................................... 82 Passions. .......................................................................................................... 84
Control Variables ................................................................................................ 85 Individual-level variables................................................................................ 85
Firm-level variables. ....................................................................................... 87 Family conflict. ............................................................................................... 89
Common Method Variance Treatment .................................................................... 90
Instrument Testing ................................................................................................... 94
Pilot Survey 1 ...................................................................................................... 94 Pilot Survey 2 .................................................................................................... 100
Data Analysis ......................................................................................................... 102
CHAPTER 4: DATA ANALYSIS AND FINDINGS .................................................... 104 Data Description .................................................................................................... 104
Sample Characteristics ...................................................................................... 104
Common Method Variance Tests ...................................................................... 108 CFA Testing of the Measurement Model .......................................................... 114 Descriptive Statistics ......................................................................................... 121 Convergent and Discriminant Validity .............................................................. 125
Hypothesis Testing................................................................................................. 127
Post hoc Analyses .............................................................................................. 148
CHAPTER 5: DISCUSSION, LIMITATIONS, AND FUTURE RESEARCH ............. 156
Discussion .............................................................................................................. 156 Is Entrepreneurial Burnout Different? ............................................................... 157 Passion ............................................................................................................... 160 Regulatory Focus ............................................................................................... 165 Summary ........................................................................................................... 169
Implications and Future Research .......................................................................... 169

viii
Contributions to Literature ................................................................................ 175 Contributions to Practice ................................................................................... 177
Limitations ............................................................................................................. 179 Conclusion ............................................................................................................. 185
REFERENCES ............................................................................................................... 187
APPENDIX ..................................................................................................................... 206
Survey Instrument – Maslach Burnout Inventory – General Survey ..................... 207 Survey Instrument – Trait Promotion Focus and Trait Prevention Focus ............. 208 Survey Instrument – Work Prevention Focus ........................................................ 209
Survey Instrument – Work Promotion Focus ........................................................ 210 Survey Instrument – Harmonious and Obsessive Passion ..................................... 211
Survey Instrument – Work-Family Conflict Scale ................................................ 212 Survey Instrument – Family-Work Conflict Scale ................................................ 212 Survey Instrument – Physical Development Scale ................................................ 213

ix
LIST OF TABLES
Table Page
1 Burnout Studies of Entrepreneurs ............................................................................... 22 2 Partial Correlations of Passion Outcomes................................................................... 43 3 Studies including Direct Measures of Passion of Entrepreneurs ................................ 45
4 Regulatory Focus Orientations ................................................................................... 58
5 Sample Size Estimation .............................................................................................. 76 6 Measurement Scales Summary ................................................................................... 78
7 Survey 1 Pilot 1 Results .............................................................................................. 95
8 Survey 1 Pilot 2 Results .............................................................................................. 98 9 Survey 1 Combined Pilot 1 and 2 Results ................................................................ 100 10 Survey 2 Pilot Results ............................................................................................... 101
11 Refined Sample Size Estimation Calculations .......................................................... 102 12 Survey 1 Results ....................................................................................................... 105
13 Survey 2 Results ....................................................................................................... 106 14 Non-Response Summary Statistics ........................................................................... 108 15 EFA-Survey 1 Model Indicators Only ...................................................................... 109
16 EFA-Survey 1 Model Indicators and Controls ......................................................... 110
17 Chi-Square, Goodness-of-Fit Values, and Model Comparison Tests ....................... 112 18 Unconstrained Model Factor Loadings: Standardized .............................................. 113 19 Baseline Model Factor Covariances ......................................................................... 114
20 CFA-Initial Factor Loadings ..................................................................................... 117 21 CFA Scale Refinement Fit ........................................................................................ 119
22 CFA-Refined Measurement Model Factor Loadings ............................................... 120
23 Descriptive Statistics and Correlations ..................................................................... 123 24 Convergent Validity Statistics .................................................................................. 126
25 Discriminant Validity Tests ...................................................................................... 127 26 Regression Results H1 Exhaustion ........................................................................... 130 27 Regression Results H1 Professional Efficacy ........................................................... 131
28 Regression Results H1 Cynicism .............................................................................. 132 29 Regression Results H2 Exhaustion ........................................................................... 134
30 Regression Results H2 Professional Efficacy ........................................................... 135 31 Regression Results H2 Cynicism .............................................................................. 136 32 Regression Results H3a Exhaustion ......................................................................... 137 33 Regression Results H3a Professional Efficacy ......................................................... 138 34 Regression Results H3a Cynicism ............................................................................ 139
35 Regression Results H3b Exhaustion ......................................................................... 140 36 Regression Results H3b Professional Efficacy ......................................................... 141 37 Regression Results H3b Cynicism ............................................................................ 142
LIST
OF TABLES
x
38 Regression Results H4a Exhaustion ......................................................................... 143 39 Regression Results H4a Professional Efficacy ......................................................... 144
40 Regression Results H4a Cynicism ............................................................................ 145 41 Regression Results H4b Exhaustion ......................................................................... 146 42 Regression Results H4b Professional Efficacy ......................................................... 147 43 Regression Results H4b Cynicism ............................................................................ 148 44 Regression Results Post Hoc Exhaustion and Passion ............................................. 150
45 Regression Results Post Hoc Professional Efficacy and Passion ............................. 151
46 Regression Results Post Hoc Cynicism and Passion ................................................ 152 47 Regression Results Post Hoc Exhaustion and Passion Controls Evaluation ............ 153
48 Regression Results Post Hoc Professional Efficacy and Passion Controls Evaluation
................................................................................................................................... 154 49 Regression Results Post Hoc Cynicism and Passion Controls Evaluation ............... 154

xi
LIST OF FIGURES
Figure Page
1 Research Model .......................................................................................................... 68 2 CFA Model Diagram ................................................................................................ 115 3 Interaction Plot: H1 Cynicism and Promotion Foci and Fit ..................................... 133
LIST
OF FIGURES

1
CHAPTER 1: INTRODUCTION
American technology tycoon and Apple co-founder Steve Jobs said of his
entrepreneurial efforts, “I’ve always been attracted to the more revolutionary changes. I
don’t know why. Because they’re harder. They’re much more stressful emotionally”
(Goodell, 1994, p. 3). Burnout is a maladaptive psychological syndrome that develops
from chronic exposure to workplace stressors (Maslach, 1998; Maslach & Jackson,
1981). The consequences of burnout are inherently negative; specifically, burnout has
been found to lead to reduced engagement (Schaufeli & Bakker, 2004), reduced
productivity (Leiter & Maslach, 2001), increased turnover intentions (Jackson, Schwab,
& Schuler, 1986), increased absenteeism (Firth & Britton, 1989), and low morale
(Freudenberger, 1974; Maslach & Jackson, 1981). Entrepreneurs discover, create,
evaluate, and exploit opportunities (Venkataraman, 1997) while shouldering and
managing significant inherent risks (Lumpkin & Dess, 1996). Entrepreneurs are therefore
likely to experience stressors that set the stage for burnout (Baron, 1998; Shepherd,
Marchisio, Morrish, Deacon, & Miles, 2010; Venkataraman, 1997). Entrepreneurial
burnout reduces venture performance (Shepherd et al., 2010), increases exits (Brigham,
De Castro, & Shepherd, 2007), and contributes to venture failures (CBInsights, 2018;
Coombs, Webb, & Swider, 2009). A recent analysis attributed 8% of venture failures to
burnout (CBInsights, 2018). New ventures create 1.5 million jobs annually in the United
States (Wiens & Jackson, 2015), meaning that burnout could destroy up to 120,000 jobs

2
nationally each year through venture failures. Given these undesirable effects, it is
important to understand entrepreneurial burnout.
Burnout develops along two pathways: increased stressors and reduced energies.
Stressors contribute directly to burnout, and energies buffer stressors in addition to
decreasing burnout (Bakker & Demerouti, 2007; Demerouti, Bakker, Nachreiner, &
Schaufeli, 2001; Demerouti, Mostert, & Bakker, 2010; Maslach, Schaufeli, & Leiter,
2001; Shirom, 2003). When burnout models are applied to entrepreneurs, these pathways
have been conceptualized in several ways. The most common perspective is that stressors
occur when the role demands originating from conflict, ambiguity, and overload exceed
abilities (Maslach, 1998; Maslach & Jackson, 1981). Role demand models have
demonstrated the stressor pathway to burnout (Fernet, Lavigne, Vallerand, & Austin,
2014; Shepherd et al., 2010; Wincent, Örtqvist, & Drnovsek, 2008). In these studies,
burnout has been shown to be related to the intent to quit among new Swedish
entrepreneurs (Wincent et al., 2008), as well as to low job satisfaction and poor
performance in a sample of New Zealand entrepreneurs (Shepherd et al., 2010). A second
perspective, based on job-demands theory (Karasek, 1979), adds the energetic pathway as
a possible factor. Stressors occur when there are insufficient energy resources to meet
demands (Bakker & Demerouti, 2007; Demerouti et al., 2001). Wei, Cang, and Hisrich
(2015) have identified five areas of entrepreneurial job demands associated with
stressors: management responsibility, workload, knowledge demands, intensity of
competition, and resource requirements. In a sample of Chinese entrepreneurs, limited
support was found for management responsibility, workload, and knowledge demands
but not for the intensity of competition or resource requirements (Wei et al., 2015). In

3
terms of an integrating perspective based on person-environment fit theory (Caplan,
1987; French, Caplan, & Van Harrison, 1982), when a person is not compatible with the
environment, stressors increase and energy declines (Maslach et al., 2001). In a sample of
United States entrepreneurs, person-job fit has been directly related to reduced burnout
and had more complex mediated links through passion (de Mol, Ho, & Pollack, 2016).
Three issues limit the existing explanations of entrepreneurial burnout: the current
under-developed level of research, difficulties capturing entrepreneurs’ broad range of
stressors, and questions about how passion affects burnout. Limited research has been
done on burnout among entrepreneurs (see Table 1 for a list of eight known studies) (de
Mol et al., 2016; Shepherd et al., 2010). Additionally, certain issues call into question the
reliability of what knowledge can be established. One issue stems from the
operationalization of the burnout construct, which is most commonly defined as
consisting of three distinct dimensions (Maslach, Jackson, & Leiter, 1996): exhaustion,
cynicism toward work, and professional efficacy (Maslach et al., 1996). All three have
been collected and evaluated in only two known studies (Boles, Dean, Ricks, Short, &
Wang, 2000; Wei et al., 2015). Other researchers have either considered a single
dimension (e.g., Wincent et al., 2008) or collapsed the three distinct dimensions into a
single one (e.g., Shepherd et al., 2010), which may have obscured the findings.
Unexplained and conflicting findings are another issue; for example, Wei et al. (2015)
have found that greater management responsibility (a stressor source) had the expected
effect of increasing burnout, but greater knowledge demands (another stressor source)
had the reverse effect. The underdeveloped state of the literature, combined with

4
methodological uncertainties and unexplained findings, highlight the need for more
research into the important construct of entrepreneurial burnout.
Compared to the many professions and roles that have been studied,
entrepreneurship is unique in terms of the broad range of responsibilities and activities
that follow from identifying and developing new opportunities (Venkataraman, 1997).
Burnout models applied to date have been developed from an early focus on narrower
human services professions, such as nursing and teachers, and then later in more general
occupations (Cordes & Dougherty, 1993; Maslach et al., 2001). Framing a broader range
of stressor sources is difficult, as evidenced by the findings of Wei et al. (2015). The
person-environment fit model captures the broadest range of characteristics (Caplan,
1987; French et al., 1982). One study has evaluated entrepreneurs’ perceptions of venture
fit to capture this range of stressors without having to define them (de Mol et al., 2016).
However, unanchored perceptions of fit obscure the factors that matter and may be prone
to unrelated biases (Bunderson, 2001; Schneider, 1975). More concrete
conceptualizations of fit exist, but either these were not designed for entrepreneurs, or
different factors were used to define the person and the environment (e.g., Brigham,
2002; Chan, 1996; Maslach et al., 2001). Person-environment fit theory requires that the
characteristics of each side of the fit be commensurate (Edward, Caplan, & Van Harrison,
1998; French, Rodgers, & Cobb, 1974). An entrepreneur-venture fit model of burnout
should meet the commensurate and objective requirements while also capturing the
broadest range of stressors in order to advance entrepreneurial burnout research. A
cognitive perspective holds promise for these purposes.
5
Baron (2004) has suggested that cognitive perspectives are useful for
entrepreneurial research, while Brockner, Higgins, and Low (2004) have proposed
regulatory focus theory as a useful cognitive framework for studying the entrepreneurial
process. In terms of regulatory focus theory, two orientations, namely promotion and
prevention, have guided the selection of goals, methods of pursuit, and the resulting
behavior (Higgins, 1997, 1998). A promotion focus drives the pursuit of the ideal self
through growth or engagement strategies (Higgins, 1997), while a prevention focus
drives this pursuit through duty and responsibility strategies (Higgins, 1997). A
promotion focus may reduce burnout by promoting a marshaling of resources to support
engagement (Brenninkmeijer, Demerouti, le Blanc, & Hetty van Emmerik, 2010; Shi,
Zhang, Xu, Liu, & Miao, 2015). However, a prevention focus may increase stressors by
promoting vigilance concerns and monitoring (Brenninkmeijer et al., 2010; Higgins,
1997). Neither a promotion nor prevention focus is inherently better; rather, different
entrepreneurial roles may have differing ideal foci (Brockner et al., 2004). In terms of
regulatory fit theory (Higgins, 2005), the fit between entrepreneurs and their ventures is
most important for energy or stressor effects. Together, these orientations offer a two-
dimensional cognitive model that may be useful for describing entrepreneurs (Johnson,
Smith, Wallace, Hill, & Baron, 2015) and explaining burnout (Shi et al., 2015).
Regulatory foci can also describe the entrepreneur’s environment – that is, the
venture. Entrepreneurship is about the discovery or creation, development, and
exploitation of opportunities (Alvarez & Barney, 2007; Alvarez, Barney, & Young, 2010;
Shane & Venkataraman, 2000). Activities in each phase of entrepreneurship may have
characteristics that suggest a particular focus preference, either promotion or prevention

6
(Brockner et al., 2004). The venture environment can then be classified in regulatory
focus terms as a work-specific regulatory focus orientation (Johnson et al., 2015;
Neubert, Kacmar, Carlson, Chonko, & Roberts, 2008). By conceptualizing the venture in
terms of venture activities and characterizing those activities in terms of a regulatory
focus, commensurate terms can describe both entrepreneurs and their ventures.
Passion is an energetic resource particularly important to entrepreneurs and
relevant to burnout (Cardon, Wincent, Singh, & Drnovsek, 2009). Entrepreneurial
passion is a motivational force that derives from strong positive feelings that provide
energy for engagement and the pursuit of venture goals (Cardon et al., 2009; Smilor,
1997; Vallerand et al., 2003). Passion is considered particularly important for
entrepreneurs (Smilor, 1997), and it is relevant to burnout because it affects the energetic
pathway (Cardon et al., 2009; Vallerand, Paquet, Philippe, & Charest, 2010). One
conceptualization, the dualistic model of passion, further defines two passion types that
vary according to how a stressor’s pathway to burnout is affected: harmonious and
obsessive (Vallerand et al., 2003). Harmonious passion helps avoid stressors by
facilitating the interruption of conflicting engagements to promote the balancing of
demand-satisfying activities. Obsessive passion adds to stressors by driving the exclusive
pursuit of a single engagement to the point of excluding other activities needed to satisfy
competing demands (Vallerand et al., 2010).
Passion has been related to burnout mostly with respect to non-entrepreneurs
(Curran, Hill, Appleton, Vallerand, & Standage, 2015) and in one study of entrepreneurs
(de Mol et al., 2016). Harmonious passion had a moderate negative relationship with
burnout, and obsessive passion had a weak positive relationship (Curran et al., 2015; de

7
Mol et al., 2016). Evidence of the relevance of passion to burnout has been found in
stressor and energetic effects. Passion was observed to be negatively associated with role
ambiguity, a stressor source (Collewaert, Anseel, Crommelinck, De Beuckelaer, &
Vermeire, 2016). The linkage of entrepreneurial passion to an energetic pathway has been
observable as behaviors (e.g., persistence Cardon & Kirk, 2015; commitment Fisher,
Merlot, & Johnson, 2018; grit Mueller, Wolfe, & Syed, 2017). Thus, entrepreneurial
passion, with its energetic and stressor pathways to burnout, is a factor that may help
explain entrepreneurial burnout.
The purpose of this study is to explore how the characteristics of entrepreneurs
and the situational characteristics of their ventures, both conceptualized in terms of
regulatory focus theory, combine into an entrepreneur-venture fit model and interact with
passion to explain entrepreneurial burnout. This study collected data using a two-wave
field survey of entrepreneurs that resulted in a final sample size of n=302. The two-wave
design was intended to partially mitigate common method variance concerns (Podsakoff,
MacKenzie, & Podsakoff, 2012). The first wave collected criterion variables, and the
second wave collected predictor variables. All of the constructs were measured with
validated instruments. Confirmatory factor and other analyses tested construct validity,
and multiple linear regression tested the proposed model.
Most of the proposed model was unsupported. One hypothesis test found that
promotion fit related to reduced cynicism, and all other tests were null. Reflecting on the
results and study motivations led to informative explanations. For example, entrepreneurs
appear to have high levels of tolerance for stressors, and they resist burnout. Further, the
data show relatively high levels of exhaustion and cynicism, two dimensions of burnout,

8
but professional efficacy was high, which suggests a strong coping ability. This
characteristic may arise through a self-selection and attrition process in which
entrepreneurs with built-in stressor resistance are successful while others withdraw.
Autonomy-supported control of resources may have been another possible driver of this
resistance; entrepreneurs with high levels of control may adjust resources and demands to
manage stressors. However, entrepreneurs were especially vulnerable to stressors from
family conflict. Promotion focus, both at the entrepreneur and the venture levels, was
related to reduced burnout through moderate level direct effects, while prevention focus
had no significant relationship with burnout. Prevention focus is theoretically important
to successful entrepreneurship, and descriptive statistical results indicate that prevention
focus was present in the sample. These results suggest that entrepreneurs have some
unknown means of resisting theorized stressors that originate from prevention focus.
Harmonious passion was directly related to reduced burnout, but no moderation occurred,
and the strength of the direct relationships was weaker than is typically found. Obsessive
passion had no relationship with burnout.
This study makes several contributions. First, for the burnout literature, it adds to
the few studies on entrepreneurial burnout, goes beyond the specific role of stressors in a
cognitive fit model, and incorporates and analyzes all three dimensions of the Maslach et
al. (1996) definition of burnout. Second, the introduction of regulatory focus theory as a
framework for describing entrepreneurs and venture environments informs the
entrepreneurship, regulatory focus, and job-fit literature, which suggests that regulatory
focus theory has much to offer entrepreneurship research (Brockner et al., 2004; Johnson
et al., 2015). This study joins a small and growing stream of research that explores

9
regulatory focus effects with entrepreneurs (e.g., Mitteness, Sudek, & Cardon, 2012).
Third, the entrepreneurial passion literature is informed by the application of the dualistic
model of passion, which includes harmonious and obsessive passion (Vallerand et al.,
2003). Fourth, one benefit of this study is the way it highlights the importance of
incorporating adequate controls. Comparisons with past research showed meaningful
changes in the findings when established alternate explanations were incorporated. Last,
general entrepreneurship is informed by the results that indicate that entrepreneurs
respond to stressors differently than others.
On a practical level, practitioners may benefit from assessing their venture or job
designs to ensure that they emphasize promotion focus duties. Conflict related to family
life is important to manage because it strongly relates to burnout. Established
entrepreneurs are likely quite tolerant of on-the-job stressors, so major efforts to mitigate
those stressors are unnecessary. Autonomy in the venture may be important to guard
because it may be key to maintaining stressor resistance. Finally, new entrepreneurs may
be at the highest risk of developing burnout. Entrepreneurs, investors, family, and other
stakeholders should be sensitive to stressor and burnout signs and intervene quickly.
This study proceeds as follows. Chapter two discusses burnout research,
highlights challenges to explaining entrepreneurial burnout, states the research question,
and develops the entrepreneur-venture fit model of burnout. The complete research model
as shown in Figure 1 is then presented. Chapter three describes the methodology for
testing the proposed model. Chapter four presents the data and analysis process results in
detail. Finally, a discussion of findings, implications, and limitations leads to the
conclusion in chapter five.
10
CHAPTER 2: LITERATURE REVIEW AND HYPOTHESES DEVELOPMENT
To better understand how entrepreneurial burnout develops, this study undertook
a review of literature over the period from 2016 to early 2018. Initially, online searches
were conducted using Google Scholar and a southeastern United States-based university
library system. The library searches included the multi-subject databases EBSCO,
ProQuest, Academic OneFile, JSTOR, and Web of Science. The first searches included
terms relevant to the study problem: entrepreneur burnout, entrepreneur stress, and
burnout. The breadth of stress research, which includes burnout, was enormous and
challenging to assimilate, so reviews and meta-analytical studies were examined first to
develop a broad understanding. Early search results were scanned for relevance, reviewed
for applicability, and cataloged. Search keywords were refined and combined with
synonyms such as SME, owners, and manager for entrepreneurs, and exhaustion and
well-being for burnout to focus on relevant literature while capturing more meaningful
material. Studies deemed to be more relevant due to abstract reviews or higher citation
counts were examined, and their citation lists were reviewed for additional studies. One
stage of research included locating offline references of highly cited works, which were
typically books. Finally, a list of the authors and journals that most frequently published
relevant material was identified, and targeted reviews were conducted. The study review
developed from this initial material, and similar search processes were undertaken in the

11
review of fit frameworks and passion literature. These later searches were focused to
address the study’s purpose.
The first part of this chapter comprises a review of the burnout literature, focusing
on three gaps: the scarcity of knowledge concerning entrepreneurial burnout, the lack of
an entrepreneur-venture fit model of burnout, and the question of how entrepreneurial
passion affects burnout. Following that, an entrepreneur-venture fit model of burnout is
developed that conceptualizes both entrepreneurs and their ventures in terms of cognitive
characteristics (i.e., regulatory focus orientations). Passion is integrated into the burnout
model to explain its effects, and hypotheses are proposed. Finally, the complete research
model, together with its underlying hypotheses, is presented.
Literature Review
This review consists of three sections. The first is a review of the burnout
literature, which is followed by an examination of person-environment fit models that are
applicable to burnout. The last section covers entrepreneurial passion research, and the
chapter ends with a summary of the review and the presentation of the study’s plan.
Burnout
Burnout is a maladaptive strain response syndrome that develops from chronic
exposure to workplace stressors and consists of three distinct dimensions: exhaustion,
cynicism toward work, and reduced professional efficacy (Maslach & Jackson, 1981;
Maslach et al., 2001). Sometimes referred to as job burnout, it occurs when exhaustion
and cynicism toward work are relatively high, and professional efficacy is relatively low
(Maslach et al., 2001). Burnout is best known for its associated negative behavioral,
physical, and performance outcomes (Cordes & Dougherty, 1993; Maslach & Jackson,

12
1982). The term “burnout” is drawn from common observations of those afflicted.
Research into the phenomenon began with Freudenberger (1974) and Maslach (1976),
and by the year 2000, over 6,000 articles had been published on the subject, and research
continued to increase (Schaufeli & Buunk, 2003).
Other factors besides stressors are also involved in determining when burnout
develops: coping resources (e.g., autonomy, control, and support (Baron, Franklin, &
Hmieleski, 2016; Lazarus, 2006; Lazarus & Folkman, 1984)) and psychological
characteristics (e.g., cognitive biases, efficacy, and personality (Semmer & Schabracq,
2003)). Burnout is sometimes viewed as existing on the opposite end of a scale from
engagement (Maslach & Leiter, 1997). Research has established that burnout and
engagement are indeed distinct, even though they are often inversely related (Cole,
Walter, Bedeian, & O’Boyle, 2012; Demerouti et al., 2001; Gorgievski & Hobfoll, 2008).
The following sections describe some defining outcomes of burnout, two
conceptualizations of it, and an overview of the state of research as applied to
entrepreneurs.
Outcomes. Job burnout outcomes include reduced engagement (Schaufeli &
Bakker, 2004), reduced productivity (Leiter & Maslach, 2001), increased turnover
intentions (Alarcon, 2011; Jackson et al., 1986), increased absenteeism (Firth & Britton,
1989), and lower morale (Freudenberger, 1974; Maslach & Jackson, 1981). There is also
concern that burnout-related job performance issues can affect co-workers’ performance,
perhaps through conflict or disruptions, and increase the overall organizational impact
(Maslach et al., 2001). In the few studies that have specifically examined entrepreneurs,
burnout was found to reduce venture performance (r=-.30 Shepherd et al., 2010) and lead

13
to personally exiting the venture (r=.48 Brigham, 2002). Coombs et al. (2009) have also
suggested that burnout contributes to venture failure.
Conceptualizations. There is minor disagreement regarding the precise nature of
burnout (Cole et al., 2012), and two major conceptualizations have received the most
attention. The most common one, which this study adopts, is Maslach’s, which consists
of three distinct dimensions: exhaustion, cynicism toward work, and professional efficacy
(Maslach & Jackson, 1981; Maslach et al., 2001). The other, based on job demands-
resources theory, defines two dimensions: exhaustion and disengagement (Demerouti et
al., 2001; Demerouti & Nachreiner, 1998). These conceptualizations are rooted in
different models but share a process view (Beehr & Newman, 1978; Jex & Britt, 2014;
Katz & Kahn, 1978). In both models, burnout develops over time due to chronic exposure
to stressors, depending on certain conditions such as coping methods, psychological
resources, and work experiences (Schaufeli & Buunk, 2003). The models differ in terms
of the definition of burnout, the identification of stressors, and the theoretical
explanations for the relationship between stressors and burnout. The following sections
provide reviews of each model.
Maslach’s model. Maslach’s conceptualization of three burnout dimensions was
originally developed atheoretically on the basis of an empirical analysis of clinical
experiences (Maslach, 1998; Maslach & Jackson, 1981; Maslach et al., 1996). This
conceptualization followed the syndrome framing that was common in the clinical
psychology setting of the initial research. A syndrome is a set of simultaneously
occurring symptoms and does not require initial theoretical reasoning. The majority of
burnout research applies Maslach’s conception of burnout (Mäkikangas & Kinnunen,

14
2016; Schaufeli & Enzmann, 1998). As noted above, its three dimensions are exhaustion,
cynicism toward work, and professional efficacy.
Exhaustion is the core aspect of burnout and represents the general depletion of
personal energy. An individual is unable to cope with further workload demands and
conflicts once all his or her energy is expended (Cordes & Dougherty, 1993; Jackson et
al., 1986; Schaufeli & Maslach, 1993). Cynicism toward work is sometimes referred to as
depersonalization and comprises feelings of detachment and distance from the job
(Maslach et al., 2001). Co-workers and customers, as well as job tasks and
responsibilities, are distanced and objectified (Cordes & Dougherty, 1993; Maslach,
1998). Professional efficacy, sometimes referred to as personal accomplishment,
represents a self-evaluation concept consisting of feelings of accomplishment and
capability and, most importantly, an expectation of effectiveness in the future in relation
to one’s profession (Maslach et al., 2001).
Burnout is indicated by higher levels of exhaustion and cynicism toward work and
lower levels of professional efficacy (Maslach, 1998). These dimensions are distinct,
meaning that each should be measured and analyzed separately (Maslach et al., 1996).
Thus, Maslach’s conceptualization is not defined by a single measure but rather by a set
of three distinct measures that comprise the syndrome (Maslach et al., 1996). Empirical
testing followed by meta-analytical analysis has confirmed the distinctiveness and
reliability of these dimensions across both non-entrepreneur and entrepreneur populations
(Boles et al., 2000; Worley, Vassar, Wheeler, & Barnes, 2008). The first two dimensions,
exhaustion and cynicism toward work, are typically the strongest measures and serve as

15
warning signs of possible burnout exposure when one or the other first appears (Maslach
& Leiter, 2008).
Maslach’s model: conceptualization of stressors. Job stressors are generally seen
as excessive job demands experienced by the individual (Maslach, 1998). They originate
with interpersonal or role demands. Interpersonal work demands can be rooted in
competition, the contentious or rude behavior of employees or customers, or indirect
relationship affronts, such as inequities in workloads (Jex & Britt, 2014). In early work
on burnout researchers examined populations with significant emotional stressors in their
work environment, such as nurses and teachers (Cordes & Dougherty, 1993). High
burnout experiences among nurses may originate from stressors that occur in the normal
performance of their roles, which involve interpersonal relationships with ill patients.
Based on role theory, the role concept refers to expectations of behaviors when an
individual occupies a specific position or status within an organization (Jacobson,
Charters, & Lieberman, 1951). There are three classifications of role stressors: role
ambiguity, role conflict, and role overload.
Role ambiguity follows from the uncertainty of what to do, such as unclear
performance standards or undefined work processes (Kahn, Wolfe, Quinn, Snoek, &
Rosenthal, 1964). Role conflict follows from competing demands within the same job
(Kahn et al., 1964), and role overload can take a quantitative form, such as having too
much work for a given time, or a qualitative form, such as having tasks that are too
difficult (Jones, Flynn, & Kelloway, 1995). A meta-analysis of role stressors supports
each stressor as a significant contributor to general burnout (Alarcon, 2011).

16
Maslach’s model: theoretical support. Chronic stressors may lead to the
development of exhaustion in the first stage as workers expend energy to meet demands
(Maslach et al., 2001). Stressors may or may not lead to exhaustion over time, depending
on whether effective or ineffective coping mechanisms are utilized. With little energy
remaining, workers may withdraw emotionally from their jobs and distance themselves
from job-related interpersonal relationships as a dysfunctional coping strategy (Cordes &
Dougherty, 1993; Maslach, 1998). Withdrawal and depersonalization set the stage for
cynicism toward work to develop. Finally, professional inefficacy develops either from
exhaustion, cynicism, or a combination of the two (Leiter, 1993). Inefficacy, as the
opposite of efficacy, suggests a reduced engagement with job activities, that is, a
maladaptive coping strategy (Maslach et al., 2001).
Role stressors are prevalent among entrepreneurs (Stevenson & Gumpert, 1985),
who are likely to experience role conflict due to managing disparate stakeholders with
different expectations, such as customers, investors, and suppliers, in the process of
exploiting new opportunities (Wincent et al., 2008). One study has found that role
conflict is related to burnout (Shepherd et al., 2010), whereas another found no
relationship to burnout (Wincent et al., 2008). Similarly, role ambiguity is likely because
expectations for performance and behavior can be unclear in new ventures due to the
novelty of the situation. Indeed, role ambiguity has been found to be related to burnout
among entrepreneurs (Shepherd et al., 2010; Tetrick, Slack, Da Silva, & Sinclair, 2000;
Wincent et al., 2008). Moreover, role overload can result when entrepreneurs have
limited resources to meet stakeholder requirements. Role overload has been found to

17
affect burnout among entrepreneurs (Shepherd et al., 2010; Tetrick et al., 2000; Wincent
& Örtqvist, 2009).
Beyond the types of role stressors listed above, some studies have tested other
possible work stressors. Organizational constraints were found to increase burnout among
neurotic entrepreneurs with low conscientiousness (Perry, Penney, & Witt, 2008). Fernet,
Torrès, Austin, and St-Pierre (2016) have conceptualized stressors as a collective
perception of recent problems in the areas of finances, sales, administration, employees,
and suppliers. Stressors were found to positively affect burnout. Further, when
entrepreneurial orientation was low, loneliness mediated and strengthened the stressors-
to-burnout relationship, whereas when entrepreneurial orientation was high, loneliness
mediation became insignificant (Fernet et al., 2016).
Overall, these limited findings partly support the view that established role
stressors are applicable to entrepreneurs. However, inconsistencies in role conflict
findings and the success of alternate stressor categorizations suggest that there is more to
entrepreneurial stressors. The job demands-resources model highlights an additional
pathway relevant to burnout, namely an energetic one.
Job demands-resources model. The job demands-resources model grew out of job
demands-resources theory (Demerouti et al., 2001; Karasek, 1979; Schaufeli & Bakker,
2004), and it conceptualizes burnout as having two dimensions: exhaustion and job
disengagement (Bakker & Demerouti, 2007; Demerouti et al., 2001). The exhaustion
dimension is consistent with Maslach’s conceptualization of burnout and includes
physical and cognitive weariness, which may be particularly relevant to workplace
settings. Job disengagement is closely related to cynicism toward work and somewhat

18
related to profession inefficacy, but this dimension alone describes personal separation
and distancing from the work of the job itself (Demerouti et al., 2001; Maslach et al.,
2001).
Burnout is present when exhaustion and disengagement are both elevated. The
Oldenburg burnout inventory was developed to measure burnout experiences related to
this model (Demerouti & Nachreiner, 1998), and empirical work has confirmed the
invariance of the two dimensions across different work settings (Demerouti et al., 2001).
Job demands-resources model: conceptualization of stressors. Job stressors
originate with job demands, similar to Maslach’s concept, and when these demands
exceed resources, stressors are generated (Demerouti et al., 2001). Job demands require
the expenditure of mental and/or physical effort and could originate in physical, social, or
organizational aspects of the job. Job resources may be external (e.g., social and
organizational), or internal (e.g., cognitive and energy-based) (Richter & Hacker, 2014).
Job resources can help one meet demands, reduce the effort cost of meeting demands, or
enhance personal capabilities (e.g., personal growth or development) and therefore
increase resources (Bakker & Demerouti, 2007; Demerouti et al., 2001). An important
contribution of this model is this conceptualization of the individual’s energetic ability to
satisfy the demands; when the ability is insufficient, stressors appear.
Job resources can directly or indirectly address job demands by supporting the
required effort, reducing the demand, or promoting an intrinsic motivation through
growth or learning (Bakker & Demerouti, 2007). Control as a resource can directly adjust
demand or marshal resources (Demerouti et al., 2001). Social connections as a resource
can indirectly help with weakening demand or acquiring new resources through the

19
supportive efforts of colleagues (Schaufeli & Bakker, 2004). Professional development
can enable one to develop personal resources, such as new skills or abilities that bolster
intrinsic motivation (Bakker, Demerouti, & Verbeke, 2004). Stressors are generated when
the level and type of job demands exceed the level and type of job resources; these
stressors may then lead to exhaustion.
Job demands-resources model: theoretical support. In this model, two
simultaneous but interrelated processes lead to exhaustion and/or disengagement (Bakker
& Demerouti, 2007; Demerouti et al., 2001). The relationship is complex, however:
resources serve to blunt the effects of demands, and demands affect how resources lead to
engagement (Bakker & Demerouti, 2007).
First, job demands require psychological energy and, over time, lead to
exhaustion if the resources become insufficient. In response to the wear caused by the
effort to meet demands, extra psychological energy is applied to meet the demands. The
result is that, should exhaustion develop from this effort-expending process, new
demands cannot be met, and stressors occur (Bakker & Demerouti, 2007).
Second, resources can also be involved in an energetic process that, when
reduced, leads to disengagement. Should the available resources be insufficient for the
demands at hand, both energy-wise and in the wrong type or form, disengagement occurs.
Disengagement is a dysfunctional but self-protective behavior to avoid failures to meet
demands, and it manifests initially as cynicism toward work (Bakker, Van Emmerik, &
Van Riet, 2008).
The usefulness of the job demands-resources model to explain stressors and
overall burnout has been established (Alarcon, 2011), but the distinctiveness of the two

20
conceptual dimensions, exhaustion and engagement, as a definition of burnout have not.
Meta-analysis suggests that burnout (as exhaustion, cynicism toward work, and
professional inefficacy) and engagement share a significant overlap in their conceptual
dimensions (Cole et al., 2012). When burnout was controlled for, engagement became
insignificant for health-related complaints, and only slightly explanatory (Δr2=.06) for job
satisfaction and organizational commitment outcomes. These results suggest that the two-
dimensional definition of burnout proposed by the job demands-resources model does not
meaningfully improve on Maslach’s three-dimensional model. Job demands-resources
theory does help explain the workings of burnout by including not only a stressor
pathway to burnout, but also an energetic one.
In terms of research on entrepreneurs, one study has applied a job demands-
resources model: Wei et al. (2015) have conceptualized entrepreneurial stressors, per this
model, as perceptions of net demand on five dimensions: workload, competitive situation,
knowledge demands, management responsibility, and resource requirements. Wei et al.
(2015) have found partial and inconsistent support for the five proposed dimensions of
stressors. Workload affected burnout as expected with increased exhaustion, cynicism
toward work, and professional inefficacy. Management responsibility showed an
inconsistent burnout response with increased exhaustion and cynicism toward work but
decreased professional inefficacy. Demands-of-knowledge showed a different
inconsistent burnout response with decreased exhaustion and cynicism toward work but
increased professional inefficacy. Competitive situations increased exhaustion and
cynicism toward work only, and resource requirements had no effect (Wei et al., 2015).

21
The differing and conflicting responses suggest that this attempt at conceptualizing
entrepreneurs’ stressors was unsuccessful.
To summarize, the same concepts appear in the two conceptualizations of
burnout, either as conceptual dimensions or as related outcomes. Exhaustion is
consistently identified as a dimension of burnout, while cynicism toward work and
disengagement are similar concepts that remain distinct (Demerouti et al., 2001).
Professional efficacy is not universally accepted as integral to both, but it is closely
related. Cynicism toward work may be a close outcome of burnout, acting as a coping
mechanism as workers step back from the job (Maslach et al., 2001). Professional
efficacy is sometimes described as a partial mediator or simply as a moderator of the
stressors in the burnout development path (Avey, Luthans, & Jensen, 2009; Avey,
Reichard, Luthans, & Mhatre, 2011). These three concepts appear in both models, in
different ways; thus, an integration of these models seems reasonable.
Entrepreneurial burnout. Only a few studies (eight found by this study; see Table
1) have specifically examined burnout among entrepreneurs. The scarcity of burnout
research on entrepreneurs is surprising considering that entrepreneurial burnout can affect
venture performance (Shepherd et al., 2010), lead to personally exiting the venture
(Brigham, 2002) or possibly even venture failure (Coombs et al., 2009). It is not clear
why so few studies of entrepreneurs have been conducted; A review of the known studies
revealed no explanation, although most noted the extant gap.

22
Table 1
Burnout Studies of Entrepreneurs
Study Sample / Country Measure Findings
Theory or
Model Stressor
Boles et al. (2000)
Small business
owners / U.S. MBI
Empirically validated three dimensions of burnout
as distinct among entrepreneurs and had similar
relationships with established nomological network. Maslach
Role conflict,
work conflict
Tetrick et al.
(2000)
Morticians as small
business owners /
U.S.
MBI-
exhaustion
Owner morticians had less role ambiguity and role
conflict, less social support, and less exhaustion
than non-owner operators and employees. Maslach
Role conflict,
ambiguity,
overload
Perry et al. (2008)
Self-employed /
undisclosed
MBI-
collapsed
Found neurotic entrepreneurs with low
conscientiousness developed more burnout when
faced with organizational constraints. COR,
J-DR
Personality and
constraints
Wincent et al.
(2008)
Entrepreneurs /
Sweden
MBI-
exhaustion
Tested a causal model using longitudinal study
finding role ambiguity and role overload increased
exhaustion, but not role conflict. Further, exhaustion
was related to venture withdrawal. Maslach
Role conflict,
ambiguity,
overload
Shepherd et al.
(2010)
Entrepreneurs /
New Zealand
MBI-
collapsed
Role stress was related to burnout, and burnout
negatively related to organizational commitment,
satisfaction, and perceived performance. Maslach
Role conflict,
ambiguity,
overload
Wei et al. (2015)
Entrepreneurs /
Chinese MBI
Examined entrepreneurial stressors of five types:
workload, competition, knowledge demands,
responsibility, and resource demands. Managing
responsibility contributed to efficacy and
exhaustion. Workload contributed to exhaustion.
Demands-of-knowledge negatively affected all three
dimensions of burnout. J-DR
Entrepreneurial
Stress
Questionnaire
(Wei et al., 2009)

23
Study Sample / Country Measure Findings
Theory or
Model Stressor
de Mol et al.
(2016)
Business Network
owners-managers /
U.S.
MBI-
collapsed
Perceived job fit related to harmonious passion and
burnout, and harmonious passion related to lower
burnout
Perceived job fit related to obsessive passion when
destiny beliefs were present, and obsessive passion
related to higher burnout. P-E fit
Perceptions of
job fit
Fernet et al.
(2016)
SME owners-
managers / France
BMS-
French
Direct effect of job stressors to increasing burnout.
Entrepreneurial orientation moderates an
occupational loneliness to burnout relationship such
that loneliness only contributed to burnout at low
entrepreneurial orientation levels. Maslach
Role Stressors
(Torres et al.
2012 measure)
Theories/Models:
Maslach model (Maslach et al., 2001).
J-DR: Job demands-resources model (Bakker & Demerouti, 2007; Demerouti et al., 2001).
P-E fit: Person-Environment fit theory/model (French et al., 1974; Maslach et al., 2001).
COR: Conservations of resources theory (Hobfoll & Freedy, 1993).
Measurement Instruments:
MBI: Maslach burnout inventory (Maslach et al., 1996).
MBI-Exhaustion: Single exhaustion dimension of the MBI.
MBI-Collapsed: Maslach burnout inventory with the three independent dimensions combined.
BMS-French: Burnout measure (Malach-Pines, 2005), short version, adapted to French language (Lourel, Gueguen, & Mouda, 2007).

24
The authors of all but one of the eight studies, the exception being Fernet et al.
(2016), applied the Maslach conceptualization for burnout (see Table 1). The
distinctiveness of the three dimensions and sample invariance were tested and established
in one of these studies (Boles et al., 2000). All three dimensions were collected and
independently analyzed in only two studies (Boles et al., 2000; Wei et al., 2015), despite
the importance of all dimensions for measuring burnout as a unique syndrome (Maslach
et al., 1996).
In two of the Maslach-based studies, data were collected on only the single
dimension of exhaustion (Tetrick et al., 2000; Wincent et al., 2008). Additionally, the
Fernet et al. (2016) study also collected data on exhaustion alone, although with a
different measure (Malach-Pines, 2005; Pines & Aronson, 1988). Collecting data on
exhaustion alone is a common practice (e.g., Jung, Yoon, & Kim, 2012); it is sometimes
argued to be acceptable because exhaustion has the highest correlation with burnout
outcomes (Worley et al., 2008). However, exhaustion alone does not capture the full
multi-dimensional syndrome, so it is not sufficient to identify burnout (Maslach et al.,
1996; Maslach et al., 2001); the findings from those studies thus may not relate to
burnout. In three studies of entrepreneurs, the three dimensions were collapsed
empirically: de Mol et al. (2016), Shepherd et al. (2010), and Perry et al. (2008). In those
cases, burnout became confounded because the three dimensions are distinct; the findings
based on collapsed scales thus may not be related to burnout (Maslach et al., 1996;
Maslach et al., 2001). The result of these issues is that less is known about
entrepreneurial burnout than the number of studies suggests.

25
One entrepreneurial burnout study (Wei et al., 2015) has properly applied the full
Maslach conceptualization with the purpose of evaluating stressor antecedents; this study
was described earlier. Recall that Wei et al. (2015) considered five work demand areas:
workload, competition, knowledge demands, responsibility, and resources. Each area was
evaluated among a sample of Chinese entrepreneurs, and inconsistent and contradictory
findings resulted (Wei et al., 2015). Only workload was related to burnout as expected,
and two other demand areas had different and inconsistent relationships with the three
dimensions of burnout. There was no explanation for this contradiction. This study’s
unexpected and conflicting results also suggest a need for further research.
From the preceding material, there appears to be limited scholarly knowledge of
burnout among entrepreneurs. First, few studies sampled entrepreneurs. Second, although
burnout definitions appear to be conceptually consistent, their operationalizations within
the studies were not, which casts doubt on the existing studies’ usefulness. Last,
unexplained and conflicting findings in one study (Wei et al., 2015) suggest that
entrepreneurs may have a unique burnout experience that current models inadequately
explain. In order to address these issues, more studies that use burnout models better
suited to entrepreneurs are needed.
Integration of the job-demands model with Maslach’s originally more atheoretical
approach can further enhance entrepreneurial burnout research. The job-demands model
offers an expanded picture of burnout development via both a stressors pathway and an
energetic pathway, and it has a broader resource focus. The energetic pathway addition
accounts for some of the impact of personal abilities described by Maslach given that the
use of energies is part of meeting demands. Since energy is also a defining aspect of

26
entrepreneurial efforts (Smilor, 1997) it is important to consider its effect on
entrepreneurial burnout. Integrating the broader resource view can facilitate capturing
more types of resources, as well as demands, in burnout research. An integrated model
would facilitate this aim. Person-environment fit models offer an opportunity for such
integration.
Person-Environment Fit
Person-environment fit models have been proposed to better conceptualize the
antecedents of burnout development (Caplan, 1987; French et al., 1982) by helping to
capture more completely the unique environment and entrepreneurs’ stressors.
Conceptualizations of the person and the environment vary among studies, and few
entrepreneurial fit models have been used (Brigham et al., 2007; de Mol et al., 2016).
This section comprises a review of a proposed general workplace model with an eye
toward implications for entrepreneurs. Next, a nascent attempt at a person-environment
fit burnout model for entrepreneurs is examined. Finally, weaknesses in the current
research are analyzed, revealing the need for a fit framework better suited to
entrepreneurs (Brigham, 2002; Markman & Baron, 2003).
The person-environment fit model, also referred to as person-job fit, focuses on
the relationship between the individual and the situational environment of the job
(Caplan, 1987; French et al., 1982). When the individual characteristics of the person
align with the job requirements, good fit is present. Good fit predicts a better adjustment
to job demands and more positive and adaptive responses (French et al., 1974). Poor fit is
indicated in the opposite case and leads to maladaptive strain responses, such as burnout

27
(Spielberger, Vagg, & Wasala, 2001). Stressors, and whether the individual responds
adaptively or maladaptively, follow from the level of fit.
Conceptualizing factors for fit requires a consideration of how the personal and
environmental perspectives relate (Leiter & Maslach, 2003). Past conceptualizations of
dimensions for testing fit include similarity, need-satisfaction, and demand-ability
matches (Kristof-Brown, Zimmerman, & Johnson, 2005), and the general classes of
factors have included skills, needs, preferences, personality traits, goals, and attitudes
(Kristof-Brown et al., 2005). Fit has been labeled an elusive construct due to the
application of a wide range of conceptualizations in research (Judge & Ferris, 1992). A
major consideration affecting fit conceptualizations follows from the environmental
perspective. Past research perspectives include vocation, job, organization, group, and
supervisor factors (Kristof-Brown et al., 2005).
Environmental perspectives are chosen to bring relevant dimensions to a study.
From each perspective, further conceptualization leads to the identification of specific
characteristics that can be related to the person to explain outcomes. Vocational
perspectives result in a broad focus on vocational choice and employee satisfaction
questions rooted in the characteristics of vocations (Kristof-Brown et al., 2005). The
focus of organizational perspectives is organizational values, while group perspectives
enable the identification of the relevant interpersonal characteristics of a group. In terms
of supervisor perspectives, a second person, the supervisor or another, is defined as the
environment in order to focus more narrowly on interpersonal characteristics. The job
perspective’s focus is on specific job tasks, and there are two general approaches. The
first consists of identifying the requirements of the job, typically the knowledge, skills,

28
and abilities needed, and the second in identifying the benefits the job may provide,
typically those supporting personal needs or values. Within an environment, relevant
environmental dimensions help to answer research questions. However, these dimensions
must be directly relatable to the person in order to evaluate fit (Edward et al., 1998;
French et al., 1974).
Maslach et al. (2001) have proposed a burnout fit model for general worker
settings and developed conceptual dimensions of relevant factors. The Maslach proposal
has been tested empirically in a general worker sample and found broad support (Maslach
& Leiter, 2008). The next section provides a review of this model.
Maslach fit model. Maslach et al. (2001) have proposed a person-environment fit
model for general burnout research that combines elements of the job, group,
organization, and supervisor perspectives to capture factors relevant to stressor
generation and burnout. Maslach et al. (2001) have identified six dimensions believed to
be most relevant: workload, control, reward, community, fairness, and values. Of these,
workload typically has the strongest link to exhaustion (Leiter & Maslach, 2003). Too
much work represents role overload, a stressor that can result in eventual exhaustion
(Maslach et al., 2001). Examples of factors from the personal side include abilities and
skills, personality, traits, and inclinations. The environmental side consists of different
types or amounts of work that may demand or benefit from the personal side factors.
Personal factors are resources and environmental factors are job demands when viewed
through a job demands-resources lens (Bakker & Demerouti, 2007). When demands
exceed resources, energy eventually depletes, and exhaustion develops. Entrepreneurs
may be better able to manage workload factors by having more control over their jobs

29
(e.g., delegating work, changing demands, or marshaling resources), but they might also
experience heavy workloads and limited resources.
Control refers to the individual’s ability to affect job demands and marshal
resources (Maslach et al., 2001), and it is an important moderating factor of job stressors
(Alarcon, 2011). Karasek (1979) has applied the demand-control theory of job stress to
explain that, while stressors come from high job demands, worker control over the job
acts as a moderating resource. Role conflict and role ambiguity are the stressors that
control affects most. Conflict arising from conflicting demands, or unclear demands,
suggests that having control over the job allows some resolution of these issues before
exhaustion and inefficacy take hold (Alarcon, 2011). Entrepreneurs may have higher
levels of control due to the nature of their positions, but the entrepreneurial process also
reflects limited control (e.g., bricolage and effectuation).
Reward relates to the balance of equity. Rewards are the benefits of the job and
include extrinsic rewards such as monetary or social gain and intrinsic rewards such as
pride in a job well done (Leiter & Maslach, 2003). Imbalance occurs when rewards are
perceived to be inconsistent with the amount of effort applied (Maslach & Leiter, 1997).
As in the effort-reward imbalance theory (Siegrist, 1996), when low rewards accrue from
high-effort situations, stressors are generated that eventually lead to inefficacy and
burnout (Maslach et al., 2001; Siegrist, 2002). Entrepreneurs may exit poor-reward
ventures, but exit may not be feasible in all cases. Perhaps few alternatives are available,
or there is a special connection, such as a family business obligation, leading to stressors
(Maslach et al., 2001).

30
Community refers to social connections at work (Maslach et al., 2001). Positive
connections, such as support and closeness, lead to better functioning, which is indicated
by more engagement and less burnout. Negative connections, such as conflict or simply a
lack of positive aspects, degrade functioning (Leiter & Maslach, 2003). Jobs may also
isolate one or impersonalize contact with others, making the benefits of social
connections less likely. Negative connections with supervisors are most related to
exhaustion, and positive relationships with co-workers are more closely related to greater
efficacy (Leiter & Maslach, 2003). Entrepreneurs may be better able than some to
manage these social connections: creating a new organization, or at least leading it, may
aid in the establishment of positive connections (Maslach et al., 2001).
Fairness relates to perceptions of decisions being fair, as well as to respectful
treatment (Leiter & Maslach, 2003). Procedural justice (Tyler, 2006) refers to perceptions
of fairness that can come from the evaluation of decision processes, such as performance
appraisals (Maslach et al., 2001). Stressors occur when procedures are perceived as unfair
(Maslach et al., 2001). There is also a distributive justice (McFarlin & Sweeney, 1992)
aspect, in which perceptions of unfair pay may likewise create stressors. The issue of
distributive justice for fairness is most concerned with perceptions of trust and respect
rather than the actual distribution (Leiter & Maslach, 2003). Experiences of perceived
unfairness create stressors that lead to exhaustion and cynicism toward work and, with
time, burnout (Maslach et al., 2001). Entrepreneurs may control many of the factors
affecting fairness, but externalities, such as access to resources, could still drive
perceptions of lower fairness.

31
The last of Maslach’s six dimensions is values. Personal values are aspirations
and expectations that concern norms or behaviors (e.g., ethical behavior and social
responsibility). These ideas are central to individual identity; personal values motivate
engagement to reinforce these ideas (Deci & Ryan, 2000). If the job environment
encourages behaviors that are inconsistent with these ideas, stressors consume energy,
reduce engagement, and lead to burnout (Leiter & Maslach, 2003). Values may extend to
organizational identity discrepancies and conflicts, as well (Maslach et al., 2001). Pines
(1993) has argued that individuals who expect to derive a sense of significance from their
work are susceptible to stressors when this does not happen. Those without such value
expectations could experience job stress but not burnout. For example, social
entrepreneurs might value a mission statement to do good but experience conflict from
investor pressure to generate revenue.
The Maslach et al. (2001) fit model integrates much of the reasoning of the two
previously discussed burnout models: the Maslach model and the job demands-resources
model. In terms of the Maslach model, burnout originates from stressors caused by
excessive demand that lead to exhaustion (Maslach, 1998). Each of the proposed fit
dimensions explains different types of demands that can generate stressors. The job
demands-resources model is consistent with the workload and control classes of factors;
if resources are low or demand is high, stressors occur.
Maslach’s conceptualization of person-environment fit was tested in a population
of organization employees, and the value of the fit model, as well as the dimensions, were
confirmed (Maslach & Leiter, 2008). In most of the dimensions, poor fit was found to be
related to increased burnout levels. Correlations of all the fit dimensions affected the

32
exhaustion and cynicism toward work dimensions of burnout as expected; poor fit
increased exhaustion and cynicism toward work similarly. The actual correlations ranged
from .30 to .63. The correlations of all fit dimensions except workload (which was
insignificant) also affected the professional efficacy dimension of burnout, as expected;
poor fit decreased professional efficacy, with correlations ranging from .12 to .26
(Maslach & Leiter, 2008). The weaker correlations of professional efficacy relative to
exhaustion and cynicism toward work have commonly been observed in burnout research
(Alarcon, 2011). Based on these results, the validity of this person-environment fit model
for burnout was confirmed and, by extension, so was the usefulness of fit models for
burnout research.
Some of the six dimensions proposed by Maslach et al. (2001) may have limited
relevance to entrepreneurs. Control, fairness, reward, community, and values are
dimensions entrepreneurs might more easily align with their entrepreneurial roles because
they can create their own jobs (Wincent & Örtqvist, 2009) and set organizational values
(Kristof-Brown, 1996; Schein, 1983). Indeed, researchers have called for a fit framework
better suited to entrepreneurs (Brigham, 2002; Markman & Baron, 2003).
Perceived entrepreneurial fit model. One study was found that explored a job-fit
burnout model of entrepreneurs (de Mol et al., 2016). It proposed a job-fit model for
burnout based on a unidimensional environmental perspective and the premise that the
perception of overall fit was most meaningful for burnout. The results found that job fit
negatively relates to burnout, with a correlation of -.59 (de Mol et al., 2016). The use of
perceptions of fit addressed the challenge of designing specific fit criteria for
entrepreneurs but left open the question of what actual factors were relevant to

33
entrepreneurial burnout. For practical purposes, understanding what factors matter is
important for possible interventions. The consistency and compatibility of dimensions
between application to the person and application to the environment are also important
to person-environment fit theory (Edward et al., 1998; French et al., 1974). Comparisons
of fit are not possible without this two-sided equivalence.
Perceptions of fit may appear to address the theoretical concern, but such
conceptualizations capture only one direction of the fit (i.e., does an individual fit well or
fit poorly?) (Bunderson, 2001). Moreover, perceptions of fit are affected by expectations;
perceived fit can change based on relative comparisons and experiences that alter
expectations (Schneider, 1975). Thus, two people in the same situation may experience
different perceptions of fit although the same underlying characteristics are in place.
Following from the above discussion on person-environment fit, fit models for
entrepreneurial burnout research hold promise. Developing conceptualizations that
support consistent dimension comparisons between person and environment are
challenging, however. Both Maslach and Leiter (2008) and de Mol et al. (2016) avoided
this issue by conceptualizing mismatches within their dimensions as relative perceptions.
This approach is counter to person-environment theory (Edward et al., 1998; French et
al., 1974) and vulnerable to biases unrelated to fit (Schneider, 1975). To advance research
into entrepreneurial burnout, a fit model based on consistent, objective criteria across
both entrepreneurs, and their ventures is needed.
So far, two major issues have been reviewed. First, this overview explored the
limited scholarly knowledge about entrepreneurial burnout. Entrepreneurial burnout
models used to date may have had difficulties in capturing the uniquely broad range of

34
stressors that entrepreneurs often experience. Maslach’s conceptualization of role-based
stressors, for example, may be too narrow for entrepreneurs, and the absence of a distinct
energetic pathway may not reflect entrepreneurial experiences. The job demands-
resources model suggests a response to these concerns, but one attempt at adapting the
resources model to entrepreneurs resulted in unexplained contradictory findings (Wei et
al., 2015). Additionally, all the entrepreneurial burnout research to date has relied on
perceptions of imbalance in demands, which is vulnerable to bias (Schneider, 1975) and
has the potential obscuring of results. Capturing antecedent factors of entrepreneurial
burnout has proven to be challenging. The scarcity of entrepreneurial burnout research
may be due to this difficulty in capturing a meaningful range of stressors and resources.
The second major issue is intertwined with the first; person-environment fit
models of burnout have been proposed to capture the broad range of stressors
entrepreneurs are likely to experience. Nonetheless, relatively little research has used
these models with entrepreneurial burnout. One entrepreneurial passion study (de Mol et
al., 2016) has shown promise for a person-environment fit model explaining
entrepreneurial burnout, but it suffers from the same stressor conceptualization and bias
issues discussed previously (Bunderson, 2001; Edward et al., 1998; French et al., 1974;
Schneider, 1975). The reliance on perceptions of person-environment fit represents a
significant weakness of the current fit models. A person-environment fit model based on
a conceptualization in which the two sides are proportional and which captures the broad
range of entrepreneurially relevant stressors for burnout is lacking in the research so far.
This type of model is needed to advance entrepreneurial burnout research. The last gap to
be explored concerns how entrepreneurial passion may affect burnout, as well.

35
Passion
When one thinks of entrepreneurial passion, drive, energy, action, and persistence
come to mind (Smilor, 1997). Energy seems to have been depleted when burnout
develops, as exhaustion and cynicism toward work increase and professional efficacy
wanes. Passion is commonly regarded as an important energizing force for entrepreneurs
(Cardon et al., 2009), but few researchers have explored how it relates to entrepreneurial
burnout. In fact, only one study was found (de Mol et al., 2016) that addressed this
subject. The next section reviews entrepreneurial passion conceptualizations. Next, two
major passion models are examined, along with the results of empirical testing. The last
section reviews entrepreneurial passion research, in which entrepreneurial burnout
connections and implications are discussed.
Passion is a strong motivational attribute that provides energy to pursue a goal,
activity, or role focus (Cardon et al., 2009; Vallerand et al., 2003; Vallerand & Houlfort,
2003). As an energetic resource and driver of engagement, passion seems to have
implications for burnout. It also has an affective aspect suggested by the Latin word
(passio) for suffering (Andrews, Short, Lewis, & Freund, 1907). In conceptualizations of
passion, the affective aspect denotes strong positive feelings (Cardon et al., 2009). Within
this general definition, researchers have only recently developed formal conceptions and
measurements of the passion constructs.
Within entrepreneurial passion research, the most common conceptualizations are
those of Baum, Locke, and Smith (2001), Cardon et al. (2009), and Vallerand et al.
(2003). The first two were developed within the entrepreneurship field and have almost
exclusively been applied to entrepreneurial research. The last comes from the field of

36
psychology (Vallerand et al., 2003). The Cardon et al. (2009) model is the most
commonly applied; it is known to have been utilized in 12 entrepreneurial passion
studies, followed by the Vallerand et al. (2003) model, which has been used in eight
entrepreneurial studies. The earliest conceptualization was that of Baum et al. (2001),
which has been used in three studies. These models are direct measures against which
entrepreneurs personally report their passion experience. There is an exception; one study
(Breugst, Domurath, Patzelt, & Klaukien, 2012) implemented a second-party perceptions
instrument based on Cardon et al. (2009). A brief overview of each passion model
follows.
The Baum et al. (2001) model of entrepreneurial passion is rooted in a description
of passion as enthusiasm and joy, as a well as a determined and persistent drive to
succeed in a venture (Smilor, 1997). The core elements, positive affect and motivational
energy, are consistent throughout all the later conceptualizations. Studies that used this
conceptualization established passion as related to venture performance (Baum & Locke,
2004; Baum et al., 2001) and later to entrepreneurial intentions (De Clercq, Honig, &
Martin, 2013). These studies helped to establish the importance of passion for important
entrepreneurial outcomes, but recent research has chosen between the next two models.
Cardon et al. (2009) have defined passion as intense, positive feelings for
activities related to specific entrepreneurial roles. Three roles are defined: inventor,
founder, and developer (Cardon, Gregoire, Stevens, & Patel, 2013). Each of these role-
based passions independently indicates passion for a set of entrepreneurial activities. This
conceptualization is often referred to simply as entrepreneurial passion.

37
Finally, in their model developed in psychology literature, Vallerand et al. (2003)
have defined passion as a strong motivator for engagement in tasks that are considered
personally important. Two types of passion are described, namely harmonious and
obsessive, both of which maintain the two core elements above and are differentiated by
internal self-regulatory functions and outcomes. This conceptualization is called the
dualistic model of passion and is discussed in detail later. Although the number of studies
on entrepreneurial passion is small, this model has been applied in over 100 studies of
other populations (Vallerand, 2015). The only known entrepreneurial burnout study in
which this model was used was that of (de Mol et al., 2016). It is also known to have
been used in eight other workplace burnout studies (e.g., Fernet et al., 2014; Lavigne,
Forest, & Crevier-Braud, 2012; Trépanier, Fernet, Austin, Forest, & Vallerand, 2014).
Differing relationships between the two types of passion and burnout have been
observed.
Each of these conceptualizations has some commonality at the definition level;
there is consensus that passion is a strong energetic motivator. This has implications for
burnout research because energetic resources are relevant to stressor experiences, as
noted earlier. Entrepreneurial burnout research that incorporates passion is limited to the
single study cited above, using only the dualistic model of passion. Certainly, further
research is warranted to explore the explanatory power of passion for entrepreneurial
burnout. The next sections comprise a review of the two most common passion
conceptualizations.
Cardon: entrepreneurial passion. Cardon et al. (2009) have defined
entrepreneurial passion as a motivational force growing from engagement with activities

38
for which there are intense, positive feelings, and the activities are important to the self-
identity of entrepreneurs in terms of the entrepreneurial venture. Cardon’s three passion
dimensions are identified in terms of the stages of the entrepreneurial process: inventor,
founder, and developer (Shane & Venkataraman, 2000). Recently, researchers have
suggested a more elaborate set of six dimensions (Cardon, Glauser, & Murnieks, 2017).
These six dimensions relate to the interest areas entrepreneurs focus on and for which
they may develop passion: firm growth, people, product or service, inventing,
competition, and social cause. The Cardon et al. (2009) entrepreneurial passion
conceptualization is the most commonly applied model among entrepreneurship
researchers.
The three dimensions of entrepreneurial passion also have particular types of
activities associated with them, which, when engaged, might generate strong, positive
emotions (Cardon et al., 2013; Cardon et al., 2009). Higher levels of passion occur when
the two parts combine (activities generate strong positive feelings, and the role has
meaning and importance to the self) (Cardon et al., 2013). The three stages represent
independent measures of passion. They cannot be combined directly; each must be
considered separately in models (Cardon et al., 2013).
The rigid role identities proposed can coexist within one person; multiple
identities are theorized to be hierarchically organized within the self, with higher ones
dominating the lower, less important ones (Stryker & Burke, 2000). Cardon et al. (2009)
have suggested that this could explain why some entrepreneurs do particularly well at one
stage of the venture, but not at another. Consider a serial entrepreneur who develops a
business, quickly sells it, and moves on to start a new venture; perhaps this entrepreneur

39
has little self-identity resonance with the developer role and hence has less passion at that
stage (Cardon et al., 2009). Other entrepreneurs may possess other types of identities in
their hierarchy of selves that are aligned with activities required in more than one stage.
The Cardon conceptualization of entrepreneurial passion has not enhanced
entrepreneurial burnout research directly; no burnout researcher is known to have applied
this conceptualization of entrepreneurial passion to date. As an energetic motivational
force, it does suggest that passion is worth exploring in a burnout model. The next section
presents a review of the dualistic model of passion.
Dualistic model of passion. The dualistic model defines passion as “a strong
inclination toward an activity that people like, that they find important, and in which they
invest time and energy” (Vallerand et al., 2003, p. 756). There are two types of passion,
harmonious and obsessive, which are distinct and independent (Vallerand et al., 2003).
The two passion types differ in how each motivational disposition is regulated within the
self: harmonious passion motivates in a balanced manner, while obsessive passion
motivates in an uncontrolled manner. Each passion type also relates differently to
individual-level outcomes (Curran et al., 2015; Vallerand, 2015; Vallerand et al., 2003).
Burnout, for instance, has a moderate negative association with harmonious passion
(Curran et al., 2015), possibly due to the energy passion can provide to ward off
exhaustion (Vallerand, 2015). Conversely, burnout has a weak positive association with
obsessive passion, which is theorized to follow a course from excessive drive to
exhaustion or the generation of stressors that result from conflicting goals (Curran et al.,
2015; Vallerand et al., 2003). The two passion types are thus distinct but still have much
in common.

40
Harmonious passion begins with an autonomous internalization; an activity is
voluntarily accepted, freely and without external contingencies attached (Sheldon, 2002).
The activity itself is the most important benefit (e.g., fun, interesting, a challenge). The
outcomes of the activity are not subjected to external evaluation to satisfy the innate
need. The outcome is not completely irrelevant; it may be that there is a strong motive to
generate the best outcome possible, but evaluating the outcome for an external
contingency is not what makes the activity necessary (Vallerand et al., 2003).
Consider an entrepreneur who truly enjoys inventing new product solutions. This
entrepreneur works long hours and invests considerable resources to develop and test
each new idea. If the product is a flop, there is still satisfaction with the work since it was
done well. This set of inventing activities is a focus of harmonious passion (Vallerand et
al., 2003).
Obsessive passion begins with a controlled internalization (Vallerand et al.,
2003). The activity serves as a contingency to an end, and that eventual end is what is
most valued (Sheldon, 2002). For instance, consider another entrepreneur who also
enjoys inventing new product solutions and does equally meaningful work. This
entrepreneur desires to be recognized as one of the top inventors in his or her area. Each
time a successful invention is completed, the entrepreneur looks to showcase his
accomplishment. This set of inventing activities is a focus of obsessive passion. This
entrepreneur is deeply disappointed by failed products; even if the work is well done and
the process leads to new product ideas, there is no new product to showcase to the world.
This entrepreneur is unsatisfied with the outcome and experiences negative affect and
stressors.
41
Harmonious passion and obsessive passion also differ in how the associated
motivational forces are regulated within the self. Harmonious passion is adaptive
(Vallerand et al., 2003). The drive that harmonious passion generates allows an
individual to balance motivation with other needs; thus, these activities are in harmony
with other activities that are important to the self. With harmonious passion, the person is
in control of engagement, which represents a full integration of behavior within the self
(Vallerand et al., 2003). Harmonious passion may serve as a buffer against the exhaustion
dimension of burnout, thus preventing excessive engagement in one activity that might
lead to a depletion of energy (Vallerand, 2015). This contrasts with the maladaptive
regulation of obsessive passion (Vallerand et al., 2003).
The drive obsessive passion generates is uncontrolled; that is, the activities
focused on must be engaged in even to the point of crowding out other important
activities (Vallerand et al., 2003). With obsessive passion, the person must engage in the
activity until it has run its course (Philippe, Vallerand, Houlfort, Lavigne, & Donahue,
2010). The uncontrolled behavior is only a partial integration with the self because
conflict with other activities might occur. When engagement is thwarted prematurely,
negative affect is experienced, and stressors develop (Mageau, Vallerand, Rousseau,
Ratelle, & Provencher, 2005; Stenseng, Rise, & Kraft, 2011). The adaptive or
maladaptive regulatory characteristic of these two passions is a factor that explains
differing outcomes. Obsessive passion can generate stressors through the internal conflict
between choices of activities, concerns with external contingencies, and excessive
engagement, which may lead to increased burnout (Curran et al., 2015).

42
Curran et al. (2015) have performed a meta-analysis of empirical research that
measures the outcomes theorized and tested for harmonious and obsessive passion. The
authors collected and analyzed 26 outcomes in four areas of intrapersonal interest:
well/ill-being, motivational factors, cognitive outcomes, and behavior/performance.
Large differences in outcomes were noted between the two passions; either no effect or
even reverse effects from one passion to the other were found. Burnout was negatively
correlated with harmonious passion at -.44 and positively correlated with obsessive
passion at .15. This confirms the value of the dualistic model in helping to explain
burnout. Correlations with implications for burnout include positive affect correlated with
harmonious passion at r=.35, but not obsessive passion, and negative affect correlated
with obsessive passion at r=.25, but not with harmonious passion. Rumination correlated
with obsessive passion at r=.47, suggesting a source of stressors. Performance avoidance
goals and performance approach goals were correlated with obsessive passion at r=.21
and r=.16, respectively. These confirm that obsessive passion is related to external
contingencies around those activities. Table 2 provides a summary of these partial
correlations. Partial correlations separate out the effects of one passion from the other;
although the two passions are distinct constructs, there is commonly a shared variance in
samples (Vallerand, 2015). The empirical data show the defining aspects of harmonious
and obsessive passion that make each one unique and suggest that passion might help
explain burnout.

43
Table 2
Partial Correlations of Passion Outcomes
Passion
Type Burnout
Positive
affect
Negative
affect
Perform.
avoidance
goal
Perform.
approach
goal Rumination
Harmonious -0.44 0.35
Obsessive 0.15 0.25 0.21 0.16 0.47
* Weighted partial correlations (pr+) corrected for sampling error; blank indicates n.s.
Adapted from Curran et al. (2015).
Entrepreneurial passion. Studies of entrepreneurial passion represent a fairly small
group; Table 3 lists the empirical research that was found as part of this review. As
mentioned earlier, only one study of entrepreneurial burnout was found, namely that of
de Mol et al. (2016). The remaining 28 studies provide little insight into possible burnout
implications. What support there is for burnout explanations comes predominantly from
correlated outcomes that show a shared nomological network that helps to support the
value of testing passion in an entrepreneurial burnout model.
No known burnout research has applied the Cardon et al. (2009) conceptualization
of entrepreneurial passion to date. Entrepreneurial passion researchers have found
relationships with some burnout-related individual level constructs: effort (Gielnik,
Spitzmuller, Schmitt, Klemann, & Frese, 2015), time spent on activities (Murnieks,
Mosakowski, & Cardon, 2014), persistence (Cardon et al., 2013; Cardon & Kirk, 2015),
innovative behavior (Kang, Matusik, Kim, & Phillips, 2016), role ambiguity (Collewaert
et al., 2016), grit (Mueller et al., 2017), and entrepreneurial self-efficacy (Biraglia &
Kadile, 2017; Cardon & Kirk, 2015; Huyghe, Knockaert, & Obschonka, 2016; Murnieks
et al., 2014). Entrepreneurial self-efficacy is particularly interesting because one of the
dimensions of burnout is a form of efficacy. Shared firm-level outcomes have also been

44
found: venture survival (Stenholm & Renko, 2016), venture growth (Baum & Locke,
2004; Baum et al., 2001; Drnovsek, Cardon, & Patel, 2016), financial performance (Ho &
Pollack, 2014), and spin-off and startup intentions (Biraglia & Kadile, 2017; Huyghe et
al., 2016). These findings suggest that passion shares at least a nomological network with
entrepreneurial burnout and thus warrants further investigation.

45
Table 3
Studies including Direct Measures of Passion of Entrepreneurs
Study
Passion
Definition
Antecedents(s),
Mediator(s) and
Moderator(s) in model
Dependent
Variable(s) Findings
Baum et al.
(2001) Smilor (1997)
Passion, tenacity,
proactivity,
competencies,
motivation, strategies,
environment Venture growth
Passion has an indirect effect on venture growth,
mediated through competencies (general and
specific), motivation and competitive strategies.
Baum and
Locke (2004) Self-developed
Passion, tenacity, new
resource skill, vision,
goals, self-efficacy Venture growth
Goals, self-efficacy, and communicated vision had
direct effects on venture growth, and these factors
mediated the effects of passion, tenacity, and new
resource skill on subsequent growth.
Breugst et al.
(2012)
Based on
Cardon et al.
(2013),
employee’s
perceptions of
founder
passion for
inventing,
founding and
developing
Entrepreneur’s
passions, employee’s
positive affect, and
goal clarity
Employee
affective
commitment
Employees’ perceptions of entrepreneurs’ passion
for inventing and developing enhance
commitment, passion for founding reduces it.
Employees’ experiences of positive affect and goal
clarity mediate these effects.

46
Study
Passion
Definition
Antecedents(s),
Mediator(s) and
Moderator(s) in model
Dependent
Variable(s) Findings
Cardon et al.
(2013)
Cardon et al.
(2013) -
inventing,
founding, and
developing
Passions, identity
centrality (founder,
inventor, and
developer)
Creativity,
persistence,
absorption
Passion for inventing is related to creativity.
Passion for founding and for developing are both
related to persistence. The interaction between
passion for founding and identity centrality-
founding is positive towards persistence and
creativity. Passion for developing is related to
absorption. The interaction between passion for
developing and centrality-developing is positive
towards absorption.
De Clercq et al.
(2013)
Baum &
Locke (2004)
Feasibility, desirability,
passion, learning
orientation, autonomy
Entrepreneurial
intention
Passion positively relates to entrepreneurial
intentions, as well as positively moderates
perceptions of feasibility and desirability effects
on intentions. Autonomy preference interacted
with passion and learning orientation for an
additional positive affect.
Ho and Pollack
(2014)
Vallerand et al.
(2003) -
harmonious
and obsessive
Network centrality
(inward or outward)
Referral income,
business income
Out-degree network mediated harmonious passion
and referral income. In-degree network mediated
negative obsessive passion and referral income
relationship.
Murnieks et al.
(2014)
Vallerand et al.
(2003) -
harmonious
Entrepreneurial
identity, passion, self-
efficacy
Time spent on
activities
Passion rises and falls in connection with
entrepreneurial identity centrality; passion is
associated with individual entrepreneurial
behavior and entrepreneurial self-efficacy.

47
Study
Passion
Definition
Antecedents(s),
Mediator(s) and
Moderator(s) in model
Dependent
Variable(s) Findings
Cardon and
Kirk (2015)
Cardon et al.
(2013) -
inventing,
founding, and
developing Self-efficacy, passions Persistence
The self-efficacy to persistence relationship is
mediated by passion for inventing and for
founding but not by passion for developing.
Dalborg and
Wincent (2015)
Vallerand et al.
(2003) -
harmonious
“Pull"
entrepreneurship, self-
efficacy Passion
Self-efficacy mediates the influence of pull
entrepreneurship on founder passion.
Gielnik et al.
(2015)
Cardon et al.
(2013) -
inventing and
founding
Effort, new venture
progress, free choice Passions
Changes in entrepreneurial passion are a
consequence of entrepreneurial effort, and that the
interplay of new venture progress and free choice
provides a causal link underlying the effect of
entrepreneurial effort on passion.
Thorgren and
Wincent (2015)
Vallerand et al.
(2003) -
harmonious
and obsessive Passions
Types of
entrepreneurship
(habitual, serial
single, or
portfolio)
Obsessive passion is positively related to all types
of entrepreneurship, and most strongly portfolio.
Harmonious passion is related to portfolio only.
Biraglia and
Kadile (2017)
Cardon et al.
(2013) -
founding Passion, self-efficacy
Entrepreneurial
intentions
Entrepreneurial passion had a strong positive
relationship with entrepreneurial intentions, even
when entrepreneurial self-efficacy was introduced
as a mediator.

48
Study
Passion
Definition
Antecedents(s),
Mediator(s) and
Moderator(s) in model
Dependent
Variable(s) Findings
Collewaert et
al. (2016)
Cardon et al.
(2013) -
founding
Venture change, role
ambiguity, feedback
Passion for
founding
Feelings of passion for founding change over time,
but not founder identity. Idea pivots limited
passion decrease, and feedback limited role
ambiguity negative effects.
de Mol et al.
(2016)
Vallerand et al.
(2003) -
harmonious
and obsessive
Job fit, destiny beliefs,
passions Burnout
Perceived job fit related to harmonious passion
and reduced burnout. Job fit only related to
obsessive passion when destiny beliefs were
present, then increased burnout.
Drnovsek et al.
(2016)
Cardon et al.
(2013) -
developing
Goal commitment, goal
challenge, passion Venture growth
Direct positive effects of passion for developing
on venture growth and an indirect positive effect
mediated by goal commitment, but not goal
challenge.
Gielnik, Uy,
Funken, and
Bischoff (2016)
Vallerand et al.
(2003) -
harmonious
Training, self-efficacy,
passion Business startup
Entrepreneurial self-efficacy is important to
maintain high passion after training. Maintaining
high passion after training eventually leads to
business creation.
Huyghe et al.
(2016)
Cardon et al.
(2013) -
inventing
Scientific obsessive
passion, self-efficacy,
affective organizational
commitment, passion
Spin-off
intentions,
startup
intentions
Higher levels of passion are associated with
stronger spin-off and start-up intentions. Obsessive
scientific passion is positively associated with
researchers' intentions to create a spin-off, and
negatively with propensity to establish a start-up.
Obsessive scientific passion moderates passion–
intentions relationship such that it strengthens
spin-off intentions.

49
Study
Passion
Definition
Antecedents(s),
Mediator(s) and
Moderator(s) in model
Dependent
Variable(s) Findings
Kang et al.
(2016)
Cardon et al.
(2013)-
inventing
Passion, organizational
climate (innovative,
proactive and risk-
taking)
Employee
innovative
behavior
Passion for inventing is positively related to
innovative behavior. Firm-level innovative climate
affects innovative behavior through passion and is
moderated by proactive climate. Risk-taking
climate moderates the passion/behavior link.
Stenholm and
Renko (2016)
Cardon et al.
(2013)-
inventing,
founding, and
developing Passion, bricolage Venture survival
Entrepreneurs passionate about inventing and
developing are more likely to engage in bricolage
and, combined, the affective state of passion and
bricolage help entrepreneurs keep their businesses
going.
Davis,
Hmieleski,
Webb, and
Coombs (2017)
Chen et al.
(2009) -
Perceptions
Creativity, funders
affective reactions,
passion
Crowdfunding
performance
Perceived product creativity is positively related to
crowdfunding performance, directly and indirectly
through positive affective reactions of funders.
Perceived entrepreneurial passion positively
moderates the indirect effect.
Mueller et al.
(2017)
Cardon et al.
(2013)-
developing
Passion, locomotion,
assessment
Grit,
performance
Developer passion and grit is mediated by
locomotion and assessment; with a positive
relationship between locomotion and grit and a
negative relationship between assessment and grit.
Grit and venture performance were positively
related.

50
Study
Passion
Definition
Antecedents(s),
Mediator(s) and
Moderator(s) in model
Dependent
Variable(s) Findings
Cardon,
Mitteness, and
Sudek (2017)
Chen et al.
(2009) -
Perceptions
Passion (enthusiasm
and preparedness), time
commitment, money
commitment, capital
efficiency, commitment
Funding
potential
Investors prefer entrepreneurs prepared and
committed to ventures. Enthusiasm has positive
effect when entrepreneurs invest little of their own
money or time, but a negative effect when
entrepreneurs invest a lot of personal money or
time.
Fisher et al.
(2018)
Vallerand et al.
(2003) -
harmonious
and obsessive
Passions, sustained
entrepreneurial
commitment, resilience
Entrepreneurial
success
Harmonious passion contributes directly and
indirectly to perceptions of entrepreneurial success
through resilience; Obsessive passion contributes
to sustained entrepreneurial commitment which
contributes to success through resilience.

51
Eight entrepreneurial passion studies have applied the dualistic model of passion.
Among those, only four incorporated the full model, with both harmonious and obsessive
passion (de Mol et al., 2016; Fisher et al., 2018; Ho & Pollack, 2014; Thorgren &
Wincent, 2015), while three used only harmonious passion (Dalborg & Wincent, 2015;
Gielnik et al., 2016; Murnieks et al., 2014), and one used obsessive passion alone
(Murnieks, Cardon, Sudek, White, & Brooks, 2016). Among these was the sole
entrepreneurial burnout study, which included subjective perceptions of job fit as an
antecedent (de Mol et al., 2016). Harmonious passion was moderately negatively related
to burnout (r=-.63), and more strongly than in meta-analytical results (r=-.44) from other
populations (Curran et al., 2015; de Mol et al., 2016). Obsessive passion had a small and
insignificant correlation compared to the meta-analytical results (r=.15 Curran et al.,
2015). This study suggests that the dualistic model of passion holds promise for
explaining a complex relationship with entrepreneurial burnout.
Within the dualistic model studies, one study has noted that obsessive passion has
meaning for investors due to its uncontrolled motivational power (Murnieks et al., 2016).
This conclusion was based on a conjoint study of 43 angel investors. These investors are
practice experts in evaluating entrepreneurs’ performance potentials, and they value
passion as a positive indicator (Hsu, Haynie, Simmons, & McKelvie, 2013; Mitteness,
Baucus, & Sudek, 2012). The absence of obsessive passion from much of the
entrepreneurial passion research may represent a significant gap.
The dualistic model of passion holds promise for helping to explain a complex
involvement of passion with burnout. Passion represents a motivational energy source
with implications for burnout, both in terms of helping stave off exhaustion and possibly

52
contributing to stressors through the pathway of obsessive passion. Differing effects of
harmonious and obsessive passion indicate that a net burnout response is the result of the
interplay between the two types. Angel investors might value obsessive passion for its
positive venture outcomes (Murnieks et al., 2016), but it is missing from the Cardon et al.
(2009) entrepreneurial passion model. The limited burnout research that includes any
form of passion, and particularly obsessive passion, represents an important gap.
Summary
The preceding sections comprised a review of the extant literature with a view to
exploring three gaps: the limited research concerning a construct as important as
entrepreneurial burnout, the lack of a suitable entrepreneur-venture fit model of burnout,
and open questions of how entrepreneurial passion affects burnout. The review of
entrepreneurial burnout literature revealed how little the under-developed research
explains. One reason offered was the uniqueness of the entrepreneurial experience.
Conceptualizing such a broad range of stressor sources has proven to be difficult, and
existing models based on other occupations have not been up to the task.
The review of existing entrepreneur-venture fit models started with a general
person-job burnout model, followed by one entrepreneurial burnout model. The
conceptualization of stressors for entrepreneurs is limited in these models. The person-fit
model is a suitable framework upon which to build an entrepreneurial-venture fit burnout
model, but conceptualizing the stressors continues to be a challenge. In the literature,
collecting respondent perceptions of fit is a common method to address these challenges,
but person-environment fit theory suggests that there are limitations to this approach.

53
The final section was a review of entrepreneurial passion literature whose aim
was to explore whether and how it may help explain entrepreneurial burnout. Several
conceptualizations of passion were discussed, with two main models outlined in detail.
No burnout research was found that applied the most popular entrepreneurial passion
conceptualization, namely that of Cardon et al. (2009), but evidence was found to suggest
that passion might relate to burnout. A single entrepreneurial burnout study was found in
which the dualistic model of passion (Vallerand et al., 2003) was used. Different
relationship effects were noted for each type of passion, which, when combined with how
the two types work, may help to explain the stressor and energetic pathways to burnout.
In light of the above, this study addresses the stated gaps by asking the question:
How do the characteristics of entrepreneurs and the situational characteristics of
entrepreneurs’ ventures combine and interact with passion to explain
entrepreneurial burnout?
The next section provides a description of the theory and hypothesis development
for the proposed study. Drawing on person-environment fit models, a cognitive
conceptualization of factors affecting fit is adopted to create an entrepreneur-venture fit
burnout model. Next, the dualistic model of passion is integrated into the new model to
explore the effects of passion.
Theory and Hypothesis Development
In this section, an entrepreneur-venture fit model of burnout is developed by
conceptualizing both entrepreneurs and ventures as cognitive characteristics. Next,

54
passion is integrated into the burnout model to explain its effects. The complete research
model is presented last.
Entrepreneur-Venture Fit
A fit model of burnout and one of entrepreneurial burnout were reviewed earlier,
with weaknesses noted in the conceptualization of fit. The present study develops an
entrepreneur-venture fit burnout model that addresses those challenges, which were
rooted in determining the stressor sources and energetic resources of entrepreneurs. First,
the entrepreneurial experience involves a broad range of potential stressor sources
(Baron, 1998; Venkataraman, 1997). Second, person-environment theory requires
commensurate characteristics on both sides of the model (the entrepreneurs and their
ventures) (Edward et al., 1998; French et al., 1974). Last, the characteristics on each side
of the model must be measurable to avoid biases of relative fit perceptions (Bunderson,
2001; Schneider, 1975). Each of these challenges is addressed below.
The person-environment fit model of burnout captures a broad range of stressors.
Individual and situational factors interact to produce stressors; thus, this type of model
captures both elements of the interaction (Caplan, 1987; French et al., 1982). The pair of
burnout studies reviewed showed that fit-based burnout models hold promise (de Mol et
al., 2016; Maslach & Leiter, 2008). Thus, the person-environment theory (Caplan, 1987;
Edward et al., 1998) perspective was adopted for this study and incorporated into an
entrepreneur-venture fit model of burnout.
Person-environment theory requires that conceptualizations of fit be
commensurate between the person and the environment (Edward et al., 1998; French et
al., 1974). Each must be evaluated in the same terms to investigate the interactional
55
effects. Entrepreneurs and their ventures are obviously not the same, so this is a
challenging requirement. Conceptualizing abstract dimensions for fit is possible, as in the
case of the Maslach et al. (2001) person-environment fit model of burnout. Researchers
must evaluate each side of the fit separately, and no burnout research was found to have
accomplished this objective. Instead, perceptions of fit were implemented in the two
burnout fit models reviewed previously: Maslach and Leiter (2008) and de Mol et al.
(2016). Perceptions of fit do not meet the requirements of person-environment theory and
may also distort findings due to personal biases (Schneider, 1975). These weaknesses are
addressed in this study by conceptualizing both entrepreneurs and their ventures
consistently as cognitive characteristics that can be measured independently.
Cognitive resources are recognized as abilities and energy resources that are
applicable to the job demands-resources view of burnout (Bakker & Demerouti, 2007;
Demerouti et al., 2001; Richter & Hacker, 2014). Baron (2004) has suggested that a
cognitive perspective might provide insights into questions about entrepreneurial success.
Cognition refers to mental processes such as collecting information, directing attention,
setting goals and motivating to action (Baron, 2004). Entrepreneurship is a dynamic and
action-oriented process involving diverse activities in a broad range of areas
(Venkataraman, 1997). Furthermore, it is reasonable to expect that the manner in which
entrepreneurs think could be important to entrepreneurial outcomes such as burnout.
Regulatory focus theory
Brockner et al. (2004) have proposed regulatory focus theory as a useful cognitive
framework for studying the entrepreneurial process. This theory involves two orientations
of cognitive styles: promotion and prevention. These are independent and orthogonal

56
cognitive styles that affect how goals are selected and how strategies are chosen to pursue
them (Higgins, 1997). Throughout the entrepreneurial process, one or the other
orientation may be better (Baron, 2004; Brockner et al., 2004). Either orientation could
be adopted to pursue any goal, but many goals are most effectively pursued by utilizing
one of them (Higgins, 1997). Individuals have innate preferred orientations, but
temporary mental switches are possible. This set of characteristics suggests that
regulatory focus theory may be ideal for capturing the dynamic nature of entrepreneurs
within their ventures. This study proposes a trait-based regulatory focus (promotion and
prevention) to describe entrepreneurs and a work-specific regulatory focus to classify
their venture work demands, creating a cognitively-based entrepreneur-venture fit model
for burnout.
Regulatory focus orientations. Theories of self-regulation are examinations of
how and why individuals select particular end-states, select the means to pursue chosen
end-states, and engage the means until the end-state is attained (Molden, Lee, & Higgins,
2008). These self-regulating characteristics fit somewhere between personality and
people’s values and goals (Kruglanski, Orehek, Higgins, Pierro, & Shalev, 2009).
Regulatory focus theory (Higgins, 1997, 1998) is a self-regulation theory proposed to
have particular value in explaining motivational energy in the entrepreneurial process
(Brockner et al., 2004).
Regulatory focus theory categorizes motivations into drives to satisfy two major
classifications of needs: advancement and security (Molden et al., 2008). Advancement
needs are concerned with approaching desired new conditions; this is called promotion
focus. Security needs are concerned with avoiding undesirable new conditions; this is

57
called prevention focus. These two foci, or cognitive orientations, start with a difference
in how the end-states are perceived (desired or undesired) and result in distinct
approaches to goal selection, intentions, and actions (Higgins, 1997).
A promotion focus drives the pursuit of the ideal self through growth or
engagement strategies (Higgins, 1997). The desirability of end-states frames how goals
are selected. These goals take one of two forms: the accomplishment of a positive,
desired end-state or the avoidance of the absence of a positive end-state. For example,
consider a glass in which the presence of water is a positive, desirable end-state. A
promotion focus goal is to fill the glass with water, thus achieving the desired end-state.
Another promotion focus goal is to make sure the glass has no cracks, thereby avoiding
an absence of the desired end-state. Promotion focus strategies are not concerned with
potential losses; the emphasis is on the desirable gain. For example, entrepreneurship
promotion is likely well suited to exploring new ideas and starting new ventures
(Brockner et al., 2004).
A prevention focus drives the pursuit of the ought self through duty and
responsibility strategies (Higgins, 1997). The undesirability of end-states frames how
goals are selected. These goals take one of two forms: avoidance of the undesirable end-
state or accomplishment of the absence of the negative or undesired end-state. Consider
the glass of water again; a prevention focus goal is to cover the glass so that it cannot
spill, thus avoiding the undesirable loss. Another prevention goal is to stand by to refill
the glass immediately should it begin leaking, thus achieving an absence of the undesired
end-state. Prevention focus strategies are concerned with potential losses; the emphasis is
on how to avoid them. In the entrepreneurial setting, prevention is likely well suited to

58
the analysis of new ideas for feasibility, namely the due diligence process (Brockner et
al., 2004).
Promotion and prevention are independent, self-regulatory systems; both might
co-exist within an individual (Förster, Higgins, & Bianco, 2003; Scholer & Higgins,
2008). It is possible for each focus to have low to high levels independently of the other.
Meta-analysis has supported this contention (Lanaj, Chang, & Johnson, 2012). Brockner
et al. (2004) have suggested that both regulatory foci are important for entrepreneurial
success. At different points in the entrepreneurial process, however, certain foci may be
more important for success. For example, when ideas for new opportunities are needed, a
promotion focus is most effective. Later, when performing operations to deliver products
or services to customers on time, a prevention focus might be more effective.
Entrepreneurs with higher levels of both regulatory foci could engage in a broader range
of activities in the entrepreneurial process most effectively. Regulatory focus theory
should, therefore, be relevant to capturing important aspects of entrepreneurial cognition
(Brockner et al., 2004). These characteristics of regulatory mode orientations are shown
in Table 4.
Table 4
Regulatory Focus Orientations
Characteristic Promotion Prevention
Goal framing Get to desired condition Prevent undesired condition
Types of
Needs Advancement Security
Motivation Approach Avoidance
Loss
sensitivity No Yes
Strategies
Growth and Engagement,
Eagerness strategies
Duty and Responsibility,
Vigilance strategies

59
Regulatory focus has both trait and state conceptualizations. The trait-based
regulatory focus stems from early development experiences and represents a chronic
preference for foci that normally remain stable over time (Higgins, 1997), while the state-
based regulatory focus is a temporary shift in focus preference based on immediate
influences (Higgins, 1997). In the workplace setting, tactical responses to job demands
prompt these state influences and are referred to as work-specific regulatory foci
(Johnson et al., 2015; Neubert et al., 2008; Wallace, Johnson, & Frazier, 2009).
Responses to the demands of the workplace, and thus the workplace environment itself,
can be conceptualized as promotion and prevention regulatory foci. A trait-based
regulatory focus represents a cognitive characteristic of the person, and a work-specific
regulatory focus represents a matching characteristic of the work environment.
In summary, regulatory focus theory, with its promotion and prevention
orientations, provides a useful framework for describing the cognitive characteristics of
entrepreneurs, and trait-based regulatory focus orientations of entrepreneurs characterize
them along these two dimensions. Work-specific regulatory orientations reflect venture
environments through the temporary responses of entrepreneurs. Together, these two
orientations conceptualize a cognitive perspective of entrepreneurs and their ventures,
meeting the consistency and objectivity requirements of the person-environment model to
predict stressor generation in a burnout model.
Hypothesis development
Recall that burnout has two pathways, a stressor one and an energetic one (Bakker
& Demerouti, 2007; Demerouti et al., 2001; Maslach et al., 2001). The stressor pathway
leads to the development of burnout as stressors occur. The energetic pathway provides

60
resources to mitigate stressors and fuels engagement. Each is important for explaining
burnout; if stressors are high and energetic resources are low, burnout develops.
The regulatory focus conceptualization leads to two separate fit cases: promotion
fit and prevention fit. There are differences in some of the proposed hypotheses due to the
unique characteristics of each focus type. Promotion fit buffers stressors and provides
energy, while prevention fit contributes to stressors while providing energy. The next
section explains promotion fit, followed by an explanation of prevention fit.
Direct promotion fit. In terms of person-environment fit theory, reduced fit leads
to increasing stressors (Caplan, 1987; French et al., 1982). Maslach et al. (2001) have
explained that stressors lead to burnout, and this relationship was observed in a
perception of fit burnout model (Maslach & Leiter, 2008). Lower perceptions of job fit
were related to higher levels of burnout (Maslach & Leiter, 2008). Stressors draw energy
away, depleting resources and leading to burnout (Maslach et al., 2001). Based on these
arguments, stressors are expected to increase with lower promotion fit and to decrease
with higher promotion fit.
The energetic pathway must also be considered; it is affected by regulatory focus
characteristics. The regulatory focus conceptualization was explained earlier, but recall
that goal setting and motivation are closely connected to regulatory modes (Higgins,
1998). Increased motivational energy is associated with higher levels of each regulatory
focus, albeit toward different goal types. In terms of regulatory fit theory, when
regulatory fit is high, the goal pursued is perceived as more important and is engaged
more strongly (Avnet & Higgins, 2003). Research shows that individuals increase
engagement in activities that are consistent with their regulatory orientations (Avnet,

61
2006; Higgins, 2005; Kruglanski et al., 2009). Based on these arguments, energy is
expected to increase with higher promotion fit and to decrease with lower promotion fit.
Burnout behaves as follows: at low levels of promotion fit, stressors increase and
energy decreases, leading to increased burnout. At high levels of promotion fit, stressors
decrease and energy increases, leading to decreased burnout. Thus:
H1: Entrepreneur-venture promotion fit is negatively associated with burnout.
Direct prevention fit. The above reasoning for a direct promotion fit effect also
applies to a direct prevention fit hypothesis, but with an added effect. The stressor and
energetic pathways for burnout are affected by prevention fit according to the same
reasoning applied earlier to promotion fit. The presence of prevention regardless of fit
introduces an additional effect to the stressor pathway of burnout.
Prevention focus is defined as being oriented toward avoiding undesirable
outcomes, typically losses (Higgins, 1997). A person with a prevention focus is attentive
to monitoring for these losses and is particularly aware of limited resources. Resource
depletion and stress are related to the resulting avoidance goals (Elliot, Thrash, &
Murayama, 2011). Studies of the effects of avoidance goals have established stressor-
related individual effects such as worry, threat, and rumination (Derryberry & Reed,
1994; Elliot & Harackiewicz, 1996). Individuals with strong prevention foci have been
observed to have elevated stressor levels (Brenninkmeijer et al., 2010). These stressor-
related effects of avoidance goal preference, and the established linkage of strong
prevention focus to increased stressors, have suggested an additional stressor pathway
input.

62
Therefore, cases of higher prevention fit generate additional stressors. Although
the same stressor and energetic process are in place as with promotion fit, a new source
of stressors occurs with the presence of higher levels of prevention foci. Entrepreneurs
experiencing prevention fit may feel more pressure to meet external demands and avoid
failure, which manifests as greater stressors. The increasing stressors that derive from an
avoidance goal-dominated venture may temper lowered stressors from a higher
prevention fit. The energetic process benefits of prevention fit and stressor reduction
expected from fit agreement are still present and drive the direction of the relationship.
Burnout behaves as follows: at low levels of prevention fit, stressors increase and
energy decreases, leading to increased burnout. At high levels of prevention fit, stressors
decrease and energy increases, leading to decreased burnout. Thus:
H2: Entrepreneur-venture prevention fit is negatively associated with burnout.
Passion as a moderator. The burnout model includes passion due to its important
energetic and stressor-related effects, which are contingent on the type of entrepreneur-
venture fit experienced. As an energetic resource, passion bolsters energy, leading to
reduced burnout. Research has shown a significant negative relationship with burnout, at
least with the harmonious form (Curran et al., 2015; de Mol et al., 2016). The relationship
is more complex, however, and obsessive passion has a positive but smaller magnitude
relationship with burnout (Curran et al., 2015; de Mol et al., 2016; Vallerand et al., 2010).
The differing response may be due to the differences in controllability and the goal
perspectives of each passion type. The uncontrolled and externally focused nature of
obsessive passion creates stressors as conflict occurs from displaced activities and

63
concerns over external contingencies (Vallerand et al., 2003). Harmonious passion works
to counter the deleterious effects of obsessive passion by supporting more control and
balance among activities and providing an intrinsic motivation that draws the focus away
from externalities (Fisher et al., 2018; Vallerand et al., 2003). The unique goal
perspectives of harmonious and obsessive passion, intrinsic vs. extrinsic, suggest linkages
to the motivational biases of promotion and prevention regulatory foci. Thus, each type
of passion affects each type of entrepreneur-venture fit differently. A moderation model
has been proposed to explain when each type of passion affects each type of
entrepreneur-venture fit and leads to more or less burnout.
Promotion fit moderation by passion. As described for H1, promotion fit reduces
burnout by generating fewer stressors and providing energy, so burnout decreases.
Burnout increases when fit is low because more stressors occur, and less energy is added.
One defining characteristic of passion is that it is a strong motivational, or energetic,
force (Cardon et al., 2009; Vallerand & Houlfort, 2003). Each of the passion types adds
to the energetic pathway of burnout and leads to some reduction. There are significant
differences in how each passion type further affects burnout beyond the energetic
influence.
Harmonious passion has fundamental consistencies with a promotion regulatory
focus. Promotion is concerned with moving toward new end-states and having less
concern for potential losses or costs (Higgins, 1998). Harmonious passion shares these
motivational characteristics with activities at the core of passion that are valued for their
engagement alone and not for their costs or risks (Vallerand et al., 2003). This synergy of
drivers that lower stressors and increase energy magnifies the burnout response to fit.

64
Entrepreneurs experiencing high promotion fit see a greater reduction in burnout when
harmonious passion is higher. Thus:
H3a: Harmonious passion moderates the entrepreneur-venture promotion fit to
burnout relationship, such that as harmonious passion increases, the
relationship between promotion fit and burnout becomes more negative.
Obsessive passion exhibits an almost uncontrollable and involuntary drive to meet
external contingencies (Vallerand et al., 2003; Vallerand et al., 2010). Obsessive passion,
similar to prevention focus, is also attentive to monitoring for external appraisals and
sensitive to failings (Vallerand et al., 2003). As mentioned before regarding prevention
focus, avoidance goals are associated with resource depletion and stress (Elliot et al.,
2011). Stressors originate this way from the concern for external comparisons and
requirements, which is also the nature of obsessive passion (Belanger, Lafreniere,
Vallerand, & Kruglanski, 2013; Vallerand et al., 2010). Within the context of promotion
fit, this contrasting, external, contingencies-based motivational characteristic of obsessive
passion tempers the negative burnout response. The unique nature of obsessive passion
may also produce negative affect, potentially interacting further with cognitive processes.
When tasks associated with obsessive passion are thwarted or end, negative affect
results (Mageau et al., 2005; Stenseng et al., 2011). Neuropsychological and experimental
evidence has shown that affect, such as that involved in passion, is an important part of
decision-making in complex situations (Forgas & George, 2001) such as entrepreneurship
(Baron, 2007). Cognitive processes and affective states interact in their influence on
behavior (Forgas & George, 2001). For instance, experiments have shown more

65
flexibility in cognitive functions with greater positive affect (Lyubomirsky, King, &
Diener, 2005).
Obsessive passion is then expected to interact with promotion fit to change the
burnout response. High promotion fit should lead to low burnout when obsessive passion
is low and a higher level of burnout when obsessive passion is high. Low promotion fit
should lead to high burnout regardless of obsessive passion. Thus:
H3b: Obsessive passion moderates the entrepreneur-venture promotion fit to
burnout relationship, such that as obsessive passion increases, the
relationship between promotion fit and burnout becomes less negative.
Prevention fit moderation by passion. The arguments underlying this part of the
model are somewhat symmetrical with the previous hypotheses. As described above for
H2, prevention fit reduces burnout by generating fewer stressors and providing energy, so
burnout decreases. When prevention fit is low, more stressors occur, and less energy is
added, so burnout increases. When prevention fit increases, lower stressors and more
energy lead to reduced burnout. A new stressor pathway owing to the avoidance goal
domination of prevention focus tempers the burnout decrease compared to the promotion
fit case. In this section, an explanation is offered regarding how passion changes that
response.
Obsessive passion has fundamental consistencies with a prevention focus:
prevention is concerned with avoiding negative outcomes by avoiding mistakes and
having the most concern for potential losses or costs (Higgins, 1998), and obsessive
passion shares these motivational characteristics, with a focus on activities valued for

66
their results or outcomes rather than the engagement itself (Vallerand, 2015). In situations
with high prevention fit and high obsessive passion, entrepreneurs engage a greater
number of venture activities associated with avoidance-type goals (Higgins, 1998;
Vallerand, 2015). Managing these activities exposes entrepreneurs to negative affect and
stressor generation when activities are thwarted or stopped (Mageau et al., 2005;
Stenseng et al., 2011). The setup of H3b explains the implications of negative affect.
Recall that the explanation included stressor generation from negative affect and possible
cognitive changes at very high levels of affect (Baron, Hmieleski, & Henry, 2012). In the
case of promotion fit, the venture environment was dominated by approach-type goals,
which help one avoid extreme levels due to a balance of activity motivation types
(approach and avoidance). In this prevention fit case, there is little balance at high levels
of fit and obsessive passion; avoidance-type goal activities dominate the venture
experience. Higher levels of negative affect become more likely, leading to magnified
stressors and cognitive change effects.
The uncontrolled engagement of avoidance-type behaviors that obsessive passion
brings, along with the already present domination of avoidance goal directed work due to
prevention fit, magnifies the generation of stressors and affects how entrepreneurs
manage these stressors. Obsessive passion is then expected to interact with prevention fit,
and entrepreneurs who experience high prevention fit should also experience increasing
burnout when obsessive passion is higher. Thus:
H4a: Obsessive passion moderates the entrepreneur-venture prevention fit to
burnout relationship such that as obsessive passion increases, the

67
relationship between prevention fit and burnout changes from negative to
positive.
Harmonious passion exhibits an intrinsic motivation preference that relates to
approach-type motivations (Vallerand et al., 2003). In the case of prevention fit,
harmonious passion represents a force to balance the dominance of avoidance goals, thus
lessening the related stressor effects (Derryberry & Reed, 1994; Elliot & Harackiewicz,
1996). Harmonious passion should motivate entrepreneurs to select and pursue approach-
oriented goals, thus helping to reduce avoidance-goal stressors. An additional benefit
may come from the positive affect related to harmonious passion. Distractions, activities
with pleasurable affect, have been offered as a possible mitigating method for reducing
rumination (Chang, 2004). Harmonious passion reduces avoidance goal-based stressors
and changes how prevention fit relates to burnout.
Harmonious passion, following from these stressor-mitigating characteristics, is
expected to interact with prevention fit to dampen stressors felt from high prevention-fit
situations. In the unmoderated hypothesis H2, it is expected that entrepreneurs
experiencing high prevention fit should experience reduced burnout, and a high level of
harmonious passion should magnify that burnout reduction. Thus:
H4b: Harmonious passion moderates the entrepreneur-venture prevention fit to
burnout relationship, such that as harmonious passion increases, the
relationship between prevention fit and burnout becomes more negative.

68
Research model
Figure 1 shows the complete research model.
Figure 1
Research Model
Harmonious
Passion
Burnout
Promotion
Fit
Prevention
Fit
H1: -
H2: -
H3a:+ H4a:-
Obsessive
Passion
H3b:- H4b:+

69
CHAPTER 3: RESEARCH METHODOLOGY
This chapter consists of four sections. The first contains an outline of the research
setting and data collection design, and the second is a description of the instruments used
to collect measures of the constructs and control variables, including a discussion of the
strategies for managing common method variance. The third section discusses the
instrument testing process. Finally, analytical methods and the process planned to test the
research model and its hypotheses are identified.
Research Design and Data Collection
Survey research is the most common non-experimental method for organizational
research and is appropriate for testing the correlational hypotheses proposed in this study
(Jex & Britt, 2014); such research is also well established within the entrepreneurial
research field. Surveys supply a sampling method to measure variables that provide data
for inference and generalization regarding the overall population (Fowler, 2013). Last,
the model constructs are internal to the individual, because they comprise self-
perceptions, recollections, or opinions. Surveys are appropriate for collecting these data
types and support the quantitative correlational design of this study (Dillman, Smyth, &
Christian, 2014).
Research Setting
A sample of small-company owner-founders was drawn for this two-stage field
study with self-report surveys. The firms were U.S.-based, privately owned, for-profit

70
companies that had been in existence for fewer than 10 years (Cardon & Kirk, 2015;
Shrader, Oviatt, & McDougall, 2000) and had fewer than 250 employees (Cardon &
Kirk, 2015; Taylor & Banks, 1992). The two-wave survey was designed to help address
common method variance errors that could originate from single-source survey reports
(Podsakoff et al., 2012); this is discussed later in a dedicated section.
This study defined entrepreneurs as those who engage in the discovery,
evaluation, and exploitation of opportunities to create value (Shane & Venkataraman,
2000). Firm founders have engaged in exploitation to create their firms, and founders of
newer, smaller firms that are still private are closer to their discovery and evaluation
experiences. Founders who have more recently engaged in startup activities and have not
grown their firms beyond a small scale are considered to be involved in the
entrepreneurial process (Cardon & Kirk, 2015).
Identifying a cut-off age for a firm to ensure that founders are still entrepreneurs
was less certain; the literature varies on this point (Reynolds & Miller, 1992; Shrader et
al., 2000). The maximum age of 10 years was intended to capture firms that were still in
the development stage of the entrepreneurial process, but not to the extent that
development may have dampened entrepreneurial behaviors (Shrader et al., 2000). This
limit is consistent with other entrepreneurship research (e.g., Cardon & Kirk, 2015). The
literature varies regarding what size a small firm is while remaining an entrepreneurial
one (Cardon & Kirk, 2015). The maximum firm size of 250 employees was chosen as
consistent with past practice (Cardon & Kirk, 2015; Taylor & Banks, 1992). The firm age
and size criteria defined a sample of newer, smaller businesses that were generally
consistent with past research practice. A limitation follows from this imperfect method of

71
entrepreneurial firm identification: generalizations about the larger population of
entrepreneurs may not be warranted.
The sample design was similar to other studies of entrepreneurs with similar
constructs. Cardon and Kirk (2015) have used the same sample criteria in a study
involving entrepreneurial self-efficacy and persistence and found that passion for
inventing and passion for founding mediated the relationship. Murnieks et al. (2014) have
used similar sample criteria but limited the firm age to seven years based on previous
research (e.g., Hmieleski & Baron, 2009); they found that passion was related to
entrepreneurial self-efficacy and entrepreneurial effort (Murnieks et al., 2014). The
limitation of seven years applied by Murnieks et al. (2014) was partly derived from the
reported mean venture age of 5.74 years by Hmieleski and Baron (2009), who did not
apply a seven-year limit to their sample frame. Mueller et al. (2017) also removed the age
and size criteria but reported that their mean sample age was 23 years, with 23% of the
sample younger than 10 years. Most firms had fewer than 50 employees (93%), and the
relationships between passion and grit, mediated by regulatory modes, were significant
(Mueller et al., 2017). The success of studies with similar sample criteria using similar
constructs supports this sampling design.
Data Collection
Dun & Bradstreet’s Hoover database identified invitees for the first survey. Dun
& Bradstreet operates a major business credit reporting service in the United States and
globally. New ventures find their services important for financing, vendor, and customer
credit operations, so this database is one of the most exhaustive available (Kalleberg,
Marsden, Aldrich, & Cassell, 1990). The Dun & Bradstreet database has an established

72
history as a source of entrepreneur contacts for research on U.S.-based businesses. A
long-running longitudinal survey by the Kauffman Foundation has used this database to
develop initial contacts (Ballou et al., 2008), and several other studies of entrepreneurs
have drawn from the Dun & Bradstreet database (e.g., Baron et al., 2016; Cardon et al.,
2013; Cardon & Kirk, 2015; Hmieleski & Baron, 2008; Murnieks et al., 2014).
This study planned for an email-invited, web-hosted survey design. Web surveys
offer relatively lower costs and a higher speed of data collection but also commonly have
lower response rates (Dillman et al., 2014). Practical constraints drove the preference for
the lower-cost design. Among the studies identified that used similar samples and the
selected database, most used mailed invitations and printed surveys. Since email and
web-hosted survey designs were not found, response rate expectations for planning
purposes had to be estimated. First, an analysis of mailed and printed survey design
results was undertaken. Next, adjustments reported by past research were applied to
estimate potential returns for this study’s design. Finally, pilot testing results tested the
response rate estimates and confirmed that they were reasonable. The analysis and initial
response rate estimation processes follow next, and the results of pilot testing and final
sample sizing are discussed in a later section.
Mailed and printed surveys experience two major factors that reduce the usable
response: delivery issues such as returned mail, and incomplete or unqualified surveys
returned. Dun & Bradstreet have reported that 20% of firms change location each year
(Hmieleski & Baron, 2009). Undeliverable mailings support this claim and averaged 15%
across three studies (Baron et al., 2016; Cardon & Kirk, 2015; Hmieleski & Baron,
2008). In the two most recent and similar studies, returned and usable response rates for

73
printed and mailed surveys were reported as 6.3% and 4.2% by Cardon and Kirk (2015)
and 9.9% and 8.0% by Baron et al. (2016). The reduction between responses and usable
responses was 23.7% and 5.9% for each study, respectively. For survey-planning
purposes, the more conservative response (6.3%) and usable (23.7% reduction) rates were
chosen to estimate calculations in order to increase the likelihood of achieving a
sufficient sample size.
In addition to postal addresses, email addresses were available from Dun &
Bradstreet for a subset of contacts. No disclosure of how many contacts have email
addresses available was found, so an examination of the database was undertaken;
applying the criteria of this study resulted in 336,477 contacts. Adding a constraint for
campaign-verified emails, which are emails expected to be deliverable 90% of the time,
resulted in 37,329 contacts (11%). Dun & Bradstreet stated that this 90% “represents the
likelihood that an email address will not hard bounce when contacted” (Dun &
Bradstreet, 2018). The concept of bounced emails is similar to an incorrect postal mailing
address. The Dun & Bradstreet assertion that 10% of email addresses arrive at valid
destinations provides an estimate of first losses in an email survey process.
In addition to undeliverable emails, there are other losses unique to email that
mailed survey non-responses conceptually include. Non-consent and opt-out choices
appear in mailed designs as non-response cases. In email designs, these choices may
appear as responses. A comparative analysis of mail rates to email rates should account
for this difference. No studies were found that used Dun & Bradstreet email addresses, so
a direct estimation of non-response losses based on similar studies was not possible. The
survey methodology literature was thus referenced to provide guidance.

74
A meta-analysis of web survey response rates compared to paper survey response
rates showed an average decrease for web surveys of 11% (Manfreda, Bosnjak, Berzelak,
Haas, & Vehovar, 2008). The difference was worse for one-time recruitments similar to
this design, which experienced a 28% decrease (Manfreda et al., 2008). The reasons
given for lowered response rates included over-surveying fatigue (Manfreda et al., 2008),
security and privacy concerns (Sax, Gilmartin, & Bryant, 2003), the fact that a lack of
physical paper made email invitations easy to overlook (Crawford, McCabe, Couper, &
Boyd, 2002), and spam email considerations (Jones & Pitt, 1999). Applying the 28%
adjustment to the earlier identified 6.3% response rate of mailed surveys resulted in a
first-wave initial response expectation of 4.6% for this study.
Reports of second-wave response rates varied depending on situational and
sample specifics (Lynn, 2009). Panel studies of consumers have reported sample losses
ranging from 18% to possibly 50% (Lynn, 2009) for multi-year studies. Shorter periods
between surveys reduced losses (Lynn, 2009), as demonstrated by two recent studies of
entrepreneurs. Drnovsek et al. (2016) have reported a 74% response rate with a 15-month
delay for a sample drawn from a defunct high-tech firm directory that included a $10
incentive for the second survey. Mueller et al. (2017) have reported an 83% response rate
with a 12-month delay for a university alumni directory sample. Each of the identified
studies had characteristics likely to increase responses, an incentive in one and a loyalty
tie in the other, that this design does not have. The more conservative rate observed in the
Drnovsek et al. (2016) second survey with the incentive benefit would seem unlikely in
this study. Setting the second-wave expected response rate was critical for calculating an
initial sample draw, but no better estimate was available.

75
Web survey second-wave response rates were also difficult to estimate. The same
reasons for reduced response rates described earlier are as applicable to the second wave
as to the first. Since the second survey is preceded by the first, respondent reactions are
not as extreme as the one-time recruitment effect observed in cross-sectional studies
(Manfreda et al., 2008). The average response rate reduction seen for web surveys (11%)
was chosen to calculate the second survey response rate estimate of 65.9%.
At the completion of the second wave, a minimum of 229 usable respondents was
expected to be necessary. This minimum size was determined by an a priori sample size
analysis using the software package G*Power 3 (Faul, Erdfelder, Buchner, & Lang,
2009). The G*Power 3 software calculated a minimum sample size for general linear
regression models based on the analytical technique applied, the complexity of the model,
the required levels of errors (both type-I and type-II), and an estimate of the expected
effect size. Assumptions drawn from the model and management research practice were
as follows: 25 predictor variables, including all controls, independent variables, and
interactions; 12 predictor variables to test; a one-tailed level of significance of .05; and
statistical power of .80. An anticipated effect size of .08 was selected based on a review
of several studies that collected similar data and employed passion constructs. The closest
study included burnout as a dependent variable and passion as an independent variable;
the effect sizes of related paths were .371 and .084 (de Mol et al., 2016). Another study
with grit as a dependent variable included passion and a related regulatory mode
construct; these effect sizes were .18 and .036 (Mueller et al., 2017). Additionally,
Cardon and Kirk (2015) have reported an effect size of .124, and Murnieks et al. (2014)

76
have reported .15 and .021. Given the uncertainty of what effect size could be expected,
the .08 level was chosen based on the closest study results (de Mol et al., 2016).
The sample draw size for the initial survey wave was designed to meet the
targeted final study size of n=229. The estimation criteria described earlier were applied
for this email and web-based survey design. Calculations are summarized in Table 5. An
initial sample draw was calculated to require a minimum of 14,500 contacts, which was
within the capability of the database to supply.
Table 5
Sample Size Estimation
Email/Web-Sample Size Estimation Criteria Sample Sizes
Initial Sample Draw 14,500
Fir
st
Wav
e Inaccurate Email Addresses 10% 13,050
Response Rate 4.6% 596
Incompletes and screening issues 23.7% 455
Sec
ond
Wav
e Inaccurate Email Addresses 0% 455
Response Rate and Response 65.9% 300
Incompletes and screening issues 23.7% 229
Target final n= 229
The initial survey solicitation process followed the general recommendations of
Dillman et al. (2014) adapted for web-based surveying. Pre-survey mailings are
recommended for paper surveys, but they are ineffective or at least minimally effective
for web-based surveys (Manfreda et al., 2008; Shih & Fan, 2008). Initial invitations were
therefore sent by email with a direct web link to the survey. Follow-up emails provided
reminders with the direct web link again. The first reminder was sent two to three days
after the initial invitation (Crawford et al., 2002; Dillman et al., 2014). Reminders were
limited to two (Manfreda et al., 2008), with the last sent five days later. Additional

77
reminders are considered ineffective when significant increases in responses are not
noted, as was the case in this study (Dillman et al., 2014).
The initial survey collected the independent and control variables, as well as data
to verify that respondents and ventures qualified for the sample frame. Qualification
questions included: “Are you a founder of this business?” and “Is your business a ‘for-
profit’ type, based in the USA, and privately owned?” The questions about firm age and
employee count were included in the survey as control variables.
The second wave of data collection was primarily a common method variance
control technique (Podsakoff et al., 2012). The dependent variable was collected from the
same firm founder. A separation of the collection of criterion and predictor variables by a
temporal delay may reduce the respondents’ motivations and abilities to answer with
responses primed by the earlier instruments (Podsakoff, MacKenzie, Lee, & Podsakoff,
2003; Podsakoff et al., 2012). The second solicitation was planned for three weeks after
the initial response; this period was chosen to minimize sample loss and still meet the
second wave purpose (Lynn, 2009; Podsakoff et al., 2012). Longer response delays were
experienced, however, partly due to technical issues and also to allow more responses.
Additionally, the holiday season spanned the two surveys, and as noted by other
researchers, responses were slower as a result. The Qualtrics systems used for the survey
delivery also limited the rate of invitation and reminder transmissions, so several batches
had to be sent over a longer period. The same delivery process described for the initial
survey was repeated again for the second survey.

78
Measures
Appendix A contains a list of each of the instruments used in this study. The
dependent variable was assessed using the Maslach Burnout Inventory-General Survey
(Maslach et al., 1996). A summary of the instruments discussed in the next section
appears in Table 6.
Table 6
Measurement Scales Summary
Construct Instrument Name
Research
reference Cronbach’s alpha
Burnout
Maslach Burnout
Inventory-General
Services
MBI-
GS
Maslach et
al. (1996)
Exhaustion 0.89,
Cynicism 0.80,
Efficacy 0.76
Trait
Prevention
Focus
Regulatory Focus
Questionnaire –
Prevention RFQ
Higgins et
al. (2001) 0.80
Trait
Promotion
Focus
Regulatory Focus
Questionnaire –
Promotion RFQ
Higgins et
al. (2001) 0.73
Work
Prevention
Focus
Work Regulatory
Focus – Prevention WRF
Neubert et
al. (2008) 0.92
Work
Promotion
Focus
Work Regulatory
Focus – Promotion WRF
Neubert et
al. (2008) 0.91
Harmonious
Passion Harmonious Passion HP
Vallerand
(2015) 0.79
Obsessive
Passion Obsessive Passion OP
Vallerand
(2015) 0.89

79
Dependent Variable
Burnout. The Maslach Burnout Inventory1 instrument is the most common
measure applied to burnout research across all fields (Mäkikangas & Kinnunen, 2016;
Schaufeli & Enzmann, 1998). There are three forms of the instrument: general services
(GS), human services (HS), and educators (ES) (Maslach et al., 1996). The three forms
are adaptations of the same instrument for different populations. Most entrepreneurs in
this sample were believed to correspond best to the general services form. This general
services scale has been used in most studies of entrepreneurial burnout (e.g., Boles et al.,
2000; de Mol et al., 2016; Shepherd et al., 2010). To best match the sample
characteristics and remain consistent with past research, the Maslach Burnout Inventory-
General Services (MBI-GS) instrument was used in this study.
The burnout construct comprises three separate and independent dimensions:
exhaustion, cynicism toward work, and professional efficacy. Exhaustion was measured
with five items using an anchored scale from one (never) to seven (every day). A sample
item is, “I feel emotionally drained from my work.” Cynicism toward work was
measured with five items, again on the same scale. A sample item is, “I doubt the
significance of my work.” Professional efficacy was measured with six items using the
same anchored scale; a sample item is, “In my opinion, I am good at my job.” Reliability
was reported as Cronbach’s alpha estimates of .89, .76, and .80, respectively (Maslach et
al., 1996).
1 The Maslach Burnout Inventory is copyright © 1996, 2016 Wilmar B. Schaufeli, Michael P.
Leiter, Christina Maslach & Susan E. Jackson. The copyright holders must be compensated for its use and
it may not be published in its entirety in this dissertation.

80
The three dimensions of the Maslach Burnout Inventory are considered distinct
(Maslach et al., 2001); therefore, they cannot be combined or summated without
confounding the construct. Analysis involving this measure was repeated for each
dimension measured, which is consistent with the syndrome-based definition of burnout
employed in this study (Maslach & Jackson, 1981; Maslach et al., 1996; Maslach et al.,
2001).
Independent Variables
Trait regulatory foci. The two trait-based regulatory foci, trait promotion focus,
and trait prevention focus, represent chronic preferences in terms of how individuals
prefer to regulate toward goals. These chronic preferences are argued to have derived
from subjective appraisals of past goal pursuit experiences (Higgins et al., 2001). Two
instruments have been used the most to date (Gorman et al., 2012): the General
Regulatory Focus Measure (GRFM) (Lockwood, Jordan, & Kunda, 2002) and the
Regulatory Focus Questionnaire (RFQ) (Higgins et al., 2001). Both scales are based on
the same theoretical reasoning. Items for the RFQ were designed to assess perceptions of
past success or failure of efforts related to ideal or ought goals (Higgins et al., 2001); that
is, they represent a formative perspective. The items for the GRFM were designed to
assess the effects of promotion or prevention foci support after self-integration of those
past experiences (Lockwood et al., 2002), in other words, a reflective perspective.
Earlier studies have not compared the relative validity of these two measures, but
meta-analytical internal consistencies are higher for the GRFM (Gorman et al., 2012).
The reported Cronbach’s alphas for promotion and prevention measures, using the
GRFM and RFQ, respectively, were .82 vs. .70 and .82 vs. .80. Both scales demonstrated

81
good internal consistency across several studies (Gorman et al., 2012). The major
distinction between these two popular scales is the differing perspective: formative vs.
reflective.
Studies specific of entrepreneurs have included applications of each scale.
Hmieleski and Baron (2008) have used a shortened version of the RFQ in a sample of
entrepreneurs similar to the one planned for this study. The two measures produced good
reliability (.79 for promotion, and .81 for prevention) (Hair, Black, Babin, & Anderson,
2010), and the results showed a positive relationship between promotion focus and
venture performance, along with a negative relationship between prevention focus and
venture performance in dynamic situations (Hmieleski & Baron, 2008). Tumasjan and
Braun (2012) have used a slightly reworded version of the GRFM with a sample of
United Kingdom entrepreneurs. Their measures produced good reliability (.90 for
promotion and .83 for prevention) (Hair et al., 2010), and the study found promotion
positively related to opportunity recognition, whereas prevention focus was unrelated.
Despite the limited number of studies, the research applying these scales to entrepreneurs
supports their effectiveness with this population.
The RFQ scale is a more suitable measure for the purposes of this study. A major
part of the model under investigation was the regulatory fit of entrepreneurs with their
ventures. The trait of regulatory foci discussed in this section is chronic to entrepreneurs.
Therefore, it represents one side of the fit test. Data pertaining to other side of the fit test,
the venture, were also collected from entrepreneurs (work regulatory foci are discussed in
the next section). These two constructs, the trait foci and the workplace-primed state foci,
are conceptually distinct (Higgins, 1997).

82
In more recent developments regarding instruments for primed state foci,
reflective models have been applied to capture the result of the state influence (e.g.,
Neubert et al., 2008; Wallace & Chen, 2006). There is a concern that the reflective
GRFM scale may capture more than trait regulatory foci; it could capture the state
regulatory foci or at least overlap the two and present a confounded measure. An
inspection of items from the GRFM instrument prompts this concern. For example, one
item in the GRFM modified to the work setting would appear as follows: “My major goal
at work right now is to avoid becoming a failure” (Lockwood et al., 2002). An item
appearing in the work regulatory foci instrument (discussed in the next section) is, “I do
everything I can to avoid loss at work” (Neubert et al., 2008). A face validity inspection
suggests that these two questions probably do not tap distinct concepts. Therefore, to
capture valid trait regulatory foci, the RFQ developed by Higgins et al. (2001) was used
in this study.
The RFQ scale measures two variables, trait promotion focus and trait prevention
focus (Grant & Higgins, 2003; Higgins et al., 2001). A combination of six items
measures promotion, and five items measure prevention. All items were assessed using a
five-point scale, with anchors reworded among the questions. The survey instrument
intermixes items from the trait promotion focus and trait prevention focus variables. The
Appendix lists the 11 items as well as the response anchors.
Work regulatory foci. The two work-based regulatory foci, work promotion focus
and work prevention focus, represent a view of the work environment. The ability of
environmental cues, and particularly engagement in activities, to prime regulatory modes
is well established (e.g., Higgins, 2005; Higgins et al., 2001). The demands of the venture

83
perform this priming both by providing a context and requiring tactical instantiations, that
is, engagement with activities (Johnson et al., 2015). The Work Regulatory Focus (WRF)
scale captures the regulatory profile of the venture by measuring entrepreneurs’ venture-
evoked regulatory focuses (Neubert et al., 2008).
The WRF scale measures the work promotion focus and work prevention focus
variables (Neubert et al., 2008). Items in the instruments tap the theoretically expected
outcomes of each regulatory focus within the work setting (Neubert et al., 2008). Trait
regulatory foci are distinct from work regulatory foci, which is supported by a promotion
correlation of .39 and prevention having no significant correlation (Neubert et al., 2008).
The internal reliability was good, with a Cronbach’s alpha for promotion of .91 and
prevention of .93.
Work prevention focus was measured with nine items using a five-point Likert
scale (Neubert et al., 2008). One of the items was adapted to fit the entrepreneurial
venture and founder context underlying the present study. Item seven originally read,
“Job security is an important factor for me in any job search.” This item was also
modified because a firm founder is not likely to be involved in a job search. After
modification, the item read, “Job security is an important factor for me.” Likert anchors
ranged from one (never) to five (constantly). Appendix A lists all nine items.
Work promotion focus was measured with nine items using a five-point Likert
scale (Neubert et al., 2008). Two of these items were adapted to better fit the
entrepreneurial venture and founder context of the present study. Item 14 originally read,
“A chance to grow is an important factor for me when looking for a job.” This item was
modified because, as mentioned above, a firm founder is not likely to be involved in a job

84
search; thus, the modified item read, “A chance to grow is an important factor for me
when choosing how to perform my job.” Item 15 originally read, “I focus on
accomplishing job tasks that will further my advancement.” This item was modified to
clarify the term “advancement” since workplace advancement is not as applicable to a
firm founder; the modified version read, “I focus on accomplishing job tasks that will
further my advancement goals.” The Likert anchors ranged from one (never) to five
(constantly). The Appendix lists all nine items.
Passions. The two passion constructs, harmonious and obsessive, represent
independent dimensions of the dualistic model of passion (Vallerand, 2015; Vallerand et
al., 2003). This model was chosen because it uniquely differentiates these two
dimensions, and particularly because obsessive passion is considered especially relevant
to entrepreneurs (Murnieks et al., 2016). The other popular passion scale for
entrepreneurs developed by Cardon et al. (2013) does not independently measure
obsessive passion.
Vallerand et al. (2003) have developed and later refined scales for harmonious
and obsessive passion (Vallerand, 2015). The internal reliability was good, with
Cronbach’s alphas of .79 and .89, respectively. Instrument questions have been refined to
fit entrepreneurial settings to relate passion specifically to entrepreneurial activities
(Gielnik et al., 2016; Ho & Pollack, 2014; Murnieks et al., 2014). The lead-in question
was changed in one study series, resulting in Cronbach’s alphas of .85 for harmonious
and .86 for obsessive passion (de Mol et al., 2016; Ho & Pollack, 2014). Instrument items
were also reworded to focus on entrepreneurial activities. For example, many of the
original Vallerand et al. (2003) items included references to specific activities (e.g., “this

85
activity”). This wording was adjusted to reference entrepreneurial roles, which is
consistent with other adaptations to the general work context (Vallerand, 2015; Vallerand
& Houlfort, 2003; Vallerand et al., 2010). For example, item eight originally read, “This
activity is well integrated in my life,” while the modified item read, “My entrepreneurial
work is well integrated in my life.” The reliability after the rewording of harmonious
passion items was .89 and .71 for the Gielnik et al. (2016) and Murnieks et al. (2014)
studies, respectively. Similarly reworded items based on the revised instruments
(Vallerand, 2015) were used in this study.
The Vallerand (2015) Passion Scale survey instrument intermixes items from the
harmonious passion and obsessive passion variables; six items measure harmonious
passion, and six items measure obsessive passion. All were collected on a five-point
Likert scale (Vallerand, 2015; Vallerand et al., 2003). Appendix A lists all 12 items.
Control Variables
Prior research suggests several variables that might affect burnout, passion, and
entrepreneurial behavior in general. In this study, these variables were incorporated as
controls to account for possible alternative explanations of the relationships tested
(Cuervo-Cazurra, Andersson, Brannen, Nielsen, & Reuber, 2016). The selection of
control variables was primarily based on burnout studies of entrepreneurs, but also in
light of general entrepreneurship behavioral research.
Individual-level variables. Age, gender, marital status, education, and experience
are related to burnout in some studies not specific to entrepreneurs (Maslach et al., 2001).
Age has been reported to be the most consistent of these demographic relationships, with
burnout weakly decreasing with greater age (Cordes & Dougherty, 1993; Maslach et al.,

86
2001). When age was studied in samples of entrepreneurs, this same weak but
insignificant relationship held in two studies (de Mol et al., 2016; Fernet et al., 2016), but
one found a surprising moderate positive relationship (Wei et al., 2015). This study
controlled for age measured in the firm founder’s years (de Mol et al., 2016; Fernet et al.,
2016; Maslach et al., 2001).
Gender is less clear than age in its relationship with burnout (Maslach et al.,
2001). Researchers using samples not specific to entrepreneurs have found more burnout
in women (Poulin & Walter, 1993), but others have found more burnout among men (van
Horn, Schaufeli, Greenglass, & Burke, 1997). Since gender may be highly correlated
with job roles, one explanation is that burnout deriving from the characteristics of role
demands may be confounded with gender (Maslach et al., 2001). Gender has not been a
significant factor in the limited entrepreneurial burnout research (de Mol et al., 2016;
Fernet et al., 2016; Wei et al., 2015). However, since there are so few studies of burnout
in entrepreneurs, this study controlled for gender, which was collected as founder gender
(0=male or 1=female) (Maslach et al., 2001).
Marital status is a factor that has been studied in relation to burnout and possibly
confounded with gender (Maslach et al., 2001). Marital status could relate to lowered
burnout since it may act as a social resource useful for coping with stress (Maslach &
Jackson, 1981). This idea, and its confounding with gender (Ahola et al., 2006), has been
shown to affect some stress manifestations (Thoits, 1987). One known study using a
sample of entrepreneurs did not find a burnout effect for marital status (Wei et al., 2015).
Again, considering that very few entrepreneurial burnout researchers have tested this

87
alternate explanation, marital status was controlled for and collected as founder marital
status (single, married, divorced, or other) (Maslach & Jackson, 1981).
Education has been noted to affect burnout such that higher levels of education
relate to higher levels of burnout (Maslach et al., 2001). The one known study of a
sample of entrepreneurs that included education level found no relationship between
education and burnout (Wei et al., 2015). To consider this possible alternative
explanation for effects on burnout, education level was controlled for in this study and
collected as the founder’s achieved education in years (Robinson & Sexton, 1994).
Experience may be a factor that affects an entrepreneur’s ability to cope with
stress and reduce burnout (Jung et al., 2012), as well as developing passion (Gielnik et
al., 2015; Vallerand et al., 2003). Experience reflects knowledge accumulated through
past exposure and involvement with workplace demands. For entrepreneurs specifically,
experience has been measured as the number of individual firm startup experiences
(Dimov, 2010; Mueller et al., 2017), and as the number of years operating or managing
any business (Fernet et al., 2016). Experience related to activities in the family may also
bolster coping resources through learning by seeing how others cope with the demands
and stressors of entrepreneurship. To consider the effect of experience on the
relationships to be tested, this study controlled for experience in three ways: as the
number of startup attempts, as the number of years operating or managing any business,
and as a dichotomous response to the question, “Do you come from a business family or
family of entrepreneurs?”
Firm-level variables.

88
Firm age, firm size, industry, and firm growth may affect burnout. These variables
may also affect the outcomes of passion in relation to entrepreneurial behavior or firm
outcomes, so they have been included in some studies that incorporated passion.
Firm age may relate negatively to burnout. One argument concerns the liabilities
of newness as contributing to stressors and increasing burnout in younger firms (Cardon
& Kirk, 2015; Drnovsek et al., 2016). Firm age was controlled for and collected as the
age of the firm in years (Cardon & Kirk, 2015; Drnovsek et al., 2016; Fernet et al., 2016).
Firm size may also relate to decreasing levels of burnout; the liability of smallness
could explain increased stressors due to more limited resources in smaller firms, and this
could lead to more burnout. Thus, firm size was controlled for as both sales and the
number of employees (Baum & Locke, 2004; Drnovsek et al., 2016; Fernet et al., 2016).
It has been argued that industry in general has broad sources of potential stressors,
such as environmental dynamism (Drnovsek et al., 2016) and industry munificence
(Baum & Locke, 2004), that could result in higher or lower stressor levels within these
groups and therefore affect burnout. Thus, industry effects are controlled for using four
categories: services, manufacturing, trade, and finance/insurance (Ho & Pollack, 2014).
Firm growth has been controlled for in some studies of entrepreneurial passion.
One argument for doing so is that firm growth is representative of industry
competitiveness and therefore affects entrepreneurial behaviors related to passion (Ho &
Pollack, 2014; Murnieks et al., 2014). Another argument can be made that growth relates
to increasing resources (Baum & Locke, 2004; Drnovsek et al., 2016), resulting in the
lowering of stressors and reduced burnout. This study controlled for firm growth as
perceptions of revenue growth relative to competitors (Murnieks et al., 2014).

89
Family conflict. A venture perspective was adopted in an attempt to explain
burnout experiences among entrepreneurs. The constructs in the proposed model reflect
the characteristics of entrepreneurs and their firms. By adopting the person-environment
fit model of Maslach et al. (2001), stressors originating from within entrepreneurs and
venture situations were theorized to be explained. An established source of stressors
coming from outside the venture was not considered in the core model, namely, family
conflict.
Both work-family conflict and family-work conflict are forms of inter-role
conflict (Netemeyer, Boles, & McMurrian, 1996). Conflict occurs when membership in
one group and the responsibilities of one role conflict with membership in another group
and its attendant responsibilities (Kahn et al., 1964). The roles in this case are the firm
founder role and the family role. Work-family conflict occurs when the general demands
of the firm interfere with family responsibilities (Netemeyer et al., 1996), while family-
work conflict occurs when the general demands of the family interfere with firm
responsibilities (Netemeyer et al., 1996).
Peeters, Montgomery, Bakker, and Schaufeli (2005) have established a distinction
between the work and home domains in relation to burnout. Burnout studies of general
populations have found that conflict related to the home is related to burnout (Bakker et
al., 2004; Purvanova & Muros, 2010). Measures of work-home conflict and home-work
conflict were collected as controls using the Work-Family Conflict and Family-Work
Conflict scales (Netemeyer et al., 1996).
The Work-Family Conflict scale contains five items measured on a seven-point
Likert scale. Internal reliability was good, with Cronbach’s alphas ranging from .88 to .89
90
(Netemeyer et al., 1996). The Likert anchors ranged from one (strongly disagree) to
seven (strongly agree). All five items are listed in the Appendix.
The Family-Work Conflict scale contains five items measured on a seven-point
Likert scale. Internal reliability was good, with Cronbach’s alphas ranging from .82 to .90
(Netemeyer et al., 1996). The Likert anchors ranged from one (strongly disagree) to
seven (strongly agree). All five items are listed in the Appendix.
Common Method Variance Treatment
Podsakoff et al. (2003) have explained that remedies for common method
variance should be chosen to fit the specifics of the research at hand. Survey data
collected for this study come from the same source (entrepreneurs), and the reflective
constructs within the research model are self-reported perceptions. As such, common
method variance bias was a significant concern (Podsakoff et al., 2012). Several
precautions, both procedurally and statistically, attempted to mitigate this risk (Podsakoff
et al., 2012). Procedural precautions included collecting independent and dependent
variables at different times and emphasizing intent as well as confidentiality assurances in
detail. Statistical precautions included Harman’s one-factor test and the Confirmatory
Factor Analysis (CFA) marker technique during the data analysis.
A two-wave survey collection was used to help limit common method variance
(Podsakoff et al., 2012). Separating the collection of criterion and predictor variables may
help reduce respondent biases by reducing self-priming caused by previous answers and
assumptions developed from the questions (Podsakoff et al., 2003). A temporal
separation facilitates this reduction by using the passage of time to allow short-term

91
memory to forget priming information (Podsakoff et al., 2012). Results for three- and
four-week temporal spacing have suggested significant reductions of common method
bias (Johnson, Rosen, & Djurdjevic, 2011; Ostroff, Kinicki, & Clark, 2002). The
disadvantages of this design include response rate reductions (Lynn, 2009) and a lack of
certainty of the effectiveness of limiting common method variance (Weijters, Geuens, &
Schillewaert, 2010).
This study design addressed these disadvantages in several ways. Response rate
reduction may be related to the degree of temporal separation and offset by incentives
(Lynn, 2009). This design attempted to limit the two survey collections to the shortest
period found to be effective in the literature, namely three weeks (Johnson et al., 2011).
Incentives were also considered as a method of mitigating the response rate reduction.
Incentives are effective for increasing response rates in cross-sectional surveys
(Singer & Cong, 2013); response rate improvements vary depending on pre-paid or post-
paid terms (19% to 5%) (Church, 1993). Unconditional cash incentives initially have the
strongest effect on response rates compared to gift or lottery incentives and those
provided conditionally after survey completion (Singer & Cong, 2013). Little research
exists to explain incentive effects specifically for longitudinal surveys, but the response
rate benefits can be reasoned (Lynn, 2009).
Unconditional incentives are difficult to deliver up-front in web-based surveys,
the method considered for this study (Dillman et al., 2014), and the costs that would be
associated with the scale of this study make typical cash incentives impractical for this
researcher. One survey design similar to this study successfully employed an incentive
payment of $10 after completion of two collection waves. Data collection occurred

92
through a panel, so the response rate effects are unknown. However, current research
ethical considerations now discourage that design (Neubert et al., 2008). Based on the
uncertain but promising benefit of incentives, and the limited empirical support of
benefits for two-wave designs and researcher constraints, this study piloted an incentive
offer of $5 per survey. A random selection of respondents received this offer. Between
two sets of pilot studies, 200 incentives were offered out of 612 survey invitations. The
plan was to test the effect on response rates before committing to an incentive plan for the
full survey. Non-response and incentive-related bias tests were also planned to evaluate
the significance and magnitude of any errors from this method. Unfortunately, response
rates were too low to allow the statistical analyses planned, but as the following section
discusses, the response rate benefits were deemed too low to justify the expense.
Intent and confidentiality assurances were designed to address barriers to accurate
responses by respondents. Following from social exchange concepts (Dillman et al.,
2014), the study’s possible practical benefits for others and society were emphasized to
increase motivation and improve the accuracy of responses (Krosnick, 1999).
Accordingly, the study purpose was explained with an emphasis on the importance and
potential benefits (i.e., “a good cover story”) (Podsakoff et al., 2012, p. 562). Social
desirability might also introduce error if respondents choose not to share accurate reports
of their opinions out of fear of disclosure (Podsakoff et al., 2012). This could manifest in
various ways, including non-response (Podsakoff et al., 2012), middle-category scale
selection (Steenkamp, De Jong, & Baumgartner, 2010), and inaccurate response
selections (Baumgartner & Steenkamp, 2001). To decrease respondent concerns about

93
disclosure, the potential respondents were assured of the privacy of their responses and
provided with clear explanations of how their data would be kept private.
The possibility that common method variance bias may occur was tested and
evaluated using two techniques: Harman’s one-factor test (Podsakoff et al., 2003) and the
CFA marker technique (Podsakoff et al., 2012). Harman’s one-factor test indicates
whether common method bias may exist (Podsakoff & Organ, 1986). All the indicators
are entered into a factor analysis, the output of which determines either a single factor
result or, in the case of multiple factors, the presence of one general factor that accounts
for most of the variance of the data (Podsakoff & Organ, 1986). The Harman one-factor
test provides one indication of common method variance bias, but uncertainty in the
interpretation of the results indicates that additional testing is prudent (Podsakoff &
Organ, 1986).
The CFA marker technique is a more recent suggestion for the detection and
evaluation of common method error variance (Podsakoff et al., 2012). The CFA marker
technique requires the inclusion of an unrelated marker variable subject to any common
method variance bias that is also unrelated theoretically to the constructs of interest in the
model (Williams, Hartman, & Cavazotte, 2010). This may present the largest impediment
in its application because the selection of such a variable can be difficult and can
confound the results (Richardson, Simmering, & Sturman, 2009). To meet this study’s
need for a theoretically unrelated marker variable, a review of marker variables used in
past research was undertaken. Based on an analysis and report of variables serving as
marker variables in past studies (Williams et al., 2010), a variable determined to likely be
unrelated to the theories applied in this study was selected (Oreg, 2006). The Physical

94
Development Value scale measures the degree to which an individual cares about his or
her physical appearance (Scott & Scott, 1965). As described by Williams et al. (2010),
phase I of the CFA marker technique was applied to identify and quantify common
method variance error.
Instrument Testing
The survey process began in the fall of 2018. The instruments and processes for
data collection were tested before full survey deployment. The two surveys were
developed online in the Qualtrics website, and reviews by editors, students, and business
people were conducted to verify proper syntax, grammar, spelling, and formatting, as
well as web survey operation. Next, expert reviews were conducted to collect feedback
on the questionnaire, content, and analysis issues (Dillman et al., 2014). Three
entrepreneurs took each survey in an informal interview session. The charge was to
communicate first impressions on the clarity and meaning of each question. Only minor
adjustments to wording were made. Since all items came from validated instruments,
major changes were avoided. Lead-in statement changes were made when possible to
address comments about readability.
Pilot Survey 1
A set of pilots collectively referred to as “Survey 1 Pilot 1” was released to
evaluate the performance and the delivery process for the first survey. Additionally, the
goals included estimating completion times, survey response rates, and item response
distributions (Dillman et al., 2014). A random sample of n=410 meeting the study criteria
was drawn. The surveys were hosted on Qualtrics and designed without an incentive and
with a conditional $5 incentive. The incentive surveys were a conditional offer design;

95
the respondent had to meet the sample frame criteria and complete the survey. An
invitation was emailed with a link to a web-hosted survey. Summary results appear in
Table 7.
Table 7
Survey 1 Pilot 1 Results
Pilot 1 (U.S. email)
No Incentive Incentive Combined
n= 311 99 410
bounced/returned 1.93% 3.03% 2.20%
opted out 6.43% 3.03% 5.61%
complete 12 3 15
Usable Response Rate 1.05% 2.15% 1.32%
Incomplete or Unusable Rate 42% 33% 40.00%
Response Rate 4.21% 3.23% 3.97%
A total of 410 survey invitations were sent. Eight of the first respondents
inadvertently chose non-consent, which was non-recoverable. This was due to a non-
intuitive aspect of the consent form design on Qualtrics that was modified mid-test. Nine
respondents failed to meet the sample frame criteria for age of firm (1.5%), and two were
not founders (0.3%). Bounced emails and returned mail were lower than expected at
2.20%. The overall response rate for each survey type was 3.97%, below the earlier
estimate of 4.60% for web surveys. The usable rate after abandoned and non-qualified
respondents was also worse at 1.32%, a 40% loss of responses. These results were poorer
than estimated, and the initial issues encountered at deployment were likely a factor.
Completion times were difficult to calculate due to the presence of large numbers.
Qualtrics did not stop timing when a respondent delayed or returned later to complete the
survey. The median completion time was 17.8 minutes, and the fastest times were about
10 minutes. Incomplete or abandoned constituted fewer than half of attempts.

96
Considering the length of the survey, which was estimated to take 15 minutes, this is
consistent with expectations (Dillman et al., 2014). An examination of the response data
showed varying responses and reasonable patterns, which suggests the questions were
engaged.
The incentive test was inconclusive owing to the small sample size, but the
incentivized survey response rate came in below the non-incentivized version. The
incentive offered was through TangoCard.com and allowed quick redemption through
many popular online and physical sites; the offer was contingent on completion of the
survey. Studies have found that contingent incentive offers may not improve response
rates (Dillman et al., 2014), and electronic redemptions are valued less than cash
(Birnholtz, Horn, Finholt, & Bae, 2004). To test this effect, a second pilot was planned.
The contingent nature of the offer was modified and made unconditional in the
incentivized pilot design, and the unconditional offer was emphasized in the invitation
material.
Phone call interviews with several respondents revealed several invitations that
had been hidden by spam filters. Dillman et al. (2014) have provided a list of words that
increase the chances of this happening, and care was taken to avoid those particular
words. Tests of spam filters revealed that the word “survey,” when it occurred several
times in a message, increased the chance of a spam filter action. Invitations and
reminders were revised to address this.
Phone interviews and email inquiries with dozens of respondents also revealed
heightened cyber-security concerns. Security and privacy concerns are recognized in the
literature as negative factors affecting response rates (Sax et al., 2003). Discussions in the
97
literature have primarily focused on data security and privacy issues related to the
protection and use of the data respondents supply. Respondents rarely discussed those
concerns, but they almost universally indicated concern for outside data intrusions and
compromises of their computer systems.
Clicking on a link or typing one from a printed invitation letter, are pathways to
computer viruses and failures. Interested respondents made phone calls to validate the
authenticity and safety of the links that were mailed and emailed. In two cases, after long
discussions, respondents still declined to use the web survey but offered instead to
schedule telephone surveys as an alternative.
One student provided an email from a corporate information services department
forbidding any employee to click on email links from unexpected or unknown sources.
These concerns represent a major impediment to survey response, for which no
comprehensive remedy was found. Survey invitations and reminders were updated to
describe where the link redirected and what it contained in an attempt to mitigate fears.
For example, instead of including “click here,” invitation links were changed to say,
“Browse to Questions on Kennesaw’s Qualtrics Website.”
Dillman et al. (2014) have explained that overall response quality is greatly
affected by the process of surveys, such as invitation wording, and not just specific
survey design. A review of suggestions for invitation design suggested the use of active
voice, shorter messages, wording aimed at the respondent’s perspective, and the use of
social exchange concepts (Dillman et al., 2014). These ideas were developed further in
revised invitations and updated reminders. In an attempt to leverage social exchange
concepts, wording emphasized the researcher’s status as an entrepreneur (one of them)

98
and the significance and value of the sponsoring university. To test these changes, the
second pilot was designed with a modified sample draw limited to counties near the
sponsoring university.
The second set of pilots collectively referred to as “Survey 1 Pilot 2” were
released to evaluate the changes made based on the first pilot. The sample for this survey
was selected from Dun & Bradstreet contacts in the counties surrounding the University.
The incentive was made unconditional, and invitation and reminder emails were revised.
Survey response rates and incentive effectiveness were the focus of this test, and two
surveys, a non-incentivized and an incentivized, were used. Summary results are reported
in Table 8.
Table 8
Survey 1 Pilot 2 Results
Pilot 2 (KSU counties only)
No Incentive Incentive combined
n= 101 101 202
Bounced/Returned 0.00% 1.98% 0.99%
Opted Out 0.99% 3.96% 2.48%
Complete 6 6 12
Usable Response Rate 5.00% 6.32% 5.64%
Incomplete or Unusable Rate 17% 0% 8.33%
Response Rate 6.00% 6.32% 6.15%
A total of 202 survey invitations were sent. Four respondents failed to meet the
sample criteria for age of firm (1.0%), but all were founders. Bounced emails and
returned mail were still lower than expected. The overall response rate for Pilot 2
improved, from 3.97% to 6.15%, which was above the earlier estimate of 4.60% for web
surveys. The usable rate after abandoned and non-qualified respondents was also better at
5.64%, mostly due to a much lower 8.33% loss of responses due to incomplete data.
Changes made to the invitation and reminder messages or the University proximity of the

99
contacts may have been effective, or both. Overall, these results were encouraging for the
project’s success.
Completion times indicated many lower times, several at six minutes. The median
completion time in Pilot 1 was 17.8 minutes, so the new time was considered difficult for
an engaged participant to accomplish. An examination of some of the fastest times
revealed patterns of consistent selections, that is, possible straight-line answers. These
lowest completion times suggested a need for careful data cleaning inspections.
Incomplete or abandoned surveys constituted fewer than half of attempts.
Incentives did not affect response rates. In Pilot 2, the non-incentive and incentive
response rates were 6.00% and 6.32%, respectively. Usable response rates were slightly
better for incentivized surveys, 5.00% to 6.32%. Although these rates appeared to suggest
a benefit to incentives, a majority of the low times and data screening issues were found
within the incentivized results. The sample sizes were too small to evaluate this
statistically, but casual inspection gave rise to caution. There were nine incentivized
completions between the two pilots, with four from unqualified firms and one that did not
complete any questions. About half of the incentives paid yielded no data. Based on these
pilot experiences, incentives were not employed in the full study.
Both sets of pilot surveys supported the Survey 1 design as ready for release. Data
quality concerns stemmed from unqualified firms in the contact list, and respondent
behaviors completing the surveys. Confidence intervals based on all pilot data combined
were calculated for key response measures (α=.05). An inspection of pilot data indicated
that at least 20% of responses would likely require removal, which was consistent with
the initial estimate of 23.7% and the calculated interval for incomplete or unusable

100
responses of 9.40%-42.46%. The overall response rate of the pilots was consistent with
initial estimates and the calculated confidence interval estimate of the response rate
(2.98% to 6.45%). A summary of combined pilot data and calculated confidence intervals
is presented in Table 9.
Table 9
Survey 1 Combined Pilot 1 and 2 Results
Pilot 1&2 Combined
Combined
Interval*
No
Incentive Incentive Combined Lower Upper
n= 412 200 612
Bounced/Returned 1.46% 2.50% 1.80% 0.74% 2.85%
Opted out 5.10% 3.50% 4.58% 2.92% 6.23%
Complete 18 9 27
Usable Response Rate 2.08% 4.26% 2.79% 1.44% 4.14%
Incomplete or Unusable
Rate 33% 11% 25.93% 9.40% 42.46%
Response Rate 4.68% 4.79% 4.71% 2.98% 6.45%
* α=.05
Pilot Survey 2
The second survey contained items concerning the dependent variable burnout.
Testing of this instrument had some of the same goals as the first; survey performance
and the delivery process. As before, an estimation of completion times, a determination
of survey response rates, and item response distributions were the goals of this step
(Dillman et al., 2014).
This pilot went to 16 usable response contacts from the first survey pilot
invitations. Second survey incentives were committed to respondents who completed
incentivized versions of the first survey, but no new offers were made. Continuation of

101
the incentive protocol in this pilot stage was necessary to complete prior obligations, but
the sample size n=8 was too small to evaluate statistically. Summary results are reported
in Table 10.
Table 10
Survey 2 Pilot Results
Pilot Survey 2
No Incentive Incentive Combined
n= 8 8 16
Bounced/Returned 0.00% 0.00% 0.00%
Opted Out 0.00% 0.00% 0.00%
Complete 6 6 12
Usable Response Rate 75.00% 75.00% 75.00%
Incomplete Rate 0% 0% 0.00%
Response Rate 75.00% 75.00% 75.00%
The sample size for the Survey 2 pilot was too small to draw meaningful
statistical inferences. There were no major indications of issues with the returned data.
The sample response rate was consistent with the planning estimate of 65.9%. The
median completion time was about six minutes, with some as fast as 4.5 minutes. The
examination of resulting scores showed no alarming patterns, even for the fastest
respondents. Once Survey 2 responses were inspected and considered valid, the complete
survey design was ready, and deployment began.
The initial sample draw estimates were updated to reflect the pilot findings.
Drawing from the combined pilot data confidence intervals presented in Table 9, a
comparison with the original sample draw estimations (see Table 5) was made. For
Survey 1, the estimate of bounced emails was higher than the pilot upper interval
estimate (10% vs. 2.85%). Given that the original estimation was inferred, the pilot data
was deemed more reliable. Survey 2 bounced emails were zero in the pilot, which was

102
reasonable given that Survey 1validated the email addresses. The original Survey 1
sample estimation applied a sample response rate of 4.6%, followed by a factor for
incomplete and screening reductions (23.7%) to derive a usable response rate of 3.48%.
This estimation was within the calculated pilot interval for the usable response rate
(1.44% to 4.14%). To increase the likelihood of achieving a sufficient sample size, the
more conservative lower interval value was selected. These updated estimates were
applied, and an initial sample draw size for Survey 1 was calculated as 32,500 contacts.
Table 11 summarizes these calculations. This draw size was within the capacity of the
Dun & Bradstreet database but required nearly all of its 37,329 available contacts. All
available contacts were then drawn, and contacts used in the pilots as well as duplications
were removed. A final list of 36,385 email contacts was prepared for the deployment of
Survey 1.
Table 11
Refined Sample Size Estimation Calculations
Sample Sizes
Initial Sample Draw 32,500
Fir
st
Wav
e Inaccurate Email Addresses 2.85% 31,574
Usable Response Rate 1.44% 455
Sec
ond
Wav
e
Response Rate 65.9% 300
Incompletes and screening issues 23.7% 229
Target final n= 229
Data Analysis
There were two stages of data analysis. The first was an analysis of the multi-item
instruments for reliability and validity in the research model. The earlier described tests
for common method variance errors were performed. CFA fit and factor loadings,
average variance extracted (AVE) estimates, and composite reliability calculations were
103
used to test the overall measurement model, scales for construct reliability, and
convergent and discriminant validity (Fornell & Larcker, 1981; Hair et al., 2010). Next,
each hypothesis was tested using hierarchical linear regression through a series of models
starting with control variables only, then adding direct variables, followed by interaction
terms (Aiken, West, & Reno, 1991; Cohen & Cohen, 1983; Hair et al., 2010; Hayes,
2013). The mean centering of independent variables involved with interaction terms was
applied as has been recommended to help mitigate multicollinearity effects (Aiken et al.,
1991). Multicollinearity was tested by examining correlations to assure they were all
below 0.70 (Hair et al., 2010), and VIF scores in all regressions were below 10 (Kutner,
Nachtsheim, Neter, & Wasserman, 2004). Mean centering may not actually provide this
benefit, but it was still performed as a standard practice since it may aid in the
interpretation of the results (Hayes, 2013).

104
CHAPTER 4: DATA ANALYSIS AND FINDINGS
Data Description
This chapter describes how the data were analyzed and provides the results of the
hypothesis tests. Basic sample characteristics were calculated first, and data were cleaned
and tested for non-response bias. Then, common method variance bias was tested using
two methods. Next, the measurement model was evaluated and scales refined. Summary
descriptive statistics and correlations were then calculated. Last, the hypotheses were
tested.
Sample Characteristics
The final usable sample size after both surveys was 308. Table 12 summarizes the
following sample characteristics discussion of Survey 1: it had a total sample draw of
36,385 contacts, of which 887 (2.44%) emailed invitations bounced, 2,357 (6.64%)
respondents opted out, and 21 declined consent. Survey starts were 1,184 (3.34%), but
300 (25.34%) respondents abandoned the survey, which resulted in 884 completions and
a 2.49% response rate. Among the completed surveys, 68 respondents were not firm
founders, and 26 firms were not for-profit, so these respondents were removed. General
data cleaning was not undertaken at this point for practical reasons, and to have more
information available, the second survey was collected first. The Survey 1 usable sample
size was 769, or a response rate of 2.17%.

105
Table 12
Survey 1 Results
Sample Counts Rates
Total Invitation Emails 36,385
Bounced 887 2.44%
Opted Out 2,357 6.64%
Started Surveys 1,184 3.34%
Finished Surveys 884 2.49%
Incomplete Surveys 300 25.34%
Declined Consent 21 1.77%
Not Founder 68
Not For-Profit 26
Usable Responses 769 2.17%
Compared to the response estimations (see Table 5) and pilot results (see Table
9), the usable response rate was as expected. The earlier discussion of the pilot process
explained the concerns this sample reported for cyber-security risks. Email and phone
inquiries during the survey deployment continued to reveal this factor as a major
consideration. Another response-dampening factor may have related to the deployment
time: these surveys were deployed during the holiday season of the United States, which
has a poorer response expectation (Dillman et al., 2014). Although the case has been
made that this response rate is reasonable, the relatively low rate by historical standards
does highlight this as a limitation.
Survey 2 resulted in 450 responses (a response rate of 59.0%), which was
consistent with the pilot findings. Table 13 summarizes the Survey 2 results. Survey 2
invited the 769 usable respondents from Survey 1 to complete this project. Surprisingly,
six (.78%) emailed invitations bounced, 16 (2.10%) respondents opted out, and one
declined consent. Survey starts were 452 (59.24%), but 19 (4.20%) respondents
abandoned the survey, which resulted in 433 completions and a 56.75% response rate.

106
Among the completed surveys, 111 responses reported firm ages significantly higher than
the intended sample frame and were removed. An additional nine were removed due to
missing data among the demographic control variables age, gender, marital status, and
education. Finally, four were removed as suspected outliers and are discussed below. The
Survey 2 usable sample size was 308, a response rate of 40.37%.
Table 13
Survey 2 Results
Sample Counts Rates
Total Invitation Emails 769
Bounced 6 0.78%
Opted Out 16 2.10%
Started Surveys 452 59.24%
Finished Surveys 433 56.75%
Incomplete Surveys 19 4.20%
Declined Consent 1 0.22%
Firm Size or Age Criteria Not Met 111
Missing Demographic Controls 9
Data Cleaning 4
Usable Responses (n) 308 40.37%
The collective data of Survey 1 and Survey 2 were examined for data cleaning
needs. Response outliers were identified through inspection of the data for extreme
values or patterns, survey completion times, and Mahalanobis distance tests. One item
(number 86) was removed due to observed sequence patterns and an extreme value for
the number of individual firm startup experiences (130). The Mahalanobis D2 was
calculated among all the independent variables that Survey 1 collected. There were 11
items with D2 p-values of less than 0.005 (Hair et al., 2010) that were thus identified as
potential outliers. From this group, three (items 43, 225, and 245) were removed with

107
completion times for Survey 1 below the first quartile time (534 seconds). A total of four
items were removed in the data cleaning process.
The low data cleaning removal count was surprising. Pilot data observations and
Survey 1 casual inspections before Survey 2 was collected had set higher expectations.
Two factors may explain this. First, respondents that provided complete data for Survey 2
provided quality data on Survey 1. When data were integrated between the two surveys,
most of the issues noted earlier were removed. Survey 2 respondents were self-selected
higher quality data providers and may have been more motivated than others by the study
purpose or by their own character. Second, a large number of removals were performed
based on firm size and firm age responses. These items included a number of highly
unlikely values, and numerous questionable responses were deleted in this sample criteria
filtering.
Non-response bias was tested to determine if respondents differed from the
overall surveyed population. Group comparisons are made between an equally sized
(n=450) random selection of non-responding invitees and those that responded. Firm
revenue and employee count were available from the Dun & Bradstreet database to make
these comparisons. Firm revenue was adjusted by a natural log transform to adjust for
non-normal distribution. Pooled variance two-sample t-tests were performed to test for
mean differences between respondents and non-respondents, and Levene’s test was
performed to test for differences in variances between the groups. All t-test and Levene’s
test p-values were greater than .05, indicating no differences. Firm sizes as described by
revenue and employee count were not significantly different between the responding

108
group and those that did not respond. Descriptive and test statistics of these two groups
are summarized in Table 14.
Table 14
Non-Response Summary Statistics
Mean Test Levene's Test
Mean S.D. t p F p
ln(Firm
Revenue)
Respondent $616,049 $2,846,298 1.13 0.26 1.42 0.23
Non-Respondent $922,804 $5,205,635
Firm
Employees
Respondent 6.50 12.29 0.31 0.76 1.16 0.28
Non-Respondent 6.76 12.91
n=450 each group
Common Method Variance Tests
Two analysis methods tested for common method variance: Harman one-factor
tests and a CFA marker technique. Factor analysis may indicate the presence of common
method variance bias by indicating either a single factor solution or one factor that
accounts for the majority of variance (Podsakoff et al., 2003). Table 15 and Table 16
provide the results of the Harman one-factor tests. Survey 1 contained six constructs
comprising the independent variables of the research model. Survey 2 collected the
dependent variable separately and after a delay, so common method variance was less
likely. The first test included only Survey 1 indicators (41 in total) for the six major
constructs of the model. Podsakoff and Organ (1986) have noted that factor analysis is
more likely to find more factors when greater numbers of indicators are present, thus
reducing the possibility of a single factor emerging; the first factor analysis minimized
the number of indicators for this reason. Table 15 summarizes these results. More than
one factor extracted (10), and the first unrotated factor accounted for much less than a
majority of variance (15.4%). The second test included all indicators from Survey 1,
which amounted to the inclusion of controls (21 additional indicators). Table 16

109
summarizes these results. Again, more than one factor extracted (17), and the first
unrotated factor accounted for 11.2% of the total variance explained. These one-factor
tests, although not conclusively dismissing common variance bias concerns, at least
partly supported minimal risk. Next, a CFA marker technique explored this concern
further.
Table 15
EFA-Survey 1 Model Indicators Only
Component Eigenvalues
% of
Variance
Cumulative
%
1 6.32 15.4 15.4
2 4.68 11.4 26.8
3 3.41 8.3 35.2
4 2.54 6.2 41.3
5 2.12 5.2 46.5
6 1.71 4.2 50.7
7 1.44 3.5 54.2
8 1.17 2.9 57.1
9 1.15 2.8 59.9
10 1.08 2.6 62.5

110
Table 16
EFA-Survey 1 Model Indicators and Controls
Component Eigenvalues
% of
Variance
Cumulative
%
1 6.96 11.2 11.2
2 6.52 10.5 21.7
3 4.87 7.8 29.6
4 3.41 5.5 35.1
5 2.45 4.0 39.0
6 2.22 3.6 42.6
7 1.95 3.1 45.8
8 1.82 2.9 48.7
9 1.58 2.5 51.2
10 1.41 2.3 53.5
11 1.36 2.2 55.7
12 1.25 2.0 57.7
13 1.23 2.0 59.7
14 1.15 1.9 61.5
15 1.10 1.8 63.3
16 1.07 1.7 65.0
17 1.03 1.7 66.7
Phase I of the CFA marker technique as outlined by Williams et al. (2010) tested
the data set for common method variance concerns. A series of SEM models tested for
the presence of bias effects relative to the marker construct for indicator measures as well
as construct correlations. The output of one SEM model estimates the degree of method
inflation present. The presence and the magnitude of marker variable effects were thus
explored.
The results of the SEM models are summarized in Table 17. AMOS25 performed
these analyses using maximum likelihood estimation. All six independent variable
constructs from the research model, plus the marker construct Physical Development
Value (PDS), were included. The first model, labeled CFA, was run to establish factor

111
loadings and error variance estimates for the five marker construct indicators. The
unstandardized regression weights for PDS1, PDS2, PDS3, PDS4, and PDS5 were 1.0,
1.178, .671, .812, and .767, respectively, and the unstandardized error variances were
.175, .105, .126, .284, and .184. These parameters were then fixed in a second SEM
model referred to as the baseline in order to establish a reference model without marker
variable effects.
A third SEM model, referred to as constrained, linked the marker construct to all
substantive indicators in the model. The constrained model found insignificant loadings
for the marker variable on all indicators when loadings were assumed to be equal
(p=.072). This indicated that an equal and therefore common marker effect on all the
study indicators was not present. Next, an unconstrained model tested for unequal method
marker effects and found support (p=.01). A varying marker variable effect, rather than a
constant bias, is termed an unrestricted method variance (UMV) in contrast to a common
method variance (CMV) (Richardson et al., 2009). The unconstrained SEM model was
then the best reference to evaluate marker variable effect. Table 18 shows standardized
loadings for the unconstrained model. Seven out of 41 marker variable indicators
significantly loaded on model indicators, ranging from .02 to .04 standardized with an
average of .02. Standardized loadings for indicators directly relevant to the model ranged
between .25 and .89 with an average of .59, and all were statistically significant (p<.01).
The relative amount of variance in the study indicators greatly exceeded that of the
measured method marker variance, so the magnitude of method variance was likely
minimal.

112
Since the hypotheses of this study were correlational, a restricted SEM model tested
for marker effects on correlations among the study constructs. The restricted model
followed from the unrestricted model, but factor relationships were fixed at values from
the baseline model. Covariances from the baseline SEM model fixed in the restricted
model are listed in Table 19. The analysis showed no significant effects on correlations
among model constructs (χ2=0.08, df=36, χ2 critical=51.00). The CFA marker technique
further indicated that method variance concerns were not significant for the Survey 1
data.
Table 17
Chi-Square, Goodness-of-Fit Values, and Model Comparison Tests
Model χ2 df CFI 1. CFA 2254.43
968 0.738
2. Baseline 2258.83
983 0.74
3. Model-C 2255.58
982 0.741
4. Model-U 2191.96
942 0.746
5. Model-Ru 2192.12
957 0.749
Chi-Square Comparison Tests
Δ Models Δ χ2 Δ df χ2 Critical
Value; p-value
1. Baseline vs. Model-C 3.25 * 1 3.84 0.072
2. Model-C vs. Model-U 63.62
40 55.76 0.010
3. Model-C vs. Model-Ru 0.16
15 25.00

113
Table 18
Unconstrained Model Factor Loadings: Standardized
Item PDS OP HP Work
Prevention
Work
Promotion
PDS1 0.64a
PDS2 0.78a
PDS3 0.55a
PDS4 0.47a
PDS5 0.55a
OP12 0.02 0.62
OP11 0.02 0.76
OP9 0.02 0.38
OP7 0.02 0.60
OP4 0.03 0.73
OP2 0.02 0.62
HP10 0.03*
0.72
HP8 0.03
0.66
HP6 0.04
0.60
HP5 0.03
0.56
HP3 0.04
0.66
HP1 0.03
0.65
WPREV1 0.04
0.53
WPREV2 0.04
0.49
WPREV3 0.05
0.47
WPREV4 0.04
0.39
WPREV5 0.03
0.71
WPREV6 0.03
0.72
WPREV7 0.03
0.75
WPREV8 0.03
0.75
WPREV9 0.03
0.73
WPROM18 0.04
0.61
WPROM17 0.04
0.55
WPROM16 0.04
0.60
WPROM15 0.04
0.56
WPROM14 0.05
0.53
WPROM13 0.04
0.60
WPROM12 0.04
0.48

114
Table 18, Continued
Item PDS OP HP Work
Prevention Work
Promotion
Trait
Prevention
Trait
Promotion
WPROM11 0.04 0.71
WPROM10 0.04 0.69
TPREV2 0.03
0.80
TPREV4 0.03
0.78
TPREV5 0.05
0.68
TPREV6 0.03
0.89
TPREV8 0.03
0.46
TPROM1 0.03
0.31
TPROM3 0.05
0.45
TPROM7 0.05*
0.27
TPROM9 0.04
0.35
TPROM10 0.06
0.64
TPROM11 0.03*
0.25
a - Factor loadings from baseline model fixed through comparisons.
* - p<0.05 for PDS loadings, all other loadings p<0.01
Table 19
Baseline Model Factor Covariances
OP HP
Work
Prevention
Work
Promotion
Trait
Prevention
HP 0.227
Work Prevention 0.03 -0.006
Work Promotion 0.263 0.282 0.003
Trait Prevention -0.187 -0.033 0.056 -0.16
Trait Promotion 0.026 0.236 0.008 0.13 -0.033
CFA Testing of the Measurement Model
The overall measurement model was assessed using confirmatory factor analysis,
and model fit was assessed to evaluate and refine scales. Figure 2 shows the measurement
model tested using IBM© AMOS© 25 software. All model constructs were unconstrained,
and evaluation was performed according to the guidelines of Hair et al. (2010).

115
Figure 2
CFA Model Diagram
The initial model estimation resulted in a poor fit. Target benchmarks are a
comparative fit index (CFI) greater than .90 and root mean square error of approximation
(RMSEA) of less than .07 (Hair et al., 2010). This SEM model reported a poor CFI =
.752 and an acceptable RMSEA = .062. Consistent with the suggestions of MacKenzie,

116
Podsakoff, and Podsakoff (2011), indicators were examined to evaluate scale refinement
possibilities.
All indicators had statistical significance with p-values below .01. Loadings for
several indicators were below the minimum preferred .50 recommended (Hair et al.,
2010). Table 20 summarizes these loadings and indicates those below the threshold. The
scale refinement process began by reviewing the lowest loading indicators for possible
removal. There were two indicators with very low loadings for trait promotion, TPROM7
and TPROM11 (.28 and .23). These are items 7 and 11 of the RFQ shown in appendix A.
Trait promotion is a unidimensional construct with six indicators. A review of face
validity of the instrument questions suggested that the removal of these two indicators did
not significantly impact validity to the construct, and four indicators would remain as
recommended (Hair et al., 2010). Common practice in research has been to refine the
RFQ (Hmieleski & Baron, 2008; Vallerand et al., 2010). Another item had an extremely
low loading (0.21). PEF5 is item 5 of the Maslach Burnout Inventory and part of the
professional efficacy dimension of burnout. Again, a review of face validity of instrument
questions and the unidimensional design suggested that deleting this item would not
appreciably affect construct validity. Refinement of this instrument has been reported,
although specifics were not disclosed (Boles et al., 2000). Six indicators measure this
dimension, so the item was removed. Model fit remained poor, with CFI=.763 and
RMSEA=.064. Table 21 summarizes the scale refinement fit progress.

117
Table 20
CFA-Initial Factor Loadings
Construct Indicator Loading Construct Indicator Loading
Trait Promotion TPROM11 0.28 Harmonious Passion HP1 0.65 TPROM10 0.61 HP3 0.66 TPROM9 0.38 HP5 0.55 TPROM7 0.23 HP6 0.59 TPROM3 0.47 HP8 0.67 TPROM1 0.32 HP10 0.73
Trait Prevention TPREV8 0.47 Obsessive Passion OP2 0.62 TPREV6 0.89 OP4 0.73 TPREV5 0.68 OP7 0.60 TPREV4 0.78 OP9 0.38 TPREV2 0.81 OP11 0.75
Work Promotion WPROM18 0.62 OP12 0.62 WPROM17 0.55 Burnout Dimensions
WPROM16 0.60 Exhaustion EXH1 0.82 WPROM15 0.56 EXH2 0.79 WPROM14 0.53 EXH3 0.81 WPROM13 0.61 EXH4 0.69 WPROM12 0.48 EXH6 0.88 WPROM11 0.70 Prof. Efficacy PEF5 0.21 WPROM10 0.69 PEF7 0.39
Work Prevention WPREV9 0.73 PEF10 0.54 WPREV8 0.75 PEF11 0.52 WPREV7 0.75 PEF12 0.66 WPREV6 0.71 PEF16 0.54 WPREV5 0.71 Cynicism CYN8 0.91 WPREV4 0.39 CYN9 0.92 WPREV3 0.47 CYN13 0.37 WPREV2 0.49 CYN14 0.69 WPREV1 0.53 CYN15 0.70
The examination of lower loading indicators continued for several cycles.
Construct item counts of at least four were maintained, which were above the three
minimum preferred (Hair et al., 2010). Trait promotion had two indicators loading below
the .5 guideline, TPROMM1 and TPROMM9 (.30 and .34); these were items 1 and 9 of
118
the RFQ shown in Appendix A. Since the construct was at four indicators and other low
loadings were present, these were not removed. Two indicators could have threatened the
meaning of the construct (Hair et al., 2010). Four other low-loading indicators were
judged to meet the general guidelines for removal without threatening construct validity.
WPREV4 is item 4 of the Work Regulatory Focus Questionnaire and part of work
prevention (.39). OP9 was item 9 of the Obsessive Passion Scale (.38), PEF7 was item 7
of the Maslach Burnout Inventory and part of the professional efficacy dimension of
burnout (.34). CYN13 was item 13 of the Maslach Burnout Inventory and part of the
cynicism dimension of burnout (.37). Model fit at this third step remained poor, with
CFI=.78 and RMSEA=.065.
There were still four indicators with loadings below .40. Two were on the
professional efficacy dimension of burnout, PEF10 and PEF16 (.40 and .40). The two
others were on the trait promotion construct, TPROM1 and TPROM9 (.29 and .33).
Removing these indicators would have reduced each construct’s indicator count below
the preferred minimum of three, so they were retained. The process of scale refinement
continued with an examination of residual covariances (MacKenzie et al., 2011).
In the fifth and subsequent steps, standardized residual covariances greater than
four were examined first (Hair et al., 2010), and the indicator with the largest value was
considered for removal. If the related construct retained at least four indicators, and the
construct face validity was not directly jeopardized, then the indicator was removed.
After each removal, the CFA model was estimated, and the cycle was repeated. The
following indicators met this criterion and were removed in sequence: HP5, OP12,
WPREV9, HP3, and WPROM18. The model fit that resulted from each removal is

119
reported in Table 21. This process ended at step 9, when 13 indicators had been removed.
Hair et al. (2010) have recommend that no more than 20% of indicators be removed.
The CFA model fit was still below the general guideline of .90 with CFI=.83.
RMSEA was acceptable, .059, with an upper confidence interval of .063, which met the
guideline criteria of less than .07 (Hair et al., 2010). The final model loadings for
indicators show that nine were still below .50, but only two were below .30. Table 22
summarizes the final indicator loadings and the indicators removed. Additionally, stress
was indicated in the model, with six cases of standardized residual covariances greater
than 4.0 and 23 more greater than the guideline of 2.5 (Hair et al., 2010).
Table 21
CFA Scale Refinement Fit
Initial Step 2 Step 3 Step 4 Step 5 Step 6 Step 7 Step 8 Step 9
χ2/df 2.196 2.253 2.309 2.242 2.204 2.168 2.16 2.134 2.08
df 1503 1341 1139 1091 1044 998 953 909 866
GFI 0.714 0.718 0.732 0.745 0.752 0.757 0.763 0.771 0.783
CFI 0.752 0.763 0.78 0.794 0.804 0.812 0.814 0.821 0.832
RMSEA 0.062 0.064 0.065 0.064 0.063 0.058 0.061 0.061 0.059
Indicator
Count 57 54 51 50 49 48 47 46 45

120
Table 22
CFA-Refined Measurement Model Factor Loadings
Construct Indicator Loading Construct Indicator Loading
Trait Promotion TPROM11 *
Harmonious
Passion HP1 0.72
TPROM10 0.58 HP3 *
TPROM9 0.34 HP5 *
TPROM7 * HP6 0.48
TPROM3 0.52 HP8 0.68
TPROM1 0.29 HP10 0.83
Trait Prevention TPREV8 0.47
Obsessive
Passion OP2 0.64
TPREV6 0.89 OP4 0.82
TPREV5 0.68 OP7 0.57
TPREV4 0.78 OP9 *
TPREV2 0.81 OP11 0.66
Work Promotion WPROM18 * OP12 *
WPROM17 0.44
Burnout
Dimensions
WPROM16 0.51 Exhaustion EXH1 0.82
WPROM15 0.50 EXH2 0.79
WPROM14 0.49 EXH3 0.81
WPROM13 0.57 EXH4 0.69
WPROM12 0.55 EXH6 0.88
WPROM11 0.80 Prof. Efficacy PEF5 *
WPROM10 0.78 PEF7 *
Work Prevention WPREV9 * PEF10 0.40
WPREV8 0.71 PEF11 0.63
WPREV7 0.80 PEF12 0.80
WPREV6 0.67 PEF16 0.40
WPREV5 0.75 Cynicism CYN8 0.92
WPREV4 * CYN9 0.93
WPREV3 0.44 CYN13 *
WPREV2 * CYN14 0.67
WPREV1 0.54 CYN15 0.69
* indicator removed during scale refinement

121
Descriptive Statistics
Descriptive statistics and correlations are shown in Table 23. The construct values
were computed as averaged scores based on the results of the CFA. The male gender
accounted for 59%, and 41% were female. The average age was 47.8, ranging from 28 to
78 years. Married status was reported by 77%. The education level breakdown was 41%
with four-year degrees, 31% with professional degrees, 10% with some college, 6% with
doctorate degrees, 6% with two-year degrees, 5% were high school graduates and 1%
completed their education earlier than high school. Startup counts varied from one to 23
with a median of two. The breakdown for one to eight startups was 36%, 23%, 17%,
10%, 6%, 3%, 2% and 2%, respectively. Family business experience was noted in 42% of
respondents. The average firm age was 7.8 years. Employee counts ranged from one to
75 with a mean of 6.2 and a median of four. Revenue averaged $572,276 and ranged
from $80,000 to $2.5 million. Industries reported were services (70%), manufacturing
(15%), trade (12%), and finance/insurance (3%). Growth perceptions relative to
competitors included 21% indicating much more, 36% somewhat more, 25% about the
same, 15% somewhat less, and 4% much less.
The dependent variable burnout included three dimensions: exhaustion,
professional efficacy, and cynicism. The means for exhaustion and cynicism were in the
upper third range identified for North American respondents (Maslach et al., 1996).
Exhaustion (M=3.27) was greater than 3.20, and cynicism (M=2.77) was greater than
2.20. In contrast to the first two dimensions, which tended toward burnout experience,
professional efficacy (M=6.28) was in the lowest third of the burnout risk range, greater

122
than 5.00. Collectively, these results suggest that the sampled population had elements of
burnout development, but professional efficacy was a strong negating indication.

123
Table 23
Descriptive Statistics and Correlations
M SD 1 2 3 4 5 6 7 8
1. Trait Promotion 4.07 0.57
2. Trait Prevention 3.34 0.92 0.04
3. Work Promotion 4.06 0.62 .28** -.19**
4. Work Prevention 3.88 0.80 0.05 0.10 0.05
5. Harmonious Passion 5.65 1.02 .28** 0.00 .28** 0.00
6. Obsessive Passion 4.30 1.26 0.03 -.16** .35** 0.05 .12*
7. Burnout - Exhaustion 3.27 1.41 -.27** -0.06 -0.09 0.08 -.32** 0.10
8. Burnout - Professional Efficacy 6.28 0.63 .34** 0.04 .26** 0.00 .18** 0.04 -.23**
9. Burnout - Cynicism 2.77 1.34 -.27** -0.05 -.20** 0.07 -.32** 0.02 .61** -.30**
10. Age 47.82 10.52 0.04 0.01 -0.09 0.00 0.03 -0.09 -.26** 0.01
11. Gender 0.41 0.49 .16** 0.08 -0.04 .21** 0.11 -0.01 0.07 0.01
12. Marital Status 0.77 0.42 0.02 0.08 -0.01 0.06 -0.05 -0.09 -0.05 0.04
13. Education 4.97 1.28 0.04 .15** 0.05 -0.07 0.00 -0.04 0.06 0.01
14. Startups Count 2.71 2.30 .11* -.17** .26** -.16** .18** .15** -.14* 0.04
15. Time Managing Businesses 15.47 9.47 0.08 -0.04 0.09 0.02 0.08 0.09 -.21** 0.07
16. Family Business Heritage 0.42 0.49 0.09 0.00 -0.02 0.00 0.05 .13* -0.07 0.03
17. Firm Age 7.80 2.40 0.04 -0.07 0.02 0.03 .18** 0.02 -.18** 0.08
18. Firm Employees 6.19 7.28 0.05 0.07 0.02 0.00 -0.10 -0.05 -0.01 -0.02
19. Firm Revenue 572,276 1,827,915 0.04 -0.08 .12* -0.03 -0.03 0.08 0.02 -0.06
20. Industry 0.30 0.46 0.05 -0.06 0.07 -.18** -0.03 0.06 -0.06 .12*
21. Firm Growth 3.54 1.10 .22** -0.07 .22** -0.02 0.06 0.06 -0.04 .26**
22. Work-Family Conflict 4.24 1.52 -.16** -0.11 -0.05 0.09 -.41** .32** .42** -0.10
23. Family-Work Conflict 3.09 1.37 -.15* 0.04 -0.05 -0.02 -.12* .21** .31** -.11*

124
Table 23 - Continued
9 10 11 12 13 14 15 16 17 18 19 20 21 22
Control Variables
10. Age -.18**
11. Gender 0.02 -0.01
12. Marital Status -0.09 -0.03 -.12*
13. Education -0.02 -0.04 0.06 0.02
14. Startups Count -0.09 0.06 -.17** -0.05 -0.02
15. Time Managing
Businesses -.11* .56** -0.05 -0.09 -0.07 .34**
16. Family Business
Heritage 0.08 -0.09 0.05 0.01 -0.02 -0.09 0.00
17. Firm Age -0.08 .12* 0.00 -0.11 -0.10 0.01 .26** 0.04
18. Firm Employees -0.09 0.05 -0.09 0.08 -0.05 0.11 .12* -0.11 -0.07
19. Firm Revenue -.14* 0.07 -.18** 0.01 -0.07 0.10 0.07 -0.06 -0.02 .45**
20. Industry -0.07 0.02 -.12* 0.00 -0.10 0.01 0.02 0.06 0.00 0.02 .14*
21. Firm Growth -.15** -0.07 -0.01 0.04 -0.01 .16** 0.10 0.04 -0.07 .14* .14* 0.10
22. Work-Family
Conflict .32** -.12* -0.02 0.05 -0.02 -0.07 -0.11 0.00 -0.07 0.04 -0.01 0.01 -0.02
23. Family-Work
Conflict .20** -.21** 0.01 .13* 0.08 -0.03 -0.08 -0.05 0.08 0.01 -0.02 -0.04 -.13* .46**
* p<.05, ** p<.01

125
Convergent and Discriminant Validity
Convergent validity was determined by three measures: factor loadings at or
above .40, AVE of .50 or more, and composite reliability of .70 or more (Hair et al.,
2010). Factor loadings are shown earlier in Table 22. Nine of the 44 loadings did not
meet the .50 criteria, and two of those were below .40 (both part of trait promotion). Half
or more indicators were below .50 for trait promotion and the burnout dimension
professional efficacy. Three of the five indicators for trait promotion were weak, ranging
from .29 to .47. Professional efficacy had two of four loadings at .40. The effects of these
low loadings are reflected in inadequate AVE and construct reliability measures. Table
24 summarizes these validity measures for all constructs. Among the remaining
constructs, four were affected by low loadings and failed to meet the recommended level
of AVE: work promotion, work prevention, harmonious passion, and obsessive passion.
Composite reliability was acceptable for all constructs except trait promotion and
professional efficacy. Cronbach’s alphas were consistent with composite reliability
measures, falling below .70 only for the same two constructs (Hair et al., 2010). Based on
these results, two constructs demonstrated poor convergent validity: trait promotion and
professional efficacy. Four were weak but met some of the criteria: work promotion,
work prevention, harmonious passion, and obsessive passion. Three constructs met all
recommended convergent validity standards: two of the burnout dimensions (exhaustion
and cynicism) and trait prevention.

126
Table 24
Convergent Validity Statistics
Construct AVE
Composite
Reliability
Cronbach’s
Alpha
Exhaustion 63.8% 0.90 .90
Prof Efficacy 33.8%* 0.65* .63a,.63b
Cynicism 65.7% 0.88 .84a,.89b
Trait Promotion 19.9%* 0.48* .48a,.45b
Trait Prevention 54.4% 0.85 .84
Work Promotion 35.2%* 0.81 .83a,.81b
Work Prevention 43.9%* 0.82 .85a,.82b
Harmonious Passion 47.4%* 0.78 .80a,.77b
Obsessive Passion 46.0%* 0.77 .77a,.78b
*-Low AVE or CR
a-Original scale, b-Refined scale α
Discriminant validity is supported for a construct when its AVE measure exceeds
all other construct correlations squared (Fornell & Larcker, 1981). All constructs met this
criterion except the two previously identified for weak composite reliability: trait
promotion and professional efficacy. Table 25 shows the squared construct correlations
for this test. This evidence further weakened these two constructs but supported
discriminant validity for the other five in the research model.

127
Table 25
Discriminant Validity Tests
Squared Inter-construct Correlations
Construct AVE 1 2 3 4 5 6 7 8 9
1. Exhaustion 64% 0.05 0.43 0.14 0.00 0.01 0.01 0.15 0.01
2. Prof Efficacy* 34% 0.05 0.13 0.37 0.00 0.12 0.00 0.08 0.03
3. Cynicism 66% 0.43 0.13 0.14 0.00 0.04 0.01 0.13 0.00
4. Trait Promotion* 20% 0.14 0.37 0.14 0.02 0.29 0.00 0.23 0.03
5. Trait Prevention 54% 0.00 0.00 0.00 0.02 0.07 0.01 0.00 0.03
6. Work Promotion 35% 0.01 0.12 0.04 0.29 0.07 0.00 0.06 0.18
7. Work Prevention 44% 0.01 0.00 0.01 0.00 0.01 0.01 0.00 0.00
8. Harmonious
Passion 47% 0.15 0.08 0.13 0.23 0.00 0.06 0.00 0.01
9. Obsessive
Passion 46% 0.01 0.03 0.00 0.03 0.03 0.18 0.00 0.01 *- Weak discriminant validity items
Hypothesis Testing
Hierarchical linear regression tested the hypotheses through a series of models
starting with control variables before adding direct variables and finally interaction terms
(Cohen & Cohen, 1983; Hair et al., 2010). The analysis process was repeated for each of
the three dimensions of the dependent variable burnout (exhaustion, professional
efficacy, and cynicism).
Model 1 of each regression series included the control variables alone. Model 2
added the direct effects of the interaction term constructs for each hypothesis test, and
Model 3 added one or more two-construct interactions as required for testing each
hypothesis. Model 4 added the three-construct interactions for hypotheses 3 and 4.
Multicollinearity was assessed by examining the variance inflation factor (VIF)
scores in the results of all regression models. VIF values below 10 are an indication that
multicollinearity has not affected the reported coefficients (Kutner et al., 2004).
Hypothesis 1 regression VIF scores ranged from 1.04 to 1.90, hypothesis 2 regression

128
VIF scores ranged from 1.04 to 1.92, hypothesis 3a regression VIF scores ranged from
1.04 to 1.92, hypothesis 3b regression VIF scores ranged from 1.04 to 1.97, hypothesis 4a
regression VIF scores ranged from 1.04 to 1.95, and hypothesis 4b regression VIF scores
ranged from 1.04 to 1.98. As all VIF scores were below the recommended guideline,
multicollinearity was likely not a concern.
Hypothesis 1 proposed a negative relationship between burnout and promotion-
focused entrepreneur-venture fit; the regression results are summarized in Table 26,
Table 27, and Table 28. Fit relationships, tested as interaction effects, for exhaustion
(p=.22) and professional efficacy (p=.22) were insignificant. Cynicism had a significant
interaction effect (β = .11, Δr2=.01, p<.05) and was explored next.
An interaction plot in Figure 3 aids in understanding the effect of promotion-
focused entrepreneur-venture fit on cynicism. High and low levels of work promotion
(venture) focus were separately plotted from a low trait promotion (entrepreneurs) focus
to a high trait promotion focus point. Classifications of low and high levels were one
standard deviation from the mean (Aiken et al., 1991). Ventures with low work
promotion focus showed a steeper (β=-.75) negative relationship between cynicism and
trait (entrepreneurs) promotion focus than ventures with high work promotion focus (β=-
.08). The inflection point where the two lines become statistically indiscernible occurred
at a venture (work) promotion focus level of Z=.27 based on the Johnson-Newman
technique (Johnson & Fay, 1950). This indicates that a majority (61%) of entrepreneurs
polled operated ventures with job designs that preferred levels of promotion focus that
were more likely to increase cynicism. This evidence indicates that the promotion focus
fit of the entrepreneur and venture has a relationship with cynicism. In ventures with the

129
lowest work promotion focus, entrepreneurs experienced the strongest effect as their trait
promotion focus increased and cynicism decreased. In ventures with the highest work
promotion focus, entrepreneurs experienced a smaller effect as their trait promotion focus
increased. The lowest levels of cynicism these effects related to occurred at the highest
levels of entrepreneur and venture promotion focus. Entrepreneur-venture fit related to
reduced cynicism, lending partial support to hypothesis 1. As a syndrome, burnout is
present when all three dimensions reach higher levels. Promotion fit limited one
dimension, cynicism, and thus contributed to limiting a burnout experience.

130
Table 26
Regression Results H1 Exhaustion
Burnout-Exhaustion
Variables Model 1 Model 2 Model 3
β S.E. β S.E. β S.E.
Age - .18* ( .01) - .18* ( .01) - .18* ( .01)
Gender .05 ( .15) .09 ( .15) .09 ( .15)
Marital Status - .10* ( .17) - .09 ( .17) - .09 ( .17)
Education .03 ( .06) .04 ( .05) .03 ( .05)
Startups Count - .11* ( .03) - .08 ( .03) - .08 ( .03)
Time Managing Businesses .01 ( .01) .01 ( .01) .01 ( .01)
Family Business Heritage - .08 ( .14) - .06 ( .14) - .06 ( .14)
Firm Age - .16* ( .03) - .14* ( .03) - .15* ( .03)
Firm Employees - .05 ( .01) - .04 ( .01) - .05 ( .01)
Firm Revenue .08 ( .08) .09 ( .08) .09 ( .08)
Industry - .06 ( .16) - .05 ( .15) - .04 ( .15)
Firm Growth - .01 ( .07) .02 ( .07) .02 ( .07)
Work-Family Conflict .32* ( .05) .30* ( .05) .30* ( .05)
Family-Work Conflict .14* ( .06) .13* ( .06) .13* ( .06)
Work Promotion
- .02 ( .12) - .02 ( .12)
Trait Promotion
- .19* ( .13) - .19* ( .13)
Work x Trait Promotion
.05 ( .22)
Adjusted r2 .26 .29 .29
Δr2 .29* .03* .00 F for Δr2 8.57 6.96 .85 F 8.57* 8.67* 8.21*
Note: n=308, * p ≤ .05, Standardized betas (β) with standard errors (S.E.) reported.

131
Table 27
Regression Results H1 Professional Efficacy
Burnout-Professional Efficacy
Variables Model 1 Model 2 Model 3
β S.E. β S.E. β S.E.
Age .01 ( .01) .04 ( .00) .04 ( .00)
Gender .02 ( .09) - .03 ( .09) - .03 ( .09)
Marital Status .09 ( .10) .08 ( .10) .07 ( .10)
Education .04 ( .03) .01 ( .03) .01 ( .03)
Startups Count .02 ( .02) - .05 ( .02) - .05 ( .02)
Time Managing Businesses .01 ( .01) - .01 ( .01) - .01 ( .01)
Family Business Heritage - .02 ( .09) - .04 ( .08) - .04 ( .08)
Firm Age .06 ( .02) .03 ( .02) .04 ( .02)
Firm Employees - .02 ( .01) - .01 ( .01) - .01 ( .01)
Firm Revenue - .07 ( .05) - .11 ( .05) - .11 ( .05)
Industry .11 ( .09) .08 ( .09) .08 ( .09)
Firm Growth .18* ( .04) .10 ( .04) .10 ( .04)
Work-Family Conflict - .12 ( .03) - .09 ( .03) - .08 ( .03)
Family-Work Conflict - .06 ( .04) - .03 ( .03) - .03 ( .03)
Work Promotion
.22* ( .07) .22* ( .07)
Trait Promotion
.25* ( .08) .25* ( .08)
Work x Trait Promotion
- .03 ( .13)
Adjusted r2 .04 .16 .16
Δr2 .09* .12* .00 F for Δr2 1.95 21.55 .23 F 1.95* 4.64* 4.37*
Note: n=308, * p ≤ .05, Standardized betas (β) with standard errors (S.E.) reported.

132
Table 28
Regression Results H1 Cynicism
Burnout-Cynicism
Variables Model 1 Model 2 Model 3
β S.E. β S.E. β S.E.
Age - .12 ( .01) - .14* ( .01) - .13 ( .01)
Gender - .02 ( .16) .01 ( .16) .02 ( .16)
Marital Status - .12* ( .18) - .11* ( .18) - .10 ( .18)
Education - .02 ( .06) - .01 ( .06) - .01 ( .06)
Startups Count - .07 ( .04) - .03 ( .04) - .03 ( .04)
Time Managing Businesses .04 ( .01) .05 ( .01) .04 ( .01)
Family Business Heritage .07 ( .15) .07 ( .15) .08 ( .15)
Firm Age - .09 ( .03) - .08 ( .03) - .09 ( .03)
Firm Employees - .02 ( .01) - .02 ( .01) - .02 ( .01)
Firm Revenue - .06 ( .09) - .05 ( .09) - .04 ( .09)
Industry - .05 ( .17) - .04 ( .16) - .04 ( .16)
Firm Growth - .16* ( .07) - .12* ( .07) - .13* ( .07)
Work-Family Conflict .26* ( .06) .24* ( .06) .24* ( .05)
Family-Work Conflict .04 ( .06) .03 ( .06) .03 ( .06)
Work Promotion
- .11* ( .13) - .10a ( .13)
Trait Promotion
- .14* ( .14) - .15* ( .14)
Work x Trait Promotion
.11* ( .24)
Adjusted r2 .13 .16 .17
Δr2 .17* .04* .01* F for Δr2 4.34 6.44 3.92 F 4.34* 4.75* 4.74*
Notes: n=308, *-p ≤ .05, a-p≤.10, Standardized betas (β) with standard errors (S.E.)
reported.

133
Figure 3
Interaction Plot: H1 Cynicism and Promotion Foci and Fit
Hypothesis 2 proposed a negative relationship between burnout and prevention-
based entrepreneur-venture fit. The regression results are summarized in Table 29, Table
30, and Table 31. The relationships for exhaustion (p>.05), professional efficacy (p>.05),
and cynicism (p>.05) were insignificant. Hypothesis 2 was not supported.
2.0
2.2
2.4
2.6
2.8
3.0
3.2
Low
Tra
it
Pro
moti
on
Focu
s
Hig
h T
rait
Pro
moti
on
Focu
s
Cyn
icis
m
Low Work
Promotion
Focus
High Work
Promotion
Focus

134
Table 29
Regression Results H2 Exhaustion
Burnout-Exhaustion
Variables Model 1 Model 2 Model 3
β S.E. β S.E. β S.E.
Age - .18* ( .01) - .18* ( .01) - .18* ( .01)
Gender .05 ( .15) .05 ( .15) .05 ( .15)
Marital Status - .10* ( .17) - .10* ( .17) - .10* ( .17)
Education .03 ( .06) .04 ( .06) .04 ( .06)
Startups Count - .11* ( .03) - .11* ( .03) - .11* ( .03)
Time Managing Businesses .01 ( .01) .01 ( .01) .00 ( .01)
Family Business Heritage - .08 ( .14) - .08 ( .14) - .08 ( .14)
Firm Age - .16* ( .03) - .16* ( .03) - .16* ( .03)
Firm Employees - .05 ( .01) - .04 ( .01) - .04 ( .01)
Firm Revenue .08 ( .08) .08 ( .08) .08 ( .08)
Industry - .06 ( .16) - .05 ( .16) - .05 ( .16)
Firm Growth - .01 ( .07) - .02 ( .07) - .02 ( .07)
Work-Family Conflict .32* ( .05) .31* ( .05) .31* ( .05)
Family-Work Conflict .14* ( .06) .15* ( .06) .15* ( .06)
Work Prevention .04 ( .09) .04 ( .09)
Trait Prevention - .06 ( .08) - .06 ( .08)
Work x Trait Prevention .01 ( .09)
Adjusted r2 .26 .26 .25
Δr2 .29* .00 .00 F for Δr2 8.57 .84 .03 F 8.57* 7.59* 7.12*
Note: n=308, * p ≤ .05, Standardized betas (β) with standard errors (S.E.) reported.

135
Table 30
Regression Results H2 Professional Efficacy
Burnout-Professional Efficacy
Variables Model 1 Model 2 Model 3
β S.E. β S.E. β S.E.
Age .01 ( .01) .01 ( .01) .01 ( .01)
Gender .02 ( .09) .02 ( .09) .01 ( .09)
Marital Status .09 ( .10) .09 ( .11) .09 ( .11)
Education .04 ( .03) .04 ( .03) .04 ( .03)
Startups Count .02 ( .02) .03 ( .02) .04 ( .02)
Time Managing Businesses .01 ( .01) .00 ( .01) .00 ( .01)
Family Business Heritage - .02 ( .09) - .02 ( .09) - .02 ( .09)
Firm Age .06 ( .02) .06 ( .02) .06 ( .02)
Firm Employees - .02 ( .01) - .03 ( .01) - .03 ( .01)
Firm Revenue - .07 ( .05) - .07 ( .05) - .07 ( .05)
Industry .11 ( .09) .11 ( .10) .11 ( .10)
Firm Growth .18* ( .04) .18* ( .04) .18* ( .04)
Work-Family Conflict - .12 ( .03) - .11 ( .03) - .12 ( .03)
Family-Work Conflict - .06 ( .04) - .06 ( .04) - .06 ( .04)
Work Prevention .03 ( .06) .03 ( .06)
Trait Prevention .04 ( .05) .04 ( .05)
Work x Trait Prevention .01 ( .06)
Adjusted r2 .04 .04 .03
Δr2 .09* .00 .00 F for Δr2 1.95 .47 .02 F 1.95* 1.76* 1.65
Note: n=308, * p ≤ .05, Standardized betas (β) with standard errors (S.E.) reported.

136
Table 31
Regression Results H2 Cynicism
Burnout-Cynicism
Variables Model 1 Model 2 Model 3
β S.E. β S.E. β S.E.
Age - .12 ( .01) - .12 ( .01) - .12 ( .01)
Gender - .02 ( .16) - .03 ( .16) - .03 ( .16)
Marital Status - .12* ( .18) - .12* ( .18) - .12* ( .19)
Education - .02 ( .06) - .02 ( .06) - .02 ( .06)
Startups Count - .07 ( .04) - .07 ( .04) - .07 ( .04)
Time Managing Businesses .04 ( .01) .04 ( .01) .03 ( .01)
Family Business Heritage .07 ( .15) .07 ( .15) .07 ( .15)
Firm Age - .09 ( .03) - .10 ( .03) - .10 ( .03)
Firm Employees - .02 ( .01) - .01 ( .01) - .01 ( .01)
Firm Revenue - .06 ( .09) - .07 ( .09) - .07 ( .09)
Industry - .05 ( .17) - .05 ( .17) - .05 ( .17)
Firm Growth - .16* ( .07) - .16* ( .07) - .16* ( .07)
Work-Family Conflict .26* ( .06) .25* ( .06) .25* ( .06)
Family-Work Conflict .04 ( .06) .05 ( .07) .05 ( .07)
Work Prevention .02 ( .10) .02 ( .10)
Trait Prevention - .03 ( .09) - .03 ( .09)
Work x Trait Prevention .03 ( .10)
Adjusted r2 .13 .13 .13
Δr2 .17* .00 .00 F for Δr2 4.34 .18 .35 F 4.34* 3.80* 3.59*
Note: n=308, * p ≤ .05, Standardized betas (β) with standard errors (S.E.) reported.
Hypothesis 3a proposed that harmonious passion moderates the entrepreneur-
venture promotion fit to burnout relationship. The regression results are summarized in
Table 32, Table 33, and Table 34. The relationships for exhaustion (p>.05), professional
efficacy (p>.05), and cynicism (p>.05) were insignificant. Hypothesis 3a was not
supported.

137
Table 32
Regression Results H3a Exhaustion
Burnout-Exhaustion
Variables Model 1 Model 2 Model 3 Model 4
β S.E. β S.E. β S.E. β S.E.
Age - .18* ( .01) - .18* ( .01) - .17* ( .01) - .17* ( .01)
Gender .05 ( .15) .10 ( .15) .11* ( .15) .11* ( .15)
Marital Status - .10* ( .17) - .09 ( .17) - .09 ( .17) - .08 ( .17)
Education .03 ( .06) .03 ( .05) .03 ( .05) .03 ( .05)
Startups Count - .11* ( .03) - .07 ( .03) - .06 ( .03) - .06 ( .03)
Time Managing Businesses .01 ( .01) .00 ( .01) .00 ( .01) .00 ( .01)
Family Business Heritage - .08 ( .14) - .06 ( .14) - .06 ( .14) - .05 ( .14)
Firm Age - .16* ( .03) - .13* ( .03) - .13* ( .03) - .14* ( .03)
Firm Employees - .05 ( .01) - .05 ( .01) - .05 ( .01) - .05 ( .01)
Firm Revenue .08 ( .08) .09 ( .08) .09 ( .08) .09 ( .08)
Industry - .06 ( .16) - .05 ( .15) - .05 ( .15) - .05 ( .15)
Firm Growth - .01 ( .07) .02 ( .07) .02 ( .07) .02 ( .07)
Work-Family Conflict .32* ( .05) .25* ( .06) .25* ( .06) .25* ( .06)
Family-Work Conflict .14* ( .06) .14* ( .06) .14* ( .06) .14* ( .06)
Work Promotion .00 ( .12) .00 ( .13) - .01 ( .13)
Trait Promotion - .17* ( .13) - .16* ( .13) - .17* ( .13)
Harmonious Passion - .13* ( .08) - .14* ( .08) - .15* ( .08)
Work x Trait Promotion
.05 ( .23) .05 ( .23)
Work Prom x Harm Pass
- .02 ( .12) - .01 ( .12)
Trait Prom x Harm Pass
- .05 ( .14) - .06 ( .14)
Work x Trait Prom x
Harmonious Passion
.05 ( .23)
Adjusted r2 .26 .30 .29 .29
Δr2 .29* .04* .00 .00
F for Δr2 8.57 6.45 .61 .92
F 8.57* 8.59* 7.36* 7.05*
Note: n=308, * p ≤ .05, Standardized betas (β) with standard errors (S.E.) reported.

138
Table 33
Regression Results H3a Professional Efficacy
Burnout-Professional Efficacy
Variables Model 1 Model 2 Model 3 Model 4
β S.E. β S.E. β S.E. β S.E.
Age .01 ( .01) .04 ( .00) .03 ( .00) .03 ( .00)
Gender .02 ( .09) - .04 ( .09) - .04 ( .09) - .04 ( .09)
Marital Status .09 ( .10) .08 ( .10) .08 ( .10) .08 ( .10)
Education .04 ( .03) .01 ( .03) .02 ( .03) .02 ( .03)
Startups Count .02 ( .02) - .06 ( .02) - .06 ( .02) - .06 ( .02)
Time Managing Businesses .01 ( .01) .00 ( .01) .00 ( .01) .00 ( .01)
Family Business Heritage - .02 ( .09) - .04 ( .08) - .04 ( .08) - .04 ( .08)
Firm Age .06 ( .02) .02 ( .02) .03 ( .02) .03 ( .02)
Firm Employees - .02 ( .01) - .01 ( .01) .00 ( .01) .00 ( .01)
Firm Revenue - .07 ( .05) - .11 ( .05) - .12 ( .05) - .12 ( .05)
Industry .11 ( .09) .09 ( .09) .09 ( .09) .09 ( .09)
Firm Growth .18* ( .04) .10 ( .04) .10 ( .04) .10 ( .04)
Work-Family Conflict - .12 ( .03) - .05 ( .03) - .05 ( .03) - .05 ( .03)
Family-Work Conflict - .06 ( .04) - .04 ( .03) - .04 ( .03) - .04 ( .03)
Work Promotion .20* ( .07) .21* ( .07) .21* ( .08)
Trait Promotion .24* ( .08) .24* ( .08) .24* ( .08)
Harmonious Passion .09 ( .05) .08 ( .05) .08 ( .05)
Work x Trait Promotion
- .03 ( .14) - .03 ( .14)
Work Prom x Harm Pass
.07 ( .07) .07 ( .07)
Trait Prom x Harm Pass
- .04 ( .08) - .03 ( .08)
Work x Trait Prom x
Harmonious Passion
- .01 ( .13)
Adjusted r2 .04 .16 .16 .16
Δr2 .09* .12* .00 .00
F for Δr2 1.95 15.08 .59 .01
F 1.95* 4.50* 3.90* 3.70*
Note: n=308, * p ≤ .05, Standardized betas (β) with standard errors (S.E.) reported.

139
Table 34
Regression Results H3a Cynicism
Burnout-Cynicism
Variables Model 1 Model 2 Model 3 Model 4
β S.E. β S.E. β S.E. β S.E.
Age - .12 ( .01) - .13 ( .01) - .12 ( .01) - .12 ( .01)
Gender - .02 ( .16) .02 ( .16) .03 ( .16) .03 ( .16)
Marital Status - .12* ( .18) - .11* ( .18) - .10 ( .18) - .10 ( .18)
Education - .02 ( .06) - .01 ( .06) - .02 ( .06) - .02 ( .06)
Startups Count - .07 ( .04) .00 ( .04) .00 ( .04) .00 ( .04)
Time Managing Businesses .04 ( .01) .03 ( .01) .03 ( .01) .03 ( .01)
Family Business Heritage .07 ( .15) .08 ( .15) .09 ( .15) .09 ( .15)
Firm Age - .09 ( .03) - .05 ( .03) - .07 ( .03) - .07 ( .03)
Firm Employees - .02 ( .01) - .04 ( .01) - .04 ( .01) - .04 ( .01)
Firm Revenue - .06 ( .09) - .05 ( .09) - .04 ( .09) - .04 ( .09)
Industry - .05 ( .17) - .05 ( .16) - .04 ( .16) - .04 ( .16)
Firm Growth - .16* ( .07) - .12* ( .07) - .13* ( .07) - .13* ( .07)
Work-Family Conflict .26* ( .06) .16* ( .06) .16* ( .06) .16* ( .06)
Family-Work Conflict .04 ( .06) .05 ( .06) .05 ( .06) .05 ( .06)
Work Promotion - .07 ( .13) - .07 ( .13) - .07 ( .14)
Trait Promotion - .11 ( .14) - .12* ( .14) - .12* ( .14)
Harmonious Passion - .20* ( .08) - .19* ( .09) - .20* ( .09)
Work x Trait Promotion
.09a ( .25) .10a ( .25)
Work Prom x Harm Pass
- .01 ( .13) - .01 ( .13)
Trait Prom x Harm Pass
- .01 ( .14) - .01 ( .14)
Work x Trait Prom x
Harmonious Passion
.01 ( .24)
Adjusted r2 .13 .19 .19 .19
Δr2 .17* .06* .01 .00
F for Δr2 4.34 8.02 .97 .06
F 4.34* 5.25* 4.61* 4.38*
Note: n=308, * p ≤ .05, Standardized betas (β) with standard errors (S.E.) reported, a-p≤.10
Hypothesis 3b proposed that obsessive passion moderates the entrepreneur-
venture promotion fit to burnout relationship. The regression results are summarized in
Table 35, Table 36 and Table 37. The relationships for exhaustion (p>.05), professional
efficacy (p>.05), and cynicism (p>.05) were insignificant. Hypothesis 3b was not
supported.

140
Table 35
Regression Results H3b Exhaustion
Burnout-Exhaustion
Variables Model 1 Model 2 Model 3 Model 4
β S.E. β S.E. β S.E. β S.E.
Age - .18* ( .01) - .18* ( .01) - .17* ( .01) - .17* ( .01)
Gender .05 ( .15) .09 ( .15) .09 ( .15) .09 ( .15)
Marital Status - .10* ( .17) - .09 ( .17) - .09 ( .17) - .09 ( .17)
Education .03 ( .06) .03 ( .05) .04 ( .05) .03 ( .05)
Startups Count - .11* ( .03) - .08 ( .03) - .08 ( .03) - .08 ( .03)
Time Managing Businesses .01 ( .01) .01 ( .01) .00 ( .01) .00 ( .01)
Family Business Heritage - .08 ( .14) - .06 ( .14) - .06 ( .14) - .06 ( .14)
Firm Age - .16* ( .03) - .15* ( .03) - .16* ( .03) - .16* ( .03)
Firm Employees - .05 ( .01) - .05 ( .01) - .05 ( .01) - .05 ( .01)
Firm Revenue .08 ( .08) .09 ( .08) .10 ( .08) .09 ( .08)
Industry - .06 ( .16) - .04 ( .15) - .05 ( .15) - .05 ( .15)
Firm Growth - .01 ( .07) .02 ( .07) .01 ( .07) .02 ( .07)
Work-Family Conflict .32* ( .05) .31* ( .05) .30* ( .05) .30* ( .05)
Family-Work Conflict .14* ( .06) .13* ( .06) .12* ( .06) .13* ( .06)
Work Promotion - .01 ( .13) - .03 ( .13) - .03 ( .13)
Trait Promotion - .19* ( .13) - .19* ( .13) - .17* ( .14)
Obsessive Passion - .03 ( .07) - .01 ( .07) .01 ( .07)
Work x Trait Promotion
.06 ( .24) .05 ( .25)
Work Prom x Obsess Pass
- .09 ( .10) - .09 ( .10)
Trait Prom x Obsess Pass
- .03 ( .11) - .02 ( .11)
Work x Trait Prom x
Obsessive Passion
- .05 ( .19)
Adjusted r2 .26 .28 .29 .29
Δr2 .29* .03* .01 .00
F for Δr2 8.57 4.70 1.52 .69
F 8.57* 8.15* 7.19* 6.88*
Note: n=308, * p ≤ .05, Standardized betas (β) with standard errors (S.E.) reported.

141
Table 36
Regression Results H3b Professional Efficacy
Burnout-Professional Efficacy
Variables Model 1 Model 2 Model 3 Model 4
β S.E. β S.E. β S.E. β S.E.
Age .01 ( .01) .04 ( .00) .04 ( .00) .05 ( .00)
Gender .02 ( .09) - .03 ( .09) - .03 ( .09) - .03 ( .09)
Marital Status .09 ( .10) .08 ( .10) .08 ( .10) .08 ( .10)
Education .04 ( .03) .02 ( .03) .02 ( .03) .02 ( .03)
Startups Count .02 ( .02) - .06 ( .02) - .06 ( .02) - .06 ( .02)
Time Managing Businesses .01 ( .01) - .02 ( .01) - .03 ( .01) - .03 ( .01)
Family Business Heritage - .02 ( .09) - .05 ( .08) - .05 ( .08) - .05 ( .08)
Firm Age .06 ( .02) .04 ( .02) .04 ( .02) .03 ( .02)
Firm Employees - .02 ( .01) - .01 ( .01) - .01 ( .01) - .01 ( .01)
Firm Revenue - .07 ( .05) - .11 ( .05) - .11 ( .05) - .11 ( .05)
Industry .11 ( .09) .08 ( .09) .08 ( .09) .08 ( .09)
Firm Growth .18* ( .04) .10 ( .04) .11 ( .04) .10 ( .04)
Work-Family Conflict - .12 ( .03) - .11 ( .03) - .11 ( .03) - .11 ( .03)
Family-Work Conflict - .06 ( .04) - .04 ( .03) - .04 ( .04) - .05 ( .04)
Work Promotion .19* ( .08) .18* ( .08) .18* ( .08)
Trait Promotion .25* ( .08) .26* ( .08) .24* ( .08)
Obsessive Passion .09 ( .04) .09 ( .04) .07 ( .04)
Work x Trait Promotion
- .02 ( .14) - .01 ( .15)
Work Prom x Obsess Pass
- .04 ( .06) - .04 ( .06)
Trait Prom x Obsess Pass
.01 ( .06) .00 ( .06)
Work x Trait Prom x
Obsessive Passion
.06 ( .11)
Adjusted r2 .04 .16 .16 .16
Δr2 .09* .12* .00 .00
F for Δr2 1.95 15.02 .27 .96
F 1.95* 4.49* 3.83* 3.69*
Note: n=308, * p ≤ .05, Standardized betas (β) with standard errors (S.E.) reported.

142
Table 37
Regression Results H3b Cynicism
Burnout-Cynicism
Variables Model 1 Model 2 Model 3 Model 4
β S.E. β S.E. β S.E. β S.E.
Age - .12 ( .01) - .14* ( .01) - .13 ( .01) - .13 ( .01)
Gender - .02 ( .16) .01 ( .16) .01 ( .16) .01 ( .16)
Marital Status - .12* ( .18) - .12* ( .18) - .11* ( .18) - .11 ( .18)
Education - .02 ( .06) - .01 ( .06) - .01 ( .06) - .01 ( .06)
Startups Count - .07 ( .04) - .02 ( .04) - .03 ( .04) - .02 ( .04)
Time Managing Businesses .04 ( .01) .06 ( .01) .05 ( .01) .05 ( .01)
Family Business Heritage .07 ( .15) .08 ( .15) .09 ( .15) .09 ( .15)
Firm Age - .09 ( .03) - .08 ( .03) - .09 ( .03) - .09 ( .03)
Firm Employees - .02 ( .01) - .03 ( .01) - .03 ( .01) - .03 ( .01)
Firm Revenue - .06 ( .09) - .04 ( .09) - .03 ( .09) - .03 ( .09)
Industry - .05 ( .17) - .04 ( .16) - .03 ( .16) - .03 ( .16)
Firm Growth - .16* ( .07) - .12* ( .07) - .13* ( .07) - .13* ( .07)
Work-Family Conflict .26* ( .06) .27* ( .06) .26* ( .06) .26* ( .06)
Family-Work Conflict .04 ( .06) .04 ( .06) .05 ( .06) .05 ( .06)
Work Promotion - .09 ( .14) - .07 ( .14) - .07 ( .14)
Trait Promotion - .14* ( .14) - .15* ( .14) - .14* ( .15)
Obsessive Passion - .07 ( .07) - .08 ( .07) - .08 ( .07)
Work x Trait Promotion
.09 ( .25) .08 ( .27)
Work Prom x Obsess Pass
.01 ( .10) .01 ( .10)
Trait Prom x Obsess Pass
.04 ( .11) .04 ( .12)
Work x Trait Prom x
Obsessive Passion
- .02 ( .20)
Adjusted r2 .13 .16 .17 .17
Δr2 .17* .04* .01 .00
F for Δr2 4.34 4.75 1.47 .14
F 4.34* 4.55* 4.11* 3.91*
Note: n=308, * p ≤ .05, Standardized betas (β) with standard errors (S.E.) reported.
Hypothesis 4a proposed that obsessive passion moderates the entrepreneur-
venture prevention fit to burnout relationship. The regression results are summarized in
Table 38, Table 39 and Table 40. The relationships for exhaustion (p>.05), professional
efficacy (p>.05), and cynicism (p>.05) were insignificant. Hypothesis 4a was not
supported.

143
Table 38
Regression Results H4a Exhaustion
Burnout-Exhaustion
Variables Model 1 Model 2 Model 3 Model 4
β S.E. β S.E. β S.E. β S.E.
Age - .18* ( .01) - .18* ( .01) - .19* ( .01) - .19* ( .01)
Gender .05 ( .15) .05 ( .15) .05 ( .15) .05 ( .15)
Marital Status - .10* ( .17) - .11* ( .17) - .11* ( .17) - .11* ( .17)
Education .03 ( .06) .04 ( .06) .04 ( .06) .04 ( .06)
Startups Count - .11* ( .03) - .11 ( .03) - .11 ( .03) - .11 ( .04)
Time Managing Businesses .01 ( .01) .01 ( .01) .01 ( .01) .01 ( .01)
Family Business Heritage - .08 ( .14) - .07 ( .15) - .07 ( .15) - .07 ( .15)
Firm Age - .16* ( .03) - .16* ( .03) - .16* ( .03) - .16* ( .03)
Firm Employees - .05 ( .01) - .05 ( .01) - .04 ( .01) - .04 ( .01)
Firm Revenue .08 ( .08) .08 ( .08) .08 ( .08) .08 ( .08)
Industry - .06 ( .16) - .05 ( .16) - .05 ( .16) - .05 ( .16)
Firm Growth - .01 ( .07) - .02 ( .07) - .02 ( .07) - .02 ( .07)
Work-Family Conflict .32* ( .05) .32* ( .06) .33* ( .06) .33* ( .06)
Family-Work Conflict .14* ( .06) .16* ( .06) .15* ( .06) .15* ( .06)
Work Prevention .04 ( .09) .04 ( .09) .04 ( .10)
Trait Prevention - .06 ( .08) - .07 ( .08) - .07 ( .08)
Obsessive Passion - .05 ( .06) - .06 ( .06) - .06 ( .06)
Work x Trait Prev
.01 ( .09) .01 ( .09)
Work Prev x Obsess Pass
.09a ( .06) .09a ( .06)
Trait Prev x Obsess Pass
- .04 ( .07) - .04 ( .07)
Work x Trait Prev x
Obsessive Passion
- .01 ( .07)
Adjusted r2 .26 .26 .26 .26
Δr2 .29* .01 .01 .00
F for Δr2 8.57 .85 1.35 .05
F 8.57* 7.19* 6.34* 6.02*
Note: n=308, * p ≤ .05, Standardized betas (β) with standard errors (S.E.) reported, a-p≤.10
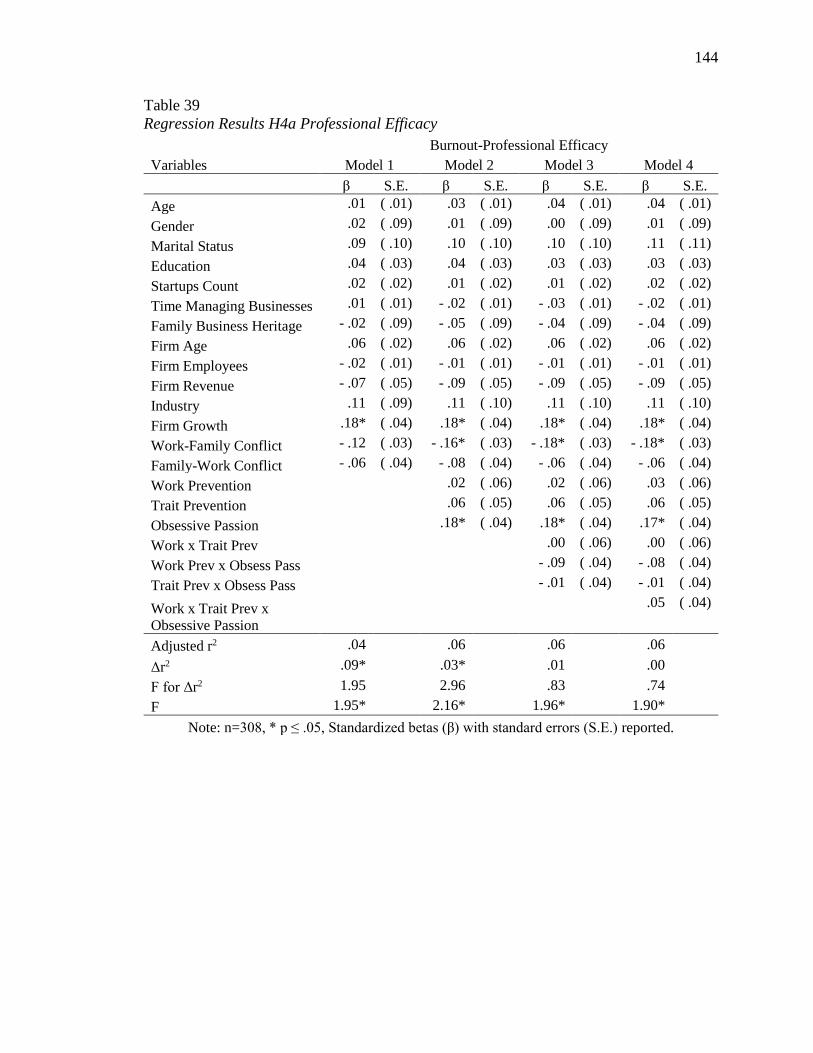
144
Table 39
Regression Results H4a Professional Efficacy
Burnout-Professional Efficacy
Variables Model 1 Model 2 Model 3 Model 4
β S.E. β S.E. β S.E. β S.E.
Age .01 ( .01) .03 ( .01) .04 ( .01) .04 ( .01)
Gender .02 ( .09) .01 ( .09) .00 ( .09) .01 ( .09)
Marital Status .09 ( .10) .10 ( .10) .10 ( .10) .11 ( .11)
Education .04 ( .03) .04 ( .03) .03 ( .03) .03 ( .03)
Startups Count .02 ( .02) .01 ( .02) .01 ( .02) .02 ( .02)
Time Managing Businesses .01 ( .01) - .02 ( .01) - .03 ( .01) - .02 ( .01)
Family Business Heritage - .02 ( .09) - .05 ( .09) - .04 ( .09) - .04 ( .09)
Firm Age .06 ( .02) .06 ( .02) .06 ( .02) .06 ( .02)
Firm Employees - .02 ( .01) - .01 ( .01) - .01 ( .01) - .01 ( .01)
Firm Revenue - .07 ( .05) - .09 ( .05) - .09 ( .05) - .09 ( .05)
Industry .11 ( .09) .11 ( .10) .11 ( .10) .11 ( .10)
Firm Growth .18* ( .04) .18* ( .04) .18* ( .04) .18* ( .04)
Work-Family Conflict - .12 ( .03) - .16* ( .03) - .18* ( .03) - .18* ( .03)
Family-Work Conflict - .06 ( .04) - .08 ( .04) - .06 ( .04) - .06 ( .04)
Work Prevention .02 ( .06) .02 ( .06) .03 ( .06)
Trait Prevention .06 ( .05) .06 ( .05) .06 ( .05)
Obsessive Passion .18* ( .04) .18* ( .04) .17* ( .04)
Work x Trait Prev
.00 ( .06) .00 ( .06)
Work Prev x Obsess Pass
- .09 ( .04) - .08 ( .04)
Trait Prev x Obsess Pass
- .01 ( .04) - .01 ( .04)
Work x Trait Prev x
Obsessive Passion
.05 ( .04)
Adjusted r2 .04 .06 .06 .06
Δr2 .09* .03* .01 .00
F for Δr2 1.95 2.96 .83 .74
F 1.95* 2.16* 1.96* 1.90*
Note: n=308, * p ≤ .05, Standardized betas (β) with standard errors (S.E.) reported.

145
Table 40
Regression Results H4a Cynicism
Burnout-Cynicism
Variables Model 1 Model 2 Model 3 Model 4
β S.E. β S.E. β S.E. β S.E.
Age - .12 ( .01) - .13 ( .01) - .13 ( .01) - .13 ( .01)
Gender - .02 ( .16) - .02 ( .16) - .02 ( .16) - .03 ( .16)
Marital Status - .12* ( .18) - .13* ( .18) - .13* ( .19) - .13* ( .19)
Education - .02 ( .06) - .02 ( .06) - .02 ( .06) - .02 ( .06)
Startups Count - .07 ( .04) - .05 ( .04) - .05 ( .04) - .06 ( .04)
Time Managing Businesses .04 ( .01) .05 ( .01) .05 ( .01) .05 ( .01)
Family Business Heritage .07 ( .15) .08 ( .16) .08 ( .16) .08 ( .16)
Firm Age - .09 ( .03) - .10 ( .03) - .10 ( .03) - .10 ( .03)
Firm Employees - .02 ( .01) - .03 ( .01) - .03 ( .01) - .03 ( .01)
Firm Revenue - .06 ( .09) - .05 ( .09) - .05 ( .09) - .05 ( .09)
Industry - .05 ( .17) - .05 ( .17) - .05 ( .17) - .04 ( .17)
Firm Growth - .16* ( .07) - .16* ( .07) - .16* ( .07) - .16* ( .07)
Work-Family Conflict .26* ( .06) .29* ( .06) .29* ( .06) .29* ( .06)
Family-Work Conflict .04 ( .06) .06 ( .07) .06 ( .07) .06 ( .07)
Work Prevention .03 ( .10) .03 ( .10) .02 ( .10)
Trait Prevention - .04 ( .09) - .04 ( .09) - .04 ( .09)
Obsessive Passion - .12* ( .07) - .11a ( .07) - .11a ( .07)
Work x Trait Prev
.04 ( .10) .04 ( .10)
Work Prev x Obsess Pass
- .01 ( .07) - .02 ( .07)
Trait Prev x Obsess Pass
.03 ( .07) .03 ( .07)
Work x Trait Prev x
Obsessive Passion
- .05 ( .07)
Adjusted r2 .13 .14 .13 .13
Δr2 .17* .01 .00 .00
F for Δr2 4.34 1.46 .27 .93
F 4.34* 3.85* 3.29* 3.18*
Note: n=308, * p ≤ .05, Standardized betas (β) with standard errors (S.E.) reported, a-p≤.10
Hypothesis 4b proposed that harmonious passion moderates the entrepreneur-
venture prevention fit to burnout relationship. The regression results are summarized in
Table 41, Table 42, and Table 43. The relationships for exhaustion (p>.05), professional
efficacy (p>.05), and cynicism (p>.05) were insignificant. Hypothesis 4b was not
supported.

146
Table 41
Regression Results H4b Exhaustion
Burnout-Exhaustion
Variables Model 1 Model 2 Model 3 Model 4
β S.E. β S.E. β S.E. β S.E.
Age - .18* ( .01) - .18* ( .01) - .17* ( .01) - .17* ( .01)
Gender .05 ( .15) .07 ( .15) .06 ( .15) .06 ( .15)
Marital Status - .10* ( .17) - .10* ( .17) - .10 ( .17) - .10 ( .17)
Education .03 ( .06) .04 ( .06) .04 ( .06) .05 ( .06)
Startups Count - .11* ( .03) - .08 ( .03) - .08 ( .03) - .07 ( .03)
Time Managing Businesses .01 ( .01) .00 ( .01) - .02 ( .01) - .01 ( .01)
Family Business Heritage - .08 ( .14) - .07 ( .14) - .06 ( .14) - .06 ( .14)
Firm Age - .16* ( .03) - .14* ( .03) - .14* ( .03) - .13* ( .03)
Firm Employees - .05 ( .01) - .05 ( .01) - .05 ( .01) - .05 ( .01)
Firm Revenue .08 ( .08) .08 ( .08) .08 ( .08) .08 ( .08)
Industry - .06 ( .16) - .05 ( .16) - .05 ( .16) - .04 ( .16)
Firm Growth - .01 ( .07) - .01 ( .07) .00 ( .07) .00 ( .07)
Work-Family Conflict .32* ( .05) .23* ( .06) .23* ( .06) .23* ( .06)
Family-Work Conflict .14* ( .06) .17* ( .06) .17* ( .06) .17* ( .06)
Work Prevention .05 ( .09) .05 ( .09) .05 ( .09)
Trait Prevention - .06 ( .08) - .06 ( .08) - .05 ( .08)
Harmonious Passion - .17* ( .08) - .17* ( .08) - .17* ( .08)
Work x Trait Prev
.02 ( .09) .01 ( .09)
Work Prev x Harm Pass
- .08 ( .09) - .07 ( .09)
Trait Prev x Harm Pass
- .01 ( .08) - .01 ( .08)
Work x Trait Prev x
Harmonious Passion
.05 ( .11)
Adjusted r2 .26 .28 .28 .28
Δr2 .29* .03* .01 .00
F for Δr2 8.57 3.70 .87 1.10
F 8.57* 7.90* 6.84* 6.57*
Note: n=308, * p ≤ .05, Standardized betas (β) with standard errors (S.E.) reported.

147
Table 42
Regression Results H4b Professional Efficacy
Burnout-Professional Efficacy
Variables Model 1 Model 2 Model 3 Model 4
β S.E. β S.E. β S.E. β S.E.
Age .01 ( .01) .01 ( .01) .00 ( .01) .00 ( .01)
Gender .02 ( .09) - .01 ( .09) - .01 ( .09) - .01 ( .09)
Marital Status .09 ( .10) .09 ( .10) .09 ( .10) .09 ( .10)
Education .04 ( .03) .04 ( .03) .03 ( .03) .03 ( .03)
Startups Count .02 ( .02) .00 ( .02) .00 ( .02) .00 ( .02)
Time Managing Businesses .01 ( .01) .01 ( .01) .03 ( .01) .03 ( .01)
Family Business Heritage - .02 ( .09) - .03 ( .09) - .04 ( .09) - .03 ( .09)
Firm Age .06 ( .02) .03 ( .02) .03 ( .02) .03 ( .02)
Firm Employees - .02 ( .01) - .01 ( .01) - .02 ( .01) - .02 ( .01)
Firm Revenue - .07 ( .05) - .07 ( .05) - .08 ( .05) - .08 ( .05)
Industry .11 ( .09) .12* ( .09) .12* ( .10) .12* ( .10)
Firm Growth .18* ( .04) .17* ( .04) .16* ( .04) .16* ( .04)
Work-Family Conflict - .12 ( .03) - .03 ( .03) - .02 ( .04) - .02 ( .04)
Family-Work Conflict - .06 ( .04) - .07 ( .04) - .08 ( .04) - .08 ( .04)
Work Prev .02 ( .06) .02 ( .06) .02 ( .06)
Trait Prev .05 ( .05) .04 ( .05) .05 ( .05)
Harmonious Passion .20* ( .05) .20* ( .05) .19* ( .05)
Work x Trait Prev
- .01 ( .06) - .01 ( .06)
Work Prev x Harm Pass
.06 ( .06) .06 ( .06)
Trait Prev x Harm Pass
.01 ( .05) .01 ( .05)
Work x Trait Prev x
Harmonious Passion
.02 ( .06)
Adjusted r2 .04 .07 .06 .06
Δr2 .09* .03* .00 .00
F for Δr2 1.95 3.48 .38 .15
F 1.95* 2.27* 1.97* 1.88*
Note: n=308, * p ≤ .05, Standardized betas (β) with standard errors (S.E.) reported.

148
Table 43
Regression Results H4b Cynicism
Burnout-Cynicism
Variables Model 1 Model 2 Model 3 Model 4
β S.E. β S.E. β S.E. β S.E.
Age - .12 ( .01) - .12 ( .01) - .12 ( .01) - .12 ( .01)
Gender - .02 ( .16) .00 ( .16) .00 ( .16) .00 ( .16)
Marital Status - .12* ( .18) - .12* ( .18) - .12* ( .18) - .12* ( .18)
Education - .02 ( .06) - .02 ( .06) - .02 ( .06) - .01 ( .06)
Startups Count - .07 ( .04) - .02 ( .04) - .02 ( .04) - .02 ( .04)
Time Managing Businesses .04 ( .01) .02 ( .01) .02 ( .01) .02 ( .01)
Family Business Heritage .07 ( .15) .08 ( .15) .08 ( .15) .09 ( .15)
Firm Age - .09 ( .03) - .06 ( .03) - .06 ( .03) - .06 ( .03)
Firm Employees - .02 ( .01) - .03 ( .01) - .03 ( .01) - .04 ( .01)
Firm Revenue - .06 ( .09) - .06 ( .09) - .06 ( .09) - .07 ( .09)
Industry - .05 ( .17) - .05 ( .16) - .05 ( .17) - .04 ( .17)
Firm Growth - .16* ( .07) - .15* ( .07) - .15* ( .07) - .15* ( .07)
Work-Family Conflict .26* ( .06) .14* ( .06) .14* ( .06) .14* ( .06)
Family-Work Conflict .04 ( .06) .07 ( .06) .07 ( .06) .07 ( .06)
Work Prev .03 ( .10) .04 ( .10) .03 ( .10)
Trait Prev - .03 ( .08) - .03 ( .08) - .03 ( .08)
Harmonious Passion - .25* ( .08) - .25* ( .08) - .25* ( .08)
Work x Trait Prev
.05 ( .10) .04 ( .10)
Work Prev x Harm Pass
.00 ( .10) .00 ( .10)
Trait Prev x Harm Pass
.02 ( .08) .02 ( .08)
Work x Trait Prev x
Harmonious Passion
.03 ( .11)
Adjusted r2 .13 .17 .17 .17
Δr2 .17* .05* .00 .00
F for Δr2 4.34 5.94 .28 .37
F 4.34* 4.81* 4.10* 3.91*
Note: n=308, * p ≤ .05, Standardized betas (β) with standard errors (S.E.) reported.
Post hoc Analyses
Hypotheses 3 and 4 explored the passion moderation effects on the entrepreneur-
venture fit promotion and prevention constructs. Since the foundational fit tests of
hypotheses 1 and 2 resulted in mostly null findings, the hypothesized moderation tests did
not provide adequate analyses to fully discuss the study motivation of exploring passion

149
implications within the entrepreneurial burnout model. In the preceding hypothesis 3 and
hypothesis 4 results, harmonious and obsessive passions found direct effects with
professional efficacy only when prevention focus constructs were included. Thus, post-
hoc regression analyses of passion alone were conducted to help disentangle the
implications for the discussion below.
All controls were first entered in model 1, and harmonious and obsessive passion
were added in Model 2. These results are presented in Table 44 through Table 46.
Harmonious passion was negatively related to burnout across all three burnout
dimensions. Obsessive passion was positively related to professional efficacy alone, also
suggesting less likelihood of a full burnout experience through one dimension.

150
Table 44
Regression Results Post Hoc Exhaustion and Passion
Exhaustion-Passion Post Hoc
Variables Model 1 Model 2
β S.E. β S.E.
Age - .18* ( .01) - .18* ( .01)
Gender .05 ( .15) .07 ( .15)
Marital Status - .10* ( .17) - .10* ( .17)
Education .03 ( .06) .02 ( .05)
Startups Count - .11* ( .03) - .08 ( .03)
Time Managing Businesses .01 ( .01) .00 ( .01)
Family Business Heritage - .08 ( .14) - .07 ( .14)
Firm Age - .16* ( .03) - .13* ( .03)
Firm Employees - .05 ( .01) - .06 ( .01)
Firm Revenue .08 ( .08) .09 ( .08)
Industry - .06 ( .16) - .06 ( .15)
Firm Growth - .01 ( .07) - .01 ( .07)
Work-Family Conflict .32* ( .05) .25* ( .06)
Family-Work Conflict .14* ( .06) .15* ( .06)
Harmonious Passion - .17* ( .08)
Obsessive Passion .00 ( .06)
Adjusted r2 .26 .27
Δr2 .29* .02*
F for Δr2 8.57 4.53
F 8.57* 8.24*
Note: n=308, *-p ≤ .05, Standardized betas (β) with standard errors (S.E.) reported.

151
Table 45
Regression Results Post Hoc Professional Efficacy and Passion
Professional Efficacy-Passion Post Hoc
Variables Model 1 Model 2
β S.E. β S.E.
Age .01 ( .01) .02 ( .01)
Gender .02 ( .09) .00 ( .09)
Marital Status .09 ( .10) .10 ( .10)
Education .04 ( .03) .04 ( .03)
Startups Count .02 ( .02) - .03 ( .02)
Time Managing Businesses .01 ( .01) .00 ( .01)
Family Business Heritage - .02 ( .09) - .05 ( .09)
Firm Age .06 ( .02) .04 ( .02)
Firm Employees - .02 ( .01) .01 ( .01)
Firm Revenue - .07 ( .05) - .10 ( .05)
Industry .11 ( .09) .11 ( .09)
Firm Growth .18* ( .04) .17* ( .04)
Work-Family Conflict - .12 ( .03) - .09 ( .04)
Family-Work Conflict - .06 ( .04) - .08 ( .04)
Harmonious Passion .16* ( .05)
Obsessive Passion .13* ( .04)
Adjusted r2 .04 .08
Δr2 .09* .04*
F for Δr2 1.95 6.97
F 1.95* 2.65*
Note: n=308, *-p ≤ .05, Standardized betas (β) with standard errors (S.E.) reported.

152
Table 46
Regression Results Post Hoc Cynicism and Passion
Cynicism-Passion Post Hoc
Variables Model 1 Model 2
β S.E. β S.E.
Age - .12 ( .01) - .13 ( .01)
Gender - .02 ( .16) .01 ( .16)
Marital Status - .12* ( .18) - .13* ( .18)
Education - .02 ( .06) - .02 ( .06)
Startups Count - .07 ( .04) - .02 ( .04)
Time Managing Businesses .04 ( .01) .03 ( .01)
Family Business Heritage .07 ( .15) .09 ( .15)
Firm Age - .09 ( .03) - .06 ( .03)
Firm Employees - .02 ( .01) - .04 ( .01)
Firm Revenue - .06 ( .09) - .05 ( .09)
Industry - .05 ( .17) - .06 ( .16)
Firm Growth - .16* ( .07) - .15* ( .07)
Work-Family Conflict .26* ( .06) .18* ( .06)
Family-Work Conflict .04 ( .06) .07 ( .06)
Harmonious Passion - .23* ( .08)
Obsessive Passion - .06 ( .07)
Adjusted r2 .13 .18
Δr2 .17* .05*
F for Δr2 4.34 9.07
F 4.34* 5.14*
Note: n=308, *-p ≤ .05, Standardized betas (β) with standard errors (S.E.) reported.
The explanatory power of passion, as described by Δr2, was surprisingly low
(Δr2=.02 to .05). Past research has found higher explanatory power for passion with
burnout (e.g., r2=.14 for de Mol et al., 2016). One difference between this study and past
research was a more extensive set of controls. To facilitate the discussion of these results,
an analysis of the effects of the alternate explanations incorporated in this study but not
noted in past studies was performed. These results are presented in Table 47 through
Table 49. The results showed meaningful passion effects for exhaustion and cynicism,

153
but not for professional efficacy. The effect sizes of passion were meaningfully reduced
when additional relationships were included in the regression with passion. Harmonious
passion reduced burnout across all three dimensions, and obsessive passion was
insignificant everywhere.
Table 47
Regression Results Post Hoc Exhaustion and Passion Controls Evaluation
Exhaustion-Passion Controls Post Hoc
Variables Model 1 Model 2 Model 3
β S.E. β S.E. β S.E.
Age - .26* ( .01) - .24* ( .01) - .17* ( .01)
Harmonious Passion
- .33* ( .07) - .16* ( .08)
Obsessive Passion
.12* ( .06) - .01 ( .06)
Marital Status
- .12* ( .17)
Startups Count
- .09 ( .03)
Firm Age
- .14* ( .03)
Work-Family Conflict
.25* ( .06)
Family-Work Conflict
.17* ( .06)
Adjusted r2 .06 .17 .27
Δr2 .07* .11* .12*
F for Δr2 21.89 20.66 9.74
F 21.89* 22.01* 15.53*
Note: n=308, *-p ≤ .05, Standardized betas (β) with standard errors (S.E.) reported.

154
Table 48
Regression Results Post Hoc Professional Efficacy and Passion Controls Evaluation
Professional Efficacy-Passion Controls Post Hoc
Variables Model 1 Model 2 Model 3
β S.E. β S.E. β S.E.
Age .03 ( .00) .03 ( .00) .04 ( .00)
Harmonious Passion
.22* ( .04) .21* ( .04)
Obsessive Passion
.07 ( .03) .06 ( .03)
Firm Growth
.17* ( .04)
Adjusted r2 .00 .05 .07
Δr2 .00 .06* .03*
F for Δr2 .24 8.96 9.76
F .24 6.06* 7.11*
Note: n=308, *-p ≤ .05, Standardized betas (β) with standard errors (S.E.) reported.
Table 49
Regression Results Post Hoc Cynicism and Passion Controls Evaluation
Cynicism-Passion Controls Post Hoc
Variables Model 1 Model 2 Model 3
β S.E. β S.E. β S.E.
Age - .15* ( .01) - .14* ( .01) - .14* ( .01)
Harmonious Passion
- .33* ( .07) - .23* ( .08)
Obsessive Passion
.04 ( .06) - .04 ( .06)
Marital Status
- .12* ( .17)
Firm Growth
- .17* ( .07)
Work-Family Conflict
.21* ( .06)
Adjusted r2 .02 .12 .18
Δr2 .02* .11* .07*
F for Δr2 7.17 18.34 8.73
F 7.17* 14.88* 12.37*
Note: n=308, *-p ≤ .05, Standardized betas (β) with standard errors (S.E.) reported.
In the preceding analyses, data were evaluated and hypotheses tested. Weaknesses
were noted in the measurement model, and hypothesis findings were null except for one.
The exception provided support for the proposed fit model in the case of promotion fit

155
and cynicism alone. Prevention focus did not help explain burnout, and neither
harmonious nor obsessive passion moderated the regulatory foci of either form. Passion
was explored in a series of post hoc regressions. Obsessive passion had no explanatory
value for burnout, and harmonious passion universally reduced burnout directly. Next,
these results are discussed and the implications are considered.

156
CHAPTER 5: DISCUSSION, LIMITATIONS, AND FUTURE RESEARCH
The overall purpose of this study is to explore a model of entrepreneurial burnout
that is capable of explaining burnout development and resistance. Entrepreneurial
experiences of burnout are argued to be particularly important to individuals and ventures
due to the unique nature of entrepreneurship. A job-fit model was defined based on
regulatory focus theory and was proposed to capture entrepreneur and venture
characteristics relevant to stressors and energy. Passion was included for its relevance to
energy and stressors. This dissertation proposes that more aligned entrepreneur and firm
characteristics relate to reduced burnout experiences, while less aligned entrepreneur and
firm characteristics relate to increased burnout experiences, and passion changes these
relationships. A broad range of entrepreneurs across the United States provided data, and
the results are reported above. This chapter discusses those results, implications, study
limitations, and ideas for future research.
Discussion
The conceptualization of entrepreneur and venture fit characteristics using
promotion and prevention foci resulted in mostly null findings, with one exception. As a
result, further testing of the moderation effects of fit by passion became mostly irrelevant.
Thus, this study finds only minimal support for the proposed model. Reconciliation is
now in order. To clarify the contributions to theoretical understanding, this discussion
explores the question, “Why are the findings so limited?” Returning to the conceptual and
157
theoretical motivations of the study to explore and reflect on these results informs and
advances the concepts and theories applied. This is done in stages for each motivation by
briefly noting the original reasoning, summarizing the findings, comparing the results to
other studies to identify consistencies and differences, developing possible explanations
for differences, and discussing the implications for the research that contributes to the
motivations.
Is Entrepreneurial Burnout Different?
An initial motivation for this study stemmed from the limited entrepreneurial
burnout research to date. Only a few burnout studies have investigated entrepreneurs, as
noted earlier in Table 1, and even fewer have examined all three dimensions of burnout.
Entrepreneurs may not experience burnout similarly to other, more studied populations;
the broad sampling design of this study sought to explore this idea. A comparison of this
study’s results with past research findings explores entrepreneurial burnout study
differences and the differences with studies of other groups.
Data for entrepreneurial burnout is limited; thus, few overlapping variables are
available for comparison. The results for control variables’ relationships with the
dimensions of burnout found that many of the demographic variables were insignificant,
or the findings were inconsistent among the three burnout dimensions. The measured
effect sizes for work-family conflict were the largest or near-largest in almost every
regression result, with the exception of professional efficacy (where work-family conflict
was insignificant in all regressions except hypothesis 4a).
This study reasoned that work-family conflict was a firm- external stressor that
would not be explained by the fit model proposed because its conceptualization was

158
limited to stressors and energies within the venture setting. One entrepreneur burnout
study has found similar correlations with work-family conflict (Boles et al., 2000), and a
second study added support (Tetrick et al., 2000). Work-family conflict correlations in
this sample were r=.42, r=.32, and r=-.10 n.s. (Table 23) compared to r=.50, r=.40, and
r=.05 n.s. for exhaustion, cynicism, and professional efficacy, respectively (Boles et al.,
2000). Tetrick et al. (2000) have found a similar r=.41 for job-personal conflict and
exhaustion. Regression testing in this study, except for tests with professional efficacy,
found that work-family conflict had moderate effect sizes (ranging from β=.14 to β=.33
standardized). These findings are consistent with research outside of entrepreneurs, as
well (e.g., Amstad, Meier, Fasel, Elfering, & Semmer, 2011; Bakker et al., 2004). The
study results confirm a relationship between work-family conflict and entrepreneurs for
two dimensions of burnout, exhaustion, and cynicism. Work-family conflict is a
significant burnout concern for entrepreneurs, as it is for other populations.
The related concept of family-work conflict also has an established relationship
with burnout in general work populations, again limited to the burnout dimensions of
exhaustion and cynicism (Peeters et al., 2005). This study identified a distinction for
entrepreneurs, however. Where relationships of a similar magnitude were observed
between exhaustion and family-work conflict, as in other populations, cynicism was less
affected among entrepreneurs. Entrepreneur correlations for exhaustion and cynicism
were r=.31 and r=.20, compared to general workers’ r=.34 and r=.33 (Peeters et al.,
2005). The lessened importance of family-work conflict for entrepreneurs is further
supported by non-significant cynicism relationships in the regression results. Conflict
originating with family demands is a concern for exhaustion, as it is for other

159
populations. To meet family demands, energy must be expended. Entrepreneurs
experienced reduced development of cynicism, however, which reduced the risk of full
burnout. A difference in the area of responsibility affected by demands may explain why
entrepreneurs were less affected by family-work conflict than work-family conflict.
Family-work conflict occurs when family demands interfere with firm responsibilities
(Netemeyer et al., 1996). Entrepreneurs with greater job control are better able than many
workers to adjust workplace situations and adapt to family demands (Demerouti et al.,
2001; Hessels, Rietveld, & van der Zwan, 2017; Maslach et al., 2001). This functional
coping strategy reduces the need for the maladaptive coping strategy of cynicism
(Maslach et al., 2001).
The unique status of entrepreneurs as typically having higher levels of control
may also explain the professional efficacy findings. Control is a moderating factor of
stressors among many populations (Alarcon, 2011) and may explain null relationships
between family-work conflict and the burnout dimension of professional efficacy.
Control has a strong positive correlation (r=.52) with professional efficacy (Lee &
Ashforth, 1996) in many populations. This study’s sample mean for professional efficacy
was relatively high, 6.28 on a seven-point scale, as has similarly been observed for other
entrepreneur samples (Boles et al., 2000; Wei et al., 2015). In one theorized sequence of
burnout development, cynicism is a precursor to reduced professional efficacy (Leiter,
1993). Control-coping may then help reduce cynicism’s depletion of professional
efficacy. Demand-control model research also supports control as a resource that is
directly related to increased professional efficacy (Taris, Kompier, Geurts, Houtman, &
Heuvel, 2010). Control, following from the autonomous nature of entrepreneurship, may

160
be a distinguishing resource of entrepreneurs that supports higher professional efficacy
and promotes resistance to burnout through control-based coping of stressors.
The work-family and family-work conflict relationships with burnout were
included in this study to incorporate stressors reasoned to be external to the proposed
inter-firm focused model. The differentiated results may reinforce support for control as
an important and defining aspect of entrepreneurs. The results of this study suggest that
entrepreneurs as a group are better able to cope with stressors but differentially in ways
that control coping may explain. Control may be an important resource for explaining
differential effects across the different burnout dimensions.
Passion
Passion was theorized as relevant to entrepreneurial burnout for its energetic
resource potential and its contribution to stressors. To separate stressor effects, the
dualistic model of passion was adopted (Vallerand et al., 2003). The proposed
moderation of the stressors to burnout relationship was theorized based on these two
mechanisms. For both passion types, the energetic resource characteristic would reduce
exhaustion and fuel professional efficacy, as well as reduce the need for coping through
cynicism. Different stressor characteristics of each passion type would lead to
differentiated outcomes. Harmonious passion would bolster adaptive coping to dampen
stressors, thus improving all dimensions of burnout (Vallerand, 2015). Obsessive passion
would prevent adaptive responses, thereby amplifying stressor effects (Vallerand, 2015).
A net burnout response would result from combined effects and was reasoned to have
particular relevance to entrepreneurs due to the importance of entrepreneurial passion

161
(Cardon et al., 2009). The net magnitude of these effects was thus theorized to tend
toward a more positive outcome for harmonious passion than obsessive passion.
The study results were partly consistent with past findings. Correlations for
harmonious passion with each burnout dimension indicated an overall reduction
(exhaustion r=-.32, professional efficacy r=.18, and cynicism r=-.32). Correlations for
obsessive passion were not significant. A study of general populations by meta-analysis
has reported a composite burnout correlation with harmonious passion of r=-.53 and no
significant relationship with obsessive passion (Curran et al., 2015). The one known
entrepreneurial burnout study found a similar composite burnout correlation with
harmonious passion of r=-.63 and no significant obsessive passion correlation (de Mol et
al., 2016). This study’s composite correlation of r=-.27 showed a weaker harmonious
passion relationship. In relation specifically to professional efficacy, Murnieks et al.
(2014) have found a correlation to entrepreneurial self-efficacy of r=.30, again larger than
this study’s finding of r=.18. Correlational findings, although not completely consistent
in magnitude, are still similar to past research. The findings of this study further support
the differential influences of harmonious and obsessive passion, as well as the weaker
effect of obsessive passion. In the regression results, a more nuanced story develops.
Hypotheses 3 and 4 related to exploring passion’s conditional effects with the
regulatory focus-based fit conceptualization. Since most of the foundational fit proposal
was unfounded, a post hoc set of regressions removed the regulatory focus fit constructs
to help explore passion effects more closely (see Table 44 through Table 46). Each
burnout dimension had a unique relationship with passion.

162
Exhaustion was consistently negatively related to harmonious passion.
Standardized β values ranged from -.14 to -.17 in all hypothesis tests. Obsessive passion
had no direct relationship with exhaustion. The first post hoc analysis Δr2 for adding both
passions was .02 (Table 44). Among entrepreneurs, the only study with passion and
burnout reported a composite score, so exhaustion was not isolated. In this study, r2
increased by .14 with the addition of passion, harmonious passion was negatively related
(β=-.46), and obsessive passion was positively related (β=.16) (de Mol et al., 2016).
Among teachers, a strong negative relationship was found for harmonious passion (β=-
.54), and a moderate positive relationship was found for obsessive passion (β=.31)
(Fernet et al., 2014). The current study’s results differ from past research and find that
passion is not as relevant to exhaustion as expected. Harmonious passion had a weaker
relationship, and obsessive passion had no explanatory value. One difference between
past studies and this one was a more comprehensive use of controls. A second post hoc
analysis explored the possibility of the more comprehensive controls as an explanation of
this study’s differing findings (Finkel, 1995).
The first post hoc regression analyses incorporated this study’s full set of
expected controls for established alternative explanations of relationships. An analysis of
comparative studies from Fernet et al. (2014) and de Mol et al. (2016) showed that only
age was controlled for in one. The second set of post hoc regressions included age as a
control first in Model 1, then added passion in Model 2 in order to better compare this
study’s data to past research findings, and finally added all the controls this study found
were significant in Model 3. The results for exhaustion are summarized in Table 47.
When alternate explanations not considered by other research are excluded, this study
163
finds more consistent comparative results. Variance explained of Δr2=.11 is closer to the
Δr2=.14 of de Mol et al. (2016), and harmonious passion and obsessive passion have
significant path coefficients (β=-.33 and β=.12 respectively) that are also similar (β=-.46
and β=.16) to de Mol et al. (2016). The path coefficients of Fernet et al. (2014) are
similar but stronger (β=-.54 and .31), perhaps highlighting differences between teacher
samples and entrepreneurs. The examination of Model 3, into which the remaining
controls were added again, showed significant additional variance explained (Δr2=.12) as
the passion constructs return to the lower harmonious passion coefficient and
insignificance for obsessive passion. This study’s differences in results for passion can be
explained by the more comprehensive inclusion of alternative explanations.
The importance of work-family conflict and family-work conflict is discussed
above. General non-work conflict was examined with nurses and found to strongly
mediate the relationship between obsessive passion and exhaustion (Vallerand et al.,
2010). The inclusion of the family conflict constructs as controls provided a better
explained variance than the obsessive passion construct alone, to the point of excluding
obsessive passion. The lowered harmonious passion coefficient is more difficult to
understand. Firm age is related to lowered exhaustion, possibly due to the reduced
liability of newness. Marital status is related to lowered exhaustion likely as a personal
stressor coping resource. Harmonious passion was revealed as less important in its
negative relationship with exhaustion when these controls were incorporated. Work-
family and family-work conflict were negatively related to harmonious passion (r=-41
and r=-.12) (see Table 23). Outside work conflict may affect harmonious passion in a
harmful way for entrepreneurs. Harmonious passion is closely connected to positive

164
affect, and in high-conflict situations with emotional importance, such as family, positive
affect may suffer. The experience of negative affect could lead to dampened harmonious
passion and the reduced effects observed on burnout.
Examinations of the other two dimensions of burnout with passion are also useful.
Harmonious and obsessive passion explained additional variance in professional efficacy
of Δr2=.06 (see Table 48). The one significant control added after age was firm growth,
which, as an indicator of success, was expected to be related to professional efficacy.
Harmonious passion was positively related (β=.22), and obsessive passion was not
significant. The addition of controls did not meaningfully change these relationships.
Harmonious passion results are consistent with one similar entrepreneur study (β=.39 for
Murnieks et al., 2014). Among entrepreneurs, studies of obsessive passion with
professional efficacy were not found. This study’s results were consistent with a study of
young female athletes, where harmonious passion had larger path coefficients, but
obsessive passion was insignificant (Martin & Horn, 2013).
The variance explained in the relationship between cynicism and the two passions
was Δr2=.12 (see Table 49). Harmonious passion was negatively related (β=-.23), and
obsessive passion was not significant. Significant controls explained an additional
Δr2=.07 of variance, with work-family conflict relating to an increase, and with marital
status and firm growth relating to a decrease. As in the case of exhaustion, controls
explained meaningful amounts of variance and reduced the magnitude of the harmonious
passion relationship.
The study’s results related to passion again highlight the importance of outside-
of-work sources of conflict to entrepreneurs. Differences in the passion findings of this

165
study compared to past research can be explained by the inclusion of controls for
established factors. The relatively weak relationship strengths for harmonious passion
may be related to family conflict for entrepreneurs, a concept not known to have been
explored directly. Another interesting implication for entrepreneurs is the null finding for
obsessive passion. Job autonomy, or control, was found to influence passion levels over
time in a sample of teachers, thus reducing obsessive passion (Fernet et al., 2014). If this
applies to entrepreneurs, high natural autonomy may reduce obsessive passion effects and
help explain why obsessive passion relationships were not as expected.
Regulatory Focus
Regulatory focus theory was at the core of this study and was applied for its
theoretical effects, which suggested usefulness for entrepreneurs (Brockner et al., 2004;
Johnson et al., 2015). This study proposed to extend a fit model of burnout to
entrepreneurs by classifying entrepreneurs as chronic, trait-based cognitive preferences
that shape action within the individual and ventures as the cognitive preferences primed
by dynamic, work-based demands. A fit-based general burnout model has been
successful for general workers (Maslach & Leiter, 2008; Maslach et al., 2001).
Entrepreneur and venture fit using regulatory focus theory has found limited support to
date for the entrepreneur half of the fit (Hmieleski & Baron, 2008). Classifying venture
characteristics in a meaningful way for burnout is challenging. A hierarchical perspective
of regulatory focus theory in organizations has suggested that the firm environment can
be characterized by tactical and strategic levels of regulatory foci (Johnson et al., 2015;
Neubert et al., 2008). This dissertation proposed that burnout would be minimized when
166
entrepreneur-venture fit characteristics were most similar, and more likely when fit
characteristics differed.
As reported above, the sole case of a fit finding was the entrepreneur-venture fit
for promotion focus and as related to cynicism alone. Entrepreneur (trait-based)
promotion focus interacted with venture (work-based) promotion to affect cynicism
(Table 28). The amount of variance explained in the interaction effect was a small but
significant Δr2=.01. Larger direct effects were found for entrepreneur (trait-based)
promotion focus with exhaustion (Table 26) and professional efficacy (Table 27).
Venture (work-based) promotion focus had a significant relationship with professional
efficacy and was marginally significant for cynicism (p=.06). For exhaustion, only the
entrepreneur mattered (Table 26). All of these relationships indicated that burnout was
lessened with a stronger promotion focus. Variance explained for direct effects was
Δr2=0.03 for exhaustion, Δr2=.12 for professional efficacy, and Δr2=.04 for cynicism.
Promotion foci were supported as meaningful for helping to explain entrepreneurial
burnout.
Prevention foci for neither the entrepreneur nor the venture were significant in
any relationship tested. Furthermore, a review of correlations in the descriptive statistics
(Table 23) showed that the only significant correlations to model constructs were
between trait prevention and two other constructs, obsessive passion and work
promotion. Prevention focus has been argued to be a useful self-regulation orientation for
entrepreneurs (Baron, 2004), but there are few regulatory focus investigations of
entrepreneurs (e.g., Bryant, 2007; Hmieleski & Baron, 2008; McMullen & Shepherd,
2002). With so little empirical research, entrepreneurs may not respond as theorized

167
(Brockner et al., 2004). A comparison of these results to other research may help explain
these null findings.
A similar sample of entrepreneurs examined firm performance and trait regulatory
foci. Prevention focus was found to have an effect, but only through an indirect path
moderated by high industry dynamism (Hmieleski & Baron, 2008). Correlation results
were insignificant between prevention and firm performance, further supporting that
there is no direct effect (Hmieleski & Baron, 2008). This study’s descriptive statistics
also indicated no significant relationship between either prevention focus or firm growth.
Entrepreneurial self-efficacy, a corollary of the burnout dimension professional efficacy,
was unrelated to prevention focus in another sample of entrepreneurs (Tumasjan &
Braun, 2012). Although limited empirical data were available for comparison, the finding
of null results for prevention focus was consistent with other studies of entrepreneurs.
In other populations, prevention focus has found mixed support. Among school
teachers, prevention focus was related to increased exhaustion (β=.28) (Brenninkmeijer et
al., 2010). A panel study of general workers found no relationship between prevention
and exhaustion (Zivnuska, Kacmar, & Valle, 2017), and meta-analytical results found no
relationship between prevention focus and self-efficacy, another construct similar to
professional efficacy (Lanaj et al., 2012). The examination of results within other
populations suggests that prevention focus has some explanatory value, but, like in
entrepreneurship, more complex moderation or mediation effects may occur, and direct
effects are thus less likely.
The theoretical basis for regulatory foci generally helping to explain
entrepreneurial strain responses such as burnout, other well-being outcomes, and firm

168
performance is convincing (Brockner et al., 2004; Hmieleski & Baron, 2008). Empirical
research supports this study’s null findings for prevention focus. Researchers have
recognized that, among entrepreneurs, both regulatory foci may not be as useful as
theorized for specific outcomes (Johnson et al., 2015; Tumasjan & Braun, 2012). One
explanation for the null findings for prevention focus may be that this cognitive
orientation is not as influential on the uniquely stressor-tolerant character of
entrepreneurs.
Baron et al. (2016) have proposed that entrepreneurs tolerate or process stressors
differently from other groups. Attraction-Selection-Attrition theory (Schneider, 1987;
Schneider, Goldstiein, & Smith, 1995) explains a self-selection process whereby potential
entrepreneurs are first drawn to new ventures as high-risk, dynamic undertakings and
then remain or withdraw depending on their capabilities and fit with the ensuing
demands. Entrepreneurs are self-selecting based on many characteristics, one of which is
a high tolerance or innate resistance to strain responses (Fine, Meng, Feldman, & Nevo,
2012). Prevention regulatory focus was reasoned to lead to greater stressors, following
from vigilance strategies and avoidance goals. Entrepreneurs that survive the attrition part
of the process and self-select to remain in their ventures may simply be less sensitive to
this stressor-strain link than theory has suggested for other groups. Prevention regulatory
focus may still be present and affect cognitive processes as reasoned. What sets
entrepreneurs apart from others may be an innate lowered response to venture stressors
such that prevention focus stressors have minimal strain effect.

169
Summary
The question remains: why such limited findings? Entrepreneurs may have a
higher tolerance for stressors and may respond differently to venture-based stressors such
as those proposed in this burnout model. Self-selection and attrition may be how this
characteristic arises, as well as the autonomy and control associated with
entrepreneurship. This could explain why only one test found stressor responses related
to poor entrepreneur-venture fit. Entrepreneurial resistance to stress may be evidenced by
the relatively high professional efficacy noted in the sample, an indication of strong
coping resources, such as control.
Implications and Future Research
Types of venture-based stressors, such as those generated in prevention focus goal
and strategy preferences and obsessive passion persistence and negative affect, may be
well tolerated by established entrepreneurs. This ability to tolerate select stressors may be
a defining factor of successful entrepreneurs. Entrepreneurs are often described as risk-
takers, but they are also recognized as innovative risk managers, a cognitive style that is
closer to prevention focus. To be successful at entrepreneurship suggests, among other
aspects, being comfortable with prevention focus cognition (Brockner et al., 2004).
Future research could explore prevention focus processes in entrepreneurs to see how this
regulatory focus contributes to risk perceptions and management, stressor and strain
responses, and venture-level outcomes such as success. The benefit may be insightful for
an important and defining aspect of entrepreneurship.
The most successful entrepreneurs are often described as passionate in terms
related to the definition of obsessive passion, long hours and lots of perspiration with

170
focus (Murnieks et al., 2016). Obsessive passion has been theorized to generate stressors
that could be detrimental, but those effects were not evident in this study. Entrepreneurs
may be resistant to strain responses from obsessive passion stressors. There could be a
protective effect from harmonious passion not presently understood or something else
about entrepreneurs that blunts detrimental strain responses. Passion research among
entrepreneurs is dominated by a different and unidimensional definition of passion
(Cardon et al., 2009). Success according to the Cardon et al. (2013) definition and
construct may be partly due to an entrepreneurial ability to tolerate stressors stemming
from obsessive passion, while other groups experience negative effects. Another
possibility mentioned in the preceding discussion may be that control acts to moderate
obsessive passion effects. The dualistic model of passion also has another construct that
was not evaluated but that may explain the minimized obsessive passion stressors.
Vallerand et al. (2003) have described Passion Criteria as a measure of the magnitude,
rather than the type, of passion present. Perhaps the obsessive passion indicated by
entrepreneurs in this sample was of a low strength; thus Passion Criteria may have
mediated and explained the lack of effects. Future research could explore obsessive
passion to examine whether the theorized negative effects manifest and how
entrepreneurs harness or minimize this type of passion for success.
These suppositions on risk tolerance could explain why prevention focus and
obsessive passion had no effects on burnout measures in this study. Enhanced stressor
tolerance of entrepreneurs may not be universal; only certain types of stressors or specific
pathways for responses may be limited by the nature of entrepreneurs. An established and
possibly defining resource often cited as enabling the marshaling of resources to blunt

171
stressor effects within the venture is control (Hessels et al., 2017). Future research may
build on demand-control theory (Karasek, 1979, 1998) as prevention focus and obsessive
passion are explored. Useful measures to assess levels of control could include capital
structure (debt ratio), percentage outside equity, percentage family and friend equity,
accelerator or incubator start-up, and board of directors presence or structure. The
expansion of control research may have the potential to explain more of what makes
entrepreneurs successful, or at least what keeps them from burning out.
Entrepreneurship is autonomous by nature, so control-coping resources are
expected to be strong. A self-selection and attrition process may serve to develop this
characteristic or any other, such as tolerance of prevention focus stressors (Baron et al.,
2016). Entrepreneurs that succumb to stressors because they do not have what it takes to
survive entrepreneurship may withdraw (attrition) from ventures and entrepreneurship.
Those that remain are likely strong in control (or whatever characteristic is needed) and
able to marshal resources and manage demands to limit stressor responses. Research that
applies the Attraction-Selection-Attrition theory proposed by Baron et al. (2016) could
explain the who and how of successful entrepreneurship. It may be helpful for future
research to explore entrepreneurs that have recently exited ventures, both for this self-
selection concept and to uncover possible cognitive dissonance effects that may have
suppressed admissions of burnout in this study. Future research could develop this theory
into a better understanding of what a successful entrepreneur is or how they came to be
one. Such research could offer insight into how to lower risk and improve the success of
new ventures.

172
Conflict from outside the venture may not be manageable by in-venture coping
tactics, so entrepreneurs may still succumb to external stressors. This could explain the
work-family and family-work conflict responses; these were among the strongest effects
found in this study. It may not be possible to cope with conflict coming from the family
while meeting venture demands. Nurse burnout experiences are similar, where emotional
drain results from unresolvable conflicts when the practical realities and limits of medical
care fail patients. Evidence of this follows from the differential effects between work-
family conflict and family-work conflict in this study. In the first case, conflict
originating in the firm may be more manageable by an autonomous entrepreneur. For
example, a business trip interfering with a family celebration may be re-scheduled to
another time, a conflict resolution with no long-term failing. The emotional impact of
letting the venture down in a conflict resolution may be less impactful, as well. Conflict
originating in the family may be less manageable. For example, attending to family needs
such as elder care or child-rearing may be difficult or impossible to resolve while still
satisfying firm demands. The emotional impact of letting a family member down in a
conflict like this may be more impactful. Conflict external to the venture is one case
where entrepreneurs may be less tolerant of a stressor, which may explain the results in
this study. Family-work and work-family conflict research is well developed and is a
specific form of inter-group conflict (Kahn et al., 1964; Netemeyer et al., 1996). The
importance of this source of conflict should be considered in future entrepreneurship
research as it could be kryptonite for entrepreneurs. For instance, family conflict may
have meaningfully affected passion research by distorting findings. Future research may
benefit from exploring the impact family conflict may have among entrepreneurs.

173
This research focused on the dependent variable burnout as a proxy for a set of
outcomes important to entrepreneurs that may be dependent on cognitive and
motivational concepts. Burnout is a negative outcome with a nomological network that
includes positive individual outcomes, such as well-being, and venture outcomes, such as
survival and performance. Future studies may find value in evaluating other outcomes
and building from the theoretical concepts applied in this study.
This study applied the dualistic model of passion, with its harmonious and
obsessive forms. The use of entrepreneurial passion is more common in passion research
of entrepreneurs (Cardon et al., 2013); it contains three dimensions, each applying to a
phase of the entrepreneurial process, although these dimensions may be re-
conceptualized. This definition of passion is most comparable to harmonious passion
because it lacks major stressor elements at least until extremely high levels.
Entrepreneurial passion has typically been theorized in research models as an antecedent
or mediator of entrepreneurial processes. Future research may find it fruitful to evaluate
entrepreneurial passion effects on burnout, and possibly for moderator effects, as
theorized in this study. Entrepreneurial passion is theorized to provide a significant
energetic resource and stressor coping mechanism through positive affect.
One area for future research concerns a limitation of this study. There were
reliability and validity challenges for the trait promotion focus measure. Although other
studies have used the RFQ successfully, some reported loadings were low, and similar
scale refinement was required. An alternative measure that performs better with
entrepreneurs could facilitate regulatory focus research. The GRFM scale, which has
received more use (Gorman et al., 2012), may serve this purpose. A study may help

174
advance regulatory focus research among entrepreneurs by evaluating this, or other,
instrument performance among entrepreneurs (Lockwood et al., 2002).
Regulatory focus theory was chosen as a cognitive framework theorized to
explain entrepreneurial stressors in this study. The choice was based on the developed
literature as well as theoretical linkages to stressors. There are alternate frameworks that
could be applied in fit models such as the one proposed here. The main requirement is
that any conceptualization’s theoretical underpinnings must be meaningful for the
outcome under investigation. Future research could benefit from alternative fit
conceptualizations that meaningfully model the process being studied.
An example of this would be regulatory mode theory (Kruglanski et al., 2000).
Regulatory mode theory was considered for this study early on but was discarded for
instrument validation concerns. Regulatory mode theory, like regulatory focus theory,
describes a self-regulatory system based on two orthogonal cognitive styles. Locomotion
and assessment describe specific cognitive perspectives with associated strategies and
pursuit goals. Although distinct from regulatory focus theory, superficially, there are
overlaps in characteristics. The concept of fit applies in the same way as for regulatory
focus theory, and there is overlap in the literature that develops the supporting fit theory.
Alternate fit models need only make theoretical sense; they do not require the
symmetry of identical theoretical structures as in the case of regulatory focus theory. For
example, Hmieleski and Baron (2008) have defined an entrepreneur-venture fit model
based on regulatory focus theory for the entrepreneur and operating environmental
certainty for the venture. The purpose of the study was to investigate venture success
from the perspective of the entrepreneur’s cognitive style. It was theorized that

175
promotion-focused entrepreneurs were most effective in uncertain operating
environments because promotion leads to exploring and finding new ways to operate, and
prevention-focused entrepreneurs were most effective in certain operating environments
because prevention leads to managing risks, avoiding losses, and optimizing the systems
in place. Similar theoretically grounded perspectives of fit may help illustrate important
contextual factors in entrepreneurship.
Contributions to Literature
Several contributions have been made to research literature. This study adds to the
limited research on entrepreneurial burnout. Evidence of the importance of
entrepreneurial burnout was reinforced (Boles et al., 2000). A broad sample confirms the
prevalence among entrepreneurs of higher levels of exhaustion and cynicism, two
dimensions of burnout. Professional efficacy did not fit the burnout profile and was
measured at the lowest burnout risk levels, indicating that the entrepreneurs sampled
tolerated stressors well and avoided full burnout experiences. This study is one of few
among entrepreneurs to examine the three dimensions of burnout defined by Maslach et
al. (1996). The results show that each dimension operates differently, thus supporting the
call to collect all three dimensions and analyze them as a syndrome rather than a
collapsed score (Maslach et al., 2001). This study also contributes to the literature by
incorporating such a large set of established burnout relationships as controls, thus
providing more insight into entrepreneurs’ burnout experiences.
Cognitive and motivational research in entrepreneurship is expanded by these
results. Regulatory focus theory holds promise to help explain entrepreneurial
experiences from a cognitive perspective (Brockner et al., 2004; Johnson et al., 2015),

176
and this study helps inform and shape future research. Theory suggests that both
promotion and prevention foci are useful for explaining entrepreneur stressor experiences
(Brockner et al., 2004). The exploration of regulatory focus orientations, including both
trait and venture forms, within a broad entrepreneurial setting show differing effects for
each focus type, promotion and prevention. In this study, regulatory focus constructs
were measured and evaluated for relationships with the three burnout dimensions:
exhaustion, professional efficacy, and cynicism. Only promotion focus affected the
burnout factors; similarly, other research has found promotion focus alone useful
(Tumasjan & Braun, 2012). A differential effect, with promotion focus alone affecting
outcomes, further supports the need to understand the unique characteristics of each focus
in the setting of entrepreneurship.
Entrepreneurial passion research benefits from this study’s application of the
infrequently applied dualistic model of passion, and from the findings of weaker
harmonious passion effects and null obsessive passion effects. The dualistic model of
passion is the dominant passion model applied outside of entrepreneurship but has seen
limited application to entrepreneurs despite its theoretical value. The unexpected results
show that passion effects are conditional on established coping resources and family
sources of conflict, thus informing this research area.
Entrepreneurship research in general benefits from the findings of minimal
stressor responses of entrepreneurs to obsessive passion and regulatory prevention mode.
Each of these factors is theorized to generate stressors that would contribute to burnout,
but the results show no effect. Entrepreneurs appear to relate differently than other
populations, and in a way that suggests greater stressor tolerance. Possible defining
177
characteristics of entrepreneurs that may explain this include autonomy (an established
factor) and innate tolerance for the certain type of stressors generated from prevention
focus-related goal pursuit preferences. Future research is needed to explore these results,
as well as to assess how these differences work within entrepreneurs.
Contributions to Practice
The following contributions to practice should be considered cautiously. Recall
that the findings were limited, r-squares were relatively small, and the explanations
focused heavily on conjecture. Even in the light of this caution, practical contributions
are proposed. Entrepreneurs are now better informed on several fronts. Promotion focus
may be important for minimizing entrepreneurial burnout and possibly other strain
responses. Trait promotion focus is believed to be stable, and, like personality,
entrepreneurs are unlikely to change it. Awareness of a lower trait promotion focus level
suggests that attention should be paid to job design, which can increase venture
promotion focus to limit the risk of cynicism (Wrzesniewski & Dutton, 2001). Regardless
of a trait promotion level, all entrepreneurs can benefit from job designs that maximize
promotion focus-preferred duties (Bryant, 2007; Tumasjan & Braun, 2012). Entrepreneur
promotion focus and venture promotion focus both contributed to lowering burnout risk,
albeit to a small degree.
Entrepreneurs also benefit from this study’s reinforcement of the established
importance of managing conflict external to the venture, specifically work-family and
family-work conflict. Prior research has shown that this source of inter-role conflict is a
significant stressor for many jobs (Amstad et al., 2011). This study highlights the
vulnerability of entrepreneurs to this type of conflict. The characteristics of entrepreneurs

178
that help limit stressor responses at the venture may not apply to family-based conflict.
Entrepreneurs must be aware of the conflict their work brings to the family, and vice
versa, and recognize that there are potentially deleterious effects for themselves in
exhaustion and cynicism. Planning to reduce or avoid these types of conflicts is
warranted; this was among the largest contributors to burnout noted in this study.
Entrepreneurs, at least established ones, can be less concerned about venture-
based stressors. Once an entrepreneur has stood the test of time, he or she is likely to
have demonstrated an inherent insensitivity to stressors or strain responses. It may be that
stressors are experienced, but entrepreneurs as a group tend to naturally avoid the
development of deleterious strain effects such as burnout. How exactly this occurs, either
by developing coping mechanisms or through predispositions, is not clear. One known
factor to be aware of is control over the entrepreneurial role.
Entrepreneurs should be aware of their autonomy as far as it impacts control over
demands and resources. Prior burnout and stressor-strain research has established a
linkage between control and strain responses (Hessels et al., 2017; Jex & Britt, 2014).
Control may allow resources to be allocated to meet demands, thereby reducing conflict
and stressors. Control may also allow demands to be adjusted for the same benefit. This
study suggests that control is a significant defining aspect of entrepreneurs that may
impart the noted natural resistance to stressor effects. Entrepreneurs may benefit from
considering the impact of aspects such as financial structures (e.g., debt leverage, or large
equity partners), business environments (e.g., a large, dominating single customer or
exclusive licensor or supplier), or other factors that may limit their autonomy. Autonomy

179
can be limited by necessity, but the importance of autonomy should be considered in
business planning and operation.
Entrepreneurs and other stakeholders such as investors, partners, and educators
should be aware of a possible window of potential risk for new or aspiring entrepreneurs.
Entrepreneurship is likely a high-stress undertaking. The observed stressor resistance of
established entrepreneurs in this study may be explained by new entrepreneurs with
natural resistance being attracted to the undertaking (Baron et al., 2016). It may also be
the result of learning coping methods that are not fully understood. These possibilities
suggest that entrepreneurs without a natural resistance, or those that do not learn to cope
with the stressors, may succumb to burnout or other outcomes and exit entrepreneurship.
Sensitivity to monitoring stressor responses, such as burnout or other maladaptive coping
behaviors, may be well advised for newer entrepreneurs.
In summary, practitioners should assess their venture or job designs and consider
how they emphasize promotion focus duties. Conflict related to family life is important to
manage. Established entrepreneurs are likely tolerant of on-the-job stressors, so major
effort to mitigate these may not be as necessary. Autonomy in the venture should be
guarded; it may be key to maintaining stressor resistance. Finally, new entrepreneurs may
be at the highest risk of developing burnout, and sensitivity to strains and quick
intervention are wise.
Limitations
Limitations are present in this study. Self-selection of study participants was an
important consideration. Burnout is a syndrome that, when fully developed, would likely
predict that an invited respondent would not respond. It is expected that entrepreneurs

180
experiencing high levels of burnout are not represented in the sample collected, and that
may have influenced the results. The examination of descriptive statistics, including
means and variation, shows that a range of values for burnout are in the data, and these
statistics are consistent with the limited entrepreneurial studies. These results, even if
they are influenced by this limitation, are still likely to be comparable to other burnout
studies that have used similar sampling designs.
The sample and method of the survey are limitations with similar potential to
influence the findings. Survey error may derive from four major areas: coverage,
sampling, non-response, and measurement (Dillman et al., 2014). Coverage error was
addressed by using a large database from Dun & Bradstreet to maximize the chance of
randomly sampling entrepreneurs. Additionally, the sample criteria described earlier
(e.g., firm size, firm age, for-profit firms) sought to qualify the sample to entrepreneurs.
This study applied criteria with established use in research to identify entrepreneurs;
however, there is no guarantee that the sample reflects entrepreneurs more than small
business operators. Additionally, an implied sample characteristic of these entrepreneurs
was that their firms represented important endeavors that required significant effort and
attention (e.g., full-time effort, financially important to the entrepreneur). The screening
criteria were designed to increase this likelihood. A limitation of this study follows from
the possibility that some respondents may not be entrepreneurs as intended.
Error may have been introduced by limiting the contacts to entrepreneurs with
email addresses on file. The sample frame without email requirement was 336,477, and
with email was 37,329. Sampling error is less likely, however, since this study attempted
contact with almost the entire list. Non-response error is a further concern; the response

181
rate for the initial emailed invitations was as expected (2.49%), but factors driving non-
response may have skewed respondents. The response rate is considered low according to
past survey practice, but not according to practice among this population using this
method in today's heightened cyber-security environment. Response rate expectations
were discussed in the initial sample estimation process and later with pilot results. The
invitation and survey design, as well as multiple contact attempts, sought to maximize
response rates (Dillman et al., 2014). Direct feedback from invitees highlighted cyber-
security as a new major concern that directly counters emailed invitations and web-based
survey design response rates. Combined with established lower responses for electronic
methods, these factors explained the observed response rate. The potential for non-
response error is a limitation of this study. As discussed in Chapter 4, firms’ basic
demographic characteristics were compared between non-responding and responding
firms. These difference tests support the conclusion that sampling non-response was not a
major issue. Measurement error is discussed next as a weakness in the measurement
model.
Weakness in the measurement model was indicated by CFA, convergent validity,
and discriminant validity testing results. CFA results indicated poor convergent and
discriminant validity. Fit measures were below guidelines (see Table 21), some loadings
were below .50 (see Table 22), and stress was evidenced in the residual covariances even
after the maximum allowed amount of scale refinement was performed. Convergent
validity testing found that six of the nine constructs were weak (see Table 24). The
weakest were trait promotion and professional efficacy, which also expressed weak
discriminant validity (see Table 25). These weaknesses increased measurement error and
182
contributed to lowered statistical power. All of these construct instruments had been
validated and used in other research, so the analyses were performed.
Validity concerns may have influenced the results in unknown ways. Even though
the instruments applied were validated and used in prior research, the entrepreneurs
polled may have interpreted these questions differently. The survey instruments used had
received only limited use among entrepreneurs, so data were too limited to perform
careful comparisons. Several instrument items were adapted slightly in terms of wording
in order to resolve ambiguity in the entrepreneurial setting, and this may have affected
the meaning of the responses collected. Correlational results indicated that many
expected nomological expectations were present in the data, which suggests that major
validity issues were not present.
Scale refinement was undertaken to improve the measurement model, which
could have affected the validity and changed the meaning of constructs. Care was taken
to assure that limited deletions were confined to items that were duplicative of the
measured dimensions so that constructs’ important definitional meanings were not
affected. The wording was inspected to identify reasons for ambiguity or
misinterpretation that may have created the need for refinement, although in most cases,
this was less than satisfactory. Research practice commonly refines the scales used in this
study, but the exact scale refinement details were not published. Best practice guidelines
for the scale refinement process were followed, which included the face validity
considerations just described, as well as maximum number deletions and maintaining
minimum indicator counts for each construct.

183
The surveys collected self-reported data, which means that all reports were
subjective, and each respondent was vulnerable to psychological (e.g., social desirability)
and practical (e.g., time constraints) biases. This design was necessary because the model
was comprised of constructs internal to the founder’s mind, and thus more objective
measures were not available. The measures discussed in the design process sought to
minimize potential biases. A limitation of this study follows from the subjective nature of
the construct reporting.
Trait promotion focus was a problematic construct because it was core to half of
the regressions. It was collected based on the established RFQ (Grant & Higgins, 2003;
Higgins et al., 2001), which has been used within entrepreneurship studies but not
without indicating issues. A nearly identical sample reported a mean of 5.55 with an
unusually low standard deviation of .09 (Hmieleski & Baron, 2008). Internal reliability
was also reported as weak at α=.60 (Kammerlander, Burger, Fust, & Fueglistaller, 2015).
Low loadings were also common, with EFA results indicating the lowest at .37 (Bryant,
2009; Kammerlander et al., 2015). The RFQ intermixes items of trait promotion focus
and trait prevention focus, with three of the six promotion items reversed. Reverse coding
of instruments may be problematic (Hair et al., 2010). In light of the findings here, these
indications suggest a cause for concern when using this instrument among entrepreneurs.
The sample size finally collected (n=302) was substantially larger than that
planned for (n=229), but this may have been insufficient to fully evaluate the proposed
model. An effect size of .08 was planned for, and regression results from the hypothesis
testing suggest that effect sizes may be smaller, with standardized β coefficients for
interactions ranging as low as .01 but including .03 and .05 values. Estimating the sample

184
size with this new information, and using the original planning criteria suggests a target
final sample size of 589 for an estimated β of .03.
Burnout is a syndrome of three dimensions that develop over time. This cross-
sectional design could not explore the development aspect of burnout. The results are
thus correlational only and do not suggest the causality of relationships. The two-survey
data collection design was not for longitudinal purposes; an important aspect of the
definition of burnout was therefore not included in the study design. The results may not
relate to the concept of burnout as much as they do to the individual dimensions
measured at one point in time.
More generally, the cross-sectional design of this study is a limitation for all
causality arguments or inferences. Theoretical development argued for relationships and
effects that were causal in nature. The hypotheses tested and the results discussed were
correlational only, with no empirical support argued for causal relationships. Testing of
the causal effects discussed requires a different study design, which was not undertaken.
Common method variance is a consideration for this study because all variables
were self-reported. Steps were taken to mitigate bias concerns: the survey design
separated dependent and independent variable collection over time, and two statistical
methods examined data for signs of common bias. Statistical testing supports the absence
of significant bias, but if it occurred, the relationships reported may be biased.
Last, this study collected data from founders within the United States, and cultural
factors may have affected the results. For instance, in the setting sampled, individualism
often dominates, but in other cultures, collectivism is more common. This may have
changed how stressor factors (e.g., family conflict) affected burnout development. A

185
more individualist person may resolve conflict by choosing to satisfy family demands
first, but a more collectivist perspective may attempt to satisfy firm demands first. Each
of these choices would lead to different, unresolved demands and different types of
potential stressors. A limitation of this study follows from cultural biases within the
setting sampled.
Conclusion
The purpose of this study was to explore how characteristics of entrepreneurs,
conceptualized in terms of regulatory focus theory, and situational characteristics of their
ventures, also conceptualized in terms of regulatory focus theory, combine into an
entrepreneur-venture fit model and interact with passion to explain entrepreneurial
burnout. Unfortunately, only a minimal part of the model was supported, but this research
has extended the use of regulatory focus theory to explain entrepreneurial burnout, and in
so doing, it showed the usefulness of promotion focus at both the entrepreneur and
venture levels. Unique characteristics of promotion and prevention foci were explored,
which revealed the importance of promotion focus and the irrelevance of prevention
focus to entrepreneurial burnout. Entrepreneurial burnout research benefited by this
addition, including the complete analysis of all three Maslach et al. (1996) burnout
dimensions. Entrepreneurs are a unique population; this study further highlighted the
greater stressor tolerance of entrepreneurs and suggested autonomy and control as
possible defining factors worthy of future research. Entrepreneurial passion research was
advanced by expanding the use of the dualist model of passion with entrepreneurs and the
finding of reduced importance of harmonious and obsessive passion. A main benefit of

186
this study was highlighting the importance of considering adequate controls, such as
those developed in the post hoc analyses that comparatively explored past passion
research. The incorporation of established explanations when exploring new concepts
was shown to meaningfully alter earlier findings. Overall, despite generally null findings,
this study still provides useful contributions.

187
REFERENCES
Ahola, K., Honkonen, T., Isometsä, E., Kalimo, R., Nykyri, E., Koskinen, S., . . .
Lönnqvist, J. (2006). Burnout in the general population. Social Psychiatry and
Psychiatric Epidemiology, 41(1), 11-17.
Aiken, L. S., West, S. G., & Reno, R. R. (1991). Multiple regression: Testing and
interpreting interactions: Sage.
Alarcon, G. M. (2011). A meta-analysis of burnout with job demands, resources, and
attitudes. Journal of Vocational Behavior, 79(2), 549-562.
Alvarez, S. A., & Barney, J. B. (2007). Discovery and creation: Alternative theories of
entrepreneurial action. Strategic Entrepreneurship Journal, 1(1-2), 11-26.
Alvarez, S. A., Barney, J. B., & Young, S. L. (2010). Debates in entrepreneurship:
Opportunity formation and implications for the field of entrepreneurship. In Z. J.
Acs & D. B. Audretsch (Eds.), Handbook of Entrepreneurship Research (Vol. 5,
pp. 23-45). New York, NY: Springer.
Amstad, F. T., Meier, L. L., Fasel, U., Elfering, A., & Semmer, N. K. (2011). A meta-
analysis of work–family conflict and various outcomes with a special emphasis on
cross-domain versus matching-domain relations. Journal of Occupational Health
Psychology, 16(2), 151.
Andrews, E. A., Short, C., Lewis, C. T., & Freund, W. (1907). Harpers' Latin dictionary.
New York: American Book Company.
Avey, J. B., Luthans, F., & Jensen, S. M. (2009). Psychological capital: A positive
resource for combating employee stress and turnover. Human Resource
Management, 48(5), 677-693.
Avey, J. B., Reichard, R. J., Luthans, F., & Mhatre, K. H. (2011). Meta‐analysis of the
impact of positive psychological capital on employee attitudes, behaviors, and
performance. Human Resource Development Quarterly, 22(2), 127-152.
Avnet, T. (2006). How regulatory fit affects value in consumer choices and opinions.
Journal of Marketing Research, 43(1), 1-10.

188
Avnet, T., & Higgins, E. T. (2003). Locomotion, assessment, and regulatory fit: Value
transfer from “how” to “what”. Journal of Experimental Social Psychology,
39(5), 525-530.
Bakker, A. B., & Demerouti, E. (2007). The job demands-resources model: State of the
art. Journal of Managerial Psychology, 22(3), 309-328.
Bakker, A. B., Demerouti, E., & Verbeke, W. (2004). Using the job demands‐resources
model to predict burnout and performance. Human Resource Management, 43(1),
83-104.
Bakker, A. B., Van Emmerik, H., & Van Riet, P. (2008). How job demands, resources,
and burnout predict objective performance: A constructive replication. Anxiety,
Stress, & Coping, 21(3), 309-324.
Ballou, J., Barton, T., DesRoches, D., Potter, F., Reedy, E., Robb, A., . . . Zhao, Z.
(2008). The Kauffman firm survey: Results from the baseline and first follow-up
surveys. Retrieved from Kansas City, MO: http://ssrn.com/abstract=1098173
Baron, R. A. (1998). Cognitive mechanisms in entrepreneurship: Why and when
entrepreneurs think differently than other people. Journal of Business Venturing,
13(4), 275-294.
Baron, R. A. (2004). The cognitive perspective: a valuable tool for answering
entrepreneurship's basic "why" questions. Journal of Business Venturing, 19(2),
221-239.
Baron, R. A. (2007). Behavioral and cognitive factors in entrepreneurship: Entrepreneurs
as the active element in new venture creation. Strategic Entrepreneurship
Journal, 1(1‐2), 167-182.
Baron, R. A., Franklin, R. J., & Hmieleski, K. M. (2016). Why entrepreneurs often
experience low, not high, levels of stress: The joint effects of selection and
psychological capital. Journal of Management, 42(3), 742-768.
Baron, R. A., Hmieleski, K. M., & Henry, R. A. (2012). Entrepreneurs' dispositional
positive affect: The potential benefits – and potential costs – of being “up”.
Journal of Business Venturing, 27(3), 310-324.
Baum, J. R., & Locke, E. A. (2004). The relationship of entrepreneurial traits, skill, and
motivation to subsequent venture growth. Journal of Applied Psychology, 89(4),
587-598.
Baum, J. R., Locke, E. A., & Smith, K. G. (2001). A multidimensional model of venture
growth. Academy of Management Journal, 44(2), 292-303.

189
Baumgartner, H., & Steenkamp, J.-B. E. M. (2001). Response styles in marketing
research: a cross-national investigation. Journal of Marketing Research, 38(2),
143-156.
Beehr, T. A., & Newman, J. E. (1978). Job stress, employee health, and organizational
effectiveness: A facet analysis, model, and literature review. Personnel
Psychology, 31(4), 665-699.
Belanger, J. J., Lafreniere, M.-A. K., Vallerand, R. J., & Kruglanski, A. W. (2013). When
passion makes the heart grow colder: The role of passion in alternative goal
suppression. Journal of Personality and Social Psychology, 104(1), 126-147.
Biraglia, A., & Kadile, V. (2017). The role of entrepreneurial passion and creativity in
developing entrepreneurial intentions: Insights from american homebrewers.
Journal of Small Business Management, 55(1), 170-188.
Birnholtz, J. P., Horn, D. B., Finholt, T. A., & Bae, S. J. (2004). The effects of cash,
electronic, and paper gift certificates as respondent incentives for a web-based
survey of technologically sophisticated respondents. Social Science Computer
Review, 22(3), 355-362.
Boles, J. S., Dean, D. H., Ricks, J. M., Short, J. C., & Wang, G. (2000). The
dimensionality of the Maslach Burnout Inventory across small business owners
and educators. Journal of Vocational Behavior, 56(1), 12-34.
Brenninkmeijer, V., Demerouti, E., le Blanc, P. M., & Hetty van Emmerik, I. (2010).
Regulatory focus at work: The moderating role of regulatory focus in the job
demands-resources model. Career Development International, 15(7), 708-728.
Breugst, N., Domurath, A., Patzelt, H., & Klaukien, A. (2012). Perceptions of
entrepreneurial passion and employees' commitment to entrepreneurial ventures.
Entrepreneurship: Theory & Practice, 36(1), 171-192.
Brigham, K. H. (2002). Mismatch between entrepreneurs and their firms: The role of
cognitive fit/misfit. (Ph.D.), University of Colorado, Boulder, CO.
Brigham, K. H., De Castro, J. O., & Shepherd, D. A. (2007). A person-organization fit
model of owner-managers' cognitive style and organizational demands.
Entrepreneurship: Theory & Practice, 31(1), 29-51.
Brockner, J., Higgins, E. T., & Low, M. B. (2004). Regulatory focus theory and the
entrepreneurial process. Journal of Business Venturing, 19(2), 203-220.
Bryant, P. (2007). Self-regulation and decision heuristics in entrepreneurial opportunity
evaluation and exploitation. Management Decision, 45(4), 732-748.
Bryant, P. (2009). Self-regulation and moral awareness among entrepreneurs. Journal of
Business Venturing, 24(5), 505-518.

190
Bunderson, J. S. (2001). How work ideologies shape the psychological contracts of
professional employees: Doctors' responses to perceived breach. Journal of
Organizational Behavior, 22(7), 717-741.
Caplan, R. D. (1987). Person-environment fit theory and organizations: Commensurate
dimensions, time perspectives, and mechanisms. Journal of Vocational behavior,
31(3), 248-267.
Cardon, M. S., Glauser, M., & Murnieks, C. Y. (2017). Passion for what? Expanding the
domains of entrepreneurial passion. Journal of Business Venturing Insights, 8, 24-
32.
Cardon, M. S., Gregoire, D. A., Stevens, C. E., & Patel, P. C. (2013). Measuring
entrepreneurial passion: Conceptual foundations and scale validation. Journal of
Business Venturing, 28(3), 373-396.
Cardon, M. S., & Kirk, C. P. (2015). Entrepreneurial passion as mediator of the self-
efficacy to persistence relationship. Entrepreneurship Theory and Practice, 39(5),
1027-1050.
Cardon, M. S., Mitteness, C. R., & Sudek, R. (2017). Motivational cues and angel
investing: Interactions among enthusiasm, preparedness, and commitment.
Entrepreneurship Theory and Practice, 41(6), 1057-1085.
Cardon, M. S., Wincent, J., Singh, J., & Drnovsek, M. (2009). The nature and experience
of entrepreneurial passion. The Academy of Management Review, 34(3), 511-532.
CBInsights. (2018). Top 20 reasons why startups fail. Retrieved from
https://app.cbinsights.com/research/startup-failure-reasons-top/
Chan, D. (1996). Cognitive misfit of problem-solving style at work: A facet of person-
organization fit. Organizational Behavior and Human Decision Processes, 68(3),
194-207.
Chang, E. C. (2004). Distinguishing between ruminative and distractive responses in
dysphoric college students: Does indication of past depression make a difference?
Personality and Individual Differences, 36(4), 845-855.
Church, A. (1993). Estimating the effect of incentives on mail survey response. Public
Opinion Quarterly, 57(1), 62-79.
Cohen, J. D., & Cohen, P. (1983). Applied multiple regression/correlation analysis for
the behavioral sciences. Hillsdale,NJ: Erlbaum.
Cole, M. S., Walter, F., Bedeian, A. G., & O’Boyle, E. H. (2012). Job burnout and
employee engagement: A meta-analytic examination of construct proliferation.
Journal of Management, 38(5), 1550-1581.
191
Collewaert, V., Anseel, F., Crommelinck, M., De Beuckelaer, A., & Vermeire, J. (2016).
When passion fades: Disentangling the temporal dynamics of entrepreneurial
passion for founding. Journal of Management Studies, 53(6), 966-995.
Coombs, J. E., Webb, J., & Swider, B. (2009). The role of burnout in venture failure.
Frontiers of Entrepreneurship Research, 29(6), 22.
Cordes, C. L., & Dougherty, T. W. (1993). A review and an integration of research on job
burnout. Academy of Management Review, 18(4), 621-656.
Crawford, S., McCabe, S., Couper, M., & Boyd, C. (2002). From mail to web: improving
response rates and data collection efficiencies. Paper presented at the
International Conference on Improving Surveys.
Cuervo-Cazurra, A., Andersson, U., Brannen, M. Y., Nielsen, B. B., & Reuber, A. R.
(2016). From the editors: Can I trust your findings? Ruling out alternative
explanations in international business research. Journal of International Business
Studies, 47(8), 881-897.
Curran, T., Hill, A. P., Appleton, P. R., Vallerand, R. J., & Standage, M. (2015). The
psychology of passion: A meta-analytical review of a decade of research on
intrapersonal outcomes. Motivation and Emotion, 39(5), 631-655.
Dalborg, C., & Wincent, J. (2015). The idea is not enough: The role of self-efficacy in
mediating the relationship between pull entrepreneurship and founder passion – a
research note. International Small Business Journal, 33(8), 974-984.
Davis, B. C., Hmieleski, K. M., Webb, J. W., & Coombs, J. E. (2017). Funders' positive
affective reactions to entrepreneurs' crowdfunding pitches: The influence of
perceived product creativity and entrepreneurial passion. Journal of Business
Venturing, 32(1), 90-106.
De Clercq, D., Honig, B., & Martin, B. (2013). The roles of learning orientation and
passion for work in the formation of entrepreneurial intention. International Small
Business Journal, 31(6), 652-676.
de Mol, E., Ho, V. T., & Pollack, J. M. (2016). Predicting entrepreneurial burnout in a
moderated mediated model of job fit. Journal of Small Business Management.
Deci, E. L., & Ryan, R. M. (2000). The" what" and" why" of goal pursuits: Human needs
and the self-determination of behavior. Psychological Inquiry, 11(4), 227-268.
Demerouti, E., Bakker, A. B., Nachreiner, F., & Schaufeli, W. B. (2001). The job
demands-resources model of burnout. Journal of Applied Psychology, 86(3), 499-
512.

192
Demerouti, E., Mostert, K., & Bakker, A. B. (2010). Burnout and work engagement: a
thorough investigation of the independency of both constructs. Journal of
Occupational Health Psychology, 15(3), 209-222.
Demerouti, E., & Nachreiner, F. (1998). The specificity of burnout in human services:
Fact or artifact? Zeitschrift fur Arbeitswissenschaft, 52(2), 82-89.
Derryberry, D., & Reed, M. A. (1994). Temperament and attention: Orienting toward and
away from positive and negative signals. Journal of Personality and Social
Psychology, 66(6), 1128-1139.
Dillman, D. A., Smyth, J. D., & Christian, L. M. (2014). Internet, phone, mail, and
mixed-mode surveys: the tailored design method. Hoboken, NJ: John Wiley &
Sons.
Dimov, D. (2010). Nascent entrepreneurs and venture emergence: Opportunity
confidence, human capital, and early planning. Journal of Management Studies,
47(6), 1123-1153.
Drnovsek, M., Cardon, M. S., & Patel, P. C. (2016). Direct and indirect effects of passion
on growing technology ventures. Strategic Entrepreneurship Journal, 10(2), 194-
213.
Dun & Bradstreet. (2018). Dun & Bradstreet Hoovers Database. Available from Dun &
Bradstreet Hoovers Retrieved 11/27/2018, from Dun and Bradstreet,
Inc. www.dnb.com
Edward, J., Caplan, R., & Van Harrison, R. (1998). Person-environment fit theory:
Conceptual foundations, empirical evidence and direction for future research. In
A. C. Cooper (Ed.), Theories of organisational stress (pp. 28-67). Oxford: Oxford
University Press.
Elliot, A. J., & Harackiewicz, J. M. (1996). Approach and avoidance achievement goals
and intrinsic motivation: A mediational analysis. Journal of Personality and
Social Psychology, 70(3), 461-475.
Elliot, A. J., Thrash, T. M., & Murayama, K. (2011). A longitudinal analysis of self‐
regulation and well‐being: Avoidance personal goals, avoidance coping, stress
generation, and subjective well‐being. Journal of Personality, 79(3), 643-674.
Faul, F., Erdfelder, E., Buchner, A., & Lang, A.-G. (2009). Statistical power analyses
using G* Power 3.1: Tests for correlation and regression analyses. Behavior
Research Methods, 41(4), 1149-1160.
Fernet, C., Lavigne, G. L., Vallerand, R. J., & Austin, S. (2014). Fired up with passion:
Investigating how job autonomy and passion predict burnout at career start in
teachers. Work & Stress, 28(3), 270-288.

193
Fernet, C., Torrès, O., Austin, S., & St-Pierre, J. (2016). The psychological costs of
owning and managing an SME: Linking job stressors, occupational loneliness,
entrepreneurial orientation, and burnout. Burnout Research, 3(2), 45-53.
Fine, S., Meng, H., Feldman, G., & Nevo, B. (2012). Psychological predictors of
successful entrepreneurship in China: An empirical study. International Journal
of Management, 29(1), 279.
Finkel, S. E. (1995) Causal analysis with panel data. In S. McElroy (Series Ed.), Sage
University Paper series on Quantitative Applications in the Social Sciences: Vol.
07-105 (pp. 98). Thousand Oaks, CA: Sage.
Firth, H., & Britton, P. (1989). 'Burnout', absence and turnover amongst British nursing
staff. Journal of Occupational Psychology, 62(1), 55-59.
Fisher, R., Merlot, E., & Johnson, L. W. (2018). The obsessive and harmonious nature of
entrepreneurial passion. International Journal of Entrepreneurial Behavior &
Research, 24(1), 22-40.
Forgas, J. P., & George, J. M. (2001). Affective influences on judgments and behavior in
organizations: An information processing perspective. Organizational Behavior
and Human Decision Processes, 86(1), 3-34.
Fornell, C., & Larcker, D. F. (1981). Evaluating structural equation models with
unobservable variables and measurement error. Journal of Marketing Research,
39-50.
Förster, J., Higgins, E. T., & Bianco, A. T. (2003). Speed/accuracy decisions in task
performance: Built-in trade-off or separate strategic concerns? Organizational
Behavior and Human Decision Processes, 90(1), 148-164.
Fowler, F. J. (2013). Survey research methods (5th ed.). Thousand Oaks, CA: Sage.
French, J. R., Caplan, R. D., & Van Harrison, R. (1982). The mechanisms of job stress
and strain (Vol. 7). Chichester [Sussex]; New York: J. Wiley.
French, J. R., Rodgers, W., & Cobb, S. (1974). Adjustment as person-environment fit. In
G. V. Coelho, D. A. Hamburg, & J. E. Adams (Eds.), Coping and Adaptation (pp.
316-333). New York: Basic Books.
Freudenberger, H. J. (1974). Staff burn-out. Journal of Social Issues, 30(1), 159-165.
Gielnik, M. M., Spitzmuller, M., Schmitt, A., Klemann, D. K., & Frese, M. (2015). “I put
in effort, therefore I am passionate”: Investigating the path from effort to passion
in entrepreneurship. Academy of Management Journal, 58(4), 1012-1031.

194
Gielnik, M. M., Uy, M. A., Funken, R., & Bischoff, K. M. (2016). Boosting and
sustaining passion: A long-term perspective on the effects of entrepreneurship
training. Journal of Business Venturing, 32(3), 334-353.
Goodell, J. (1994). Steve Jobs in 1994: The Rolling Stone Interview. Rolling Stone, 16,
10.
Gorgievski, M. J., & Hobfoll, S. E. (2008). Work can burn us out or fire us up:
Conservation of resources in burnout and engagement. In J. R. B. Halbesleben
(Ed.), Handbook of stress and burnout in health care (3 ed., pp. 7-22): Nova
Science Publishers.
Gorman, C. A., Meriac, J. P., Overstreet, B. L., Apodaca, S., McIntyre, A. L., Park, P., &
Godbey, J. N. (2012). A meta-analysis of the regulatory focus nomological
network: Work-related antecedents and consequences. Journal of Vocational
Behavior, 80(1), 160-172.
Grant, H., & Higgins, E. T. (2003). Optimism, promotion pride, and prevention pride as
predictors of quality of life. Personality and Social Psychology Bulletin, 29(12),
1521-1532.
Hair, J. F., Black, W. C., Babin, B. J., & Anderson, R. E. (2010). Multivariate data
analysis (7th ed.). Upper Saddle River, NJ: Prentice Hall.
Hayes, A. F. (2013). Introduction to mediation, moderation, and conditional process
analysis: A regression-based approach: Guilford Press.
Hessels, J., Rietveld, C. A., & van der Zwan, P. (2017). Self-employment and work-
related stress: The mediating role of job control and job demand. Journal of
Business Venturing, 32(2), 178-196.
Higgins, E. T. (1997). Beyond pleasure and pain. American Psychologist, 52(12), 1280-
1300.
Higgins, E. T. (1998). Promotion and prevention: Regulatory focus as a motivational
principle. In M. P. Zanna (Ed.), Advances in Experimental Social Psychology
(Vol. 30, pp. 1-46): Academic Press.
Higgins, E. T. (2005). Value from regulatory fit. Current Directions in Psychological
Science, 14(4), 209-213.
Higgins, E. T., Friedman, R. S., Harlow, R. E., Idson, L. C., Ayduk, O. N., & Taylor, A.
(2001). Achievement orientations from subjective histories of success: Promotion
pride versus prevention pride. European Journal of Social Psychology, 31(1), 3-
23.

195
Hmieleski, K. M., & Baron, R. A. (2008). Regulatory focus and new venture
performance: A study of entrepreneurial opportunity exploitation under conditions
of risk versus uncertainty. Strategic Entrepreneurship Journal, 2(4), 285-299.
Hmieleski, K. M., & Baron, R. A. (2009). Entrepreneurs' optimism and new venture
performance: a social cognitive perspective. Academy of Management Journal,
52(3), 473-488.
Ho, V. T., & Pollack, J. M. (2014). Passion isn't always a good thing: Examining
entrepreneurs' network centrality and financial performance with a dualistic
model of passion. Journal of Management Studies, 51(3), 433-459.
Hobfoll, S. E., & Freedy, J. (1993). Conservation of resources: A general stress theory
applied to burnout. In W. Schaufeli, C. Maslach, & T. Marek (Eds.), Professional
burnout: Recent developments in theory and research (pp. 115-133). New York,
NY: Taylor & Francis.
Hsu, D. K., Haynie, J. M., Simmons, S. A., & McKelvie, A. (2013). What matters,
matters differently: a conjoint analysis of the decision policies of angel and
venture capital investors. Venture Capital, 16(1), 1-25.
Huyghe, A., Knockaert, M., & Obschonka, M. (2016). Unraveling the “passion
orchestra” in academia. Journal of Business Venturing, 31(3), 344-364.
Jackson, S. E., Schwab, R. L., & Schuler, R. S. (1986). Toward an understanding of the
burnout phenomenon. Journal of Applied Psychology, 71(4), 630-640.
Jacobson, E., Charters, W., & Lieberman, S. (1951). The use of the role concept in the
study of complex organizations. Journal of Social Issues, 7(3), 18-27.
Jex, S. M., & Britt, T. W. (2014). Organizational psychology: A scientist-practitioner
approach (3rd ed.). Hoboken, NJ: John Wiley & Sons.
Johnson, P. D., Smith, M. B., Wallace, J. C., Hill, A. D., & Baron, R. A. (2015). A
review of multilevel regulatory focus in organizations. Journal of Management,
41(5), 1501-1529.
Johnson, P. O., & Fay, L. C. (1950). The Johnson-Neyman technique, its theory and
application. Psychometrika, 15(4), 349-367.
Johnson, R. E., Rosen, C. C., & Djurdjevic, E. (2011). Assessing the impact of common
method variance on higher order multidimensional constructs. Journal of Applied
Psychology, 96(4), 744-761.
Jones, B., Flynn, D. M., & Kelloway, E. K. (1995). Perception of support from the
organization in relation to work stress, satisfaction, and commitment. In S. L.
Sauter & L. R. Murphy (Eds.), Organizational risk factors for job stress (pp. 41-
52). Washington, DC: American Psychological Association.

196
Jones, R., & Pitt, N. (1999). Health surveys in the workplace: comparison of postal, email
and World Wide Web methods. Occupational Medicine, 49(8), 556-558.
Judge, T. A., & Ferris, G. R. (1992). The elusive criterion of fit in human resources
staffing decisions. Human Resource Planning, 15(4), 47-67.
Jung, H. S., Yoon, H. H., & Kim, Y. J. (2012). Effects of culinary employees’ role stress
on burnout and turnover intention in hotel industry: moderating effects on
employees’ tenure. The Service Industries Journal, 32(13), 2145-2165.
Kahn, R. L., Wolfe, D. M., Quinn, R. P., Snoek, J. D., & Rosenthal, R. A. (1964).
Organizational stress: Studies in role conflict and ambiguity. New York, NY:
Wiley.
Kalleberg, A. L., Marsden, P. V., Aldrich, H. E., & Cassell, J. W. (1990). Comparing
organizational sampling frames. Administrative Science Quarterly, 35(4), 658-
688.
Kammerlander, N., Burger, D., Fust, A., & Fueglistaller, U. (2015). Exploration and
exploitation in established small and medium-sized enterprises: The effect of
CEOs' regulatory focus. Journal of Business Venturing, 30(4), 582-602.
Kang, J. H., Matusik, J. G., Kim, T.-Y., & Phillips, J. M. (2016). Interactive effects of
multiple organizational climates on employee innovative behavior in
entrepreneurial firms: A cross-level investigation. Journal of Business Venturing,
31(6), 628-642.
Karasek, R. A. (1979). Job demands, job decision latitude, and mental strain:
Implications for job redesign. Administrative Science Quarterly, 24(2), 285-308.
Karasek, R. A. (1998). Demand/Control model: A social-emotional, and psychological
approach to stress risk and active behavior development. In J. M. Stellman (Ed.),
Encyclopedia of occupational health and safety (4 ed., pp. 34.36-34.14):
International Labour Office.
Katz, D., & Kahn, R. L. (1978). The social psychology of organizations (Vol. 2). New
Yourk, NY: Wiley.
Kristof-Brown, A. L. (1996). Person‐organization fit: An integrative review of its
conceptualizations, measurement, and implications. Personnel Psychology, 49(1),
1-49.
Kristof-Brown, A. L., Zimmerman, R. D., & Johnson, E. C. (2005). Consequences of
individuals' fit at work: A meta-analysis of person–job, person–organization,
person–group, and person–supervisor fit. Personnel Psychology, 58(2), 281-342.
Krosnick, J. A. (1999). Survey research. Annual Review of Psychology, 50, 537-567.

197
Kruglanski, A. W., Orehek, E., Higgins, E. T., Pierro, A., & Shalev, I. (2009).
Assessment and locomotion as independent determinants in goal pursuit. In R. H.
Hoyle (Ed.), Handbook of personality and self-regulation (pp. 375-402).
Singapore: Wiley-Blackwell.
Kruglanski, A. W., Thompson, E. P., Higgins, E. T., Atash, M., Pierro, A., Shah, J. Y., &
Spiegel, S. (2000). To" do the right thing" or to" just do it": locomotion and
assessment as distinct self-regulatory imperatives. Journal of Personality and
Social Psychology, 79(5), 793-815.
Kutner, M. H., Nachtsheim, C. J., Neter, J., & Wasserman, W. (2004). Applied linear
regression models (4th ed.): McGraw-Hill.
Lanaj, K., Chang, C.-H., & Johnson, R. E. (2012). Regulatory focus and work-related
outcomes: a review and meta-analysis. Psychological Bulletin, 138(5), 998-1034.
Lavigne, G. L., Forest, J., & Crevier-Braud, L. (2012). Passion at work and burnout: A
two-study test of the mediating role of flow experiences. European Journal of
Work and Organizational Psychology, 21(4), 518-546.
Lazarus, R. S. (2006). Stress and emotion: A new synthesis. New York, NY: Springer.
Lazarus, R. S., & Folkman, S. (1984). Stress, appraisal, and coping. New York, NY:
Springer.
Lee, R. T., & Ashforth, B. E. (1996). A meta-analytic examination of the correlates of the
three dimensions of job burnout. Journal of Applied Psychology, 81(2), 123.
Leiter, M. P. (1993). Burnout as a developmental process: Consideration. In W.
Schaufeli, C. Maslach, & T. Marek (Eds.), Professional burnout: Recent
developments in theory and research (pp. 237-250). New York, NY: Taylor &
Francis.
Leiter, M. P., & Maslach, C. (2001). Burnout and quality in a speed-up world. The
Journal for Quality and Participation, 24(2), 48-51.
Leiter, M. P., & Maslach, C. (2003). Areas of worklife: A structured approach to
organizational predictors of job burnout. In P. Perrewé & D. C. Ganster (Eds.),
Emotional and physiological processes and positive intervention strategies (Vol.
3, pp. 91-134): Emerald Group Publishing Limited.
Lockwood, P., Jordan, C. H., & Kunda, Z. (2002). Motivation by positive or negative role
models: Regulatory focus determines who will best inspire us. Journal of
Personality and Social Psychology, 83(4), 854-864.
Lourel, M., Gueguen, N., & Mouda, F. (2007). The burnout assessment of Pines: a french
adaptation and validation of the ‘Burnout Measure Short version' (BMS-10).
Pratiques Psychologiques, 13(3), 353-364.

198
Lumpkin, G. T., & Dess, G. G. (1996). Clarifying the entrepreneurial orientation
construct and linking it to performance. Academy of Management Review, 21(1),
135-172.
Lynn, P. (2009). Methodology of longitudinal surveys. United Kingdom: John Wiley &
Sons.
Lyubomirsky, S., King, L., & Diener, E. (2005). The benefits of frequent positive affect:
Does happiness lead to success? Psychological Bulletin, 131(6), 803-855.
MacKenzie, S. B., Podsakoff, P. M., & Podsakoff, N. P. (2011). Construct measurement
and validation procedures in MIS and behavioral research: Integrating new and
existing techniques. MIS Quarterly, 35(2), 293-334.
Mageau, G. v. A., Vallerand, R. J., Rousseau, F. l. L., Ratelle, C. F., & Provencher, P. J.
(2005). Passion and gambling: Investigating the divergent affective and cognitive
consequences of gambling. Journal of Applied Social Psychology, 35(1), 100-118.
Mäkikangas, A., & Kinnunen, U. (2016). The person-oriented approach to burnout: a
systematic review. Burnout Research, 3(1), 11-23.
Malach-Pines, A. (2005). The burnout measure, short version. International Journal of
Stress Management, 12(1), 78-88.
Manfreda, K. L., Bosnjak, M., Berzelak, J., Haas, I., & Vehovar, V. (2008). Web surveys
versus other survey modes: a meta-analysis comparing response rates.
International Journal of Market Research, 50(1), 79.
Markman, G. D., & Baron, R. A. (2003). Person–entrepreneurship fit: why some people
are more successful as entrepreneurs than others. Human Resource Management
Review, 13(2), 281-301.
Martin, E. M., & Horn, T. S. (2013). The role of athletic identity and passion in
predicting burnout in adolescent female athletes. The Sport Psychologist, 27(4),
338-348.
Maslach, C. (1976). Burned-out. Human Behavior, 5(9), 16-22.
Maslach, C. (1998). A multidimensional theory of burnout. In G. L. Cooper (Ed.),
Theories of organizational stress (pp. 68-85). New York: Oxford University
Press.
Maslach, C., & Jackson, S. E. (1981). The measurement of experienced burnout. Journal
of Occupational Behavior, 2(2), 99-113.
Maslach, C., & Jackson, S. E. (1982). Burnout: The cost of caring. Englewood Cliffs, NJ:
PrenticeHall.

199
Maslach, C., Jackson, S. E., & Leiter, M. P. (1996). Maslach burnout inventory: MBI
(3rd ed.). Palo Alto, CA: Consulting Psychologists Press.
Maslach, C., & Leiter, M. P. (1997). The truth about burnout: How organizations cause
personal stress and what to do about it. San Francisco: Jossey-Bass.
Maslach, C., & Leiter, M. P. (2008). Early predictors of job burnout and engagement.
Journal of Applied Psychology, 93(3), 498-512.
Maslach, C., Schaufeli, W. B., & Leiter, M. P. (2001). Job burnout. Annual Review of
Psychology, 52(1), 397-422.
McFarlin, D. B., & Sweeney, P. D. (1992). Research notes. Distributive and procedural
justice as predictors of satisfaction with personal and organizational outcomes.
Academy of Management Journal, 35(3), 626-637.
McMullen, J. S., & Shepherd, D. A. (2002). Regulatory focus and entrepreneurial
intention: Action bias in the recognition and evaluation of opportunities. In W. D.
Bygrave (Ed.), Frontiers of entrepreneurship research (Vol. 22, pp. 61-72).
Babson Park: Babson College.
Mitteness, C. R., Baucus, M. S., & Sudek, R. (2012). Horse vs. Jockey? How stage of
funding process and industry experience affect the evaluations of angel investors.
Venture Capital, 14(4), 241-267.
Mitteness, C. R., Sudek, R., & Cardon, M. S. (2012). Angel investor characteristics that
determine whether perceived passion leads to higher evaluations of funding
potential. Journal of Business Venturing, 27(5), 592-606.
Molden, D. C., Lee, A. Y., & Higgins, E. T. (2008). Motivations for promotion and
prevention. In J. Y. Shah & W. L. Gardner (Eds.), Handbook of motivation
science (pp. 169-187). New York, NY: Guilford Press.
Mueller, B. A., Wolfe, M. T., & Syed, I. (2017). Passion and grit: An exploration of the
pathways leading to venture success. Journal of Business Venturing, 32(3), 260-
279.
Murnieks, C. Y., Cardon, M. S., Sudek, R., White, T. D., & Brooks, W. T. (2016). Drawn
to the fire: The role of passion, tenacity and inspirational leadership in angel
investing. Journal of Business Venturing, 31(4), 468-484.
Murnieks, C. Y., Mosakowski, E., & Cardon, M. S. (2014). Pathways of passion identity
centrality, passion, and behavior among entrepreneurs. Journal of Management,
40(6), 1583-1606.
Netemeyer, R. G., Boles, J. S., & McMurrian, R. (1996). Development and validation of
work–family conflict and family–work conflict scales. Journal of Applied
Psychology, 81(4), 400-410.

200
Neubert, M. J., Kacmar, K. M., Carlson, D. S., Chonko, L. B., & Roberts, J. A. (2008).
Regulatory focus as a mediator of the influence of initiating structure and servant
leadership on employee behavior. Journal of Applied Psychology, 93(6), 1220-
1233.
Oreg, S. (2006). Personality, context, and resistance to organizational change. European
Journal of Work and Organizational Psychology, 15(1), 73-101.
Ostroff, C., Kinicki, A. J., & Clark, M. (2002). Substantive and operational issues of
response bias across levels of analysis: An example of climate–satisfaction
relationships. Journal of Applied Psychology, 87(2), 355-368.
Peeters, M. C. W., Montgomery, A. J., Bakker, A. B., & Schaufeli, W. B. (2005).
Balancing work and home: How job and home demands are related to burnout.
International Journal of Stress Management, 12(1), 43-61.
Perry, S. J., Penney, L. M., & Witt, L. (2008). Coping with the constraints of self-
employment: A person-situation model of entrepreneurial burnout. Paper
presented at the Academy of management proceedings, Anaheim,CA.
Philippe, F. L., Vallerand, R. J., Houlfort, N., Lavigne, G. L., & Donahue, E. G. (2010).
Passion for an activity and quality of interpersonal relationships: The mediating
role of emotions. Journal of Personality and Social Psychology, 98(6), 917-932.
Pines, A. (1993). Burnout: An existential perspective. In W. Schaufeli, C. Maslach, & T.
Marek (Eds.), Professional burnout: Recent developments in theory and research
(pp. 33-52). New York, NY: Taylor & Francis.
Pines, A., & Aronson, E. (1988). Career burnout: Causes and cures. New York, NY:
Free Press.
Podsakoff, P. M., MacKenzie, S. B., Lee, J. Y., & Podsakoff, N. P. (2003). Common
method biases in behavioral research: a critical review of the literature and
recommended remedies. Journal of Applied Psychology, 88(5), 879-903.
Podsakoff, P. M., MacKenzie, S. B., & Podsakoff, N. P. (2012). Sources of method bias
in social science research and recommendations on how to control it. Annual
Review of Psychology, 63, 539-569.
Podsakoff, P. M., & Organ, D. W. (1986). Self-reports in organizational research:
Problems and prospects. Journal of Management, 12(4), 531-544.
Poulin, J. E., & Walter, C. A. (1993). Burnout in gerontological social work. Social
Work, 38(3), 305-310.
Purvanova, R. K., & Muros, J. P. (2010). Gender differences in burnout: A meta-analysis.
Journal of Vocational Behavior, 77(2), 168-185.

201
Reynolds, P., & Miller, B. (1992). New firm gestation: Conception, birth, and
implications for research. Journal of Business Venturing, 7(5), 405-417.
Richardson, H. A., Simmering, M. J., & Sturman, M. C. (2009). A tale of three
perspectives. Organizational Research Methods, 12(4), 762-800.
Richter, P., & Hacker, W. (2014). Workload and strain: Stress, fatigue, and burnout in
working life (5th ed.). Heidelberg: Asagner.
Robinson, P. B., & Sexton, E. A. (1994). The effect of education and experience on self-
employment success. Journal of Business Venturing, 9(2), 141-156.
Sax, L. J., Gilmartin, S. K., & Bryant, A. N. (2003). Assessing response rates and
nonresponse bias in web and paper surveys. Research in Higher Education, 44(4),
409-432.
Schaufeli, W. B., & Bakker, A. B. (2004). Job demands, job resources, and their
relationship with burnout and engagement: a multi-sample study. Journal of
Organizational Behavior, 25(3), 293-315.
Schaufeli, W. B., & Buunk, B. P. (2003). Burnout: An overview of 25 years of research
and theorizing. In M. J. Schabracq, J. A. M. Winnubst, & C. L. Cooper (Eds.),
The handbook of work and health psychology (Vol. 2, pp. 383-428). Hoboken,
NJ: John Wiley and Sons.
Schaufeli, W. B., & Enzmann, D. (1998). The burnout companion to study and research:
a critical analysis. London: Taylor & Francis.
Schaufeli, W. B., & Maslach, C. (1993). Historical and conceptual development of
burnout. In W. Schaufeli, C. Maslach, & T. Marek (Eds.), Professional burnout:
Recent developments in theory and research (pp. 1-16). New York, NY: Taylor &
Francis.
Schein, E. H. (1983). The role of the founder in creating organizational culture.
Organizational Dynamics, 12(1), 13-28.
Schneider, B. (1975). Organizational climate: Individual preferences and organizational
realities revisited. Journal of Applied Psychology, 60(4), 459-465.
Schneider, B. (1987). The people make the place. Personnel Psychology, 40(3), 437-453.
Schneider, B., Goldstiein, H. W., & Smith, D. B. (1995). The ASA framework: An
update. Personnel Psychology, 48(4), 747-773.
Scholer, A. A., & Higgins, E. T. (2008). Distinguishing levels of approach and
avoidance: An analysis using regulatory focus theory. In A. J. Elliot (Ed.),
Handbook of approach and avoidance motivation (pp. 489-503). New York, NY:
Psychology Press.
202
Scott, W., & Scott, R. (1965). Values and organizations; a study of fraternities and
sororities. Chicago: Rand McNally.
Semmer, N., & Schabracq, M. J. (2003). Individual differences, work stress and health. In
M. J. Schabracq, J. A. M. Winnubst, & C. L. Cooper (Eds.), Handbook of work
and health psychology (Vol. 2, pp. 83-120). Hoboken: John Wiley and Sons.
Shane, S., & Venkataraman, S. (2000). The promise of entrepreneurship as a field of
research. The Academy of Management Review, 25(1), 217-226.
Sheldon, K. M. (2002). The self-concordance model of healthy goal-striving: When
personal goals correctly represent the person. In E. L. Deci & R. M. Ryan (Eds.),
Handbook of self-determination research (pp. 65-86). Rochester, NY: University
of Rochester Press.
Shepherd, C. D., Marchisio, G., Morrish, S. C., Deacon, J. H., & Miles, M. P. (2010).
Entrepreneurial burnout: Exploring antecedents, dimensions and outcomes.
Journal of Research in Marketing and Entrepreneurship, 12(1), 71-79.
Shi, R., Zhang, S., Xu, H., Liu, X., & Miao, D. (2015). Regulatory focus and burnout in
nurses: The mediating effect of perception of transformational leadership.
International Journal of Nursing Practice, 21(6), 858-867.
Shih, T. H., & Fan, X. (2008). Comparing response rates from web and mail surveys: A
meta-analysis. Field Methods, 20(3), 249-271.
Shirom, A. (2003). The effects of work stress on health. In M. J. Schabracq, J. A. M.
Winnubst, & C. L. Cooper (Eds.), The handbook of work and health psychology
(pp. 63-82): John Wiley & Sons.
Shrader, R. C., Oviatt, B. M., & McDougall, P. P. (2000). How new ventures exploit
trade-offs among international risk factors: Lessons for the accelerated
internationization of the 21st century. Academy of Management Journal, 43(6),
1227-1247.
Siegrist, J. (1996). Adverse health effects of high-effort/low-reward conditions. Journal
of Occupational Health Psychology, 1(1), 27-41.
Siegrist, J. (2002). Effort-reward imbalance at work and health Historical and current
perspectives on stress and health (pp. 261-291): Emerald Group Publishing
Limited.
Singer, E., & Cong, Y. (2013). The use and effects of incentives in surveys. In D. S.
Massey & R. Tourangeau (Eds.), The nonresponse challenge to surveys and
statistics (1st ed., pp. 112-141). Los Angeles, CA: Sage.
Smilor, R. W. (1997). Entrepreneurship: reflections on a subversive activity. Journal of
Business Venturing, 12(5), 341-347.
203
Spielberger, C. D., Vagg, P. R., & Wasala, C. F. (2001). Health psychology and work
stress: a more positive approach. In L. E. Tetrick & J. C. Quick (Eds.), Handbook
of occupational psychology (pp. 185-200). Washington: American Psychological
Association.
Steenkamp, J.-B., De Jong, M., & Baumgartner, H. (2010). Socially desirable response
tendencies in survey research. Journal of Marketing Research, 47(2), 199-214.
Stenholm, P., & Renko, M. (2016). Passionate bricoleurs and new venture survival.
Journal of Business Venturing, 31(5), 595-611.
Stenseng, F., Rise, J., & Kraft, P. (2011). The dark side of leisure: Obsessive passion and
its covariates and outcomes. Leisure Studies, 30(1), 49-62.
Stevenson, H. H., & Gumpert, D. E. (1985). The heart of entrepreneurship. Harvard
Business Review, 63(2), 85-94.
Stryker, S., & Burke, P. J. (2000). The past, present, and future of an identity theory.
Social Psychology Quarterly, 63(4), 284-297.
Taris, T. W., Kompier, M. A. J., Geurts, S. A. E., Houtman, I. L. D., & Heuvel, F. F. M.
(2010). Professional efficacy, exhaustion, and work characteristics among police
officers: A longitudinal test of the learning‐related predictions of the demand—
control model. Journal of Occupational and Organizational Psychology, 83(2),
455-474.
Taylor, G. S., & Banks, M. C. (1992). Entrepreneurs, small business executives, and
large business executives: a comparison of the perceived importance of current
business issues. Journal of Small Business Management, 30(4), 24-40.
Tetrick, L. E., Slack, K. J., Da Silva, N., & Sinclair, R. R. (2000). A comparison of the
stress–strain process for business owners and nonowners: Differences in job
demands, emotional exhaustion, satisfaction, and social support. Journal of
Occupational Health Psychology, 5(4), 464-476.
Thoits, P. A. (1987). Gender and marital status differences in control and distress:
common stress versus unique stress explanations. Journal of Health and Social
Behavior, 28(1), 7-22.
Thorgren, S., & Wincent, J. (2015). Passion and habitual entrepreneurship. International
Small Business Journal, 33(2), 216-227.
Trépanier, S.-G., Fernet, C., Austin, S., Forest, J., & Vallerand, R. J. (2014). Linking job
demands and resources to burnout and work engagement: Does passion underlie
these differential relationships? Motivation and Emotion, 38(3), 353-366.
204
Tumasjan, A., & Braun, R. (2012). In the eye of the beholder: How regulatory focus and
self-efficacy interact in influencing opportunity recognition. Journal of Business
Venturing, 27(6), 622-636.
Tyler, T. R. (2006). Why people obey the law. New Jersey: Princeton University Press.
Vallerand, R. J. (2015). The psychology of passion: A dualistic model. New York, NY:
Oxford University Press.
Vallerand, R. J., Blanchard, C., Mageau, G. A., Koestner, R., Ratelle, C., Léonard, M., . .
. Marsolais, J. (2003). Les passions de l'ame: on obsessive and harmonious
passion. Journal of Personality and Social Psychology, 85(4), 756-767.
Vallerand, R. J., & Houlfort, N. (2003). Passion at work: Toward a new
conceptualization. In S. Gilliland, D. Steiner, & D. Skarlicki (Eds.), Emerging
perspectives on values in organizations (pp. 175-204). Greenwich, CT:
Information Age.
Vallerand, R. J., Paquet, Y., Philippe, F. L., & Charest, J. (2010). On the role of passion
for work in burnout: a process model. Journal of personality, 78(1), 289-312.
van Horn, J. E., Schaufeli, W. B., Greenglass, E. R., & Burke, R. J. (1997). A canadian-
dutch comparison of teachers' burnout. Psychological Reports, 81(2), 371-382.
Venkataraman, S. (1997). The distinctive domain of entrepreneurship research. In J. A.
Katz (Ed.), Advances in entrepreneurship, firm emergence and growth (Vol. 3,
pp. 119-138): JAI Press.
Wallace, J. C., & Chen, G. (2006). A multilevel integration of personality, climate, self‐
regulation, and performance. Personnel Psychology, 59(3), 529-557.
Wallace, J. C., Johnson, P. D., & Frazier, M. L. (2009). An examination of the factorial,
construct, and predictive validity and utility of the regulatory focus at work scale.
Journal of Organizational Behavior, 30(6), 805-831.
Wei, X., Cang, S., & Hisrich, R. D. (2015). Entrepreneurial stressors as predictors of
entrepreneurial burnout. Psychological Reports, 116(1), 74-88.
Weijters, B., Geuens, M., & Schillewaert, N. (2010). The individual consistency of
acquiescence and extreme response style in self-report questionnaires. Applied
Psychological Measurement, 34(2), 105-121.
Wiens, J., & Jackson, C. (2015). The Importance of Young Firms for Economic Growth.
The Kauffman Foundation and The Public Forum Institute. Retrieved
from https://www.kauffman.org/what-we-do/resources/entrepreneurship-
policy-digest/the-importance-of-young-firms-for-economic-growth
205
Williams, L. J., Hartman, N., & Cavazotte, F. (2010). Method variance and marker
variables: A review and comprehensive CFA marker technique. Organizational
Research Methods, 13(3), 477-514.
Wincent, J., & Örtqvist, D. (2009). Role stress and entrepreneurship research. The
International Entrepreneurship and Management Journal, 5(1), 1-22.
Wincent, J., Örtqvist, D., & Drnovsek, M. (2008). The entrepreneur's role stressors and
proclivity for a venture withdrawal. Scandinavian Journal of Management, 24(3),
232-246.
Worley, J. A., Vassar, M., Wheeler, D. L., & Barnes, L. L. (2008). Factor structure of
scores from the maslach burnout inventory a review and meta-analysis of 45
exploratory and confirmatory factor-analytic studies. Educational and
Psychological Measurement, 68(5), 797-823.
Wrzesniewski, A., & Dutton, J. E. (2001). Crafting a job: Revisioning employees as
active crafters of their work. Academy of Management Review, 26(2), 179-201.
Zivnuska, S., Kacmar, K. M., & Valle, M. (2017). The mechanisms of regulatory focus:
Mindfulness, leader-member exchange, and motivational outcomes. Career
Development International, 22(1), 37-49.

206
APPENDIX
SURVEY INSTRUMENTS

207
Survey Instrument – Maslach Burnout Inventory – General Survey
Maslach Burnout Inventory-General Survey (MBI-GS) Maslach et al. (1996)
This scale is copyright © 1996, 2016 Wilmar B. Schaufeli, Michael P. Leiter, Christina
Maslach & Susan E. Jackson. All rights reserved in all media. Published by Mind
Garden, Inc., www.mindgarden.com
Copyright terms granted to this author allow for the inclusion in this dissertation of a
sample of three items from the full set of 16:
1. I feel emotionally drained from my work.
10. In my opinion, I am good at my job.
15. I doubt the significance of my work.
Items 1, 2, 3, 4, and 6 are exhaustion scale items. Items 5, 7, 10, 11, 12, and 16 are
professional efficacy scale items. Items 8, 9, 13, 14, and 15 are cynicism scale items.
Leading question: How often do:
Rated from 1 (Never), 2 (A few times a year or less), 3 (Once a month or less), 4 (A few
times a month), 5 (Once a week), 6 (A few times a week), and 7 (Every day).

208
Survey Instrument – Trait Promotion Focus and Trait Prevention Focus
Regulatory Focus Questionnaire (RFQ) – Trait Promotion Focus and Trait Prevention
Focus (Grant & Higgins, 2003; Higgins et al., 2001)
Items 1, 3, 7, 9, 10, and 11 are trait promotion scale items. Items 2, 4, 5, 6, and 8 are trait
prevention scale items.
Leading question: This set of questions asks you about specific events in your life. Please
indicate your answer to each question by choosing the appropriate number below it.
1. Compared to most people, are you typically unable to get what you want out of life?
(1=never or seldom, 3=sometimes, to 5=very often)*
2. Growing up, would you ever “cross the line'' by doing things that your parents would
not tolerate? (1=never or seldom, 3=sometimes, to 5=very often)*
3. How often have you accomplished things that got you ``psyched'' to work even
harder? (1=never or seldom to 5=many times)
4. Did you get on your parents' nerves often when you were growing up? (1=never or
seldom, 3=sometimes, to 5=very often)*
5. How often did you obey rules and regulations that were established by your parents?
(1=never or seldom, 3=sometimes, to 5=always)
6. Growing up, did you ever act in ways that your parents thought were objectionable?
(1=never or seldom, 3=sometimes, to 5=very often)*
7. Do you often do well at different things that you try? (1=never or seldom,
3=sometimes, to 5=very often)
8. Not being careful enough has gotten me into trouble at times. (1=never or seldom,
3=sometimes, to 5=very often)*
9. When it comes to achieving things that are important to me, I find that I don't perform
as well as I ideally would like to do. (1=never true to 5=very often true)*
10. I feel like I have made progress toward being successful in my life. (1=certainly false
to 5=certainly true)
11. I have found very few hobbies or activities in my life that capture my interest or
motivate me to put effort into them. (1=certainly false to 5=certainly true)*
*-Reverse coded

209
Survey Instrument – Work Prevention Focus
Work Regulatory Focus (WRF) Scale - Prevention (Neubert et al., 2008)
Leading question: rate how often you focus on these thoughts and activities when you are
working.
Rated from 1 (strongly disagree) to 5 (strongly agree).
* - Items revised for the entrepreneurial setting, replacement follows in next line.
1. I concentrate on completing my work tasks correctly to increase my job security.
2. At work I focus my attention on completing my assigned responsibilities.
3. Fulfilling my work duties is very important to me.
4. At work, I strive to live up to the responsibilities and duties given to me by others.
5. At work, I am often focused on accomplishing tasks that will support my need for
security.
6. I do everything I can to avoid loss at work.
7. Job security is an important factor for me in any job search.*
7. Job security is an important factor for me.
8. I focus my attention on avoiding failure at work.
9. I am very careful to avoid exposing myself to potential losses at work.

210
Survey Instrument – Work Promotion Focus
Work Regulatory Focus (WRF) Scale - Promotion (Neubert et al., 2008)
Leading question: rate how often you focus on these thoughts and activities when you are
working.
Rated from 1 (strongly disagree) to 5 (strongly agree).
* - Items revised for the entrepreneurial setting, replacement follows in next line.
10. I take chances at work to maximize my goals for advancement.
11. I tend to take risks at work in order to achieve success.
12. If I had an opportunity to participate on a high-risk, high-reward project I would
definitely take it.
13. If my job did not allow for advancement, I would likely find a new one.
14. A chance to grow is an important factor for me when looking for a job. *
14. A chance to grow is an important factor for me when choosing how to perform my
job.
15. I focus on accomplishing job tasks that will further my advancement. *
15. I focus on accomplishing job tasks that will further my goals for advancement.
16. I spend a great deal of time envisioning how to fulfill my aspirations.
17. My work priorities are impacted by a clear picture of what I aspire to be.
18. At work, I am motivated by my hopes and aspirations.
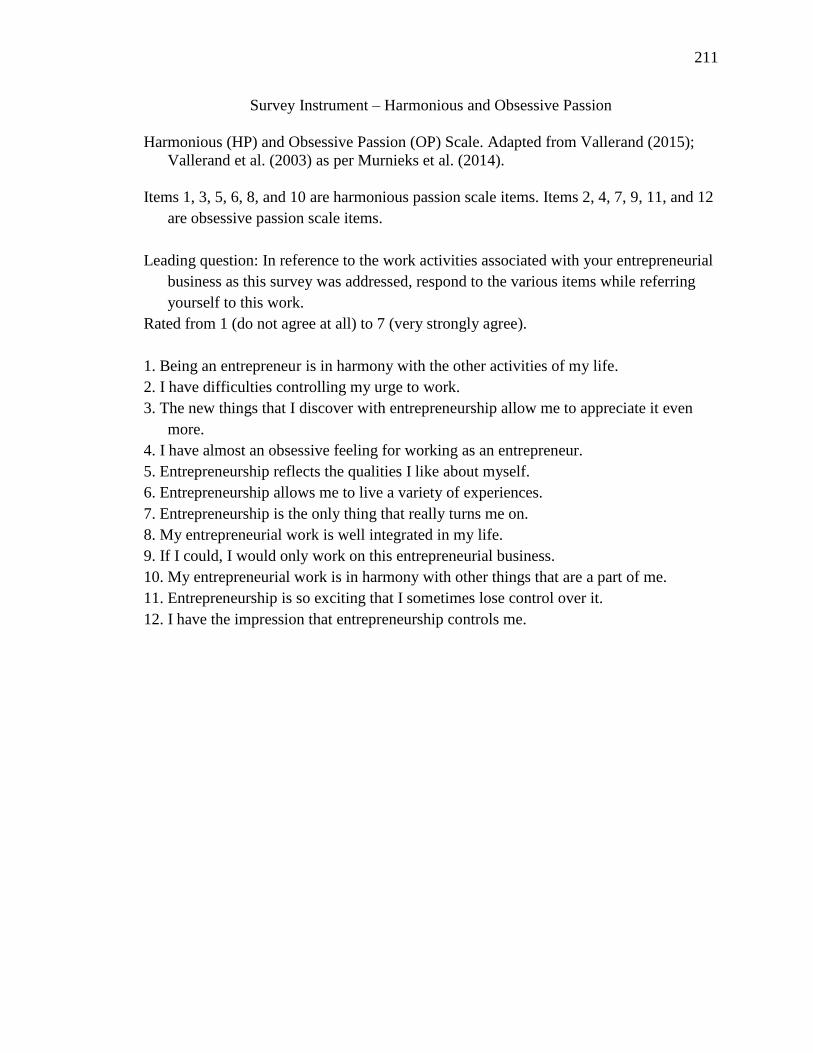
211
Survey Instrument – Harmonious and Obsessive Passion
Harmonious (HP) and Obsessive Passion (OP) Scale. Adapted from Vallerand (2015);
Vallerand et al. (2003) as per Murnieks et al. (2014).
Items 1, 3, 5, 6, 8, and 10 are harmonious passion scale items. Items 2, 4, 7, 9, 11, and 12
are obsessive passion scale items.
Leading question: In reference to the work activities associated with your entrepreneurial
business as this survey was addressed, respond to the various items while referring
yourself to this work.
Rated from 1 (do not agree at all) to 7 (very strongly agree).
1. Being an entrepreneur is in harmony with the other activities of my life.
2. I have difficulties controlling my urge to work.
3. The new things that I discover with entrepreneurship allow me to appreciate it even
more.
4. I have almost an obsessive feeling for working as an entrepreneur.
5. Entrepreneurship reflects the qualities I like about myself.
6. Entrepreneurship allows me to live a variety of experiences.
7. Entrepreneurship is the only thing that really turns me on.
8. My entrepreneurial work is well integrated in my life.
9. If I could, I would only work on this entrepreneurial business.
10. My entrepreneurial work is in harmony with other things that are a part of me.
11. Entrepreneurship is so exciting that I sometimes lose control over it.
12. I have the impression that entrepreneurship controls me.

212
Survey Instrument – Work-Family Conflict Scale
Work-Family Conflict (WFC) Scale (Netemeyer et al., 1996)
Rated from 1 (strongly disagree) to 7 (strongly agree).
1. The demands of my work interfere with my home and family life.
2. The amount of time my job takes up makes it difficult to fulfill family
responsibilities.
3. Things I want to do at home do not get done because of the demands my job puts on
me.
4. My job produces strain that makes it difficult to fulfill family duties.
5. Due to work-related duties, I have to make changes to my plans for family activities.
Survey Instrument – Family-Work Conflict Scale
Family-Work Conflict (FWC) Scale (Netemeyer et al., 1996)
Rated from 1 (strongly disagree) to 7 (strongly agree).
1. The demands of my family or spouse/partner interfere with work-related activities.
2. I have to put off doing things at work because of demands on my time at home.
3. Things I want to do at work don't get done because of the demands of my family or
spouse/partner.
4. My home life interferes with my responsibilities at work such as getting to work on
time, accomplishing daily tasks, and working overtime.
5. Family-related strain interferes with my ability to perform job-related duties.

213
Survey Instrument – Physical Development Scale
Physical Development Scale (Scott & Scott, 1965)
Leading question: Please read over the following statements, and for each one indicate
whether it is something you always admire in other people, or something you always
dislike, or something that depends on the situation whether you admire it or not.
Rated as 1 (Always Admire), 2 (Depends on Situation), or 3 (Always Dislike).
1. Being good in some form of sport.
2. Developing physical strength or agility.
3. Taking good care of one’s physical self, so that one is always healthy.
4. Developing an attractive body that others will admire.
5. Being graceful and well-coordinated in physical movements.