Embed Size (px)
Citation preview
ENTRENCHING INNOVATIONThe 4th UK Alternative Finance Industry Report
December 2017
With the support of:
EMBARGOED UNTIL 00:00 FRI 8 December 2017

EMBARGOED UNTIL 00:00 FRI 8 December 2017
CONTENTS
Executive Summary
Methodology
UK Alternative Finance Market Dynamics
Size & Growth by Model.............................................................................................................
Geography of UK Alternative Finance........................................................................................
Dynamics and Market Trends of the UK Alternative Finance Market.........................................
Key Sectors & Industries............................................................................................................
UK Alternative Business Finance...............................................................................................
Innovation Across UK Alternative Finance Platforms.................................................................
Cross Border Activity..................................................................................................................
Gender Dynamics of UK Online Alternative Finance..................................................................
Alternative Finance Funders
Key Findings for UK Alternative Finance Funders......................................................................
Funders Who Use More Than One Alternative Finance Platform...............................................
Gender.......................................................................................................................................
Gender in Terms of Invested Funds............................................................................................
Age of Funders...........................................................................................................................
Investing in Middle Age & Retirements......................................................................................
Education...................................................................................................................................
The Impact of Contingency Funds..............................................................................................
Due Diligence..............................................................................................................................
Relative Risk of UK Online Alternative Finance Channels.........................................................
Confidence of Fund Recovery in Event of Platform Failure........................................................
Mitigating Risks – Seeking Independent Financial Advice.........................................................
Tax Incentives.............................................................................................................................
Ability to Liquidate Position & Secondary Markets......................................................................
Alternative Finance Models
Peer-to-Peer Business Lending.................................................................................................
Peer-to-Peer Consumer Lending...............................................................................................
Peer-to-Peer Property Lending..................................................................................................
Invoice Trading...........................................................................................................................
Debt-based Securities.................................................................................................................
Equity-based Crowdfunding........................................................................................................
Real Estate Crowdfunding...........................................................................................................
Community Shares.....................................................................................................................
Donation-based Crowdfunding...................................................................................................
Reward-based Crowdfunding.....................................................................................................
End Notes
10
11
12-26
13
14
16
17
18
22
24
25
27-41
27
28
29
30
31
32
33
34
35
37
38
39
40
41
42-66
42
49
53
56
56
59
63
65
65
66
67
EMBARGOED UNTIL 00:00 FRI 8 December 2017

4 The 4th Annual UK Alternative Finance Industry Report
RESEARCH TEAM
KIERAN GARVEYKieran is the Lead on Regulation & Policy at the Cambridge
Centre for Alternative Finance, Cambridge Judge Business
School. His research interests include the application of
alternative finance with respect to financial inclusion, early stage ventures, regulatory & policy evolution and technology.
SAMANTHA RIDLERSam is a Senior Industry and Policy Researcher at the
Cambridge Centre for Alternative Finance. Previously, Sam was
Manager of the P2P Finance Association (P2PFA), co-ordinating
the industry’s response to key policy issues and liaising with key stakeholders such as HMT, HMRC, FCA and BoE.
NIKOS YEROLEMOUNikos is a Research Assistant, Cambridge Centre for Alternative
Finance focusing on data and analytics before starting his
career in commercial real estate at Lloyds Banking Group. He
has since moved to Fortwell Capital as a Leveraged Debt &
Structured Finance Analyst.
JOHN BURTONDr. John Burton is a Skills and Capability lead for the
Civil Service and has been using his years of astronomy
data analysis expertise to introduce new techniques and
methodologies across government departments. He has worked
for a number of world-renowned research institutions, including
most recently the CCAF, and was honoured for his work by
NASA in October 2017.
BRYAN ZHANG Bryan is a Co-Founder and Executive Director of the Cambridge
Centre for Alternative Finance and a Research Fellow in
Finance at the Cambridge Judge Business School. Bryan
has led and co-authored many of the most influential industry reports on the alternative finance industry since 2013.
TANIA ZIEGLER Tania is the Senior Research Manager at the Cambridge Centre
for Alternative Finance, Cambridge Judge Business School. Her
research interests include small business economics and SME
utilization of alternative funding models.
EMBARGOED UNTIL 00:00 FRI 8 December 2017

5
ACKNOWLEDGEMENTS
We would like to thank CME Group Foundation for their financial support of this research programme and report.
This report would not have been possible without the participation of 77 UK-based platforms, and the support of the United
Kingdom Crowdfunding Association (UKCFA) and the Peer to the Peer-to-Peer Finance Association (P2PFA). In particular, we
would like to thank Karen Kerrigan, Julia Groves and Bruce Davis from the UKCFA and Christine Farnish and Robert Pettigrew
from P2PFA for all their support.
We are grateful to the Financial Conduct Authority for the opportunity to provide research inputs into the ongoing post-
implementation review of crowdfunding regulation and for their feedback regarding the design and conduct of field research.
We are extremely grateful to the wider CCAF research team, including Louise Westerlind and Dr. Jonathan Anderson for their role
in data collection, research, analysis and feedback throughout the research process. The research team at the CCAF would also
like to thank Robert Wardrop, Raghavendra Rau and Mia Gray for their counsel, guidance and feedback throughout the study. We
would also like to thank Mint Garvey for her work on designing the publication, and Charles Goldsmith, Kate Belger, Ruth Newman
and Philippa Coney for their continued support in producing and publishing this report.
EMBARGOED UNTIL 00:00 FRI 8 December 2017
6 The 4th Annual UK Alternative Finance Industry Report
FOREWORDS
Bryan ZhangCo-Founder and Executive DirectorCambridge Centre for Alternative Finance
This report is titled ‘Entrenching Innovation’, which is a reflection upon both the historical development and the current state of the UK online alternative finance industry.
Online alternative finance has become an ever more established component of the UK financial landscape. Since 2011, more than £10 billion worth of funding has now been intermediated through various online alternative finance platforms in the UK. Online funding channels, such as crowdfunding and peer-to-peer lending, have not
only entered common discourse, but have also become embedded in the everyday
infrastructure of finance; in many instances, they are now one of the default fundraising and investments channels for businesses, retail investors and institutions. With equity-
based crowdfunding now accounting for 17% of all seed and venture stage equity
investment in the UK and peer-to-peer business lending providing an equivalent of 15%
of all new loans lent to small businesses by UK banks, alternative finance has entered the mainstream and is likely here to stay.
Progress in financial innovation is, nevertheless, not linear within such a dynamic landscape, and is made more difficult as competitors, technology and markets evolve. In 2016, a number of alternative finance platforms either suspended operations or exited the market completely. As market consolidation accelerates there is greater pressure
on alternative finance platforms to distinguish themselves through better services and more innovative products, whilst simultaneously responding to emerging regulatory and
supervisory demands. Consequently, the industry has witnessed a considerable level
of product and business-model innovation over the last year. Some of these innovative
changes have driven the growth of the alternative finance market to £4.58 billion in 2016 whereas others, such as the controversial ‘wholesale lending’, have not been conducive to the development of industry.
Funder research shows that the compositions of the retail investor and lender market
have been relatively stable over the last two years since the implementation of the
FCA regulations. The alternative finance retail market has exhibited stability across demographic metrics, including age, gender, education, income and geographical
distribution, as well as within motivational and behavioural patterns. One of the
prevailing trends over the last year has been the institutionalisation of the funding, with
many alternative finance models reporting over 25-30% of funding coming from mutual funds, pension funds, asset managers, family offices, broker-dealers and banks among others. In the longer-term, the bifurcation of the supply side of alternative finance is likely to continue with institutional funders co-investing alongside retail investors.
From the CCAF’s parallel and comparative studies conducted in the Americas, the Asia-Pacific region, Europe, Middle East and Africa, similar patterns of development, challenges to keep innovating and opportunities to reshape the existing financial landscape have been identified. Good financial innovation not only improves the efficiency of capital allocation and reduces information asymmetry, but also can achieve a greater degree of financial inclusion, increase welfare and benefit communities. In that sense, perhaps this report marks just the ‘end of beginning’ for the UK alternative finance industry.
EMBARGOED UNTIL 00:00 FRI 8 December 2017
7
Kim TaylorPresident Clearing and Post-Trade ServicesCME Group
The world of banking and financial services continues to change swiftly and dramatically, with alternatives to traditional products and services being introduced
daily, significantly impacting the way people and institutions use money.
Previously, financial technology could be regarded as applications of traditional financial services upon existing technologies, but today, we are witnessing truly novel inventions with participation from previously untapped markets.
Crowdfunding and peer-to-peer lending are just a few examples where new
participants are accessing technological innovations to create new marketplaces.
The size and growth of the online alternative finance market, new entrants and partnerships, and the impacts on regulation and tax incentives, have the potential
to transform the global economy. But this transformation can be best achieved
only with thoughtful analysis and a thorough understanding of the alternative
finance landscape.
CME Group, as the world’s leading and most diverse derivatives marketplace, is proud to support the publication of this series of reports through its Foundation.
We believe that it is with informed view of the possible future, we can work to
achieve new opportunities and economic prosperity through financial innovation.
EMBARGOED UNTIL 00:00 FRI 8 December 2017
8 The 4th Annual UK Alternative Finance Industry Report
We thank the alternative finance platforms defining this industry for their contribution and input to this research:
EMBARGOED UNTIL 00:00 FRI 8 December 2017
9EMBARGOED UNTIL 00:00 FRI 8 December 2017
10 The 4th Annual UK Alternative Finance Industry Report
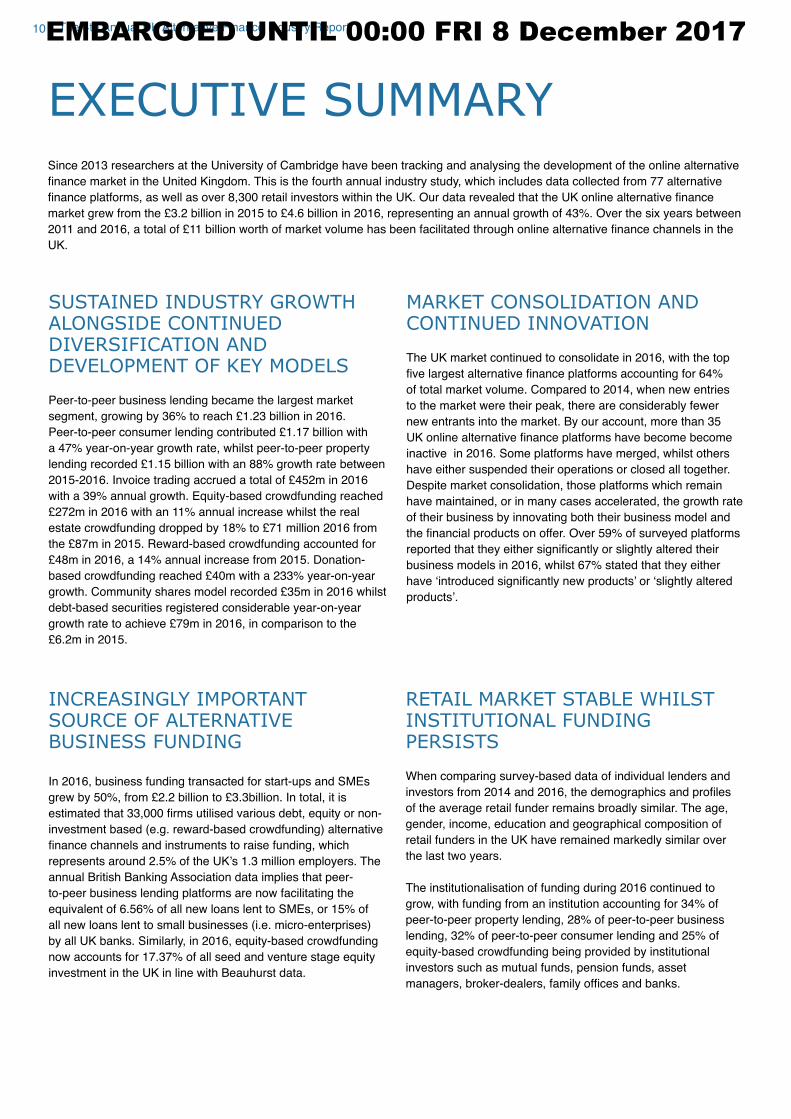
Since 2013 researchers at the University of Cambridge have been tracking and analysing the development of the online alternative
finance market in the United Kingdom. This is the fourth annual industry study, which includes data collected from 77 alternative finance platforms, as well as over 8,300 retail investors within the UK. Our data revealed that the UK online alternative finance market grew from the £3.2 billion in 2015 to £4.6 billion in 2016, representing an annual growth of 43%. Over the six years between 2011 and 2016, a total of £11 billion worth of market volume has been facilitated through online alternative finance channels in the UK.
SUSTAINED INDUSTRY GROWTH ALONGSIDE CONTINUED DIVERSIFICATION AND DEVELOPMENT OF KEY MODELS
Peer-to-peer business lending became the largest market
segment, growing by 36% to reach £1.23 billion in 2016. Peer-to-peer consumer lending contributed £1.17 billion with a 47% year-on-year growth rate, whilst peer-to-peer property
lending recorded £1.15 billion with an 88% growth rate between 2015-2016. Invoice trading accrued a total of £452m in 2016 with a 39% annual growth. Equity-based crowdfunding reached
£272m in 2016 with an 11% annual increase whilst the real estate crowdfunding dropped by 18% to £71 million 2016 from the £87m in 2015. Reward-based crowdfunding accounted for £48m in 2016, a 14% annual increase from 2015. Donation-based crowdfunding reached £40m with a 233% year-on-year growth. Community shares model recorded £35m in 2016 whilst debt-based securities registered considerable year-on-year
growth rate to achieve £79m in 2016, in comparison to the £6.2m in 2015.
MARKET CONSOLIDATION AND CONTINUED INNOVATION
The UK market continued to consolidate in 2016, with the top
five largest alternative finance platforms accounting for 64% of total market volume. Compared to 2014, when new entries
to the market were their peak, there are considerably fewer
new entrants into the market. By our account, more than 35
UK online alternative finance platforms have become become inactive in 2016. Some platforms have merged, whilst others
have either suspended their operations or closed all together.
Despite market consolidation, those platforms which remain
have maintained, or in many cases accelerated, the growth rate
of their business by innovating both their business model and
the financial products on offer. Over 59% of surveyed platforms reported that they either significantly or slightly altered their business models in 2016, whilst 67% stated that they either
have ‘introduced significantly new products’ or ‘slightly altered products’.
EXECUTIVE SUMMARY
INCREASINGLY IMPORTANT SOURCE OF ALTERNATIVE BUSINESS FUNDING
In 2016, business funding transacted for start-ups and SMEs
grew by 50%, from £2.2 billion to £3.3billion. In total, it is estimated that 33,000 firms utilised various debt, equity or non-investment based (e.g. reward-based crowdfunding) alternative
finance channels and instruments to raise funding, which represents around 2.5% of the UK’s 1.3 million employers. The annual British Banking Association data implies that peer-
to-peer business lending platforms are now facilitating the
equivalent of 6.56% of all new loans lent to SMEs, or 15% of
all new loans lent to small businesses (i.e. micro-enterprises)
by all UK banks. Similarly, in 2016, equity-based crowdfunding
now accounts for 17.37% of all seed and venture stage equity
investment in the UK in line with Beauhurst data.
RETAIL MARKET STABLE WHILST INSTITUTIONAL FUNDING PERSISTS
When comparing survey-based data of individual lenders and
investors from 2014 and 2016, the demographics and profiles of the average retail funder remains broadly similar. The age,
gender, income, education and geographical composition of
retail funders in the UK have remained markedly similar over
the last two years.
The institutionalisation of funding during 2016 continued to
grow, with funding from an institution accounting for 34% of
peer-to-peer property lending, 28% of peer-to-peer business
lending, 32% of peer-to-peer consumer lending and 25% of
equity-based crowdfunding being provided by institutional
investors such as mutual funds, pension funds, asset
managers, broker-dealers, family offices and banks.
EMBARGOED UNTIL 00:00 FRI 8 December 2017
11
Since 2013, the University of Cambridge and its partners have
endeavoured to document and analyse the development of
the alternative finance industry in the United Kingdom. As with previous studies, this report aims to track the latest market data
and emerging trends. Additionally, this report extends beyond
the scope of the past studies and utilises a broader range
of quantitative and qualitative data gathered by the CCAF.
Selected evidence from this work has also been provided to the
FCA as inputs into their ongoing review of the regulatory regime
for crowdfunding.
This research was conducted over the course of six months and
included three phases of research. Throughout this report, we
will refer to different components of this research. Akin to our
previous studies, the Centre conducted an ‘Industry Tracking Survey’, which was disseminated to crowdfunding, peer-to-peer lending and other online alternative finance platforms. The survey collected aggregate-level industrial data used to
measure the size and growth of the industry, as well as other
key metrics. Though the data collected in the Industry Tracking
Survey is based upon self-reported data, the survey responses
were thoroughly sanitized and verified before being aggregated for analysis. During analysis, all average data points (e.g.
platform acceptance rates, funding success rates or most
funded sectors) where weighted (by transaction volume) to
calculate more accurate estimates based on the available data.
This benchmark was conducted with the support of the Peer-to-
Peer Finance Association (P2PFA) and the UK Crowdfunding
Association (UKCFA) and included responses from 77
platforms, capturing an estimated 95% of the visible UK online
alternative finance market. Two additional platform datasets were generated using web scraping methods and added to the
total survey database, which increased the overall research
sample size to 79 platforms.
In addition to the Industry Tracking Survey, this report includes
results from a ‘Funder Survey’, modeled after research conducted in 2014 and enhanced to provide further insights into
investor perceptions and motivations. The survey was designed
for retail investors who actively utilised Investment-based
and/or Loan-based Crowdfunding as part of their investment
portfolios. The CCAF provided selected evidence from investor
and fundraiser surveys to the FCA, along with aggregate reports
based on transaction level data, as inputs into their ongoing
review.
METHODOLOGYThe models to be analysed were:
Loan-based crowdfunding:
● Peer-to-Peer Consumer (P2PC) Lending● Peer-to-Peer Business (P2PB) Lending● Peer-to-Peer Property (P2P Property) Lending
Investment-based crowdfunding:
● Debt-Based Securities (DBS)● Equity-Based Crowdfunding (Equity)● Real Estate Crowdfunding (RE CF)
The final 2016 Funder Survey dataset comprised of 8370 responses across the six models, with peer-to-peer consumer
lending having the highest number of respondents at 3837.
These surveys were collected in complete anonymity and
disseminated through platform-based outreach, with 22
platforms assisting in this process. A follow-up qualitative
interview was conducted with 55 survey participants who
explicitly gave the Centre consent to be contacted, and
provided identifying information for that purpose. The survey
responses were analysed in aggregate, and analysed by model
type rather than specific platform.
As with the 2014 Funder survey, the 2016 activity focused on
key demographic information, as well as qualitative data on
funder behaviour and perspectives. The methodology and
some of the data collected in the 2014 version of the survey
differs from the 2016 activity. Therefore, it was not always
possible to make direct comparisons between the two datasets.
Only where appropriate, comparisons have been made.
The third phase of research included the collection and analysis
of granular-level transaction data from 15 Investment-based
and Loan-based Crowdfunding platforms. This phase of the
research made it possible to review key market fundamentals and
industry trends through a more sophisticated lens, for instance
the average size of loan/issuance, or the number of investors per
loan/issuance. To ensure the research methodology and process
was consistently and independently applied, the Centre collected
transaction (loan or deal level data) provided by platforms. The
collected data was analysed on an aggregated basis and hosted
securely on the Centre’s alternative finance data depository for policy and academic use only. The data depository captured four
separate but linked tables in database format. The first two data-sets include demographic information on the Funders (Investors
or Lenders) and Fundraisers (Borrowers or Issuers), the third and
fourth dataset included specific details on the Loan or Issuance as effected by the Funder and Fundraiser (e.g. amount sought
vs amount contributed by unique funder). The data from each
platform was collected securely and cleaned further to remove
confidential or private information/fields before being added to the data-depository. All subsequent analysis and queries were run of
off the main database, with all information fully aggregated.
EMBARGOED UNTIL 00:00 FRI 8 December 2017
12 The 4th Annual UK Alternative Finance Industry Report
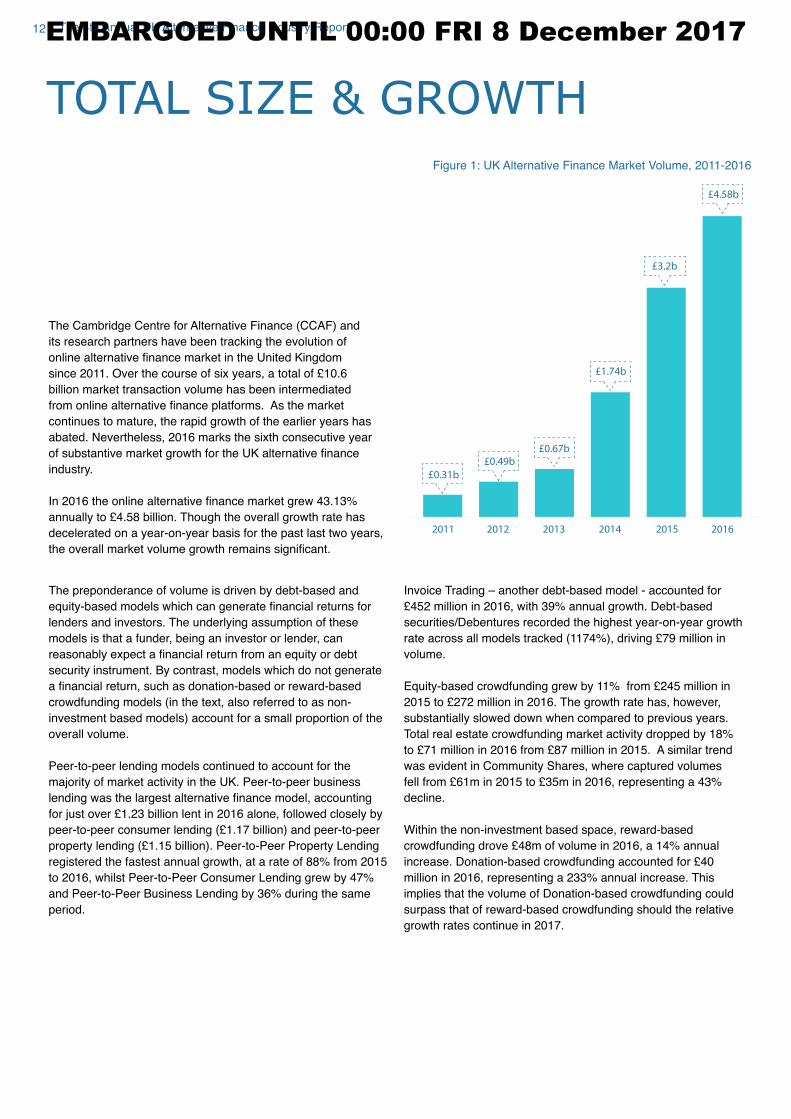
TOTAL SIZE & GROWTH
The Cambridge Centre for Alternative Finance (CCAF) and
its research partners have been tracking the evolution of
online alternative finance market in the United Kingdom since 2011. Over the course of six years, a total of £10.6 billion market transaction volume has been intermediated
from online alternative finance platforms. As the market continues to mature, the rapid growth of the earlier years has
abated. Nevertheless, 2016 marks the sixth consecutive year
of substantive market growth for the UK alternative finance industry.
In 2016 the online alternative finance market grew 43.13% annually to £4.58 billion. Though the overall growth rate has decelerated on a year-on-year basis for the past last two years,
the overall market volume growth remains significant. 2011 2012 2013 2014 2015 2016
£0.31b
£0.49b
£0.67b
£1.74b
£3.2b
£4.58b
Figure 1: UK Alternative Finance Market Volume, 2011-2016
The preponderance of volume is driven by debt-based and
equity-based models which can generate financial returns for lenders and investors. The underlying assumption of these
models is that a funder, being an investor or lender, can
reasonably expect a financial return from an equity or debt security instrument. By contrast, models which do not generate
a financial return, such as donation-based or reward-based crowdfunding models (in the text, also referred to as non-
investment based models) account for a small proportion of the
overall volume.
Peer-to-peer lending models continued to account for the
majority of market activity in the UK. Peer-to-peer business
lending was the largest alternative finance model, accounting for just over £1.23 billion lent in 2016 alone, followed closely by peer-to-peer consumer lending (£1.17 billion) and peer-to-peer property lending (£1.15 billion). Peer-to-Peer Property Lending registered the fastest annual growth, at a rate of 88% from 2015
to 2016, whilst Peer-to-Peer Consumer Lending grew by 47%
and Peer-to-Peer Business Lending by 36% during the same
period.
Invoice Trading – another debt-based model - accounted for
£452 million in 2016, with 39% annual growth. Debt-based securities/Debentures recorded the highest year-on-year growth
rate across all models tracked (1174%), driving £79 million in volume.
Equity-based crowdfunding grew by 11% from £245 million in 2015 to £272 million in 2016. The growth rate has, however, substantially slowed down when compared to previous years.
Total real estate crowdfunding market activity dropped by 18%
to £71 million in 2016 from £87 million in 2015. A similar trend was evident in Community Shares, where captured volumes
fell from £61m in 2015 to £35m in 2016, representing a 43% decline.
Within the non-investment based space, reward-based
crowdfunding drove £48m of volume in 2016, a 14% annual increase. Donation-based crowdfunding accounted for £40 million in 2016, representing a 233% annual increase. This
implies that the volume of Donation-based crowdfunding could
surpass that of reward-based crowdfunding should the relative
growth rates continue in 2017.
EMBARGOED UNTIL 00:00 FRI 8 December 2017
13
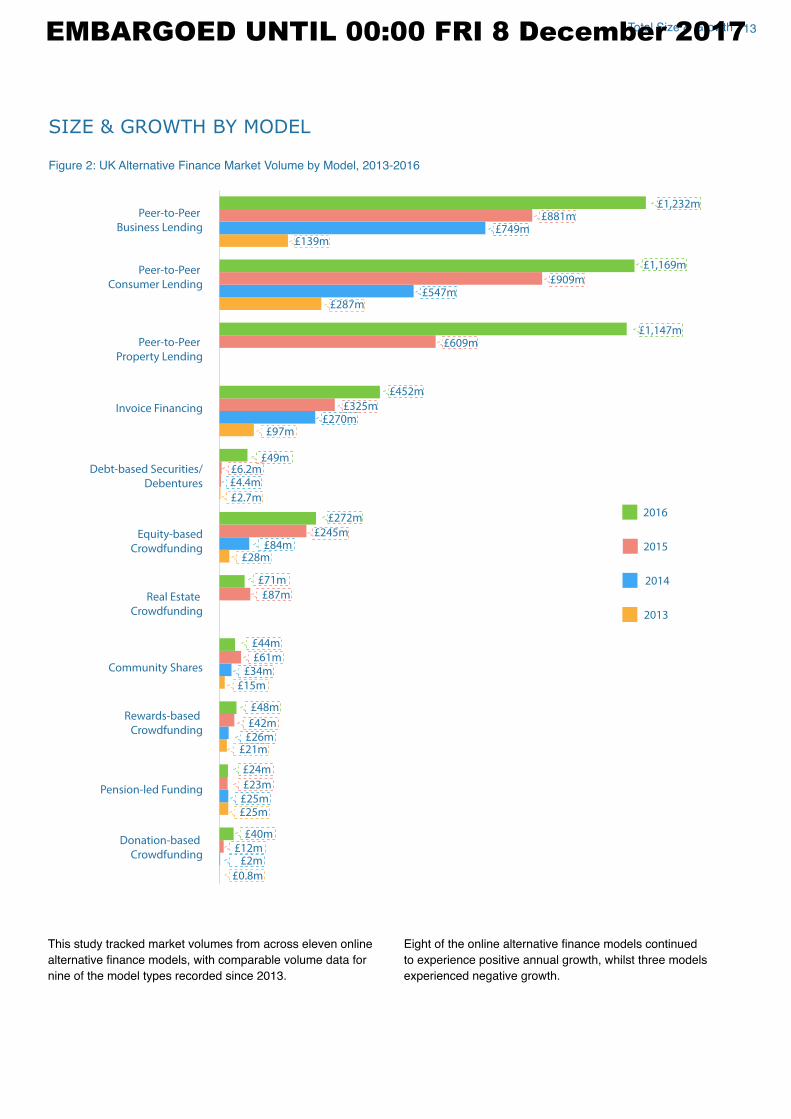
SIZE & GROWTH BY MODEL
Peer-to-Peer
Business Lending
Peer-to-Peer
Consumer Lending
Peer-to-Peer
Property Lending
Invoice Financing
Debt-based Securities/
Debentures
Equity-based
Crowdfunding
Real Estate
Crowdfunding
Community Shares
Rewards-based
Crowdfunding
Pension-led Funding
Donation-based
Crowdfunding
£139m
£881m£749m
£1,232m
£287m
£609m
£97m
£2.7m
£4.4m£6.2m
£49m
£28m£84m
£245m
£272m
£87m
£71m
£15m
£34m£61m
£44m
£21m£26m£42m
£48m
£25m
£40m£12m
£2m
£0.8m
£25m
£23m
£24m
£270m£325m
£452m
£1,147m
£547m£909m
£1,169m
2013
2014
2015
2016
Figure 2: UK Alternative Finance Market Volume by Model, 2013-2016
This study tracked market volumes from across eleven online
alternative finance models, with comparable volume data for nine of the model types recorded since 2013.
Eight of the online alternative finance models continued to experience positive annual growth, whilst three models
experienced negative growth.
Total Size & GrowthEMBARGOED UNTIL 00:00 FRI 8 December 2017
14 The 4th Annual UK Alternative Finance Industry Report
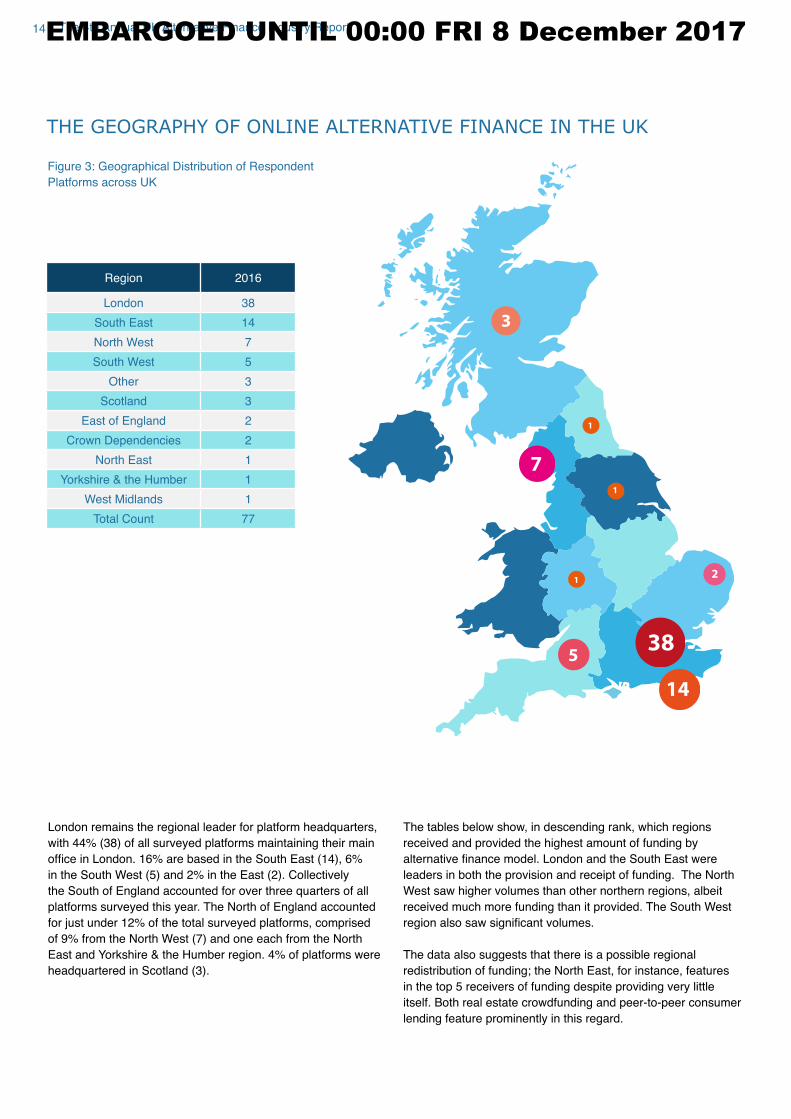
THE GEOGRAPHY OF ONLINE ALTERNATIVE FINANCE IN THE UK
1
1
12
5
7
14
38
3
London remains the regional leader for platform headquarters,
with 44% (38) of all surveyed platforms maintaining their main
office in London. 16% are based in the South East (14), 6% in the South West (5) and 2% in the East (2). Collectively
the South of England accounted for over three quarters of all
platforms surveyed this year. The North of England accounted
for just under 12% of the total surveyed platforms, comprised
of 9% from the North West (7) and one each from the North
East and Yorkshire & the Humber region. 4% of platforms were
headquartered in Scotland (3).
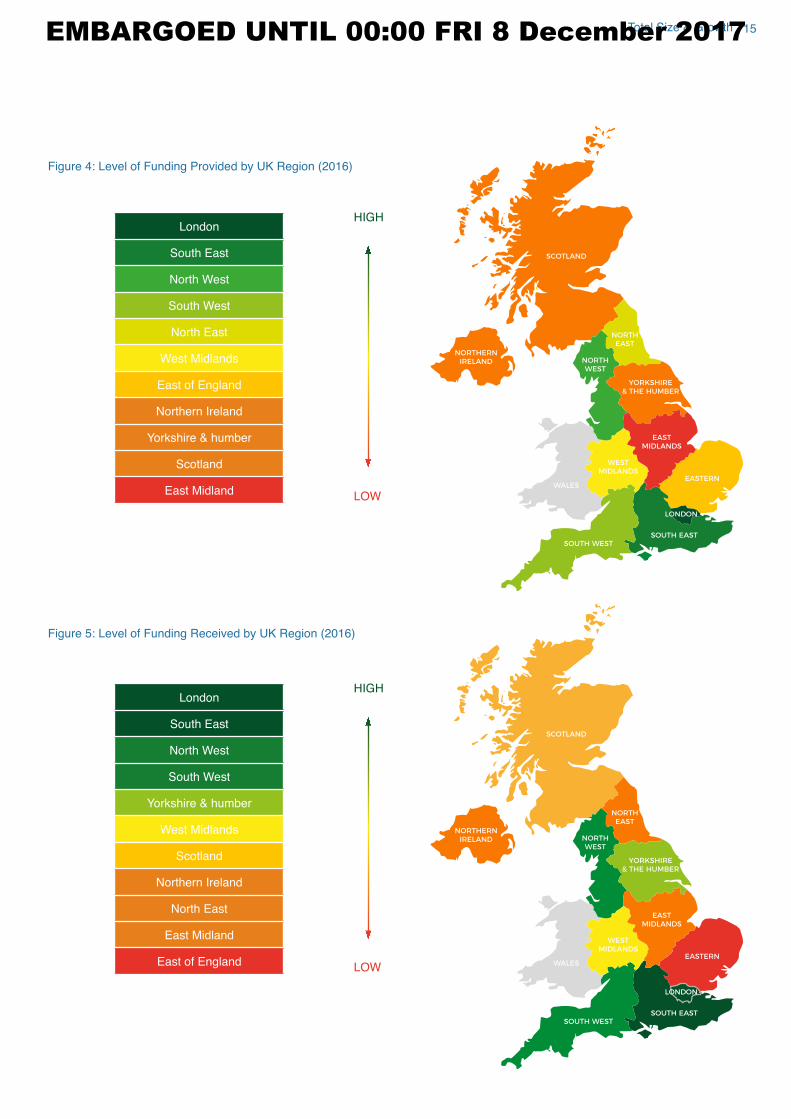
The tables below show, in descending rank, which regions
received and provided the highest amount of funding by
alternative finance model. London and the South East were leaders in both the provision and receipt of funding. The North
West saw higher volumes than other northern regions, albeit
received much more funding than it provided. The South West
region also saw significant volumes.
The data also suggests that there is a possible regional
redistribution of funding; the North East, for instance, features in the top 5 receivers of funding despite providing very little
itself. Both real estate crowdfunding and peer-to-peer consumer
lending feature prominently in this regard.
Region 2016
London 38
South East 14
North West 7
South West 5
Other 3
Scotland 3
East of England 2
Crown Dependencies 2
North East 1
Yorkshire & the Humber 1
West Midlands 1
Total Count 77
Figure 3: Geographical Distribution of Respondent
Platforms across UK
EMBARGOED UNTIL 00:00 FRI 8 December 2017
15
London
South East
North West
South West
North East
West Midlands
East of England
Northern Ireland
Yorkshire & humber
Scotland
East Midland
London
South East
North West
South West
Yorkshire & humber
West Midlands
Scotland
Northern Ireland
North East
East Midland
East of England
HIGH
LOW
HIGH
LOW
Figure 4: Level of Funding Provided by UK Region (2016)
Figure 5: Level of Funding Received by UK Region (2016)
Total Size & GrowthEMBARGOED UNTIL 00:00 FRI 8 December 2017
16 The 4th Annual UK Alternative Finance Industry Report
2004 2006 2008 2010
Incorporated
Began trading
2012 2014 2016 2018
11
4
3
7
9
17
21
4
2
11
4
11
20
16
55
3
11
Figure 6: Alternative Finance Platform
Incorporation and Start Trading Dates
in 2014-2017
Figure 7: Suspected Inactive Platforms
in 2016
Equity-based
Crowdfunding
Peet
-to
-Pee
rC
on
sum
er L
end
ing
Peet-to-P
eer
Business
Lending
Re
wa
rd-b
ase
d
Cro
wd
fun
din
g
Real Estate
crowdfunding
Hybrid Model
Invoice Trading
Do
natio
n-b
ased
Cro
wd
fun
din
g
Co
mm
un
ity
Sh
are
s
Mini-bond
12
2
2
3
3
3
4
5
10
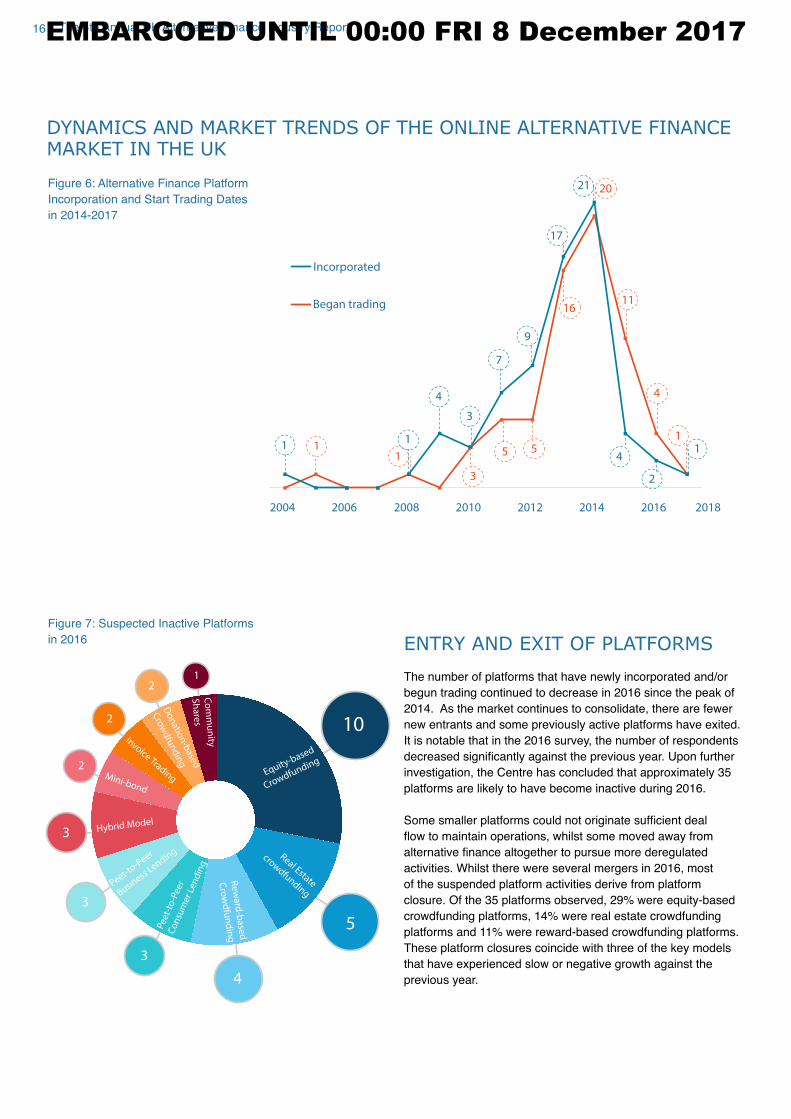
ENTRY AND EXIT OF PLATFORMS
The number of platforms that have newly incorporated and/or
begun trading continued to decrease in 2016 since the peak of
2014. As the market continues to consolidate, there are fewer
new entrants and some previously active platforms have exited.
It is notable that in the 2016 survey, the number of respondents
decreased significantly against the previous year. Upon further investigation, the Centre has concluded that approximately 35
platforms are likely to have become inactive during 2016.
Some smaller platforms could not originate sufficient deal flow to maintain operations, whilst some moved away from alternative finance altogether to pursue more deregulated activities. Whilst there were several mergers in 2016, most
of the suspended platform activities derive from platform
closure. Of the 35 platforms observed, 29% were equity-based
crowdfunding platforms, 14% were real estate crowdfunding
platforms and 11% were reward-based crowdfunding platforms.
These platform closures coincide with three of the key models
that have experienced slow or negative growth against the
previous year.
DYNAMICS AND MARKET TRENDS OF THE ONLINE ALTERNATIVE FINANCE MARKET IN THE UK
EMBARGOED UNTIL 00:00 FRI 8 December 2017
17Total Size & Growth
KEY SECTORS AND INDUSTRIES
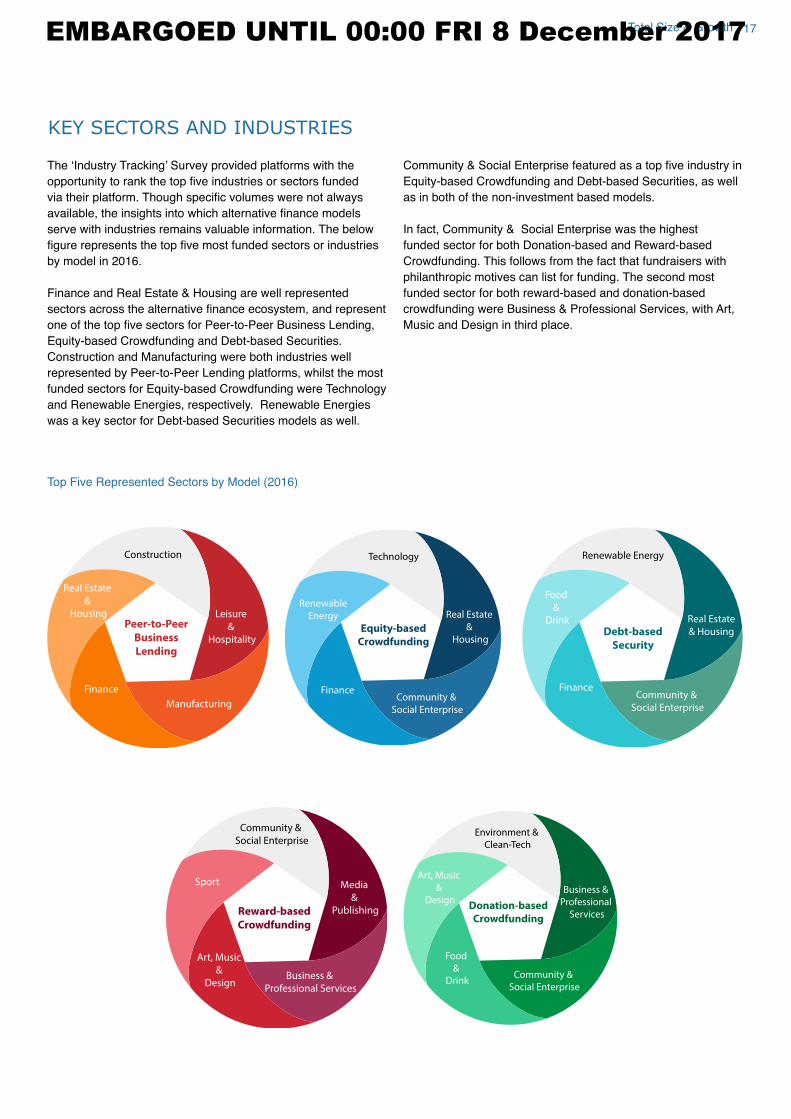
The ‘Industry Tracking’ Survey provided platforms with the opportunity to rank the top five industries or sectors funded via their platform. Though specific volumes were not always available, the insights into which alternative finance models serve with industries remains valuable information. The below
figure represents the top five most funded sectors or industries by model in 2016.
Finance and Real Estate & Housing are well represented
sectors across the alternative finance ecosystem, and represent one of the top five sectors for Peer-to-Peer Business Lending, Equity-based Crowdfunding and Debt-based Securities.
Construction and Manufacturing were both industries well
represented by Peer-to-Peer Lending platforms, whilst the most
funded sectors for Equity-based Crowdfunding were Technology
and Renewable Energies, respectively. Renewable Energies
was a key sector for Debt-based Securities models as well.
Community & Social Enterprise featured as a top five industry in Equity-based Crowdfunding and Debt-based Securities, as well
as in both of the non-investment based models.
In fact, Community & Social Enterprise was the highest
funded sector for both Donation-based and Reward-based
Crowdfunding. This follows from the fact that fundraisers with
philanthropic motives can list for funding. The second most
funded sector for both reward-based and donation-based
crowdfunding were Business & Professional Services, with Art,
Music and Design in third place.
Top Five Represented Sectors by Model (2016)
Peer-to-Peer
Business
Lending
Construction
Manufacturing
Real Estate
&
Housing Leisure
&
Hospitality
Finance
Equity-based
Crowdfunding
Real Estate
&
Housing
FinanceCommunity &
Social Enterprise
Renewable
Energy
Technology
Debt-based
Security
FinanceCommunity &
Social Enterprise
Renewable Energy
Food
&
Drink Real Estate
& Housing
Reward-based
Crowdfunding
Community &
Social Enterprise
Business &
Professional Services
Media
&
Publishing
Art, Music
&
Design
Sport
Donation-based
Crowdfunding
Community &
Social Enterprise
Business &
Professional
Services
Art, Music
&
Design
Food
&
Drink
Environment &
Clean-Tech
EMBARGOED UNTIL 00:00 FRI 8 December 2017
18 The 4th Annual UK Alternative Finance Industry Report
93%5%
20152014
20
,00
0 S
ME
s
7,0
00
SM
Es
32
,80
0 S
ME
s£1b
£2.2b
£3.3b
2016
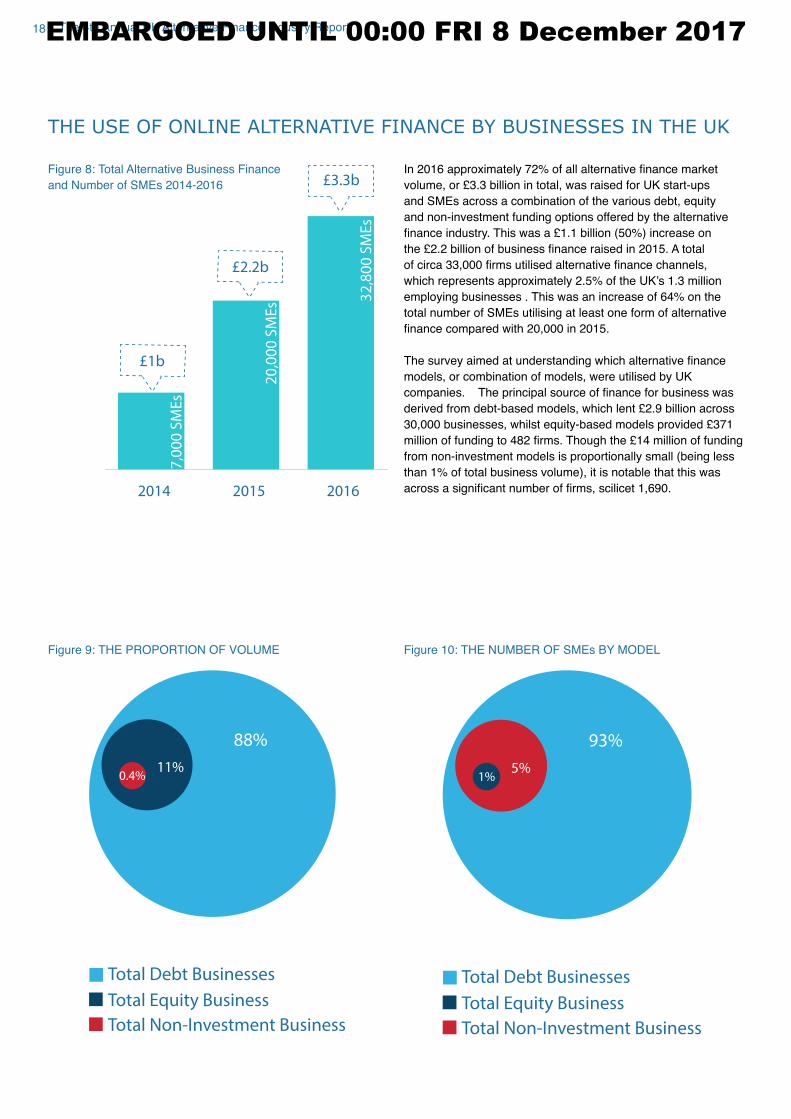
Figure 8: Total Alternative Business Finance
and Number of SMEs 2014-2016
Figure 9: THE PROPORTION OF VOLUME Figure 10: THE NUMBER OF SMEs BY MODEL
THE USE OF ONLINE ALTERNATIVE FINANCE BY BUSINESSES IN THE UK
In 2016 approximately 72% of all alternative finance market volume, or £3.3 billion in total, was raised for UK start-ups and SMEs across a combination of the various debt, equity
and non-investment funding options offered by the alternative
finance industry. This was a £1.1 billion (50%) increase on the £2.2 billion of business finance raised in 2015. A total of circa 33,000 firms utilised alternative finance channels, which represents approximately 2.5% of the UK’s 1.3 million employing businesses . This was an increase of 64% on the
total number of SMEs utilising at least one form of alternative
finance compared with 20,000 in 2015.
The survey aimed at understanding which alternative finance models, or combination of models, were utilised by UK
companies. The principal source of finance for business was derived from debt-based models, which lent £2.9 billion across 30,000 businesses, whilst equity-based models provided £371 million of funding to 482 firms. Though the £14 million of funding from non-investment models is proportionally small (being less
than 1% of total business volume), it is notable that this was
across a significant number of firms, scilicet 1,690.
5%
93%
Total Debt Businesses
Total Equity Business
Total Non-Investment Business
1%11%
88%
0.4%
Total Debt Businesses
Total Equity Business
Total Non-Investment Business
EMBARGOED UNTIL 00:00 FRI 8 December 2017
19Total Size & Growth
2011 2012 2013
Equity Crowdfunding
VC Funding (BVCA)
Seed & Early State VC
(Beauhurst)
2014 2015 2016
£1.7m £3.9m£28m
£84m
£245m
£347m
£488m£563m
£522m
£874m
£1,574m £1,566m
£343m£298m
£293m£344m
£272m
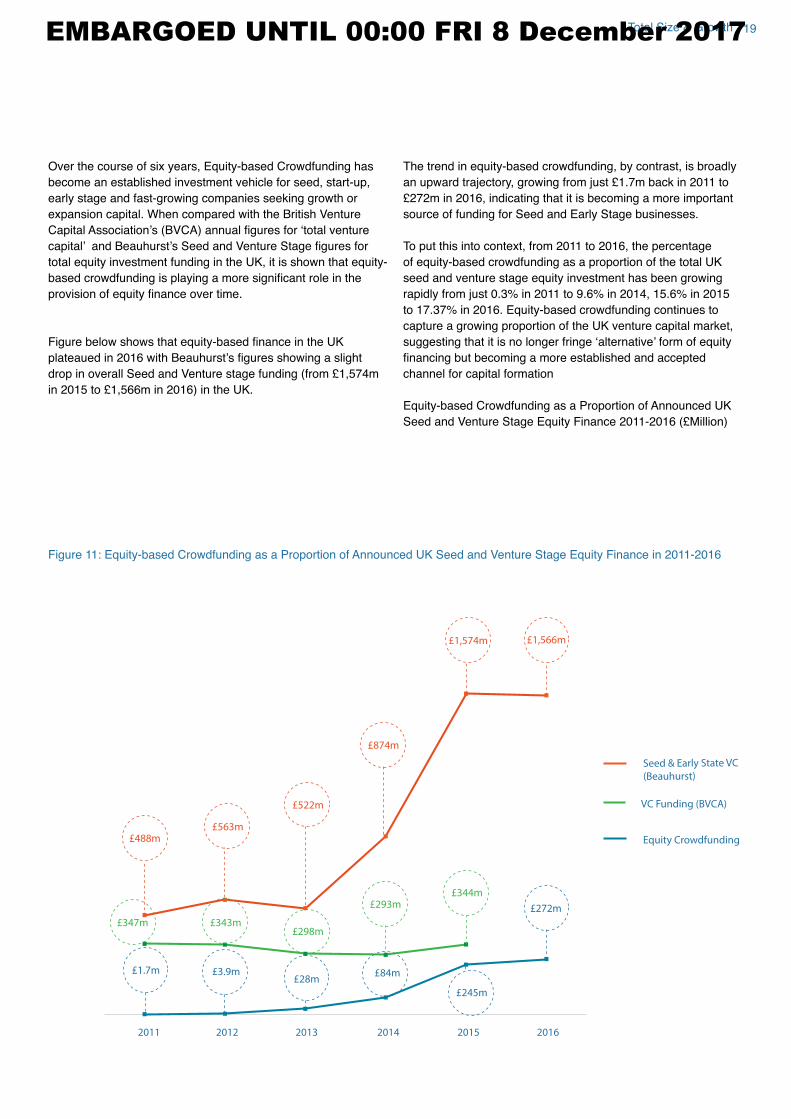
Figure 11: Equity-based Crowdfunding as a Proportion of Announced UK Seed and Venture Stage Equity Finance in 2011-2016
Over the course of six years, Equity-based Crowdfunding has
become an established investment vehicle for seed, start-up,
early stage and fast-growing companies seeking growth or
expansion capital. When compared with the British Venture
Capital Association’s (BVCA) annual figures for ‘total venture capital’ and Beauhurst’s Seed and Venture Stage figures for total equity investment funding in the UK, it is shown that equity-
based crowdfunding is playing a more significant role in the provision of equity finance over time.
Figure below shows that equity-based finance in the UK plateaued in 2016 with Beauhurst’s figures showing a slight drop in overall Seed and Venture stage funding (from £1,574m in 2015 to £1,566m in 2016) in the UK.
The trend in equity-based crowdfunding, by contrast, is broadly
an upward trajectory, growing from just £1.7m back in 2011 to £272m in 2016, indicating that it is becoming a more important source of funding for Seed and Early Stage businesses.
To put this into context, from 2011 to 2016, the percentage
of equity-based crowdfunding as a proportion of the total UK
seed and venture stage equity investment has been growing
rapidly from just 0.3% in 2011 to 9.6% in 2014, 15.6% in 2015
to 17.37% in 2016. Equity-based crowdfunding continues to
capture a growing proportion of the UK venture capital market,
suggesting that it is no longer fringe ‘alternative’ form of equity financing but becoming a more established and accepted channel for capital formation
Equity-based Crowdfunding as a Proportion of Announced UK
Seed and Venture Stage Equity Finance 2011-2016 (£Million)
EMBARGOED UNTIL 00:00 FRI 8 December 2017
20 The 4th Annual UK Alternative Finance Industry Report
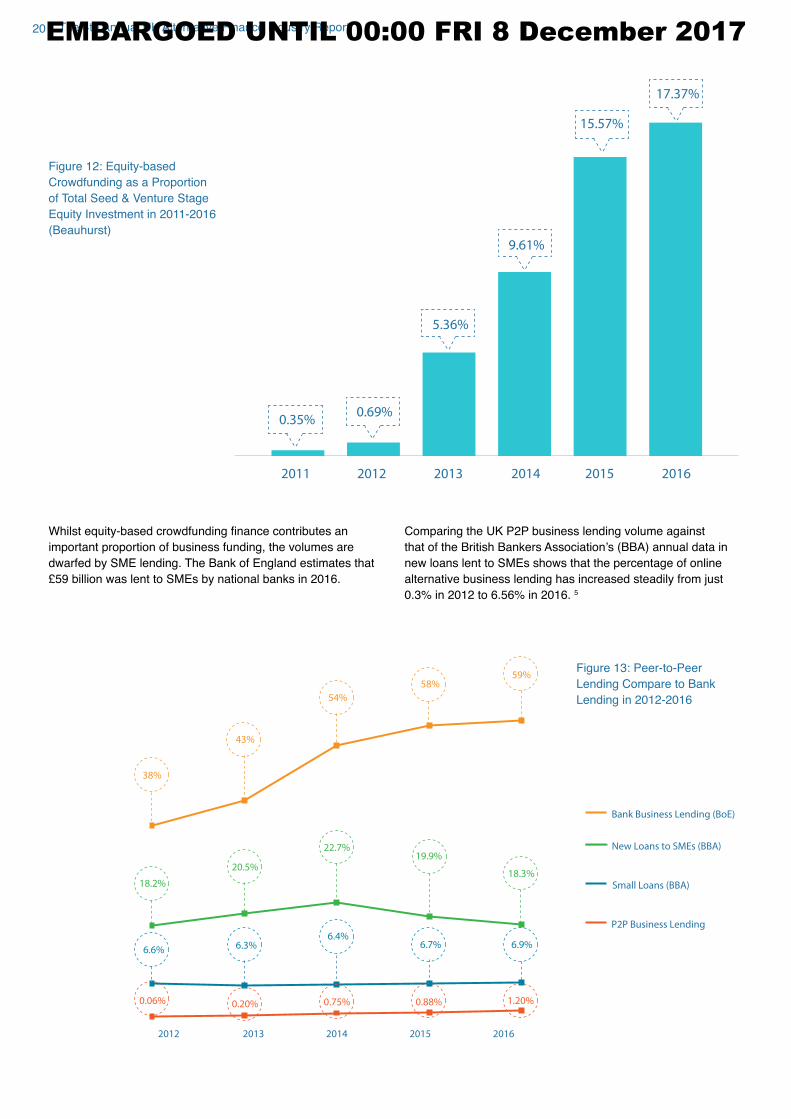
Whilst equity-based crowdfunding finance contributes an important proportion of business funding, the volumes are
dwarfed by SME lending. The Bank of England estimates that
£59 billion was lent to SMEs by national banks in 2016.
Comparing the UK P2P business lending volume against
that of the British Bankers Association’s (BBA) annual data in new loans lent to SMEs shows that the percentage of online
alternative business lending has increased steadily from just
0.3% in 2012 to 6.56% in 2016. 5
2012 2013
P2P Business Lending
New Loans to SMEs (BBA)
Bank Business Lending (BoE)
Small Loans (BBA)
2014 2015 2016
0.06%
38%
43%
54%
58%59%
18.3%
6.9%6.4%
6.7%
19.9%
6.3%6.6%
18.2%
20.5%
22.7%
0.20% 0.75% 0.88% 1.20%
Figure 13: Peer-to-Peer
Lending Compare to Bank
Lending in 2012-2016
2011
0.35%0.69%
5.36%
9.61%
15.57%
17.37%
2012 2013 2014 2015 2016
Figure 12: Equity-based
Crowdfunding as a Proportion
of Total Seed & Venture Stage
Equity Investment in 2011-2016
(Beauhurst)
EMBARGOED UNTIL 00:00 FRI 8 December 2017
21Total Size & Growth
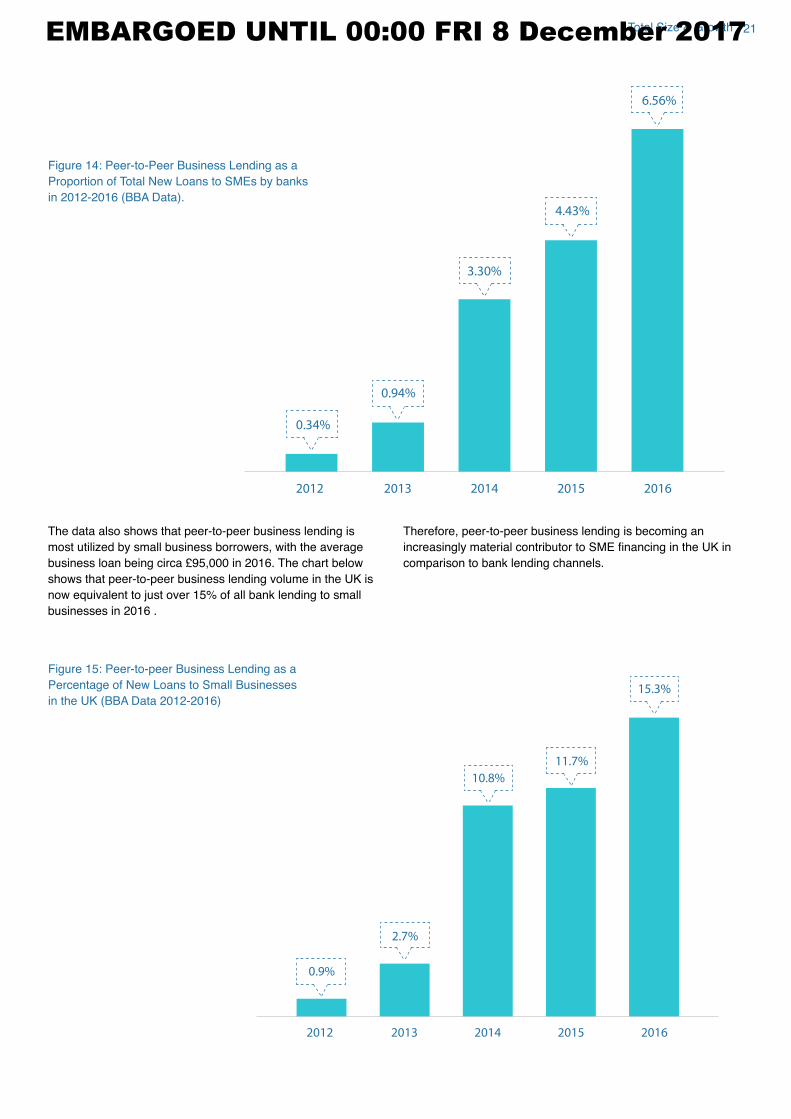
Therefore, peer-to-peer business lending is becoming an
increasingly material contributor to SME financing in the UK in comparison to bank lending channels.
The data also shows that peer-to-peer business lending is
most utilized by small business borrowers, with the average
business loan being circa £95,000 in 2016. The chart below shows that peer-to-peer business lending volume in the UK is
now equivalent to just over 15% of all bank lending to small
businesses in 2016 .
0.9%
2.7%
10.8%
11.7%
15.3%
2012 2013 2014 2015 2016
Figure 15: Peer-to-peer Business Lending as a
Percentage of New Loans to Small Businesses
in the UK (BBA Data 2012-2016)
0.34%
0.94%
3.30%
4.43%
6.56%
2012 2013 2014 2015 2016
Figure 14: Peer-to-Peer Business Lending as a
Proportion of Total New Loans to SMEs by banks
in 2012-2016 (BBA Data).
EMBARGOED UNTIL 00:00 FRI 8 December 2017
22 The 4th Annual UK Alternative Finance Industry Report
INNOVATION ACROSS ALTERNATIVE FINANCE PLATFORMS
15%
44%
42%
We significantly altered our business model in 2016
We slightly altered our business model in 2016
We made no significant changes to our business model in 2016
31%
36%
33%
We introduced significantly new products in 2016
We slightly altered products in 2016
We made no significant changes to our products in 2016
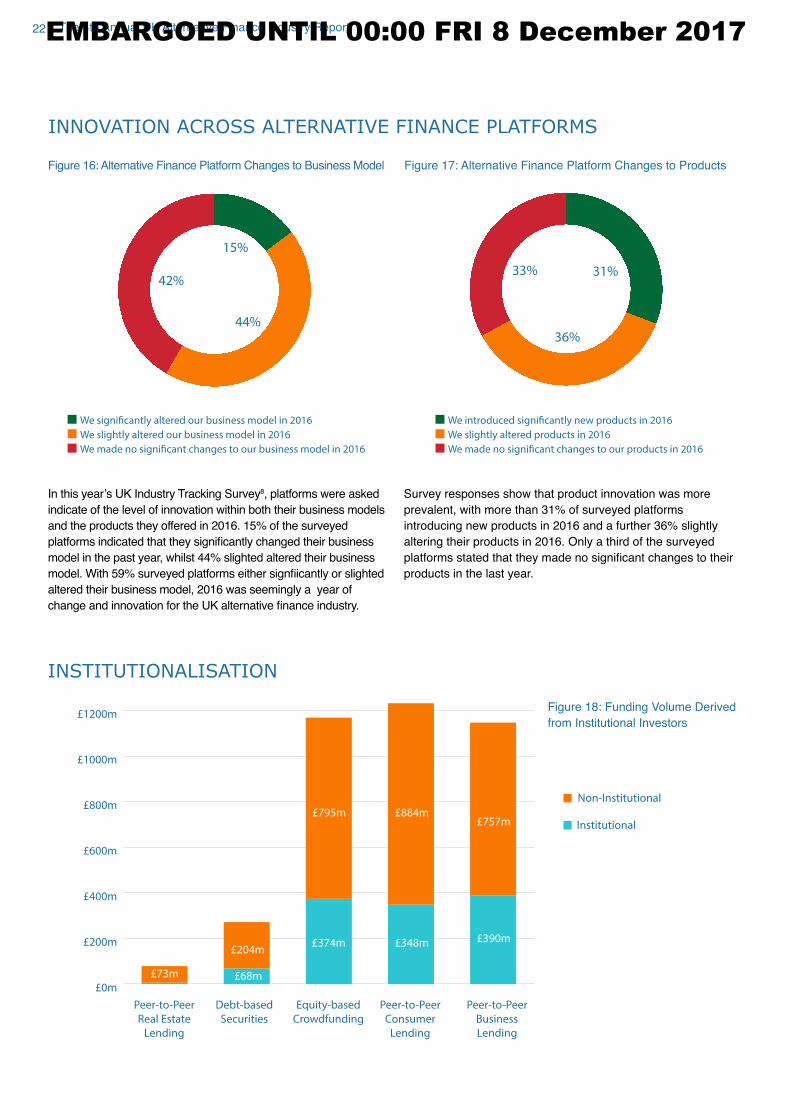
In this year’s UK Industry Tracking Survey8, platforms were asked
indicate of the level of innovation within both their business models
and the products they offered in 2016. 15% of the surveyed
platforms indicated that they significantly changed their business model in the past year, whilst 44% slighted altered their business
model. With 59% surveyed platforms either signfiicantly or slighted altered their business model, 2016 was seemingly a year of
change and innovation for the UK alternative finance industry.
Survey responses show that product innovation was more
prevalent, with more than 31% of surveyed platforms
introducing new products in 2016 and a further 36% slightly
altering their products in 2016. Only a third of the surveyed
platforms stated that they made no significant changes to their products in the last year.
Figure 16: Alternative Finance Platform Changes to Business Model Figure 17: Alternative Finance Platform Changes to Products
INSTITUTIONALISATION
£0m
£200m
£400m
£600m
£800m
£1000m
£1200m
Peer-to-Peer
Real Estate
Lending
Debt-based
Securities
Peer-to-Peer
Consumer
Lending
Peer-to-Peer
Business
Lending
Equity-based
Crowdfunding
Institutional
Non-Institutional
£757m
£390m
£884m
£348m
£795m
£374m£204m
£68m£73m
Figure 18: Funding Volume Derived
from Institutional Investors
EMBARGOED UNTIL 00:00 FRI 8 December 2017
23Total Size & Growth
0% 10% 20% 30% 40% 50% 60% 70% 80% 90% 100%
Equity-based Crowdfunding 2016
Equity-based Crowdfunding 2015
P2P Real Estate Lending 2016
P2P Real Estate Lending 2015
P2P Business Lending 2016
P2P Business Lending 2015
P2P Consumer Lending 2016
P2P Consumer Lending 2015
25%
8%
25%
25%
28%
26%
32%
32%
Institutional Non-Institutional
75%
92%
75%
75%
72%
74%
68%
68%
Figure 19: Proportion of Funding
from Institutional Investors, 2015 vs
2016
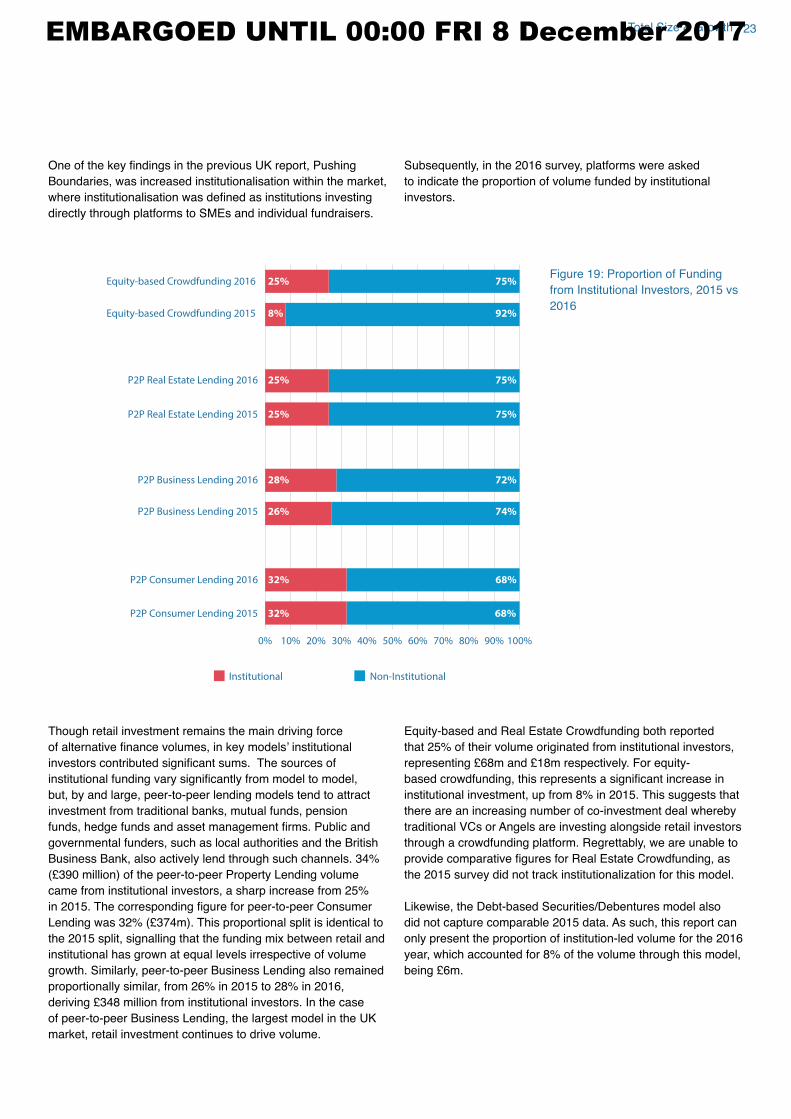
One of the key findings in the previous UK report, Pushing Boundaries, was increased institutionalisation within the market,
where institutionalisation was defined as institutions investing directly through platforms to SMEs and individual fundraisers.
Subsequently, in the 2016 survey, platforms were asked
to indicate the proportion of volume funded by institutional
investors.
Though retail investment remains the main driving force
of alternative finance volumes, in key models’ institutional investors contributed significant sums. The sources of institutional funding vary significantly from model to model, but, by and large, peer-to-peer lending models tend to attract
investment from traditional banks, mutual funds, pension
funds, hedge funds and asset management firms. Public and governmental funders, such as local authorities and the British
Business Bank, also actively lend through such channels. 34%
(£390 million) of the peer-to-peer Property Lending volume came from institutional investors, a sharp increase from 25%
in 2015. The corresponding figure for peer-to-peer Consumer Lending was 32% (£374m). This proportional split is identical to the 2015 split, signalling that the funding mix between retail and
institutional has grown at equal levels irrespective of volume
growth. Similarly, peer-to-peer Business Lending also remained
proportionally similar, from 26% in 2015 to 28% in 2016,
deriving £348 million from institutional investors. In the case of peer-to-peer Business Lending, the largest model in the UK
market, retail investment continues to drive volume.
Equity-based and Real Estate Crowdfunding both reported
that 25% of their volume originated from institutional investors,
representing £68m and £18m respectively. For equity-based crowdfunding, this represents a significant increase in institutional investment, up from 8% in 2015. This suggests that
there are an increasing number of co-investment deal whereby
traditional VCs or Angels are investing alongside retail investors
through a crowdfunding platform. Regrettably, we are unable to
provide comparative figures for Real Estate Crowdfunding, as the 2015 survey did not track institutionalization for this model.
Likewise, the Debt-based Securities/Debentures model also
did not capture comparable 2015 data. As such, this report can
only present the proportion of institution-led volume for the 2016
year, which accounted for 8% of the volume through this model,
being £6m.
EMBARGOED UNTIL 00:00 FRI 8 December 2017
24 The 4th Annual UK Alternative Finance Industry Report
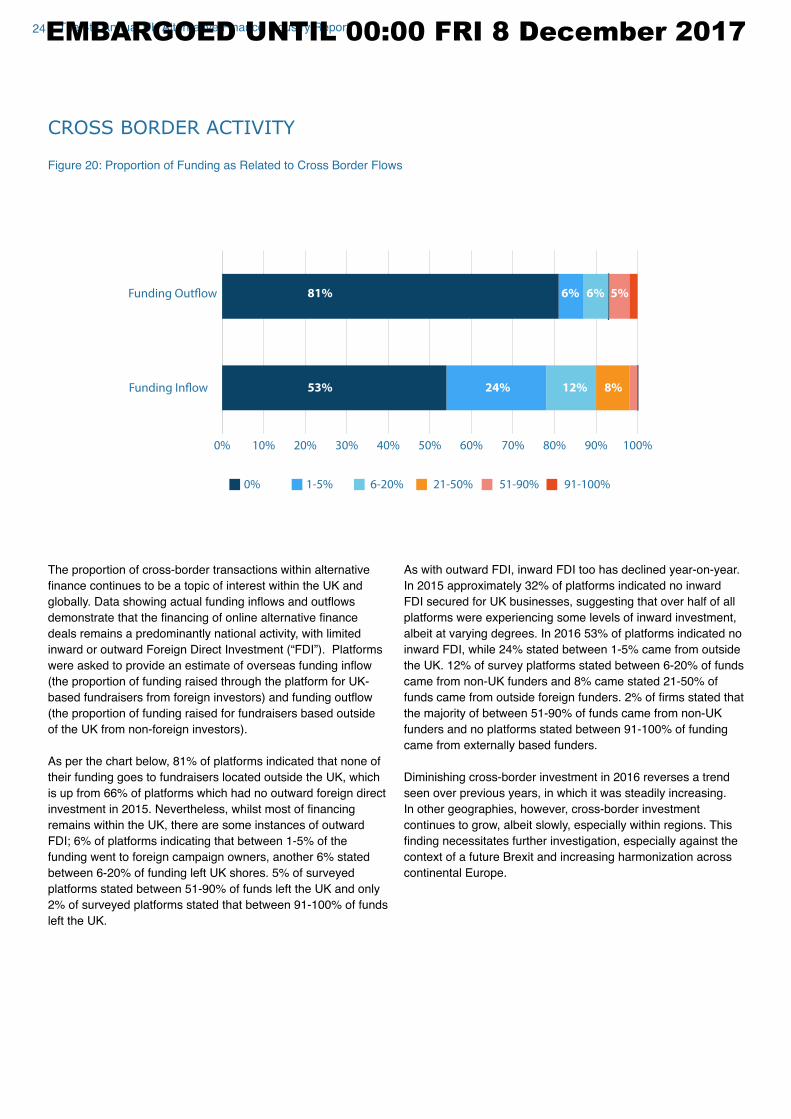
CROSS BORDER ACTIVITY
0% 10% 20% 30% 40% 50% 60% 70% 80% 90% 100%
53% 24% 12%
6% 6% 5%
8%
81%
0% 1-5%
Funding Outflow
Funding Inflow
6-20% 21-50% 51-90% 91-100%
The proportion of cross-border transactions within alternative
finance continues to be a topic of interest within the UK and globally. Data showing actual funding inflows and outflows demonstrate that the financing of online alternative finance deals remains a predominantly national activity, with limited
inward or outward Foreign Direct Investment (“FDI”). Platforms
were asked to provide an estimate of overseas funding inflow (the proportion of funding raised through the platform for UK-
based fundraisers from foreign investors) and funding outflow (the proportion of funding raised for fundraisers based outside
of the UK from non-foreign investors).
As per the chart below, 81% of platforms indicated that none of
their funding goes to fundraisers located outside the UK, which
is up from 66% of platforms which had no outward foreign direct
investment in 2015. Nevertheless, whilst most of financing remains within the UK, there are some instances of outward
FDI; 6% of platforms indicating that between 1-5% of the funding went to foreign campaign owners, another 6% stated
between 6-20% of funding left UK shores. 5% of surveyed
platforms stated between 51-90% of funds left the UK and only
2% of surveyed platforms stated that between 91-100% of funds
left the UK.
As with outward FDI, inward FDI too has declined year-on-year.
In 2015 approximately 32% of platforms indicated no inward
FDI secured for UK businesses, suggesting that over half of all
platforms were experiencing some levels of inward investment,
albeit at varying degrees. In 2016 53% of platforms indicated no
inward FDI, while 24% stated between 1-5% came from outside
the UK. 12% of survey platforms stated between 6-20% of funds
came from non-UK funders and 8% came stated 21-50% of
funds came from outside foreign funders. 2% of firms stated that the majority of between 51-90% of funds came from non-UK
funders and no platforms stated between 91-100% of funding
came from externally based funders.
Diminishing cross-border investment in 2016 reverses a trend
seen over previous years, in which it was steadily increasing.
In other geographies, however, cross-border investment
continues to grow, albeit slowly, especially within regions. This
finding necessitates further investigation, especially against the context of a future Brexit and increasing harmonization across
continental Europe.
Figure 20: Proportion of Funding as Related to Cross Border Flows
EMBARGOED UNTIL 00:00 FRI 8 December 2017
25Total Size & Growth
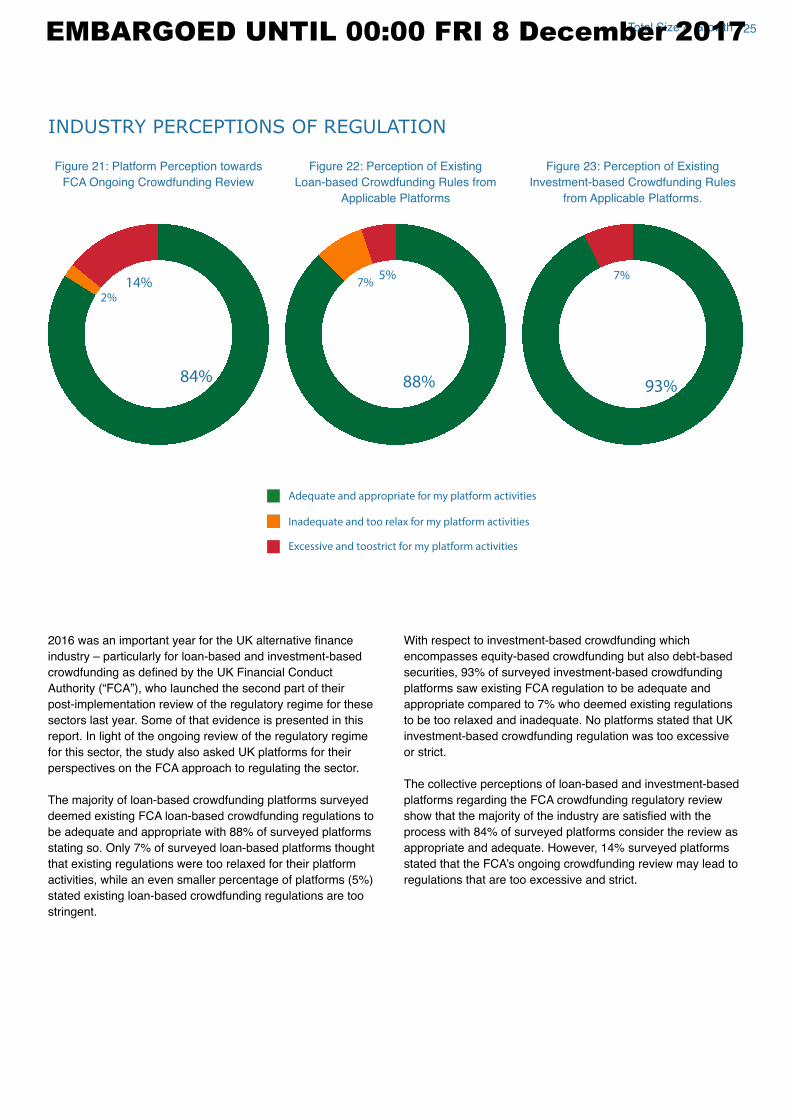
INDUSTRY PERCEPTIONS OF REGULATION
84%
14%
2%
88%
7%5%
93%
7%
Adequate and appropriate for my platform activities
Inadequate and too relax for my platform activities
Excessive and toostrict for my platform activities
2016 was an important year for the UK alternative finance industry – particularly for loan-based and investment-based
crowdfunding as defined by the UK Financial Conduct Authority (“FCA”), who launched the second part of their
post-implementation review of the regulatory regime for these
sectors last year. Some of that evidence is presented in this
report. In light of the ongoing review of the regulatory regime
for this sector, the study also asked UK platforms for their
perspectives on the FCA approach to regulating the sector.
The majority of loan-based crowdfunding platforms surveyed
deemed existing FCA loan-based crowdfunding regulations to
be adequate and appropriate with 88% of surveyed platforms
stating so. Only 7% of surveyed loan-based platforms thought
that existing regulations were too relaxed for their platform
activities, while an even smaller percentage of platforms (5%)
stated existing loan-based crowdfunding regulations are too
stringent.
With respect to investment-based crowdfunding which
encompasses equity-based crowdfunding but also debt-based
securities, 93% of surveyed investment-based crowdfunding
platforms saw existing FCA regulation to be adequate and
appropriate compared to 7% who deemed existing regulations
to be too relaxed and inadequate. No platforms stated that UK
investment-based crowdfunding regulation was too excessive
or strict.
The collective perceptions of loan-based and investment-based
platforms regarding the FCA crowdfunding regulatory review
show that the majority of the industry are satisfied with the process with 84% of surveyed platforms consider the review as
appropriate and adequate. However, 14% surveyed platforms
stated that the FCA’s ongoing crowdfunding review may lead to regulations that are too excessive and strict.
Figure 21: Platform Perception towards
FCA Ongoing Crowdfunding Review
Figure 22: Perception of Existing
Loan-based Crowdfunding Rules from
Applicable Platforms
Figure 23: Perception of Existing
Investment-based Crowdfunding Rules
from Applicable Platforms.
EMBARGOED UNTIL 00:00 FRI 8 December 2017
The 4th Annual UK Alternative Finance Industry Report26
0% 20% 40% 60% 80% 100%
Potential 'crowding out' of individual
investors as institutionalization accelerates
Impact of Brexit
Notable increase in default rates/
business failure rates
Cancellation/Removal of tax incentives
(i.e. SEIS, EIS, SITR, IF ISA)
Pending FCA Authorisation
Changes to regulation at a national level
Fraud involving one or more high-profile
campaigns/deals/loans
The collapse of one or more well-known
platforms due to malpractice
Cyber-security breach
Very high risk
Very low risk
High risk
Low risk
Medium risk
41% 36%
32%
23%
22%
17%
15%
14%
12%
8%
6%
6%
6%
6% 54% 30%
43% 31% 12%
33% 41% 9%
13% 28% 43%
31% 33% 14%
34% 32% 9%
32% 26% 13%
29% 26%
13% 6%
7%
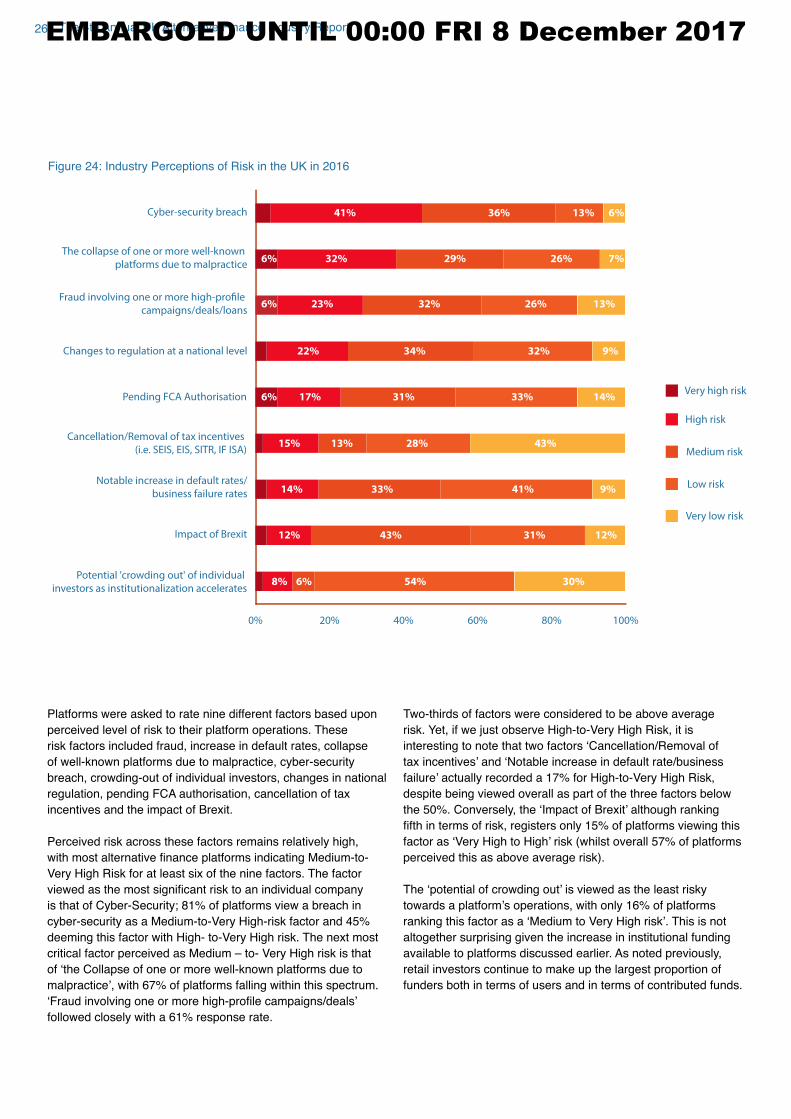
Platforms were asked to rate nine different factors based upon
perceived level of risk to their platform operations. These
risk factors included fraud, increase in default rates, collapse
of well-known platforms due to malpractice, cyber-security
breach, crowding-out of individual investors, changes in national
regulation, pending FCA authorisation, cancellation of tax
incentives and the impact of Brexit.
Perceived risk across these factors remains relatively high,
with most alternative finance platforms indicating Medium-to-Very High Risk for at least six of the nine factors. The factor
viewed as the most significant risk to an individual company is that of Cyber-Security; 81% of platforms view a breach in cyber-security as a Medium-to-Very High-risk factor and 45%
deeming this factor with High- to-Very High risk. The next most
critical factor perceived as Medium – to- Very High risk is that
of ‘the Collapse of one or more well-known platforms due to malpractice’, with 67% of platforms falling within this spectrum. ‘Fraud involving one or more high-profile campaigns/deals’ followed closely with a 61% response rate.
Two-thirds of factors were considered to be above average
risk. Yet, if we just observe High-to-Very High Risk, it is
interesting to note that two factors ‘Cancellation/Removal of tax incentives’ and ‘Notable increase in default rate/business failure’ actually recorded a 17% for High-to-Very High Risk, despite being viewed overall as part of the three factors below
the 50%. Conversely, the ‘Impact of Brexit’ although ranking fifth in terms of risk, registers only 15% of platforms viewing this factor as ‘Very High to High’ risk (whilst overall 57% of platforms perceived this as above average risk).
The ‘potential of crowding out’ is viewed as the least risky towards a platform’s operations, with only 16% of platforms ranking this factor as a ‘Medium to Very High risk’. This is not altogether surprising given the increase in institutional funding
available to platforms discussed earlier. As noted previously,
retail investors continue to make up the largest proportion of
funders both in terms of users and in terms of contributed funds.
Figure 24: Industry Perceptions of Risk in the UK in 2016
EMBARGOED UNTIL 00:00 FRI 8 December 2017
Total Size & Growth 27
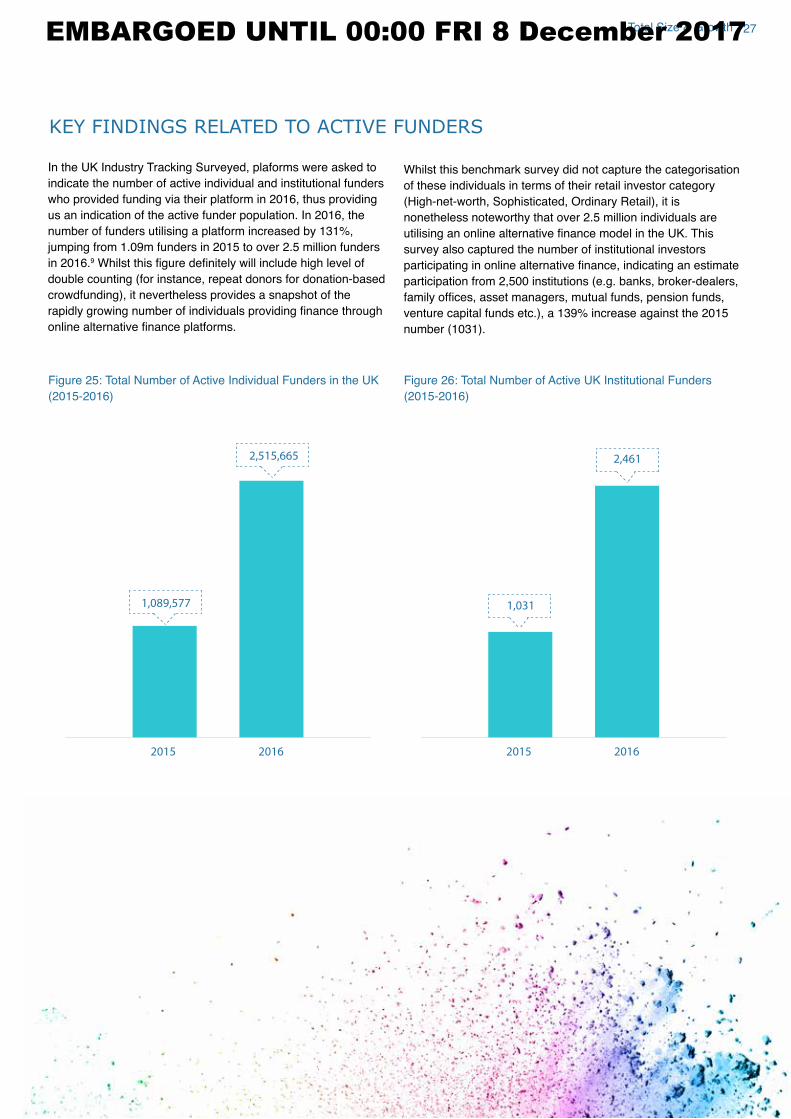
In the UK Industry Tracking Surveyed, plaforms were asked to
indicate the number of active individual and institutional funders
who provided funding via their platform in 2016, thus providing
us an indication of the active funder population. In 2016, the
number of funders utilising a platform increased by 131%,
jumping from 1.09m funders in 2015 to over 2.5 million funders
in 2016.9 Whilst this figure definitely will include high level of double counting (for instance, repeat donors for donation-based
crowdfunding), it nevertheless provides a snapshot of the
rapidly growing number of individuals providing finance through online alternative finance platforms.
Whilst this benchmark survey did not capture the categorisation
of these individuals in terms of their retail investor category
(High-net-worth, Sophisticated, Ordinary Retail), it is
nonetheless noteworthy that over 2.5 million individuals are
utilising an online alternative finance model in the UK. This survey also captured the number of institutional investors
participating in online alternative finance, indicating an estimate participation from 2,500 institutions (e.g. banks, broker-dealers,
family offices, asset managers, mutual funds, pension funds, venture capital funds etc.), a 139% increase against the 2015
number (1031).
2015 2016
2,515,665
1,089,577
2015 2016
2,461
1,031
Figure 25: Total Number of Active Individual Funders in the UK
(2015-2016)
Figure 26: Total Number of Active UK Institutional Funders
(2015-2016)
KEY FINDINGS RELATED TO ACTIVE FUNDERS
EMBARGOED UNTIL 00:00 FRI 8 December 2017
28 The 4th Annual UK Alternative Finance Industry Report
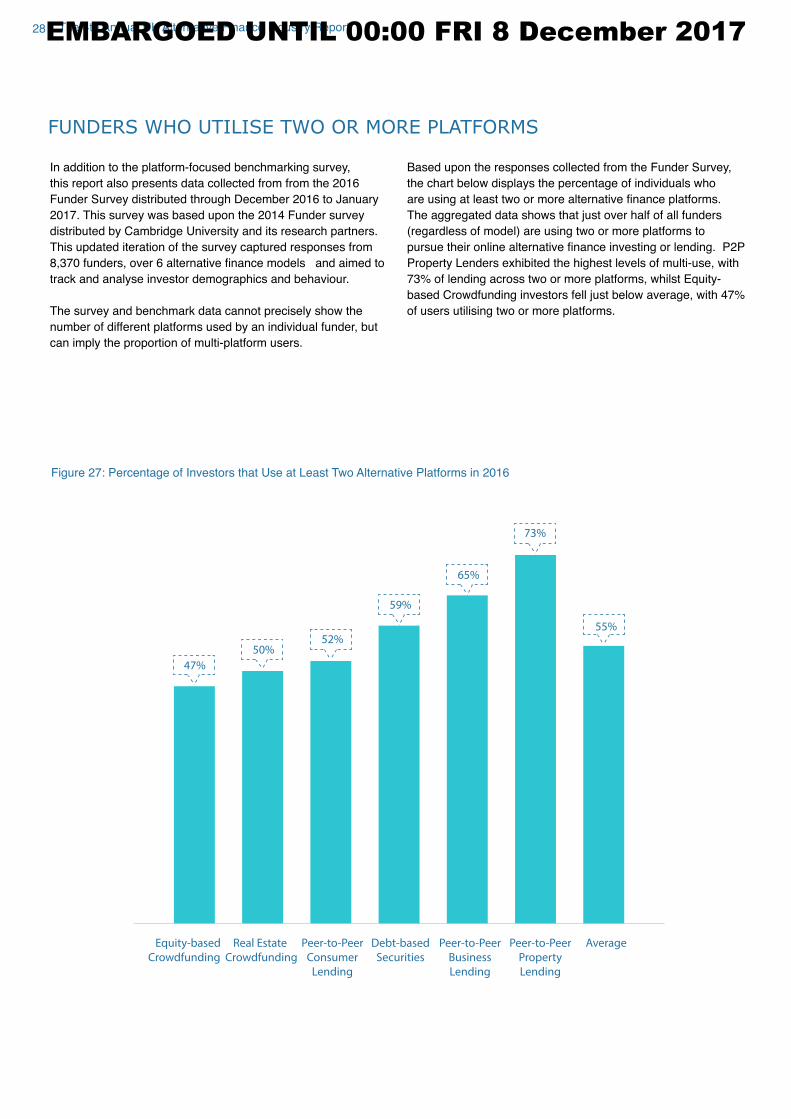
FUNDERS WHO UTILISE TWO OR MORE PLATFORMS
In addition to the platform-focused benchmarking survey,
this report also presents data collected from from the 2016
Funder Survey distributed through December 2016 to January
2017. This survey was based upon the 2014 Funder survey
distributed by Cambridge University and its research partners.
This updated iteration of the survey captured responses from
8,370 funders, over 6 alternative finance models and aimed to track and analyse investor demographics and behaviour.
The survey and benchmark data cannot precisely show the
number of different platforms used by an individual funder, but
can imply the proportion of multi-platform users.
Based upon the responses collected from the Funder Survey,
the chart below displays the percentage of individuals who
are using at least two or more alternative finance platforms. The aggregated data shows that just over half of all funders
(regardless of model) are using two or more platforms to
pursue their online alternative finance investing or lending. P2P Property Lenders exhibited the highest levels of multi-use, with
73% of lending across two or more platforms, whilst Equity-
based Crowdfunding investors fell just below average, with 47%
of users utilising two or more platforms.
47%
50%52%
59%
65%
73%
55%
Peer-to-Peer
Consumer
Lending
Real Estate
Crowdfunding
Equity-based
Crowdfunding
Debt-based
Securities
Peer-to-Peer
Business
Lending
Peer-to-Peer
Property
Lending
Average
Figure 27: Percentage of Investors that Use at Least Two Alternative Platforms in 2016
EMBARGOED UNTIL 00:00 FRI 8 December 2017
29Total Size & Growth
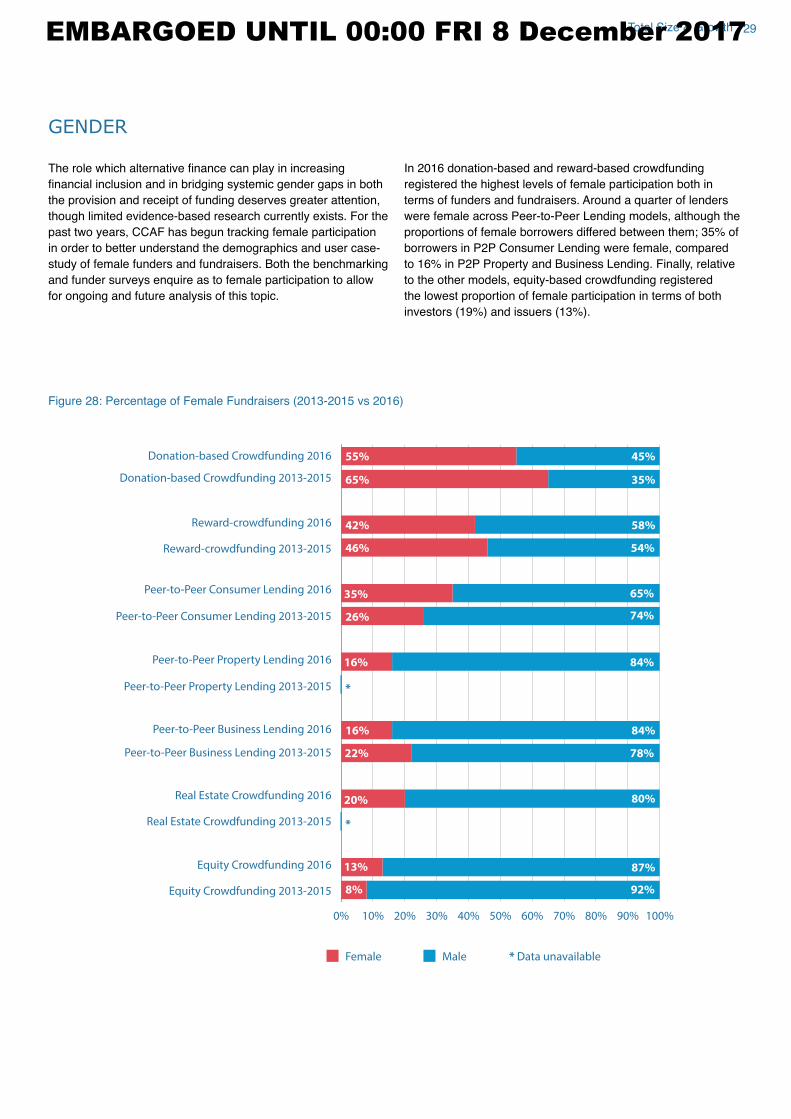
GENDER
The role which alternative finance can play in increasing financial inclusion and in bridging systemic gender gaps in both the provision and receipt of funding deserves greater attention,
though limited evidence-based research currently exists. For the
past two years, CCAF has begun tracking female participation
in order to better understand the demographics and user case-
study of female funders and fundraisers. Both the benchmarking
and funder surveys enquire as to female participation to allow
for ongoing and future analysis of this topic.
In 2016 donation-based and reward-based crowdfunding
registered the highest levels of female participation both in
terms of funders and fundraisers. Around a quarter of lenders
were female across Peer-to-Peer Lending models, although the
proportions of female borrowers differed between them; 35% of borrowers in P2P Consumer Lending were female, compared
to 16% in P2P Property and Business Lending. Finally, relative
to the other models, equity-based crowdfunding registered
the lowest proportion of female participation in terms of both
investors (19%) and issuers (13%).
0% 10% 20% 30% 40% 50% 60% 70% 80% 90% 100%
Donation-based Crowdfunding 2016
Donation-based Crowdfunding 2013-2015
Reward-crowdfunding 2016
Reward-crowdfunding 2013-2015
Peer-to-Peer Consumer Lending 2016
Peer-to-Peer Consumer Lending 2013-2015
Peer-to-Peer Property Lending 2016
Peer-to-Peer Property Lending 2013-2015
Peer-to-Peer Business Lending 2016
Peer-to-Peer Business Lending 2013-2015
Real Estate Crowdfunding 2016
Real Estate Crowdfunding 2013-2015
Equity Crowdfunding 2016
Equity Crowdfunding 2013-2015
45%
65% 35%
58%42%
54%46%
65%35%
26% 74%
84%16%
*%
*
* Data unavailable
84%
84%16%
22% 78%
80%
80%
87%
92%8%
13%
20%
55%
Female Male
Figure 28: Percentage of Female Fundraisers (2013-2015 vs 2016)
EMBARGOED UNTIL 00:00 FRI 8 December 2017
30 The 4th Annual UK Alternative Finance Industry Report
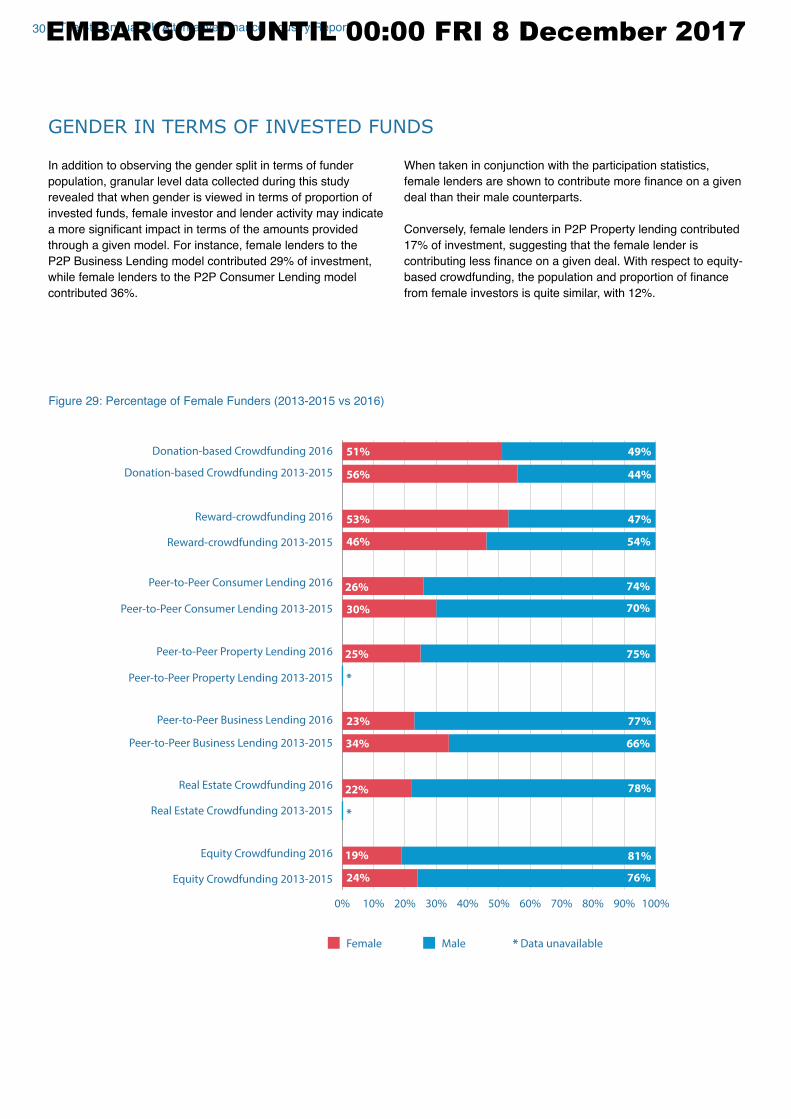
GENDER IN TERMS OF INVESTED FUNDS
In addition to observing the gender split in terms of funder
population, granular level data collected during this study
revealed that when gender is viewed in terms of proportion of
invested funds, female investor and lender activity may indicate
a more significant impact in terms of the amounts provided through a given model. For instance, female lenders to the
P2P Business Lending model contributed 29% of investment,
while female lenders to the P2P Consumer Lending model
contributed 36%.
When taken in conjunction with the participation statistics,
female lenders are shown to contribute more finance on a given deal than their male counterparts.
Conversely, female lenders in P2P Property lending contributed
17% of investment, suggesting that the female lender is
contributing less finance on a given deal. With respect to equity-based crowdfunding, the population and proportion of finance from female investors is quite similar, with 12%.
*
*
* Data unavailable
0% 10% 20% 30% 40% 50% 60% 70% 80% 90% 100%
Donation-based Crowdfunding 2016
Donation-based Crowdfunding 2013-2015
Reward-crowdfunding 2016
Reward-crowdfunding 2013-2015
Peer-to-Peer Consumer Lending 2016
Peer-to-Peer Consumer Lending 2013-2015
Peer-to-Peer Property Lending 2016
Peer-to-Peer Property Lending 2013-2015
Peer-to-Peer Business Lending 2016
Peer-to-Peer Business Lending 2013-2015
Real Estate Crowdfunding 2016
Real Estate Crowdfunding 2013-2015
Equity Crowdfunding 2016
Equity Crowdfunding 2013-2015
49%
56% 44%
47%53%
54%46%
74%26%
30% 70%
75%25%
84%
77%23%
34% 66%
80%
78%
81%
76%24%
19%
22%
51%
Female Male
Figure 29: Percentage of Female Funders (2013-2015 vs 2016)
EMBARGOED UNTIL 00:00 FRI 8 December 2017
31Total Size & Growth
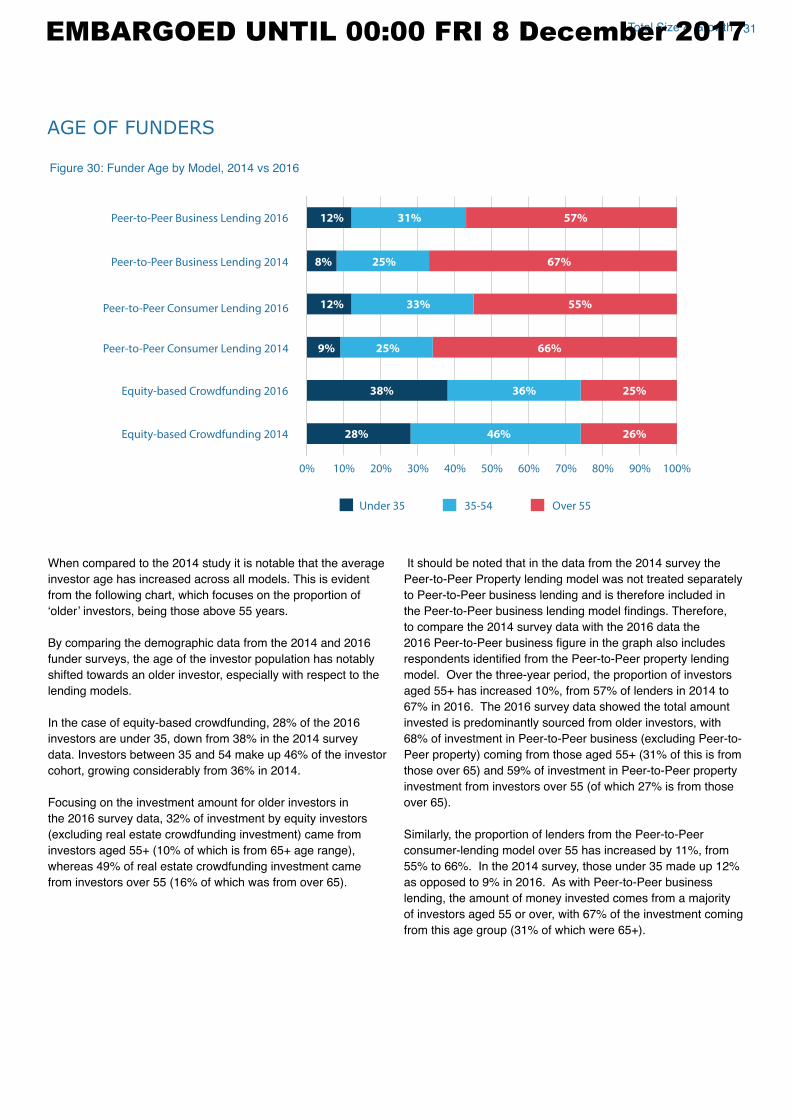
AGE OF FUNDERS
0% 10% 20% 30% 40% 50% 60% 70% 80% 90% 100%
Peer-to-Peer Business Lending 2016
Peer-to-Peer Business Lending 2014
Peer-to-Peer Consumer Lending 2016
Peer-to-Peer Consumer Lending 2014
Equity-based Crowdfunding 2016
Equity-based Crowdfunding 2014
Under 35 Over 5535-54
12%
8% 25% 67%
55%33%12%
9% 25% 66%
25%36%38%
28% 46% 26%
31% 57%
When compared to the 2014 study it is notable that the average
investor age has increased across all models. This is evident
from the following chart, which focuses on the proportion of
‘older’ investors, being those above 55 years.
By comparing the demographic data from the 2014 and 2016
funder surveys, the age of the investor population has notably
shifted towards an older investor, especially with respect to the
lending models.
In the case of equity-based crowdfunding, 28% of the 2016
investors are under 35, down from 38% in the 2014 survey
data. Investors between 35 and 54 make up 46% of the investor
cohort, growing considerably from 36% in 2014.
Focusing on the investment amount for older investors in
the 2016 survey data, 32% of investment by equity investors
(excluding real estate crowdfunding investment) came from
investors aged 55+ (10% of which is from 65+ age range),
whereas 49% of real estate crowdfunding investment came
from investors over 55 (16% of which was from over 65).
It should be noted that in the data from the 2014 survey the
Peer-to-Peer Property lending model was not treated separately
to Peer-to-Peer business lending and is therefore included in
the Peer-to-Peer business lending model findings. Therefore, to compare the 2014 survey data with the 2016 data the
2016 Peer-to-Peer business figure in the graph also includes respondents identified from the Peer-to-Peer property lending model. Over the three-year period, the proportion of investors
aged 55+ has increased 10%, from 57% of lenders in 2014 to
67% in 2016. The 2016 survey data showed the total amount
invested is predominantly sourced from older investors, with
68% of investment in Peer-to-Peer business (excluding Peer-to-
Peer property) coming from those aged 55+ (31% of this is from
those over 65) and 59% of investment in Peer-to-Peer property
investment from investors over 55 (of which 27% is from those
over 65).
Similarly, the proportion of lenders from the Peer-to-Peer
consumer-lending model over 55 has increased by 11%, from
55% to 66%. In the 2014 survey, those under 35 made up 12%
as opposed to 9% in 2016. As with Peer-to-Peer business
lending, the amount of money invested comes from a majority
of investors aged 55 or over, with 67% of the investment coming
from this age group (31% of which were 65+).
Figure 30: Funder Age by Model, 2014 vs 2016
EMBARGOED UNTIL 00:00 FRI 8 December 2017
32 The 4th Annual UK Alternative Finance Industry Report
FUNDS DERIVING FROM RETIRED INVESTORS
Analysing the proportion of total investment by age band and
‘retired’ status demonstrates that a significant proportion of platform funding comes from this group; more than half of retiree funding comes from this age bracket in the case of P2P
Property lenders (61%) and P2P Business lenders (56%),
while 43% come from this cohort in terms of P2P Consumer
Lending. It is only Equity-based Crowdfunding that derives a
smaller proportion of finance from this cohort (18%). Ultimately, not only is the proportion on retiree aged 55+ participating
in alternative finance increasing, they too are contributing significant overall investment towards platform volumes.
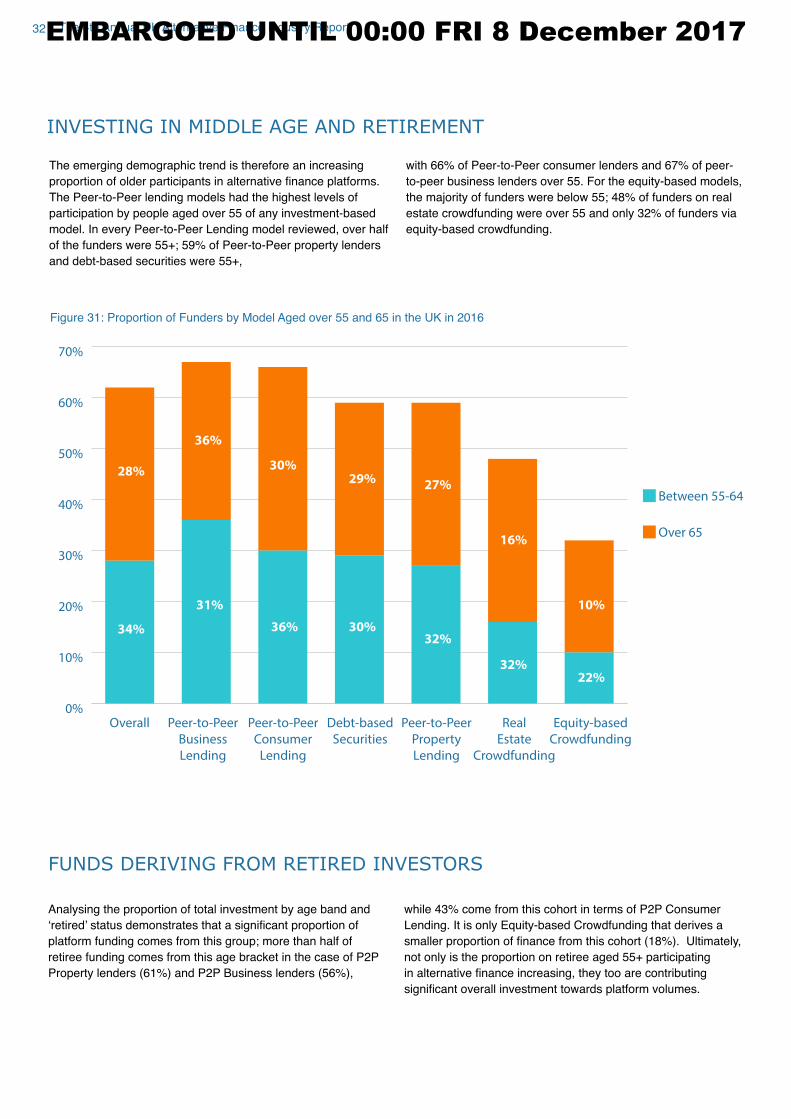
INVESTING IN MIDDLE AGE AND RETIREMENT
The emerging demographic trend is therefore an increasing
proportion of older participants in alternative finance platforms. The Peer-to-Peer lending models had the highest levels of
participation by people aged over 55 of any investment-based
model. In every Peer-to-Peer Lending model reviewed, over half
of the funders were 55+; 59% of Peer-to-Peer property lenders and debt-based securities were 55+,
with 66% of Peer-to-Peer consumer lenders and 67% of peer-
to-peer business lenders over 55. For the equity-based models,
the majority of funders were below 55; 48% of funders on real estate crowdfunding were over 55 and only 32% of funders via
equity-based crowdfunding.
0%
10%
20%
30%
40%
50%
60%
70%
34%
36%
31%
30%
36%
29%27%
32%
32%
16%
10%
22%
30%
28%
Overall
Between 55-64
Over 65
Peer-to-Peer
Business
Lending
Peer-to-Peer
Consumer
Lending
Peer-to-Peer
Property
Lending
Real
Estate
Crowdfunding
Equity-based
Crowdfunding
Debt-based
Securities
Figure 31: Proportion of Funders by Model Aged over 55 and 65 in the UK in 2016
EMBARGOED UNTIL 00:00 FRI 8 December 2017
33Total Size & Growth
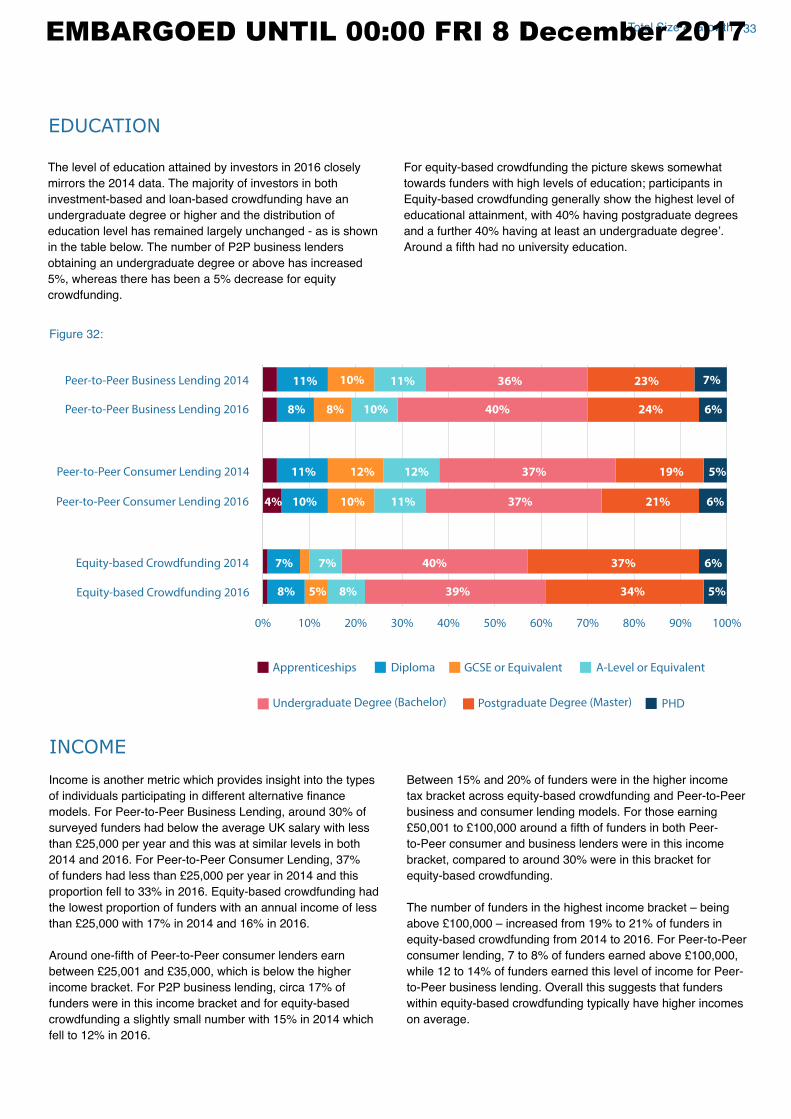
EDUCATION
The level of education attained by investors in 2016 closely
mirrors the 2014 data. The majority of investors in both
investment-based and loan-based crowdfunding have an
undergraduate degree or higher and the distribution of
education level has remained largely unchanged - as is shown
in the table below. The number of P2P business lenders
obtaining an undergraduate degree or above has increased
5%, whereas there has been a 5% decrease for equity
crowdfunding.
For equity-based crowdfunding the picture skews somewhat
towards funders with high levels of education; participants in Equity-based crowdfunding generally show the highest level of
educational attainment, with 40% having postgraduate degrees
and a further 40% having at least an undergraduate degree’. Around a fifth had no university education.
0% 10% 20% 30% 40% 50% 60% 70% 80% 90% 100%
Peer-to-Peer Business Lending 2014
Peer-to-Peer Business Lending 2016
Peer-to-Peer Consumer Lending 2014
Equity-based Crowdfunding 2014
Equity-based Crowdfunding 2016
Peer-to-Peer Consumer Lending 2016
7% 7% 40% 37%
34%39%8%8%
8%
37%
10% 40% 24%
7%10%11% 11% 36% 23%
21%11%10%
12% 37%
8%
5%
6%4%
6%
5%5%
19%
10%
6%
11% 12%
Apprenticeships Diploma GCSE or Equivalent A-Level or Equivalent
Undergraduate Degree (Bachelor) PHDPostgraduate Degree (Master)
Figure 32:
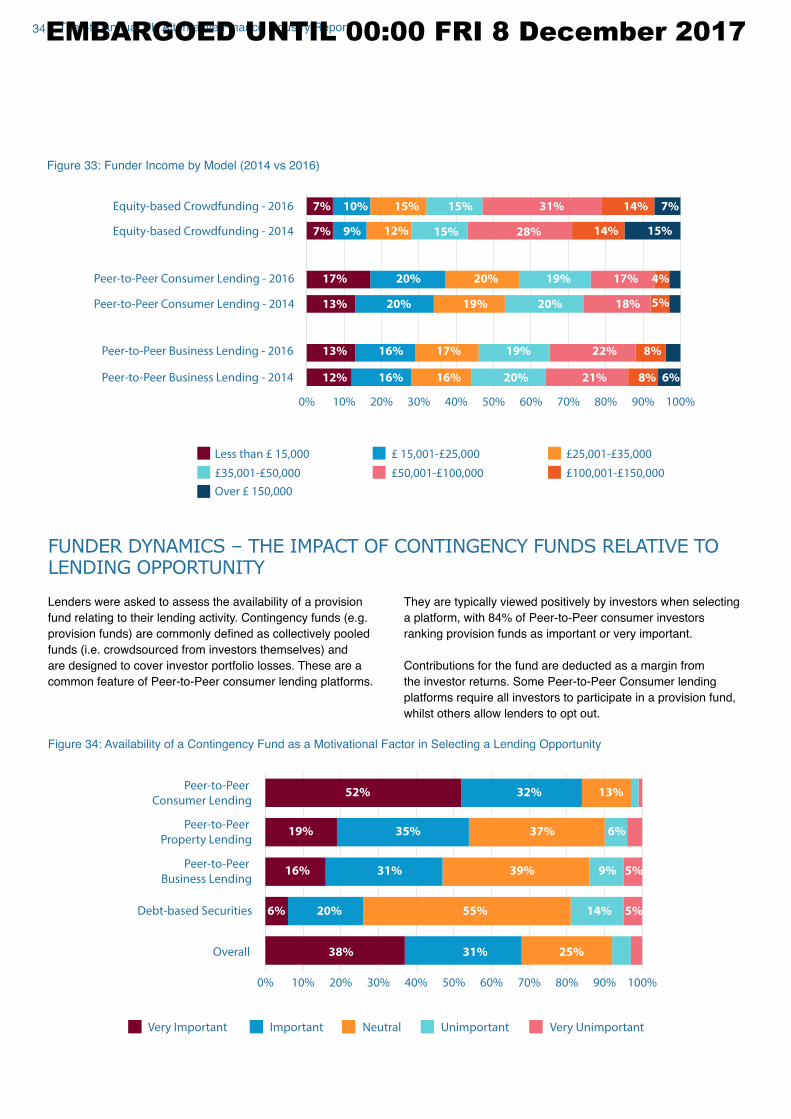
INCOME
Income is another metric which provides insight into the types
of individuals participating in different alternative finance models. For Peer-to-Peer Business Lending, around 30% of
surveyed funders had below the average UK salary with less
than £25,000 per year and this was at similar levels in both 2014 and 2016. For Peer-to-Peer Consumer Lending, 37%
of funders had less than £25,000 per year in 2014 and this proportion fell to 33% in 2016. Equity-based crowdfunding had
the lowest proportion of funders with an annual income of less
than £25,000 with 17% in 2014 and 16% in 2016.
Around one-fifth of Peer-to-Peer consumer lenders earn between £25,001 and £35,000, which is below the higher income bracket. For P2P business lending, circa 17% of
funders were in this income bracket and for equity-based
crowdfunding a slightly small number with 15% in 2014 which
fell to 12% in 2016.
Between 15% and 20% of funders were in the higher income
tax bracket across equity-based crowdfunding and Peer-to-Peer
business and consumer lending models. For those earning
£50,001 to £100,000 around a fifth of funders in both Peer-to-Peer consumer and business lenders were in this income
bracket, compared to around 30% were in this bracket for
equity-based crowdfunding.
The number of funders in the highest income bracket – being
above £100,000 – increased from 19% to 21% of funders in equity-based crowdfunding from 2014 to 2016. For Peer-to-Peer
consumer lending, 7 to 8% of funders earned above £100,000, while 12 to 14% of funders earned this level of income for Peer-
to-Peer business lending. Overall this suggests that funders
within equity-based crowdfunding typically have higher incomes
on average.
EMBARGOED UNTIL 00:00 FRI 8 December 2017
34 The 4th Annual UK Alternative Finance Industry Report
0% 10% 20% 30% 40% 50% 60% 70% 80% 90% 100%
Equity-based Crowdfunding - 2016
Less than £ 15,000 £ 15,001-£25,000 £25,001-£35,000
£35,001-£50,000 £50,001-£100,000 £100,001-£150,000
Over £ 150,000
Equity-based Crowdfunding - 2014
Peer-to-Peer Consumer Lending - 2016
Peer-to-Peer Consumer Lending - 2014
Peer-to-Peer Business Lending - 2016
Peer-to-Peer Business Lending - 2014
7%
7%
13%
17% 20% 20% 19% 17%
21% 8% 6%20%16%16%12%
13% 16% 17% 19% 22% 8%
20% 19% 20% 18% 5%
4%
10% 15% 15% 31% 14% 7%
9% 12% 15% 28% 14% 15%
Figure 33: Funder Income by Model (2014 vs 2016)
FUNDER DYNAMICS – THE IMPACT OF CONTINGENCY FUNDS RELATIVE TO LENDING OPPORTUNITY
Lenders were asked to assess the availability of a provision
fund relating to their lending activity. Contingency funds (e.g.
provision funds) are commonly defined as collectively pooled funds (i.e. crowdsourced from investors themselves) and
are designed to cover investor portfolio losses. These are a
common feature of Peer-to-Peer consumer lending platforms.
They are typically viewed positively by investors when selecting
a platform, with 84% of Peer-to-Peer consumer investors
ranking provision funds as important or very important.
Contributions for the fund are deducted as a margin from
the investor returns. Some Peer-to-Peer Consumer lending
platforms require all investors to participate in a provision fund,
whilst others allow lenders to opt out.
75%25%
80%
78%
0% 10% 20% 30% 40% 50% 60% 70% 80% 90% 100%
Peer-to-Peer
Consumer Lending
Peer-to-Peer
Property Lending
Peer-to-Peer
Business Lending
Debt-based Securities
Overall
Very Important Important Unimportant Very UnimportantNeutral
52%
19% 35% 37%
39%31%16% 9% 5%
5%14%55%20%6%
38% 31% 25%
32% 13%
6%
Figure 34: Availability of a Contingency Fund as a Motivational Factor in Selecting a Lending Opportunity
EMBARGOED UNTIL 00:00 FRI 8 December 2017
35Total Size & Growth
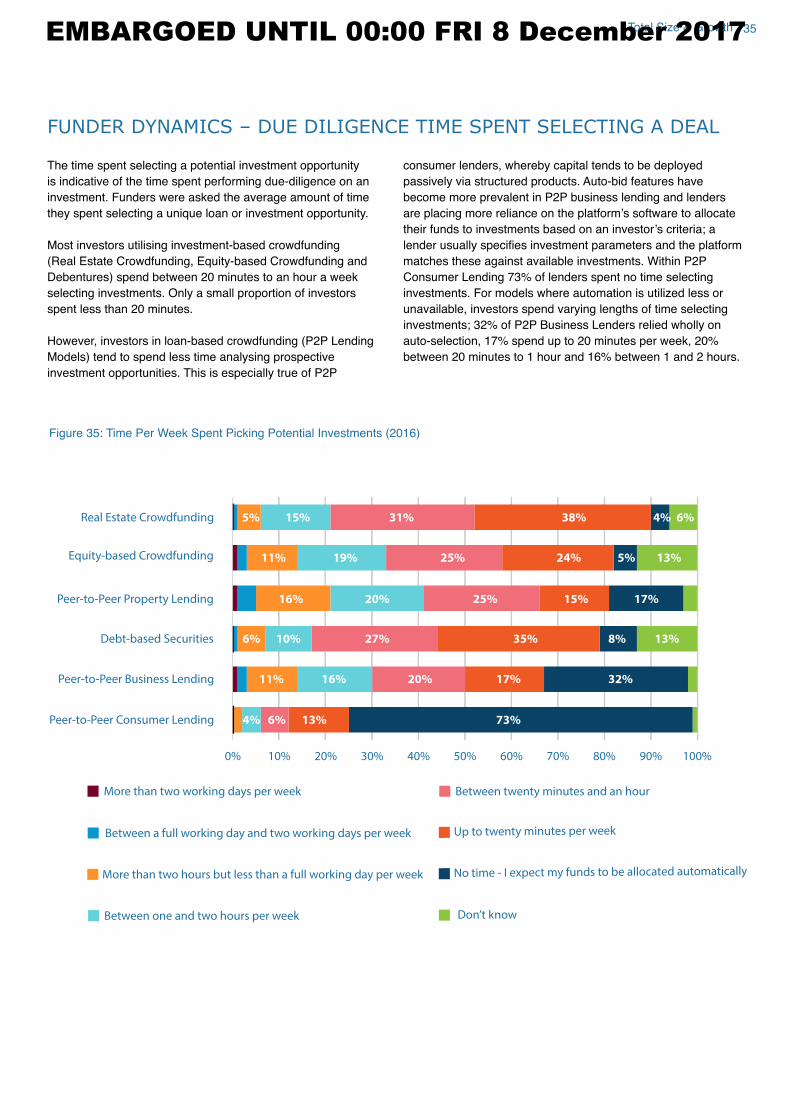
FUNDER DYNAMICS – DUE DILIGENCE TIME SPENT SELECTING A DEAL
The time spent selecting a potential investment opportunity
is indicative of the time spent performing due-diligence on an
investment. Funders were asked the average amount of time
they spent selecting a unique loan or investment opportunity.
Most investors utilising investment-based crowdfunding
(Real Estate Crowdfunding, Equity-based Crowdfunding and
Debentures) spend between 20 minutes to an hour a week
selecting investments. Only a small proportion of investors
spent less than 20 minutes.
However, investors in loan-based crowdfunding (P2P Lending
Models) tend to spend less time analysing prospective
investment opportunities. This is especially true of P2P
consumer lenders, whereby capital tends to be deployed
passively via structured products. Auto-bid features have
become more prevalent in P2P business lending and lenders
are placing more reliance on the platform’s software to allocate their funds to investments based on an investor’s criteria; a lender usually specifies investment parameters and the platform matches these against available investments. Within P2P
Consumer Lending 73% of lenders spent no time selecting
investments. For models where automation is utilized less or
unavailable, investors spend varying lengths of time selecting
investments; 32% of P2P Business Lenders relied wholly on auto-selection, 17% spend up to 20 minutes per week, 20%
between 20 minutes to 1 hour and 16% between 1 and 2 hours.
75%25%
80%
78%
0% 10% 20% 30% 40% 50% 60% 70% 80% 90% 100%
Real Estate Crowdfunding
Equity-based Crowdfunding
Peer-to-Peer Property Lending
Debt-based Securities
Peer-to-Peer Business Lending
Peer-to-Peer Consumer Lending
5%
6%
5%
15%
15% 17%
17% 32%
11%
11% 16%
16% 20%
20%
10% 27% 35% 8% 13%
19% 25%
25%
24%
5%
4% 6% 13% 73%
31% 38% 6%4%
13%
Between a full working day and two working days per week
More than two working days per week
More than two hours but less than a full working day per week
Between one and two hours per week
Up to twenty minutes per week
Don’t know
Between twenty minutes and an hour
No time - I expect my funds to be allocated automatically
Figure 35: Time Per Week Spent Picking Potential Investments (2016)
EMBARGOED UNTIL 00:00 FRI 8 December 2017
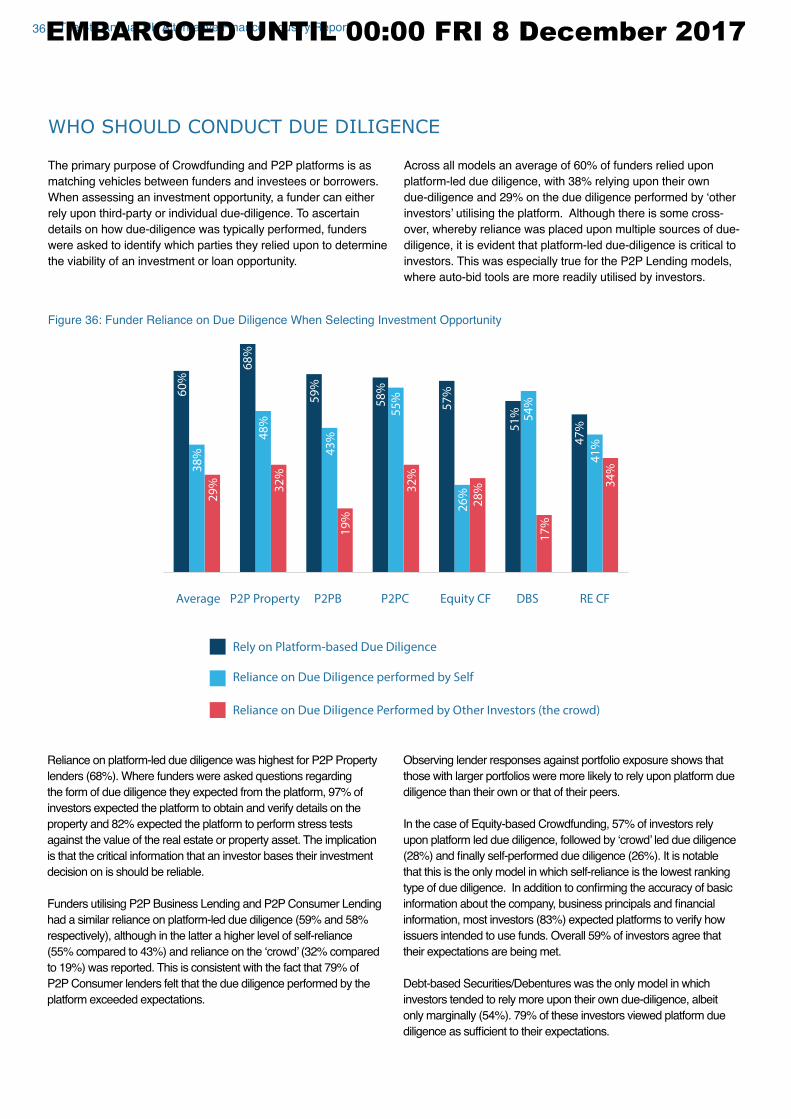
36 The 4th Annual UK Alternative Finance Industry Report
WHO SHOULD CONDUCT DUE DILIGENCE
The primary purpose of Crowdfunding and P2P platforms is as
matching vehicles between funders and investees or borrowers.
When assessing an investment opportunity, a funder can either
rely upon third-party or individual due-diligence. To ascertain
details on how due-diligence was typically performed, funders
were asked to identify which parties they relied upon to determine
the viability of an investment or loan opportunity.
Across all models an average of 60% of funders relied upon
platform-led due diligence, with 38% relying upon their own
due-diligence and 29% on the due diligence performed by ‘other investors’ utilising the platform. Although there is some cross-over, whereby reliance was placed upon multiple sources of due-
diligence, it is evident that platform-led due-diligence is critical to
investors. This was especially true for the P2P Lending models,
where auto-bid tools are more readily utilised by investors.
Average
60
%3
8%
29
%
68
%
48
%
32
%
59
%
43
%1
9%
58
%5
5%
32
%
57
%
26
%2
8%
51
% 54
%
17
%
47
%
41
%3
4%
Rely on Platform-based Due Diligence
Reliance on Due Diligence performed by Self
Reliance on Due Diligence Performed by Other Investors (the crowd)
P2P Property P2PB P2PC Equity CF DBS RE CF
Figure 36: Funder Reliance on Due Diligence When Selecting Investment Opportunity
Reliance on platform-led due diligence was highest for P2P Property
lenders (68%). Where funders were asked questions regarding
the form of due diligence they expected from the platform, 97% of
investors expected the platform to obtain and verify details on the
property and 82% expected the platform to perform stress tests
against the value of the real estate or property asset. The implication
is that the critical information that an investor bases their investment
decision on is should be reliable.
Funders utilising P2P Business Lending and P2P Consumer Lending
had a similar reliance on platform-led due diligence (59% and 58%
respectively), although in the latter a higher level of self-reliance
(55% compared to 43%) and reliance on the ‘crowd’ (32% compared to 19%) was reported. This is consistent with the fact that 79% of
P2P Consumer lenders felt that the due diligence performed by the
platform exceeded expectations.
Observing lender responses against portfolio exposure shows that
those with larger portfolios were more likely to rely upon platform due
diligence than their own or that of their peers.
In the case of Equity-based Crowdfunding, 57% of investors rely
upon platform led due diligence, followed by ‘crowd’ led due diligence (28%) and finally self-performed due diligence (26%). It is notable that this is the only model in which self-reliance is the lowest ranking
type of due diligence. In addition to confirming the accuracy of basic information about the company, business principals and financial information, most investors (83%) expected platforms to verify how
issuers intended to use funds. Overall 59% of investors agree that
their expectations are being met.
Debt-based Securities/Debentures was the only model in which
investors tended to rely more upon their own due-diligence, albeit
only marginally (54%). 79% of these investors viewed platform due
diligence as sufficient to their expectations.
EMBARGOED UNTIL 00:00 FRI 8 December 2017
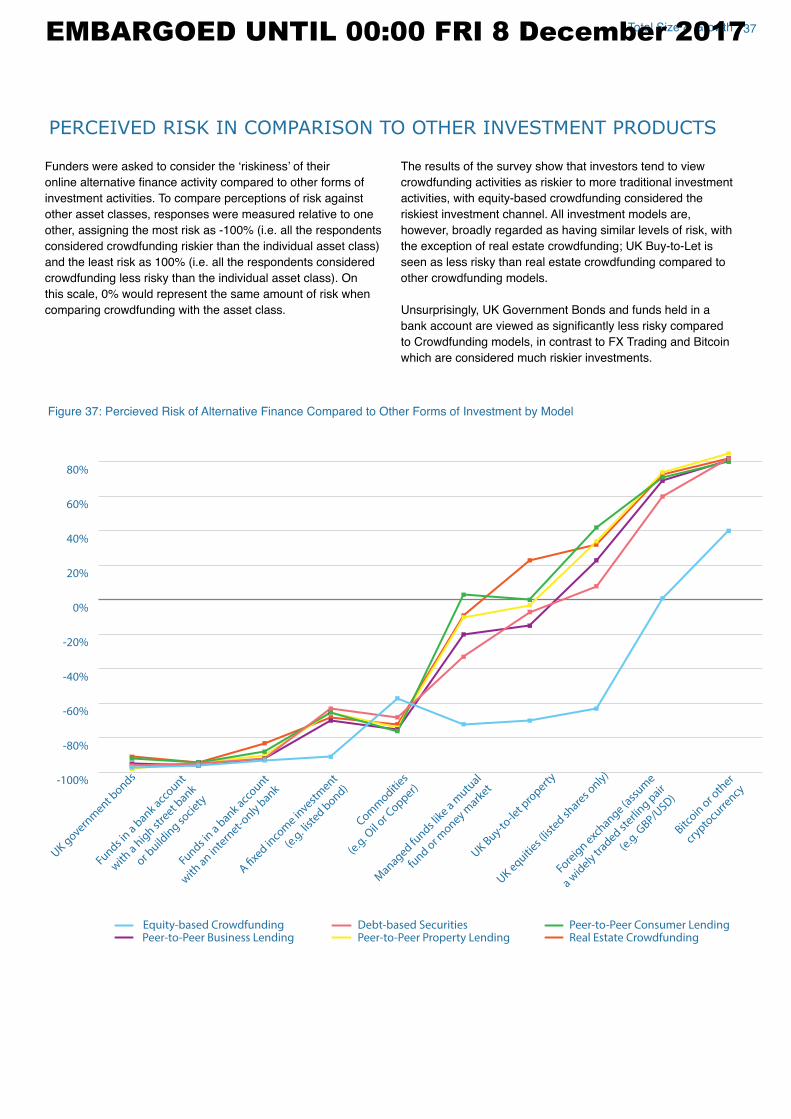
37Total Size & Growth
PERCEIVED RISK IN COMPARISON TO OTHER INVESTMENT PRODUCTS
Funders were asked to consider the ‘riskiness’ of their online alternative finance activity compared to other forms of investment activities. To compare perceptions of risk against
other asset classes, responses were measured relative to one
other, assigning the most risk as -100% (i.e. all the respondents
considered crowdfunding riskier than the individual asset class)
and the least risk as 100% (i.e. all the respondents considered
crowdfunding less risky than the individual asset class). On
this scale, 0% would represent the same amount of risk when
comparing crowdfunding with the asset class.
The results of the survey show that investors tend to view
crowdfunding activities as riskier to more traditional investment
activities, with equity-based crowdfunding considered the
riskiest investment channel. All investment models are,
however, broadly regarded as having similar levels of risk, with
the exception of real estate crowdfunding; UK Buy-to-Let is seen as less risky than real estate crowdfunding compared to
other crowdfunding models.
Unsurprisingly, UK Government Bonds and funds held in a
bank account are viewed as significantly less risky compared to Crowdfunding models, in contrast to FX Trading and Bitcoin
which are considered much riskier investments.
-100%
-80%
-60%
-40%
-20%
0%
20%
40%
60%
80%
UK govern
ment b
onds
Funds in a
bank a
ccount
with
a h
igh st
reet b
ank
or build
ing so
ciety
Funds in a
bank a
ccount
with
an in
tern
et-only
bank
A fixe
d inco
me in
vestm
ent
(e.g
. list
ed bond)
Comm
odities
(e.g
. Oil
or Copper)
Managed fu
nds lik
e a m
utual
fund o
r money m
arket
UK Buy-to
-let p
ropert
y
UK equiti
es (lis
ted sh
ares o
nly)
Foreig
n exc
hange (ass
ume
a wid
ely tr
aded sterli
ng pair
(e.g
. GBP/U
SD)
Bitcoin
or o
ther
crypto
curre
ncy
Peer-to-Peer Business Lending Peer-to-Peer Property Lending Real Estate CrowdfundingDebt-based Securities Peer-to-Peer Consumer LendingEquity-based Crowdfunding
Figure 37: Percieved Risk of Alternative Finance Compared to Other Forms of Investment by Model
EMBARGOED UNTIL 00:00 FRI 8 December 2017
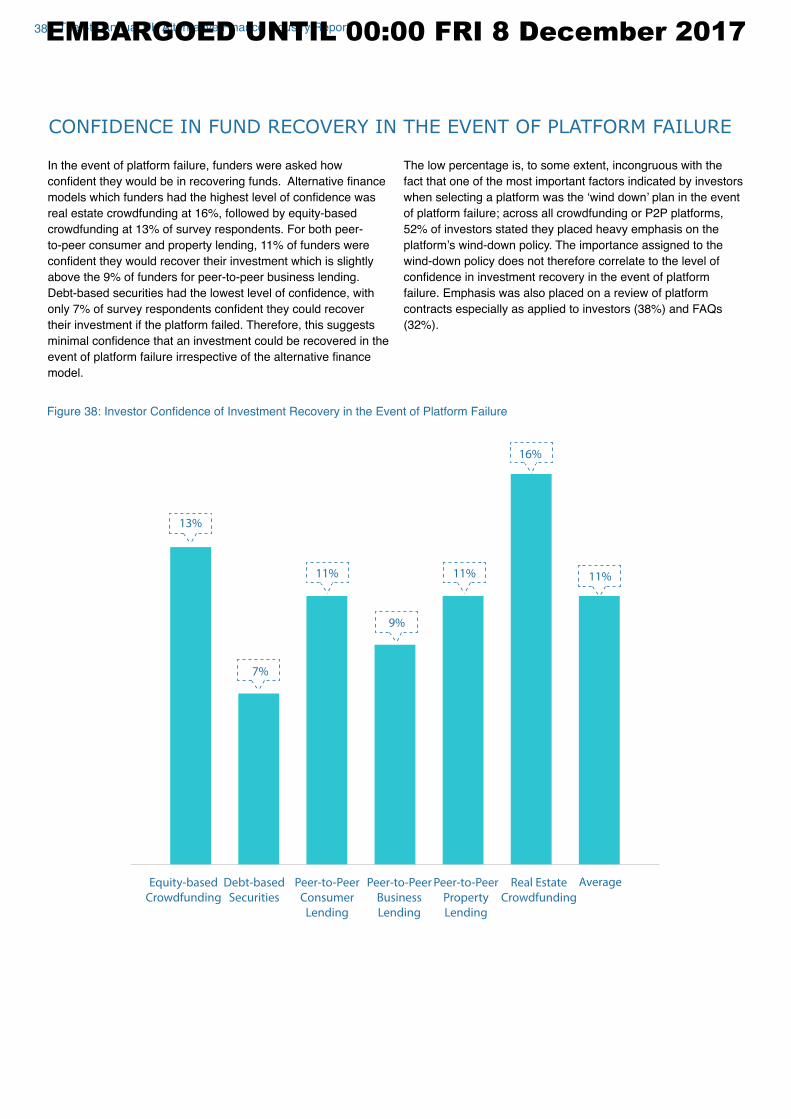
The 4th Annual UK Alternative Finance Industry Report
CONFIDENCE IN FUND RECOVERY IN THE EVENT OF PLATFORM FAILURE
In the event of platform failure, funders were asked how
confident they would be in recovering funds. Alternative finance models which funders had the highest level of confidence was real estate crowdfunding at 16%, followed by equity-based
crowdfunding at 13% of survey respondents. For both peer-
to-peer consumer and property lending, 11% of funders were
confident they would recover their investment which is slightly above the 9% of funders for peer-to-peer business lending.
Debt-based securities had the lowest level of confidence, with only 7% of survey respondents confident they could recover their investment if the platform failed. Therefore, this suggests
minimal confidence that an investment could be recovered in the event of platform failure irrespective of the alternative finance model.
The low percentage is, to some extent, incongruous with the
fact that one of the most important factors indicated by investors
when selecting a platform was the ‘wind down’ plan in the event of platform failure; across all crowdfunding or P2P platforms, 52% of investors stated they placed heavy emphasis on the
platform’s wind-down policy. The importance assigned to the wind-down policy does not therefore correlate to the level of
confidence in investment recovery in the event of platform failure. Emphasis was also placed on a review of platform
contracts especially as applied to investors (38%) and FAQs
(32%).
13%
7%
9%
11% 11%
16%
11%
Equity-based
Crowdfunding
Real Estate
Crowdfunding
Debt-based
Securities
Peer-to-Peer
Consumer
Lending
Peer-to-Peer
Business
Lending
Peer-to-Peer
Property
Lending
Average
Figure 38: Investor Confidence of Investment Recovery in the Event of Platform Failure
38EMBARGOED UNTIL 00:00 FRI 8 December 2017
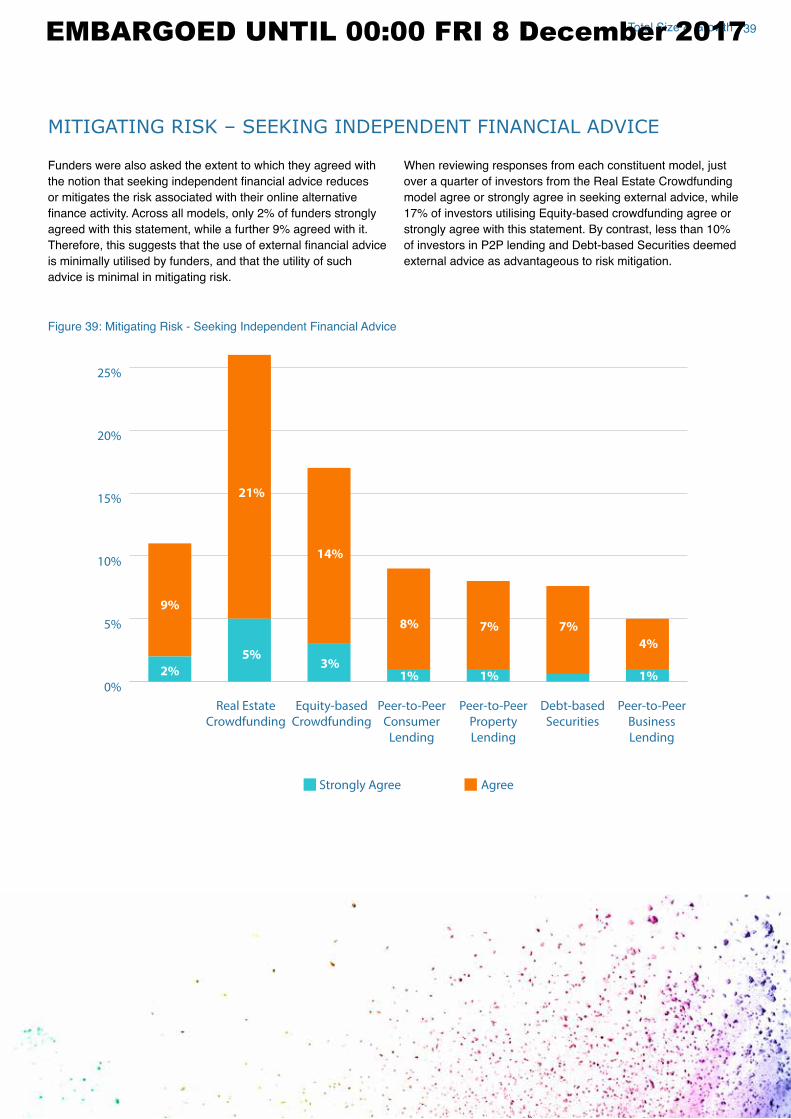
39Total Size & Growth
MITIGATING RISK – SEEKING INDEPENDENT FINANCIAL ADVICE
Funders were also asked the extent to which they agreed with
the notion that seeking independent financial advice reduces or mitigates the risk associated with their online alternative
finance activity. Across all models, only 2% of funders strongly agreed with this statement, while a further 9% agreed with it.
Therefore, this suggests that the use of external financial advice is minimally utilised by funders, and that the utility of such
advice is minimal in mitigating risk.
When reviewing responses from each constituent model, just
over a quarter of investors from the Real Estate Crowdfunding
model agree or strongly agree in seeking external advice, while
17% of investors utilising Equity-based crowdfunding agree or
strongly agree with this statement. By contrast, less than 10%
of investors in P2P lending and Debt-based Securities deemed
external advice as advantageous to risk mitigation.
0%
5%
10%
15%
20%
25%
Strongly Agree Agree
Debt-based
Securities
Peer-to-Peer
Business
Lending
Peer-to-Peer
Property
Lending
Peer-to-Peer
Consumer
Lending
Equity-based
Crowdfunding
Real Estate
Crowdfunding
9%
2%
5%
1% 1% 1%
7%8% 7%
4%
3%
21%
14%
Figure 39: Mitigating Risk - Seeking Independent Financial Advice
EMBARGOED UNTIL 00:00 FRI 8 December 2017
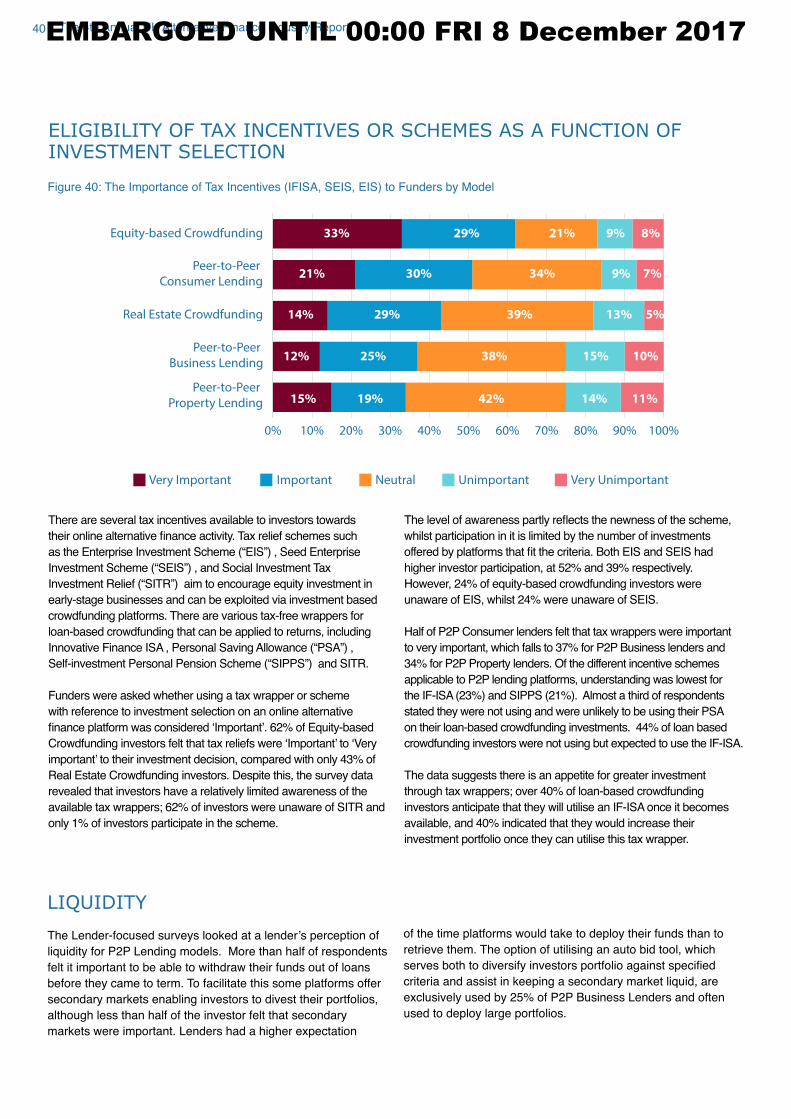
40 The 4th Annual UK Alternative Finance Industry Report
ELIGIBILITY OF TAX INCENTIVES OR SCHEMES AS A FUNCTION OF INVESTMENT SELECTION
75%25%
80%
78%
0% 10% 20% 30% 40% 50% 60% 70% 80% 90% 100%
Equity-based Crowdfunding
Very Important Very UnimportantImportant UnimportantNeutral
Peer-to-Peer
Consumer Lending
Real Estate Crowdfunding
Peer-to-Peer
Business Lending
Peer-to-Peer
Property Lending
33%
21% 30% 34%
39%29%14% 13% 5%
10%15%38%25%12%
15% 19% 42%
29% 21% 9%
7%
14% 11%
8%
9%
There are several tax incentives available to investors towards
their online alternative finance activity. Tax relief schemes such as the Enterprise Investment Scheme (“EIS”) , Seed Enterprise
Investment Scheme (“SEIS”) , and Social Investment Tax
Investment Relief (“SITR”) aim to encourage equity investment in
early-stage businesses and can be exploited via investment based
crowdfunding platforms. There are various tax-free wrappers for
loan-based crowdfunding that can be applied to returns, including
Innovative Finance ISA , Personal Saving Allowance (“PSA”) ,
Self-investment Personal Pension Scheme (“SIPPS”) and SITR.
Funders were asked whether using a tax wrapper or scheme
with reference to investment selection on an online alternative
finance platform was considered ‘Important’. 62% of Equity-based Crowdfunding investors felt that tax reliefs were ‘Important’ to ‘Very important’ to their investment decision, compared with only 43% of Real Estate Crowdfunding investors. Despite this, the survey data
revealed that investors have a relatively limited awareness of the
available tax wrappers; 62% of investors were unaware of SITR and only 1% of investors participate in the scheme.
The level of awareness partly reflects the newness of the scheme, whilst participation in it is limited by the number of investments
offered by platforms that fit the criteria. Both EIS and SEIS had higher investor participation, at 52% and 39% respectively.
However, 24% of equity-based crowdfunding investors were
unaware of EIS, whilst 24% were unaware of SEIS.
Half of P2P Consumer lenders felt that tax wrappers were important
to very important, which falls to 37% for P2P Business lenders and
34% for P2P Property lenders. Of the different incentive schemes
applicable to P2P lending platforms, understanding was lowest for
the IF-ISA (23%) and SIPPS (21%). Almost a third of respondents
stated they were not using and were unlikely to be using their PSA
on their loan-based crowdfunding investments. 44% of loan based
crowdfunding investors were not using but expected to use the IF-ISA.
The data suggests there is an appetite for greater investment
through tax wrappers; over 40% of loan-based crowdfunding investors anticipate that they will utilise an IF-ISA once it becomes
available, and 40% indicated that they would increase their
investment portfolio once they can utilise this tax wrapper.
Figure 40: The Importance of Tax Incentives (IFISA, SEIS, EIS) to Funders by Model
LIQUIDITY
The Lender-focused surveys looked at a lender’s perception of liquidity for P2P Lending models. More than half of respondents
felt it important to be able to withdraw their funds out of loans
before they came to term. To facilitate this some platforms offer
secondary markets enabling investors to divest their portfolios,
although less than half of the investor felt that secondary
markets were important. Lenders had a higher expectation
of the time platforms would take to deploy their funds than to
retrieve them. The option of utilising an auto bid tool, which
serves both to diversify investors portfolio against specified criteria and assist in keeping a secondary market liquid, are
exclusively used by 25% of P2P Business Lenders and often
used to deploy large portfolios.
EMBARGOED UNTIL 00:00 FRI 8 December 2017
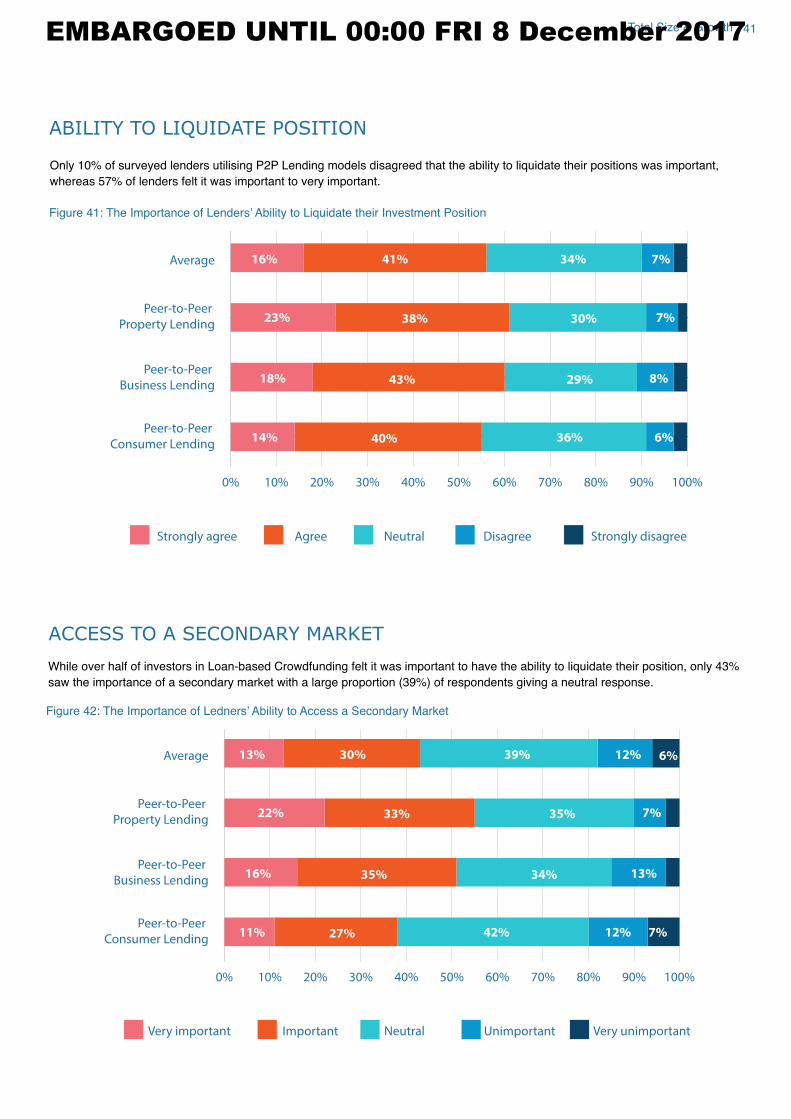
41Total Size & Growth
ABILITY TO LIQUIDATE POSITION
75%25%
80%
78%
0% 10% 20% 30% 40% 50% 60% 70% 80% 90% 100%
16%Average
Strongly agree Strongly disagreeAgree DisagreeNeutral
Peer-to-Peer
Consumer Lending
Peer-to-Peer
Property Lending
Peer-to-Peer
Business Lending
14%
23%
18% 43% 29%
36%
38% 30%
40%
41% 34% 7%
7%
8%
6%
Only 10% of surveyed lenders utilising P2P Lending models disagreed that the ability to liquidate their positions was important,
whereas 57% of lenders felt it was important to very important.
Figure 41: The Importance of Lenders’ Ability to Liquidate their Investment Position
75%25%
80%
78%
0% 10% 20% 30% 40% 50% 60% 70% 80% 90% 100%
13%Average
Very important Very unimportantImportant UnimportantNeutral
Peer-to-Peer
Consumer Lending
Peer-to-Peer
Property Lending
Peer-to-Peer
Business Lending
11%
22%
16% 35% 34%
42%
33% 35%
27%
30% 39% 12%
12%
7%
7%
13%
6%
ACCESS TO A SECONDARY MARKET
While over half of investors in Loan-based Crowdfunding felt it was important to have the ability to liquidate their position, only 43%
saw the importance of a secondary market with a large proportion (39%) of respondents giving a neutral response.
Figure 42: The Importance of Ledners’ Ability to Access a Secondary Market
EMBARGOED UNTIL 00:00 FRI 8 December 2017
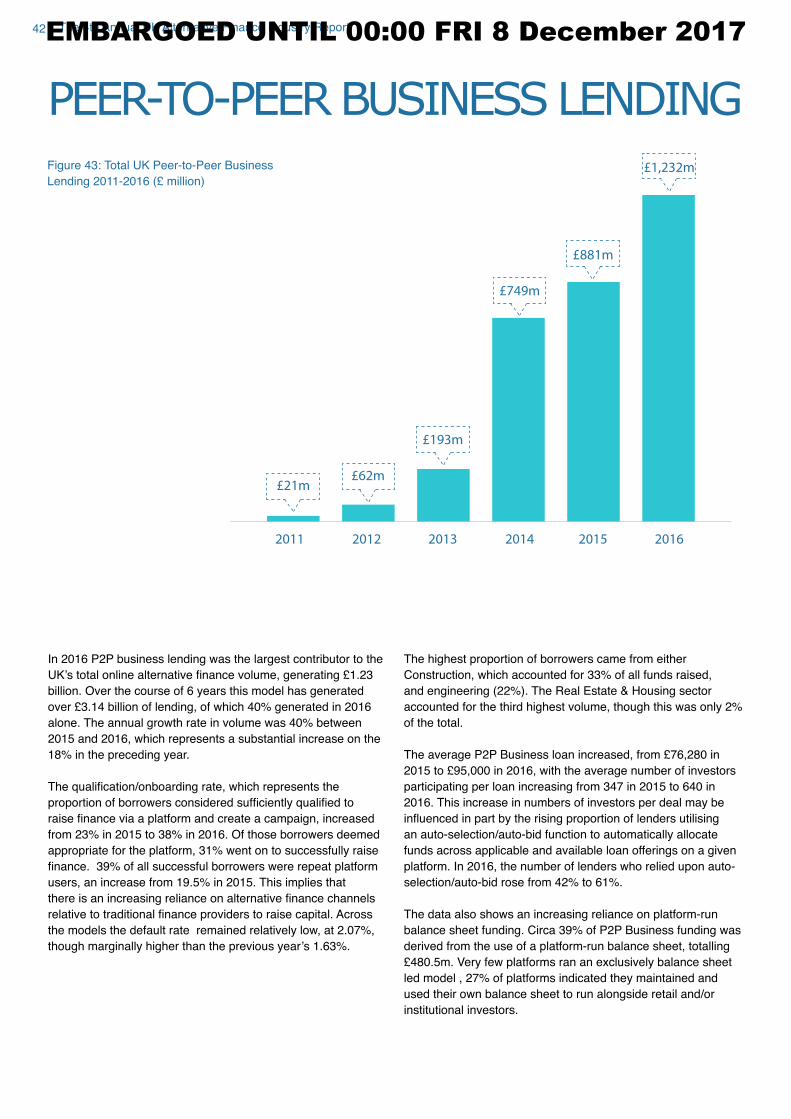
42 The 4th Annual UK Alternative Finance Industry Report
PEER-TO-PEER BUSINESS LENDING
2011
£21m£62m
£193m
£749m
£881m
£1,232m
2012 2013 2014 2015 2016
In 2016 P2P business lending was the largest contributor to the
UK’s total online alternative finance volume, generating £1.23 billion. Over the course of 6 years this model has generated
over £3.14 billion of lending, of which 40% generated in 2016 alone. The annual growth rate in volume was 40% between
2015 and 2016, which represents a substantial increase on the
18% in the preceding year.
The qualification/onboarding rate, which represents the proportion of borrowers considered sufficiently qualified to raise finance via a platform and create a campaign, increased from 23% in 2015 to 38% in 2016. Of those borrowers deemed
appropriate for the platform, 31% went on to successfully raise
finance. 39% of all successful borrowers were repeat platform users, an increase from 19.5% in 2015. This implies that
there is an increasing reliance on alternative finance channels relative to traditional finance providers to raise capital. Across the models the default rate remained relatively low, at 2.07%,
though marginally higher than the previous year’s 1.63%.
The highest proportion of borrowers came from either
Construction, which accounted for 33% of all funds raised,
and engineering (22%). The Real Estate & Housing sector
accounted for the third highest volume, though this was only 2%
of the total.
The average P2P Business loan increased, from £76,280 in 2015 to £95,000 in 2016, with the average number of investors participating per loan increasing from 347 in 2015 to 640 in
2016. This increase in numbers of investors per deal may be
influenced in part by the rising proportion of lenders utilising an auto-selection/auto-bid function to automatically allocate
funds across applicable and available loan offerings on a given
platform. In 2016, the number of lenders who relied upon auto-
selection/auto-bid rose from 42% to 61%.
The data also shows an increasing reliance on platform-run
balance sheet funding. Circa 39% of P2P Business funding was
derived from the use of a platform-run balance sheet, totalling
£480.5m. Very few platforms ran an exclusively balance sheet led model , 27% of platforms indicated they maintained and
used their own balance sheet to run alongside retail and/or
institutional investors.
Figure 43: Total UK Peer-to-Peer Business
Lending 2011-2016 (£ million)
EMBARGOED UNTIL 00:00 FRI 8 December 2017
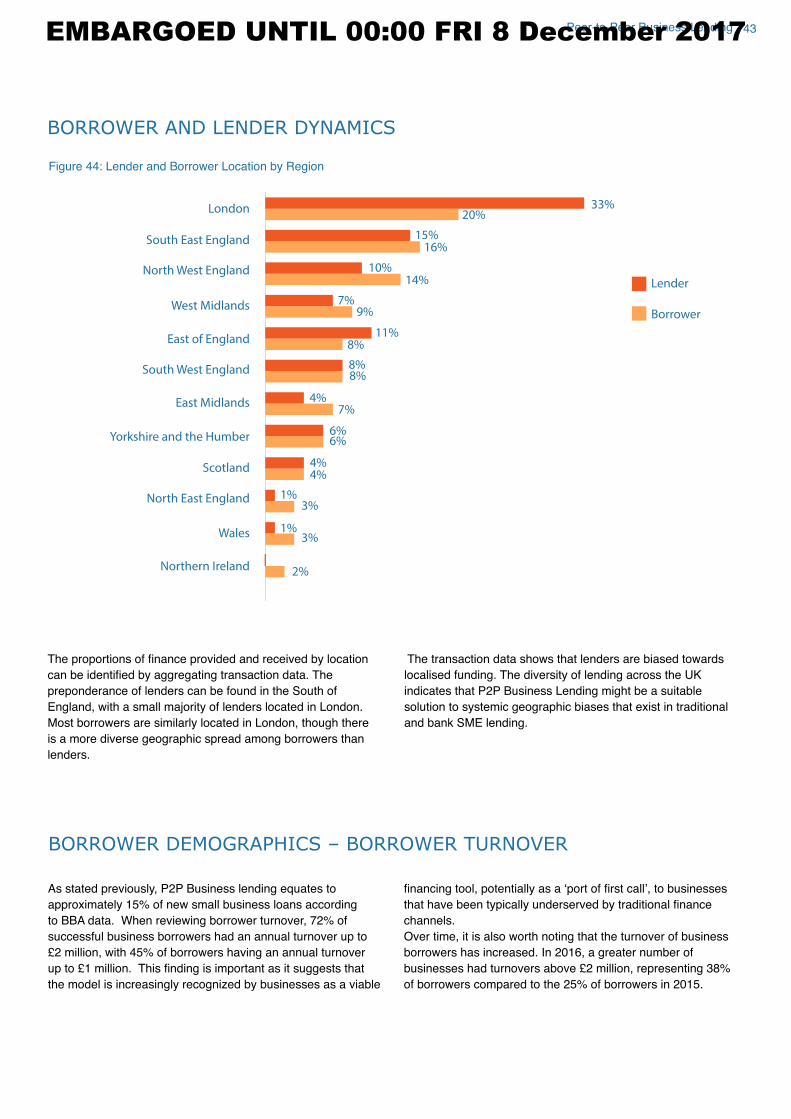
43Peer-to-Peer Business Lending
BORROWER AND LENDER DYNAMICS
The proportions of finance provided and received by location can be identified by aggregating transaction data. The preponderance of lenders can be found in the South of
England, with a small majority of lenders located in London.
Most borrowers are similarly located in London, though there
is a more diverse geographic spread among borrowers than
lenders.
The transaction data shows that lenders are biased towards
localised funding. The diversity of lending across the UK
indicates that P2P Business Lending might be a suitable
solution to systemic geographic biases that exist in traditional
and bank SME lending.
Yorkshire and the Humber
West Midlands
Wales
South West England
South East England
Scotland
Northern Ireland
North West England
North East England
London
East of England
East Midlands
6%6%
7%9%
8%8%
15%16%
4%4%
3%
3%
1%
1%
10%
20%33%
11%8%
4%7%
14% Lender
Borrower
2%
Figure 44: Lender and Borrower Location by Region
BORROWER DEMOGRAPHICS – BORROWER TURNOVER
As stated previously, P2P Business lending equates to
approximately 15% of new small business loans according
to BBA data. When reviewing borrower turnover, 72% of
successful business borrowers had an annual turnover up to
£2 million, with 45% of borrowers having an annual turnover up to £1 million. This finding is important as it suggests that the model is increasingly recognized by businesses as a viable
financing tool, potentially as a ‘port of first call’, to businesses that have been typically underserved by traditional finance channels.
Over time, it is also worth noting that the turnover of business
borrowers has increased. In 2016, a greater number of
businesses had turnovers above £2 million, representing 38% of borrowers compared to the 25% of borrowers in 2015.
EMBARGOED UNTIL 00:00 FRI 8 December 2017
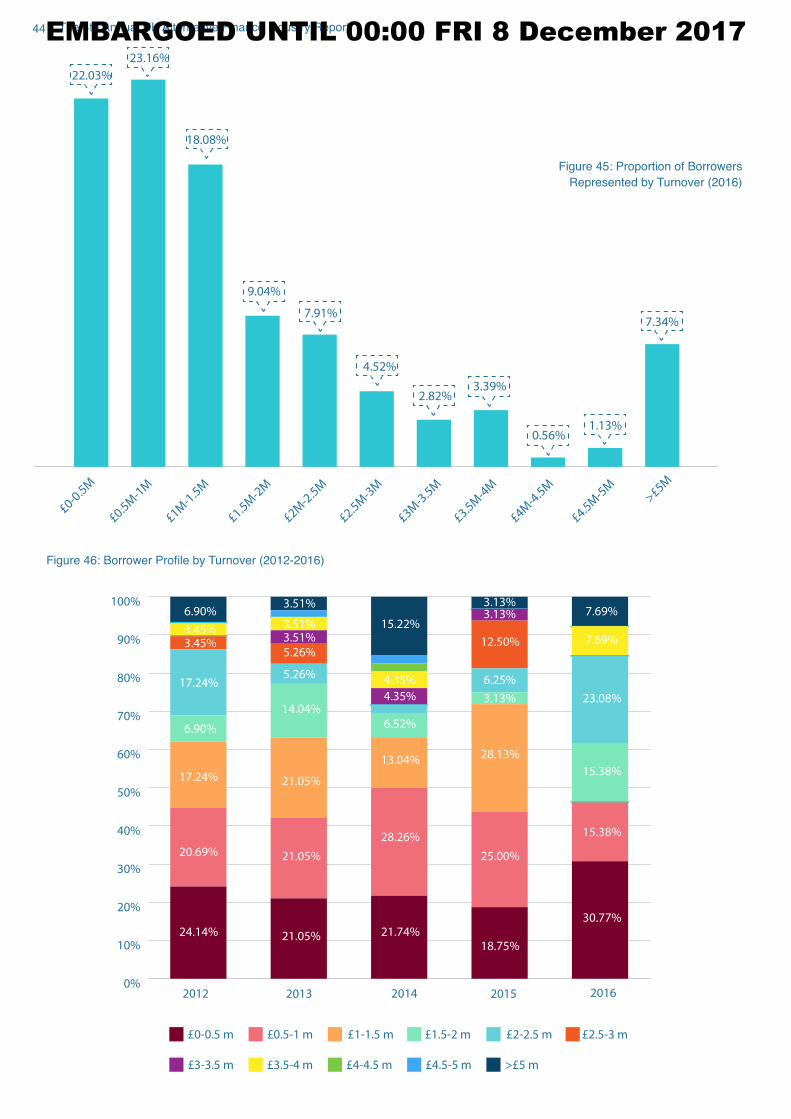
44 The 4th Annual UK Alternative Finance Industry Report
22.03%
23.16%
18.08%
9.04%
7.91%
4.52%
2.82%3.39%
0.56%1.13%
7.34%
£1M-1.5M
£0.5M-1M
£0-0.5M
£1.5M-2M
£2M-2.5M
£2.5M-3M
£3M-3.5M
£3.5M-4M
£4M-4.5M
£4.5M-5M
>£5M
Figure 45: Proportion of Borrowers
Represented by Turnover (2016)
0%
10%
20%
30%
40%
50%
60%
70%
80%
90%
100%
201420132012 2015 2016
24.14% 21.05%
21.05%
21.05%
14.04%
5.26%
5.26%
3.51%
3.51%
3.51%
15.22%
4.35%
4.35%
6.52%
13.04%
28.26%
21.74%
18.75%
30.77%
15.38%
15.38%
23.08%
7.69%
7.69%
25.00%
28.13%
3.13%
3.13%
3.13%
6.25%
12.50%
20.69%
17.24%
6.90%
17.24%
3.45%
3.45%
6.90%
£0-0.5 m £0.5-1 m £1-1.5 m £1.5-2 m £2-2.5 m £2.5-3 m
£3-3.5 m £3.5-4 m £4-4.5 m £4.5-5 m >£5 m
Figure 46: Borrower Profile by Turnover (2012-2016)
EMBARGOED UNTIL 00:00 FRI 8 December 2017
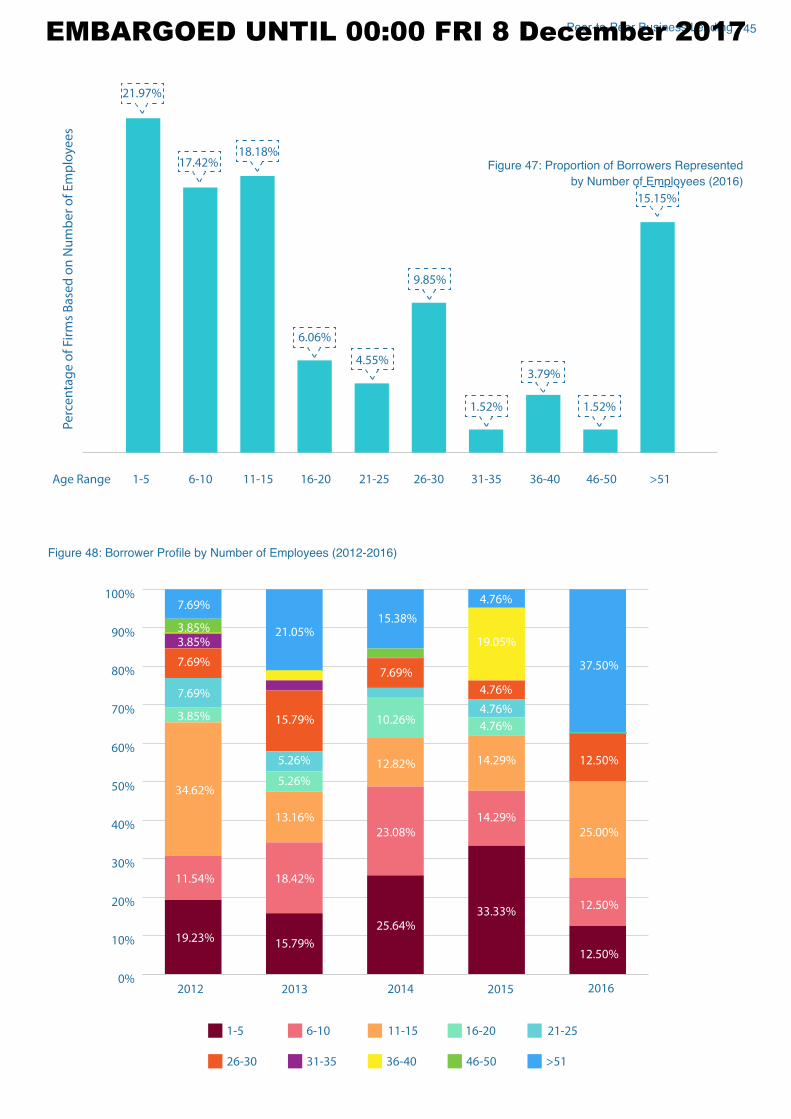
45Peer-to-Peer Business Lending
21.97%
17.42%18.18%
6.06%
4.55%
9.85%
1-5Age Range
Pe
rce
nta
ge
of
Firm
s B
ase
d o
n N
um
be
r o
f E
mp
loye
es
6-10 11-15 16-20 21-25 26-30 31-35 36-40 46-50 >51
1.52%
3.79%
1.52%
15.15%
0%
10%
20%
30%
40%
50%
60%
70%
80%
90%
100%
201420132012 2015 2016
1-5 6-10 11-15 16-20 21-25
26-30 31-35 36-40 46-50 >51
19.23%
11.54%
34.62%
3.85%
7.69%
7.69%
3.85%
3.85%
7.69%
21.05%
15.79%
5.26%
5.26%
13.16%
18.42%
15.79%
25.64%
23.08%
12.82%
10.26%
7.69%
15.38%
4.76%
19.05%
4.76%
4.76%
4.76%
14.29%
14.29%
33.33%
12.50%
12.50%
25.00%
12.50%
37.50%
Figure 47: Proportion of Borrowers Represented
by Number of Employees (2016)
Figure 48: Borrower Profile by Number of Employees (2012-2016)
EMBARGOED UNTIL 00:00 FRI 8 December 2017
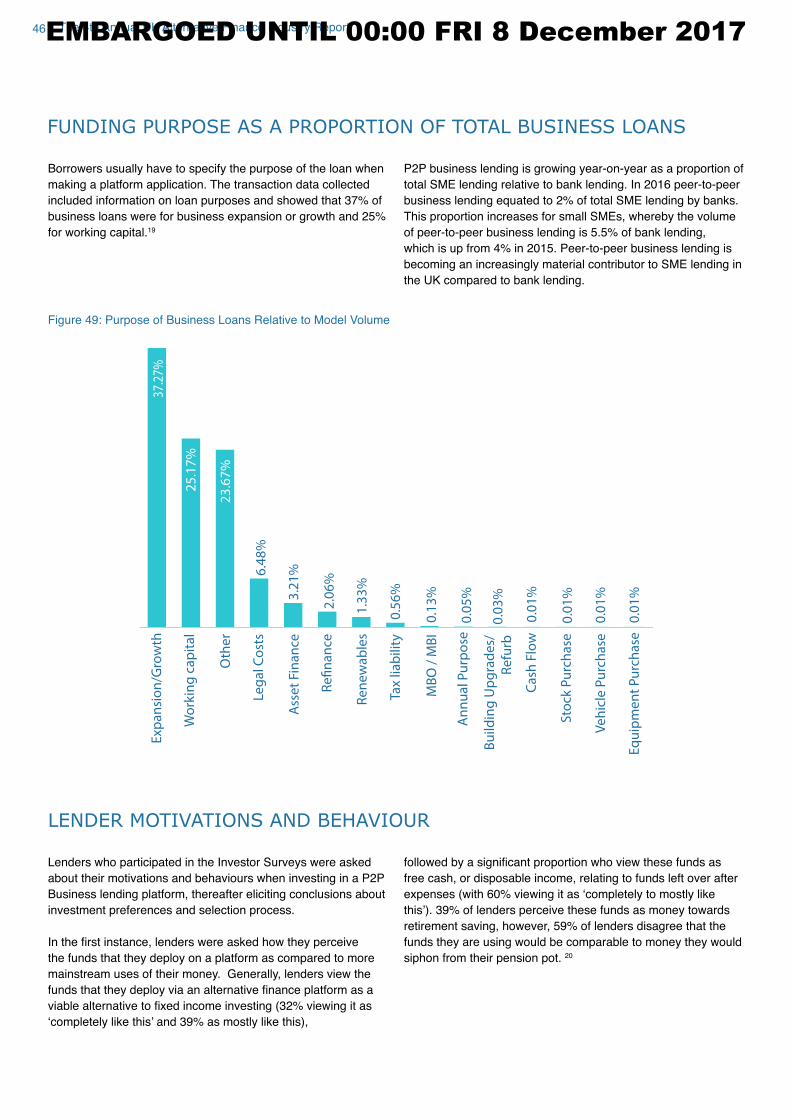
46 The 4th Annual UK Alternative Finance Industry Report
FUNDING PURPOSE AS A PROPORTION OF TOTAL BUSINESS LOANS
Borrowers usually have to specify the purpose of the loan when
making a platform application. The transaction data collected
included information on loan purposes and showed that 37% of
business loans were for business expansion or growth and 25%
for working capital.19
0.0
5%
0.0
3%
0.0
1%
0.0
1%
6.4
8%
0.1
3%
0.0
1%
0.0
1%
0.5
6%
2.0
6%
1.3
3%
3.2
1%
37.2
7%
23
.67
%
25
.17
%
An
nu
al P
urp
ose
Ass
et
Fin
an
ce
Bu
ildin
g U
pg
rad
es/
Re
furb
Ca
sh F
low
Eq
uip
me
nt
Pu
rch
ase
Exp
an
sio
n/G
row
th
Leg
al C
ost
s
MB
O /
MB
I
Oth
er
Refi
na
nce
Re
ne
wa
ble
s
Sto
ck P
urc
ha
se
Tax
liab
ility
Ve
hic
le P
urc
ha
se
Wo
rkin
g c
ap
ita
l
P2P business lending is growing year-on-year as a proportion of
total SME lending relative to bank lending. In 2016 peer-to-peer
business lending equated to 2% of total SME lending by banks.
This proportion increases for small SMEs, whereby the volume
of peer-to-peer business lending is 5.5% of bank lending,
which is up from 4% in 2015. Peer-to-peer business lending is
becoming an increasingly material contributor to SME lending in
the UK compared to bank lending.
Figure 49: Purpose of Business Loans Relative to Model Volume
LENDER MOTIVATIONS AND BEHAVIOUR
Lenders who participated in the Investor Surveys were asked
about their motivations and behaviours when investing in a P2P
Business lending platform, thereafter eliciting conclusions about
investment preferences and selection process.
In the first instance, lenders were asked how they perceive the funds that they deploy on a platform as compared to more
mainstream uses of their money. Generally, lenders view the
funds that they deploy via an alternative finance platform as a viable alternative to fixed income investing (32% viewing it as ‘completely like this’ and 39% as mostly like this),
followed by a significant proportion who view these funds as free cash, or disposable income, relating to funds left over after
expenses (with 60% viewing it as ‘completely to mostly like this’). 39% of lenders perceive these funds as money towards retirement saving, however, 59% of lenders disagree that the
funds they are using would be comparable to money they would
siphon from their pension pot. 20
EMBARGOED UNTIL 00:00 FRI 8 December 2017
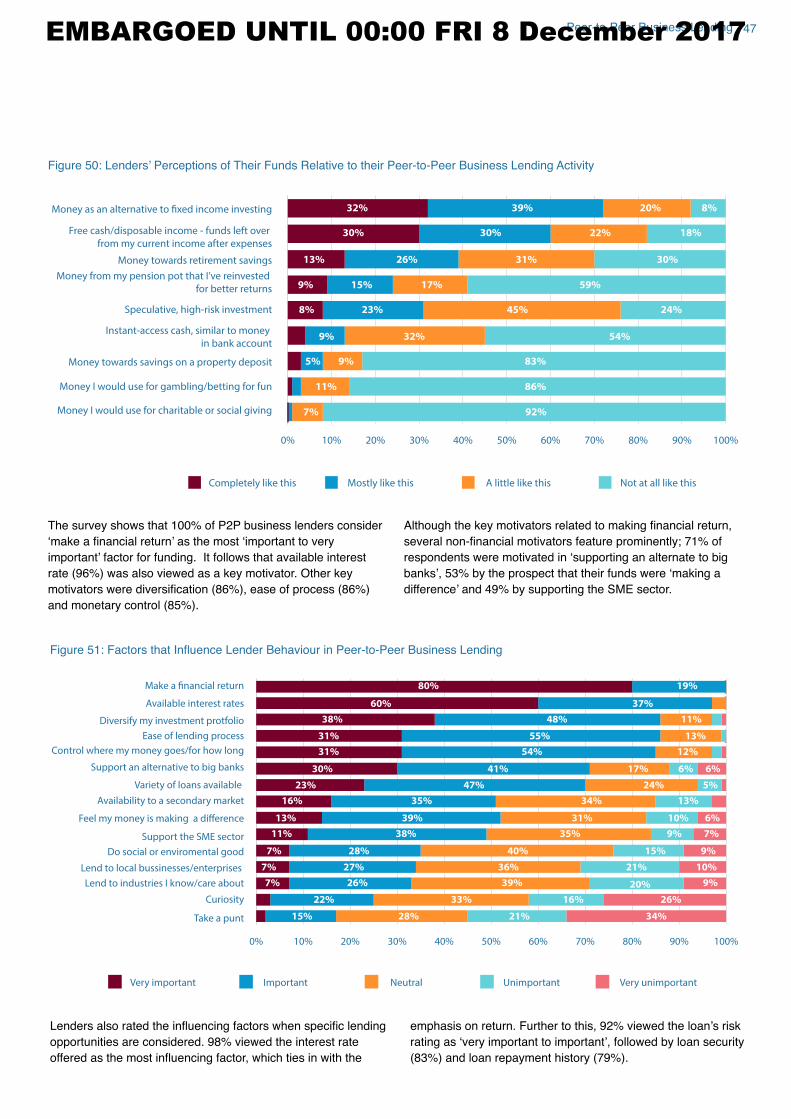
47Peer-to-Peer Business Lending
0% 10% 20% 30% 40% 50% 60% 70% 80% 90% 100%
Money I would use for charitable or social giving
Money I would use for gambling/betting for fun
Money towards savings on a property deposit
Instant-access cash, similar to money
in bank account
Speculative, high-risk investment
Money from my pension pot that I’ve reinvested
for better returns
Money towards retirement savings
Free cash/disposable income - funds left over
from my current income after expenses
Money as an alternative to fixed income investing
92%
26%
83%
22% 18%30%30%
32% 39% 20% 8%
54%
45%
32%
24%
5%
30%
23%
31%
59%
13%
7%
11% 86%
17%
8%
9%
9%
9% 15%
Completely like this Mostly like this A little like this Not at all like this
The survey shows that 100% of P2P business lenders consider
‘make a financial return’ as the most ‘important to very important’ factor for funding. It follows that available interest rate (96%) was also viewed as a key motivator. Other key
motivators were diversification (86%), ease of process (86%) and monetary control (85%).
Although the key motivators related to making financial return, several non-financial motivators feature prominently; 71% of respondents were motivated in ‘supporting an alternate to big banks’, 53% by the prospect that their funds were ‘making a difference’ and 49% by supporting the SME sector.
Figure 50: Lenders’ Perceptions of Their Funds Relative to their Peer-to-Peer Business Lending Activity
0% 10% 20% 30% 40% 50% 60% 70% 80% 90% 100%
Take a punt
Curiosity
Lend to industries I know/care about
Lend to local bussinesses/enterprises
Do social or enviromental good
Support an alternative to big banks
Support the SME sector
Control where my money goes/for how long
Ease of lending process
Diversify my investment protfolio
Available interest rates
Make a financial return
Feel my money is making a difference
Availability to a secondary market
Variety of loans available
34%
39%
35%
47%
41%
54%
55%
37%
16%
48% 11%38%
80% 19%
7%
26%
39% 20%
21% 10%
26%
27%
28% 40% 15% 9%
36%
22%
6%
5%
6%6%
38%
34%
31%
24%
17%
12%
13%
35%11%
21%15% 28%
10%
13%
7%
7%
7%
33%
9%
9%
13%
16%
23%
30%
31%
31%
60%
Very important Important Neutral Unimportant Very unimportant
Figure 51: Factors that Influence Lender Behaviour in Peer-to-Peer Business Lending
Lenders also rated the influencing factors when specific lending opportunities are considered. 98% viewed the interest rate
offered as the most influencing factor, which ties in with the
emphasis on return. Further to this, 92% viewed the loan’s risk rating as ‘very important to important’, followed by loan security (83%) and loan repayment history (79%).
EMBARGOED UNTIL 00:00 FRI 8 December 2017
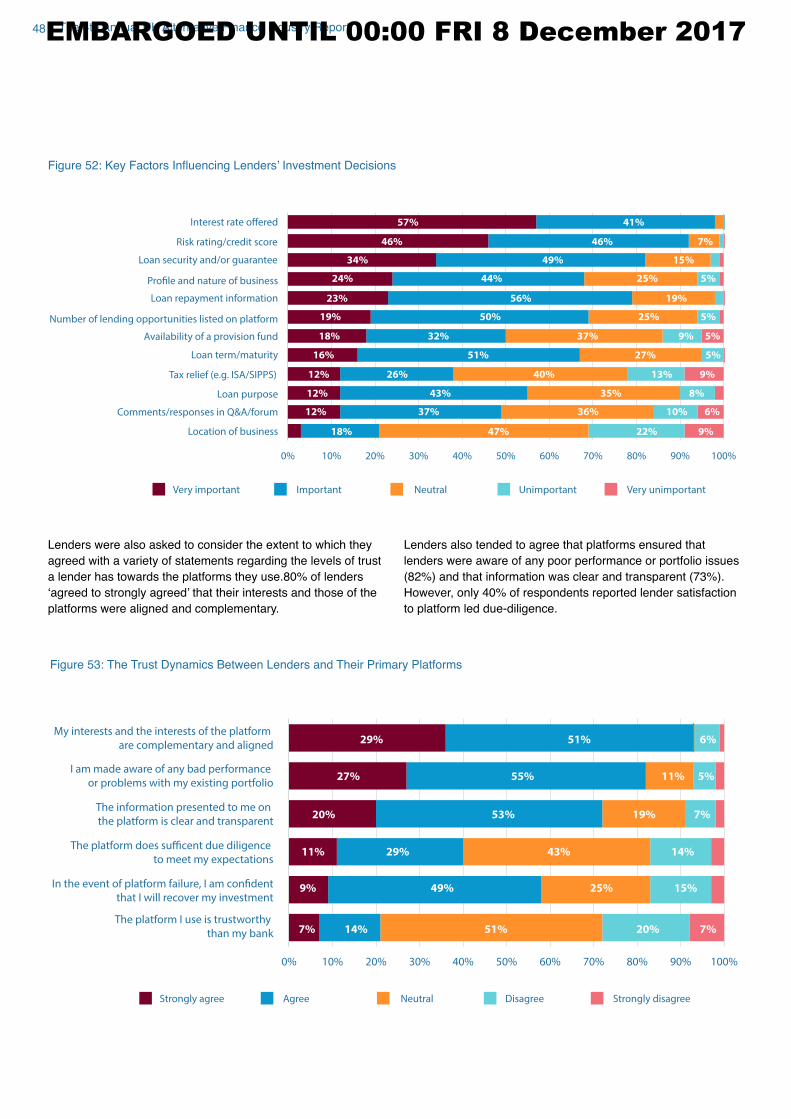
48 The 4th Annual UK Alternative Finance Industry Report
0% 10% 20% 30% 40% 50% 60% 70% 80% 90% 100%
Location of business
Comments/responses in Q&A/forum
Loan purpose
Tax relief (e.g. ISA/SIPPS)
Loan term/maturity
Availability of a provision fund
Number of lending opportunities listed on platform
Loan repayment information
Profile and nature of business
Loan security and/or guarantee
Risk rating/credit score
Interest rate offered
47%
37%
36%
9%
25%
27%
19%
23% 56% 19%
25%44%24%
34%
46%
57% 41%
46%
49% 15%
7%
50%
51%
5%
5%
5%
5%
10%
8%12%
12%
12%
9%
35%
18%
13%
32%
18% 9%22%
40%
43%
37% 6%
16%
26%
Very important Important Neutral Unimportant Very unimportant
0% 10% 20% 30% 40% 50% 60% 70% 80% 90% 100%
The platform I use is trustworthy
than my bank
In the event of platform failure, I am confident
that I will recover my investment
The platform does sufficent due diligence
to meet my expectations
The information presented to me on
the platform is clear and transparent
I am made aware of any bad performance
or problems with my existing portfolio
My interests and the interests of the platform
are complementary and aligned
14%
53%
51%
27% 55% 11%
7%
5%
6%51%29%
20%
25%49%
7%
19%
43%
20%
7%
14%
9% 15%
11% 29%
Strongly agree Agree Neutral Disagree Strongly disagree
Lenders were also asked to consider the extent to which they
agreed with a variety of statements regarding the levels of trust
a lender has towards the platforms they use.80% of lenders
‘agreed to strongly agreed’ that their interests and those of the platforms were aligned and complementary.
Lenders also tended to agree that platforms ensured that
lenders were aware of any poor performance or portfolio issues
(82%) and that information was clear and transparent (73%).
However, only 40% of respondents reported lender satisfaction
to platform led due-diligence.
Figure 52: Key Factors Influencing Lenders’ Investment Decisions
Figure 53: The Trust Dynamics Between Lenders and Their Primary Platforms
EMBARGOED UNTIL 00:00 FRI 8 December 2017
49Peer-to-Peer Consumer Lending
Figure 54: Total UK Peer-to-Peer Consumer Lending Volume,
2011-2016 (£ million)
PEER-TO-PEER CONSUMER LENDING
The second largest model in the UK is that of P2P Consumer
Lending, with a total volume of £1.169b in 2016, which is a 29% annual increase. Volume data has been recorded for P2P
consumer lending since 2011 and since then a total of £3.1b has been generated.
Though the annual growth rate of the model has decelerated
annually since 2013, it remains a fundamental channel for finance for individuals and micro businesses in the UK.
BORROWER AND LENDER DYNAMICS: DYNAMICS
Analysing P2P Consumer Lending by geographical location
shows that lenders are concentrated in the South of England,
with 27% of lenders based in London followed by 20% in the
South East and 9% in the South West. 12% of lenders came
from East of England. Similarly, to the P2P Business model,
borrowers are more geographically diverse, with a much smaller
concentration of borrowers in London (15%) and South East
(14%) relative to lenders. The North accounts for 15% of total
borrowing, with the North West and North East accounting
for 11% and 4% respectively. The spread indicates that while
significant proportions of funding come from a few distinct regions, the provision of the finance is far more geographically diverse.
2011
£68m£127m
£287m
£547m
£909m
£1,169m
2012 2013 2014 2015 2016
25% of all borrowers were repeat borrowers in 2016, which is an
increase of 9% year-on-year. The qualification/onboarding statistics show that 44% of prospective borrowers were allowed to proceed
with a funding campaign, 34% of which successfully raised
finance. Across the model the default rate was 2.48%. The average P2P Consumer loan remained a similar size,
decreasing slightly from £6,583 in 2015 to £6,289 In 2016, with an estimated average of 217 investors per loan. In 2016 circa 95% of
lenders relied upon auto-selection/auto-bid to allocate funds into
investments.
EMBARGOED UNTIL 00:00 FRI 8 December 2017
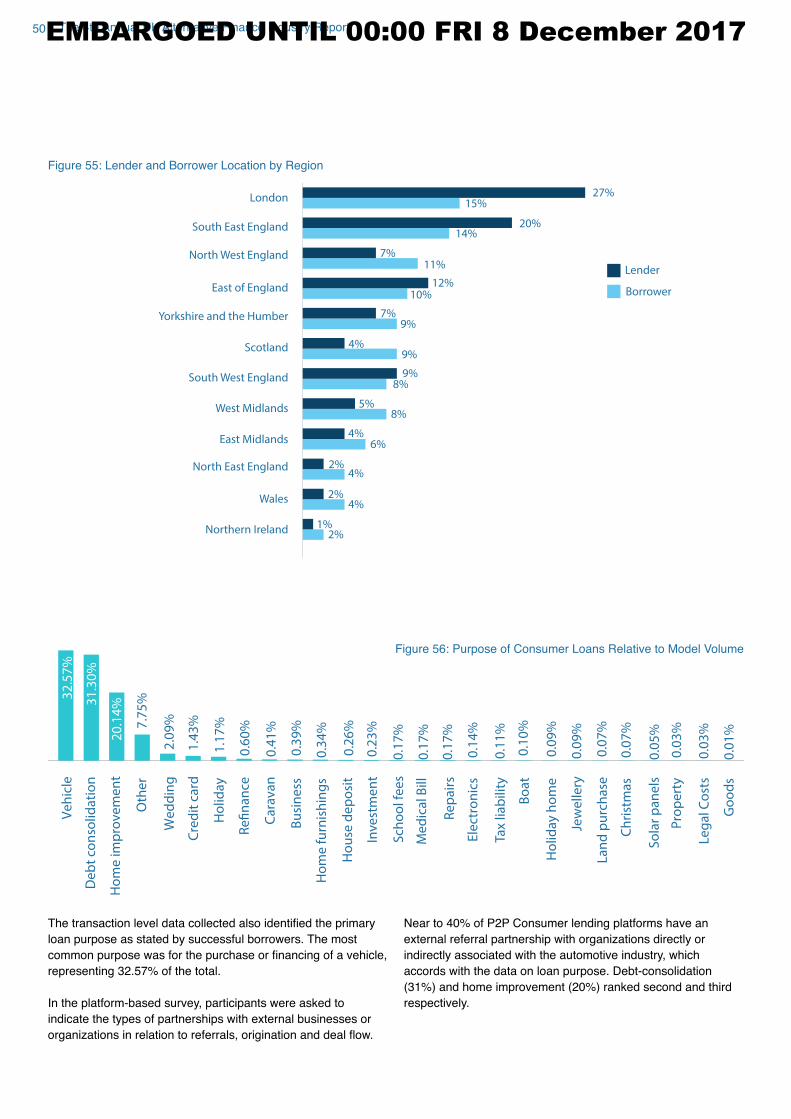
50 The 4th Annual UK Alternative Finance Industry Report
Go
od
s
Ele
ctro
nic
s
De
bt
con
solid
ati
on
Cre
dit
ca
rd
Ch
rist
ma
s
Ca
rav
an
Bu
sin
ess
Bo
at
0.1
0%
0.3
9%
0.4
1%
1.4
3%
31
.30
%
0.0
1%
0%
0.0
9%20
.14
%
0.2
6%
0.2
3%
0.0
9%
0.0
7%
0.0
3%
0.1
7%
0.0
3%
0.1
7%
0.1
7%
0.0
5%7
.75
%
0.6
0%
0.0
7%
0.1
4%
1.1
7%
0.3
4%
0.1
1%
32
.57
%
2.0
9%
Ho
lida
y
Ho
lida
y h
om
e
Ho
me
fu
rnis
hin
gs
Ho
me
imp
rov
em
en
t
Ho
use
de
po
sit
Inv
est
me
nt
Jew
ell
ery
La
nd
pu
rch
ase
Le
ga
l Co
sts
Me
dic
al B
ill
Oth
er
Pro
pe
rty
Refi
na
nce
Re
pa
irs
Sch
oo
l fe
es
So
lar
pa
ne
ls
Specia
l event
Tax
liab
ility
Ve
hic
le
We
dd
ing
The transaction level data collected also identified the primary loan purpose as stated by successful borrowers. The most
common purpose was for the purchase or financing of a vehicle, representing 32.57% of the total.
In the platform-based survey, participants were asked to
indicate the types of partnerships with external businesses or
organizations in relation to referrals, origination and deal flow.
Near to 40% of P2P Consumer lending platforms have an
external referral partnership with organizations directly or
indirectly associated with the automotive industry, which
accords with the data on loan purpose. Debt-consolidation
(31%) and home improvement (20%) ranked second and third
respectively.
Figure 56: Purpose of Consumer Loans Relative to Model Volume
Yorkshire and the Humber
West Midlands
Wales
South West England
South East England
Scotland
Northern Ireland
North West England
North East England
London
East of England
East Midlands
5%8%
12%10%
9%4%
20%14%
6%4%
4%
4%
2%
2%
7%
15%27%
7%9%
9%8%
11% Lender
Borrower
2%1%
Figure 55: Lender and Borrower Location by Region
EMBARGOED UNTIL 00:00 FRI 8 December 2017
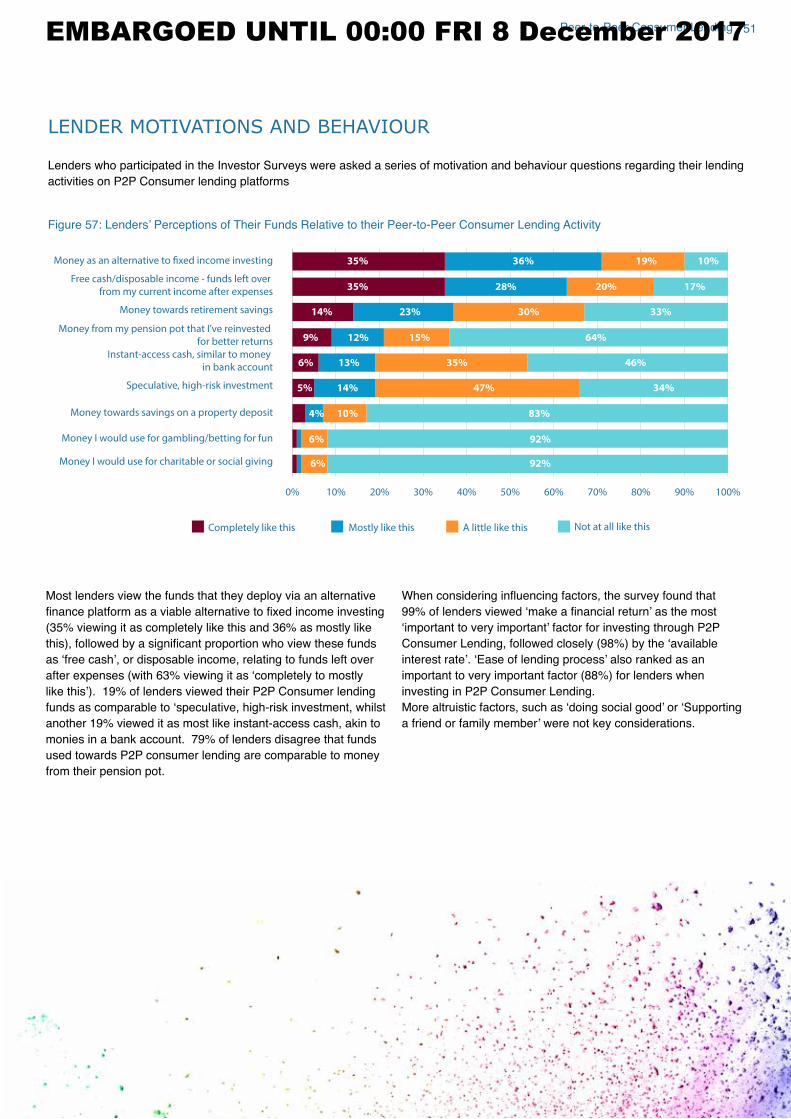
51Peer-to-Peer Consumer Lending
LENDER MOTIVATIONS AND BEHAVIOUR
Lenders who participated in the Investor Surveys were asked a series of motivation and behaviour questions regarding their lending
activities on P2P Consumer lending platforms
0% 10% 20% 30% 40% 50% 60% 70% 80% 90% 100%
Money I would use for charitable or social giving
Money I would use for gambling/betting for fun
Money towards savings on a property deposit
Instant-access cash, similar to money
in bank account
Speculative, high-risk investment
Money from my pension pot that I’ve reinvested
for better returns
Money towards retirement savings
Free cash/disposable income - funds left over
from my current income after expenses
Money as an alternative to fixed income investing
92%
23%
83%
20% 17%28%35%
35% 36% 19% 10%
34%
35%
47%
46%
4%
5%
33%
13%
30%
64%
14%
6%
6% 92%
15%
6%
10%
14%
9% 12%
Completely like this Mostly like this A little like this Not at all like this
Most lenders view the funds that they deploy via an alternative
finance platform as a viable alternative to fixed income investing (35% viewing it as completely like this and 36% as mostly like
this), followed by a significant proportion who view these funds as ‘free cash’, or disposable income, relating to funds left over after expenses (with 63% viewing it as ‘completely to mostly like this’). 19% of lenders viewed their P2P Consumer lending funds as comparable to ‘speculative, high-risk investment, whilst another 19% viewed it as most like instant-access cash, akin to
monies in a bank account. 79% of lenders disagree that funds
used towards P2P consumer lending are comparable to money
from their pension pot.
When considering influencing factors, the survey found that 99% of lenders viewed ‘make a financial return’ as the most ‘important to very important’ factor for investing through P2P Consumer Lending, followed closely (98%) by the ‘available interest rate’. ‘Ease of lending process’ also ranked as an important to very important factor (88%) for lenders when
investing in P2P Consumer Lending.
More altruistic factors, such as ‘doing social good’ or ‘Supporting a friend or family member’ were not key considerations.
Figure 57: Lenders’ Perceptions of Their Funds Relative to their Peer-to-Peer Consumer Lending Activity
EMBARGOED UNTIL 00:00 FRI 8 December 2017
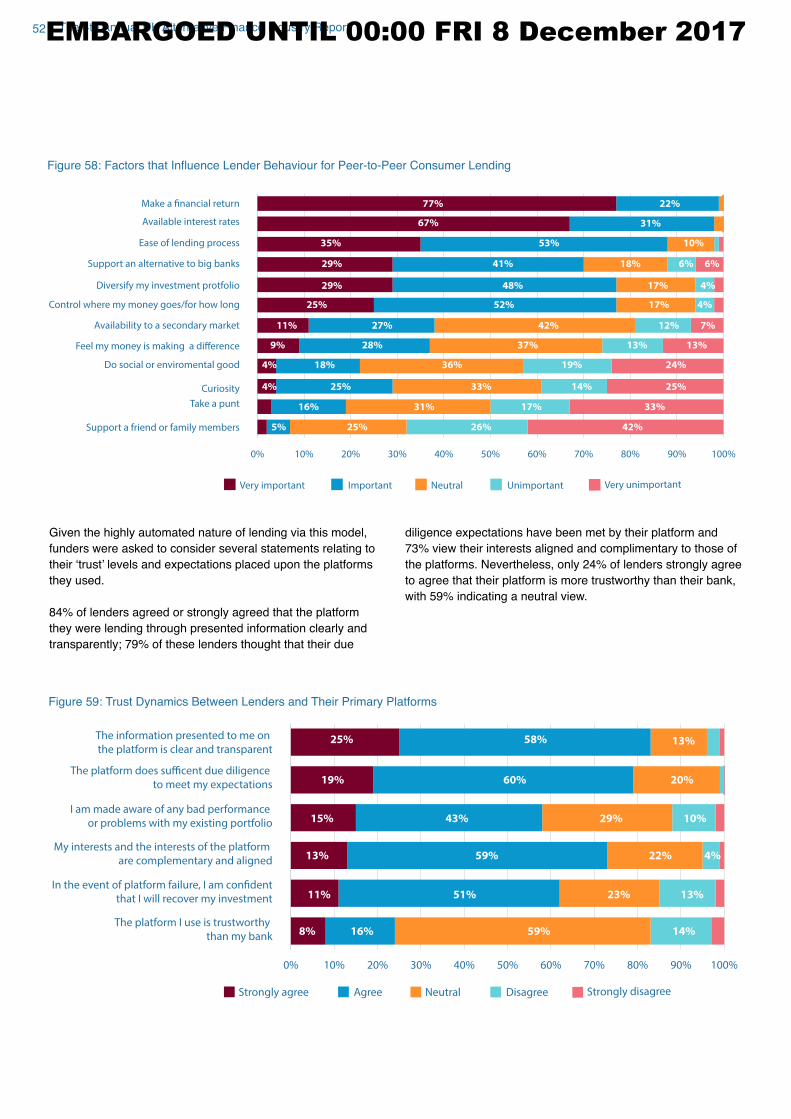
52 The 4th Annual UK Alternative Finance Industry Report
0% 10% 20% 30% 40% 50% 60% 70% 80% 90% 100%
Take a punt
Curiosity
Do social or enviromental good
Support an alternative to big banks
Support a friend or family members
Control where my money goes/for how long
Ease of lending process
Diversify my investment protfolio
Available interest rates
Make a financial return
Feel my money is making a difference
Availability to a secondary market
42%
27%
52%
48%
41%
53%
31%
17%
77% 22%
13%
33%
14% 25%25%
18% 36% 19% 24%
33%
16%
7%
4%
6%6%
28%
17%
42%
17%
18%
10%
37%9%
26%5% 25%
12%
4%
4%
4%
31%
13%
11%
25%
29%
29%
35%
67%
Very important Important Neutral Unimportant Very unimportant
0% 10% 20% 30% 40% 50% 60% 70% 80% 90% 100%
The platform I use is trustworthy
than my bank
In the event of platform failure, I am confident
that I will recover my investment
The platform does sufficent due diligence
to meet my expectations
The information presented to me on
the platform is clear and transparent
I am made aware of any bad performance
or problems with my existing portfolio
My interests and the interests of the platform
are complementary and aligned
16%
43%
59%
19% 60% 20%
10%
13%58%25%
14%
23%51%
29%
22%
15%
8%
4%
11% 13%
13% 59%
Strongly agree Agree Neutral Disagree Strongly disagree
Given the highly automated nature of lending via this model,
funders were asked to consider several statements relating to
their ‘trust’ levels and expectations placed upon the platforms they used.
84% of lenders agreed or strongly agreed that the platform
they were lending through presented information clearly and
transparently; 79% of these lenders thought that their due
diligence expectations have been met by their platform and
73% view their interests aligned and complimentary to those of
the platforms. Nevertheless, only 24% of lenders strongly agree
to agree that their platform is more trustworthy than their bank,
with 59% indicating a neutral view.
Figure 58: Factors that Influence Lender Behaviour for Peer-to-Peer Consumer Lending
Figure 59: Trust Dynamics Between Lenders and Their Primary Platforms
EMBARGOED UNTIL 00:00 FRI 8 December 2017
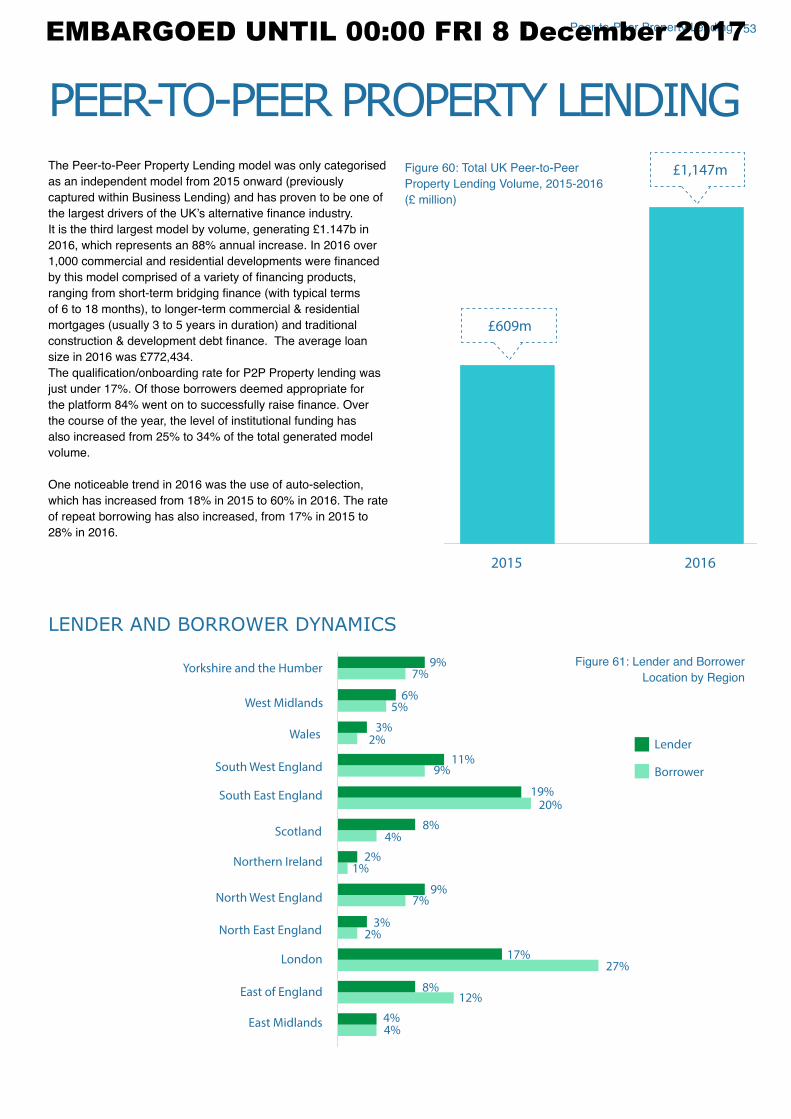
53Peer-to-Peer Property Lending
PEER-TO-PEER PROPERTY LENDINGThe Peer-to-Peer Property Lending model was only categorised
as an independent model from 2015 onward (previously
captured within Business Lending) and has proven to be one of
the largest drivers of the UK’s alternative finance industry. It is the third largest model by volume, generating £1.147b in 2016, which represents an 88% annual increase. In 2016 over
1,000 commercial and residential developments were financed by this model comprised of a variety of financing products, ranging from short-term bridging finance (with typical terms of 6 to 18 months), to longer-term commercial & residential
mortgages (usually 3 to 5 years in duration) and traditional
construction & development debt finance. The average loan size in 2016 was £772,434.The qualification/onboarding rate for P2P Property lending was just under 17%. Of those borrowers deemed appropriate for
the platform 84% went on to successfully raise finance. Over the course of the year, the level of institutional funding has
also increased from 25% to 34% of the total generated model
volume.
One noticeable trend in 2016 was the use of auto-selection,
which has increased from 18% in 2015 to 60% in 2016. The rate
of repeat borrowing has also increased, from 17% in 2015 to
28% in 2016.
£609m
£1,147m
2015 2016
Figure 60: Total UK Peer-to-Peer
Property Lending Volume, 2015-2016
(£ million)
LENDER AND BORROWER DYNAMICS
Yorkshire and the Humber
West Midlands
Wales
South West England
South East England
Scotland
Northern Ireland
North West England
North East England
London
East of England
East Midlands
9%7%
11%9%
4%8%
6%5%
2%3%
27%
12%
17%
8%
3%
7%9%
19%20%
2%1%
2% Lender
Borrower
4%4%
Figure 61: Lender and Borrower
Location by Region
EMBARGOED UNTIL 00:00 FRI 8 December 2017
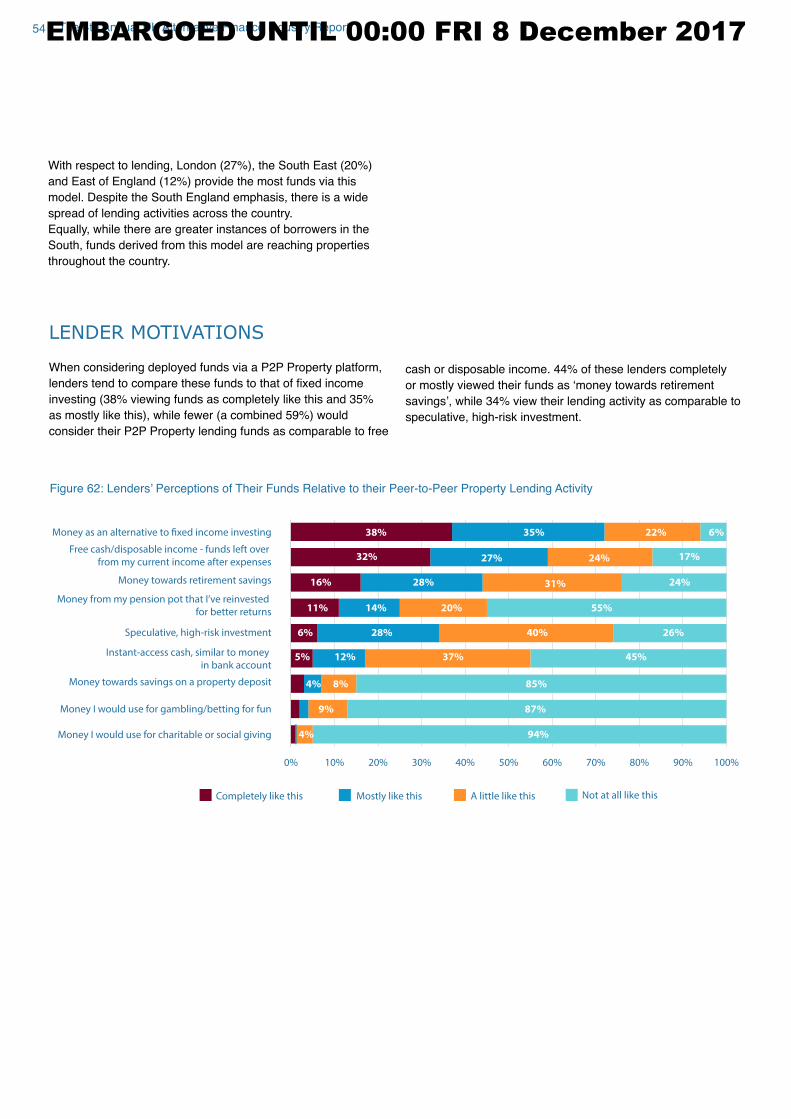
54 The 4th Annual UK Alternative Finance Industry Report
With respect to lending, London (27%), the South East (20%)
and East of England (12%) provide the most funds via this
model. Despite the South England emphasis, there is a wide
spread of lending activities across the country.
Equally, while there are greater instances of borrowers in the
South, funds derived from this model are reaching properties
throughout the country.
LENDER MOTIVATIONS
When considering deployed funds via a P2P Property platform,
lenders tend to compare these funds to that of fixed income investing (38% viewing funds as completely like this and 35%
as mostly like this), while fewer (a combined 59%) would
consider their P2P Property lending funds as comparable to free
cash or disposable income. 44% of these lenders completely
or mostly viewed their funds as ‘money towards retirement savings’, while 34% view their lending activity as comparable to speculative, high-risk investment.
0% 10% 20% 30% 40% 50% 60% 70% 80% 90% 100%
Money I would use for charitable or social giving
Money I would use for gambling/betting for fun
Money towards savings on a property deposit
Instant-access cash, similar to money
in bank account
Speculative, high-risk investment
Money from my pension pot that I’ve reinvested
for better returns
Money towards retirement savings
Free cash/disposable income - funds left over
from my current income after expenses
Money as an alternative to fixed income investing
94%
28%
85%
24% 17%27%32%
38% 35% 22% 6%
45%
40%
37%
26%
4%
5%
24%
28%
31%
55%
16%
4%
9% 87%
20%
6%
8%
12%
11% 14%
Completely like this Mostly like this A little like this Not at all like this
Figure 62: Lenders’ Perceptions of Their Funds Relative to their Peer-to-Peer Property Lending Activity
EMBARGOED UNTIL 00:00 FRI 8 December 2017
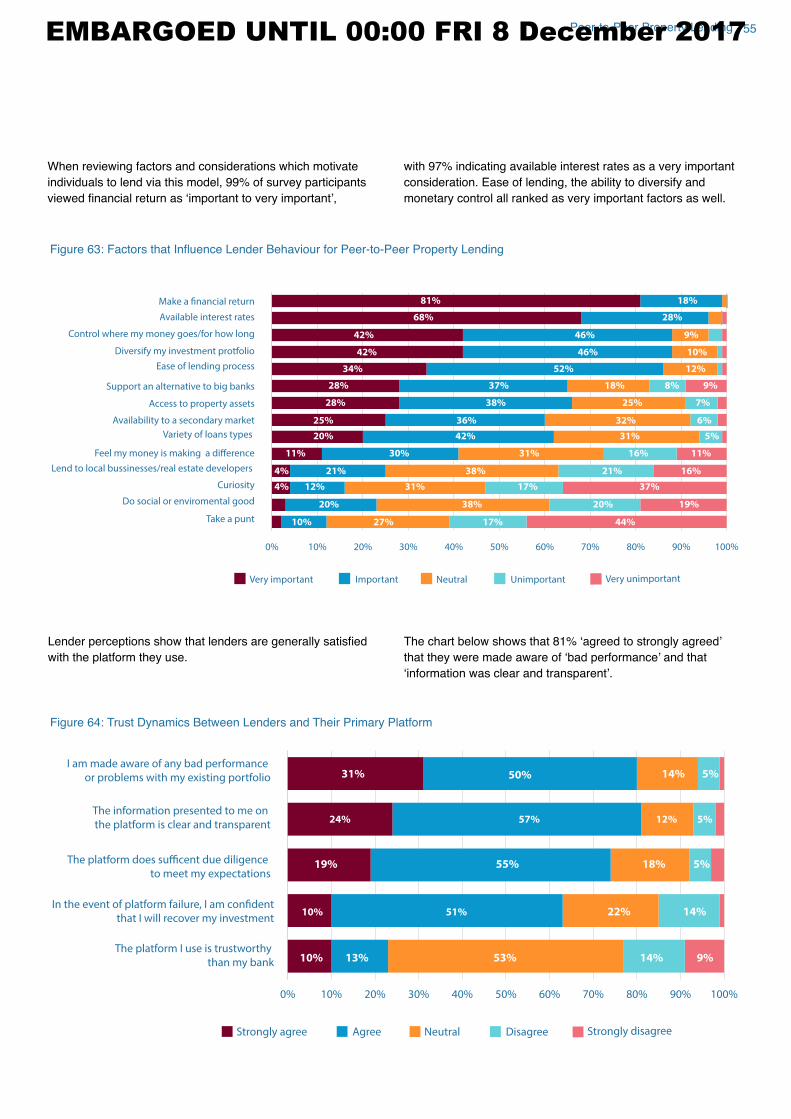
55Peer-to-Peer Property Lending
0% 10% 20% 30% 40% 50% 60% 70% 80% 90% 100%
Take a punt
Curiosity
Access to property assets
Lend to local bussinesses/real estate developers
Do social or enviromental good
Support an alternative to big banks
Control where my money goes/for how long
Ease of lending process
Diversify my investment protfolio
Available interest rates
Make a financial return
Feel my money is making a difference
Availability to a secondary market
Variety of loans types
44%
36%
38%
37%
52%
46%
28%
20%
46% 9%42%
81% 18%
19%
31% 17%
21% 16%
12%
21%
30% 31% 16% 11%
38%
20%
7%
9%8%
42%
32%
25%
18%
12%
10%
31%20%
17%10% 27%
6%
4%
4%
11%
38%
37%
5%
25%
28%
28%
34%
42%
68%
Very important Important Neutral Unimportant Very unimportant
Lender perceptions show that lenders are generally satisfied with the platform they use.
The chart below shows that 81% ‘agreed to strongly agreed’ that they were made aware of ‘bad performance’ and that ‘information was clear and transparent’.
0% 10% 20% 30% 40% 50% 60% 70% 80% 90% 100%
The platform I use is trustworthy
than my bank
In the event of platform failure, I am confident
that I will recover my investment
The platform does sufficent due diligence
to meet my expectations
The information presented to me on
the platform is clear and transparent
I am made aware of any bad performance
or problems with my existing portfolio
13% 53% 9%
31% 50% 14% 5%
14%
12%
18%
22% 14%
5%
55%
57%
10%
10% 51%
24%
19% 5%
Strongly agree Agree Neutral Disagree Strongly disagree
Figure 63: Factors that Influence Lender Behaviour for Peer-to-Peer Property Lending
Figure 64: Trust Dynamics Between Lenders and Their Primary Platform
When reviewing factors and considerations which motivate
individuals to lend via this model, 99% of survey participants
viewed financial return as ‘important to very important’,
with 97% indicating available interest rates as a very important
consideration. Ease of lending, the ability to diversify and
monetary control all ranked as very important factors as well.
EMBARGOED UNTIL 00:00 FRI 8 December 2017
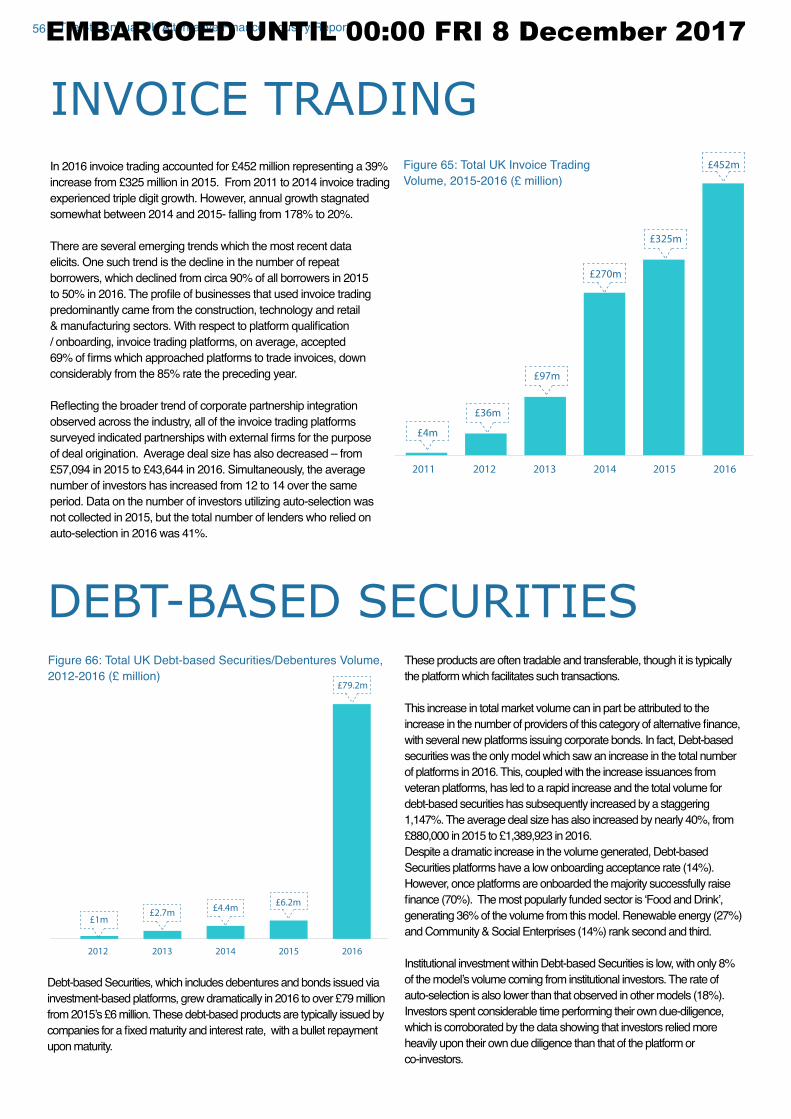
56 The 4th Annual UK Alternative Finance Industry Report
INVOICE TRADING
2011
£4m
£36m
£97m
£270m
£325m
£452m
2012 2013 2014 2015 2016
In 2016 invoice trading accounted for £452 million representing a 39% increase from £325 million in 2015. From 2011 to 2014 invoice trading experienced triple digit growth. However, annual growth stagnated
somewhat between 2014 and 2015- falling from 178% to 20%.
There are several emerging trends which the most recent data
elicits. One such trend is the decline in the number of repeat
borrowers, which declined from circa 90% of all borrowers in 2015
to 50% in 2016. The profile of businesses that used invoice trading predominantly came from the construction, technology and retail
& manufacturing sectors. With respect to platform qualification / onboarding, invoice trading platforms, on average, accepted
69% of firms which approached platforms to trade invoices, down considerably from the 85% rate the preceding year.
Reflecting the broader trend of corporate partnership integration observed across the industry, all of the invoice trading platforms
surveyed indicated partnerships with external firms for the purpose of deal origination. Average deal size has also decreased – from
£57,094 in 2015 to £43,644 in 2016. Simultaneously, the average number of investors has increased from 12 to 14 over the same
period. Data on the number of investors utilizing auto-selection was
not collected in 2015, but the total number of lenders who relied on
auto-selection in 2016 was 41%.
Figure 65: Total UK Invoice Trading
Volume, 2015-2016 (£ million)
DEBT-BASED SECURITIES
£1m£2.7m
£4.4m£6.2m
£79.2m
2012 2013 2014 2015 2016
Figure 66: Total UK Debt-based Securities/Debentures Volume,
2012-2016 (£ million)These products are often tradable and transferable, though it is typically
the platform which facilitates such transactions.
This increase in total market volume can in part be attributed to the
increase in the number of providers of this category of alternative finance, with several new platforms issuing corporate bonds. In fact, Debt-based
securities was the only model which saw an increase in the total number
of platforms in 2016. This, coupled with the increase issuances from
veteran platforms, has led to a rapid increase and the total volume for
debt-based securities has subsequently increased by a staggering
1,147%. The average deal size has also increased by nearly 40%, from
£880,000 in 2015 to £1,389,923 in 2016. Despite a dramatic increase in the volume generated, Debt-based
Securities platforms have a low onboarding acceptance rate (14%).
However, once platforms are onboarded the majority successfully raise
finance (70%). The most popularly funded sector is ‘Food and Drink’, generating 36% of the volume from this model. Renewable energy (27%)
and Community & Social Enterprises (14%) rank second and third.
Institutional investment within Debt-based Securities is low, with only 8%
of the model’s volume coming from institutional investors. The rate of auto-selection is also lower than that observed in other models (18%).
Investors spent considerable time performing their own due-diligence,
which is corroborated by the data showing that investors relied more
heavily upon their own due diligence than that of the platform or
co-investors.
Debt-based Securities, which includes debentures and bonds issued via
investment-based platforms, grew dramatically in 2016 to over £79 million from 2015’s £6 million. These debt-based products are typically issued by companies for a fixed maturity and interest rate, with a bullet repayment upon maturity.
EMBARGOED UNTIL 00:00 FRI 8 December 2017
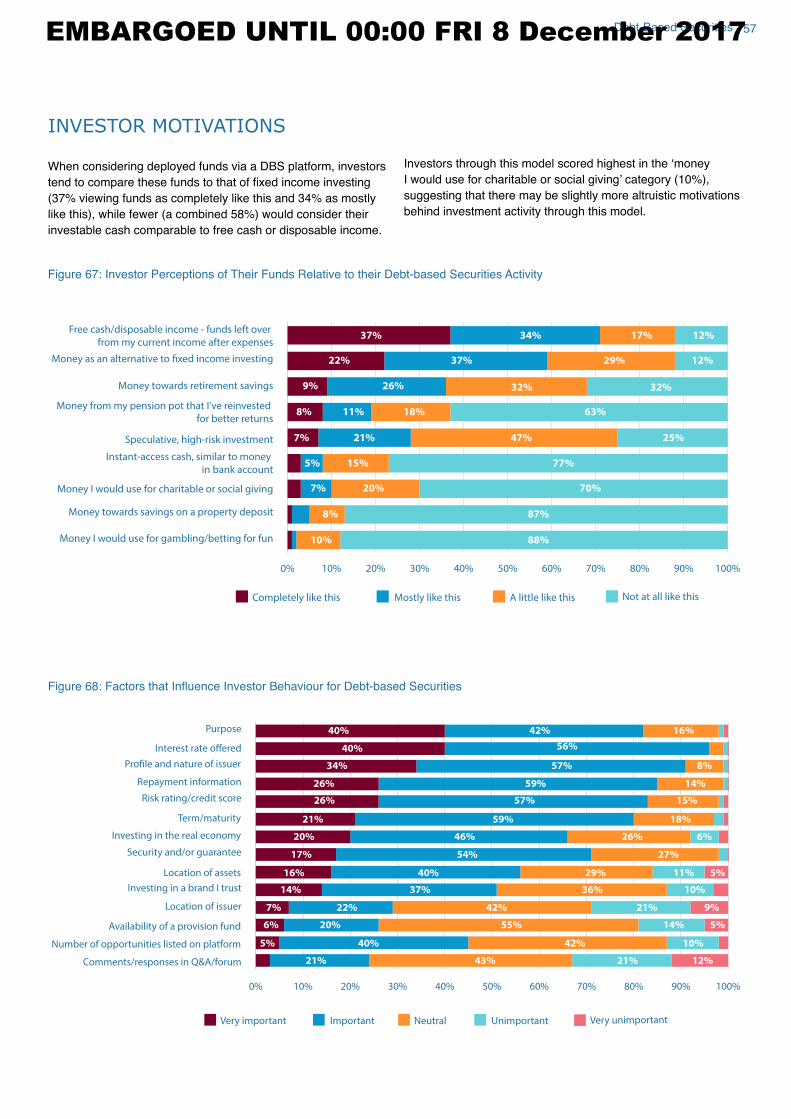
57Debt-Based Securities
INVESTOR MOTIVATIONS
When considering deployed funds via a DBS platform, investors
tend to compare these funds to that of fixed income investing (37% viewing funds as completely like this and 34% as mostly
like this), while fewer (a combined 58%) would consider their
investable cash comparable to free cash or disposable income.
Investors through this model scored highest in the ‘money I would use for charitable or social giving’ category (10%), suggesting that there may be slightly more altruistic motivations
behind investment activity through this model.
0% 10% 20% 30% 40% 50% 60% 70% 80% 90% 100%
Money I would use for charitable or social giving
Money I would use for gambling/betting for fun
Money towards savings on a property deposit
Instant-access cash, similar to money
in bank account
Speculative, high-risk investment
Money from my pension pot that I’ve reinvested
for better returns
Money towards retirement savings
Free cash/disposable income - funds left over
from my current income after expenses
Money as an alternative to fixed income investing
88%
26%
70%
29% 12%37%22%
37% 34% 17% 12%
77%
47% 25%
7%
5%
32%
21%
32%
63%
9%
10%
8% 87%
18%
7%
20%
15%
8% 11%
Completely like this Mostly like this A little like this Not at all like this
Figure 67: Investor Perceptions of Their Funds Relative to their Debt-based Securities Activity
0% 10% 20% 30% 40% 50% 60% 70% 80% 90% 100%
Location of issuer
Location of assets
Comments/responses in Q&A/forum
Purpose
Investing in a brand I trust
Investing in the real economy
Term/maturity
Availability of a provision fund
Number of opportunities listed on platform
Repayment information
Profile and nature of issuer
Security and/or guarantee
Risk rating/credit score
Interest rate offered
43%
29%
57%
11%
27%
36%
17%
20% 46% 26%
18%59%21%
26%
26%
34% 8%
59%
57% 15%
14%
54%
37%
5%
10%
6%
40% 56%
40% 42% 16%
10%
14%6%
7%
40%
9%
55%
16%
21%
40%
21% 12%21%
42%
20%
42%5%
5%
14%
22%
Very important Important Neutral Unimportant Very unimportant
Figure 68: Factors that Influence Investor Behaviour for Debt-based Securities
EMBARGOED UNTIL 00:00 FRI 8 December 2017
58 The 4th Annual UK Alternative Finance Industry Report
0% 10% 20% 30% 40% 50% 60% 70% 80% 90% 100%
The platform I use is trustworthy
than my bank
In the event of platform failure, I am confident
that I will recover my investment
The platform does sufficent due diligence
to meet my expectations
The information presented to me on
the platform is clear and transparent
I am made aware of any bad performance
or problems with my existing portfolio
My interests and the interests of the platform
are complementary and aligned
37%
60%
28%
18% 61% 18%
5%
8%63%27%
25%
60%17%
20%
34%
15%
7%
6%
8% 14%
13% 45%
Strongly agree Agree Neutral Disagree Strongly disagree
As with all previously reviewed models, the leading motivator
was making a financial return. For 96% of DBS investors, interest rate was also a critical motivator. Yet, when investors
were asked to express which factors were ‘important to very important’ this cohort noted finance purpose (82%) and the profile and nature of the issuer (91%).
Being able to ‘invest in the real economy’ also scored highly, with 66% noting this as important or very important to them.
Finally, when reviewing investor perceptions towards the
platforms, 90% ‘agree to strongly agree’ that information is clear and transparent’, and 80% perceive platform-led due diligence as satisfactory against their expectations.
Figure 69: Trust Dynamics Between Lenders and Their Primary Platform
EMBARGOED UNTIL 00:00 FRI 8 December 2017
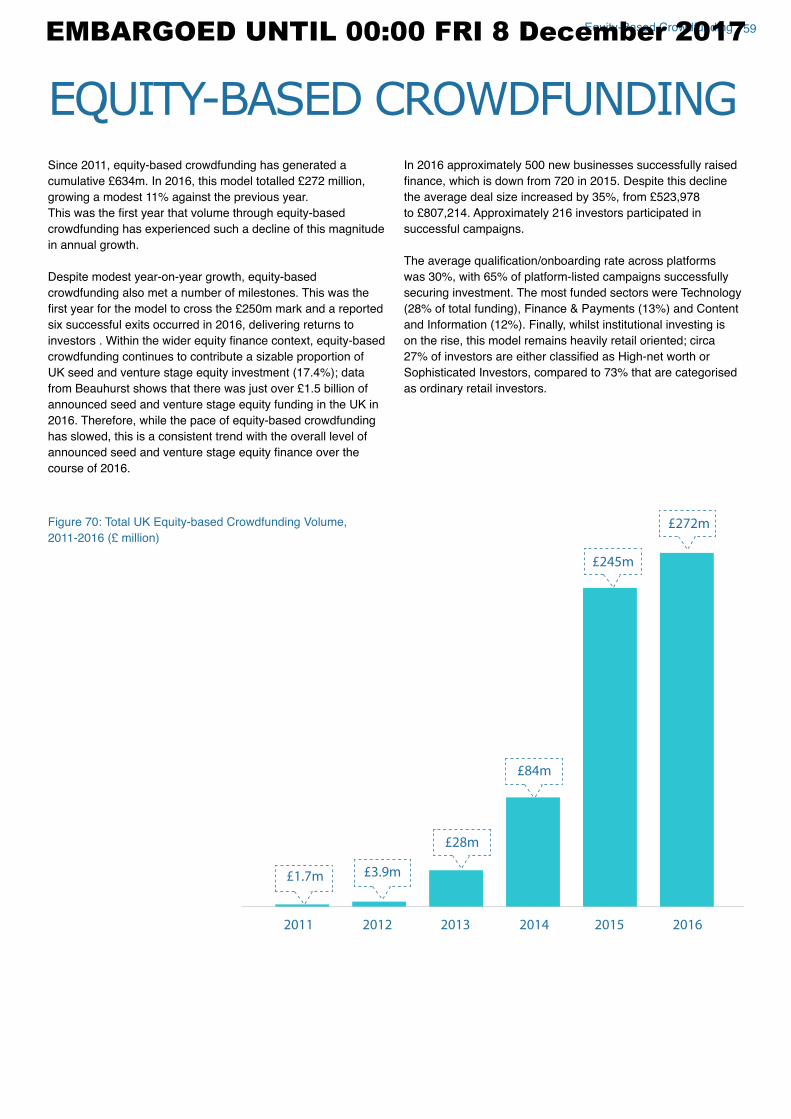
59Equity-Based Crowdfunding
EQUITY-BASED CROWDFUNDING
2011
£1.7m £3.9m
£28m
£84m
£245m
£272m
2012 2013 2014 2015 2016
Since 2011, equity-based crowdfunding has generated a
cumulative £634m. In 2016, this model totalled £272 million, growing a modest 11% against the previous year.
This was the first year that volume through equity-based crowdfunding has experienced such a decline of this magnitude
in annual growth.
Despite modest year-on-year growth, equity-based
crowdfunding also met a number of milestones. This was the
first year for the model to cross the £250m mark and a reported six successful exits occurred in 2016, delivering returns to
investors . Within the wider equity finance context, equity-based crowdfunding continues to contribute a sizable proportion of
UK seed and venture stage equity investment (17.4%); data from Beauhurst shows that there was just over £1.5 billion of announced seed and venture stage equity funding in the UK in
2016. Therefore, while the pace of equity-based crowdfunding
has slowed, this is a consistent trend with the overall level of
announced seed and venture stage equity finance over the course of 2016.
Figure 70: Total UK Equity-based Crowdfunding Volume,
2011-2016 (£ million)
In 2016 approximately 500 new businesses successfully raised
finance, which is down from 720 in 2015. Despite this decline the average deal size increased by 35%, from £523,978 to £807,214. Approximately 216 investors participated in successful campaigns.
The average qualification/onboarding rate across platforms was 30%, with 65% of platform-listed campaigns successfully
securing investment. The most funded sectors were Technology
(28% of total funding), Finance & Payments (13%) and Content
and Information (12%). Finally, whilst institutional investing is
on the rise, this model remains heavily retail oriented; circa 27% of investors are either classified as High-net worth or Sophisticated Investors, compared to 73% that are categorised
as ordinary retail investors.
EMBARGOED UNTIL 00:00 FRI 8 December 2017
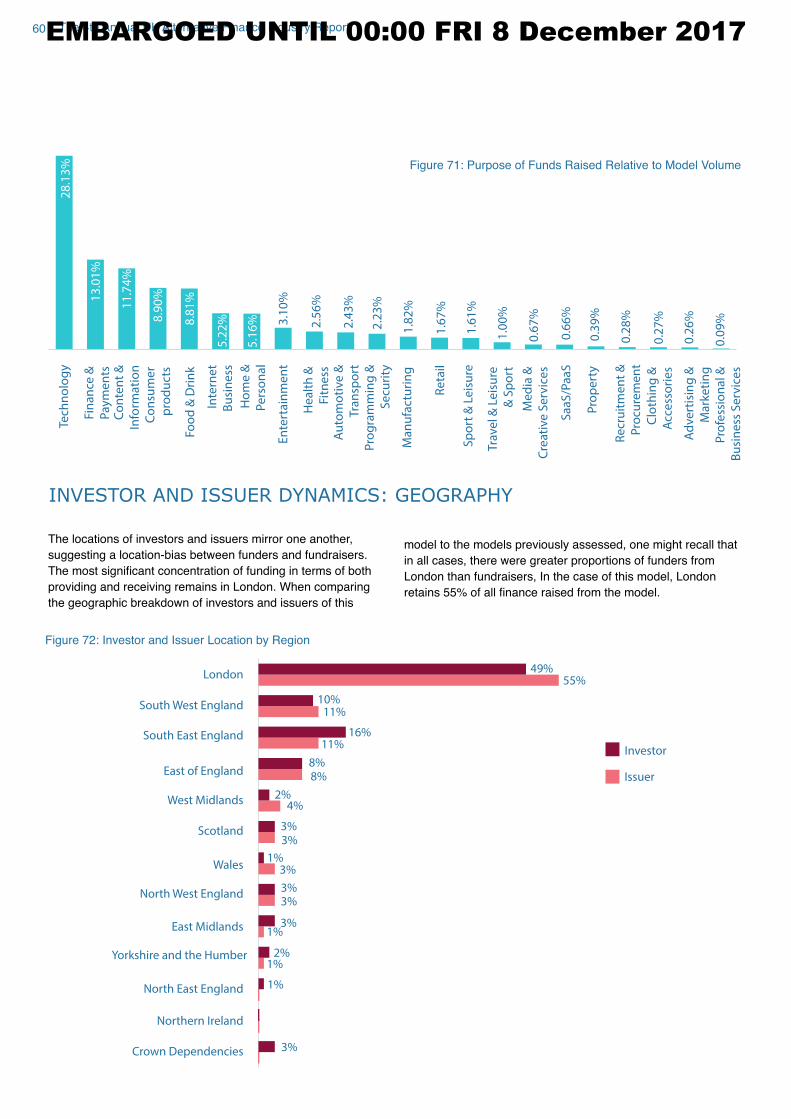
60 The 4th Annual UK Alternative Finance Industry Report
2.4
3%
2.2
3%
1.6
7%
1.8
2%
2.5
6%
1.6
1%
1.0
0%
0.6
6%
0.3
9%
0.2
7%
0.2
8%
0.6
7%
0.2
6%
0.0
9%3.1
0%
5.2
2%
5.1
6%
28
.13
%
13
.01
%
11
.74
%
8.9
0%
8.8
1%
Au
tom
oti
ve
&
Tra
nsp
ort
Foo
d &
Dri
nk
Clo
thin
g &
Acc
ess
ori
es
Pro
gra
mm
ing
&
Se
curi
ty
Pro
fess
ion
al &
Bu
sin
ess
Se
rvic
es
Ma
nu
fact
uri
ng
Ad
vert
isin
g &
Ma
rke
tin
g
Pro
pe
rty
Tra
vel &
Le
isu
re
& S
po
rt
Tech
no
log
y
Re
cru
itm
en
t &
Pro
cure
me
nt
Sa
aS
/Pa
aS
Co
nsu
me
r
pro
du
cts
He
alt
h &
Fitn
ess
Co
nte
nt
&
Info
rma
tio
n
Me
dia
&
Cre
ati
ve S
erv
ice
s
Inte
rne
t
Bu
sin
ess
Ho
me
&
Pe
rso
na
l
Re
tail
En
tert
ain
me
nt
Sp
ort
& L
eis
ure
Fin
an
ce &
Pa
ym
en
ts
Figure 71: Purpose of Funds Raised Relative to Model Volume
INVESTOR AND ISSUER DYNAMICS: GEOGRAPHY
Yorkshire and the Humber
West Midlands
Wales
South West England
South East England
Scotland
Northern Ireland
North West England
North East England
London
East of England
East Midlands
Crown Dependencies
3%3%
8%8%
3%3%
10%11%
1%3%
1%2%
1%
16%
55%49%
2%4%
1%3%
11%Investor
Issuer
3%
The locations of investors and issuers mirror one another,
suggesting a location-bias between funders and fundraisers.
The most significant concentration of funding in terms of both providing and receiving remains in London. When comparing
the geographic breakdown of investors and issuers of this
model to the models previously assessed, one might recall that
in all cases, there were greater proportions of funders from
London than fundraisers, In the case of this model, London
retains 55% of all finance raised from the model.
Figure 72: Investor and Issuer Location by Region
EMBARGOED UNTIL 00:00 FRI 8 December 2017
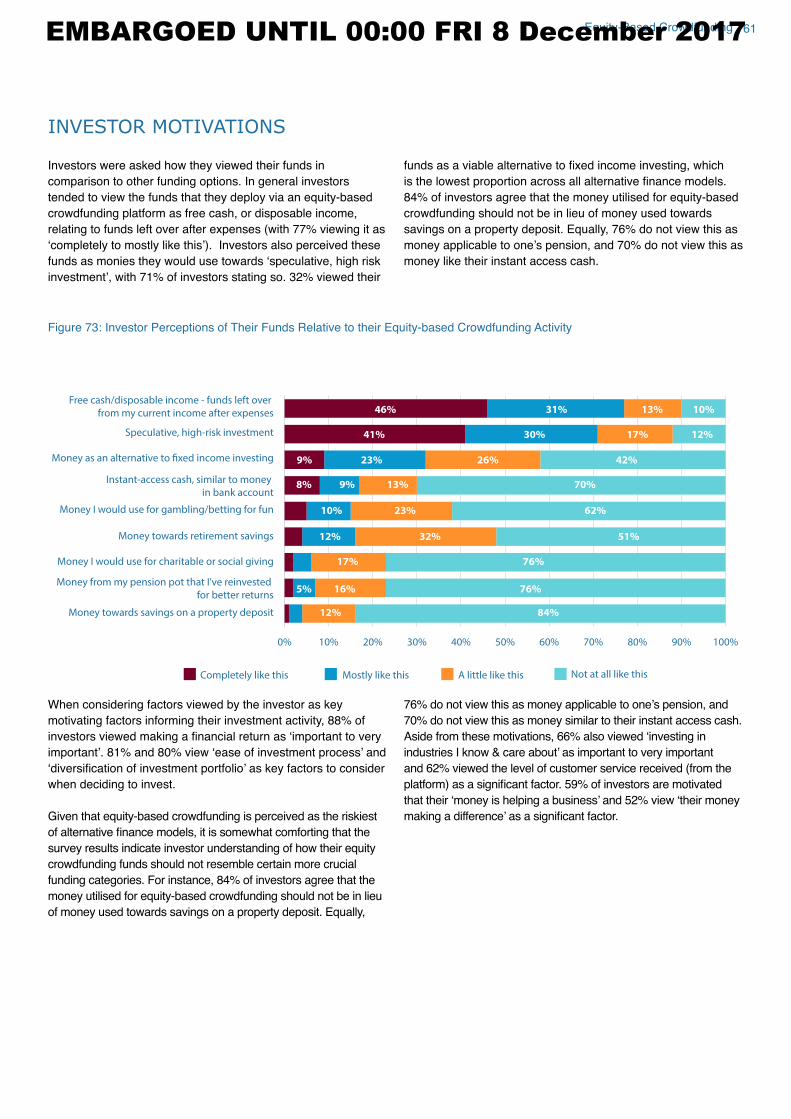
61Equity-Based Crowdfunding
INVESTOR MOTIVATIONS
Investors were asked how they viewed their funds in
comparison to other funding options. In general investors
tended to view the funds that they deploy via an equity-based
crowdfunding platform as free cash, or disposable income,
relating to funds left over after expenses (with 77% viewing it as
‘completely to mostly like this’). Investors also perceived these funds as monies they would use towards ‘speculative, high risk investment’, with 71% of investors stating so. 32% viewed their
funds as a viable alternative to fixed income investing, which is the lowest proportion across all alternative finance models. 84% of investors agree that the money utilised for equity-based
crowdfunding should not be in lieu of money used towards
savings on a property deposit. Equally, 76% do not view this as
money applicable to one’s pension, and 70% do not view this as money like their instant access cash.
0% 10% 20% 30% 40% 50% 60% 70% 80% 90% 100%
Money I would use for charitable or social giving
Money I would use for gambling/betting for fun
Money towards savings on a property deposit
Instant-access cash, similar to money
in bank account
Speculative, high-risk investment
Money from my pension pot that I’ve reinvested
for better returns
Money towards retirement savings
Free cash/disposable income - funds left over
from my current income after expenses
Money as an alternative to fixed income investing
84%
23%
76%
17% 12%30%41%
46% 31% 13% 10%
51%
62%
5%
12%
42%
23%
26%
70%
9%
12%
16% 76%
13%
10%
17%
32%
8% 9%
Completely like this Mostly like this A little like this Not at all like this
When considering factors viewed by the investor as key
motivating factors informing their investment activity, 88% of
investors viewed making a financial return as ‘important to very important’. 81% and 80% view ‘ease of investment process’ and ‘diversification of investment portfolio’ as key factors to consider when deciding to invest.
Given that equity-based crowdfunding is perceived as the riskiest
of alternative finance models, it is somewhat comforting that the survey results indicate investor understanding of how their equity
crowdfunding funds should not resemble certain more crucial
funding categories. For instance, 84% of investors agree that the
money utilised for equity-based crowdfunding should not be in lieu
of money used towards savings on a property deposit. Equally,
76% do not view this as money applicable to one’s pension, and 70% do not view this as money similar to their instant access cash.
Aside from these motivations, 66% also viewed ‘investing in industries I know & care about’ as important to very important and 62% viewed the level of customer service received (from the
platform) as a significant factor. 59% of investors are motivated that their ‘money is helping a business’ and 52% view ‘their money making a difference’ as a significant factor.
Figure 73: Investor Perceptions of Their Funds Relative to their Equity-based Crowdfunding Activity
EMBARGOED UNTIL 00:00 FRI 8 December 2017
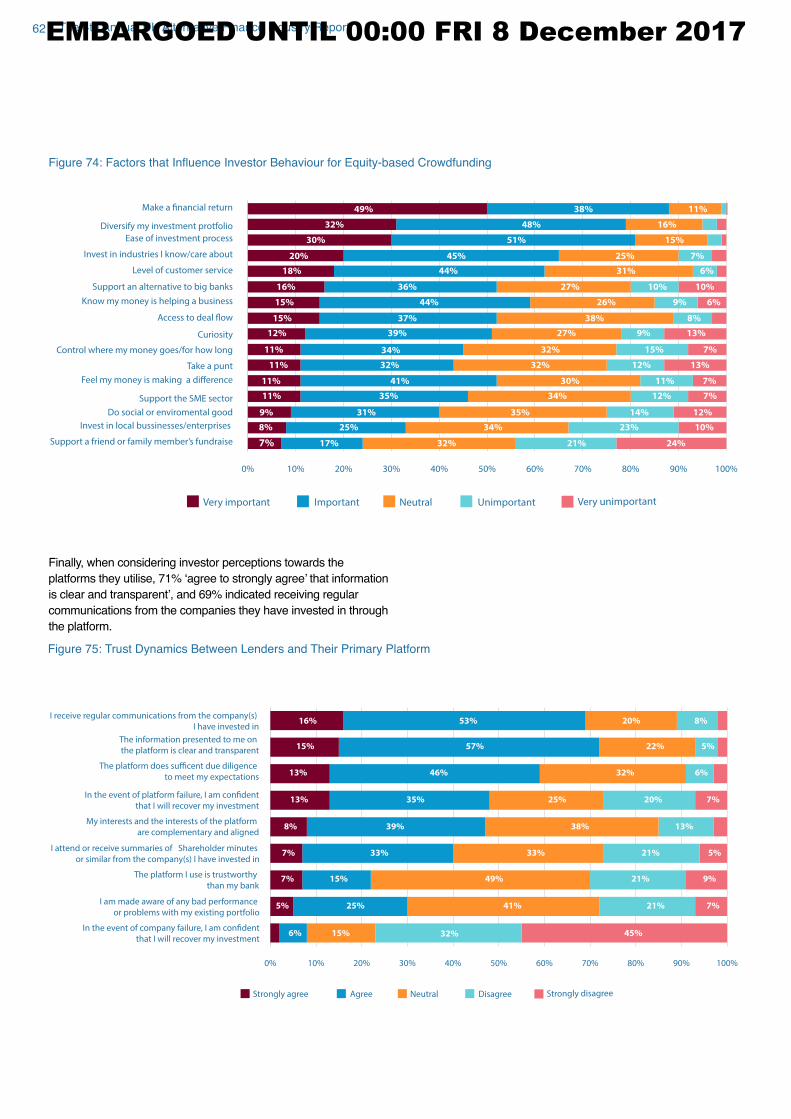
62 The 4th Annual UK Alternative Finance Industry Report
25%
0% 10% 20% 30% 40% 50% 60% 70% 80% 90% 100%
Take a punt
Curiosity
Know my money is helping a business
Invest in industries I know/care about
Invest in local bussinesses/enterprises
Do social or enviromental good
Support an alternative to big banks
Support the SME sector
Control where my money goes/for how long
Ease of investment process
Diversify my investment protfolio
Support a friend or family member’s fundraise
Make a financial return
Feel my money is making a difference
Access to deal flow
Level of customer service
21%
10%
39%
37%
44%
36%
44%
25%
34%
31% 6%
20% 7%
38% 11%
13%
23%
35% 14%
12% 7%
31%
35%
41% 30% 11% 7%
34%
8%
7%
8%
6%9%
32%
27%
49%
38%
26%
27%
13%
32%11%
11% 34% 32% 15%
32%7% 17%
16%48%
30% 51% 15%
32%
10% 10%
9%
9%
11%
11%
25%
12%
12%
24%
12%
15%
15%
16%
18%
45%
Very important Important Neutral Unimportant Very unimportant
0% 10% 20% 30% 40% 50% 60% 70% 80% 90% 100%
In the event of company failure, I am confident
that I will recover my investment
I am made aware of any bad performance
or problems with my existing portfolio
The platform I use is trustworthy
than my bank
I attend or receive summaries of Shareholder minutes
or similar from the company(s) I have invested in
My interests and the interests of the platform
are complementary and aligned
I receive regular communications from the company(s)
I have invested in
In the event of platform failure, I am confident
that I will recover my investment
The platform does sufficent due diligence
to meet my expectations
The information presented to me on
the platform is clear and transparent
15%
46%
9%21%49%15%7%
5%57%15%
16% 53% 8%
33%
38% 13%39%8%
32%
20%
22%
20%
33%
21%
5%
6%
7%
13%
6%
5% 25% 41%
32% 45%
25%
21%
7%
7%
13% 35%
Strongly agree Agree Neutral Disagree Strongly disagree
Finally, when considering investor perceptions towards the
platforms they utilise, 71% ‘agree to strongly agree’ that information is clear and transparent’, and 69% indicated receiving regular communications from the companies they have invested in through
the platform.
Figure 74: Factors that Influence Investor Behaviour for Equity-based Crowdfunding
Figure 75: Trust Dynamics Between Lenders and Their Primary Platform
EMBARGOED UNTIL 00:00 FRI 8 December 2017
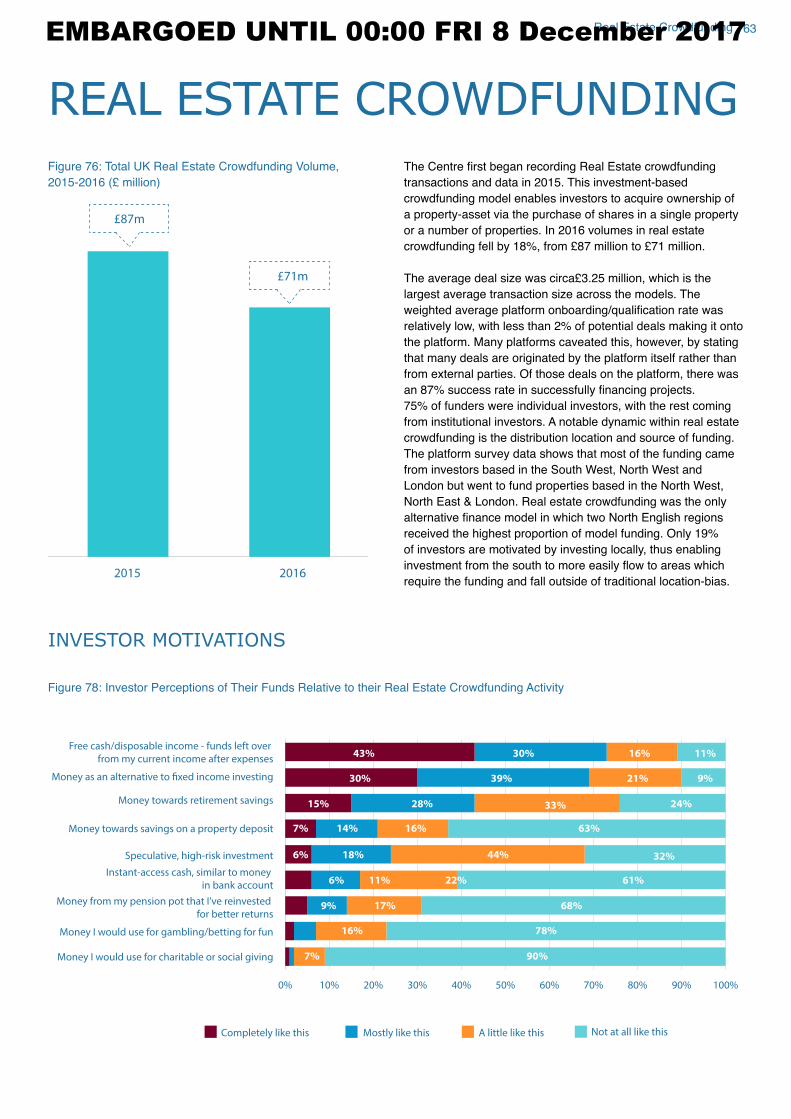
63Real Estate Crowdfunding
REAL ESTATE CROWDFUNDING
£87m
£71m
2015 2016
The Centre first began recording Real Estate crowdfunding transactions and data in 2015. This investment-based
crowdfunding model enables investors to acquire ownership of
a property-asset via the purchase of shares in a single property
or a number of properties. In 2016 volumes in real estate
crowdfunding fell by 18%, from £87 million to £71 million.
The average deal size was circa£3.25 million, which is the largest average transaction size across the models. The
weighted average platform onboarding/qualification rate was relatively low, with less than 2% of potential deals making it onto
the platform. Many platforms caveated this, however, by stating
that many deals are originated by the platform itself rather than
from external parties. Of those deals on the platform, there was
an 87% success rate in successfully financing projects. 75% of funders were individual investors, with the rest coming
from institutional investors. A notable dynamic within real estate
crowdfunding is the distribution location and source of funding.
The platform survey data shows that most of the funding came
from investors based in the South West, North West and
London but went to fund properties based in the North West,
North East & London. Real estate crowdfunding was the only
alternative finance model in which two North English regions received the highest proportion of model funding. Only 19%
of investors are motivated by investing locally, thus enabling
investment from the south to more easily flow to areas which require the funding and fall outside of traditional location-bias.
Figure 76: Total UK Real Estate Crowdfunding Volume,
2015-2016 (£ million)
INVESTOR MOTIVATIONS
0% 10% 20% 30% 40% 50% 60% 70% 80% 90% 100%
Money I would use for charitable or social giving
Money I would use for gambling/betting for fun
Money towards savings on a property deposit
Instant-access cash, similar to money
in bank account
Speculative, high-risk investment
Money from my pension pot that I’ve reinvested
for better returns
Money towards retirement savings
Free cash/disposable income - funds left over
from my current income after expenses
Money as an alternative to fixed income investing
90%
28%
68%
21% 9%39%30%
43% 30% 16% 11%
61%
44%
22%
32%
9%
6%
24%
18%
33%
63%
15%
7%
16% 78%
16%
6%
17%
11%
7% 14%
Completely like this Mostly like this A little like this Not at all like this
Figure 78: Investor Perceptions of Their Funds Relative to their Real Estate Crowdfunding Activity
EMBARGOED UNTIL 00:00 FRI 8 December 2017
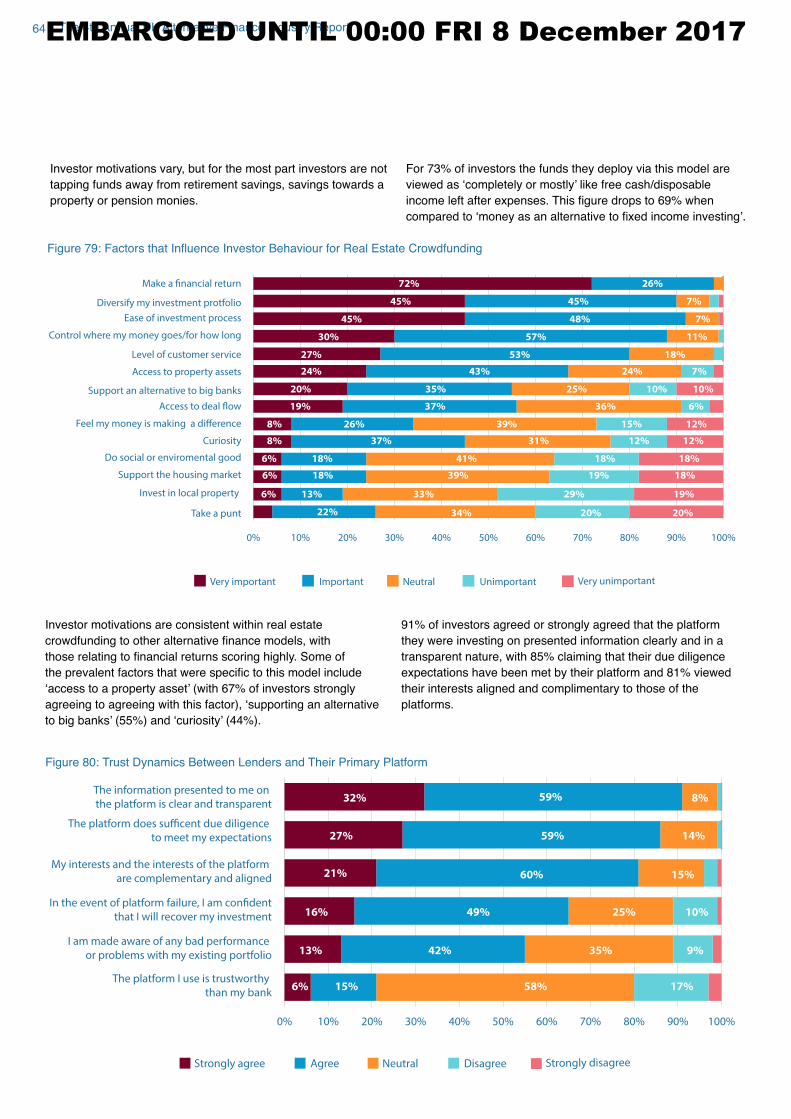
64 The 4th Annual UK Alternative Finance Industry Report
0% 10% 20% 30% 40% 50% 60% 70% 80% 90% 100%
Take a punt
Curiosity
Access to deal flow
Do social or enviromental good
Support an alternative to big banks
Access to property assets
Control where my money goes/for how long
Ease of investment process
Diversify my investment protfolio
Level of customer service
Make a financial return
Feel my money is making a difference
Support the housing market
Invest in local property
20%
37%
35%
43%
53%
57%
45%
29%
48% 7%45%
72% 26%
19%
39% 19%
18% 18%
18%
18%
37% 31% 12% 12%
41%
13%
10%10%
7%
7%
39%
36%
25%
24%
18%
11%
15%26%
20%22% 34%
6%
6%
6%
6%
8%
8%
33%
18%
12%
19%
20%
24%
27%
30%
45%
Very important Important Neutral Unimportant Very unimportant
Figure 79: Factors that Influence Investor Behaviour for Real Estate Crowdfunding
Investor motivations vary, but for the most part investors are not
tapping funds away from retirement savings, savings towards a
property or pension monies.
For 73% of investors the funds they deploy via this model are
viewed as ‘completely or mostly’ like free cash/disposable income left after expenses. This figure drops to 69% when compared to ‘money as an alternative to fixed income investing’.
0% 10% 20% 30% 40% 50% 60% 70% 80% 90% 100%
The platform I use is trustworthy
than my bank
In the event of platform failure, I am confident
that I will recover my investment
The platform does sufficent due diligence
to meet my expectations
The information presented to me on
the platform is clear and transparent
I am made aware of any bad performance
or problems with my existing portfolio
My interests and the interests of the platform
are complementary and aligned
15%
60%
58%
27% 59% 14%
8%59%32%
17%
35%42%
15%
25%
21%
6%
10%
13% 9%
16% 49%
Strongly agree Agree Neutral Disagree Strongly disagree
Investor motivations are consistent within real estate
crowdfunding to other alternative finance models, with those relating to financial returns scoring highly. Some of the prevalent factors that were specific to this model include ‘access to a property asset’ (with 67% of investors strongly agreeing to agreeing with this factor), ‘supporting an alternative to big banks’ (55%) and ‘curiosity’ (44%).
91% of investors agreed or strongly agreed that the platform
they were investing on presented information clearly and in a
transparent nature, with 85% claiming that their due diligence
expectations have been met by their platform and 81% viewed
their interests aligned and complimentary to those of the
platforms.
Figure 80: Trust Dynamics Between Lenders and Their Primary Platform
EMBARGOED UNTIL 00:00 FRI 8 December 2017
65Community Shares
COMMUNITY SHARES£61m
£44m
2015 2016
The Community shares model accounted for £44 million in 2016, which represents a 28% decrease from £61 million in 2015. The total is still significantly larger than funding in 2012 (£0.3 million) and 2013 (£0.8 million),
Figure 81: Total UK Community Shares
Volume, 2015-2016 (£ million)
DONATION-BASED CROWDFUNDING
£0.8m£2m
£12m
£39.6m
2013 2014 2015 2016
Donation-based crowdfunding raised £39.6 million in 2016, which represents annual growth of 230%. This is the largest
annual growth rate across all alternative finance models. For projects on these platforms, the donation crowdfunding
campaign funding success rate was 56% in 2016.
From 2015 to 2016 the average deal size has increased – from
£1,379 to £1,516. Simultaneously, the number of investors has also increased from 41 to 52.
For all Donation-based funding, the regional location of funders
and fundraisers were predominantly in London – followed by the
North West and the South East respectively.
Figure 83: Total UK Donation-based
Crowdfunding Volume, 2013-2016 (£ million)
EMBARGOED UNTIL 00:00 FRI 8 December 2017
66 The 4th Annual UK Alternative Finance Industry Report
REWARD-BASED CROWDFUNDING
2011
£0.9m
£4.2m
£21m
£26m
£42m
£48m
2012 2013 2014 2015 2016
In 2016 Reward-based crowdfunding accounted for £48 million, a 14% increase from 2015. From 2011 to 2013, Reward-based
crowdfunding increased at triple digit rates. However, while the
model continues to grow, it is doing so at a considerably slower
rate, by 24% in 2014 and 62% in 2015
The successful funding rate has increased in 2016 – from 34%
in 2015 to 42% in 2016. The average deal size for 2016 was
£11,800. For each funding campaign, the average number of investors has decreased – from 326 in 2015 to 228 in 2016.
For all Reward-based funding, the regional location of funders
and fundraisers were predominantly in London – followed by the
South East and the South West respectively.
Figure 82: Total UK Rewards-based Crowdfunding Volume,
2011-2016 (£ million)
EMBARGOED UNTIL 00:00 FRI 8 December 2017
ENDNOTES1. FSB data 2016 https://www.fsb.org.uk/media-centre/small-
business-statistics
2. Business volume is derived from the applicable volume
from P2P Lending, Invoice Trading, Debt-based Securities,
Equity-based Crowdfunding, Real Estate Crowdfunding
and Reward-based and Donation-based Crowdfunding.
In the case of web-scrapped data, 35% of reward-based
crowdfunding was attributed to Business funding.
3. Total Venture Capital includes VC funding to seed, start-up
and early and later stage firms. 4. It should be noted that there exists some discrepancy
in how the BoE and BBA define an SME, and a small business. The BBA makes the following distinction based
on business turnover where the small-sized business
segmentation for SMEs is up to £1m/£2m and the medium-sized business segmentation is up to £25m. For the purpose of this paper, we will adopt the BBA definition.
5. https://www.bba.org.uk/news/statistics/sme-statistics/
6. The CCAF estimates that 90% of P2P Business Lending
borrowers pertain to the Small Business category.
Participants came from the following six models.
7. Loan-based crowdfunding:
● Peer-to-Peer Consumer Lending ● Peer-to-Peer Business Lending ● Peer-to-Peer Property Lending Investment-based crowdfunding:
● Debt-Based Securities ● Equity-Based Crowdfunding ● Real Estate Crowdfunding 8. The UK tracking survey gathered data from UK alternative
finance platforms over the course of 2017 gathering data on market activity in 2016.
9. The data on funders was broadly taken from a research
survey of UK alternative finance funders.10. https://www.gov.uk/government/publications/the-enterprise-
investment-scheme-introduction
11. https://www.gov.uk/guidance/seed-enterprise-investment-
scheme-background
12. https://www.gov.uk/government/publications/social-
investment-tax-relief-factsheet/social-investment-tax-relief
13. https://www.gov.uk/government/publications/income-tax-
innovative-finance-individual-savings-account-and-peer-to-peer-loans/income-tax-innovative-finance-individual-savings-account-and-peer-to-peer-loans
14. https://www.gov.uk/government/publications/personal-
savings-allowance-factsheet/personal-savings-allowance
15. https://www.moneyadviceservice.org.uk/en/articles/self-
invested-personal-pensions
16. Default is defined as failure of payment beyond 90 days. 17. In contrast to the orthodox P2P Lending model, in an
entirely balance sheet driven model (Balance Sheet
Lending) the platform originates the loan (not matching
retail or institutional funds to complete funding) and
therefore assume the credit risk asso¬ciated with these
loans. They operate with an intermediation model that
is more akin to bank lending, by financ¬ing loans with equity and debt on their balance sheet and, like banks,
periodi¬cally refinancing by securitizing pools of the loans they have funded. Retail investors or institutions function
as a syndicate, funding the platform’s dedicated balance sheet. Unlike regulated bank lenders, however, these
balance sheet model platforms do not have access to
deposits to facilitate their lending activity.
18. The following findings refer to the collected granular-level transaction data, representing approximately 80% of the
existing UK P2P Business Lending landscape.
19. A substantial number of loan-use categories had very low
proportions of total loan use and were not included in the
analysis here.
20. For example via Self-Invested Personal Pension (SIPPs) -
21. Default is defined as failure of payment beyond 90 days. 22. At present, the data collected does not indicate the
breakdown of products.
23. As indicated by participating platforms in the Industry-
benchmark survey.
EMBARGOED UNTIL 00:00 FRI 8 December 2017

EMBARGOED UNTIL 00:00 FRI 8 December 2017

Cambridge Centre for Alternative Finance
10 Trumpington Street
Cambridge CB2 1QA
United Kingdom
Email: [email protected]
Tel: +44 (0)1223 339111
EMBARGOED UNTIL 00:00 FRI 8 December 2017