Embed Size (px)
Citation preview
1 23
Population Ecology ISSN 1438-3896Volume 58Number 4 Popul Ecol (2016) 58:535-547DOI 10.1007/s10144-016-0561-2
Vertical stratification of an aviancommunity in New Guinean tropicalrainforest
Kryštof Chmel, Jan Riegert, Luda Paul &Vojtěch Novotný

1 23
Your article is protected by copyright and all
rights are held exclusively by The Society
of Population Ecology and Springer Japan.
This e-offprint is for personal use only
and shall not be self-archived in electronic
repositories. If you wish to self-archive your
article, please use the accepted manuscript
version for posting on your own website. You
may further deposit the accepted manuscript
version in any repository, provided it is only
made publicly available 12 months after
official publication or later and provided
acknowledgement is given to the original
source of publication and a link is inserted
to the published article on Springer's
website. The link must be accompanied by
the following text: "The final publication is
available at link.springer.com”.

ORIGINAL ARTICLE
Vertical stratification of an avian community in New Guineantropical rainforest
Krystof Chmel1,2 • Jan Riegert1 • Luda Paul3 • Vojtech Novotny1,2
Received: 11 July 2016 / Accepted: 9 October 2016 / Published online: 21 October 2016
� The Society of Population Ecology and Springer Japan 2016
Abstract Vertical stratification of avian communities has
been studied in both temperate and tropical forests; how-
ever, the majority of studies used ground-based methods. In
this study we used ground-to-canopy mist nets to collect
detailed data on vertical bird distribution in primary rain
forest in Wanang Conservation Area in Papua New Guinea
(Madang Province). In total 850 birds from 86 species were
caught. Bird abundance was highest in the canopy followed
by the understory and lowest in the midstory. Overall bird
diversity increased towards the canopy zone. Insectivorous
birds represented the most abundant and species-rich
trophic guild and their abundances decreased from the
ground to canopy. The highest diversity of frugivorous and
omnivorous birds was confined to higher vertical strata.
Insectivorous birds did not show any pattern of diversity
along the vertical gradient. Further, insectivores preferred
strata with thick vegetation, while abundance and diversity
of frugivores increased with decreasing foliage density.
Our ground-to-canopy (0–27 m) mist netting, when com-
pared to standard ground mist netting (0–3 m), greatly
improved bird diversity assessment and revealed interest-
ing patterns of avian community stratification along verti-
cal forest strata.
Keywords Bird abundance � Canopy � Diversity of birds �Forest strata � Trophic guilds � Understory
Introduction
Tropical forests are characterised by vertical distribution of
plant biomass that includes wood, leaves, fruits and flow-
ers, leading to stratification of microhabitats and resources
for avian communities (Allee 1926; Smith 1973; Parker
and Brown 2000). In general, forests with higher vertical
heterogeneity are expected to host more diverse avian
communities (MacArthur and MacArthur 1961; Goetz
et al. 2007; Huang et al. 2014). The main assumption of the
hypothesis is that stratification of microhabitats allows the
coexistence of bird species exploiting the same resources
(and thus having similar morphology) due to reduced
interference competition (Koen 1988; Styring and bin
Hussin 2004; Bohm and Kalko 2009; Kwok 2009). A
structurally complex mature tropical forest with high ver-
tical heterogeneity therefore represents a suitable environ-
ment to study habitat partitioning within an avian
community as a mechanism for maintaining high species
diversity (Cody 1974; Schoener 1974). Forest bird com-
munities are known to be vertically stratified in terms of
species composition (Turcek 1951; Dickson and Noble
Electronic supplementary material The online version of thisarticle (doi:10.1007/s10144-016-0561-2) contains supplementarymaterial, which is available to authorized users.
& Krystof Chmel
Jan Riegert
Luda Paul
Vojtech Novotny
1 Department of Zoology, Faculty of Sciences,
University of South Bohemia, Branisovska 1760,
370 05 Ceske Budejovice, Czech Republic
2 Biology Centre, Czech Academy of Sciences, Branisovska
1760, 370 05 Ceske Budejovice, Czech Republic
3 New Guinea Binatang Research Center,
PO Box 604, Madang, Papua New Guinea
123
Popul Ecol (2016) 58:535–547
DOI 10.1007/s10144-016-0561-2
Author's personal copy
1978; Terborgh 1980; Koen 1988; Bohm and Kalko 2009)
overall abundance (Pearson 1971; Bell 1982) and species
diversity (Jayson and Mathew 2003). Therefore, prefer-
ences for certain strata can be one of the main factors
leading to the separation of avian guilds (Holmes and
Recher 1986). For example, the canopy of tropical primary
forest is typically dominated by frugivorous birds (e.g.,
Shanahan and Compton 2001; Naka and Stouffer 2004).
Foliage density (i.e., habitat volume) is thought to be
one of the main factors shaping the distribution of birds
along the vertical forest gradient. In agreement, foliage
density was positively correlated with bird diversity
(MacArthur 1964; Jayson and Mathew 2003) and abun-
dance (Pearson 1971; Bell 1982) in several tropical
regions. Walther (2002a) found that species recorded in
strata with dense vegetation had narrower vertical foraging
niches than species from strata with lower vegetation
density. Therefore, foliage density is likely linked to food
resource availability, although we realize that a close
relation to vegetation density may not apply to all of the
particular food resources (Basset et al. 2003). For instance,
insect abundance depends primarily on the biomass of
young foliage, rather than on total plant biomass (Whitfeld
et al. 2012). Nevertheless, correct assessment of available
food density is extremely difficult to perform for the entire
avian community (Hutto 1990). This applies especially to
the New Guinean bird community due to poor description
of diet composition for many species. Hereafter we there-
fore focused only on the effect of vegetation density on
vertical distribution without sampling of food resources.
Surveys on the stratification of avian communities in
tropical forests are generally difficult to perform. Obser-
vations from the ground may be biased against canopy
dwelling species, as they are often concealed by thick
vegetation and may be detected at a lower rate (Blake and
Loiselle 2001). Ground-based methods can be transferred
to the canopy using canopy cranes (Walther 2002b, 2003)
or walkways. However, it should be noted, that the latter
method has, so far, only been used for studies on stratifi-
cation of different taxa (Schulze et al. 2001) or for mist
netting birds only at the same height as the walkways
(Stokes et al. 1995). Moreover, although canopy cranes or
canopy walkways provide access to higher forest strata,
this is only over a limited area of the forest, usually up to
1 ha. Mist netting is another well-established method for
bird community studies providing conditions for precise
identification (including cryptic species), sampling of
genetic material, collecting parasites and morphological
data on captured birds. Although this method enables
precise determination of the vertical position of caught
birds it has rarely been used in higher forest strata and has
not been used to assess the vertical stratification for the
entire community along all strata (for examples see
Humphrey et al. 1968; Meyers and Pardieck 1993; Der-
lindati and Caziani 2005; Vecchi and Alves 2015). Here we
developed a method of mist net sampling along the vertical
forest gradient to explore the stratification of a bird com-
munity in lowland tropical rainforest in Papua New Gui-
nea. Apart from ground-to-canopy mist netting
optimization, we tested the following hypotheses: (1) forest
bird abundances and diversity differ among different strata
and change during the day; (2) main dietary groups show
different patterns of abundances and diversity along the
vertical gradient; and (3) foliage density is linked with the
vertical distribution of the avian community.
Methods
Study site
Field work was carried out from June to November 2013 in
the vicinity of the Swire Research Station located in the
center of the Wanang Conservation Area, Madang Pro-
vince, Papua New Guinea (5�604900S; 145�201900E,approximately 120 m a.s.l.). The conservation area covers
10,000 ha of primary forest and is surrounded by more than
100,000 ha of continuous primary and selectively logged
forest. The annual rainfall is around 3,400 mm, with a mild
dry season from July to September; mean monthly air
temperature around 26 �C (Anderson-Teixeira et al. 2015).
The mean maximum height of trees at the study site was
31 m (excluding scattered emergent trees reaching over
40 m). The best description of local forest vegetation
characteristics has been provided by a survey in adjacent
Wanang 50 ha forest dynamic plot (located approximately
0.5 km from our study site), comprising of 288,000 stems
with DBH[1 cm from 550 species and 211 tons per ha of
live aboveground plant biomass (Anderson-Teixeira et al.
2015; Vincent et al. 2015). So far, 135 species of birds have
been recorded in Wanang Conservation Area (K. Chmel,
unpublished data). The vertical temperature profile of the
forest was obtained from three data loggers installed at 1,
14 and 27 m above the ground in shaded locations avoiding
direct sunlight. Temperature data were collected at 30 min
intervals from 6th of August to 23rd of November 2013 at
one of the mist netting sites.
Mist netting
The vertical distribution of the forest bird community was
studied by installing mist nets from the ground to the
canopy. The method of installation was similar to that of
Humphrey et al. (1968). We selected a site in primary
forest where we could stack a series of 3 m high and 18 m
long mist nets one above the other, thus creating a large
536 Popul Ecol (2016) 58:535–547
123
Author's personal copy

mist net stretching from the ground to the lower canopy.
Smaller trees, branches and lianas (\10 cm in diameter)
were cut in order to make room (approximately 1.5 m wide
vertical space free of vegetation) for the mist nets. Thus,
only the presence of larger trees ([10 cm in diameter) in
the 18 9 1.5 m area limited mist net site selection. In three
cases mist nets were installed along a fallen tree (between
5–15 years ago) that created just enough space for the
panel of mist nets. We used a catapult to shoot guiding
ropes for the mist nets over branches of large canopy trees,
allowing us to open and close the entire stack of mist nets
as needed (Fig. 1). Mist netting was carried out at 12 pri-
mary forest sites (Fig. 1) spaced 59–147 m apart (mean
103 m). We were able to stack nine mist nets, each of
height 3 m, one above another, reaching a total height of
27 m above the ground at four sites. At the remaining eight
sites, mist nets were installed up to 24 m above the ground
(eight mist nets, each of height 3 m). We used mist nets
with 19 mm mesh size, securing a good capture rate for
small passerines to middle size birds. The largest species
captured were Great Cuckoo-Dove (Reinwardtoena rein-
wardtii) and Eclectus Parrot (Eclectus roratus). Neverthe-
less, mist nets were not suitable for capturing large birds:
e.g., Victoria Crowned Pigeon (Goura victoria), Papuan
Hornbill (Rhyticeros plicatus), Sulphur-crested Cockatoo
(Cacatua galerita), Palm Cockatoo (Probosciger ater-
rimus), Grey Crow (Corvus tristis) and birds of prey (Ac-
cipitriformes). In addition, large terrestrial species such as
Northern Cassowary (Casuarius unappendiculatus) and
Red-legged Brush Turkey (Talegalla jobiensis) were not
present in our dataset.
Mist nets were opened at 6:00 and closed before 18:00
depending on weather conditions (mean 8.9, range
1–11.7 h). The mist nets were closed during strong winds
Fig. 1 Mist netting site showing position and operation of ground-to-canopy mist nets. Bottom right map with positions of mist netting sites
(1–12), Swire field station and small rivers (Wanang and Digitam rivers, approximately 3 m wide)
Popul Ecol (2016) 58:535–547 537
123
Author's personal copy
or rains to prevent captured birds from injury or
hypothermia. We were able to carry out mist netting
simultaneously at three out of 12 sites, this was usually
done for two consecutive days. On average, mist netting
was carried out for a total of 89 h (range 75–93 h) on 10
different days (9–11 days) at each site (Table 1) and the
total exposure reached was 1,918,152 net-meter-hours.
Captured birds were extracted from mist nets and cap-
ture time, site number, and height above ground (at 3 m
intervals) were recorded. Each bird was ringed with an
individual color code or nail-varnish paint code (specific
dots on the beak) for a few species where suitable size of
color ring was not available. The birds were then measured
and released.
Additional ground level mist netting, which served as a
comparison with the ground-to-canopy technique, was
conducted in 2015 (between 12 March and 10 April and
between 28 November and 4 December) at 6 different sites
in Wanang conservation area. All sites were located in
primary forest. Mist netting was carried out for 3 days at
each site resulting in a total of 18 mist netting days
(138.5 h). Mist nets (mean length per site 174.2 m, range
120–252 m) were opened for a mean of 7.7 h per day
(range 5.25–10 h) resulting in the total of 457,632 net-
meter-hours of exposure. We used mist nets with identical
dimensions to those used for ground-to-canopy mist netting
(length 18 m, height 3 m, mesh-size 19 mm). These nets
were installed only at ground level (reaching 3 m above
ground).
Vegetation survey
The heights of the tallest trees in the vicinity of each
capture site were measured. Further, we estimated the
foliage density profile according to Radtke and Bolstad
(2001), who assessed the vegetation structure from its
intercepts with multiple vertical laser beams. The final
values of foliage density (leaf area index) between two
heights (h1, h2) were computed using the following equa-
tion: FDh1;h2 ¼ lnðuðh1Þ=u ðh2ÞÞ, developed by (MacAr-
thur and MacArthur 1961; MacArthur and Horn 1969),
where u (h) is the number of intercepts with vegetation
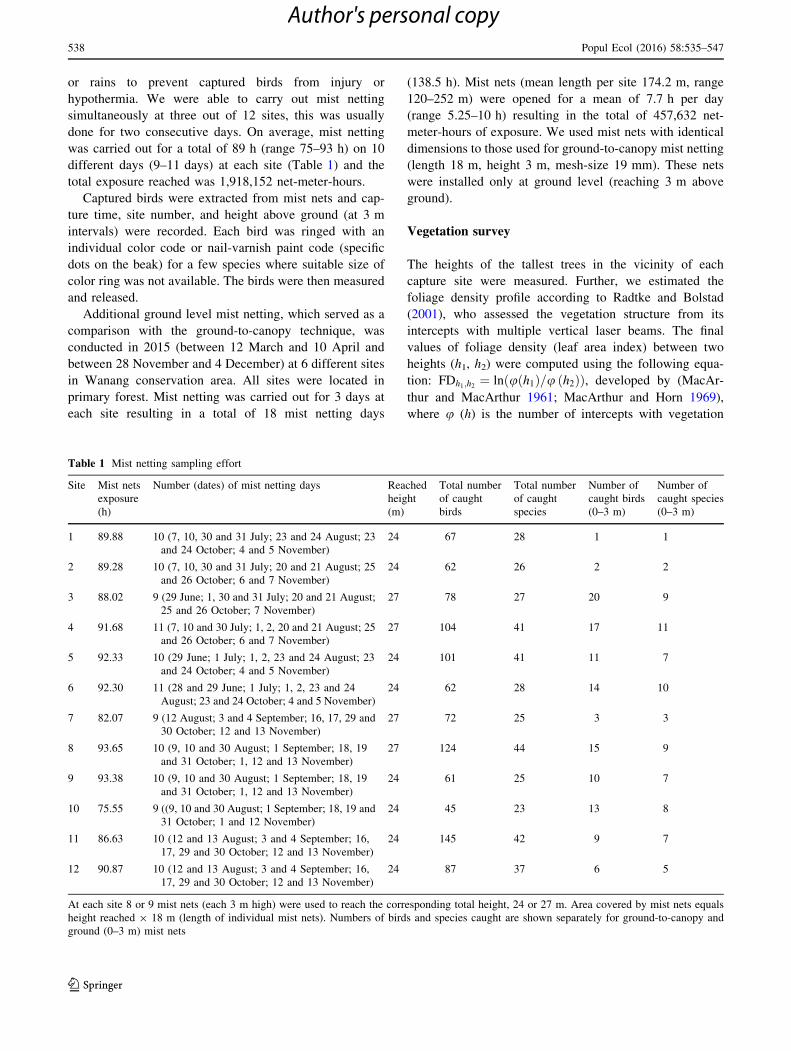
Table 1 Mist netting sampling effort
Site Mist nets
exposure
(h)
Number (dates) of mist netting days Reached
height
(m)
Total number
of caught
birds
Total number
of caught
species
Number of
caught birds
(0–3 m)
Number of
caught species
(0–3 m)
1 89.88 10 (7, 10, 30 and 31 July; 23 and 24 August; 23
and 24 October; 4 and 5 November)
24 67 28 1 1
2 89.28 10 (7, 10, 30 and 31 July; 20 and 21 August; 25
and 26 October; 6 and 7 November)
24 62 26 2 2
3 88.02 9 (29 June; 1, 30 and 31 July; 20 and 21 August;
25 and 26 October; 7 November)
27 78 27 20 9
4 91.68 11 (7, 10 and 30 July; 1, 2, 20 and 21 August; 25
and 26 October; 6 and 7 November)
27 104 41 17 11
5 92.33 10 (29 June; 1 July; 1, 2, 23 and 24 August; 23
and 24 October; 4 and 5 November)
24 101 41 11 7
6 92.30 11 (28 and 29 June; 1 July; 1, 2, 23 and 24
August; 23 and 24 October; 4 and 5 November)
24 62 28 14 10
7 82.07 9 (12 August; 3 and 4 September; 16, 17, 29 and
30 October; 12 and 13 November)
27 72 25 3 3
8 93.65 10 (9, 10 and 30 August; 1 September; 18, 19
and 31 October; 1, 12 and 13 November)
27 124 44 15 9
9 93.38 10 (9, 10 and 30 August; 1 September; 18, 19
and 31 October; 1, 12 and 13 November)
24 61 25 10 7
10 75.55 9 ((9, 10 and 30 August; 1 September; 18, 19 and
31 October; 1 and 12 November)
24 45 23 13 8
11 86.63 10 (12 and 13 August; 3 and 4 September; 16,
17, 29 and 30 October; 12 and 13 November)
24 145 42 9 7
12 90.87 10 (12 and 13 August; 3 and 4 September; 16,
17, 29 and 30 October; 12 and 13 November)
24 87 37 6 5
At each site 8 or 9 mist nets (each 3 m high) were used to reach the corresponding total height, 24 or 27 m. Area covered by mist nets equals
height reached 9 18 m (length of individual mist nets). Numbers of birds and species caught are shown separately for ground-to-canopy and
ground (0–3 m) mist nets
538 Popul Ecol (2016) 58:535–547
123
Author's personal copy
exceeding height h. We calculated foliage density for each
3 m vertical interval (0–3, 3–6, 6–9, 9–12, 12–15, 15–18,
18–21, 21–24, 24–27 m) at each of the 12 sites separately.
Vegetation measurements were taken with a Leica Disto
D5 laser range finder (range 0.05–200 m with measuring
accuracy ±1.5 mm). The range finder was fixed in a hor-
izontal position to ensure vertical laser beams. Measure-
ments of intercepts with vegetation were performed along
four transects parallel to mist nets at each capture site, laid
out at 1 and 2 m distances on each side of the mist net. The
measurements were taken at approximately 25 cm intervals
along the transects, resulting in approximately 70 mea-
surements per transect and 280 measurements per one mist
net site.
Statistical analyses
Spearman rank correlation was used for relationships
between bird and environmental variables. Two-way
ANOVA was used to test the differences in temperature
between forest zones and time of day. The effect of capture
site and repeated mist netting on abundance of caught birds
was analyzed by Generalized linear model (GLM). An
identical method was also used for the analyses of seasonal
differences in abundances of trophic guilds along the ver-
tical gradient, where two mist netting periods: 28 July–4
September and 16 October–13 November were compared.
We also tested the interactions between height above
ground and mist netting period. The influence of temper-
ature (daily means per hour) on total abundance (pooled for
twelve sites) was tested by linear regression models sepa-
rately for three 9 m vertical bands (0–9, 9–18 and 18–27 m
above ground). The temperature measurements were car-
ried out at one site only, therefore its effect was analyzed
separately from the following model. Changes in abun-
dance and diversity of captured birds with height above
ground and foliage density and time of day were analyzed
for the whole community and individual trophic guilds by
Generalized linear mixed models (GLMM) with Gaussian
distribution of dependent variables and using capture site
as a random factor. We also tested interactions among
explanatory variables as well as adding quadratic polyno-
mial functions to the model to test if those significantly
improved the process of finding the best fitting model.
Models were fitted using R package Lme4 based on AIC
values. Post-hoc pair-wise comparisons among different
day times were made using Tukey contrasts (multicomp
package in R). All the above mentioned tests and data
visualization were performed in the programs: R 3.1.1 and
STATISTIKA 12.
Canonical correspondence analysis (CCA) was per-
formed for each trophic guild in order to assess the effect of
height above ground and time of day (explanatory
variables) on species abundances (response variables).
Statistical significance was obtained by Monte Carlo per-
mutation tests with 999 permutations, using software
Canoco5 (ter Braak and Smilauer 2012). Singletons and
doubletons (n = 29) were excluded from these analyses.
In all models, abundance of birds was represented by
standardized net-meter-hour capture rate: [number of
caught birds (n)/length of mist net (m)/mist nets exposure
(hours)]. Alternatively, we used a Shannon–Wienner
diversity index (Shannon 1948) to analyze community and
trophic guilds’ diversity. The effect of individual sites was
eliminated by setting site as a random factor in GLMM and
as a covariate in CCA. In GLMM and CCA height above
ground (in 3 m intervals) was used as a continuous
explanatory variable. In contrast, time of day was divided
into four 3-h intervals (between 6:00 and 18:00) and was
considered as a categorical variable.
Species were divided into three main trophic guilds
[frugivores, insectivores and omnivores; Table S1 in
Electronic Supplementary Material (ESM)] according to
information on diet obtained from Tvardıkova (2013) and
del Hoyo et al. (2016). Among omnivores there were
subgroups of birds feeding on a combination of fruit/nectar,
fruit/insect or insect/nectar. However, in order to avoid
misleading interpretation caused by small sample size, in
statistical models these subgroups were pooled into omni-
vores only. Birds of prey with less than four recorded
individuals (Accipiter poliocephalus—3 individuals, Uro-
glaux dimorpha—1 individual) were excluded from the
analyses of trophic guilds. Small vertebrate prey that is part
of the diet of several species (e.g., Alcedinidae) was clas-
sified as insect prey. The functional difference between
large insect and small vertebrate prey was negligible for
our purposes.
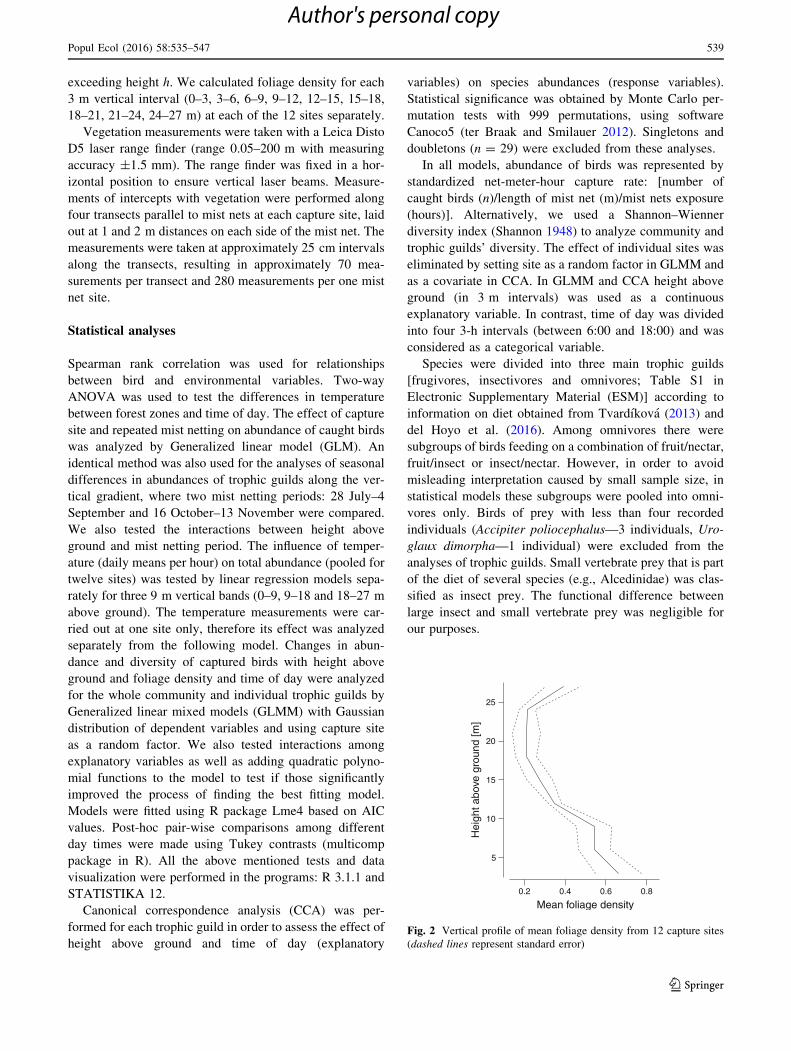
Fig. 2 Vertical profile of mean foliage density from 12 capture sites
(dashed lines represent standard error)
Popul Ecol (2016) 58:535–547 539
123
Author's personal copy
Results
The vertical foliage profile of forest surrounding the mist
netting sites was characterized by very high foliage density
in the lower strata (0–9 m) and at the vertical band between
24–27 m above the ground. Other vertical zones (between
9–24 m above ground) had much lower values of foliage
density (Fig. 2). However, we found a significant negative
correlation between height above ground and foliage den-
sity at mist netting sites (Spearman rank correlation,
rs = -0.55, n = 100, P\ 0.001), therefore foliage density
was not used in individual models as an explanatory
variable together with height above ground. Forest air
temperature, measured at 1, 14 and 27 m above ground,
differed vertically and temporally (two-way ANOVA;
height above ground: F2 = 480.8, P\ 0.001; day-time:
F9 = 304.7, P\ 0.001). The highest temperatures were
reached around 13:00 at 27 m above ground (Fig. S1 in
ESM).
In total, 850 individual birds (from 84 species) were
captured, some of them repeatedly, resulting in 1008 cap-
tures (Table S1 in ESM) Abundance of birds (capture rate)
differed significantly among the 12 sites but did not
decrease or increase with repeated controls at the same
Table 2 Results of the best GLMM models testing the influence of
time of day (time), foliage density (FD) and height above ground
(height) on the abundance (captures per net-meter-hour) and diversity
(Shannon diversity index) of the avian forest community and three
different trophic guilds (FR frugivores, IN insectivores, OM omni-
vores)
n Model AIC v2 P value
Abundance of birds 400 *1 -4001.8
*Time -4094.7 98.92 \0.001
*Time ? FD -4093.2 0.45 0.4983
*Time ? height -4109.9 17.15 \0.001
*Time ? height ? height2 -4115.7 7.778 0.005
Abundance of trophic guilds 400 FR *1 -4853.9
*VFD -4850.1 14.07 \0.001
*Height -4897.4 45.50 \0.001
*Height ? time -4904.7 13.25 0.004
IN *1 -4385.7
*Time -4481.5 89.82 \0.001
*Time ? FD -4489.8 10.30 0.001
*Time ? height -4488.3 8.76 0.003
OM *1 -4502.6
*Time -4530.7 34.10 \0.001
*Time ? FD -4532.3 3.56 0.059
*Time ? height -4564.3 35.59 \0.001
Diversity of birds 100 *1 321.1
*FD 321.3 1.85 0.174
*Height 298.4 24.73 0.011
*Height ? height2 295.1 5.32 0.021
Diversity of trophic guilds 100 FR *1 152.3
*FD 141.3 13.05 0.003
*Height 107.2 117.62 <0.001
*Height ? height2 100.7 8.53 0.003
IN *1 179.8
*FD 173.5 5.30 0.021
*Height 177.7 1.08 0.299
OM *1 190.0
*FD 190.1 1.18 0.176
*Height 170.2 21.77 <0.001
In all models, the capture site was used as a random factor. Quadratic polynomial functions are shown only when it improved the models.
Significant models (P\ 0.05) are typed in bold
540 Popul Ecol (2016) 58:535–547
123
Author's personal copy
study site (GLM; n = 120; site: F = 6.62, P\ 0.001;
repeated controls: F = 0.29, P = 0.590).
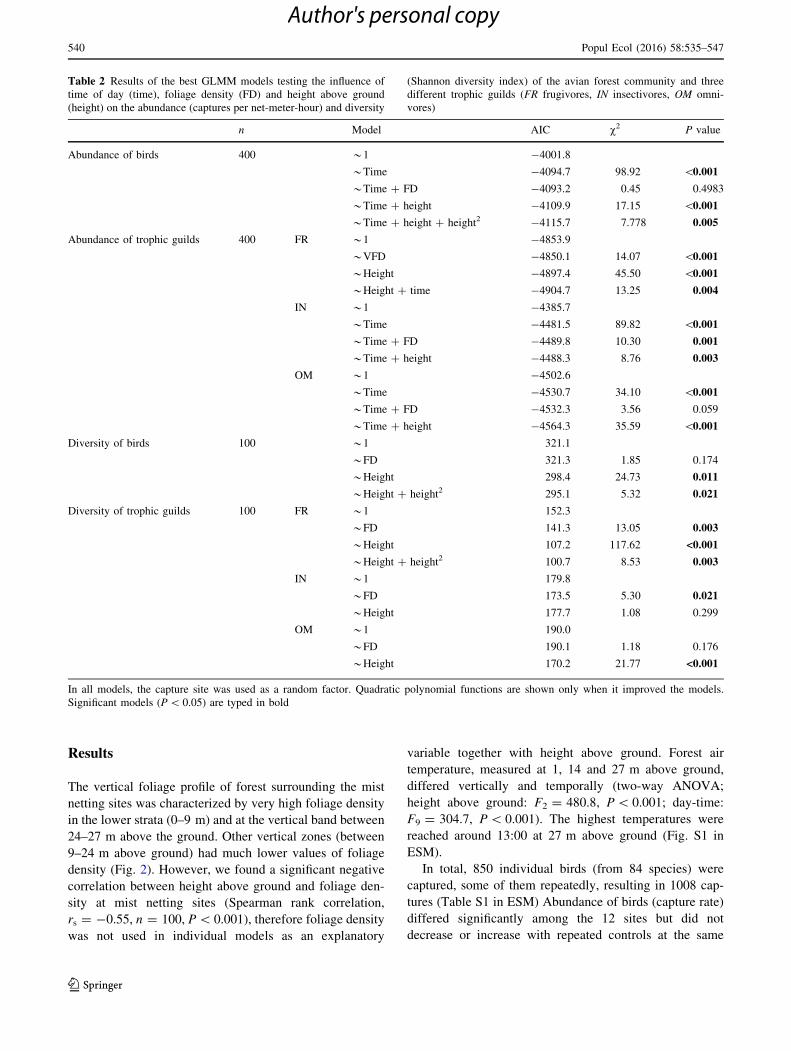
Apart from foliage density, both time of day and net
height affected the capture rates (Table 2). The highest
abundance of birds was recorded during the morning with a
gradual decrease towards the evening (Fig. 3). However,
the abundance of birds did not differ significantly between
the first two morning 3-h intervals (6:00–8:59 vs.
9:00–11:59, P = 0.120). Between the rest of the 3-h time
intervals the difference in abundance was significant
(P\ 0.001). The highest capture rate was recorded in the
top strata (21–27 m) and the lowest in the vertical band
between 9 and 18 above ground. Capture rate near ground
level (0–9 m) was slightly higher compared to midstory
vertical bands (9–18 m, Fig. 3). This explains why the best
fitting model contained the quadratic polynomial function
of height above ground (Table 2). Analysis of temperature
and its effect on abundance of birds (compared for three
9 m vertical bands) showed a significant relationship only
for the lowest strata (0–9 m), where abundance decreased
with increasing temperatures (Fig. S2 in ESM).
Caught birds consisted mainly of insectivores (364
individuals, 449 including recaptures, 40 species) and
omnivores (344 individuals, 411 including recaptures, 28
species) followed by frugivores (137 individuals, 144
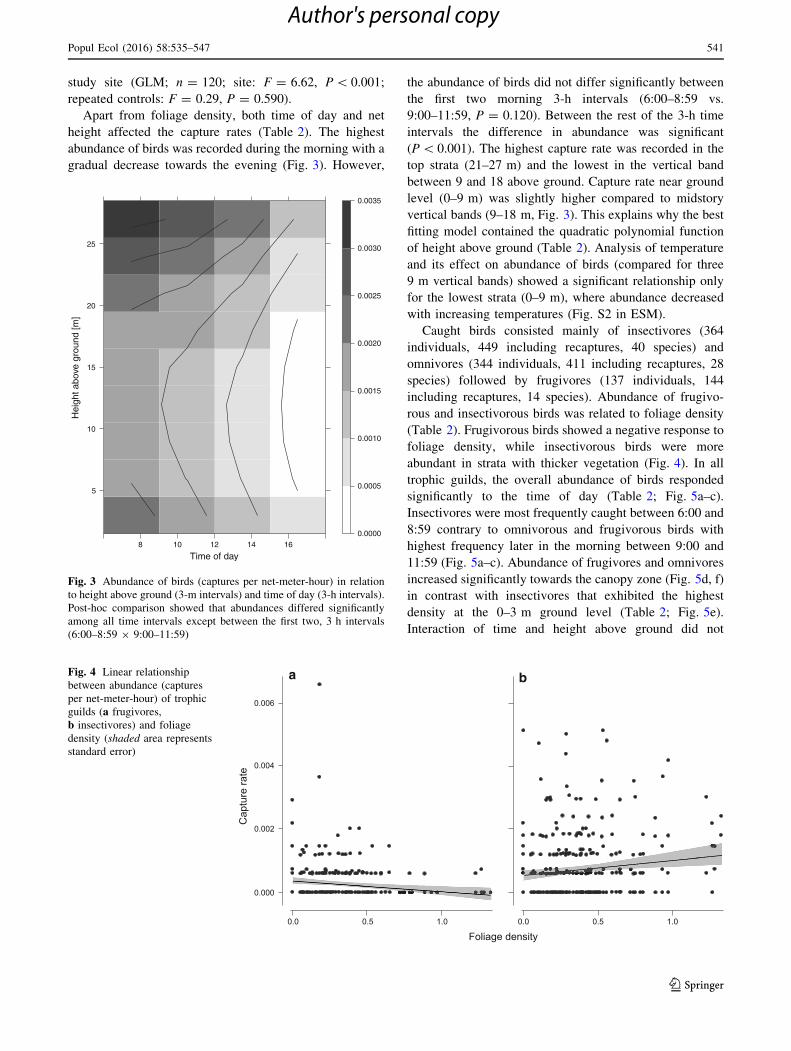
including recaptures, 14 species). Abundance of frugivo-
rous and insectivorous birds was related to foliage density
(Table 2). Frugivorous birds showed a negative response to
foliage density, while insectivorous birds were more
abundant in strata with thicker vegetation (Fig. 4). In all
trophic guilds, the overall abundance of birds responded
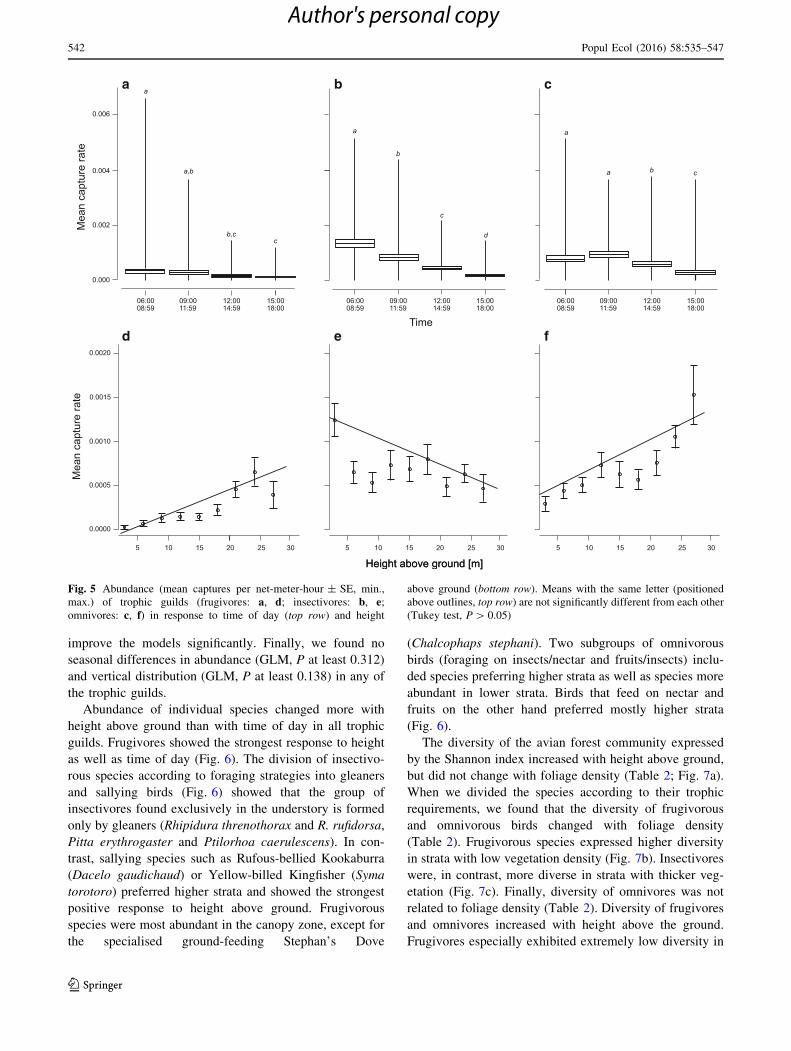
significantly to the time of day (Table 2; Fig. 5a–c).
Insectivores were most frequently caught between 6:00 and
8:59 contrary to omnivorous and frugivorous birds with
highest frequency later in the morning between 9:00 and
11:59 (Fig. 5a–c). Abundance of frugivores and omnivores
increased significantly towards the canopy zone (Fig. 5d, f)
in contrast with insectivores that exhibited the highest
density at the 0–3 m ground level (Table 2; Fig. 5e).
Interaction of time and height above ground did not
Fig. 3 Abundance of birds (captures per net-meter-hour) in relation
to height above ground (3-m intervals) and time of day (3-h intervals).
Post-hoc comparison showed that abundances differed significantly
among all time intervals except between the first two, 3 h intervals
(6:00–8:59 9 9:00–11:59)
a bFig. 4 Linear relationship
between abundance (captures
per net-meter-hour) of trophic
guilds (a frugivores,
b insectivores) and foliage
density (shaded area represents
standard error)
Popul Ecol (2016) 58:535–547 541
123
Author's personal copy
improve the models significantly. Finally, we found no
seasonal differences in abundance (GLM, P at least 0.312)
and vertical distribution (GLM, P at least 0.138) in any of
the trophic guilds.
Abundance of individual species changed more with
height above ground than with time of day in all trophic
guilds. Frugivores showed the strongest response to height
as well as time of day (Fig. 6). The division of insectivo-
rous species according to foraging strategies into gleaners
and sallying birds (Fig. 6) showed that the group of
insectivores found exclusively in the understory is formed
only by gleaners (Rhipidura threnothorax and R. rufidorsa,
Pitta erythrogaster and Ptilorhoa caerulescens). In con-
trast, sallying species such as Rufous-bellied Kookaburra
(Dacelo gaudichaud) or Yellow-billed Kingfisher (Syma
torotoro) preferred higher strata and showed the strongest
positive response to height above ground. Frugivorous
species were most abundant in the canopy zone, except for
the specialised ground-feeding Stephan’s Dove
(Chalcophaps stephani). Two subgroups of omnivorous
birds (foraging on insects/nectar and fruits/insects) inclu-
ded species preferring higher strata as well as species more
abundant in lower strata. Birds that feed on nectar and
fruits on the other hand preferred mostly higher strata
(Fig. 6).
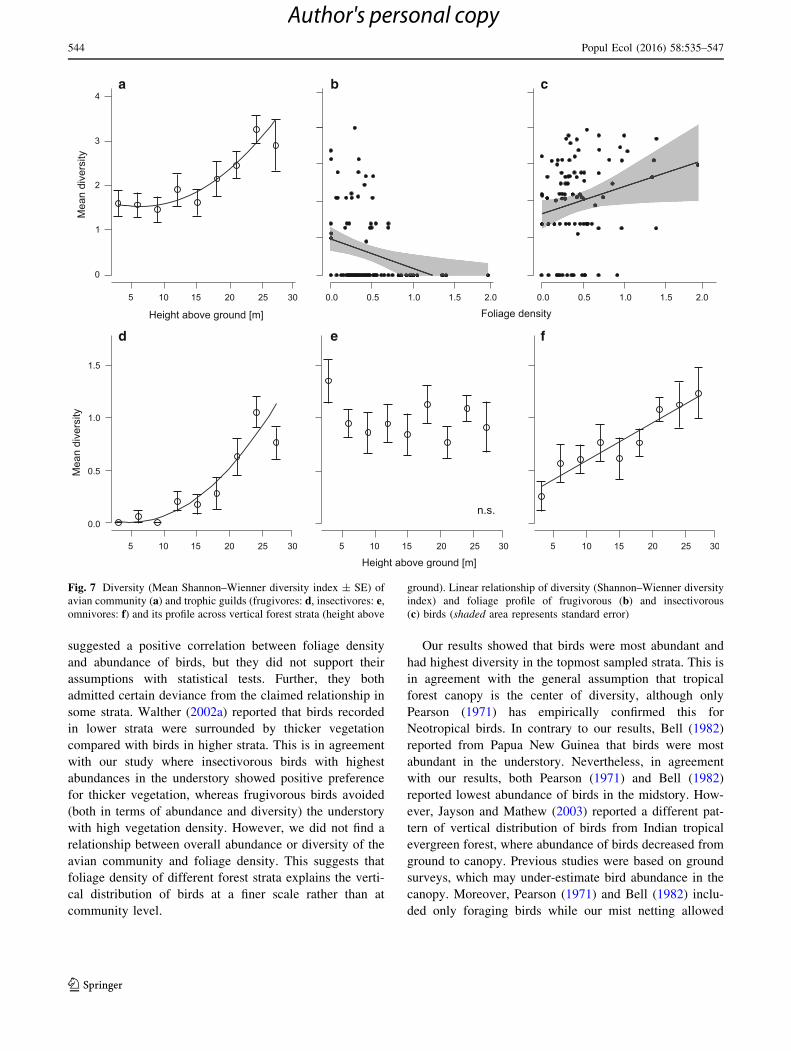
The diversity of the avian forest community expressed
by the Shannon index increased with height above ground,
but did not change with foliage density (Table 2; Fig. 7a).
When we divided the species according to their trophic
requirements, we found that the diversity of frugivorous
and omnivorous birds changed with foliage density
(Table 2). Frugivorous species expressed higher diversity
in strata with low vegetation density (Fig. 7b). Insectivores
were, in contrast, more diverse in strata with thicker veg-
etation (Fig. 7c). Finally, diversity of omnivores was not
related to foliage density (Table 2). Diversity of frugivores
and omnivores increased with height above the ground.
Frugivores especially exhibited extremely low diversity in
a b c
d e f
Fig. 5 Abundance (mean captures per net-meter-hour ± SE, min.,
max.) of trophic guilds (frugivores: a, d; insectivores: b, e;omnivores: c, f) in response to time of day (top row) and height
above ground (bottom row). Means with the same letter (positioned
above outlines, top row) are not significantly different from each other
(Tukey test, P[ 0.05)
542 Popul Ecol (2016) 58:535–547
123
Author's personal copy

lower forest zones. In contrast, diversity of insectivorous
birds did not change significantly with height above ground
(Table 2; Fig. 7d–f).
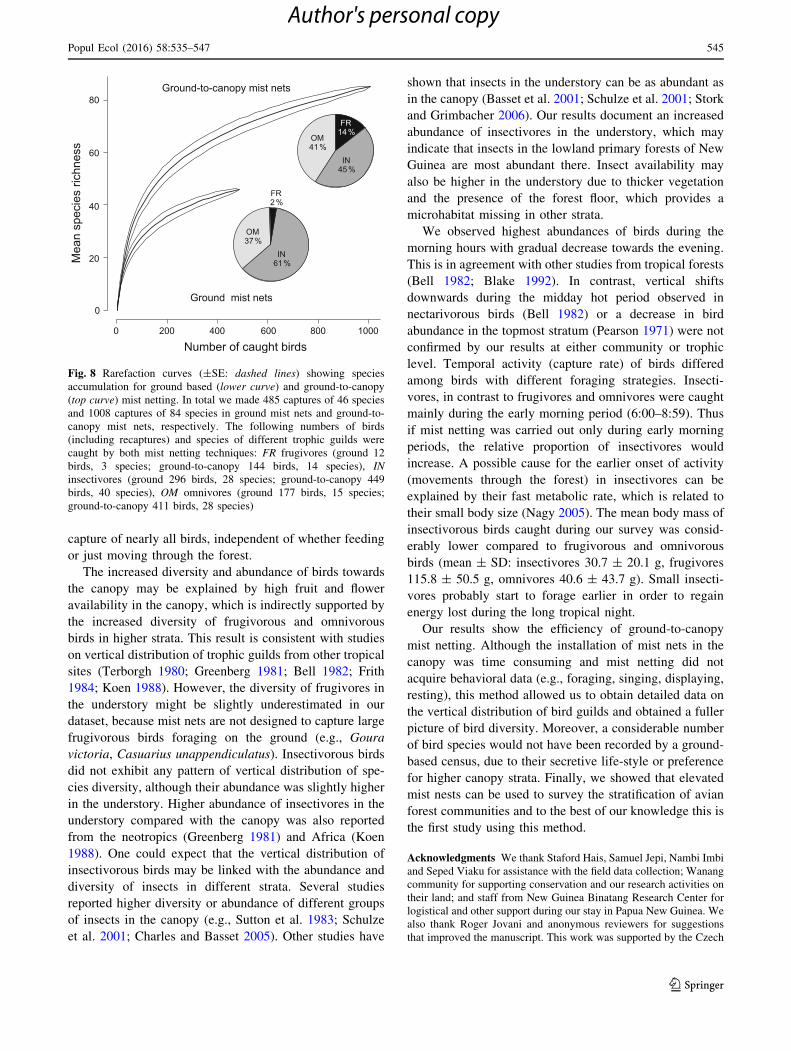
Traditional mist netting, limited only to ground level,
leads to reduced species richness in the sample. Recorded
species richness was significantly lower when ground nets
(0–3 m) were compared to the complete set of ground-to-
canopy mist nets 0–27 m at the same mist netting sites
(numbers of species per site; 0–3 m: median = 7, range
1–11; 0–27 m: median = 28, range 23–44; Mann–Whitney
U test, z2,24 = 4.128, P\ 0.001). In total, the lowest net
captured 100 individuals of 30 species, while the full set of
ground-to-canopy nets captured 850 individuals of 84
species. Even with increased sampling effort, the species
richness recorded with ground nets remains far lower. This
was shown by the ground mist netting (0–3 m) survey that
was carried out in 2015 in the same conservation area. In
total 427 individuals (485 including recaptures) were cap-
tured, but only 46 species were recorded. Moreover, rar-
efaction curves comparing both sampling techniques
showed that ground level mist netting became saturated at a
faster rate (Fig. 8). Therefore, even if the sample size of
ground-to-canopy mist netting was reduced to the same
value as ground mist netting (485 captures), elevated mist
nets would capture approximately 24 species more than
ground mist nets. The most underscored group of birds
caught by ground mist nets were frugivores with only three
captured species: Chalcophaps stephani, Gallicolumba
rufigula and Ptilinopus coronulatus; the first two species
are ground foraging birds. In contrast, the proportion (both
abundance and species richness) of insectivorous birds
caught by ground mist nets was much higher compared
with ground-to-canopy mist nets (Fig. 8). Insectivorous
birds that were caught only in ground-to-canopy mist nets
were canopy dwelling cuckoos (Cuculidae, 7 species),
other birds preferring higher strata (Carterornis chry-
somela, Dicrurus bracteatus, Gerygone palpebrosa, Mi-
croeca flavovirescens, Peltops blainvillii) and aerial
species such as Papuan Spinetail (Mearnsia novaeguineae).
The proportion of omnivorous birds was similar in both
ground-to-canopy and ground mist nets. Omnivorous birds
that were not captured by ground mist nets were mainly
parrots (Cyclopsitta diophthalma, Charmosyna placentis,
Eclectus roratus, Lorius lory, Psittaculirostris edwardsii,
Trichoglossus haematodus) and other birds that are not
often encountered in the understory: Glycichaera fallax,
Lalage atrovirens, Leptocoma serieca, Mino dumontii,
Paradisaea minor.
Discussion
The mean foliage density profile from our capture sites
resembled profiles from other tropical forests characterized
by two peaks of foliage density, one peak in the understory
and the second peak in the canopy strata (Pearson 1971;
Schemske and Brokaw 1981; Bell 1982; Meir et al. 2000;
Walther 2002b). Both Pearson (1971) and Bell (1982)
Fig. 6 CCA diagram visualising the abundance of frugivorous
(empty triangles), insectivorous (empty circles gleaning species, filled
circles sallying species) and omnivorous (bricked diamonds frugiv-
oro-insectivores, grey diamonds nectarivoro-insectivores, empty dia-
monds nectarivoro-frugivores, black diamond non-classified
omnivore) species in relation to height above ground (height) and
time of day (6–9, 9–12, 12–15, 15–18 h). The first two ordination
axes explained 3.09 % of total variation. Values of explained
variation (%), Pseudo-F statistics (F) and P level (P) for explanatory
variables (height and time) obtained by Canonical Correspondence
Analysis (covariate: capture site, Monte Carlo test with 999
permutations) of trophic guilds: frugivores (height 7.5 %, F = 6.6,
P = 002; time 3.3 %, F = 2.8, P = 0.006), insectivores (height
2.5 %, F = 4.9, P = 0,002; time 1.6 %, F = 3.1, P = 0.002),
omnivores (height 2.8 %, F = 5.6, P = 0,002; time 1.3 %,
F = 2.6, P = 0.004). Species codes: AA, Alcedo azurea; AI, Arses
insularis; AM, Aplonis metallica; CC, Carterornis chrysomela; CeS;
Ceyx solitarius; ChS, Chalcophaps stephani; CiR, Cicinnurus regius;
ClM, Colluricincla megarhyncha; CnM, Coracina melas; CrM,
Crateroscelis murina; CV, Cacomantis variolosus; DB, Dicrurus
bracteatus; DG, Dacelo gaudichaud; GC, Gerygone chrysogaster;
GF, Glycichaera fallax; GG, Geoffroyus geoffroyi; GI, Garritornis
isidorei; GP, Gerygone palpebrosa; LA, Loriculus aurantiifrons; LL,
Lorius lory; MA, Myiagra alecto; MaF, Machaerirhynchus flaviven-
ter; MaN, Macropygia nigrirostris; ME, Myzomela eques; MeN,
Melanocharis nigra; MiF, Microeca flavovirescens; MM, Melilestes
megarhynchus; MP, Micropsitta pusio; Mpa, Meliphaga analoga/M.
aruensis; PaC, Ptilorrhoa caerulescens; PaS, Pachycephala simplex;
PF, Pitohui ferrugineus; PH, Poecilodryas hypoleuca; PhM, Philemon
meyeri; PI, Ptilinopus iozonus; PiE, Pitta erythrogaster; PK, Pitohui
kirhocephalus; PP, Ptilinopus pulchellus; PsE, Psittaculirostris
edwardsii; PtC, Ptilinopus coronulatus; PtM, Ptilinopus magnificus;
PtS, Ptilinopus superbus; RL, Rhipidura leucothorax; RR, Reinward-
toena reinwardtii; RRd, Rhipidura rufidorsa; RRv, Rhipidura
rufiventris; RT, Rhipidura threnothorax; SG, Symposiachrus guttula;
SM, Symposiachrus manadensis; ST, Syma torotoro; TG, Tanysiptera
galatea; TH, Trichoglossus haematodus; TN, Toxorhamphus novae-
guineae; XF, Xanthotis flaviventer
Popul Ecol (2016) 58:535–547 543
123
Author's personal copy
suggested a positive correlation between foliage density
and abundance of birds, but they did not support their
assumptions with statistical tests. Further, they both
admitted certain deviance from the claimed relationship in
some strata. Walther (2002a) reported that birds recorded
in lower strata were surrounded by thicker vegetation
compared with birds in higher strata. This is in agreement
with our study where insectivorous birds with highest
abundances in the understory showed positive preference
for thicker vegetation, whereas frugivorous birds avoided
(both in terms of abundance and diversity) the understory
with high vegetation density. However, we did not find a
relationship between overall abundance or diversity of the
avian community and foliage density. This suggests that
foliage density of different forest strata explains the verti-
cal distribution of birds at a finer scale rather than at
community level.
Our results showed that birds were most abundant and
had highest diversity in the topmost sampled strata. This is
in agreement with the general assumption that tropical
forest canopy is the center of diversity, although only
Pearson (1971) has empirically confirmed this for
Neotropical birds. In contrary to our results, Bell (1982)
reported from Papua New Guinea that birds were most
abundant in the understory. Nevertheless, in agreement
with our results, both Pearson (1971) and Bell (1982)
reported lowest abundance of birds in the midstory. How-
ever, Jayson and Mathew (2003) reported a different pat-
tern of vertical distribution of birds from Indian tropical
evergreen forest, where abundance of birds decreased from
ground to canopy. Previous studies were based on ground
surveys, which may under-estimate bird abundance in the
canopy. Moreover, Pearson (1971) and Bell (1982) inclu-
ded only foraging birds while our mist netting allowed
a b c
d e f
Fig. 7 Diversity (Mean Shannon–Wienner diversity index ± SE) of
avian community (a) and trophic guilds (frugivores: d, insectivores: e,omnivores: f) and its profile across vertical forest strata (height above
ground). Linear relationship of diversity (Shannon–Wienner diversity
index) and foliage profile of frugivorous (b) and insectivorous
(c) birds (shaded area represents standard error)
544 Popul Ecol (2016) 58:535–547
123
Author's personal copy
capture of nearly all birds, independent of whether feeding
or just moving through the forest.
The increased diversity and abundance of birds towards
the canopy may be explained by high fruit and flower
availability in the canopy, which is indirectly supported by
the increased diversity of frugivorous and omnivorous
birds in higher strata. This result is consistent with studies
on vertical distribution of trophic guilds from other tropical
sites (Terborgh 1980; Greenberg 1981; Bell 1982; Frith
1984; Koen 1988). However, the diversity of frugivores in
the understory might be slightly underestimated in our
dataset, because mist nets are not designed to capture large
frugivorous birds foraging on the ground (e.g., Goura
victoria, Casuarius unappendiculatus). Insectivorous birds
did not exhibit any pattern of vertical distribution of spe-
cies diversity, although their abundance was slightly higher
in the understory. Higher abundance of insectivores in the
understory compared with the canopy was also reported
from the neotropics (Greenberg 1981) and Africa (Koen
1988). One could expect that the vertical distribution of
insectivorous birds may be linked with the abundance and
diversity of insects in different strata. Several studies
reported higher diversity or abundance of different groups
of insects in the canopy (e.g., Sutton et al. 1983; Schulze
et al. 2001; Charles and Basset 2005). Other studies have
shown that insects in the understory can be as abundant as
in the canopy (Basset et al. 2001; Schulze et al. 2001; Stork
and Grimbacher 2006). Our results document an increased
abundance of insectivores in the understory, which may
indicate that insects in the lowland primary forests of New
Guinea are most abundant there. Insect availability may
also be higher in the understory due to thicker vegetation
and the presence of the forest floor, which provides a
microhabitat missing in other strata.
We observed highest abundances of birds during the
morning hours with gradual decrease towards the evening.
This is in agreement with other studies from tropical forests
(Bell 1982; Blake 1992). In contrast, vertical shifts
downwards during the midday hot period observed in
nectarivorous birds (Bell 1982) or a decrease in bird
abundance in the topmost stratum (Pearson 1971) were not
confirmed by our results at either community or trophic
level. Temporal activity (capture rate) of birds differed
among birds with different foraging strategies. Insecti-
vores, in contrast to frugivores and omnivores were caught
mainly during the early morning period (6:00–8:59). Thus
if mist netting was carried out only during early morning
periods, the relative proportion of insectivores would
increase. A possible cause for the earlier onset of activity
(movements through the forest) in insectivores can be
explained by their fast metabolic rate, which is related to
their small body size (Nagy 2005). The mean body mass of
insectivorous birds caught during our survey was consid-
erably lower compared to frugivorous and omnivorous
birds (mean ± SD: insectivores 30.7 ± 20.1 g, frugivores
115.8 ± 50.5 g, omnivores 40.6 ± 43.7 g). Small insecti-
vores probably start to forage earlier in order to regain
energy lost during the long tropical night.
Our results show the efficiency of ground-to-canopy
mist netting. Although the installation of mist nets in the
canopy was time consuming and mist netting did not
acquire behavioral data (e.g., foraging, singing, displaying,
resting), this method allowed us to obtain detailed data on
the vertical distribution of bird guilds and obtained a fuller
picture of bird diversity. Moreover, a considerable number
of bird species would not have been recorded by a ground-
based census, due to their secretive life-style or preference
for higher canopy strata. Finally, we showed that elevated
mist nests can be used to survey the stratification of avian
forest communities and to the best of our knowledge this is
the first study using this method.
Acknowledgments We thank Staford Hais, Samuel Jepi, Nambi Imbi
and Seped Viaku for assistance with the field data collection; Wanang
community for supporting conservation and our research activities on
their land; and staff from New Guinea Binatang Research Center for
logistical and other support during our stay in Papua New Guinea. We
also thank Roger Jovani and anonymous reviewers for suggestions
that improved the manuscript. This work was supported by the Czech
Fig. 8 Rarefaction curves (±SE: dashed lines) showing species
accumulation for ground based (lower curve) and ground-to-canopy
(top curve) mist netting. In total we made 485 captures of 46 species
and 1008 captures of 84 species in ground mist nets and ground-to-
canopy mist nets, respectively. The following numbers of birds
(including recaptures) and species of different trophic guilds were
caught by both mist netting techniques: FR frugivores (ground 12
birds, 3 species; ground-to-canopy 144 birds, 14 species), IN
insectivores (ground 296 birds, 28 species; ground-to-canopy 449
birds, 40 species), OM omnivores (ground 177 birds, 15 species;
ground-to-canopy 411 birds, 28 species)
Popul Ecol (2016) 58:535–547 545
123
Author's personal copy
Ministry of Education and European Commission (CZ.1.07/2.3.00/
20.0064), the Grant Agency of Czech Republic (14-36098G) and the
Grant Agency of the University of South Bohemia (GAJU 156/2013/
P).
References
Allee WC (1926) Distribution of animals in a tropical rain-forest with
relation to environmental factors. Ecology 7:445–468
Anderson-Teixeira KJ, Davies SJ, Bennett AC, Gonzalez-Akre EB,
Muller-Landau HC, Joseph Wright S, Abu Salim K, Almeyda
Zambrano AM, Alonso A, Baltzer JL (2015) CTFS-ForestGEO:
a worldwide network monitoring forests in an era of global
change. Global Change Biol 21:528–549
Basset Y, Aberlenc HP, Barrios H, Curletti G, Berenger JM, Vesco
JP, Causse P, Haug A, Hennion AS, Lesobre L, Marques F,
O’Meara R (2001) Stratification and diel activity of arthropods
in a lowland rainforest in Gabon. Biol J Linn Soc 72:585–607
Basset Y, Miller SE, Novotny V, Kitching RL (eds) (2003)
Arthropods of tropical forests: spatio-temporal dynamics and
resource use in the canopy. Cambridge University Press,
Cambridge
Bell HL (1982) A bird community of New Guinean lowland
rainforest. 3. Vertical distribution of the avifauna. Emu
82:143–162
Blake JG (1992) Temporal variation in point counts of birds in a
lowland wet forest in Costa Rica. Condor 94:265–275
Blake JG, Loiselle BA (2001) Birds assemblages in second-growth
and old-growth forests, Costa Rica: perspectives from mist nets
and point counts. Auk 118:304–326
Bohm SM, Kalko EKV (2009) Patterns of resource use in an
assemblage of birds in the canopy of a temperate alluvial forest.
J Ornithol 150:799–814
Charles E, Basset Y (2005) Vertical stratification of leaf-beetle
assemblages (Coleoptera: Chrysomelidae) in two forest types in
Panama. J Trop Ecol 21:329–336
Cody ML (1974) Competition and structure of bird communities.
Princeton University Press, Princeton
del Hoyo J, Elliott A, Sargatal J, Christie DA, de Juana E (eds) (2016)
Handbook of the birds of the world alive. Lynx Edicions,
Barcelona
Derlindati EJ, Caziani SM (2005) Using canopy and understory mist
nets and point counts to study bird assemblages in Chaco forests.
Wilson Bull 117:92–99
Dickson JG, Noble RE (1978) Vertical distribution of birds in a
Louisiana bottomland hardwood forest. Wilson Bull 90:19–30
Frith D (1984) Foraging ecology of birds in an upland tropical
rainforest in North Queensland. Wildl Res 11:325–347
Goetz S, Steinberg D, Dubayah R, Blair B (2007) Laser remote
sensing of canopy habitat heterogeneity as a predictor of bird
species richness in an eastern temperate forest, USA. Remote
Sens Environ 108:254–263
Greenberg R (1981) The abundance and seasonality of forest canopy
birds on Barro Colorado Island, Panama. Biotropica 13:241–251
Holmes RT, Recher HF (1986) Determinants of guild structure in
forest bird communities: an intercontinental comparison. Condor
88:427–439
Huang Q, Swatantran A, Dubayah R, Goetz SJ (2014) The influence of
vegetation height heterogeneity on forest and woodland bird
species richness across the United States. PLoS One 9(8):e103236
Humphrey PS, Bridge D, Lovejoy TE (1968) A technique for mist-
netting in the forest canopy. Bird-banding 39:43–50
Hutto RL (1990) Measuring the availability of food resources. Stud
Avian Biol 13:20–28
Jayson EA, Mathew DN (2003) Vertical stratification and its relation
to foliage in tropical forest birds in western ghats (India). Acta
Ornithol 38:111–116
Koen JH (1988) Stratal distribution and resource partitioning of birds
in the Knysna Forest, South Africa. Afr J Ecol 26:229–238
Kwok HK (2009) Foraging ecology of insectivorous birds in a mixed
forest of Hong Kong. Acta Ecol Sin 29:341–346
MacArthur RH (1964) Environmental factors affecting bird species
diversity. Am Nat 98:387–397
MacArthur RH, Horn HS (1969) Foliage profile by vertical
measurements. Ecology 50:802–804
MacArthur RH, MacArthur JW (1961) On bird species diversity.
Ecology 42:594–598
Meir P, Grace J, Miranda AC (2000) Photographic method to measure
the vertical distribution of leaf area density in forests. Agric For
Meteorol 102:105–111
Meyers JM, Pardieck KL (1993) Evaluation of three elevated mist-net
systems for sampling birds (Evaluacion de tres sistemas de redes
ornitologicas elevadas para muestrear aves). J Field Ornithol
64:270–277
Nagy KA (2005) Field metabolic rate and body size. J Exp Biol
208:1621–1625
Naka LN, Stouffer PC (2004) Structure and organization of canopy
bird assemblages in Central Amazonia. Auk 121:88–102
Parker GG, Brown MJ (2000) Forest canopy stratification—is it
useful? Am Nat 155:473–484
Pearson DL (1971) Vertical stratification of birds in a tropical dry
forest. Condor 73:46–55
Radtke PJ, Bolstad PV (2001) Laser point-quadrat sampling for
estimating foliage-height profiles in broad-leaved forests. Can J
Forest Res 31:410–418
Schemske DW, Brokaw N (1981) Treefalls and the distribution of
understory birds in a tropical forest. Ecology 62:938–945
Schoener TW (1974) Resource partitioning in ecological communi-
ties. Science 185:27–39
Schulze C, Linsenmair KE, Fiedler K (2001) Understorey versus
canopy: patterns of vertical stratification and diversity among
Lepidoptera in a Bornean rain forest. Plant Ecol 153:133–152
Shanahan M, Compton SG (2001) Vertical stratification of fig-eaters
in Bornean lowland rainforest: how is the canopy different?
Plant Ecol 153:121–132
Shannon CE (1948) A mathematical theory of communication. Bell
Syst Tech J 27:379–423
Smith AP (1973) Stratification of temperature and tropical forests.
Am Nat 107:671–683
Stokes AE, Stokes AE, Schultz BB (1995) Mist netting birds from
canopy platforms. Selbyana 16:144–146
Stork NE, Grimbacher PS (2006) Beetle assemblages from an
Australian tropical rainforest show that the canopy and the
ground strata contribute equally to biodiversity. Proc R Soc Lond
B 273:1969–1975
Styring AR, bin Hussin MZ (2004) Foraging ecology of woodpeckers
in lowland Malaysian rain forests. J Trop Ecol 20:487–494
Sutton SL, Ash CPJ, Grundy A (1983) The vertical distribution of
flying insects in lowland rain-forests of Panama, Papua New
Guinea and Brunei. Zool J Linn Soc-Lond 78:287–297
ter Braak CJ, Smilauer P (2012) Canoco Reference Manual and
User’s Guide: Software for Ordination (version 5.0). Microcom-
puter Power, Ithaca
Terborgh J (1980) Vertical stratification of a Neotropical forest bird
community. Acta XVII Congr Int Orn Berlin 1978:1005–1012
Turcek FJ (1951) O stratifikacii vtacej populacie lesnych biocenoz
typu Querceto-Carpinetum na juznom Slovensku. Sylvia
13:71–86 (in Slovakian)
546 Popul Ecol (2016) 58:535–547
123
Author's personal copy
Tvardıkova K (2013) Diet of land birds along an altitudinal gradient
in Papua New Guinea. Ph.D. Thesis Series, No. 9. University of
South Bohemia, Czech Republic
Vecchi MB, Alves MAS (2015) Bird assemblage mist-netted in an
Atlantic Forest area: a comparison between vertically-mobile
and ground-level nets. Br J Biol 75:742–751
Vincent JB, Henning B, Saulei S, Sosanika G, Weiblen GD (2015)
Forest carbon in lowland Papua New Guinea: local variation and
the importance of small trees. Austral Ecol 40:151–159
Walther BA (2002a) Grounded ground birds and surfing canopy birds:
variation of foraging stratum breadth observed in neotropical
forest birds and tested with simulation models using boundary
constraints. Auk 119:658–675
Walther BA (2002b) Vertical stratification and use of vegetation and
light habitats by Neotropical forest birds. J Ornithol 143:64–81
Walther BA (2003) Why canopy access is essential to understand
canopy birds: four examples from the Surumoni Crane Project.
Ornithol Neotropical 15:41–52
Whitfeld TJ, Novotny V, Miller SE, Hrcek J, Klimes P, Weiblen GD
(2012) Predicting tropical insect herbivore abundance from host
plant traits and phylogeny. Ecology 93:S211–S222
Popul Ecol (2016) 58:535–547 547
123
Author's personal copy