Embed Size (px)
Citation preview
DEVELOPMENT OF SOLUTION TECHNIQUES AND DESIGN GUIDELINES FOR
EQUESTRIAN TRAILS ON PUBLIC LANDS
A Thesis presented to the Faculty of the Graduate School
at the University of Missouri-Columbia
In Partial Fulfillment of the Requirements for the Degree
Master of Science
by
NATHAN KYLE TABOR
Dr. Kathleen Trauth, Thesis Supervisor
MAY 2007

The undersigned, appointed by the dean of the Graduate School, have examined the thesis entitled
DEVELOPMENT OF SOLUTION TECHNIQUES AND DESIGN
GUIDELINES FOR EQUESTRIAN TRAILS ON PUBLIC LANDS
presented by Nathan Kyle Tabor,
a candidate for the degree of Master of Science Degree in Civil Engineering
and hereby certify that, in their opinion, it is worthy of acceptance.
Professor Kathleen Trauth
Professor John Bowders
Professor David Hammer
Professor Randy Miles
Professor Tom Nichols

ii
ACKNOWLEDGEMENTS
I would like to thank my advisor, Dr. Kathleen Trauth. Her guidance and input
has helped me with this project significantly. I also want to thank my professor, Dr. John
Bowders for all of his ideas and help with the project. I would like to thank my
professor, Dr. David Hammer, for input and expertise he has put into this project. I
would like to thank my committee members Dr. Randy Miles, and Dr. Tom Nichols for
their willingness to review my work.
I would like to thank Paul Koenig for his contribution of field and lab equipment.
I would also like to thank Dennis Meinert, from the Missouri Department of Natural
Resources, for his field work in obtaining the soil data. I also want to thank Christopher
Cash and Rhonda Bonnot for their contribution of construction drawings and engineering
expertise.
In addition, I would like to thank the Missouri Department of Conservation and
the Missouri Department of Natural Resources for funding this project. I would also like
to thank all of the area managers and staff at the Department of Conservation who
participated in the project: Ann Koenig, Rick Johnson, Tim Reel, Terry Thompson, and
Tom Trieman. Their willingness and helpfulness, contributed significantly to the
project. I especially want to thank the MDC project coordinator, George Hartman. This
project would not have been successful without his effort. He had all the answers and
solutions to any problem encountered. His input and enthusiasm contributed greatly to
the project.

iii
TABLE OF CONTENTS
ACKNOWLEDGEMENTS................................................................................................ii
LIST OF FIGURES ........................................................................................................... vi
LIST OF TABLES:...........................................................................................................,.ix
ABSTRACT:....................................................................................................................... x
1. INTRODUCTION ...................................................................................................... 1
Hypothesis....................................................................................................................... 2
2. LITERATURE REVIEW ........................................................................................... 4
Impacts from Recreational Trails.................................................................................... 4
Impacts of Horse Trails................................................................................................... 5
Erosion Process............................................................................................................... 5
Factors Influencing Trail Erosion ................................................................................... 6
Climate........................................................................................................................ 7
Vegetation ................................................................................................................... 7
Use .............................................................................................................................. 8
Landscape ................................................................................................................... 9
Soil Type................................................................................................................... 12
Management Solutions.................................................................................................. 13
Trail Layout and Design ........................................................................................... 13
Surface Stabilization ................................................................................................. 15
Literature Summary ...................................................................................................... 19
3. METHODOLOGY ................................................................................................... 20
Public Agency Implications.......................................................................................... 20
iv
Trail Analysis and Design............................................................................................. 20
Conservation Areas................................................................................................... 20
Design ....................................................................................................................... 26
Experimental Design Procedure ............................................................................... 32
Construction.............................................................................................................. 35
Trail Test Segment Monitoring and Testing................................................................. 36
4. RESULTS ................................................................................................................. 38
Definitions..................................................................................................................... 38
Construction and Observations ..................................................................................... 38
Rudolf Bennitt Conservation Area............................................................................ 38
Forest 44 Conservation Area .................................................................................... 47
Angeline Conservation Area..................................................................................... 57
Lime Stabilization Results ............................................................................................ 62
Lab Testing ............................................................................................................... 63
Post-Construction Observations................................................................................ 66
5. DISCUSSION........................................................................................................... 67
Wearing Surface Effectiveness ..................................................................................... 67
Natural Soil Surfaces ................................................................................................ 67
Surface Aggregate without Geosynthetics................................................................ 67
Surface Aggregate with Geosynthetics..................................................................... 68
Effectiveness of Lime Stabilization .......................................................................... 69
Surface Water Control .................................................................................................. 69
Geosynthetic Reinforced Waterbars ......................................................................... 69
Surface Shape............................................................................................................ 70

v
6. CONCLUSIONS....................................................................................................... 71
REFERENCES: ................................................................................................................ 73
A. APPENDIX A: TRAIL MEASUREMENT DATA ................................................ 75
B. APPENDIX B: TRAIL CONSTRUCTION DRAWINGS....................................... 82
C. APPENDIX B: PRELIMINARY GUIDELINES FOR EQUESTRIAN TRAIL
MANAGEMENT.............................................................................................................. 93
vi
LIST OF FIGURES
Figure 2-1. Landscape Location Diagram. ....................................................................... 10
Figure 2-2. Benched Trail Intercepting Subsurface Flow................................................. 12
Figure 2-3. Example of Non-Woven Geotextile Fabrics (Monlux et al., 2000). .............. 17
Figure 2-4. Single-Layer Geotextile Used for Separation on Trails (Monlux et al., 2000).
............................................................................................................................... 17
Figure 2-5. Geotextile Wrap used for Separation and Reinforcement of Fine Grained
Soils (Monlux et al., 2000). .................................................................................. 18
Figure 2-6. Geocells have a Honeycomb Structure (Monlux et al., 2000). ...................... 18
Figure 2-7. Geocells use in a trail application (Monlux et al., 2000). .............................. 18
Figure 3-1. Conservation Areas Under Study................................................................... 21
Figure 3-2. Keswick-Lindley-Gorin Soil Association Block Diagram. (Randolph County
Soil Survey, 1989) ................................................................................................ 22
Figure 3-3. Goss-Gasconade-Menfro Soil Association Block Diagram (St. Louis County
Soil Survey, 1982). ............................................................................................... 24
Figure 3-4. Clarksville-Scholten-Gepp Soil Association Diagram (Shannon County Soil
Survey, 2005)....................................................................................................... 25
Figure 3-5 Niangua-Rueter Soil Association Diagram (Shannon County Soil Survey,
2005). .................................................................................................................... 25
Figure 3-6. Geotextile Wrapped Design Profile. .............................................................. 27
Figure 3-7. Longitudinal Geocell Protection .................................................................... 28
Figure 3-8. Plan View of Stream Crossing. ...................................................................... 28
Figure 3-9. Cross Sectional View of Stream Crossing. ................................................... 29

vii
Figure 3-10. Cross Section of a Broad Based Dip. .......................................................... 30
Figure 3-11. Cross Section of the Modified Broad Based Dip. ........................................ 31
Figure 3-12. Plan View and Profile View of a Grade Reversal........................................ 32
Figure 3-13. Insloped Climbing Turn. ............................................................................. 35
Figure 4-1. Rudolf Bennitt Conservation Area................................................................. 39
Figure 4-2. Rudolf Bennitt Test Section 1. ....................................................................... 40
Figure 4-3. Gully Observed along Section 1. .................................................................. 41
Figure 4-4. Trail Widening near Stream Crossing on Section 1....................................... 42
Figure 4-5. Rudolf Bennitt Test Section 2. ...................................................................... 45
Figure 4-6. Rudolf Bennitt Test Section 3. ...................................................................... 46
Figure 4-7. Forest 44 Conservation Area.......................................................................... 48
Figure 4-8. Forest 44 Test Section 1................................................................................. 49
Figure 4-9. Segments 16 through 18 Before and After Treatment. .................................. 50
Figure 4-10. Rut Created by Disturbance on Natural Soil Segment (Segment 7). ........... 51
Figure 4-11. Trampled Waterbar. ..................................................................................... 52
Figure 4-12. Segments 16 through 19 (Observed during January 2007)......................... 53
Figure 4-13. Forest 44 Test Section 2............................................................................... 54
Figure 4-14. Forest 44 - Section 2 - Segment 1- Muddy and Dry. ................................. 55
Figure 4-15. Forest 44 Test Section 3............................................................................... 56
Figure 4-16. Angeline Conservation Area. ...................................................................... 57
Figure 4-17. Angeline Test Section 1. ............................................................................. 58
Figure 4-18. Ruts from Wheeled Vehicles on Sharp Turns.............................................. 61
Figure 4-19. Ruts and Muddiness Observed on Sections 21 and 22. ............................... 62
Figure 4-20. Hydrometer Analysis of the In-situ Soil. .................................................... 64

viii
Figure 4-21. Maximum Shear Strength for Lime Cured Samples. .................................. 64
Figure 4-22. Average Shear Strength Results for Wet and Dry Lime Cured Samples (28-
day curing). ........................................................................................................... 65

ix
LIST OF TABLES:
Table 2-1. Landscape Location Pros and Cons Regarding Trail Placement.................... 10
Table 2-2. Typical Soil Properties Based on Texture. ...................................................... 13
Table 2-3. Trail Alignment Angle and Erosion Potential ................................................. 14
Table 2-4. Tread Length Limits based on Soil Texture and Trail Steepness.................... 15
Table 2-5. Summary of Stabilization Techniques Pros and Cons. ................................... 16
Table 3-1. Surface Aggregate Particle Size Specifications. ............................................. 26
Table 3-2. Theoretical Length Limits Dependent on Slope............................................. 34
Table 4-1. Atterberg Limit Results of Lime Cured Samples. .......................................... 65
Table A-1. Rudolf Bennitt CA – Trail Measurement Data............................................... 75
Table A-2. Rudolf Bennitt CA - Section 1 Observation Data. ......................................... 76
Table A-3. Rudolf Bennitt CA - Sections 2 and 3 Observation Data ............................... 77
Table A-4. Forest 44 CA - Trail Measurement Data. ....................................................... 78
Table A-5. Forest 44 CA - Observation Data ................................................................... 79
Table A-6. Angeline CA - Trail Measurement Data......................................................... 80
Table A-7. Angeline CA - Observation Data.................................................................... 81
Table C-1. Important Factors for Trail Design. .............................................................. 93
Table C-2. Design Steps for Rerouting/New Trail Construction...................................... 95
Table C-3. Surface Stabilization Selection Chart. ............................................................ 96
x
DEVELOPMENT OF SOLUTION TECHNIQUES AND DESIGN GUIDELINES
FOR EQUESTRIAN TRAILS ON PUBLIC LANDS
Nathan Kyle Tabor
Dr. Kathleen Trauth, Advisor
ABSTRACT:
Increasing equestrian use on recreational trails puts intense pressure on the
environment. Horse traffic produces high stresses that can cause trail degradation such as
erosion and muddiness. Trail erosion has been widely studied and found to be controlled
by many factors: climate, vegetation, use, topography, and soil. Much is known about
causes of erosion, but there are limited solutions and guidance available for equestrian
trails. This study takes the knowledge from literature and current engineering solutions
to evaluate their effectiveness in preventing trail degradation on horse trails. Guidance
for the design and construction of horse trails is to be created from the observations and
lessons learned.
Test segments were constructed to evaluate the effectiveness of trail layout and
surface stabilization techniques. Trail surfaces tested include natural soil, gravel, gravel
with geosynthetic reinforcement, and lime stabilization. Observations were taken over a
one year period.
The research findings indicate that natural surface trails are not adequate in
resisting intense disturbance caused by horse use. Gravel surfaces increase erosion
resistance and surface strength, but are more effective when included with geotextile
reinforcement. Lime stabilization was not effective as a trail surface due to exposure to
freezing and thawing.

1
1. INTRODUCTION
Recreational horse use is a large and growing industry. The state of Missouri has
the sixth largest horse population in the nation, which is numbered at over 281,000. The
economic impact of this ownership is valued at $718 million. Of Missouri’s horse herd,
over 70% are used for recreation (American Horse Counsel, 2005).
The significant amount of recreational equestrian use in Missouri has put intense
pressure on the ecological stability of public lands. The Missouri Department of
Conservation (MDC) manages over 370 miles of equestrian trails throughout the state.
Many trails have become degraded over time due to poor design. MDC currently does
not possess guidelines specifying design or maintenance of equestrian trails. This study
will incorporate knowledge from published literature and current engineering technology
to develop guidelines specific to equestrian trails design.
Sustainable equestrian trails require stable surfaces and proper layout in order to
prevent trail degradation, such as erosion and user disturbance. Trail layout controls the
amount of water affecting trail surfaces. The literature shows that trail slope, trail
alignment, and topographic location affect how water interacts with a trail. Knowledge
of how these factors affect trail degradation can be used to determine the sustainability of
trails.
Trails also require stable surfaces to resist water erosion and user disturbance.
Natural soil surfaces are often disturbed by equestrian use due to the immense stresses
applied by the horses. In addition the strength of natural soil surfaces are greatly affected
by the environment. Water reduces the strength of the soil, which creates unstable
surfaces. Erosion resistance is low for soil textures that are high in silt and sand. Clay

2
textures soils have high erosion resistance, but are weak when wet. The strength and
stability of natural soil trails are greatly affected by the environment, and therefore are
questionable as adequate surfaces for sustainable equestrian trails.
Stabilization techniques are available to be applied to trail surfaces. Using gravel as
a wearing surface to protect the natural soil has been shown to be effective. Gravel can
also be combined with geosynthetics to increase strength and reduce long-term
maintenance. Lime stabilization has been used to increase strength of fine grained soils
in transportation projects.
Hypothesis
The objective of this project is to provide the MDC with guidance and solution
techniques for sustainable equestrian trails. The following hypotheses with be evaluated
over the course of this project.
1. A practical set of guidelines for design and maintenance of sustainable trails,
required by a public agency, can be created from published literature and preliminary
field observations.
2. Natural soil trails with or without proper layouts do not provide a sustainable
wearing surface with little maintenance, as required by a public agency.
3. Surface stabilization techniques (such as adding surface aggregate, utilizing
geosynthetics, and lime mixing) will provide a stable surface for horses and provide
increased erosion resistance.
These are the tasks involved in meeting the objectives:
1. Develop a set of design and installation procedures that can be utilized to
manage the various degradation problems.

3
2. Construct test segments based on the procedures and test the effectiveness
and sustainability of each solution in a realistic, typical application.
3. Develop guidelines for design and construction of equestrian trails for MDC
based on the experience from this research.

4
2. LITERATURE REVIEW
Impacts from Recreational Trails
Wilderness recreation is a growing interest for America’s public. With decreasing
amounts of land available for recreation, the urgency to preserve recreational land
increases. More popular activities like hiking and horseback-riding are easily available
for enjoyment, but intense usage of these sites can cause damage. Ecological degradation
of recreation areas creates an unsightly and unpleasant experience for users. These ugly
sights, caused by erosion due to improper use, are the focus of today’s recreation
managers’ attention. Degradation creates two problems: it environmentally degrades
ecosystems and detracts from the wilderness experience.
Deteriorating trails are a problem. They detract from the major goals of
recreation land: to provide “opportunities for wilderness recreation experiences” (Cole,
1983). “Eroding trails are a clear indication of human impact on the natural landscape”
(Bryan, 1977). A recreation manager’s main objective is to protect natural areas. With
that, trails should be designed and maintained in a way that creates minimal disturbance.
In addition, eroded trails can degrade to a point where muddiness and a lack of
footing stability cause problems for users. Erosion of soil can leave loose rocks and deep
gullies that may cause users to fall and become injured. Users tend to avoid trouble sites
and widen the trail, disturbing more area.
With increasing use and a reduction in the amount of land available, more
pressure is being put on conservation agencies for solutions. Understanding the factors
that lead to erosion and trail degradation can be a beneficial tool for managers in

5
sustaining the integrity of trails. Guidance is needed to help provide a knowledge base
for managers and users.
Impacts of Horse Trails
The effects of horse use on trails can be intense. Impacts from users cannot be
related by weight alone. The impact is related to the pressure applied to the ground, and
is quantified by the weight divided by the affected area. The static pressure applied by a
horse can range from 29 psi to 57 psi (Lull, 1959). That pressure is significantly higher
than the pressure applied from an average hiker, approximately 6 psi to 12 psi. The
stresses increase when moving due to the weight being distributed on only two hooves
and the impact from the inertial force.
Impacts on recreation trails are greater from horses than hikers (Weaver et al.,
1978). The increased disturbance is attributed to the difference in applied stresses
between users. Disturbance of the soil from external impact is only resisted by the
strength of the soil. The greater the stress applied by a user, the greater the disturbance.
The main outcome from the impact of horses is trail rutting due to user impact.
Ruts are created by the repeated impact from use. The results are depressions created by
compaction and/or displacement of the trail surface. Ruts on the trail surface can focus
water into channelized flow. Once water flow is focused, gully erosion occurs quickly.
Erosion Process
Erosion is a natural process that has created the landscape today. Changing land
usage, such as for recreational use, changes the rate of erosion. Damage is caused by

6
recreational use that disturbs soil and vegetation, which can lead to trail erosion and its
associated problems.
Water erosion is the biggest contributing factor to trail deepening and widening in
most environments (Cole, 1983). Flowing water exerts a shear stress on soil due to
friction between the water and the surface. The shear stress is controlled by the energy of
the flowing water. When the shear stress applied by water, τwater, is greater than the shear
resistance of soil, erosion occurs. The critical shear stress, cτ , is the stress required to
initiate particle movement, and is different for the various soil particle sizes.
A report by the National Cooperative Highway Research Program (2003)
examined the critical shear stress for various soils. A v-shaped relationship was found
between τc and grain size. Clays were found to have higher erosion resistance than silts
and sands, while gravels and cobbles were found to have the highest resistance to erosion.
The erosion resistance of soil is dependent on inter-particle forces. For cohesive
soils, these forces are dependent on molecular forces. For granular soils, friction between
particles resists erosion, and is related to particle size and weight. Larger particles
require a greater force for detachment and movement by water (Annandale, 2006).
Factors Influencing Trail Erosion
Many studies have been conducted to evaluate the factors contributing to erosion:
climate, vegetation, use, landscape, and soil type (Helgath et al., 1975; Whittaker, 1978;
Weaver et al., 1979). These factors explain most erosion on trails. While no single factor
causes erosion, it is the combination of all that explains the deterioration of trails.
7
Climate
Climate sets conditions for the “how and when” erosion will take place. Climate
data consists of average temperatures for seasons and average depths of rainfall. The
most important facts to know about rainfall are the duration, intensity, and season for
individual events. Those factors can indicate how much precipitation events will effect
the environment.
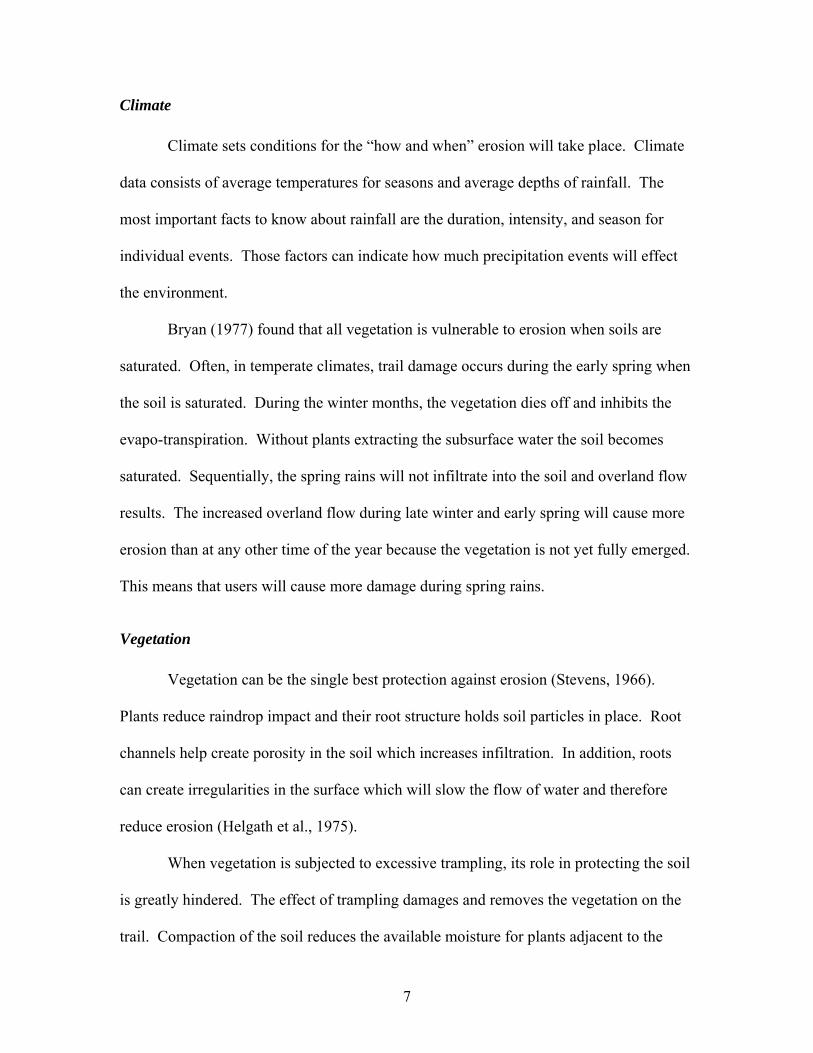
Bryan (1977) found that all vegetation is vulnerable to erosion when soils are
saturated. Often, in temperate climates, trail damage occurs during the early spring when
the soil is saturated. During the winter months, the vegetation dies off and inhibits the
evapo-transpiration. Without plants extracting the subsurface water the soil becomes
saturated. Sequentially, the spring rains will not infiltrate into the soil and overland flow
results. The increased overland flow during late winter and early spring will cause more
erosion than at any other time of the year because the vegetation is not yet fully emerged.
This means that users will cause more damage during spring rains.
Vegetation
Vegetation can be the single best protection against erosion (Stevens, 1966).
Plants reduce raindrop impact and their root structure holds soil particles in place. Root
channels help create porosity in the soil which increases infiltration. In addition, roots
can create irregularities in the surface which will slow the flow of water and therefore
reduce erosion (Helgath et al., 1975).
When vegetation is subjected to excessive trampling, its role in protecting the soil
is greatly hindered. The effect of trampling damages and removes the vegetation on the
trail. Compaction of the soil reduces the available moisture for plants adjacent to the

8
trail, which can stunt growth and cause the vegetation to die (Weaver et al., 1979).
After vegetation is removed, the soil is exposed to further disturbance by water and wind
erosion. In heavily used areas, degradation is not limited by vegetation, but by the
resistance of soil (Bryan, 1977).
The construction of most equestrian trails involves the removal of vegetation.
Vegetation is removed along with the organic soil layer in order to provide a smooth
stable trail surface. In these cases, vegetation cannot provide erosion resistance. On the
other hand, if vegetation were left, it would not survive due to the compaction of the soil
from use.
Use
The most universal effect of using recreational land is compaction and
disturbance of the natural soil. Compaction is quantified through bulk density (weight
per unit volume). As the bulk density increases, the infiltration, percolation, and water
content of the soil decrease (Arndt, 1966; Weaver et al., 1979). Limited infiltration will
result in effects similar to an impervious surface, where water will pool to create
muddiness or concentrate flow creating gully erosion.
Average bulk densities for various soils range from 50 to 69 lbs/in3 (0.8 to 1.1
gm/cc). Weaver (1979) found that the bulk density on level grassland increased to 81
lbs/in3 (1.3 gm/cc) after 1000 passes with a horse. On a slope, bulk density increased to
93 lbs/in3 (1.5 gm/cc), which is the limit for water and roots to penetrate soil. Once the
soil reaches that density, vegetation growth will be limited. The roots cannot penetrate
the hardened soil and will suffer from the loss of moisture (Weaver et al., 1979).

9
Compaction reduces total pore space, therefore infiltration and percolation may be
reduced (Kuss, 1983).
Vegetation loss can be directly related to weight of the trampler (Cole, 1995).
Horses have been found to cause more damage than a human in the same area. Soil
compaction and trail incisions were found to be greater under horses than hikers (Weaver
et al., 1978). The average pressure that a full grown horse exerts on the ground is 40 psi
in contrast to the pressure exerted by a human of 8 psi (Lull, 1959). The difference in
pressure shows how much more impact horses have on disturbing the soil. Whittaker
(1978) found that horses were much more damaging to trails verses humans. Horses
compact the soil, but then began to break up and disturb the soil leaving some sites
muddy. The disturbed soil allows water to easily remove the soil from the trail.
Degradation is not influenced by the amount of use once a certain threshold has
been passed. It only takes a few users to cause problems (Helgath et al., 1975; Cole,
1983). Whittaker (1978) found that it only took twenty-five passes of a horse before a
trail started to become muddy. Soil properties and landscape features determine the
carrying capacity of users. Damage can occur at any location with sufficient use. But
even at low intensities of use, degradation is mainly related to topography and soil
resistance (Bryan, 1977).
Landscape
The landscape plays an important role in the degradation process. A landscape is
defined as a population of landforms geomorphically welded by the through flow of
water, nutrients, and energy. Soil and landscape characteristics of recreation sites have
10
the most influence on erosion and degradation (Helgath et al., 1975). These soil-
landscape interactions determine the recreation capacity of an area (Stevens, 1966).
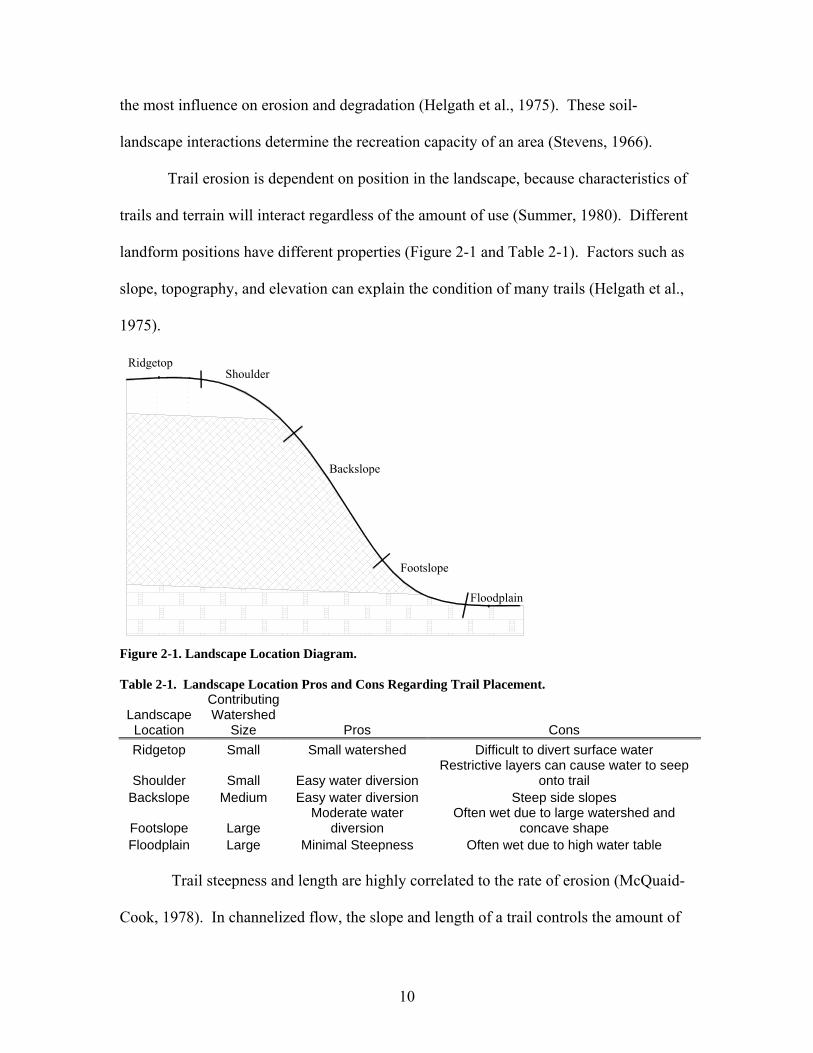
Trail erosion is dependent on position in the landscape, because characteristics of
trails and terrain will interact regardless of the amount of use (Summer, 1980). Different
landform positions have different properties (Figure 2-1 and Table 2-1). Factors such as
slope, topography, and elevation can explain the condition of many trails (Helgath et al.,
1975).
Footslope
Backslope
ShoulderRidgetop
Floodplain
Figure 2-1. Landscape Location Diagram. Table 2-1. Landscape Location Pros and Cons Regarding Trail Placement.
Landscape Location
Contributing Watershed
Size Pros Cons Ridgetop Small Small watershed Difficult to divert surface water
Shoulder Small Easy water diversion Restrictive layers can cause water to seep
onto trail Backslope Medium Easy water diversion Steep side slopes
Footslope Large Moderate water
diversion Often wet due to large watershed and
concave shape Floodplain Large Minimal Steepness Often wet due to high water table
Trail steepness and length are highly correlated to the rate of erosion (McQuaid-
Cook, 1978). In channelized flow, the slope and length of a trail controls the amount of

11
energy that flowing water has. Steeper slopes allow water to flow with greater velocity.
On a trail with a minimal steepness, but where water is allowed to flow for a long
distance, water can also reach a significant velocity. With the higher velocity of the
water, the erosion rate increases (Annandale, 2006).
If the trail steepness controls the energy of water, then landscape location controls
the amount of water that can affect the trail. The size of the watershed contributing
runoff for a ridgetop trail is generally less than that for a low-lying trail.
Because of the dynamics of soil properties, critical trail grade will vary depending
on the landform shape and soil depth (Helgath et al., 1975). Erosion may occur at 15%
trail steepness on one landform, but not on 30% trail steepness somewhere else. In arid
environments, erosion may not be found up to 17% trail steepness (Tinsley et al., 1985).
Helgath (1975) found that some trails will erode at a 5% grade while others will show no
erosion up to a 30% grade, depending on the soil type and landform.
Landform shape determines how trails and water will interact. Convex and
concave shaped landforms erode at different rates (Helgath et al., 1975). Flat segments
can be prone to poor drainage. These sites become muddy and users cause the trail to
widen while going around the muddy area (Cole, 1983).
Benched trails that are cut into a side slope are prone to erosion due to
intercepting subsurface flow (
Figure 2-2). Compaction and horizon removal expose the soil and lower the trail
surface. Subsurface flow will exit through the exposed soil, concentrate in the trail bed,
and flow down the trail surface. Flow down the trail surface causes gully erosion that is
almost impossible to stop after it starts (Helgath et al., 1975).

12
O v e r l a n d F l o w
C l a y ( R e s t r i c t i v e L a y e r )
P r e c i p i t a t i o n
S u b s u r f a c e F l o w
S i l t
Figure 2-2. Benched Trail Intercepting Subsurface Flow.
Soil Type
Soil also plays an important role in the erosion process. It is the material that is
displaced and transported. The erosion resistance of soil can be quantified and related to
many factors. Damage depends largely on soil properties such as “abundance of rocks,
homogeneity of texture, iron-pan morphology, aggregate stability and organic content”
(Bryan, 1977). Soils with high infiltration rates and that are not limited by subsurface
barriers will be less likely to erode.
Soil texture is one property that is related to degradation. There are definite
relationships between soil texture, erosion resistance and wearing resistance of soils
(Table 2-2). Fine grained soils such as clays and silts become muddy when wet and
create unstable surfaces. Silts and sands are highly erosive because the small particles
lack cohesion and are easily washed away by water.

13
Table 2-2. Typical Soil Properties Based on Texture.
Soil Type Erosion Resistance
Trampling/Wearing Resistance Potential Problems
Clay High High (when dry) Muddy and slippery when wet; High runoff potential.
Silt Low Moderate (when dry) Highly erosive; Muddy when wet. Loam Moderate Moderate Possibly muddy when wet. Sand Moderate Low Loose particles can be highly erosive. Gravely Clay High High High runoff potential.
Gravel Moderately High High Potential erosion with intense flows.
Soils with a high percentage of gravel have high erosion resistance and very high
strength (Tinsley et al., 1985). However, if user pressure is great enough to cause break-
down of soil particles, rocks can act to increase erosion.
Management Solutions
Many studies have been conducted to study the factors that effect erosion. Much
is known about the causes of erosion, but there are a limited number of solutions for the
design of equestrian trails. There are two main concepts to minimize trail degradation
from water:
1) Decrease the forces causing trail degradation.
2) Increase degradation resistance.
Depending on the situation, one or both solutions must be applied to reduce erosion and
create a sustainable trail.
Trail Layout and Design
Proper trail layout and trail design are two essential factors needed to produce
sustainable trails. Trail layout describes the path that a trail takes across the landscape.
The layout is quantified by the trail alignment angle, steepness, and length.
14
Trail Alignment
Trail alignment is the angle between the trail direction and the topographic
surface aspect. The possible ranges for trail alignment are from 0º to 90º. A trail
alignment angle of 90 º represents the trail direction that is perpendicular to the slope
(i.e., the trail follows the topographic contours). A trail alignment angle of 0º represents
a trail that travels straight up and down the slope surface.
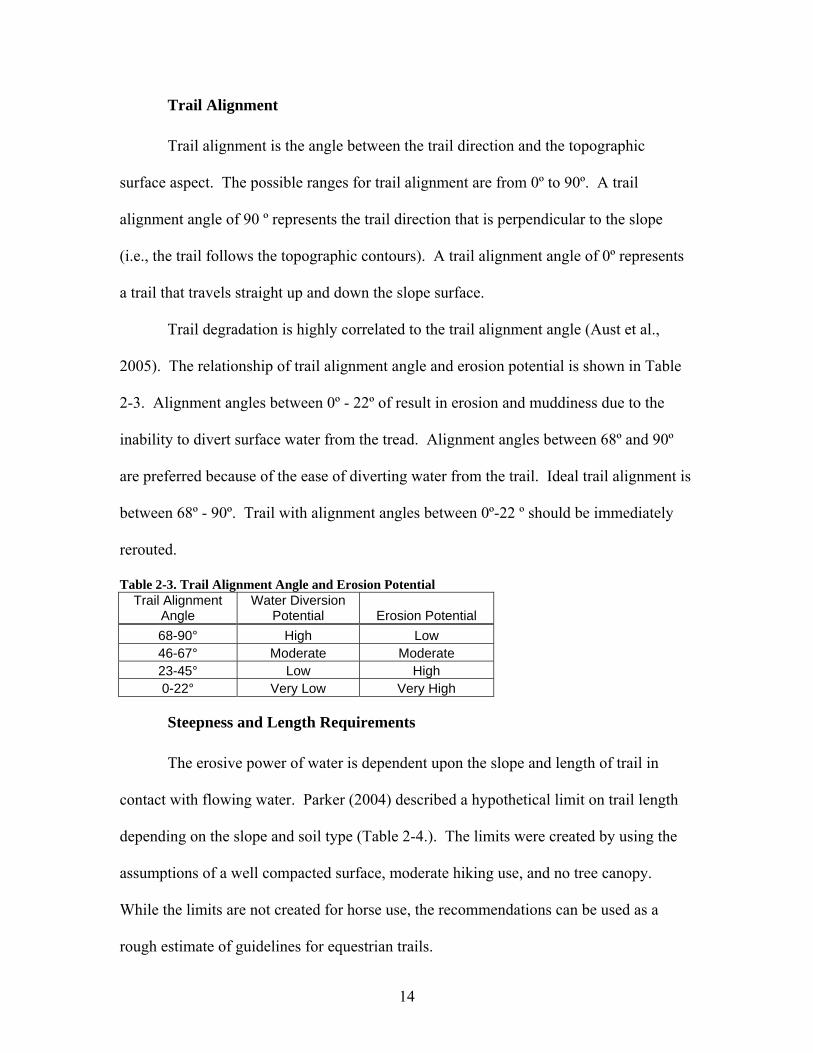
Trail degradation is highly correlated to the trail alignment angle (Aust et al.,
2005). The relationship of trail alignment angle and erosion potential is shown in Table
2-3. Alignment angles between 0º - 22º of result in erosion and muddiness due to the
inability to divert surface water from the tread. Alignment angles between 68º and 90º
are preferred because of the ease of diverting water from the trail. Ideal trail alignment is
between 68º - 90º. Trail with alignment angles between 0º-22 º should be immediately
rerouted.
Table 2-3. Trail Alignment Angle and Erosion Potential Trail Alignment
Angle Water Diversion
Potential Erosion Potential 68-90° High Low 46-67° Moderate Moderate 23-45° Low High 0-22° Very Low Very High
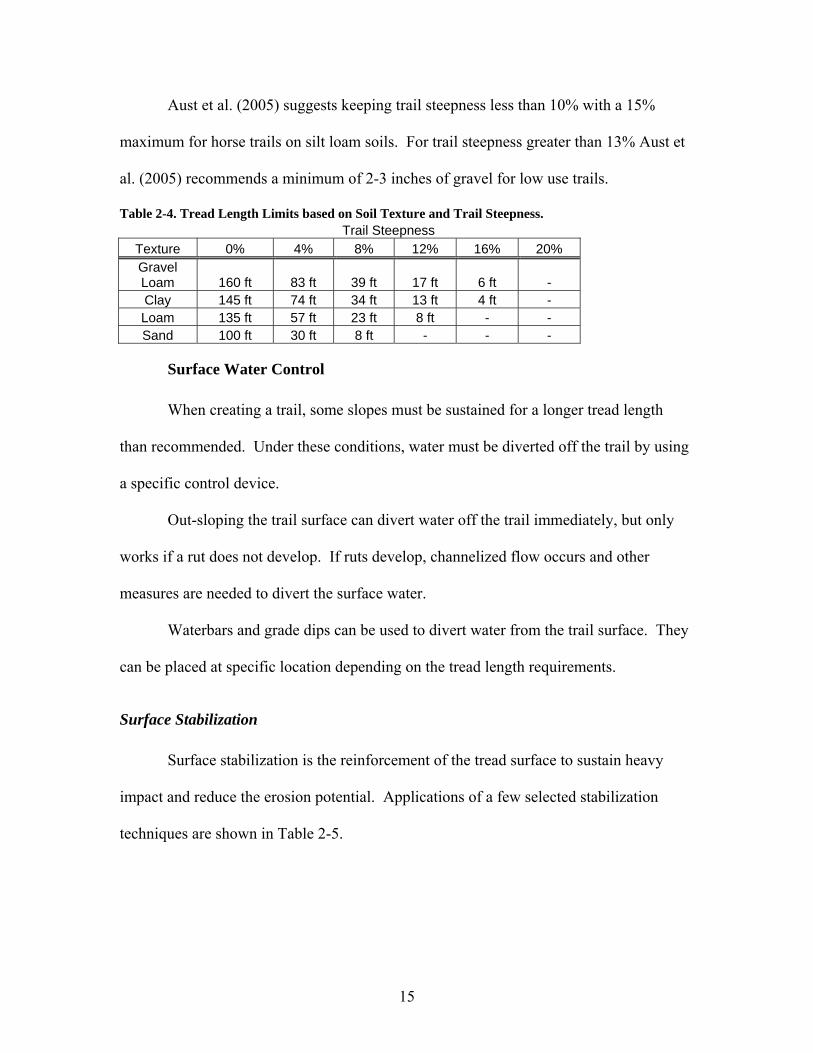
Steepness and Length Requirements
The erosive power of water is dependent upon the slope and length of trail in
contact with flowing water. Parker (2004) described a hypothetical limit on trail length
depending on the slope and soil type (Table 2-4.). The limits were created by using the
assumptions of a well compacted surface, moderate hiking use, and no tree canopy.
While the limits are not created for horse use, the recommendations can be used as a
rough estimate of guidelines for equestrian trails.
15
Aust et al. (2005) suggests keeping trail steepness less than 10% with a 15%
maximum for horse trails on silt loam soils. For trail steepness greater than 13% Aust et
al. (2005) recommends a minimum of 2-3 inches of gravel for low use trails.
Table 2-4. Tread Length Limits based on Soil Texture and Trail Steepness. Trail Steepness
Texture 0% 4% 8% 12% 16% 20% Gravel Loam 160 ft 83 ft 39 ft 17 ft 6 ft - Clay 145 ft 74 ft 34 ft 13 ft 4 ft - Loam 135 ft 57 ft 23 ft 8 ft - - Sand 100 ft 30 ft 8 ft - - -
Surface Water Control
When creating a trail, some slopes must be sustained for a longer tread length
than recommended. Under these conditions, water must be diverted off the trail by using
a specific control device.
Out-sloping the trail surface can divert water off the trail immediately, but only
works if a rut does not develop. If ruts develop, channelized flow occurs and other
measures are needed to divert the surface water.
Waterbars and grade dips can be used to divert water from the trail surface. They
can be placed at specific location depending on the tread length requirements.
Surface Stabilization
Surface stabilization is the reinforcement of the tread surface to sustain heavy
impact and reduce the erosion potential. Applications of a few selected stabilization
techniques are shown in Table 2-5.

16
Table 2-5. Summary of Stabilization Techniques Pros and Cons. Stabilization Technique Typical Applications Pros Cons Gravel Surface
Highly erosive soils: Silts and Sands.
Easy application; Relatively cheap.
Susceptible to rutting on wet fine grained soils: Silts and Clays
Gravel w/Geotextiles
Wet, fine grained soils
Increased strength; Requires less gravel (cost savings); Longer life cycle than gravel alone.
More expensive than gravel alone; Slightly more difficult construction process than gravel.
Geocells Very weak, wet fine grained soils; Steep slopes.
Very high strength; Very low rutting potential
Expensive; Intensive construction process.
Lime Mixing Fine grained, highly plastic soils: silts and clays
Increased Strength; Low Erosion Potential
Difficult to install on steep slopes.
Surface Aggregate
Applying 3.5” of gravel to a trail surface can significantly reduce degradation
(Aust et al., 2005). Gravel has a higher strength than fine grained soils which increases
surface stability. The large particle size of gravel requires a larger force to cause erosion
than most fine grained soils.
Geosynthetics
Geosynthetics are man-made materials (usually plastic) that are used for
separation, drainage, or reinforcement of soils.
Geotextiles – An old engineering adage is “if you add ten tons of rocks to ten tons
of mud, you get twenty tons of mud.” Adding aggregate to stabilize fine grained soils
can result in the fines migrating into the aggregate and reducing its integrity. This is due
to the lack of separation between the two materials (Koerner, 2005).
Geotextiles (Figure 2-3) are polypropylene fabrics that provide separation and
reinforcement. The geotextiles recommended for use in trail applications are non-woven
(long plastic fibers form a fabric by needle-punching and heat bonding). Non-woven

17
geotextiles allow water to flow through the fabric, but restrict soil particle from migrating
upwards.
Figure 2-3. Example of Non-Woven Geotextile Fabrics (Monlux et al., 2000). Geotextiles can be applied in two techniques: the single-layer technique and the
wrapped or “sausage” technique. The single-layer technique is primarily used for
separation on trails with fine grained soils. The technique uses one layer of geotextile
fabric that is laid over the soil, and is covered with a suitable surface aggregate (Figure
2-4). The wrapped technique encapsulates free draining aggregate within the fabric and
is covered with surface aggregate, as displayed in Figure 2-5.
Figure 2-4. Single-Layer Geotextile Used for Separation on Trails (Monlux et al., 2000).

18
Figure 2-5. Geotextile Wrap used for Separation and Reinforcement of Fine Grained Soils (Monlux et al., 2000). Geocells – Geocells (Figure 2-6) are plastic strips bonded together to create a
honeycomb structure (Monlux et al., 2000). Geocells provide reinforcement over weak
soils by spreading loads over a larger area. Construction involves filling the cell structure
with free draining aggregate and covering the structure with surface aggregate.
Geotextiles are applied to the surface below the cells to provide separation (Figure 2-7).
Figure 2-6. Geocells have a Honeycomb Structure (Monlux et al., 2000).
Figure 2-7. Geocells use in a trail application (Monlux et al., 2000).
Lime stabilization
Lime stabilization involves mixing hydrated lime or quicklime with fine grained
soils to improve behavior. Lime reacts with fine grained soils almost immediately to

19
reduce plasticity and increase strength. The effects of lime stabilization are dependent on
soil type, mixture rate, and curing conditions (Transportation Research Board, 1987).
Lime stabilization is often used in road construction to improve the strength of
weak subgrades. The improved strength allows for easier construction and increases the
pavement’s life.
Literature Summary
Equestrian impact on trails is intense and degradation can occur with little use;
after which, degradation is mainly controlled by location and soil type. The amount of
water greatly affects trail degradation. Low lying areas are often wet and muddy, and
fine grained soils are weak when wet.
Degradation can be reduced if trails are placed in proper locations with strong soils.
If problem areas cannot be avoided, surface stabilization can be applied to the trail
surface to reduce maintenance. While stabilization techniques are available, their
applicability and effectiveness in specific situations needs to be studied.

20
3. METHODOLOGY
Public Agency Implications
The Missouri Department of Conservation (MDC) requires horse trail design and
construction guidelines that are practical for the agency. Therefore, several meetings
were held with area managers, department engineers, and construction crews to
determine the installation limitations. The trail segments tested needed to be able to be
reproduced in other conservations areas. There were many agency constraints due to area
usage conflicts, construction equipment, available materials, and construction time
allotted. Each of these constraints needed to be discussed and addressed during the initial
phase of this experiment in order for proper development of the guidelines.
Trail Analysis and Design
Conservation Areas
Existing horse trails on three conservation areas (Figure 3-1) in Missouri were
studied to determine the causes of erosion. In addition, test segments were constructed at
each conservation area to determine the effectiveness of each proposed solution
technique.

21
Figure 3-1. Conservation Areas Under Study
Rudolf Bennitt Conservation Area
The Rudolf Bennitt Conservation Area is located 23 miles north of Columbia,
Missouri and 6 miles west of Highway US-63. The area contains over 3,500 acres of
land, 75% of which is forested. The area has approximately 40 miles of primitive trail
(no surface stabilization). Many of the 40 miles are unauthorized trails created by users.
A majority of the trails were inherited when MDC purchased the property. Nearly all of
the trails have severe erosion problems. Gullies can be seen varying in depth from one
foot to four feet deep.
The topography consists of rolling hills with relief of up to 100 feet. The
Keswick-Lindley-Gorin Soil association is predominant over the conservation area
Rudolf Bennitt
Forest 44
Angeline

22
(Figure 3-2). Soils consist mainly of silt loams on the ridgetops and clay loams lower in
the landscape. Glacial till acts as a restrictive layer on the ridgetops and causes water to
seep out over the surface on backslopes. Slopes range from 5% to 30%, and the entire
area is known to exhibit high erosion potential.
Figure 3-2. Keswick-Lindley-Gorin Soil Association Block Diagram. (Randolph County Soil Survey, 1989) The important soils characteristics in this landscape are the restrictive layers on
the ridgetops and the backslopes. On the ridgetops, a thin loess cap (eight inches)
overlying glacial till creates a perched water table. The vertical percolation is limited;
therefore water travels horizonally and seeps down backslopes. The backslopes are
mainly clay causing limited infiltration which results in increased runoff. That
combination of soil stratigraphy in the landscape creates highly erosive conditions.
Forest 44 Conservation Area
The Forest 44 Conservation Area (Figure 3-1) is located adjacent to I-44 near
Fenton, Missouri. This area is over 1000 acres in size. Almost twelve miles of trails are

23
located throughout Forest 44 and were inherited when the land was acquired by MDC.
The trails in the area cannot be relocated due to the close proximity of other trails,
protected archeological sites, and negative user response to discussions on relocations
and closings. This area is intensely used by the local population in the St. Louis area.
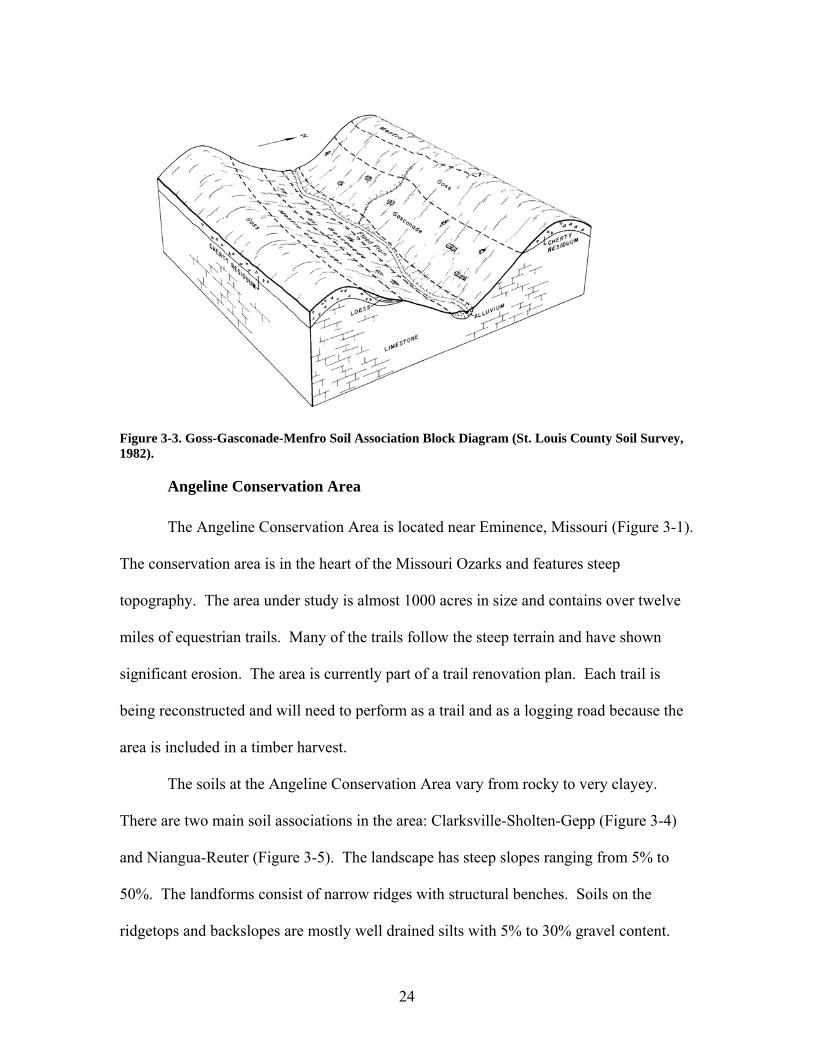
The Goss-Gasconade-Menfro soil association (Figure 3-3) encompasses the
conservation area. Slopes range from 5% to 50%. Soil textures at the conservation area
range from clay and silts intermixed with 0% to 50% cherty gravel. Ridgetop soils are
moderately well drained silts. Some ridgetops have a fragipan which causes a perched
water table. The backslopes range from cherty silt loams (well drained) to clayey silts
(poorly drained). The low lying areas such as the footslopes and flood plains consist of
well drained silts, but are often saturated due to their low position in the landscape.
Most of the landscape is moderately well drained with gravely silts. The erosion
potential is low in these cases. In cases where restrictive layers exist, such as ridgetops
with a fragipan, muddiness can occur. Ideal trail placement should be located on the
ridgetops and back slopes on well drained soils.
24
Figure 3-3. Goss-Gasconade-Menfro Soil Association Block Diagram (St. Louis County Soil Survey, 1982).
Angeline Conservation Area
The Angeline Conservation Area is located near Eminence, Missouri (Figure 3-1).
The conservation area is in the heart of the Missouri Ozarks and features steep
topography. The area under study is almost 1000 acres in size and contains over twelve
miles of equestrian trails. Many of the trails follow the steep terrain and have shown
significant erosion. The area is currently part of a trail renovation plan. Each trail is
being reconstructed and will need to perform as a trail and as a logging road because the
area is included in a timber harvest.
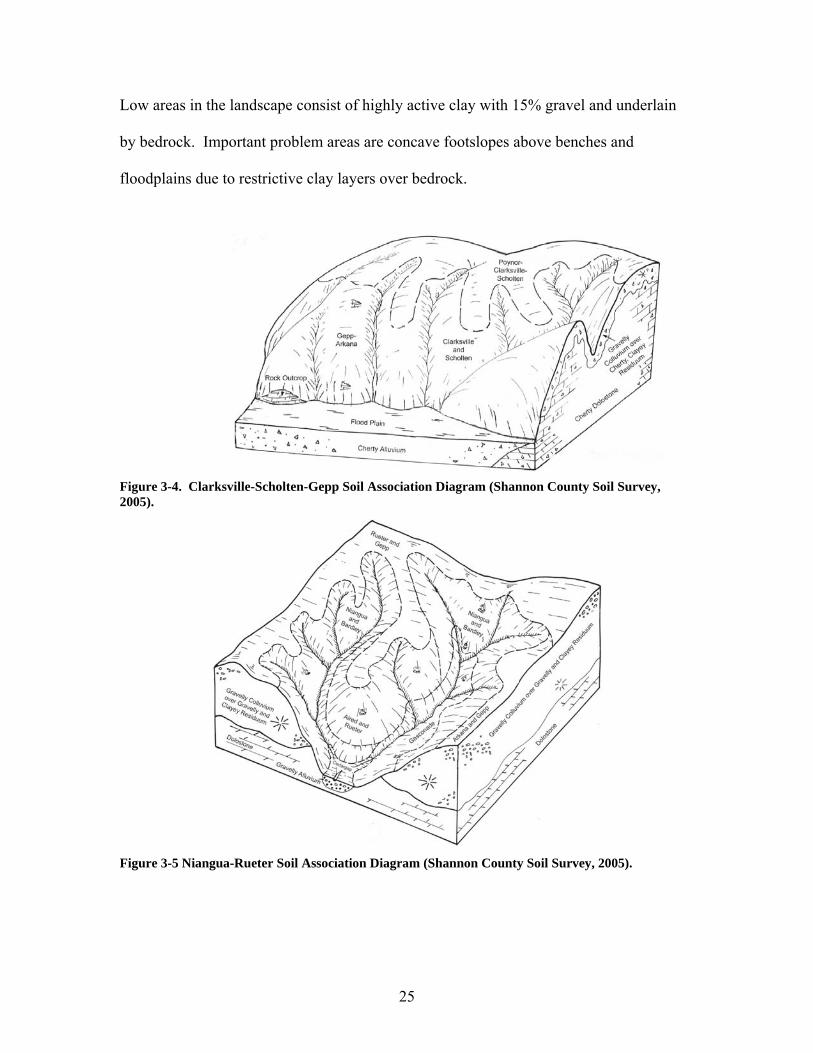
The soils at the Angeline Conservation Area vary from rocky to very clayey.
There are two main soil associations in the area: Clarksville-Sholten-Gepp (Figure 3-4)
and Niangua-Reuter (Figure 3-5). The landscape has steep slopes ranging from 5% to
50%. The landforms consist of narrow ridges with structural benches. Soils on the
ridgetops and backslopes are mostly well drained silts with 5% to 30% gravel content.
25
Low areas in the landscape consist of highly active clay with 15% gravel and underlain
by bedrock. Important problem areas are concave footslopes above benches and
floodplains due to restrictive clay layers over bedrock.
Figure 3-4. Clarksville-Scholten-Gepp Soil Association Diagram (Shannon County Soil Survey, 2005).
Figure 3-5 Niangua-Rueter Soil Association Diagram (Shannon County Soil Survey, 2005).

26
Design
Initial Assessment of Trail Problems
Each conservation area’s trail system was investigated to determine the present
problems. Trails were walked to observe the current conditions and to locate problem
areas. A majority of the trails that had significant erosion had either steep slopes or
inadequate water control. Muddy areas were found in low lying areas near the water
table, and in places where drainage of surface water was not allowed to occur. Trails
crossing ephemeral drainages often diverted water onto trails causing erosion.
Surface Stabilization
Surface stabilization is achieved by increasing the strength of the surface material.
The concept is to provide a stronger wearing surface than the natural soil that can better
withstand the use from horses and thus lower the erosion potential. This can be
accomplished by adding surface aggregate (with or without geosynthetics) for strength or
using an admixture such as hydrated lime to increase the shear strength of the soil.
Surface Aggregate - The aggregate used for the surface application is called one-
inch minus base. Specifications for the aggregate are listed in Table 3-1 . The largest
particle size is one inch, which is small enough for horses to walk on.
Table 3-1. Surface Aggregate Particle Size Specifications. Sieve Size
Percent Passing
1 inch 100 1/2 inch 60-90
No. 4 40-60 No. 40 15-35

27
Geosynthetics - The geosynthetics used for surface improvement were geotextiles
and geocells. There were used in specific applications that are described below.
Geotextiles - The geotextile used was a needle punched non-woven polypropylene
fabric. The main application of the geotextiles was to provide separation between the
trail’s natural soil and the surface aggregate. Without separation, fines from the natural
soil can migrate upward into the surface aggregate causing trail rutting and muddiness.
The geotextile was used in two different applications: wrapped and non-wrapped.
The wrapped design method consisted of wrapping the geotextile fabric around a three
inch layer of free draining aggregate, and then capping it with a two inch layer of surface
aggregate. A profile of the wrapped design can be seen in Figure 3-6. The wrapped
design provides separation of fines, and also provides increased strength.
The non-wrapped design utilized a single layer of geotextile below the surface
aggregate. This design provides separation between the natural soil and the surface
aggregate, in order to prevent rutting.
Figure 3-6. Geotextile Wrapped Design Profile.
Geocells - Geocells are a series of connected polyethylene cells that is akin to
honeycomb. The geocell reinforcement consisted of either four or eight inch thick
28
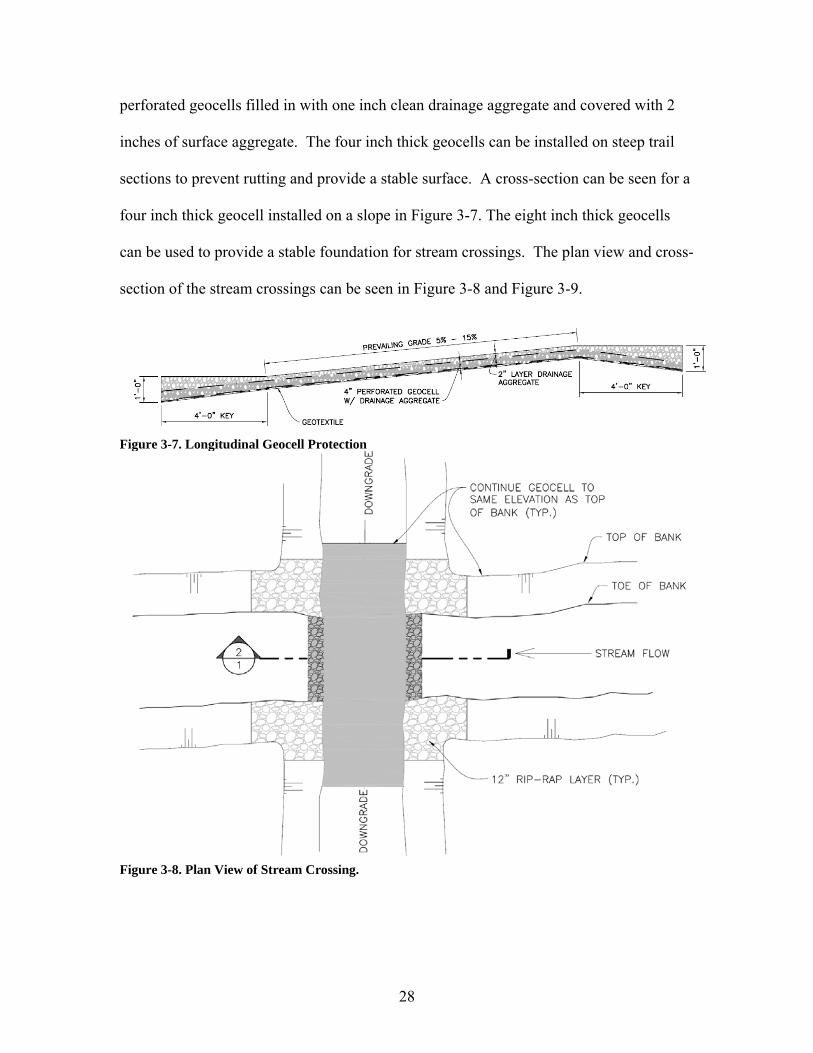
perforated geocells filled in with one inch clean drainage aggregate and covered with 2
inches of surface aggregate. The four inch thick geocells can be installed on steep trail
sections to prevent rutting and provide a stable surface. A cross-section can be seen for a
four inch thick geocell installed on a slope in Figure 3-7. The eight inch thick geocells
can be used to provide a stable foundation for stream crossings. The plan view and cross-
section of the stream crossings can be seen in Figure 3-8 and Figure 3-9.
Figure 3-7. Longitudinal Geocell Protection
Figure 3-8. Plan View of Stream Crossing.

29
Figure 3-9. Cross Sectional View of Stream Crossing.
Lime Stabilization - Lime admixtures can be used where soil conditions are not
adequate to provide a stable surface. Mixing lime with fine grained soils can reduce the
swelling potential and increase the strength by cementation. Lime stabilization is to be
applied by tilling the top six inches of soil and then mixing 10% hydrated lime by weight.
Compaction of the trail surface is then performed. Water is to be added to help with
compaction.
Surface Water Control
Designing for sustainable trails requires controlling surface water. There are
many techniques for diverting water from a trail’s surface. The most common technique
is shaping the trail’s surface, but water diversion structures such as waterbars and grade
dips can also be utilized
Tread Shape - Shaping the surface tread can divert water off of a trail.
Outsloping, insloping, and crowning are the three surface shapes available in trail design.
Outsloping involves lowering the downhill side of a trail surface to immediately divert
30
water. This method is adequate for trails that are located on a side slope. Insloping
involves lowering the uphill trail surface to collect uphill water and divert it in another
place down the trail. This method is adequate for intercepting water that may affect trails
that are downhill from the current trail. Crowning a trail surface involves having the
outside edges of a trail lower than the middle. Water is shed from both sides of the trail
with this method.
Water Diversion Structures – Water diversion structures are required on sloping
trails where water cannot be diverted by the tread shape alone.
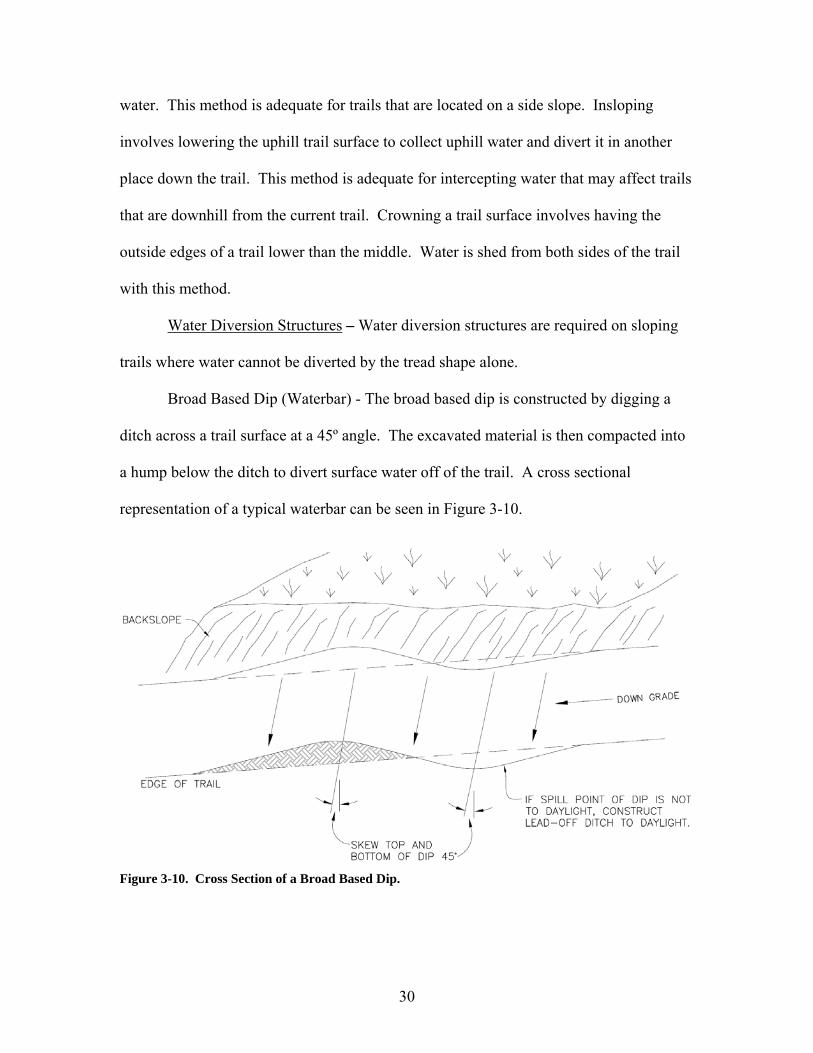
Broad Based Dip (Waterbar) - The broad based dip is constructed by digging a
ditch across a trail surface at a 45º angle. The excavated material is then compacted into
a hump below the ditch to divert surface water off of the trail. A cross sectional
representation of a typical waterbar can be seen in Figure 3-10.
Figure 3-10. Cross Section of a Broad Based Dip.

31
A modified version of the waterbar is the use of geotextiles to provide separation
and reinforcement in the hump. The modified version is constructed by digging the ditch
and removing the material. Geotextile fabric is laid where the hump will go. Free
draining aggregate is laid on the geotextile parallel to the ditch. The geotextile is then
wrapped around the aggregate with a twelve inch overlap. Surface aggregate is then
placed on top of the geotextile rap and compacted. A cross section of the modified broad
based dip can be seen in Figure 3-11.
Figure 3-11. Cross Section of the Modified Broad Based Dip.
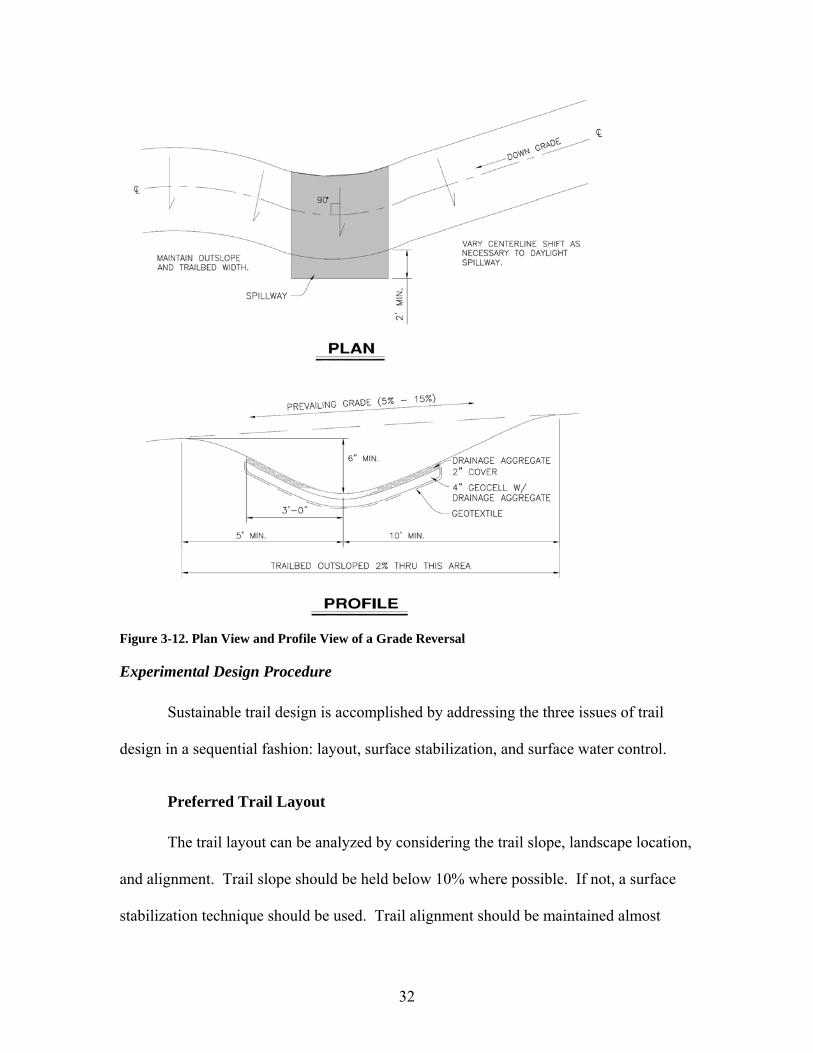
Grade Dip or Grade Reversal - A grade dip diverts water from a trail by changing
the direction of the trail to make the trail drop and then rise back up. This method can be
used when crossing side-slope drainages, or whenever water needs to be diverted off of
the trial. When crossing side-slope drainages, four inch geocells can be used as an
intermittent stream crossing. Plan and cross-sectional views of the grade reversal can be
seen in Figure 3-12.
32
Figure 3-12. Plan View and Profile View of a Grade Reversal
Experimental Design Procedure
Sustainable trail design is accomplished by addressing the three issues of trail
design in a sequential fashion: layout, surface stabilization, and surface water control.
Preferred Trail Layout
The trail layout can be analyzed by considering the trail slope, landscape location,
and alignment. Trail slope should be held below 10% where possible. If not, a surface
stabilization technique should be used. Trail alignment should be maintained almost

33
perpendicular to the side slope (i.e., following the topographic contour). Under no
circumstances should the trail go straight up and down a hill (i.e., the fall line). The trail
should be located on a side slope to allow water drainage off of the trail. Trails located
directly on a ridge top do not easily allow for drainage. Trails located low in the
landscape on a foot slope also do not allow drainage, and thus are also prone to become
muddy. If any of these conditions cannot be met, surface stabilization needs to be
applied.
Surface Stabilization
Where an appropriate trail layout is not possible, surface stabilization needs to
occur. If unsuitable soils are encountered (i.e., muddy or highly erosive) on a slope less
than 10%, non-wrapped geotextiles should be used for surface reinforcement. If steep
areas with a slope greater than 15% are encountered, four inch geocells should be used to
provide a stable surface that will not rut. If a trail is in a muddy low lying area, a
wrapped geotextile technique should be used for reinforcement and separation.
Ephemeral drainage crossings should have a four inch geocell grade dip reinforcement
applied. Stream crossings without a stable bottom should use 8 inch geocells to provide a
stable surface.
Surface Water Control
After the trail layout has been established and the surface has been chosen, water
controls can be designed. Trails with a slope of less than 5% should have an outsloped
tread. If a switchback is used to climb a hill, an insloped climbing turn should be used to

34
control water. A detailed drawing of an insloped climbing turn can be seen in Figure
3-13.
Once the tread surface has been selected, placement of water diversion structures
can be determined. Either structure can be used (water-bar or grade reversal); the
placement is dependent on the slope. The slope and length requirements (Table 3-2)
were adapted from the recommendations in the literature.
Table 3-2. Theoretical Length Limits Dependent on Slope. Slope (%)
Maximum Trail Length (ft)
0% 135 2% 90 4% 57 6% 37 8% 23 10% 14 12% 8 14% 4

35
Figure 3-13. Insloped Climbing Turn.
Old Trail Retrofitting
If old trails do not meet the preferred trail layout criteria, they need to be rerouted.
If they cannot be rerouted, then the proper surface stabilization techniques and water
diversions should be applied.
Construction
Trail construction was conducted between February and July of 2006. Trails
segments selected for construction were chosen based on location, constructability, and

36
solution type. Construction consisted of either retrofitting an existing trail or re-routing a
trail with poor a location.
Construction observation was performed on site during construction to supervise
construction and help determine the best construction practices. The observations made
during construction are to be used to develop lessons learned for the equestrian trail
guidelines.
Trail Test Segment Monitoring and Testing
Monitoring of test segments began immediately after construction. Observations
and measurements were initiated during construction and were continued at two-week
intervals until March 2007. Each segment and structure installed had its location
recorded by GPS.
Initial measurements for each trail segment are as follows: Length
Slope
Soil type
Surface type: ♦ Natural Surface ♦ Aggregate ♦ Aggregate w/ Geosynthetic
Landscape Location: ♦ Ridgetop ♦ Shoulder ♦ Backslope ♦ Nose Slope ♦ Head Slope ♦ Foot Slope

37
The observations recorded were: if the trail was disturbed by users, the occurrence
of muddiness, and the formation of ruts. Photographs were taken of each incident and its
location recorded by GPS. If ruts formed, their length, width and depth were recorded.
Soil data was obtained by a field investigation conducted by Dennis Meinert, a
Soil Scientist from the Missouri Department of Natural Resources. The trail surface was
examined for every segment tested. The data recorded consisted of surface texture,
surface thickness, restrictive layer depth, parent materials, trail and slope alignment, and
the topographic surface shape: horizontally and vertically.

38
4. RESULTS
Definitions
For the purpose of the clarity the general terminology used in this chapter is
defined as follows:
Gully - A linear depression greater than six inches deep on a trail surface caused by erosion.
Incised Surface – A depressed trail surface shape that can cause surface water to
remain on the trail. Muddiness – A trail surface condition on saturated natural soil where a two inch
or greater depression is created by an external load, such as users’ hoofs, feet, or wheels.
Natural Soil Surface – A trail surface that is comprised of in-situ soil. Rill – An erosion feature less than two inches deep on a trail surface, caused by
flowing water. Rut – A linear depression two to six inches on a trail surface caused either by
disturbance from use or by flowing water. Trail Disturbance – Any surface material that is loosened by the impact of user
traffic.
Construction and Observations
Rudolf Bennitt Conservation Area
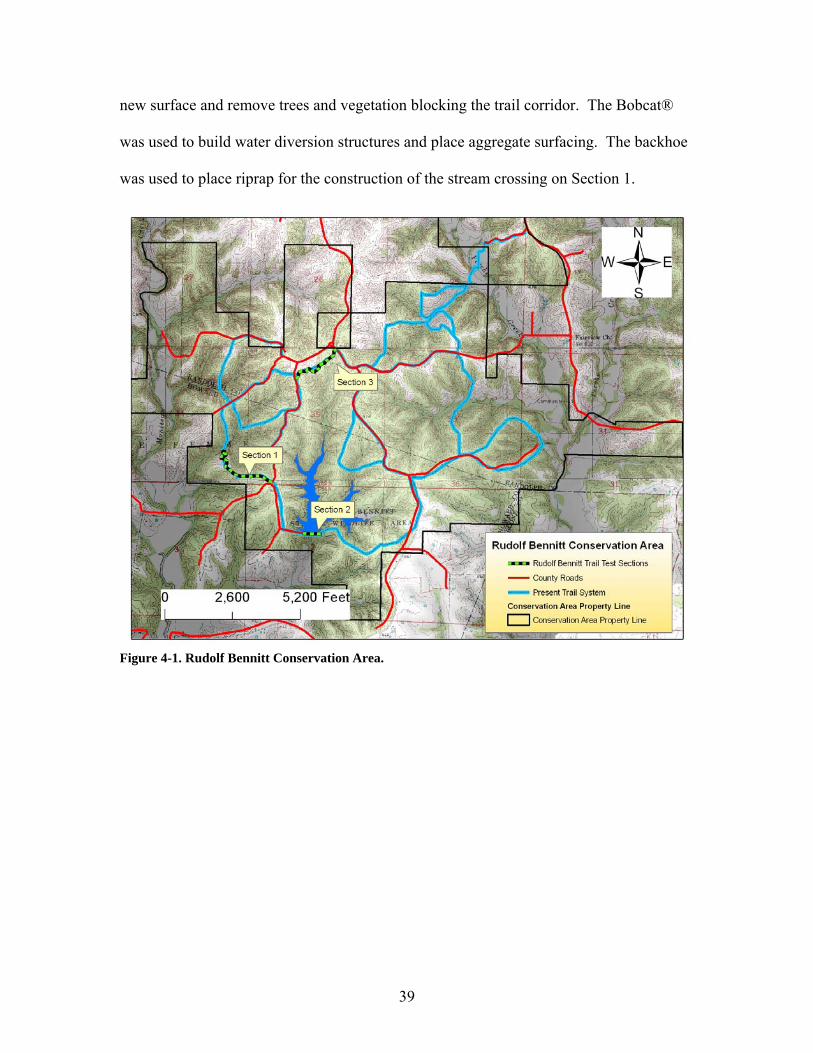
Three separate test sections were constructed at the Rudolf Bennitt Conservation
Area (Figure 4-1) from March through June 2006. The sections were chosen based on
the severity of degradation and the potential for solution application.
The equipment utilized for construction of Section 1 was a bulldozer with a ten
foot wide blade, a tracked Bobcat®, and a backhoe. The bulldozer was used to shape the
39
new surface and remove trees and vegetation blocking the trail corridor. The Bobcat®
was used to build water diversion structures and place aggregate surfacing. The backhoe
was used to place riprap for the construction of the stream crossing on Section 1.
Figure 4-1. Rudolf Bennitt Conservation Area.

40
Section 1
Section 1 is over 3000 feet in length and begins at an intersection with the county
road and continues past a stream crossing (Figure 4-2). The trail follows the ridge top
and then travels down hill to the stream crossing.
Figure 4-2. Rudolf Bennitt Test Section 1.
Existing Conditions - Along the ridge top, the old trail follows an old road bed
(Segments 1 through 21). The old road bed was almost ten feet wide and truncated
approximately six to twelve inches below the surrounding ground. The soil surface was
highly plastic clay. The section was muddy where drainage was not allowed, and several
six inch deep hoof prints could be seen on the surface.

41
Between the ridge top and the stream crossing, the trail heads downhill. Gullies
were observed ranging from one to four feet deep (Figure 4-3). The trail did not feature
any methods for diverting water off the trail. All surface runoff from the upper portion of
the trail was focused on the trail for several hundred feet.
Figure 4-3. Gully Observed along Section 1.
At the bottom of the hill, near the stream bed, the surface was muddy and
saturated (Figure 4-4). The trail had widened to more than ten feet due to users trying to
avoid muddy sections.

42
Figure 4-4. Trail Widening near Stream Crossing on Section 1.
Solutions Applied - Along the ridge top, the trail was rerouted away from the
truncated old road bed (Figure 4-2, Segments 1 through 21). The rerouted trail
meandered back and forth across the old trail in order to provide an outsloped tread for
drainage. The trail surface utilized the in-situ soil. Vegetation was removed along the
width of the trail corridor.
Access to the old trail was blocked with the vegetation and trees removed from
the new corridor. Check dams were built along the old trail to prevent water from
intercepting the new trail.
Segments 22 through 34 were also rerouted to avoid the ruts from the old trail.
Switchbacks were used to lengthen the trail and minimize slope. The tread was outsloped
and in-situ soil was used as a trail surface.

43
Segments 35 through 38 followed the old trail corridor because it provided the
lowest available slope. Segment 35 was in-sloped and utilized 4 inch geocells due to the
steepness of the segment (17%). Segment 36 utilized a geotextile wrap to provide stable
footing over a saturated area near the stream bed.
Segment 37 was the stream crossing. The segment used 60 feet of eight inch deep
geocells. The stream crossing used 60 linear feet of eight inch geocells. The downstream
side was raised six inches to cause water to pool slightly and not scour the surface
aggregate.
Lime admixtures were used along Segment 6. Construction, lab testing, and
observation results are discussed later in this chapter. Geosynthetic waterbars were
installed at varied intervals along the entire section.
Post-Construction Observations - Rills were observed on the silt surface after rain
events on Segments 1 though 22. The silt along the ridge top segments was often muddy
after rain events, and deep hoof prints could be seen. Later, on the same sections, the
hoof prints left from the muddiness appeared as dimples on the trail surface. Raindrop
impact remolded the loess soil and erased the proof of the hoof prints.
Water diversion measures (water bars, infiltration bars, and grade dips) effectively
controlled water on the trail surface. A few water bars had their geotextile wrap exposed
and ripped due to removal of aggregate surfacing. The initial aggregate thickness on the
ripped bars was less than two inches deep. Infiltration bars without surface aggregate
filled up with sediment, loosing their effectiveness.
Segments 22 through 34 had a clay surface tread. This surface was almost always
muddy, and several hundred hoof prints four to six inches deep could be seen long these
segments.
44
Four of the waterbars on Section 1 had surface aggregate removed and the
geotextile fabric was ripped due to traffic. The waterbars were covered with less than
two inches of surface aggregate for cover. All remaining waterbars had more than two
inches of surface aggregate and removal from traffic was not observed. None of the
waterbars exhibited any settling or depressions during the observation period.
A rut was observed on Segment 35 traveling perpendicular to the trail. The rut
was formed by water traveling directly across the trail. The surface aggregate on
Segments 35 was always observed to be stable.
Section 2
Section 2 (Figure 4-5) is over 750 feet in length and consisted of a newly created
path across the earthen dam for Rudolf Bennitt Lake. A path across the crest of the dam
was required to complete a loop trail across the conservation area. Because MDC is
responsible for ensuring the integrity of the dam, the crest of the dam cannot be allowed
to settle or rut due to trail use. Therefore it was decided to apply geosynthetics and build
up the surface six inches in order to prevent rutting.

45
Figure 4-5. Rudolf Bennitt Test Section 2. Two methods of geotextiles were used in Section 2, wrapped and non-wrap. The
methods were alternated across the crest of the dam and had a crowned surface. Geocells
were installed on Segments 1, 3, and 11. Segments 1 and 3 are on the slopes of the
spillway. The slopes crossing the spillway were greater than 10%.
A concern was that riders would try to direct their horses to drink from the lake
whether or not an area was provided. Therefore, a segment was installed on the upstream
face of the dam to provide a location for horses to drink from the lake without damaging
the structure.
Post-Construction Observations - No ruts or disturbances were observed on
Section 2 during ten months of observations. Many vehicles have been driven over
Section 2 for other trail renovations, with no visible impact.
Section 3
Existing Conditions - Section 3 (Figure 4-6) was an existing trail where little use
was observed. The trail was 1000 feet in length and followed a path that went straight up

46
and down the hills. The path had steep slopes ranging from 10% to 20%. Ephemeral
drainages that were crossed by the trail were often muddy and did not provide stable
footing.
Figure 4-6. Rudolf Bennitt Test Section 3.
Solutions Applied - Section 3 was rerouted to follow the topographic contours
with a final length over 1400 feet. The surface was outsloped and the in-situ soil was
used for the surface. Any ephemeral drainages crossed were filled with riprap (for water
to flow through) and covered with one-inch clean aggregate. No water diversion
structures were installed or needed due to the outsloped tread and minimal slope.
Post-Construction Observations - Minimal traffic traveled on the trail during the
observation period. No ruts or disturbances were seen for most of the observation period.
In March 2007, severe muddiness occurred along the entire length of the section. The

47
trail surface was disturbed by six inch deep hoof prints that were filled with water. It was
difficult to obtain stable footing.
Two of the four ephemeral drainage crossings clogged with sediment and water
ponded behind the structures. Clogging of the largest drainage structure caused water to
flow over the structure leaving four inch deep ruts on the surface.
Forest 44 Conservation Area
Three test sections were created at Forest 44 Conservation Area (Figure 4-7).
Each section involved repairing troubled trails within their present corridors. Area
managers could not reroute trails due to limited space between trails and archeological
sites.
Equipment used for construction consisted of a Bobcat® to shape the trail surface
and a small utility ATV with a dump bed for hauling aggregate. The equipment’s small
foot print (less than five feet wide) allowed for the trail corridors to remain small.
Construction was completed during a one week period in February 2006. The
construction crew had several people available along with several pieces of equipment.
This allowed for speedy trail construction.
Only a small portion of construction was observed. The quick speed of
construction was unexpected, and the work was completed before observations could be
made. The only record of construction methods are from pictures and eye-witness
accounts by area managers.

48
Figure 4-7. Forest 44 Conservation Area
Section 1
Existing Conditions - A section of the locally known “Grey Trail” at Forest 44
was used for Section 1 (Figure 4-8). The trail was located on a back slope and traveled
parallel to the topographic contours in most places. Trail alignment was almost
perpendicular to the slope face so rerouting was not required. The average width of the
trail corridor was three feet.
While the trail had a good location and layout, incised ruts could be seen along
the trail due to compaction and displacement of material. Steep sections of the trail had
ruts four to twelve inches deep. Segments with lesser slopes were often muddy or had
water ponding on the trail surface.
49
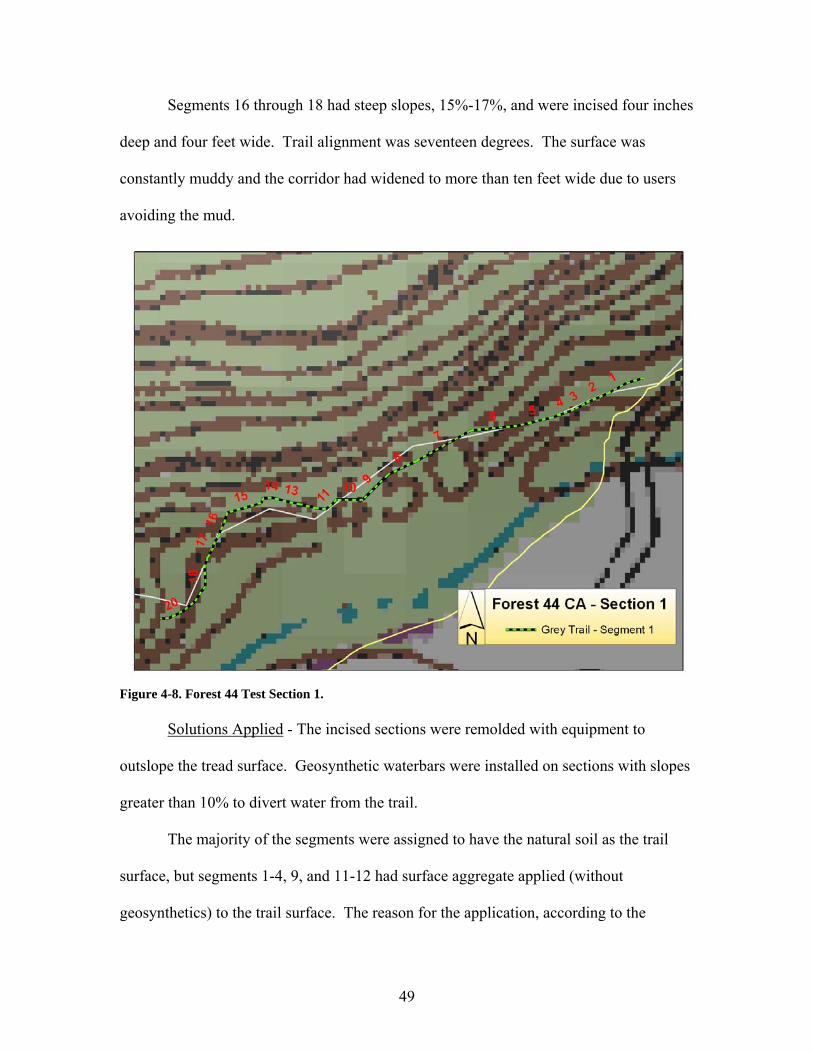
Segments 16 through 18 had steep slopes, 15%-17%, and were incised four inches
deep and four feet wide. Trail alignment was seventeen degrees. The surface was
constantly muddy and the corridor had widened to more than ten feet wide due to users
avoiding the mud.
Figure 4-8. Forest 44 Test Section 1.
Solutions Applied - The incised sections were remolded with equipment to
outslope the tread surface. Geosynthetic waterbars were installed on sections with slopes
greater than 10% to divert water from the trail.
The majority of the segments were assigned to have the natural soil as the trail
surface, but segments 1-4, 9, and 11-12 had surface aggregate applied (without
geosynthetics) to the trail surface. The reason for the application, according to the
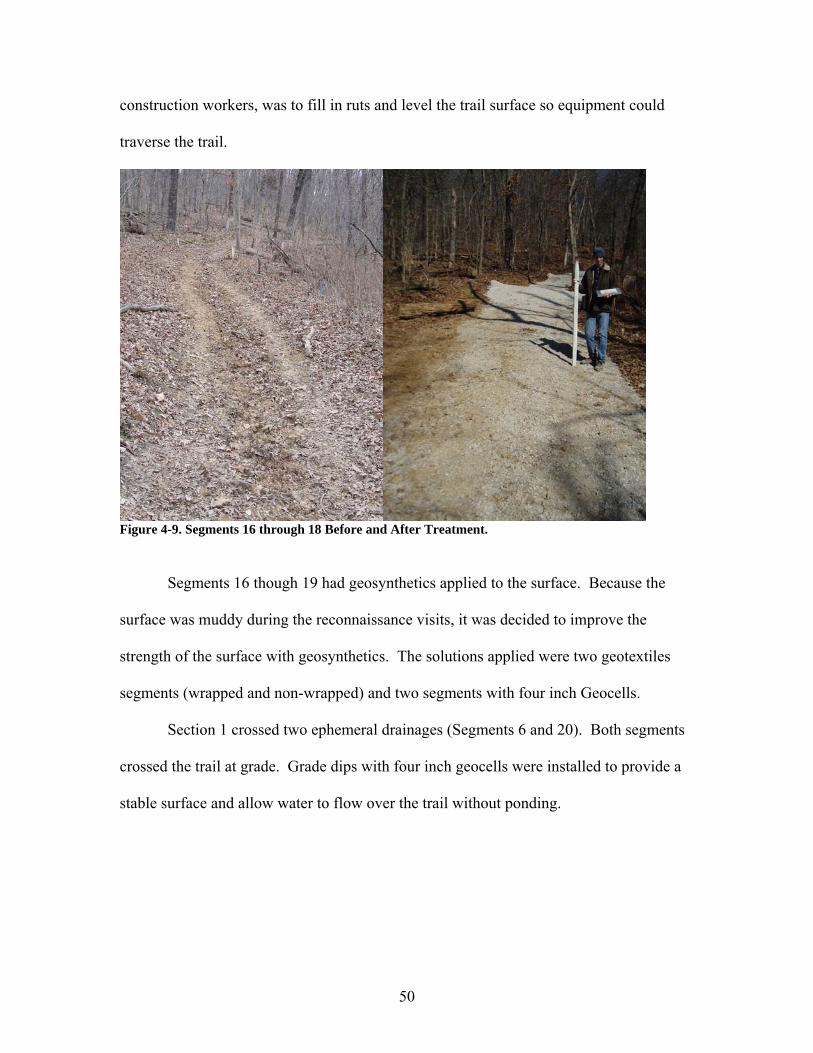
50
construction workers, was to fill in ruts and level the trail surface so equipment could
traverse the trail.
Figure 4-9. Segments 16 through 18 Before and After Treatment.
Segments 16 though 19 had geosynthetics applied to the surface. Because the
surface was muddy during the reconnaissance visits, it was decided to improve the
strength of the surface with geosynthetics. The solutions applied were two geotextiles
segments (wrapped and non-wrapped) and two segments with four inch Geocells.
Section 1 crossed two ephemeral drainages (Segments 6 and 20). Both segments
crossed the trail at grade. Grade dips with four inch geocells were installed to provide a
stable surface and allow water to flow over the trail without ponding.
51
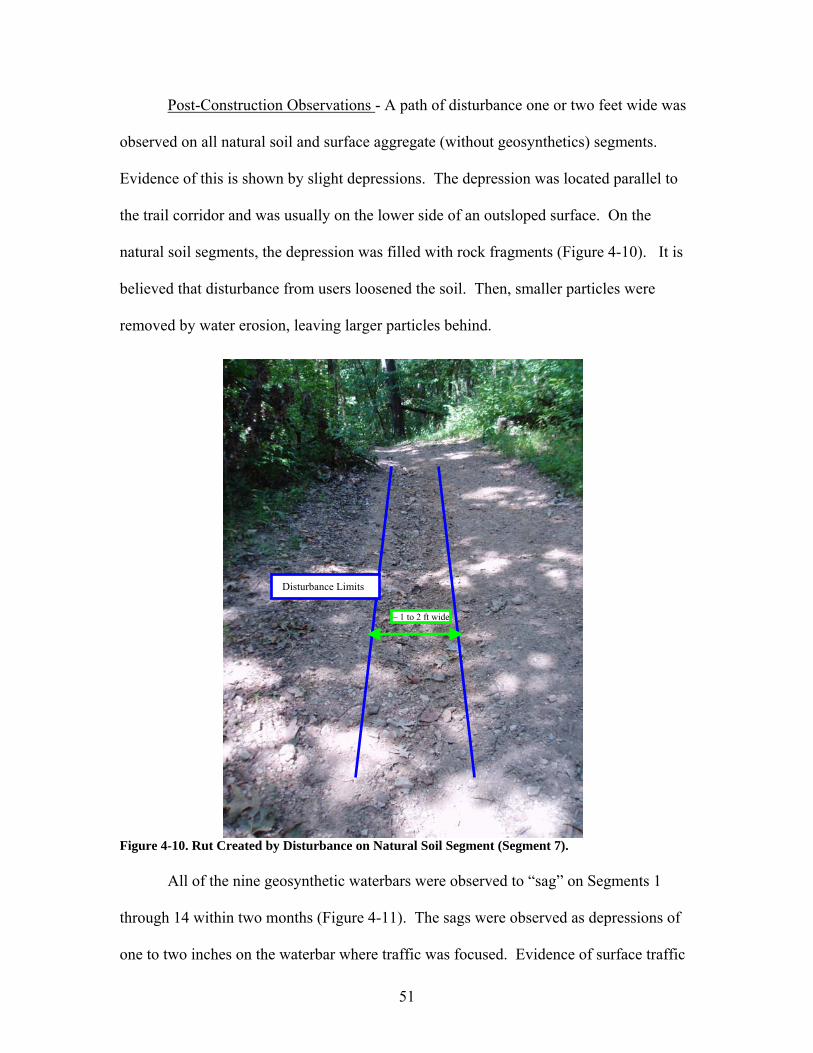
Post-Construction Observations - A path of disturbance one or two feet wide was
observed on all natural soil and surface aggregate (without geosynthetics) segments.
Evidence of this is shown by slight depressions. The depression was located parallel to
the trail corridor and was usually on the lower side of an outsloped surface. On the
natural soil segments, the depression was filled with rock fragments (Figure 4-10). It is
believed that disturbance from users loosened the soil. Then, smaller particles were
removed by water erosion, leaving larger particles behind.
Figure 4-10. Rut Created by Disturbance on Natural Soil Segment (Segment 7). All of the nine geosynthetic waterbars were observed to “sag” on Segments 1
through 14 within two months (Figure 4-11). The sags were observed as depressions of
one to two inches on the waterbar where traffic was focused. Evidence of surface traffic
Disturbance Limits
~ 1 to 2 ft wide
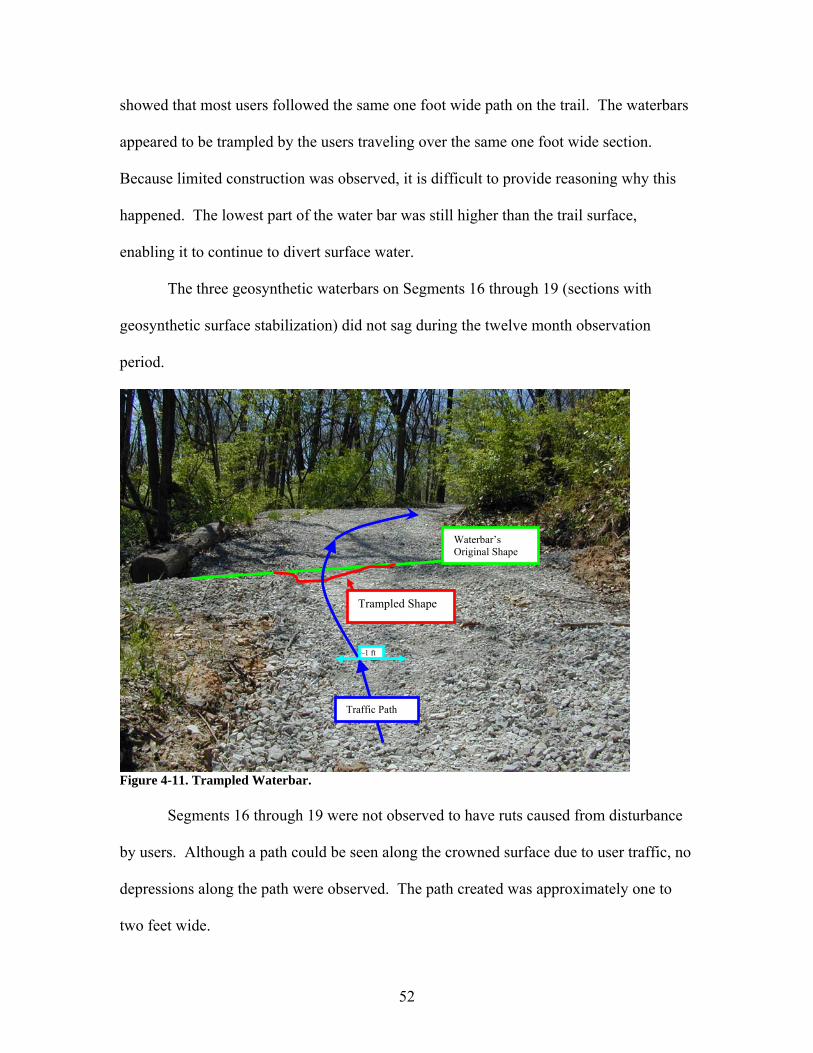
52
showed that most users followed the same one foot wide path on the trail. The waterbars
appeared to be trampled by the users traveling over the same one foot wide section.
Because limited construction was observed, it is difficult to provide reasoning why this
happened. The lowest part of the water bar was still higher than the trail surface,
enabling it to continue to divert surface water.
The three geosynthetic waterbars on Segments 16 through 19 (sections with
geosynthetic surface stabilization) did not sag during the twelve month observation
period.
Figure 4-11. Trampled Waterbar. Segments 16 through 19 were not observed to have ruts caused from disturbance
by users. Although a path could be seen along the crowned surface due to user traffic, no
depressions along the path were observed. The path created was approximately one to
two feet wide.
Trampled Shape
Waterbar’s Original Shape
Traffic Path
~1 ft

53
During January 2007, the aggregate surface (within the path of use) appeared to
have a significant amount of fines (Figure 4-12). Hoof prints could be seen ¼ inch deep
in the aggregate surface.
Figure 4-12. Segments 16 through 19 (Observed during January 2007).
Section 2
Existing Conditions - Section 2 (Figure 4-13) was located in a valley along the
Yellow Trail in the conservation area. The trail is twelve feet wide. All users travel on
this trail because all other trails are only accessed by this main trail. The test section is
over 800 feet long and crosses a stream.
The low lying trail was incised below the surrounding soil surface. After rain
events, the trail was muddy for a significant amount of time because it was so low in the
landscape. Because of the incised surface, surface water runoff often flowed on the trail
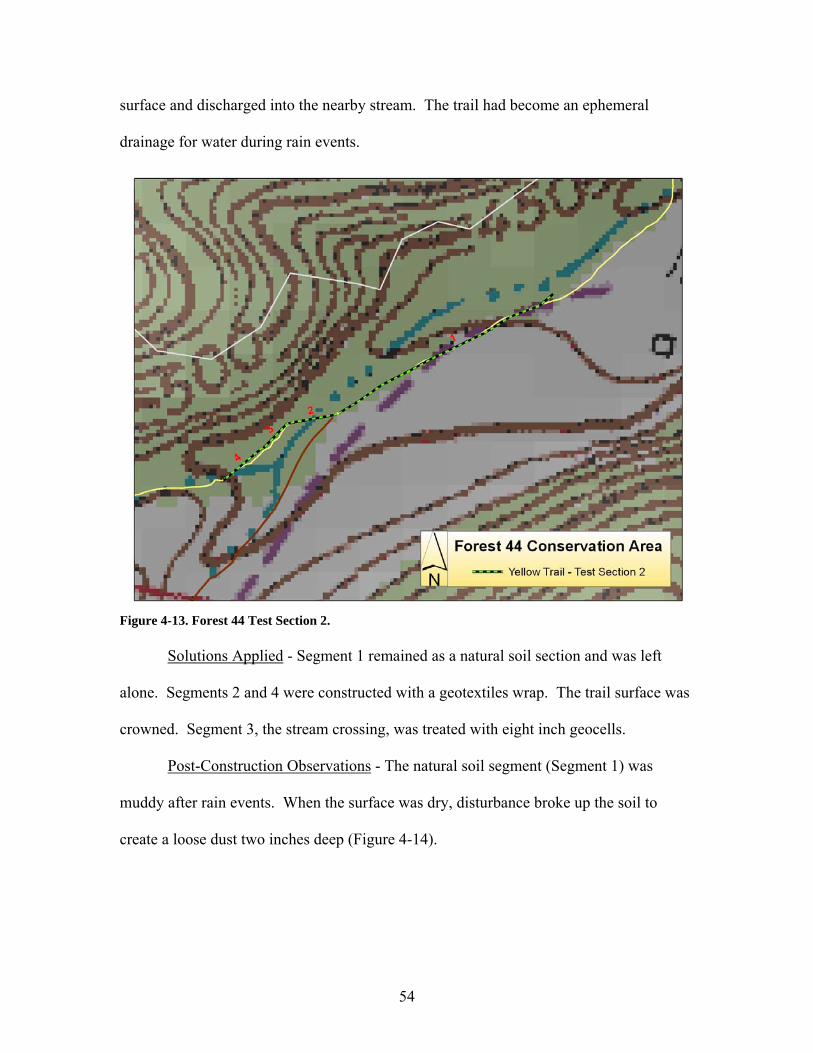
54
surface and discharged into the nearby stream. The trail had become an ephemeral
drainage for water during rain events.
Figure 4-13. Forest 44 Test Section 2.
Solutions Applied - Segment 1 remained as a natural soil section and was left
alone. Segments 2 and 4 were constructed with a geotextiles wrap. The trail surface was
crowned. Segment 3, the stream crossing, was treated with eight inch geocells.
Post-Construction Observations - The natural soil segment (Segment 1) was
muddy after rain events. When the surface was dry, disturbance broke up the soil to
create a loose dust two inches deep (Figure 4-14).

55
Figure 4-14. Forest 44 - Section 2 - Segment 1- Muddy and Dry.
A two foot wide path was observed on Segments 2 through 4 that suggests that a
majority of user traffic was focused on only one part of the trail corridor. The trail
surface remained crowned during the entire observation period and no depressions from
disturbance were observed. During January 2007, the two foot wide user path appeared
to be smooth and have more fines. The one inch particles were not seen on the surface.
Again, this observation was only seen on geosynthetic stabilized segments.
Section 3
Section 3 (Figure 4-15) consisted of a 300 foot section of the Brown Trail. The
section travels from the footslope, uphill along the backslope of a finger ridge. The soil
on the section was clay that was often wet and muddy. The steep slope of the trail
combined with the clay created a slippery condition. Hoof prints four inches deep were
observed many times along the section, along with evidence of hoofs sliding downhill.

56
Figure 4-15. Forest 44 Test Section 3.
Solutions Applied - Geosynthetics were applied to each segment along Section 3
because of the muddiness and the steepness of the trail. Segment 1, the steepest segment
(18%), was constructed with 4 inch geocells. Segments 2 and 3 were constructed with
geotextile wraps. Segment 4 was constructed with the non-wrap geotextile fabric. The
surface of each trail was crowned and waterbars were installed between each segment.
Post-Construction Observations - The crowned surface was not observed to have
any depressions or ruts due to disturbance. The aggregate surface revealed a path of
travel created by users to be two feet wide. During January 2007, the aggregate surface
appeared to be smooth and have more fines along the path most traveled.

57
Angeline Conservation Area
One test section was created at the Angeline Conservation Area (Figure 4-16).
The single test section involved rerouting a trail with poor slope alignment. A decision
was made by area managers to put surface aggregate on all trails and make them eight
feet wide; therefore maintenance could be completed with four-wheel drive vehicles.
Equipment used for construction was a bulldozer with a thirteen-foot wide blade,
a road grader for surface shaping, dump trucks for placing aggregate, a large front-end
loader with back-hoe attachment, and a Bobcat® for refined surface shaping.
Figure 4-16. Angeline Conservation Area.
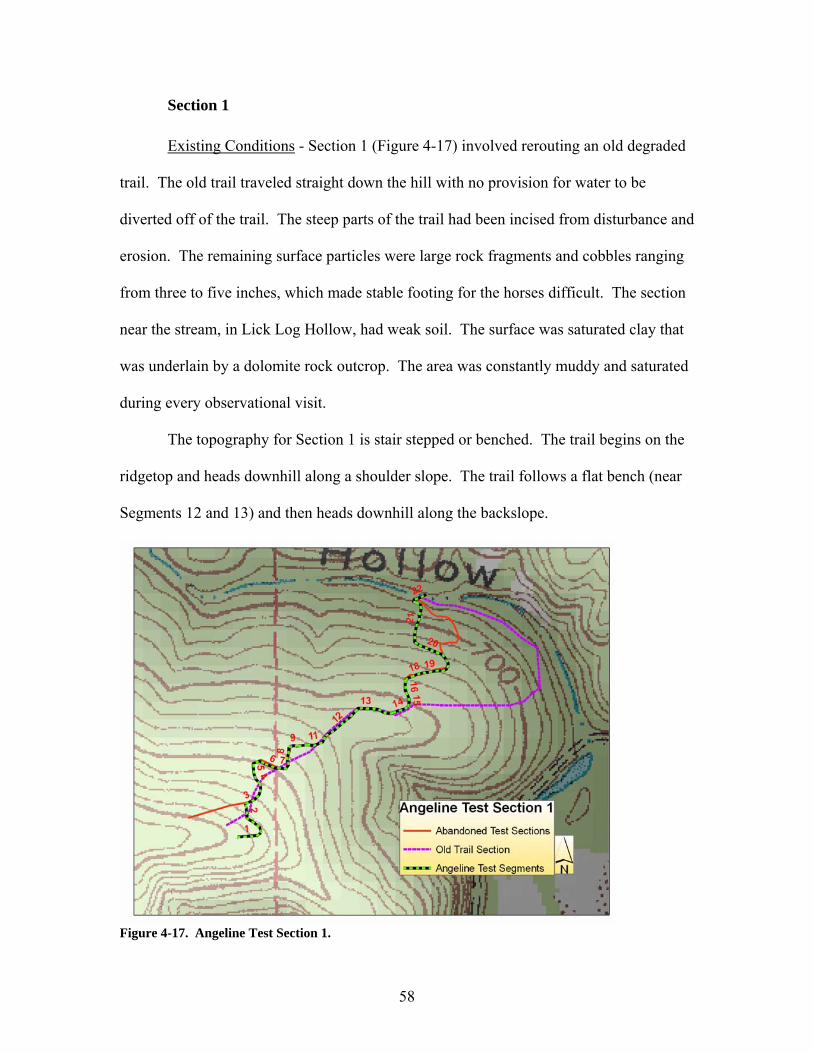
58
Section 1
Existing Conditions - Section 1 (Figure 4-17) involved rerouting an old degraded
trail. The old trail traveled straight down the hill with no provision for water to be
diverted off of the trail. The steep parts of the trail had been incised from disturbance and
erosion. The remaining surface particles were large rock fragments and cobbles ranging
from three to five inches, which made stable footing for the horses difficult. The section
near the stream, in Lick Log Hollow, had weak soil. The surface was saturated clay that
was underlain by a dolomite rock outcrop. The area was constantly muddy and saturated
during every observational visit.
The topography for Section 1 is stair stepped or benched. The trail begins on the
ridgetop and heads downhill along a shoulder slope. The trail follows a flat bench (near
Segments 12 and 13) and then heads downhill along the backslope.
Figure 4-17. Angeline Test Section 1.

59
Solutions Applied - The original trail was rerouted to create better trail alignment,
decrease the slope, and allow the trail surface to be outsloped. Segments 1 through 3, and
18 through 19 were treated with surface aggregate (no geosynthetics). Segments 4
through 11, and 13 through 17 had non-wrap geotextile fabric applied.
Segment 12 was the only segment that had wrapped geotextiles applied to it. It
was determined all the other sections were too steep to install the wrapped geotextile
fabric.
Segments 20 through 21 had extremely high slopes, 20% and 40+% respectively.
No solutions were prepared for slopes that steep. Therefore they were covered with
surface aggregate (no geosynthetics).
Segment 22, near the stream crossing, was treated with an eight-inch layer of two-
inch clean aggregate and then covered with surface aggregate. The stream crossing at the
bottom of the hill had a solid bedrock bottom, and was left asis.
All sections were covered with surface aggregate to match all other trails on the
conservation area. No natural soil surfaces were included in the test section. All
aggregates were placed by backing dump trucks downhill while dumping the aggregate.
The dump trucks were then hauled uphill by a small dozer, because the trucks could not
climb the steep hills on their own. This method was not effective in obtaining the desired
aggregate cover of four inches. The final average surface aggregate thickness was greater
than six inches.
Post-Construction Observations - A rainstorm occurred the night before the initial
measurements of the test section. Water was observed running on the trail surface on
Segments 9 through 10, and 20 through 22. Both of these stretches are located within 36
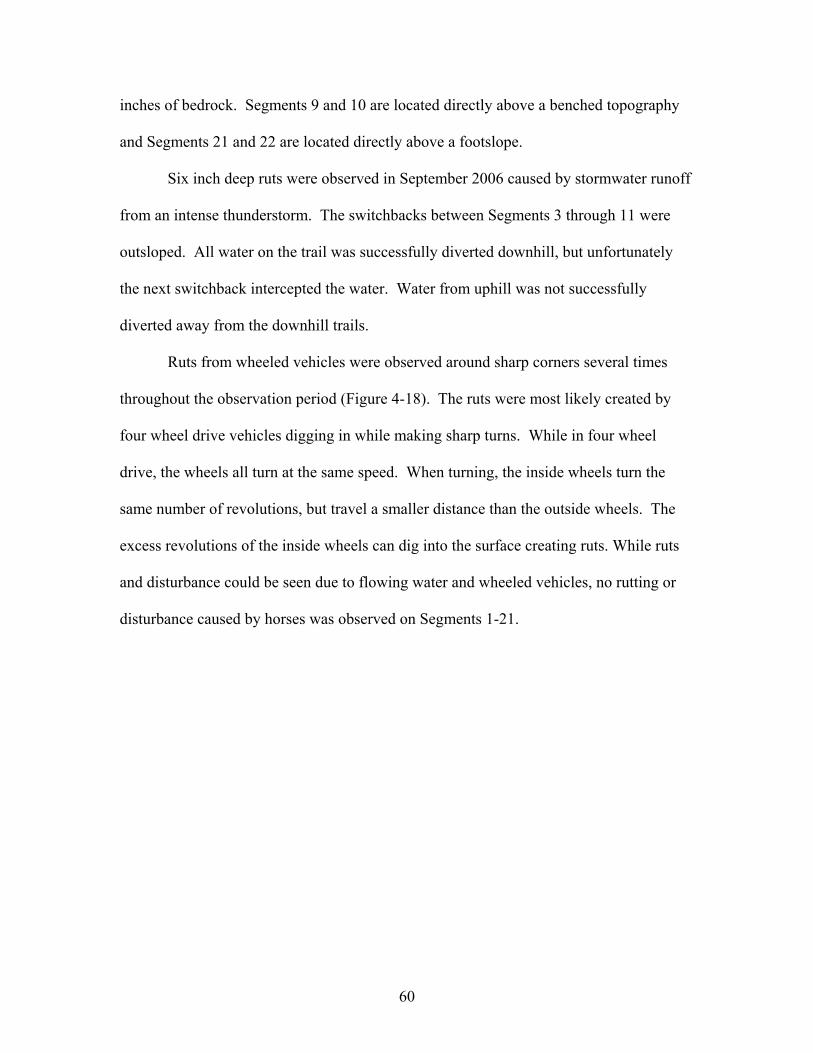
60
inches of bedrock. Segments 9 and 10 are located directly above a benched topography
and Segments 21 and 22 are located directly above a footslope.
Six inch deep ruts were observed in September 2006 caused by stormwater runoff
from an intense thunderstorm. The switchbacks between Segments 3 through 11 were
outsloped. All water on the trail was successfully diverted downhill, but unfortunately
the next switchback intercepted the water. Water from uphill was not successfully
diverted away from the downhill trails.
Ruts from wheeled vehicles were observed around sharp corners several times
throughout the observation period (Figure 4-18). The ruts were most likely created by
four wheel drive vehicles digging in while making sharp turns. While in four wheel
drive, the wheels all turn at the same speed. When turning, the inside wheels turn the
same number of revolutions, but travel a smaller distance than the outside wheels. The
excess revolutions of the inside wheels can dig into the surface creating ruts. While ruts
and disturbance could be seen due to flowing water and wheeled vehicles, no rutting or
disturbance caused by horses was observed on Segments 1-21.
61
Figure 4-18. Ruts from Wheeled Vehicles on Sharp Turns. Segment 21 and 22 were observed to have ruts four to six inches deep from
wheeled vehicles due to inadequate surface strength. Hoof prints were observed between
the ruts from wheeled vehicles. Evidence of users sliding was observed by smearing on
the surface. Both segments were muddy and water was ponded in the ruts (Figure 4-19).
Geosynthetic separation was not installed on either segment. The surface aggregate had
mixed with the underlying clay. The surface on Segment 22 was always observed to
have a wet appearance. That segment crosses a large concave topographic shape that
collects water from a large watershed drains onto the trail.
Original Shape
Ruts created by vehicles

62
Figure 4-19. Ruts and Muddiness Observed on Sections 21 and 22.
Lime Stabilization Results
Lime stabilization was suggested for use as the surface treatment to be used on
Section 1 of Rudolf Bennitt CA. The incised road bed had highly plastic clay on the
surface rather than the silt surrounding the trail. The treatment was planned to be used on
the trail, but the new path created during construction. In early June 2006, the decision
was made to proceed with the experiment. Lab testing was not performed prior to field
construction. Therefore the amount of lime required had to be estimated.
In June 2006 lime stabilization was performed on Test Segment 6. Lime was
mixed at a rate of 10% by dry weight with the “mixed soil.” It was estimated that mixing

63
lime at rate of 6% would be adequate in lab conditions. Mixing and compaction in the
field would not be as efficient; therefore, a rate of 10% was used.
Mixing was accomplished by using tilling attachment on a Bobcat®. The surface
soil was tilled six inches deep by making several passes with the Bobcat® with the tiller
attachment. Hydrated lime was dumped on the loose soil in 50-pound bags. Water was
added by making a few passes with a pick-up truck with a water tank. The soil-lime
mixture was then mixed by making several passes with the Bobcat®. The soil was
compacted with the Bobcat® making several passes over the section.
Lab Testing
Lab testing was performed on samples taken from Segment 6 prior to
construction. The tests performed involved particle size analysis, Atterberg limits, and
unconfined shear strength testing of lime cured compacted samples. The mixture rate of
lime was varied (0%, 3%, 6%, and 9%) at different curing time intervals (1-day, 7-day,
and 28-day). Shear strength testing was also performed on dry and wet samples to
observe the effect of water content.
The hydrometer analysis (Figure 4-20) and Atterberg limit testing (LL= 40,
PI=20) reveal the in-situ soil is classified as silt.

64
0%
10%
20%
30%
40%
50%
60%
70%
80%
90%
100%
0.0010.010.11
Particle Size (mm)
Perc
ent F
iner
(%)
Figure 4-20. Hydrometer Analysis of the In-situ Soil. Shear strength increase over time for the lime cured samples can be seen in Figure
4-21. After one day of curing, a strength gain of 100% occurred with the 3%, 6%, and
9% samples. For the seven and twenty-eight day curing times, a significant strength
increase was not seen.
1 day7 days
28 days
0% 3% 6% 9%
49.2
46.3
44.9
48.153.9
44.1
42.443.3
44.9
22.622.6
22.6
0.0
10.0
20.0
30.0
40.0
50.0
60.0
Shea
r Str
engt
h (p
si)
Curring Time
(days) Percentage Lime
Figure 4-21. Maximum Shear Strength for Lime Cured Samples.

65
A shear strength comparison for wet and dry samples can be seen in Figure 4-22.
The strength when wet decreases for all levels of lime mixtures. The average shear
strength decreases by 30% for samples with no lime, and almost 50% for the lime cured
samples. Although the shear strength decreases more for the lime cured samples, the
strength is still higher than the in-situ soil. The 6% and 9% samples average wet shear
strengths of 25 psi, which is stronger than the in-situ soil when dry.
DryWet 0%
3%6%
9%
49.2
25.2
48.1
25.9
42.4
19.4
22.6
17.4
0.0
5.0
10.0
15.0
20.0
25.0
30.0
35.0
40.0
45.0
50.0
Shea
r Str
engt
h (p
si)
Percentage Lime
Figure 4-22. Average Shear Strength Results for Wet and Dry Lime Cured Samples (28-day curing). Atterberg limit results (Table 4-1) show that the lime stabilization was effective in
decreasing the plasticity index of the in-situ soil. The plasticity index of 20 was reduced
to 9 by adding only 3% lime. The 6% and 9% samples broke apart and were not able to
be rolled to the 1/8” diameter. They were considered non-plastic behavior.
Table 4-1. Atterberg Limit Results of Lime Cured Samples. Atterberg Limits Percent
Lime PL LL PI 0% 20 40 20 3% 26 35 9 6% Not Plastic 35 N/A 9% Not Plastic N/A N/A
66
Post-Construction Observations
The lime stabilized trail segment was not observed to rut from water erosion or
become muddy during any part of the observation period. The surface appeared to be
solid and stable even when adjacent sections were observed to be muddy. Imprints left
on the surface from traffic were different than adjacent sections. Outlines of horse shoes
could be seen on the lime stabilized section, versus an entire hoof prints were observed
on adjacent sections. These different imprints show the difference strengths between the
treated and untreated sections.
During the winter months of December 2006, January 2007, and February 2007
the site had undergone several cycles of freezing and thawing and experienced several
winter storms. In late February 2007, the final snow cover had melted to reveal a highly
disturbed surface. The lime treated soil was broken up and loosened along the entire
segment’s surface. The loose particles consisted of chunks varying in size from 0.1 to 2
inches. Hoof prints two inches deep were observed from a few horses.

67
5. DISCUSSION
Wearing Surface Effectiveness
Natural Soil Surfaces
The soil textures studied were clay, silt, clay loam, and gravely silt. These
textures represent just a limited sample of spectrum of potential soil textures that may be
encountered, but conclusions can still be drawn about their applicability for equestrian
trail surfaces. All of the natural soil segments exhibited rutting at least inch inch deep
due to user disturbance. When dry, natural soil surfaces were broken up and turned to
dust by horse traffic. When wet, the surfaces were muddy and unstable. Sliding was
observed on segments with slopes greater than 10% when wet. Hoof prints remained on
the natural soil surface in muddy areas after the soil dried.
Evidence of erosion due to dispersion by water was observed by rills forming in
the silt segments at Rudolf Bennitt. On segments with textures other than silt, rills were
not observed due to water erosion. However, it is possible that with a longer period of
observation, these would be witnessed.
The observations of user disturbance, muddiness, and erosion provide evidence
that natural soil textures tested cannot withstand the impacts and stresses applied by
horses.
Surface Aggregate without Geosynthetics
Trail segments that were constructed with surface aggregate without geosynthetic
protection were effective in providing stable surfaces under certain conditions. These
trail segments at the Angeline CA were successful near the ridgetop while overlying soils

68
with high percentages of silt and gravel. Ruts did not appear from the upward migration
of fines into the aggregate surface. Ruts and muddiness did appear in sections in low
lying topographic areas overlying fine grained soils. The soils on those segments were
often observed to be saturated and weak. This is expected due to the differences in
subgrade texture and landscape position. High landscape positions usually have less
water affecting the surfaces than sections lower in the landscape. Fine grained soils are
weaker than soils with high gravel content.
Ruts from user disturbance were witnessed at the Forest 44 CA. Compaction
from horses caused depressions one to two inches deep with subgrades consisting of silty
gravel textures.
Ruts created by four wheel drive vehicles on sharp corners were observed at the
Angeline CA. The ruts were caused by the tires digging into the surface while taking
sharp turns. The use of vehicles was not expected, and the trails were not designed for
those users.
Erosion of the surface aggregate sections was observed at the Angeline CA. The
ruts created by erosion were caused due to inadequate surface water control. The
climbing switchback turns were not insloped to intercept runoff from uphill trails. The
trails were outsloped allowing water to flow over the trail surface and onto downhill
trails. A simple solution would be to inslope the surface shape as originally designed.
Surface Aggregate with Geosynthetics
Segments with geosynthetics provided a stable surface during the entire
observation period. The three different applications (wrapped geotextile, non-wrap
geotextiles, and geocells) outperformed the surface aggregate segments without

69
geosynthetics. The segments provided adequate strength to support horses and wheeled
vehicles. Ruts due to upward migration of fines were not observed due to the separation
from the geotextiles. Geosynthetic reinforcement is an acceptable solution to increase
surface strength.
Effectiveness of Lime Stabilization
Lab tests revealed that lime stabilization is effective in increasing the shear
strength of the tested soil. The field application confirmed the increase in shear strength
and erosion resistance during the initial observation period. While the initial
observations were positive, failure did occur during winter due to freeze-thaw effects.
The trail surface was broken up into small pieces. The resulting effect was a loose trail
surface with decreased strength. The loose surface was susceptible to disturbance and
displacement from trail users. In addition, the lack of cohesion between the loose
particles allowed for surface water to carry them away. Lime stabilization is not an
effective trail wearing surface, due to the negative effects from freeze-thaw occurrences.
Surface Water Control
Geosynthetic Reinforced Waterbars
All of the waterbars constructed were geosynthetics reinforced water bars. All of
the waterbars were successful in diverting water from trail surfaces. Waterbars at the
Rudolf Bennitt CA with less than two inches of surface aggregate cover were observed to
be ripped by horse hooves.
None of the waterbars at the Rudolf Bennitt CA were observed to have depression
created by users. It is unclear why depressions were observed in the waterbars at the

70
Forest 44 CA on natural soil segments because construction was not observed. It is
possible that the geosynthetic wrap was not wrapped “tight” enough to provide adequate
reinforcement, or not enough of an overlap was installed.
These observations suggest that the construction of waterbars required more than
two inches of surface aggregate cover and that the geotextile wrap be as tight as possible
with an overlap greater than the original twelve inches.
Surface Shape
The outsloped surfaces were successful in diverting water on the trails, except
where switchbacks were used to reduce slope. In these conditions the outsloped surface
diverts water onto other trail surfaces. Therefore, it is necessary to inslope or crown trail
surfaces when using climbing turns.
Another alternative would be to always use an insloped or crowned trail surface.
This method could reduce the amount of water affecting the trail surface. Any water
collected by insloping or crowning could be diverted off of the trail at certain exit points
by using waterbars or grade dips.

71
6. CONCLUSIONS
There are two methods available to reduce trail degradation: decrease the
causative forces or increase the resistive forces. Improving trail layout by reducing slope
and controlling surface water reduces the causative effects. Increasing surface stability
and erosion resistance increases the resisting forces. Preventing trail degradation on
equestrian trails requires both methods.
The high stresses applied by horses to trail surfaces require strong resistance.
Natural soils are not effective in providing adequate resistance. Horses disturb the
surface by loosening soil particles which are then free to be carried away by water.
Surface stabilization is required to improve strength and provide a surface that will resist
the impacts from horses.
Stabilizing the trail surface can improve resistance from the high stresses of
equestrian impact, but it does not protect against erosion unless it is combined with
proper trail layout. Surface stabilization is not a fix-all solution. Erosion of surface
aggregate will occur if water’s energy is not reduced by the trail layout.
In summary, natural soil trails are not adequate trail surfaces due to the intense
impact of horse. Surface aggregate is an effective technique when combined with
geosynthetic reinforcement; lime stabilization is not effective due to the impact of
freezing and thawing during winter.
Recommendations
While this study reveals that the combination of surface stabilization and proper
trail layout were able to resist trail degradation during the observation period, the life
expectancy of these solutions is still unknown. Observations were only conducted over a

72
one year period. Further research should be conducted to determine the exact
maintenance requirements and associated costs. As with highways and other
infrastructure, maintenance is always required. Maintenance costs have to be considered
along with the initial costs to determent the most efficient designs.
Other recommendations would be to use the technology of Geographic
Information Systems (GIS). A GIS database could be created combining soil data and
topographic data. Trail planning could be accomplished by laying out proposed trails in
GIS before field visits. The database could predict possible problem areas and help
produce the optimal trail layout.

73
REFERENCES:
American Horse Counsel. (2005). "National Economic Impact of the U.S. Horse Industry - State Breakout Studies." Retrieved March 31, 2007, from http://horsecouncil.org/stateeconomics.html. Annandale, G. W. (2006). Scour technology : Mechanics and Engineering Practice. New York :, McGraw-Hill. Arndt, W. (1966). "The effects of traffic compaction on a number of soil properties." J. of Agricultural Engineering Research 11: 182-187. Aust, M. W., J. L. Marion and K. Kyle (2005). "Research for the Development of Best Management Practices for Minimizing Horse Trail Impacts on the Hoosier National Forest. Management Report." US Department of Agriculture, US Forest Service, Final Report, Bedford, IN 77. Briaud, J. L. (2003). Complex Pier and Contraction Scour in Cohesive Soils.Transportation Research Board. NCHRP Report 24-15. Bryan, R. B. (1977). "The Influence of Soil Properties on Degradation of Mountain Hiking Trails at Grovelsjon." Geografiska Annaler. Series A, Physical Geography 59(1/2): 49-65. Cole, D. N. (1983). "Assessing and monitoring backcountry trail conditions (Research Paper INT-303)." Ogden, UT: USDA Forest Service, Intermountain Forest and Range Experiment Station. Cole, D. N. (1995). Recreational Trampling Experiments: Effects of Trampler Weight and Shoe Type, US Dept. of Agriculture, Forest Service, Intermountain Research Station. Helgath, S. F., U. I. Forest and R. E. Station (1975). Trail Deterioration in the Selway-Bitterroot Wilderness, Intermountain Forest and Range Experiment Station. Koerner, R. M. (2005). Designing with Geosynthetics. Upper Saddle River, New Jersey, Prentice Hall. Kuss, F. R. (1983). "Hiking boot impacts on woodland trails." Journal of Soil and Water Conservation 38(2): 119-121. Lull, H. W. (1959). Soil Compaction on Forest and Range Lands.USDA Forest Service. Washington D.C. Misc. Pub. No. 768. . McQuaid-Cook, J. (1978). "Effects of hikers and horses on mountain trails." Journal of Environmental Management 6: 209–212.

74
Monlux, S. and B. Vachowski (2000). Geosynthetics for Trails in Wet Areas.U.S. Department of Agriculture, Forest Service. Technical Report. 0023-2838-MTDC. Parker, T. S. (2004). Natural Surface Trails by Design. Boulder, CO, Nature Shape. Stevens, M. E. (1966). "Soil Surveys as Applied to Recreation Site Planning." Journal of Forestry 64: 314-316. Summer, R. M. (1980). "Impact of horse traffic on trails in Rocky Mountain National Park." Journal of Soil and Water Conservation 35(2): 85-77. Tinsley, B. E. and E. B. Fish (1985). "Evaluation of trail erosion in Guadalupe Mountains National Park, Texas." Landscape Planning 12(1): 29-48. Transportation Research Board (1987). Lime Stabilization: Reactions, Properties, Design, and Construction. Washington D.C., National Research Council. Soil Conservation Service (1989). Soil Survey of Randolf County, Missouri. US Department of Agriculture. Soil Conservation Service (1982). Soil Survey of St. Louis County, Missouri. US Department of Agriculture. Soil Conservation Service (2005). Soil Survey of Shannon County, Missouri. US Department of Agriculture. Weaver, T. and D. Dale (1978). "Trampling Effects of Hikers, Motorcycles and Horses in Meadows and Forests." The Journal of Applied Ecology 15(2): 451-457. Weaver, T., D. Dale and E. Hartley (1979). "The relationship of trail condition to use, vegetation, user, slope, season and time." Proc. Recreational Impact on Wildlands: 94–100. Whittaker, P. L. (1978). Comparison of Surface Impact by Hiking and Horseback Riding in the Great Smoky Mountains National Park, Dept. of the Interior, National Park Service, Southeast Region, Uplands Field Research Laboratory: Resource Management and Visitor Protection, Great Smoky Mountains National Park.

75
A. APPENDIX A: TRAIL MEASUREMENT DATA
Table A-1. Rudolf Bennitt CA – Trail Measurement Data

76
Table A-2. Rudolf Bennitt CA - Section 1 Observation Data.
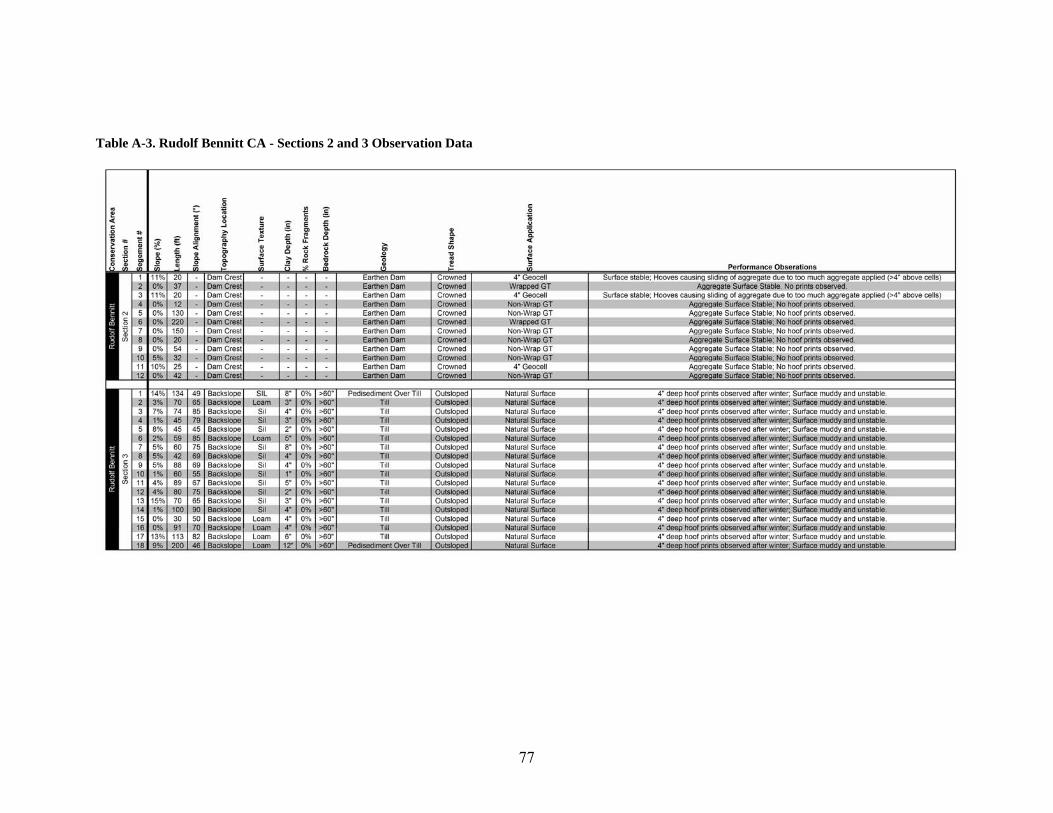
77
Table A-3. Rudolf Bennitt CA - Sections 2 and 3 Observation Data
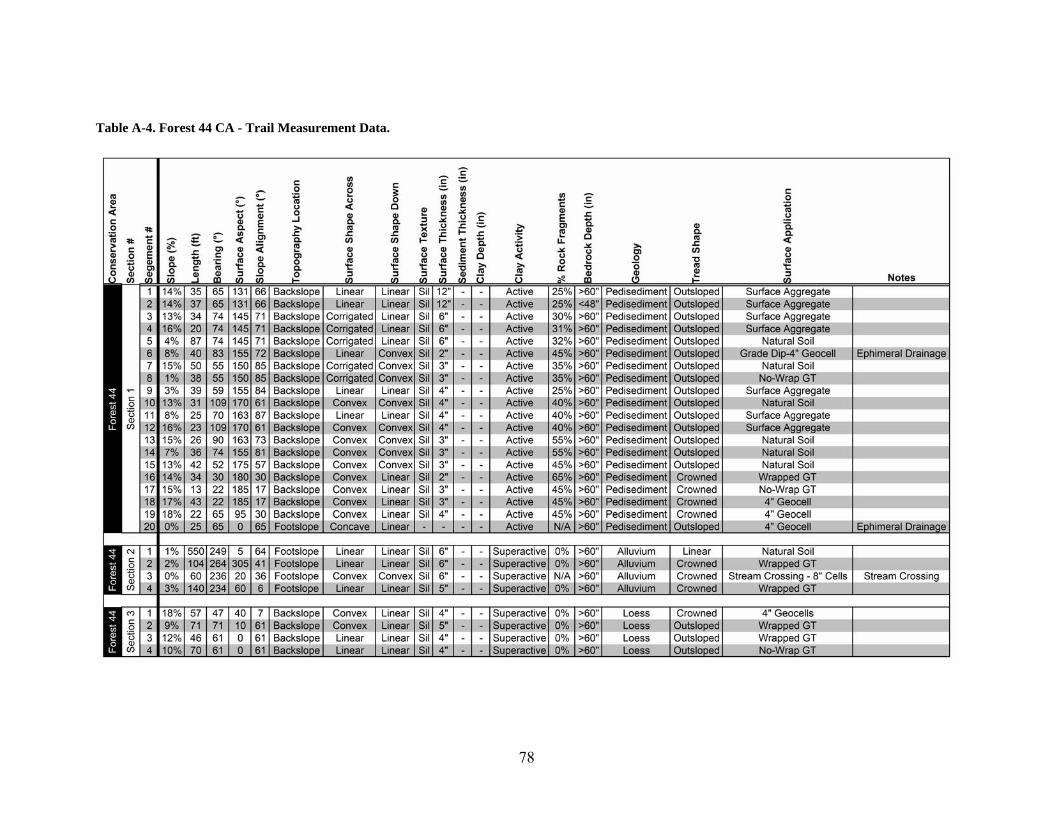
78
Table A-4. Forest 44 CA - Trail Measurement Data.

79
Table A-5. Forest 44 CA - Observation Data
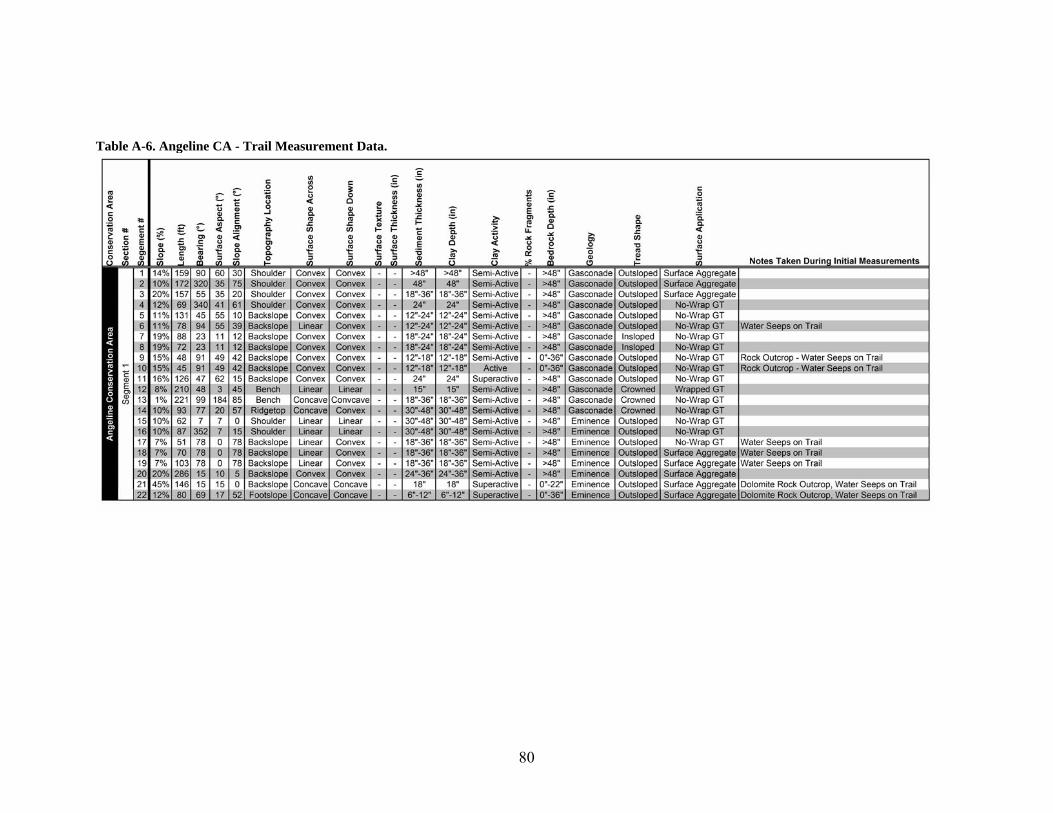
80
Table A-6. Angeline CA - Trail Measurement Data.
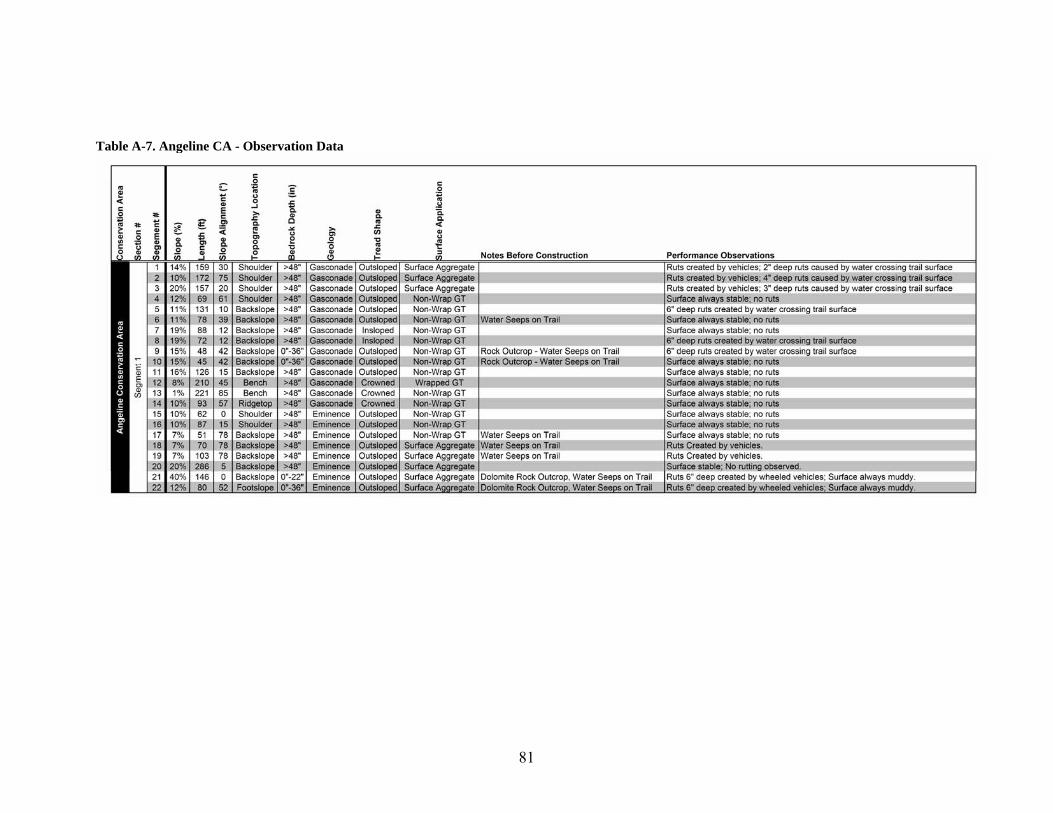
81
Table A-7. Angeline CA - Observation Data

82
B. APPENDIX B: TRAIL CONSTRUCTION DRAWINGS
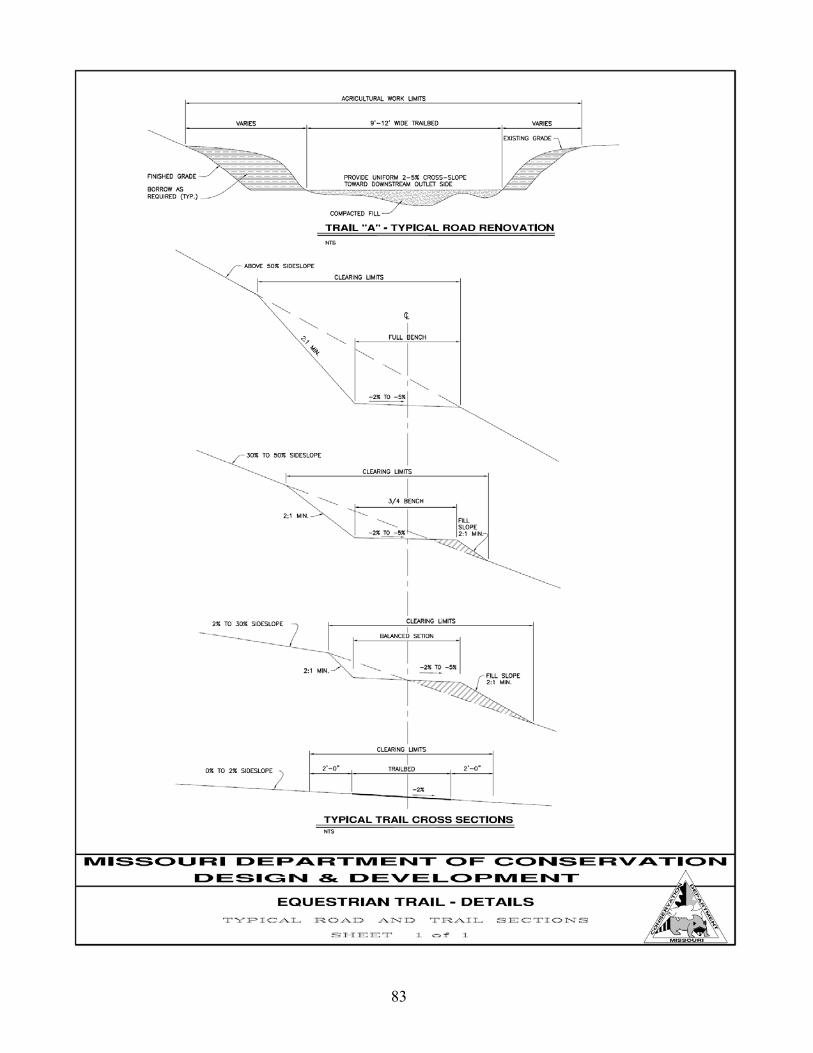
83

84
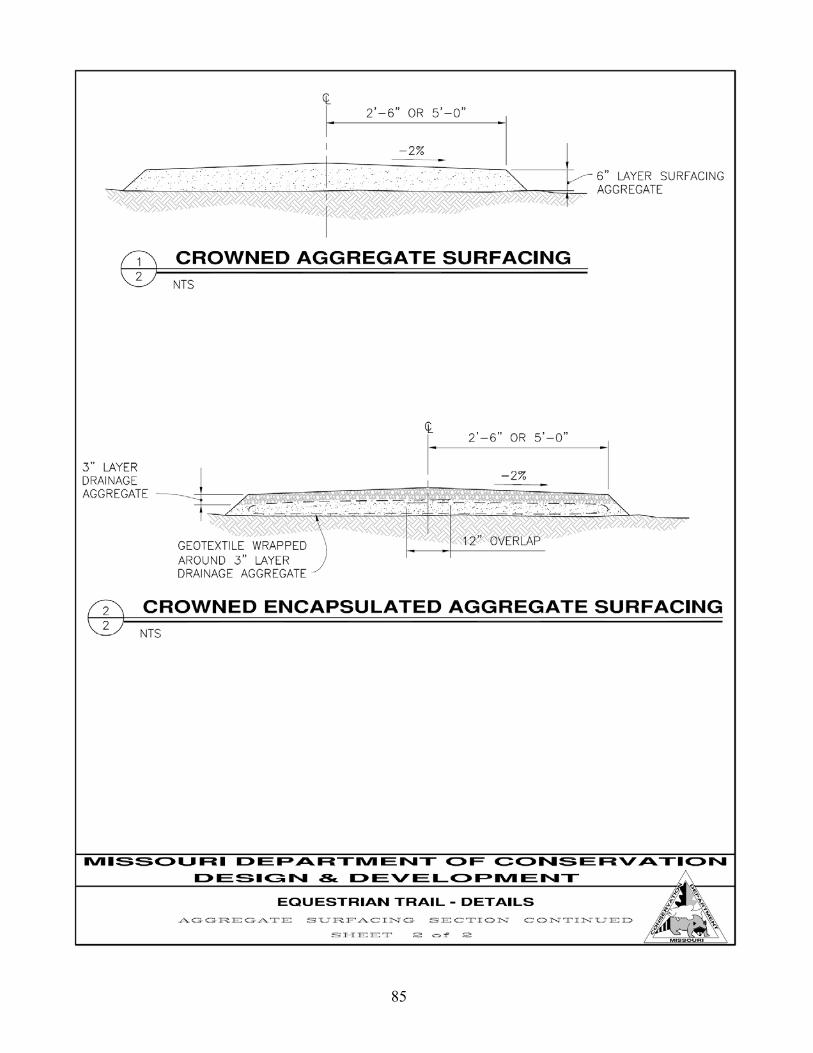
85

86

87

88

89

90

91
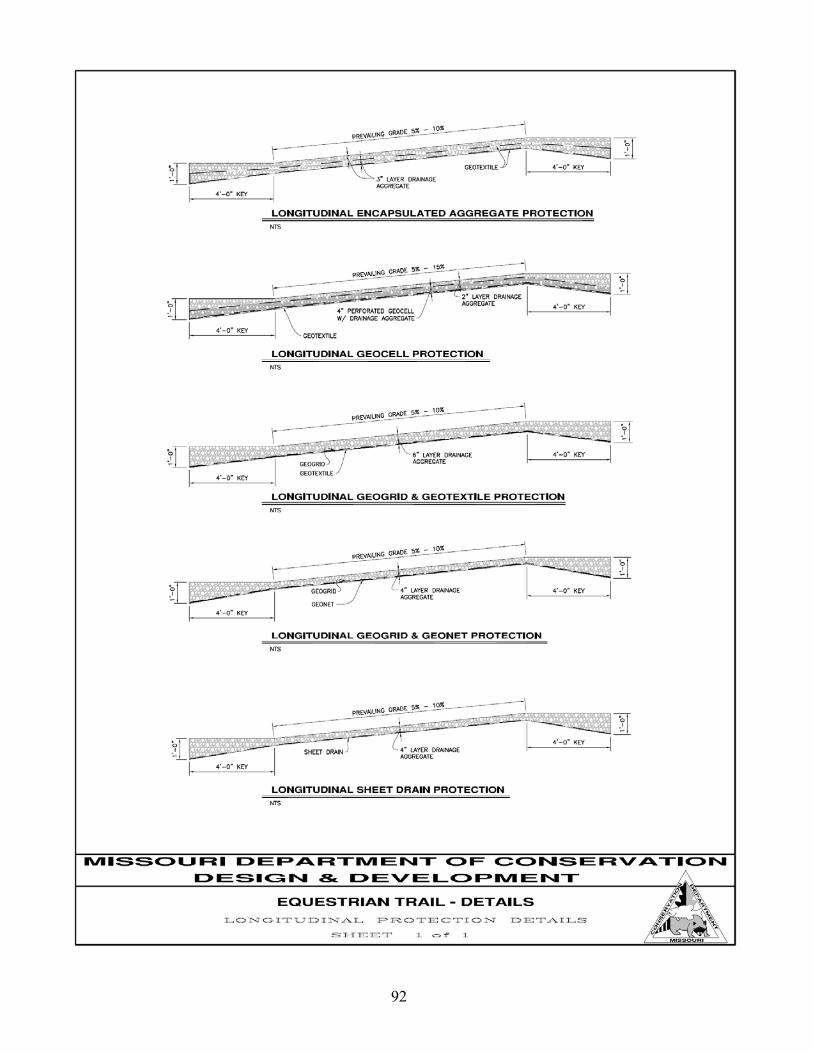
92

93
C. APPENDIX B: PRELIMINARY GUIDELINES FOR EQUESTRIAN TRAIL
MANAGEMENT.
A preliminary version of the tables and figures for the guidelines are included in this section. The guidelines include the basic thought process for the design and layout of equestrian trails.
Table C-1. Important Factors for Trail Design. Soil types and Associated Problems
Soil Type Erosion Resistance Trampling/Wearing Resistance Problems
Clay High High (when dry) Muddy and slippery when wet. High runoff potential.
Silt Low Moderate (when dry) Highly Erosive; Muddy when wet.
Loam Moderate Moderate Possibly muddy when wet. Sand Moderate Low Loose Particles can be highly erosive. Gravely Clay High High High runoff potential. Gravel Moderately High High Potential erosion with intense flows. Landscape Position Factors
Landscape Location Watershed Size Contributing Water
Potential Water Diversion Potential Ridgetop Low Low Low Shoulder Low Low Moderate
Backslope Moderate Moderate High Footslope High High Low Floodplain Very High Very High Very Low
Footslope
Backslope
ShoulderRidgetop
Floodplain
Trail Alignment Angles Factors
Alignment Angle Water Diversion Potential Erosion Potential 68-90° High Low 46-67° Moderate Moderate 23-45° Low High 0-22° Very Low Very High

94
Problem Solving Flow Chart for Old Trail Segments
Start: Measure Each Trail Segment:
-Trail Alignment -Landscape Location
-Soil Type
Is Trail Alignment less
than 68º or Slope > 15%
Can Trail be
rerouted?
Is watershed potential > moderate?
Is soil type a problem?
Reroute Trail Reference Table C-2
Choose Surface Stabilization Reference Table C-3 No
No
No
No
Yes Yes
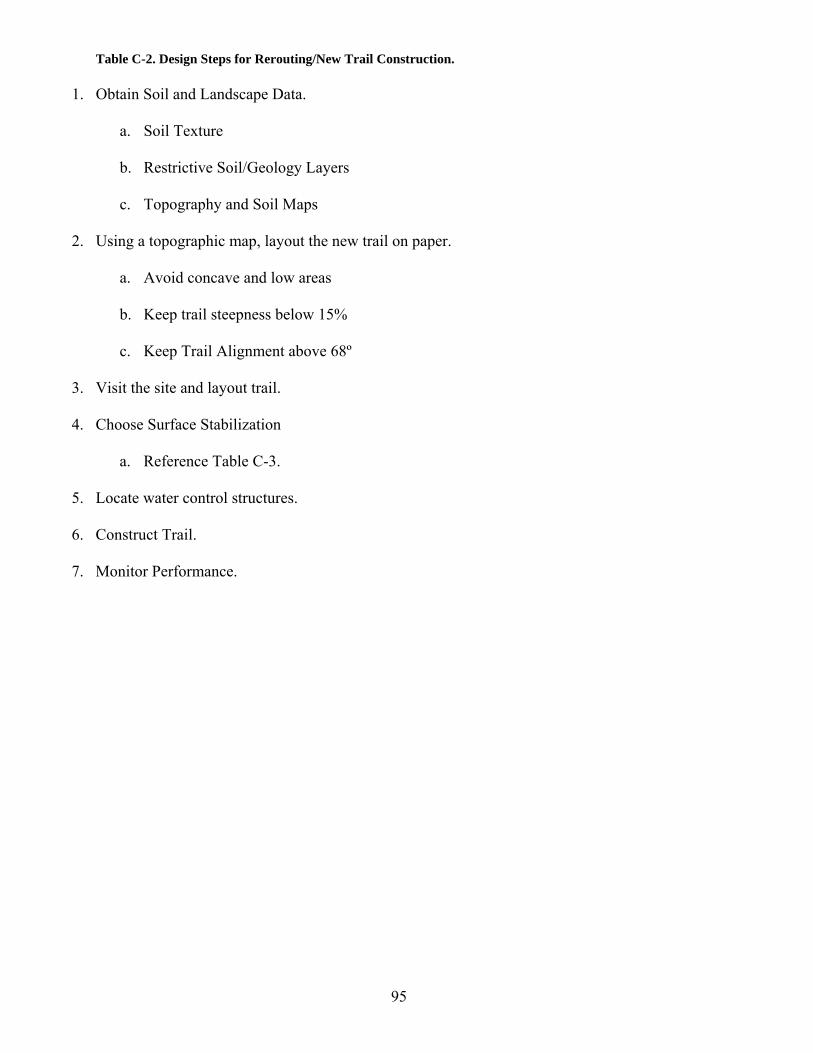
95
Table C-2. Design Steps for Rerouting/New Trail Construction.
1. Obtain Soil and Landscape Data.
a. Soil Texture
b. Restrictive Soil/Geology Layers
c. Topography and Soil Maps
2. Using a topographic map, layout the new trail on paper.
a. Avoid concave and low areas
b. Keep trail steepness below 15%
c. Keep Trail Alignment above 68º
3. Visit the site and layout trail.
4. Choose Surface Stabilization
a. Reference Table C-3.
5. Locate water control structures.
6. Construct Trail.
7. Monitor Performance.

96
Table C-3. Surface Stabilization Selection Chart. Water Potential Low Med High
x x x Silt/Sand x x x Loam x x x Clay x x x Gravel Loam
0-7%
x x x Gravelly Clay x x x Silt/Sand x x x Loam x x x Clay x x x Gravel Loam
8-15%
x x x Gravelly Clay x x x Silt/Sand x x x Loam x x x Clay x x x Gravel Loam
69-90°
Trai
l Ste
epne
ss
15-25%
x x x Gravelly Clay x x x Silt/Sand x x x Loam x x x Clay x x x Gravel Loam
0-7%
x x x Gravelly Clay x x x Silt/Sand x x x Loam x x x Clay x x x Gravel Loam
8-15%
x x x Gravelly Clay x x x Silt/Sand x x x Loam x x x Clay x x x Gravel Loam
23-68°
Trai
l Ste
epne
ss
15-25%
x x x Gravelly Clay x x x Silt/Sand x x x Loam x x x Clay x x x Gravel Loam
0-7%
x x x Gravelly Clay x x x Silt/Sand x x x Loam x x x Clay x x x Gravel Loam
8-15%
x x x Gravelly Clay x x x Silt/Sand x x x Loam x x x Clay x x x Gravel Loam
Trai
l Alig
nmen
t
0-22°
Trai
l Ste
epne
ss
15-25%
x x x Gravelly Clay
Soil
Type
None Gravel GT GC None Gravel GT GC None Gravel GT GC Solutions
None – Surface stabilization not required; requires more maintenance. Gravel – Requires least 4” of surface aggregate. GT – Gravel with Geotextile (wrapped or non-wrapped; depends on situation). GC – 4” Geocells.