Embed Size (px)
Citation preview

1
Enterprise-Wide Value Realization through IT: A Davies Story
Session 4, March 6, 2018
Dr. David Allard, CMIO, Henry Ford Health System
Geoff Patterson, VP Clinical Transformation, Henry Ford Health System
Ryan Neaves, Director of Ambulatory Applications, Novant Health

2
David Allard, MD
Has no real or apparent conflicts of interest to report.
Geoffrey Patterson
Has no real or apparent conflicts of interest to report.
Ryan Neaves
Has no real or apparent conflicts of interest to report.
Conflict of Interest

3
Agenda• Novant Health
– Creating ROI in the RCS
– Creating ROI through monitoring quality metrics
• Henry Ford Health
– Project HELIOS
– Return on Investment

4
Learning Objectives• Identify strategies to standardize non-clinical workflows
• Inform on strategies used to create value for patients and avoid rework
• Inform on strategies used to create value for patients and avoid rework

5

6
Novant Health
• Not-for-profit, integrated health system that spans communities in the Carolinas,
Virginia and Georgia
• 500 locations including 14 medical centers
• Over 1,900 medical group providers
• Over 26,000 employees and physician partners
• Nationally recognized for quality and safety measures
• Converted 28 legacy EHR systems
• HIMSS Stage 7 Ambulatory Award
• HIMSS Stage 7 Acute Award
System Overview
7
Return On Investment
RCS
Team Member
Quality Improvement

8
RCS Opportunity for ImprovementIn 2009, Revenue Cycle Services began their journey toward standardization which
ultimately ended in the selection and implementation of a single Novant Health Revenue
Cycle platform for both ambulatory and acute care services. Implementation for
ambulatory began in 2011 and implementation for acute began in third quarter of 2013.
• Cash to net collections were strong, but average days to pay were excessive
• AR days in excess of 44 days
• AR >90 days nearing 30%
• Non-standard patient collection strategy
• Inability to inform the patient, with confidence, of their out of pocket cost prior to service
• Inability to consistently collect prior to or at point of service
• Inconsistent approach to denials management resulting in a loss in net reimbursement
• Patient confusion regarding who to contact and what services they were being billed for

9
National Factors that Impact Health Outcomes

10
Maximizing the potential of the EHR system
Improve communication
Real time documentation in an encounter
Visible by both ambulatory and acute care team
members
Route notes to provider in-baskets as an FYI or for
order changes/questions
Message other care team members
Assign yourself to the care team to be notified of
patient readmissions
Reporting
Track referrals and discharge list patients
Run monthly reports tracking referrals from each
acute care department or ambulatory clinic
Monitor daily discharge lists
•Streamline the referral process
Create discharge lists using specific drivers -Novant Health PCP/contracted payor/acute care facility
Manage the work queue patients
Acute care referrals entered into the system by case management and providers partners
Referrals entered into the system by ambulatory providers
11
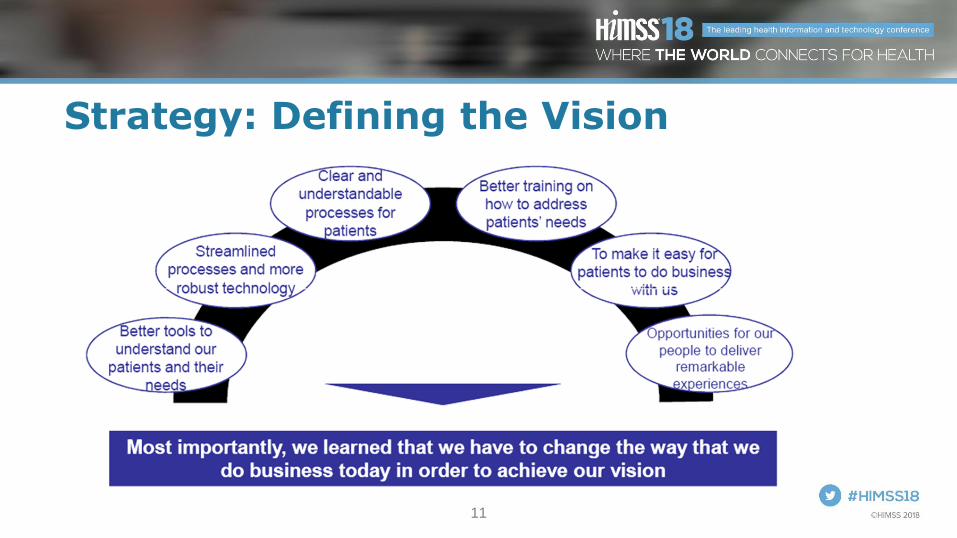
Strategy: Defining the Vision

12
Making the Experience Remarkable
• Easy for Me program
Identify repetitive patient touch points across the revenue cycle
Making revenue cycle processes easy for patients and team members
Team member engagement across all levels to maximize participation
Use technology to the best of our ability

13

14
Program-Level Roles Site Readiness Network Site-Level Roles
Program Director
Physician Champion
Engagement & Adoption
Lead
Operational VPs, VPMA
Site Readiness Owner
Revenue Cycle
representative – VP of
Revenue Cycle
Designated Application
Manager
Clinical Readiness
Owners
Revenue Cycle
Readiness Owners (as
necessary)
Site Readiness Owner
Revenue Cycle
Readiness Partner
Revenue Cycle
representatives-
Operational Directors
Site Physician Leaders
Department Directors
Site Steering
Committee
Implementatio
n Team
Revenue Cycle
Advisory Committee**New additions to the RCAC
will include the RC Readiness
Partner.
14

15
Value for Team MembersQuality % adherence with identified care gaps
– Breast
– Cervical
– Colorectal cancer screening
– Adolescent immunizations
– Pediatric immunizations
Affordability
Per member per month (PMPM) costs
ER visits/1000
Inpatient admissions/1000
30 day readmissions/1000
High modality imaging/1000
Generic drug use (% of all prescriptions)
Service/access
% in Dimensions with provider identified in PCP
field
Patient satisfaction with access
Likelihood to recommend the clinic
In-system utilization

16
Return on Investment-RCS
17
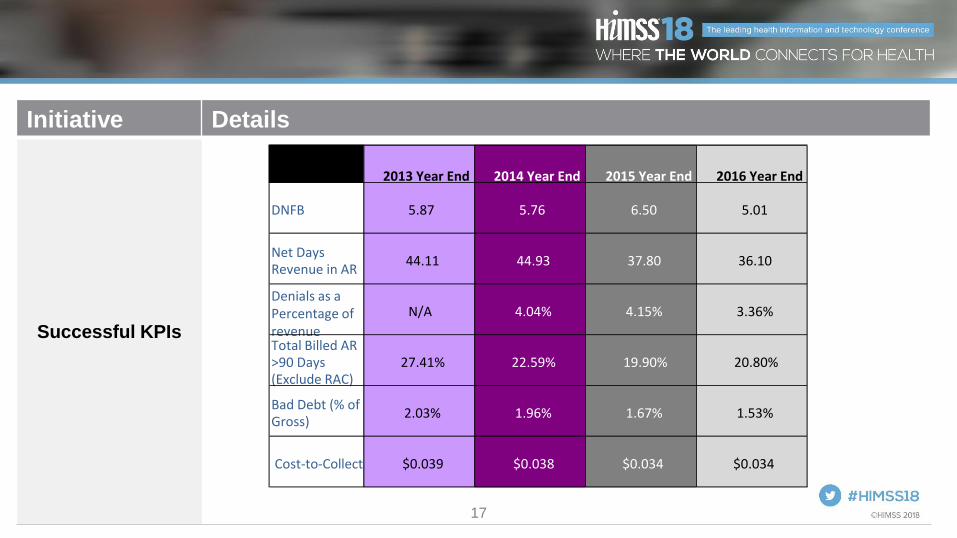
Details: Information TechnologyInitiative Details
Successful KPIs
2013 Year End 2014 Year End 2015 Year End 2016 Year End
DNFB 5.87 5.76 6.50 5.01
Net Days Revenue in AR
44.11 44.93 37.80 36.10
Denials as a Percentage of revenue
N/A 4.04% 4.15% 3.36%
Total Billed AR >90 Days (Exclude RAC)
27.41% 22.59% 19.90% 20.80%
Bad Debt (% of Gross)
2.03% 1.96% 1.67% 1.53%
Cost-to-Collect $0.039 $0.038 $0.034 $0.034

18
Outcome = 90.46% demonstrating an increase of 9% since 2015.
• Claim edits historically lived in an external claim scrubber
• Implemented claim status and WQ qualification strategy for electronic claims
• Implemented NEIC rejections within the host system to qualify for various areas of responsibility prior to claims submission via WQ
within Dimensions in an effort to improve claim acceptance percentage and move the claim validation further upstream
• These system enhancements led to our current clean claim percentage of 96% in 2017
Claim Run Date
#
ELECTRONIC
Claims in Run
ELECTRONIC
Dollar Amt
# PAPER
Claims in
Run
PAPER Dollar
Amt
# Claims
Accepted
#claims
errored in
translation
Claim
Acceptance
%
#of claims
submitted
electroincally
dollar amount of
claims submitted
electronically
January Month End 80611 713,960,294.13$ 3893 35,185,325.71$ 65726 14885 81.53% 74816 $582,753,037.20
February Month End 70070 599,045,033.39$ 3101 29,156,289.34$ 57288 12782 81.76% 69919 $558,227,698.13
March Month End 80042 674,176,715.30$ 3977 38,132,186.76$ 66279 13763 82.81% 77517 $620,628,883.98
April Month End 117078 915,847,152.20$ 5878 52,285,534.43$ 100189 16889 85.57% 112903 $809,830,269.43
May Month End 91275 694,573,880.45$ 4607 32,891,712.68$ 79232 12043 86.81% 87344 $635,170,580.49
June Month End 101077 765,078,563.00$ 5753 44,003,125.59$ 87750 13327 86.82% 99174 $675,033,861.35
July Month End 121847 908,370,040.63$ 6210 43,904,989.16$ 105758 16089 86.80% 116331 $825,661,677.33
August Month End 107846 760,717,543.60$ 6400 33,940,132.72$ 93304 14542 86.52% 105020 $711,340,905.63
September Month End 109461 823,242,394.51$ 6241 56,961,945.00$ 94417 15044 86.26% 105501 $721,101,159.27
October Month End 110344 836,360,658.25$ 5704 50,656,462.74$ 95471 14873 86.52% 105209 $716,289,838.16
November Month End 105263 800,242,022.48$ 5280 40,814,221.11$ 91500 13763 86.93% 100836 $730,504,594.37
December Month End 113926 906,465,898.01$ 5972 48,742,736.20$ 103054 10872 90.46% 110343 $786,896,754.04
Claim Edits

19
Pre Service CollectionsInitiative Details
Pre-
Service/Pt.
Access Teams
58% increase in Pre-service collections over 2015. Increase from $2.3m to $3.7m with a
reduction in staffing
The staffing reduction was driven through benefit transparency that could not be built out
within the system and readily available for our teams while speaking with the patients

20
• Obstacles
2 departments that do not interact
Two phone numbers for customer service
3 email addresses
2 chat sessions
2 In Basket pools
Cannot accept other service line payment
Highest call reasons: Make payment and balance inquiry
Customer Service• Solution
1 consolidated department
1 phone number
1 email box
1 chat session
1 In Basket pool
Dual access/dual screens
Implement IVR

21
AMB Statistics
* This is with adding coding, RCA's, Preverification and Enrollment into the RCS-- doing more for less!
Stat Pre Consolidation Current
AR Days 115 37
90+ Aging 68% 17%
Billed Providers 1023 2384
Billed Clinics 228 470
Unposted Cash $15.6m $4.1m
ADR $2.3m $5m
Est Gross Collections 51% 56.50%
Cost To Collect 8.36% *4.24%

22
Return on Investment-Team Members

23
Team members/dependents: 30 day readmission rate
0.0%
2.0%
4.0%
6.0%
8.0%
10.0%
12.0%
14.0%
16.0%
Team members/dependents: 30 day readmission rate within a Novant Health facility
Readmission trend (polynomial)

24
Cervical cancer screening rates
60%
65%
70%
75%
80%
85%
Jan-1
5
Feb
-15
Ma
r-1
5
Apr-
15
Ma
y-1
5
Jun-1
5
Jul-1
5
Aug-1
5
Sep-1
5
Oct-
15
No
v-1
5
De
c-1
5
16
-Jan
16
-Fe
b
16
-Mar
16
-Apr
16
-May
16
-Jun
16
-Jul
16
-Aug
16
-Sep
16
-Oct
16
-Nov
16
-Dec
17
-Jan
17
-Fe
b
17
-Mar
17
-Apr
17
-May
Welln
ess m
etr
ic p
erc
en
tag
e

25
Overall Value

26
Henry Ford was established a unique integrated Health system model in 1915. 4th largest employer in Metro Detroit
• 29,000 employees today, 7 Hospitals, 3 BEH, 70 Medical Centers and Ambulatory Sites, Home Health and Hospice, and Retail
• Community Services
• Health Plan
System Overview

27
Opportunity for ImprovementIn 2010, the Henry Ford Health System information system environment was a collection of
best of breed and in house developed applications that faced significant challenges:
• Care Plus Next Generation, the Henry Ford Health System in-house developed electronic
record, while cutting edge when developed had reached the end of life.
• Over 25 systems were in production where a patient could be registered and/or have a
charge generated resulted in a lack of a true electronic master patient index (eMPI).
• Regulatory challenges (ICD10, Meaningful Use, etc.) were requiring changes and enhanced
functionality that was not available in the varied systems. Significant development was
required to meet each requirements – if even possible

28
Design for Success• Launched Project HELIOS (Henry Fords Electronic Integrated Information System)
• All principles formalized in a system board sponsored, written charter at the beginning of the project
• Project Mission Statement
The Henry Ford Health System Helios initiative will transform and integrate business and clinical operations across the System. Through a standard approach and engaged workforce, Helios will align the mission, vision and values of Henry Ford.
This investment is intended to strengthen Henry Ford’s commitment to improving people’s lives through continuous improvement, commitment and innovation
• An ad-hoc subcommittee of the system board was charged with delivery. Monthly reports were provided for the 3 year project

29
Not an IT Project
• Focus not on “Go Live” but on adoption, culture change
• Key Steps for Success
– Clinical and Operationally led Initiative
– Standardization across the enterprise
– Training
– Planning for sustainment – continuous process of improvement, maintenance
– Engaged leadership and strong governance, starting with the system board of directors

30
Principles of Project Helios• A system-enabled set of business processes that reflects a seamless care experience: one patient, one record,
across the continuum and available at all times and all places to caregivers and patients.
• Highest quality, with best practices and evidence-based care (orders, clinical decision support, alerts and reminders)
• Integration of systems and data across the enterprise
• Standardized and efficient work processes across the organization (one point of data gathering with multiple points of data sharing)
• Developed as Clinical Transformation – clinically led in partnership with IT
• Designed for paperless environment with advanced data analytic capabilities (EDW)
• Patient-centered with easy entry into HFHS

31
Project Helios GoalsGoal 1 - PATIENT FOCUSED (Service Pillar)
Goal 2 - CLINICAL QUALITY AND SAFETY (Quality & Safety Pillar)
Goal 3 - INTEGRATION (Growth Pillar)
Goal 4 - STANDARDIZATION (Growth Pillar)
Goal 5 - EVIDENCE BASED CARE (Quality & Safety Pillar)
Goal 6 - FINANCIAL PERFORMANCE (Finance Pillar)
Goal 7 - COMPLIANCE (Quality & Safety and Finance Pillars)
Goal 8 – PROVIDER / EMPLOYEE SATISFACTION (People Pillar)
Goal 9 - INNOVATION (Growth Pillar)
Goal 10 - EDUCATION AND RESEARCH (Education and Research Pillars)

32
Return on InvestmentGeoff Patterson, Vice President, Clinical Transformation and IT Integration

33
Details: Information Technology• Project HELIOS had 3 components
– Epic deployment across the enterprise
– Build and deploy an Enterprise Data Warehouse
– Complete the integration of Henry Ford Macomb
• HIMSS EMR Adoption Model℠ (EMRAM) stage 6 across the enterprise
– Inpatient and Ambulatory
– Goal of HIMSS stage 7 within the next 18 months
• Most Wired status
– Including Advanced status for 2017
• Able to leverage HELIOS deployment methodology for future acquisitions (Henry Ford Allegiance Health, live in August 2017)

34
Details: Information Technology• Insourced workforce
– Insourced 650(+) consultants with a >98% retention rate
– Improved ability to rebalance based on demand
• Application consolidation
– True electronic master patient index key implemented
– Former departmental contracts moved to standard terms and conditions
– Standardized termination and migration pathways with move to Epic
– Migration of legacy applications
– Consolidated 25(+) Revenue Cycle Applications to the Epic suite
• Retired infrastructure, virtualized when possible

35
Design for Success – Operations Defines Scope
• Epic’s Core functionality (Inpatient, Revenue Cycle, Ambulatory) were scoped in automatically
• Scope and Timing task force was created to review Epic functionality, feasibility within timeline
• Committee was chaired by the Chief Quality Officer, focused on operational areas of improvement.
• “Like for like” functionality expectation
• Overall impact in favor of individual areas of functionality
• Once decisions were made – were not revisited

36
Details: Clinical / Operational• Transcription – organizational decision to minimize transcription
(~$135k/mo) in favor of electronic documentation, data sharing
• Standardization of forms, electronic distribution greatly reduced paper, postage and processing (~$100k/mo)
– HIE / Care Everywhere resulted in 8.8 Million records exchanged in 2017
– MyChart adoption with over 417,000 active accounts
• Purposeful activation, not automatically completed
– Electronic Prescribing, including schedule 2 medications
– EpicCare Link for non-HFHS Epic providers
• Pharmacy Formulary Standardization ($83k/mo)
• Improved Participation in Incentive programs
– Doubled PGIP incentives (zero opportunity for improvement)
– 98(+)% achievement of Meaningful Use Incentive opportunity

37
Details: Revenue Cycle
• Defined targeted improvement expectations for net patient revenue, days in A/R, business office expense reductions
– Leveraged our Electronic Data Warehouse (EDW) to provide visibility into bottlenecks, areas of improvement
– Leverage Epic to improve documentation, available data for workflow visibility
• Created a Central Business Office (CBO) to manage all revenue cycle for the system
– With improved reporting and visibility, able to realign staff as re-work was minimized.
• Consolidated 5 Clinical Documentation Improvement (CDI) Programs
• Post Implementation – Developed a Revenue Cycle Playbook to address productivity, revenue capture gains.

38
Details: Revenue Cycle
*2017 YTD - $31.5M over 2016 Baseline

39
Details: Revenue Cycle
2017 Revenue Cycle Playbook Banner Goals
- Hospital Billing Days in AR (43)
- Professional Billing Days in AR (34)
- Initial Denial Rate (8%)
- Denial Write Off Rate (1%)
$3.39
$15.91
$5.62
$8.76
$11.90
$- $2.00 $4.00 $6.00 $8.00
$10.00 $12.00 $14.00 $16.00 $18.00
Revenue Cycle Playbook 2017 Performance to Goal
($ in Millions)
2017 Goal 2017 Annualized (through July)
40
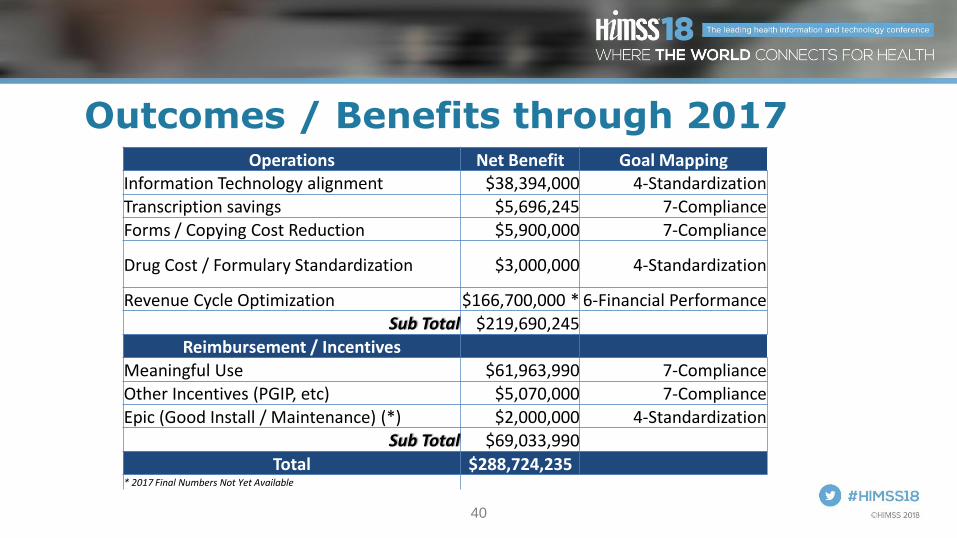
Outcomes / Benefits through 2017Operations Net Benefit Goal Mapping
Information Technology alignment $38,394,000 4-Standardization
Transcription savings $5,696,245 7-Compliance
Forms / Copying Cost Reduction $5,900,000 7-Compliance
Drug Cost / Formulary Standardization $3,000,000 4-Standardization
Revenue Cycle Optimization $166,700,000 * 6-Financial Performance
Sub Total $219,690,245
Reimbursement / Incentives
Meaningful Use $61,963,990 7-Compliance
Other Incentives (PGIP, etc) $5,070,000 7-Compliance
Epic (Good Install / Maintenance) (*) $2,000,000 4-Standardization
Sub Total $69,033,990
Total $288,724,235 * 2017 Final Numbers Not Yet Available

41
Questions
• Ryan Neaves, [email protected]
• Geoff Patterson, [email protected]
• David Allard, [email protected]