Embed Size (px)
Citation preview
Enterprise-Wide BI Platform Deployments
Authors: Andreas Bitterer, Carsten Bange, Christian Fuchs, Patrick Keller, Larissa Seidler
Publication: 19 May 2015
Abstract
This BARC document is the inaugural version of our new vendor evaluation and ranking methodology, named Score. We selected the business intelligence platform market for the premiere. Based on countless data points from The BI Survey and many analyst interactions, vendors are rated on a variety of criteria, from product capabilities and architecture to sales and marketing strategy, financial performance and customer feedback.
This document is not to be shared, distributed or reproduced in any way without prior permission of BARC

Business Intelligence Score 2015 Page 2
Table of contents
Overview ............................................................................................................................................. 3
Inclusion Criteria ................................................................................................................................. 3
Evaluation Criteria .............................................................................................................................. 4
Portfolio Capabilities ....................................................................................................................... 4
Market Execution ............................................................................................................................ 6
Score .................................................................................................................................................. 8
Score Regions ................................................................................................................................ 9
Evaluated Products .......................................................................................................................... 10
Vendor Evaluations .......................................................................................................................... 12
Actuate (OpenText) ....................................................................................................................... 12
arcplan .......................................................................................................................................... 13
Birst ............................................................................................................................................... 14
Board ............................................................................................................................................. 15
GoodData ...................................................................................................................................... 16
IBM ................................................................................................................................................ 17
Infor ............................................................................................................................................... 18
Information Builders ...................................................................................................................... 19
Logi Analytics ................................................................................................................................ 20
Microsoft ........................................................................................................................................ 21
MicroStrategy ................................................................................................................................ 22
Oracle ............................................................................................................................................ 23
Pentaho (Hitachi Data Systems) ................................................................................................... 24
Prognoz ......................................................................................................................................... 25
Qlik ................................................................................................................................................ 26
SAP ............................................................................................................................................... 27
SAS ............................................................................................................................................... 28
Tableau ......................................................................................................................................... 29
Targit ............................................................................................................................................. 30
Tibco ............................................................................................................................................. 31
Yellowfin ........................................................................................................................................ 32
Other Vendors .................................................................................................................................. 33
Related Research Documents ......................................................................................................... 38

Business Intelligence Score 2015 Page 3
Overview
The market for BI tools is highly competitive, with some large international incumbents, many successful vendors with a track record spanning decades, and countless smaller specialists that approach BI challenges from a niche perspective. This report analyzes the strengths and challenges of all of the leading vendors in the business intelligence market as well as many smaller vendors that often have less visibility, but equally offer outstanding value to their customers.
Business intelligence initiatives always include more than just the front end tools. The technical architecture also includes data warehouses and data marts, data integration and data quality components, dictionaries, repositories, and many other technologies. More importantly, organizations should have a proper BI strategy that goes well beyond an architecture blueprint to include non-technical requirements, alignment with the corporate strategy, organizational models, outcome-based priority settings, and a proper roadmap.
Still, when it comes to kicking off or expanding a business intelligence program, the initial focus lies almost always on the required toolsets. While this may not be the ideal starting point, at some stage a platform or product decision has to be made. This document will help with the selection process by evaluating the most commonly used product sets from the major vendor community.
Inclusion Criteria
There are two separate inclusion criteria for this BI Score: the first is associated with a vendor’s products and the other is linked to the financial results relating to those products. To be evaluated in this Business Intelligence Score, a vendor has to supply four out of five technologies from the following platform portfolio:
Formatted Reporting
Dashboarding
Ad-hoc Query and Reporting
Analysis
Data Mining
In addition, the vendor has to generate a minimum of 15 million EUR in license revenue per year with the above product set, spread across at least two separate geographies. As individual geographies we consider:
Europe, Middle East and Africa
North America
Latin America
Asia/Pacific
Vendors with an open source business model are evaluated by their total revenue because those companies do not charge a license for their products, but an annual subscription fee.

Business Intelligence Score 2015 Page 4
Evaluation Criteria
Every vendor is evaluated on two dimensions, Portfolio Capabilities and Market Execution, each representing one axis on the Score and representing the following sub-criteria.
Portfolio Capabilities
The portfolio capabilities criteria selected to rank the business intelligence vendors in this Score include the following technologies and their corresponding weighting.
Formatted Reporting
Formatted standard reports are usually page-oriented reports run on regular schedules. These include static reports, which usually appeal to the widest audience in a company because they are simple to use, and prompted reports, which enable users to filter reports based on predefined parameters. Aside from pixel-perfect displays which provide developers with precise control over how they place report objects and images on a screen, formatted reports also support rich printing options, dynamic page sizing and a WYSIWYG (i.e. what you see is what you get) development interface.
Virtually every BI product is able to provide some type of reports. The importance of page orientation, scheduling and other advanced reporting features, however, varies depending on the customer’s requirements.
Dashboarding
Dashboards are also referred to as cockpits, scorecards or BI applications. They provide graphical views of key performance indicators and the ability to drill down to details. Some dashboards offer self-service functions so that end users can create their own layouts without any outside help. Others (especially BI applications with guided navigation) require support from technically savvy business users or programmers. Scorecards often incorporate strategy maps and applications to manage improvement initiatives.
Ad-Hoc Query and Reporting
In many cases, users require more interactivity than they receive from formatted reports. Ad-hoc reporting tools are geared to non-professional report developers and provide basic filtering and navigation features (e.g., drill down, ranking and conditional formatting).
Analysis
Data analysis solutions differ from basic reporting tools in that they are able to probe much more deeply into operational data and generate new information which can be understood and actioned upon by the business. Further analyses can be carried out using mathematical methods. Traditional online analytical processing (OLAP) tools provide dimensional (versus reporting) data views which make it easy for users to drill down, drill across and pivot dimensions as well as apply sophisticated calculations without scripting. Certain analysis tools also offer methods to support set-based, visual or discovery-oriented data analysis.

Business Intelligence Score 2015 Page 5
Data Mining
Data mining represents non-directed, hypothesis-free data analysis. Various algorithms scan the database searching for patterns used for a segmentation, classification or association of data. The methods cover statistical data analysis, neural networks, decision trees, time series and many other algorithms. Users have to be well trained in order to use these methods and to gain the expected insights. Data mining tools often contain data integration and analysis process support functionality.
Architecture
The overall architecture of each vendor’s product portfolio is also evaluated. This includes the integration of the various components, from the perspective of the front end and user experience as well as at the infrastructure levels, including data access, models and metadata. In addition, the support for different platforms as well as the overall solution performance and caching mechanisms are considered in this evaluation.
Product Satisfaction
The results from The BI Survey’s product satisfaction ratings are also included in this BI Score. The ratings of vendors that provide more than a single product are combined into a single rating.
Criteria Weighting
We don’t consider all components of a BI portfolio equally important in this Score. This is not a reference to the generated value of an individual technology, but indicates the current customer focus and buying pattern.
Criteria Weighting
Dashboarding High
Ad-Hoc Query High
Architecture High
Product Satisfaction High
Analysis Medium
Reporting Low
Data Mining Low
Figure 1: Portfolio Capabilities - Weighting of Criteria

Business Intelligence Score 2015 Page 6
Market Execution
On the market execution axis, we rate the business intelligence vendors in this Score using the following criteria and their corresponding weighting.
Product Strategy
This is the most important of all the criteria. Vendors are rated on their product development track record, product roadmap and innovation, as well as the company portfolio’s alignment with current market trends and demands.
Sales Strategy
To rate a vendor’s sales strategy, we look at the various channels through which the company goes to market: with both direct and indirect sales teams, through distributors, value-added resellers (VARs), online channels as well as OEM relationships. We also evaluate the vendor’s product pricing and the various sales models, such as perpetual licensing, support subscription, open source, or freemium.
Marketing Strategy
A vendor’s marketing strategy is evaluated by rating its corporate and product messaging, the company’s presence in printed media, advertising and social networks, as well as its ability to run events, such as conferences, seminar roadshows and webinars.
Organizational Strength
Vendors are rated in their organizational stability, which is influenced by consistency of corporate strategy, continuity of executive leadership, but also staff turnover, reorganization and layoffs.
Financials
This criterion covers the financial position of the vendor, from market capitalization, cash position and EBITDA to profitability, burn rate and investment rounds. For vendors that are private companies or don’t break out the numbers for individual product lines, estimated figures are used.
Geographical Coverage
Vendors are evaluated on their global presence. We look at the various geographic regions and major countries in which the company conducts business with both a sales and marketing presence as well as development and support functions.
Vertical Solutions
While being a low-weighted criterion, we also look at a vendor’s solution portfolio for vertical BI applications (for example, retail, insurance or manufacturing industries).
Ecosystem
In this category, we evaluate the extended ecosystem in which the vendor participates. This includes business partner networks, hardware or cloud infrastructure providers, consulting firms and system integrators, and other technology alliances.
Customer Support
Similar to the product satisfaction score above, vendors are also rated by their customer support score from The BI Survey. This generally takes into account accessibility and quality of the support staff, time-to-resolution scores, and the overall satisfaction with the vendor’s service and support processes.

Business Intelligence Score 2015 Page 7
The following weightings have been applied for the market execution criteria:
Criteria Weighting
Product Strategy High
Customer Support High
Sales Strategy Medium
Financials Medium
Ecosystem Medium
Marketing Strategy Low
Organizational Strength Low
Geographical Coverage Low
Vertical Solutions Low
Figure 2: Market Execution - Weighting of Criteria

Business Intelligence Score 2015 Page 8
Score
Calculating the individual ratings for all criteria and all vendors produces two scores per company: the portfolio capabilities score and the market execution score, each being plotted on the corresponding axis and thus resulting in the vendor’s dot on the following BI Score graphic (Figure 3).
Figure 3: BI Score 2015 – Enterprise Wide BI Platform Deployments
Enterprise-Wide BI Pla orm Deployments
© BARC 2015
Enterprise-Wide BI Pla orm Deployments

Business Intelligence Score 2015 Page 9
Score Regions
Vendors can be positioned in one of five regions, depending on their total score on each of the two axes.
Market Leaders
Market leaders are vendors that drive both technology and market adoption in a highly influential manner. They possess both a broad portfolio of market-leading products with a strong brand as well as a robust commercial prowess through best-in-class sales and marketing programs, an extensive ecosystem of business partners and alliances, and a rock-solid financial position. Market leaders are considered a contender in virtually every planned implementation.
Trendsetters
Trendsetters are well established vendors that drive strong market adoption, supported by technology innovation and strategic acquisitions and by leveraging robust account management and a solid track record. Their portfolio enjoys high brand awareness in the market, covers an extensive range of technologies and services with only few gaps. Trendsetters typically have a large market share, making them a viable contender in almost all implementation scenarios.
Challengers
Challengers come in various shapes and sizes. They can be large vendors tapping into a new market by acquisition and pushing their way in with force, small innovative companies with a promising portfolio but limited sales and marketing resources, or vendors that attempt to disrupt a market with a new technology approach or different business model.
Specialists
Specialists are smaller vendors with a portfolio focused on a specific market segment. Vendors can be either limited in their technical capabilities by concentrating on certain features and functions, or the company isn’t a global enterprise and focuses on select geographic regions.
Entrants
Entrants are usually startups that have limited reach and visibility in the market. Their product capabilities are incomplete when compared to the respective competition, and the vendor’s long-term market potential is still unproven.

Business Intelligence Score 2015 Page 10
Evaluated Products
The following products and versions are evaluated in this BI Score.
Vendor Product(s) Version
Actuate (OpenText) BIRT iHub, BIRT Designer
BIRT Analytics
3.1
5.0
Arcplan Arcplan Enterprise 8
Birst BIRST 5.16
Board International Board 9
GoodData Open Analytics Platform 2015
IBM
Cognos BI
Cognos TM1
Watson Analytics
SPSS
10.2.2
10.2
1.0
22
Infor Infor BI 10.5
Information Builders WebFOCUS
InfoDiscovery
8.2
1.0
Logi Analytics
Logi Info
Logi Vision
Logi Ad-hoc
11.4
Microsoft
SQL Server
SharePoint
Office
Power BI
March 2015

Business Intelligence Score 2015 Page 11
Vendor Product(s) Version
MicroStrategy Analytics Platform 9s
Oracle
BI Foundation Suite
Advanced Analytics
Endeca Information Discovery
11
12c
3.1
Pentaho (Hitachi Data Systems) Business Analytics 5.3
Prognoz Prognoz Platform 8
Qlik
QlikView
Qlik Sense
QlikView NPrinting
11.2
1.0
16
SAP BusinessObjects BI Platform
Predictive Analytics
4.1
2.0
SAS Enterprise BI Server
Visual Analytics
9.4
7.1
Tableau Tableau Desktop and Tableau Server 8.2
Targit Targit Decision Platform 2014
Tibco Analytics Jaspersoft
Spotfire Platform
6
7
Yellowfin Yellowfin 7.1

Business Intelligence Score 2015 Page 12
Vendor Evaluations
In the following section, we discuss each vendor on the BI Score and highlight their strengths and weaknesses based on customer surveys and market research by the authors.
Actuate (OpenText)
San Mateo, CA, USA
www.actuate.com
Actuate is one of the earliest providers of business intelligence software. The company was founded in 1993 and is based in San Mateo, California, with about 600 employees worldwide. In January 2015, Actuate was acquired by OpenText, a global provider of Enterprise Information Management (EIM) especially known for its Enterprise Content Management (ECM) and Business Process Management (BPM) solutions.
Actuate launched the open source BIRT (Business Intelligence and Reporting Tool) project in 2004. Today the company offers a business intelligence platform called iHub which is available as an open source and a commercial version. iHub includes both developer (BIRT Designer) and different user-oriented interfaces. In 2012, Actuate acquired Quiterian for its business-user-oriented predictive analytics solution. Today the product is offered as BIRT Analytics.
BIRT iHub is a frontend which connects to different data sources and consists of different modules for formatted reporting, ad-hoc reporting, dashboarding and analysis. Development of applications and reports as well as access to data sources takes place in BIRT Designer. End users work with the web-based modules BIRT Interactive Viewer and BIRT Studio for ad-hoc reporting and simple data navigation, BIRT Data Analyzer for OLAP analysis and BIRT 360 for dashboarding.
BIRT Analytics is a combination of in-memory and columnar-based data storage with a web-based front end for visual data mining and predictive analysis. Data required for data mining and analysis is integrated using a built-in ETL module. The solution is focused on data scientists from business departments and offers different predefined data mining algorithms and analysis methods such as forecasting, clustering, venn diagrams, pivot tables, bubble charts and so on.
Strengths
Good capabilities for developing pixel-perfect reports in both open source and commercial versions
Ad-hoc reporting and data navigation suitable for business users
BIRT Analytics as a business user oriented solution for data mining and predictive analysis
Set of APIs for individual development and product integration
Weaknesses
Limited OLAP analysis capabilities in BIRT Analyzer
BIRT Analytics is not fully integrated into the rest of the portfolio
BIRT Analytics is limited to pre-defined analysis and data mining methods; no integration of programming languages for data mining such as R or SAS
Pre-definition of report structures and data through IT or a technically savvy user is required using BIRT Designer, to be used by business people in BIRT Studio

Business Intelligence Score 2015 Page 13
arcplan
Düsseldorf, Germany
www.arcplan.com
arcplan Enterprise – the vendor’s flagship product - offers a flexible, visual development environment for building individual BI applications for dashboards, reporting, analysis and planning. In BARC’s view arcplan is one of the most flexible tools on the market for custom-building a range of tailor-made BI applications with individual screen layouts using responsive design, enabling those applications to be deployed on the web or mobile devices. While many BI vendors focus on a small handful of data sources, arcplan provides connectivity to over 25 relational and multidimensional data sources, catering for all the major databases. Indeed, The BI Survey finds arcplan to be the most popular third-party frontend tool for Oracle Essbase, IBM Cognos TM1 and SAP BW. In 2014, arcplan augmented its support for SAP data sources when it gained SAP certification for its integration with HANA via MDX. In the same year, arcplan had its product Hichert IBCS-certified, which requires a consistent and transparent presentation of data.
According to The BI Survey results, arcplan has a mature, stable product delivering good query performance. Because arcplan does not have its own database management system, and is instead offering a variety of connectors to many popular relational and multidimensional databases, performance also depends to some degree on the choice and configuration of the underlying data source.
In March 2015, arcplan announced its acquisition by Marlin Equity Partners, to merge with Longview Solutions, a Canadian CPM and tax solution specialist to form a global CPM solution provider with a complementary product portfolio.
Strengths
High flexibility for building individual, tailor-made BI applications for dashboarding, analysis or reporting use cases. The solution provides integrated functions for reporting books and e-mail distribution.
Large number of supported data sources that can be combined in applications as desired
arcplan Spotlight as a web-based MDX client for OLAP analysis, working alongside arcplan Engage, an application sharing and collaboration platform environment
BI Wall module offers functionality for assembling application objects to individual dashboards through business users (“Self-service dashboard creation”)
Weaknesses
High flexibility making application handling complex, especially during initial design and implementation phase of complex BI scenarios
Developing BI applications requires technical knowledge and is only suitable for trained business users
Limited analysis and ad-hoc query capabilities, as arcplan Spotlight supports only multi-dimensional data sources such as Microsoft SQL Server Analysis Services, Oracle Essbase or SAP BW, and is not seamlessly integrated with Application Designer
Limited support for advanced analysis and data mining beyond the integration of R libraries

Business Intelligence Score 2015 Page 14
Birst
San Francisco, CA, USA
www.birst.com
BIRST, founded by several Siebel Analytics veterans, offers a cloud-based BI platform for formatted and ad-hoc reporting, dashboards and analysis. BIRST aims to provide an enterprise-ready, business-user-oriented and visually appealing BI platform.
BIRST uses a two-tier architecture in its multi-tenant platform and supports a variety of on-premise and cloud-based data sources. The platform offers modeling capabilities to create an individual semantic layer which allows connecting to data via Live Access or pulling data from original data sources into BIRST’s cloud platform.
On the front end layer BIRST provides several modules to support different BI tasks. Designer is used by technically savvy business users to create pixel-perfect formatted reports. Business users use the Dashboards module to create individual dashboards. Visualizer is an interactive module for ad-hoc reporting, query and analysis, targeted at business users.
Strengths
Cloud-based BI platform for formatted and ad-hoc reporting, dashboarding and analysis
Supports access to a wide variety of on-premise and cloud-based data sources, such as relational databases, Salesforce.com, Marketo and Hadoop.
Support of SAP HANA Cloud Platform and cooperation with Tableau for data discovery
Weaknesses
Typical self-service BI tasks in the data integration such as integrating local data sources, data blending and modeling must be done by technical users in the semantic layer
Limited built-in capabilities for advanced analysis and data mining. Functionality provided only through the integration of open source analytics engine, Weka, or R integration
Business Intelligence Score 2015 Page 15
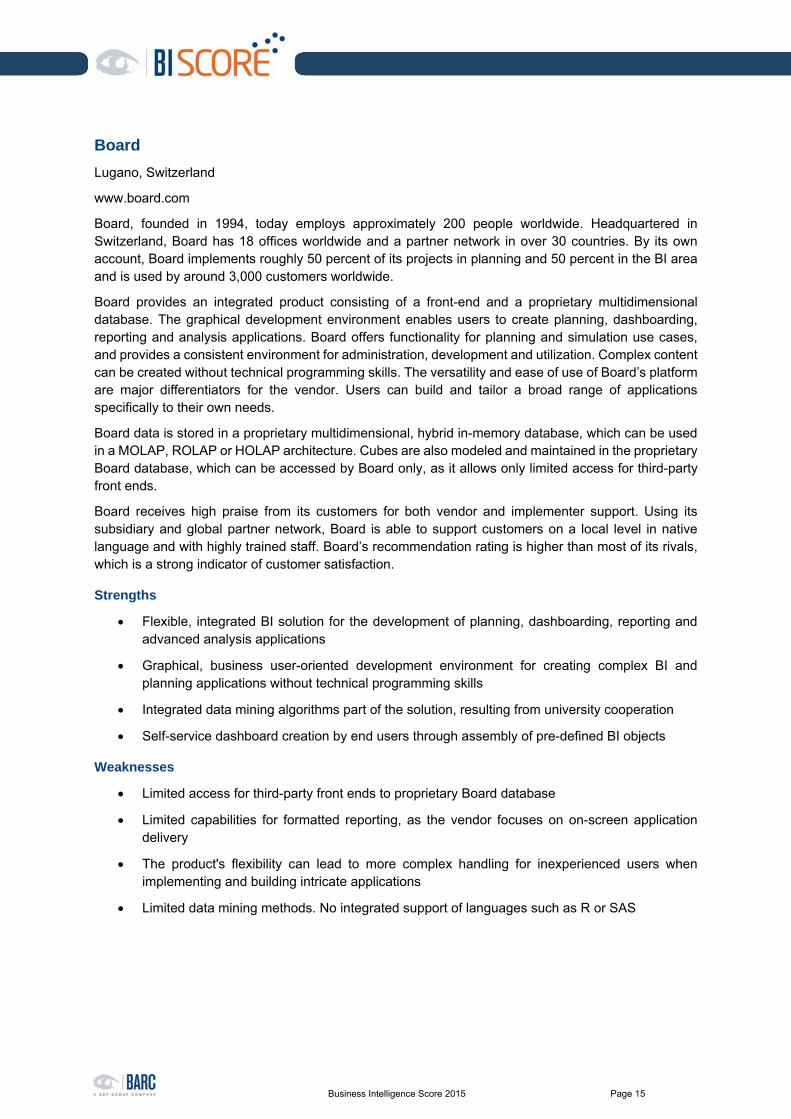
Board
Lugano, Switzerland
www.board.com
Board, founded in 1994, today employs approximately 200 people worldwide. Headquartered in Switzerland, Board has 18 offices worldwide and a partner network in over 30 countries. By its own account, Board implements roughly 50 percent of its projects in planning and 50 percent in the BI area and is used by around 3,000 customers worldwide.
Board provides an integrated product consisting of a front-end and a proprietary multidimensional database. The graphical development environment enables users to create planning, dashboarding, reporting and analysis applications. Board offers functionality for planning and simulation use cases, and provides a consistent environment for administration, development and utilization. Complex content can be created without technical programming skills. The versatility and ease of use of Board’s platform are major differentiators for the vendor. Users can build and tailor a broad range of applications specifically to their own needs.
Board data is stored in a proprietary multidimensional, hybrid in-memory database, which can be used in a MOLAP, ROLAP or HOLAP architecture. Cubes are also modeled and maintained in the proprietary Board database, which can be accessed by Board only, as it allows only limited access for third-party front ends.
Board receives high praise from its customers for both vendor and implementer support. Using its subsidiary and global partner network, Board is able to support customers on a local level in native language and with highly trained staff. Board’s recommendation rating is higher than most of its rivals, which is a strong indicator of customer satisfaction.
Strengths
Flexible, integrated BI solution for the development of planning, dashboarding, reporting and advanced analysis applications
Graphical, business user-oriented development environment for creating complex BI and planning applications without technical programming skills
Integrated data mining algorithms part of the solution, resulting from university cooperation
Self-service dashboard creation by end users through assembly of pre-defined BI objects
Weaknesses
Limited access for third-party front ends to proprietary Board database
Limited capabilities for formatted reporting, as the vendor focuses on on-screen application delivery
The product's flexibility can lead to more complex handling for inexperienced users when implementing and building intricate applications
Limited data mining methods. No integrated support of languages such as R or SAS

Business Intelligence Score 2015 Page 16
GoodData
San Francisco, CA, USA
www.gooddata.com
GoodData is one of the cloud BI pioneers in the market, providing a multi-tenant SaaS analytic platform that includes a fast Vertica-based data warehouse infrastructure, a data integration layer that connects to a broad range of data sources and cloud applications, and various front-end capabilities such as dashboards, integration of R algorithms, and special industry solutions.
With its new “Insights as a service” positioning, GoodData attempts to break free from the traditional view of BI that revolves around reporting, analysis and ad-hoc query. Often used as an analytic extension of other cloud-based applications, such as online help desk, customer relationship management or payroll, the vendor has a few subscribers with very large user bases, mostly in North America, but GoodData also reports getting traction in Brazil. The platform offers connectivity to widely-used cloud applications and data sources such as Salesforce.com, Workday and Twitter.
GoodData announced new visualization and discovery extensions to its platform in April 2015, namely Data Explorer and Analytic Designer, as well as collaboration features with email and group sharing. The vendor comes to market relatively late with these capabilities.
Strengths
Intuitive user experience for the business user, high performing analysis platform through column-store data warehouse under the covers
Well integrated and embedded into a variety of host applications from different industries and use cases. One of the most used OEM players in this round-up.
As a cloud-based platform with a good connectivity layer, well positioned to analyze social media and other SaaS applications.
Weaknesses
GoodData has very little visibility outside the Americas and does not actively market to geographies such as Europe or Asia.
The nature of the GoodData BI applications does not cater to the typical data scientist, but the vendor provides accelerators for common use cases around sales, marketing, and social analytics.
GoodData is not part of a larger ecosystem with system integrators and consulting firms positioning the vendor in new accounts

Business Intelligence Score 2015 Page 17
IBM
Armonk, NY, USA
www.ibm.com
As one of the world’s largest vendors of IT hardware, software and services, IBM offers a comprehensive portfolio of business intelligence and performance management solutions. For this BI Score, we evaluated the IBM Cognos BI and TM1 products, IBM Watson Analytics and the SPSS portfolio.
IBM Cognos BI can be characterized as a suite containing functions for many different categories of BI applications including dashboards, formatted reporting, ad-hoc reporting and OLAP analysis in web-based and integrated modules. The suite is typically used in larger scenarios supporting the needs of many concurrent users as well as large data volumes.
Although users can conduct classical OLAP analyses in IBM Cognos BI, its functionality for visual or advanced analytics is relatively weak compared to other products on the market. This is where IBM SPSS is positioned. However, the integration of the SPSS data mining solution into IBM Cognos BI is still ongoing.
IBM Cognos TM1, which has been on the market since the early 1980s, is essentially a high-performance, multidimensional in-memory database for planning and analysis. TM1 is targeted to power users who build individual planning and analysis applications based on the in-memory database. The solution uses Excel as its main front end and offers capabilities for publishing content on the Web.
IBM Watson Analytics is a new cloud-based product focused on search-oriented visual and predictive data analysis. This solution is targeted towards business users and offers encapsulated cognitive capabilities.
IBM SPSS is a package for data mining and advanced analysis which consists of different components. It is geared towards data scientists or users with statistical knowledge and is well-known on the market. SPSS offers good support for creation, test and deployment of individual data mining models.
Strengths
Extensive product offering for formatted and ad-hoc reporting, analysis, dashboarding, and planning
Broad capabilities for data mining and advanced analysis: creation and deployment of individual models as well as business-user-oriented encapsulated capabilities available; innovation leader with IBM Watson Analytics
Various options for ad-hoc and OLAP analysis and query in the portfolio with IBM Cognos BI Workspace Advanced and IBM Cognos TM1
Well established and expansive partner community with worldwide product support and knowledge
Weaknesses
Limited integration between the product families IBM Cognos BI, IBM Cognos TM1, IBM SPSS and IBM Watson Analytics
Potentially confusing mobile BI strategy due to multiple products in the portfolio, IBM Cognos Mobile, IBM TM1 Mobile Contributor and IBM Concert Mobile
With Watson Analytics being IBM’s strategic data discovery offering, there is limited traction of personal analytics solutions Cognos Insight and its AnalyticsZone community

Business Intelligence Score 2015 Page 18
Infor
New York, NY, USA
www.infor.com
Infor is a global provider of ERP, CRM, BI, SCM and other business software solutions. The company was founded in 2002, has 153 offices in 41 countries and supports over 70,000 customers in 194 countries.
Infor BI is an integrated application suite for dashboards, reporting, analysis, planning and forecasting with proprietary multidimensional data storage. The suite contains the components Infor BI Application Studio, for building Web-based BI applications, Infor BI Office Plus, an add-in for Excel, Word and PowerPoint, Infor BI Dashboards, for building and administering dashboards for the Web and mobile devices, Infor BI OLAP Server and Infor BI Designer, for modeling OLAP cubes. Infor BI Application Studio is a flexible application development tool, enabling users to create a wide range of BI applications. Predefined BI and performance management applications are also available for various business functions and industries with Infor Dynamic Enterprise Performance Management (Infor d/EPM), including strategy management, budgeting, planning and financial consolidation.
All components use the Infor BI OLAP Server, which stores data in multidimensional structures. Infor requires a relational database, most often Microsoft SQL Server or Oracle, for storing the repository that is, users, roles, and reports from Application Studio and Office Plus. Both Application Studio and Office Plus can also access Microsoft SQL Server Analysis Services, SAP BW and Exasol as well as relational databases through ODBC. Through a meta layer named DataLinks, Infor has improved access to other relational databases and the platform also supports access to Amazon Redshift.
Through OEM partnerships with Cubeware, Bissantz and IBM Cognos, Infor provides additional functions such as data integration, advanced analytics and production reporting.
Strengths
Integrated application suite for dashboards, reporting, analysis, planning and forecasting with proprietary multidimensional data storage
Flexible, web-based BI applications that can be built by tech-savvy business power users
Strong functional capabilities for ad-hoc analysis and planning integrated in Microsoft Excel
Good mobile BI offering including dashboard creation capabilities
Predefined BI and performance management applications with Infor d/EPM
Weaknesses
Limited integration of Infor BI Application Studio and Office Plus
Flip-side of high flexibility leads to complex development when implementing intricate Infor BI applications
No positioning in trending market areas such as self-service BI, visual analysis or predictive analytics
Data mining and advanced analysis is covered by partner solutions

Business Intelligence Score 2015 Page 19
Information Builders
New York, NY, USA
www.informationbuilders.com
Information Builders is a privately held company, founded in 1975 and with more than 60 offices worldwide. The vendor’s flagship BI offering, WebFOCUS, was introduced in 1997. Information Builders also provides the iWay product line, which is often used alongside WebFOCUS for data integration and data quality functionality.
Information Builders has consistently been a leading vendor for handling large data and user volumes and requiring the fewest administrator resources. With WebFOCUS, BI applications can be centrally administered and published to a large group of recipients both inside and outside of the firewall.
The WebFOCUS Suite is a web-based BI environment that supports formatted reporting, ad-hoc reporting, dashboards and analysis, a custom application development environment, including front ends and decision support tools. With WebFOCUS, BI applications can be centrally administered and published to a large group of recipients. While customers cite the relative complexity of WebFOCUS, an enterprise-centric system, the vendor has been concentrating on developing interfaces that are easier to use and configure by business decision-makers. The solution now incorporates web-based tools, such as InfoAssist for ad-hoc and OLAP analysis, BI portal designer for designing and managing group portals, dashboards and content management, InfoDiscovery, a self-service data discovery tool for business users, and interactive InfoApps for the mass user (operational employees, partners, suppliers and customers).
Another strength in WebFOCUS is its inherent support for operational BI – in which insights are derived from data coming directly out of production systems. The company’s original FOCUS products were designed to capture and provide analysis of data coming directly out of mainframe and AS/400-class systems. These capabilities have been extended across enterprises to enable analysis across any and all new systems that are engaged, including today’s cloud-based infrastructures.
Strengths
Very flexible and scalable solution for formatted reporting for large user groups and highly-formatted documents, ad-hoc reporting, dashboarding, analysis and creation of individual BI applications
Uniquely wide range of data sources
InfoDiscovery, a data discovery tool, offers easy to use facilities for business users
InfoAssist, focused on ad-hoc reporting and query for business users, provides good capabilities for content export in different formats
InfoApps and capabilities for development of pre-defined interactive applications for business users (operational and strategic/tactical BI)
Weaknesses
Technically-oriented development environment, not suitable for the casual business user
Limited collaboration features
Only recently released and still unproven self-service BI and data discovery solution

Business Intelligence Score 2015 Page 20
Logi Analytics
McLean, VA, USA
www.logianalytics.com
Logi Analytics is a business intelligence company founded in 2000. The company is strongly focused on offering BI solutions that are easily embeddable into other operational systems. Today, the company offers three products: Logi Info, a business intelligence platform that also offers self-service analytics for ad-hoc reporting, and Logi Vision, a visual analytics tool.
Logi Info is the core platform for dashboarding, reporting and analysis, and can be embedded in other host applications and operational systems. Logi Info has two distinct user roles, developer and end-user, whereby developers configure dashboards and reports, while users consume, interact and to some extent customize the developers’ work product. Visualization objects are populated with data that can be sourced from multiple sources and joins. The tool supports development of web-based and mobile applications to support various reporting and analysis use cases. Logi Info also provides governed self-service capabilities, which allow users to create ad-hoc queries from managed data sources, analyze data and build visualizations, create and share dashboards and reports.
For non-technical business users, Logi Vision, released in January 2014, is a visual analytics application designed for workgroup collaboration to fulfill the increasing demand for self-service BI. Vision connects to a range of data sources and prepares the data for analysis. Users can collaborate and share their visualizations and dashboards using a range of social tools.
Strengths
Capabilities to embed the software in operational systems
Building web and mobile applications across multiple operational systems
Support for formatted and ad-hoc reporting, dashboards and analysis
New visual product for ad-hoc analysis and self-service
Weaknesses
Self-service analysis tool Logi Vision is still a nascent product
Only initial integration between Logi Info and Logi Vision
Limited advanced analysis and data mining features
Direct geographic presence outside of US, UK and Sweden limited to business partners

Business Intelligence Score 2015 Page 21
Microsoft
Redmond, WA, USA
www.microsoft.com
Microsoft, the world’s largest software company, was founded in 1975 and has become a household name primarily due to its Windows operating system and Office suite. Microsoft also offers its own database management system, collaboration tools, servers and the Dynamics ERP and CRM solutions.
Unlike most BI vendors, Microsoft chose not to package its business intelligence offering in a distinct tool or suite. Instead, the vendor’s BI capabilities are spread across the Office, SharePoint and SQL Server product lines, providing tools for formatted reporting, ad-hoc reporting, analysis and dashboards. In 2013, Microsoft introduced Power BI as a cloud-based BI package for ad-hoc reporting, analysis and dashboards. Microsoft Excel plays a leading role in Power BI and provides functional extensions, such as Power Query, Power Pivot, Power View, Power Map, and also uses Office 365 for publishing, collaboration and mobile delivery.
Microsoft SQL Server consists of multiple products. In addition to the core relational database management system and data integration and data quality components, SQL Server provides several tools relevant to Microsoft’s BI portfolio, most importantly Analysis Services, a multidimensional database, and Reporting Services.
Microsoft SharePoint Server is a team collaboration and content management system, not a business intelligence tool as such. However, in Microsoft’s vision, Sharepoint provides important collaboration, search and management features, in particular for unstructured information.
If customers want to implement the complete Microsoft BI platform including Office, SQL Server and SharePoint, they should be aware that there are dependencies between the releases of the various product lines. Another point to note is that Microsoft products have no central metadata repository. Since several different tools can also be used for each class of BI applications, customers should carefully evaluate which solution or solution portfolio is best suited to their specific requirements. One unique advantage of using Microsoft BI, however, is that customers can leverage the vast knowledge of Microsoft technologies present in most enterprises throughout the world. However, customers’ satisfaction with the product itself, as well as with vendor and implementer support, is worrying low.
Strengths
Solid product portfolio with capabilities for formatted reporting, ad-hoc reporting, analysis and dashboards, not incurring additional licensing fees for companies with existing enterprise agreements
SQL Server is a well-known database management system consisting of relational data storage, OLAP modeling, spatial support and integrated data mining
Excel, the central self-service BI and analysis tool, is well known and widely used
Extensive business partner network, providing customers with Microsoft competencies around the world
Weaknesses
Microsoft BI products integrated on a data level only and lacking a central metadata repository
Overlapping tools for one class of BI applications, leading to confused customers as they need to evaluate products depending on the use case
Rather low product satisfaction and implementation support scores in customer surveys

Business Intelligence Score 2015 Page 22
MicroStrategy
McLean, VA, USA
www.microstrategy.com
MicroStrategy, founded in 1989, is one of the best known vendors in the business intelligence market. In 2003, MicroStrategy became the first vendor to release a fully integrated product that provides formatted reports, dashboards and interactive analysis, all in a single solution that uses the same infrastructure. With its library of statistical and advanced data mining functions, the vendor offers comprehensive analytic capabilities for a wide variety of use cases.
MicroStrategy was among the first to present solutions for mobile devices and in 2014 released PRIME (Parallel Relational In-Memory Engine) as part of its own cloud service. The product is designed to provide high performance to very large numbers of users on very large data sets.
MicroStrategy has one of the best architected suites on the market, and its integration of Flash into the system is particularly impressive. MicroStrategy centrally integrates all BI functions in the suite instead of offering a stand-alone self-service BI client. Visual Insight (VI), the relatively new data discovery solution, is also integrated with MicroStrategy Web. VI offers capabilities for visual and explorative data analysis and addresses current requirements in the self-service BI area supporting the integration of data as diverse as local spreadsheets or Hadoop.
Strengths
One integrated platform for formatted and ad-hoc reporting, dashboarding, analysis and BI application creation with good performance in large and complex environments
Visual analysis solution for self-service scenarios included in the platform
Cloud platform with incorporated data integration capabilities (Informatica OEM)
Web-based clients for ad-hoc report and query creation and analysis
Comprehensive library of statistical functions for use by developers
Weaknesses
Limited performance management and no planning solutions
No dedicated solution for predictive analysis and data mining; usage of predefined models only. However, import and export of PMML supported
Extensive reorganization at executive levels and recent staff layoffs
Higher licensing cost than competitors’ products

Business Intelligence Score 2015 Page 23
Oracle
Redwood Shores, CA, USA
www.oracle.com
Oracle is one of the world’s largest software companies, with offices in 145 countries. Oracle has long been the largest RDBMS vendor and, through a series of acquisitions, is now the second largest application vendor. With its purchase of Sun in 2010, Oracle has entered the hardware market as well. In the BI area, Oracle offers various products such as Oracle BI Foundation Suite, Oracle Advanced Analytics, Oracle Endeca Information Discovery and Oracle Hyperion Planning.
Since 2011, Oracle has offered the Oracle BI Foundation Suite either stand-alone, or in combination with Oracle Exalytics system hardware. It uses either the Oracle database in-memory option or the TimesTen in-memory database and Essbase as an in-memory database engine. The Foundation Suite serves as a platform for dashboards, formatted reporting, ad-hoc reporting and analysis. The core components are Oracle Business Intelligence Enterprise Edition (OBIEE), Oracle Business Intelligence Mobile, Oracle BI Publisher, Oracle Essbase, Oracle Essbase Analytics link and various performance management applications. With both Essbase and OBIEE, Oracle BI Foundation Suite combines both MOLAP and ROLAP technologies in one package. In 2014, the vendor introduced Oracle BI Cloud Service, which extends the Foundation Suite in the area of data loading and modeling. For analysis of Hadoop-based data, the Oracle Cloud also provides a new visualization and analysis tool named Oracle Big Data Discovery.
Oracle Advanced Analytics is an extension to Oracle’s RDBMS for data mining. It consists of Oracle R Enterprise, an R extension to its DBMS, and Oracle Data Mining, a development client for data mining algorithms to be executed within the DBMS.
Oracle Endeca Information Discovery, from the vendor’s 2011 acquisition, supports explorative analysis for structured and unstructured data. Endeca uses its own in-memory data storage and server and provides comprehensive text mining capabilities. In its latest release, Endeca was supplied with web-based data integration and simple modeling features for business users.
Strengths
Web-based tool portfolio for formatted and ad-hoc reporting, analysis, dashboarding and scorecarding in one suite
Powerful ROLAP engine including the capability to generate multiple SQL statements to answer a single user query
Action framework for triggering external events and navigation within dashboards
Usage of Oracle RDBMS to provide data mining and advanced analysis as well as spatial capabilities
Designer for mobile BI applications
Weaknesses
No seamless integration between product packages, such as Foundation Suite and Endeca
Weak collaboration and annotation features in Foundation Suite
Solutions for visual analysis and advanced analysis separate from the suite

Business Intelligence Score 2015 Page 24
Pentaho (Hitachi Data Systems)
Orlando, FL, USA
www.pentaho.com
Pentaho was founded in 2004 to “revolutionize BI” through an open source business model. The company currently employs over 400 staff worldwide, including 80 in Europe. The vendor is headquartered in Orlando and is present in more than 185 countries via subsidiaries and partners. Pentaho was acquired by Hitachi Data Systems (HDS) in 2015.
Pentaho Business Analytics is an embeddable BI platform with a commercial open source business model that comes with data integration and front-end tools for dashboarding, reporting, OLAP analysis and data mining. It also features a graphical, business-user-oriented environment for creating complex reports. The product also supports big data use cases – such as native connectivity to Hadoop clusters, NoSQL data stores and unstructured data sources. Pentaho offers a bare-bones open source community edition at no cost to download. However, most of its revenue comes from subscriptions to the Pentaho Enterprise edition, which includes technical support, extensive Q&A, bug fixes, security and performance enhancements, as well as analytic tools unavailable in the Community edition. Pentaho also has a strong SaaS offering, as the company invested heavily in cloud BI to be early to market with its own solution.
Pentaho’s product strategy is focused on Big Data integration and analytics, as well as analytics embedded in third-party software applications. Although the company expects business users to run the Pentaho BI solution without significant IT support, customer references indicate that this not necessarily always possible.
Strengths
Flexible, integrated platform including data integration and front end tools for dashboarding, reporting, analysis and data mining
Graphical, business-user-oriented environment for creating complex reports
Large open source community that tests and improves the software
Access to “big data data sources” such as Hadoop, NoSQL and other analytical databases
Data mining and predictive analysis are provided through the open source project Weka
Weaknesses
Platform customization requires IT skills
No dynamic integration into Microsoft Office environment, such as Word or PowerPoint �
No collaboration tool to share report comments between business users

Business Intelligence Score 2015 Page 25
Prognoz
Perm, Russia
www.prognoz.com
Prognoz was founded in 1991 by a research team at the Economic Cybernetics Department of the Perm State University and the Institute of Economics of the Ural branch of the Russian Academy of Sciences. Besides Eastern Europe, the company also has offices in USA, Canada, Western Europe and Asia.
Prognoz offers a platform with several components for formatted and ad-hoc reporting, dashboarding and analysis. Dashboard and application development takes place in a technical-oriented “designer” which offers advanced formatting options. Reports are created in a spreadsheet-oriented grid environment. Finished reports can be scheduled or exported in various formats. There is also a web-based module for ad-hoc reporting and analysis which provides some built-in functionality for filtering, sorting and formatting data. Prognoz also offers pre-defined statistical methods that can be used to create individual statistical models in a visual environment. Furthermore, the platform includes a development environment for individual applications and communication with platform web services.
Strengths
Embeddable BI platform for reporting, dashboarding and (advanced and multidimensional) analysis with good mobile support
Visual environment for creation and modification of statistical models and use of embedded pre-defined statistical methods to support advanced analysis and data mining
GIS-Integration for Geo Visualization
Time series analysis and pre-defined forecasting methods
Development environment for custom applications
Weaknesses
Development environment for dashboards and applications only for users with technical skills
Limited support for visual or other types of analysis
No free object positioning in the platform
No planning solution in the product portfolio
Business Intelligence Score 2015 Page 26
Qlik
Radnor, PA, USA
www.qlik.com
Qlik, originally founded in 1993 in Lund, Sweden, moved its headquarters to the United States in 2005 after it raised funds from several venture capital firms. QlikView, the company’s virtually unknown product, was very aggressively marketed after the VC investment. This created enormous attention and traction, and in 2010 Qlik went public on NASDAQ.
Until the general availability of Qlik Sense in 2014, Qlik was a one product company. Today, the vendor provides a portfolio of visual analytics offerings: Qlik Sense Enterprise and Qlik Sense Cloud, as well as the Qlik Analytics Platform for developers, QlikView, QlikView NPrinting, acquired with Vizubi in 2015 for enhanced printing and page-based layout for QlikView, and QlikView Expressor, acquired from Expressor Software in 2011 to provide data governance and data integration solutions. Recently announced products Qlik Sense Charts and Qlik DataMarket will be available later in 2015.
QlikView is a dashboard and analysis product based on in-memory technology, and was the first product in the newly coined “data discovery tools” product category. The solution is positioned as a self-service platform targeted at business users, enabling them to analyze data without going to an expert for a new report or dashboard. However, while QlikView addresses the common challenges that business users see in IT-run BI systems, for more complex QlikView installations, the potentially high amount of scripting will always require trained development staff to produce scalable and high-performance solutions.
The new Qlik Sense product is positioned as a self-service data visualization solution providing immediate analysis results instead of building applications, and has been supplied with enterprise features such as a central library for common metadata. QlikView NPrinting is a report generation, distribution and scheduling application for QlikView. It enables organizations to create reports in a variety of popular formats including Office and pixel-perfect PDF files.
Strengths
Business-oriented platform for reporting, dashboarding, analysis and creation of individual applications
Good ‘associative’/set-based navigation in data
Good formatting and charting features
Responsive in-memory processing
Fast implementation and application modification
Weaknesses
No planning capabilities as part of the solution portfolio
Data consistency issues when several models are created, have to be solved organizationally
Limited separation of data from the proprietary structure
Complex QlikView implementations and data integration demands require heavy scripting

Business Intelligence Score 2015 Page 27
SAP
Walldorf, Germany
www.sap.com
SAP was founded in 1972 as a business applications company, and it prominently entered the business intelligence market with the large acquisition of Business Objects in 2007.
The SAP BusinessObjects BI Suite incorporates various end-user tools with a moderate level of integration. The suite contains strong individual products as well as several clients for various types of analysis and capabilities for building custom guided BI applications that can be published to the Web or mobile devices. The suite currently consists of the following products: SAP Crystal Reports, SAP BusinessObjects Web Intelligence, SAP BusinessObjects Design Studio, and SAP BusinessObjects Analysis as well as the new SAP Lumira. Some products leverage the central Universe semantic layer to access data sources, while others access data sources directly.
SAP Crystal Reports provides a comprehensive solution for organizations requiring highly formatted reporting. Typically, IT departments or technically savvy power users from a line of business develop reports designed for print output and publish them to large groups of report consumers. SAP BusinessObjects Web Intelligence is an ad-hoc reporting and analysis solution also suitable for creating simple dashboards. SAP BusinessObjects Design Studio is positioned as a solution for organizations requiring custom dashboards and individual guided BI applications. For multidimensional OLAP analysis, SAP offers BusinessObjects Analysis edition for Microsoft Office as an Excel and PowerPoint add-in for both Business Warehouse (BW) and HANA-based data sources.
SAP Lumira targets business analysts with flexible capabilities for self-service data discovery and visual analysis, either as a full desktop client or server for Web users with integrated in-memory data storage or as a cloud-based version.
SAP Predictive Analytics, based on the acquired KXEN product portfolio, is a new solution for data mining and statistical analysis. It comes as an extension to SAP Lumira for statistical analysis (“expert mode”) as well as a stand-alone solution for data mining experts (“automated mode”).
Strengths
Extensive BI platform for formatted and ad-hoc reporting, analysis, dashboarding and custom application development, suitable for large deployments
Business-user-friendly experience for ad-hoc reporting, analysis and visual analysis
Strong data mining and predictive analytics capabilities
Strong publishing and distribution features built into the platform
Content distribution through versatile mobile application
Weaknesses
Product integration remains a work in progress with a strategy to converge user experiences
Analysis for Office not leveraging the BusinessObjects Universe as semantic layer. However, SAP’s BI statement of direction indicates development in this area
Strong focus on Lumira and Predictive Analytics products leading to less innovation and updates for the rest of the BI product portfolio

Business Intelligence Score 2015 Page 28
SAS
Cary, NC, USA
www.sas.com
SAS, founded in 1976, is privately held, one of the earliest software companies and a well-known brand in the business intelligence market. The vendor has specialized in business intelligence, statistics, industry-specific analytic applications, data mining and data management for decades.
SAS’s traditional BI offering, Enterprise BI Server, covers dashboarding, OLAP and reporting, and provides clients such as Web Report Studio, BI Dashboard and Windows clients such as Enterprise Guide. SAS also offers a variety of analytic applications which address different industries and application domains such as fraud detection for financial services, market basket analysis for retail, and churn analysis for telecommunications providers. Currently, the bulk of these applications are still based on the older SAS architecture.
In 2012, SAS released SAS Visual Analytics, complemented in 2014 by SAS Visual Statistics. This new product line provides an integrated platform for data exploration, dashboarding, ad-hoc reporting and analysis, and gives customers a wide range of deployment options including public cloud, as well as the flexibility to use a variety of data sources, including Hadoop and SAP HANA.
SAS tools are capable of handling large data volumes and connect to more data sources than the specialized BI tool vendors. Increasingly targeting skilled business users, SAS is well positioned to ride the big data trend that is sweeping most enterprises. Still, SAS’s greatest strength lies in advanced analytics, predictive modeling and statistics, and this strategy dovetails well with its focus on industry-specific applications as opposed to tools for business users.
Strengths
Strong analytics and data mining capabilities
Solid data management abilities with metadata support in the platform
SAS is a flexible and powerful programming language
Visual Analytics as a business-user-oriented ad-hoc analysis, reporting, data exploration and dashboarding solution
Technical support and worldwide implementation partner network
Weaknesses
Product pricing and licensing model remain a recurring issue for many SAS customers
Despite the modernized user experience of Visual Analytics, the traditional SAS BI portfolio requires significant technical expertise

Business Intelligence Score 2015 Page 29
Tableau
Seattle, WA, USA
www.tableau.com
Tableau Software (Tableau) emerged from scientific research at Stanford University, where its three founders pursued a vision of providing business users with software that allowed intuitive analysis and insights into data. The company has enjoyed remarkable growth in the US market since its inception in 2003. Tableau follows a strategy of delivering software which requires as little training as possible, and allows business users to better interpret their own data by means of visualization without having to rely on the assistance of an analyst. At the same time, the tool offers additional, pre-defined statistical functions and analysis capabilities specifically geared to analysts.
Today, Tableau offers four core products: Tableau Desktop, Tableau Server, Tableau Online and Tableau Public, which are based on one common technology.
Tableau is a user-friendly visual analysis tool. Its core comprises a full client with connectors to a wide variety of data sources, including local data. The structured intuitive user interface, built-in intelligence and main memory utilization - geared to optimizing performance - contribute to the popularity of this solution in self-service BI (SSBI) scenarios. Tableau’s architecture is relatively simple: A desktop client is used for central development and authoring. Creation of simple analyses and consumption of workbooks can be done on the Web and on mobile devices.
Tableau’s openness to different data sources is one of vendor’s focus areas. The solution allows users to combine and analyze data from a wide range of sources. Tableau offers native connectors to numerous relational databases, local files, special data sources and multidimensional databases.
Like other self-service BI providers, the company pursues a "land and expand" strategy with its focus on business users. Today the solution is promoted well by the vendor and can be seen as a “shooting star” on the BI market.
Strengths
Easy-to-use user interface and therefore potentially high user acceptance
Visual analysis with some built-in intelligence suitable for business users
Self Service data modeling and analysis capabilities for users with access to different data
sources
Several interactive visualization options with visualization recommendations
Offline reporting and analysis capabilities (desktop client)
Weaknesses
Formatted print reporting is not in scope
Planning and budgeting is not supported
Tableau is strongly oriented towards single users; risk of report “explosion” when using it as
“Enterprise-wide BI solution”
Data integration and modeling take place in the desktop client
Limited functionality to build up individual BI applications

Business Intelligence Score 2015 Page 30
Targit
Hjørring, Denmark
www.targit.com
Targit was founded in 1986 and is a privately-owned software provider based in Denmark. The company has about 5,000 customers. The majority are located in Europe and North America, while one-third are distributed across the rest of the world.
Targit is positioned well for mid-size companies that require an all-integrated BI platform. Targit has made significant inroads particularly among Microsoft Dynamics customers. The company offers a number of vertical solutions, with manufacturing and retail being the more significant verticals, while niche solutions for heavy machinery, waste management, fleet management, medical billing, fashion design and apparel are showing traction as well.
The Targit Decision Suite offers integrated data discovery, self-service analysis, ad-hoc reporting and dashboards with separately priced, add-on modules for batch reporting, mobility, storyboards and data mashups. Recent releases support a range of innovative features including speech recognition for natural-language queries, alerting and notification, an intelligent wizard that finds relevant content as the user types, the in-memory data mashup tool, support for creating custom gauges, and a Java-based client for embedding the Decision Suite on any device.
Strengths
Full-stack BI platform for data discovery, self-service analysis, ad-hoc reporting and dashboards
Business user oriented ad-hoc reporting and analysis module
Agents for monitoring data and alerting
Integration with Microsoft Dynamics and SharePoint
Weaknesses
Lack of marketing and limited overall visibility in BI markets
Microsoft-centric approach with Windows dependencies, making Targit less interesting for organizations with Linux platform focus
Lack of a comprehensive ecosystem outside Nordic region
Business Intelligence Score 2015 Page 31
Tibco
Palo Alto, CA, USA
www.tibco.com
Tibco is a software vendor best known for its infrastructure offerings. However, in 2007, Tibco decided to enter the business intelligence market with the acquisition of Spotfire, a Swedish software vendor specializing in interactive visual analysis. In 2014 Tibco invested again and purchased open source vendor Jaspersoft with its solution for formatted and ad-hoc reporting, dashboarding and OLAP analysis.
The Spotfire Analytics Platform is a comprehensive business intelligence solution strongly focused on visual and advanced statistical analysis as well as the design of interactive dashboard applications. Spotfire applications are optimized to deliver good performance through integrated in-memory data storage or by using in-database options in combination with third-party storage technologies.
Aside from a full-featured desktop client primarily targeted at trained analysts and statisticians, Tibco also offers web and mobile clients for Spotfire content consumers. By embedding complex statistical methods and models, data scientists can perform predictive analyses, leveraging capabilities offered by the S+ and R programming languages. Spotfire is also well designed for building interactive dashboards and custom BI applications with guided navigation. Users can drag and drop chart objects to the desired position on the screen. They can also effectively visualize data and intuitively navigate through datasets using the wide range of chart types.
Tibco Spotfire offers a wide range of capabilities to support collaboration through Tibbr, a separately licensed collaboration and social networking platform.
Tibco’s Jaspersoft solutions round out the vendor’s BI portfolio with reporting, dashboarding and analysis as well as data integration functionality. The products target non-technical business users, but due to Jaspersoft’s open source heritage, also the developer community. For example, JasperReports have been embedded in a large number of applications from a wide variety of industries.
Strengths
In-memory solution designed to support business users with different types of analysis: visual, geo, streaming and advanced statistical analytics (including execution of S+, R, SAS and Matlab models)
Comprehensive capabilities for visualizing data and support for unrestricted, visual data navigation
Flexible environment for developing interactive on-screen dashboards and applications for reporting and analysis
Good collaboration capabilities with the social networking platform Tibbr
Highly formatted and ad-hoc reporting as well as analysis of big data sources in Jaspersoft
Weaknesses
Basic data integration capabilities in Tibco Spotfire Professional. Specialized data integration platform for complex requirements available (OEM)
Limited integration within Tibco’s portfolio, particularly between Spotfire and Jaspersoft
Overlapping features in both product lines (Spotfire and Jaspersoft)
Acquired mobile BI solution focuses on display of KPIs instead of Spotfire reports
Spotfire pricing considered higher than competitive products.

Business Intelligence Score 2015 Page 32
Yellowfin
Melbourne, Vic, Australia
www.yellowfinbi.com
Yellowfin, founded in Melbourne in 2003, is a BI software company that set out to change the general BI approach because the founders felt that traditional BI had become too complex and too expensive. Yellowfin’s initial go-to-market strategy was to integrate BI functionality into other vendors’ products and applications. The vendor boasts more than 250 OEM partners today, a large number for a relatively small company. Yellowfin also sells directly to end-user organizations and while the company only has a small direct sales force, the vendor has been able to sign up a few impressive names as customers through its extensive reseller network.
Yellowfin is a user-friendly BI platform with innovative features such as collaboration, storyboarding and data governance. The self-service solution targets business users, who require little support from IT. The product has all its functionality integrated at one price and includes an interesting timeline feature that records user activities (such as executed reports) and submits relevant alerts to the user. Yellowfin offers simplicity, performance and agility and is well positioned in the data discovery market. However, the product’s data integration capabilities are limited.
The vendor’s “author once, consume anywhere” approach enables users to deploy dashboard content easily on mobile devices. Yellowfin has enhanced the mobile experience with collaboration features to support annotations, discussions and content sharing.
Strengths
Innovative features such as collaboration and storyboarding
Embedded BI into other host applications�
Ease of use for business users
Simple pricing model
Geo-Visualization capabilities
Weaknesses
Highly formatted (pixel-perfect) reporting is not supported
No performance management or�planning functions
Limited data mining and predictive analysis capabilities
No cloud solution offered, but an offering on Amazon Web Services is available

Business Intelligence Score 2015 Page 33
Other Vendors
There are many other established vendors in the business intelligence market that provide mature and very useful technology, which may be ideal for organizations looking for a BI solution. However, due to the inclusion criteria applied in this ranking, those vendors are not evaluated in detail. To complete the market overview, we list those providers here.
Adaptive Insights
Palo Alto, CA, USA
www.adaptiveinsights.com
Adaptive Insights offers a cloud-based business intelligence and corporate performance management suite called Adaptive Suite for planning, consolidation, analytics and reporting.
ADVIZOR Solutions
Downers Grove, IL, USA
www.advizorsolutions.com
ADVIZOR offers interactive analysis with lots of different chart types for visual discovery as well as predictive analytics based on a patented in-memory data model.
Alteryx
Irvine, CA, USA
www.alteryx.com
Alteryx Analytics provides analysts with a workflow-based approach to data blending and advanced analytics that leads to deeper insights into data.
Antivia
Leeds, UK
www.antivia.com
Antivia DecisionPoint is a tool offering for creating interactive dashboards, reports and BI applications for mobile devices and the desktop.
Bilander
West Chester, PA, USA
www.bilandergroup.com
Integrated BI tool for ad-hoc reporting, (advanced) analysis, planning, dashboarding and balanced scorecarding with comprehensive chart functionality.
Bissantz
Nuremberg, Germany
www.bissantz.de
Bissantz’s DeltaMaster software enables users to create custom solutions for analysis, planning and reporting, featuring patented visualization capabilities.

Business Intelligence Score 2015 Page 34
Bitam
Roswell, GA, USA
www.bitam.com
Bitam is a global provider of business intelligence and Enterprise Performance Management software solutions.
Chartio
San Francisco, CA, USA
www.chartio.com
Interactive charts and dashboards created through an intuitive drag-and-drop interface. Customers can connect their databases directly to Chartio to visualize their data in real-time.
ClearStory Data
Menlo Park, CA, USA
www.clearstorydata.com
Fast data access, iterative analysis and active collaboration based on an integrated Spark-based data processing platform.
Cubeware
Rosenheim, Germany
www.cubeware.de
BI frontend for reporting, analysis, dashboarding and planning with a data integration offering for various multidimensional databases.
Connexica
Stafford, UK
www.connexica.com
Connexica’s CXAIR is a search-based analytics tool for querying structured and unstructured data.
Cyberscience
Centennial, CO, USA
www.cyberscience.com
Ad-hoc query and production reporting system that allows users to create simple queries, business graphics and crosstab reports as well as production reports.
Datameer
San Francisco, CA, USA
www.datameer.com
Big data analytics environment on top of Hadoop. Datameer combines self-service data integration, analytics and visualization functionality.

Business Intelligence Score 2015 Page 35
Datawatch
Chelmsford, MA, USA
www.datawatch.com
Datawatch is a BI frontend for accessing structured and unstructured data and exploring it with visual analytics to identify trends, spot outliers and identify opportunities.
Decisyon
Stamford, CT, USA
www.decisyon.com
Collaborative business intelligence and performance management software solution that integrates analysis, planning and execution.
Dimensional Insight
Burlington, MA, USA
www.dimins.com
Business intelligence software for complex and highly regulated industries, including healthcare, manufacturing, supply chain and alcoholic beverages, providing insights into data with interactive dashboards and reports.
Domo
American Fork, UT, USA
www.domo.com
Business intelligence tool for data visualization, dashboards and reporting offering the ability to discover, mash up, visualize and present data.
Dundas
Toronto, ON, Canada
www.dundas.com
Dundas Dashboard is a highly extensible, dashboard development environment that runs on Microsoft server and enables decision makers to digest data at a glance.
Entrinsik
Raleigh, NC, USA
www.entrinsik.com
Entrinsik Informer includes a browser-based drag-and-drop, point-and-click interface that is designed to encourage self-service BI, and is heavily used by mid-sized companies in specific industries.
FICO
San Jose, CA, USA
www.fico.com
FICO offers predictive analytics and software tools for decision support.

Business Intelligence Score 2015 Page 36
iDashboards
Troy, MI, USA
www.idashboards.com
Interactive dashboarding software that displays data in real time from databases, data warehouses, spreadsheets, XML and other data sources.
InetSoft
Piscataway, NJ, USA
www.inetsoft.com
InetSoft offers various applications that focus on operational BI, enterprise reporting, data visualization and embeddable reporting.
Jedox
Freiburg, Germany
www.jedox.de
Flexible BI solution for planning, reporting and analysis that runs on the company’s own multidimensional database. The underlying philosophy of Jedox Suite is to extend the familiar Excel environment with specific BI functionality.
Jinfonet Software
Rockville, MD, USA
www.jinfonet.com
JReport provides interactive data visualization with customizable ad-hoc reporting and dashboards that empower end users through the Web and mobile devices.
Lavastorm Analytics
Boston, MA, USA
www.lavastorm.com
Agile analytic environment that combines ETL and data integration, data analysis and data visualization capabilities based on the Lavastorm Analytics Engine.
Looker
Santa Cruz, CA, USA
www.looker.com
Web-based data discovery platform accessible on any browser as well as on mobile devices. Looker operates inside underlying databases, such as Amazon Redshift, Greenplum and Teradata Aster.
Palantir Technologies
Palo Alto, CA, USA
www.palantir.com
Palantir offers solutions for integrating, visualizing and analyzing massive amounts of information. Palantir’s software is deployed at public institutions, private enterprises, and also in the non-profit sector, for example, in defense, anti-fraud and disease response.

Business Intelligence Score 2015 Page 37
Panorama Software
Toronto, ON, Canada
www.panorama.com
Collaborative business intelligence tool focused on dashboarding and analysis based on visual infographics.
Phocas
Coventry, UK
www.phocassoftware.com
Phocas offers a mature self-service tool which enables users to perform their own analysis and reporting with IT support needed only for data provisioning. Phocas offers a good range of functionality to support ad-hoc querying, standard reporting, dashboarding and data discovery.
Platfora
San Mateo, CA, USA
www.platfora.com
Interactive Big Data Analytics platform for multistructured data operating natively on Hadoop and Spark.
Pyramid Analytics
Bellevue, WA, USA
The BI Office Suite from Pyramid Analytics is a full-stack, modular BI product that was built from the ground up for the Web and designed to appeal to disenfranchised Microsoft BI users who want an easier to use, highly integrated, modern looking BI tool.
Salient
Vancouver, BC, Canada
www.salientbi.com
Salient’s Collaborative Intelligence Suite offers analytics, interactive dashboards and collaborative knowledge management all within one integrated business intelligence/performance management tool.
Sisense
New York, NY, USA
www.sisense.com
Sisense is a big data analytics company focusing on business intelligence, reporting, dashboarding and business analytics.
SpagoBI
Padua, Italy
www.spagobi.org
An open source business intelligence suite for (ad-hoc) reporting, interactive cockpits, multidimensional (OLAP) analysis and data mining.

Business Intelligence Score 2015 Page 38
Zoomdata
Reston, VA, USA
www.zoomdata.com
Big Data exploration, visualization and analytics platform for stream processing data including Cloud, Hadoop/HDFS, social media and proprietary databases to create real-time visualizations.
Related Research Documents
The following BARC and CXP Group documents complement this Business Intelligence Score:
The BI Survey: The world’s largest vendor-independent survey of BI end-users with trends analyses and an overview showing how real-world end-users currently rate each BI vendor and tool covered
Product Reviews with detailed insights into more than 30 business intelligence solutions, covering all the major players in the BI space
Market Trends for business intelligence and data management in 2015 and beyond
The PAC SITSI Research Platform with market and vendor analyses for Analytics and additional topics

Copyright © BARC GmbH 2015. All rights reserved.
Business Application Research Center – BARC GmbH
Central Europe
Berliner Platz 7 97080 Würzburg
Germany
+49 931 880651-0
www.barc.de
Rest of the World
+44 1536 772 451
www.barc-research.com