Embed Size (px)
Citation preview
Middle-Market M&A is on Fire & the Software Sector is No Exception The M&A market continues to boil and the outlook appearssolid through 2019 as long as macro conditions stay calm andstable. That being said, it is a great time to consider all of thestrategic alternatives available for a middle-market business.
Software companies are especially attractive because ofgrowth rates, overall market opportunity and pace ofinnovation. Public software companies continue to trade atpremium valuations and their share price gains are leading theoverall market. This strong performance highlights theattractiveness of software business models once they achievescale and the ongoing growth opportunities.
Middle-market M&A continues to scale upwards. Let’s look atthe reasons we believe this is the case. First, M&A activity isbeing underpinned by the strongest global economic growthsince 2011, low inflation, low interest rates, ready availabilityof acquisition financing and record amounts of private equitycapital competing with deal-hungry corporate acquirerslooking to juice up their top-line growth. The net result isconsiderably more money chasing middle-market targets,thereby increasing deal activity and valuations.
Second, the biggest change in the M&A market has been theincreasing prevalence of private equity firms. They raised$453B¹ of new capital last year and now have approximately$1.7T² to put to work. PE firms seek tuck-in acquisitions forexisting platform investments within a private equity portfolioas they continue to deploy buy and build strategies to createlarger platforms with broader product suites. Additionally,private equity firms now own an estimated 10 percent ofmiddle-market companies and we believe there is little reasonthis will not continue to climb and drive additional M&A forprivate companies.
So when we will see a downturn? With 2019 shaping upnicely and 2020 being a presidential election year, we areoptimistic that a U.S. downturn is still two to four years away.
With the market looking good, our team is meeting withexecutives and investors at the HR Tech conference in Vegas.Contact us to discuss M&A opportunities in this hot market.
Scott RhodesManaging Director
Software News & Trends Software Trading Multiples
Major Indices & Rates
September 11 – 14 | Las Vegas
Scott Rhodes, MD and Software group leader, and TomDonahue, MD and IT & Professional Services group leader,will attend the HR Technology Conference. Schedule ameeting to discuss M&A sector trends and their insights:
[email protected]@bowstringadvisors.com
Join Us - HR Tech Conference
Software InsightsAUGUST 2018
% Change3 Month 12 Month
HR Tech 70,445.53 3.8% 22.2%
Sales & Marketing Tech 229,335.33 14.1% 60.0%
SaaS 157,104.63 11.4% 51.1%
Dow Jones 25,187.70 0.7% 14.0%
NYSE 12,763.66 0.4% 6.5%
NASDAQ 7,819.71 6.3% 22.2%
AMEX 2,660.59 11.9% 7.7%
S&P 500 2,821.93 2.9% 12.3%
Russell 2000 1,675.32 7.4% 16.0%
USD/Euro 0.86 5.4% (2.1%)
USD/Yen 110.84 4.2% (1.4%)
USD/Pound 0.76 6.3% (1.6%)
U.S. Prime Rate 5.000% 25.00 Bps 75.00 Bps
U.S. Treasury - 10 Year 2.850% 11.00 Bps 58.00 Bps
LIBOR - 3 month 2.336% 2.40 Bps 103.71 Bps
Fed Funds Overnight Rate 1.910% 23.00 Bps 75.00 Bps
Close as of 6/29/2018
Enterprise ValueLTM Revenue LTM EBITDA
HR Tech 6.68x 15.3x
Sales & Marketing Tech 6.57x 9.7x
SaaS 9.36x NM
Source: S&P Capital IQ
Sources: ¹Preqin Ltd. “Q4 2017 Fundraising Update”; ²McKinsey & Co.”Dry powder in private equity”
Source: S&P Capital IQ
2
Bowstring News
Bowstring Advisors 10th Annual Conference
Spotlight on Recent Bowstring HR Tech Transaction
March 2018
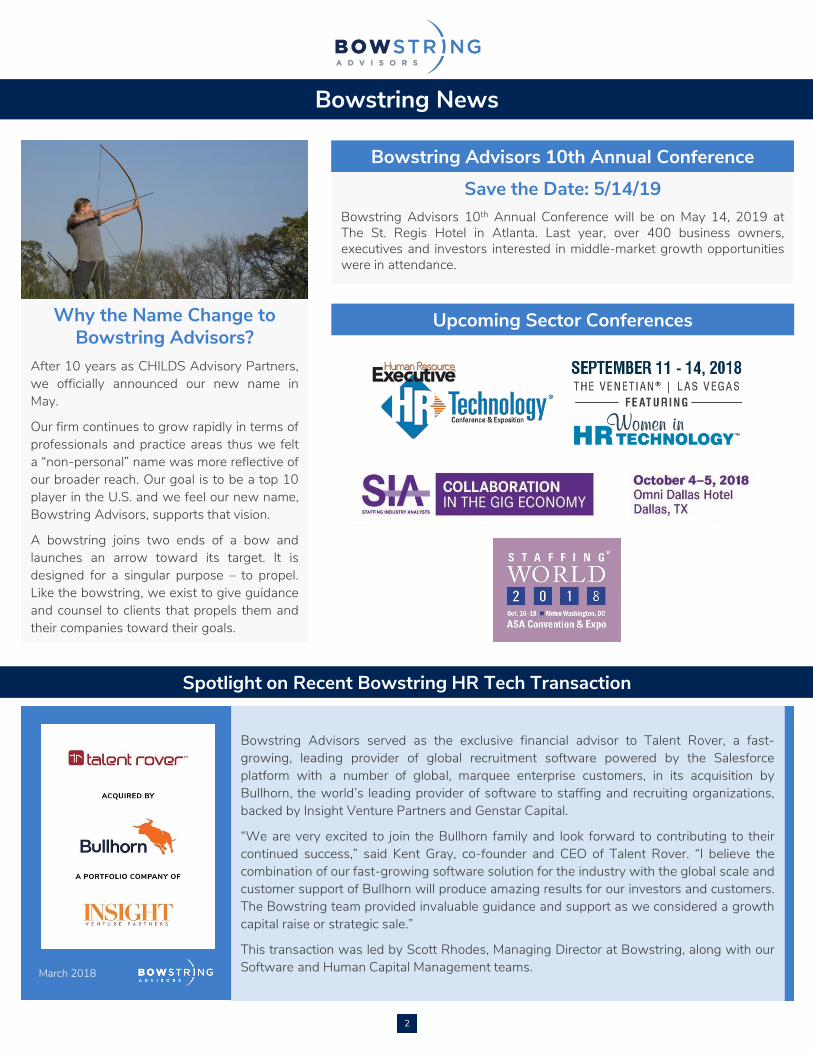
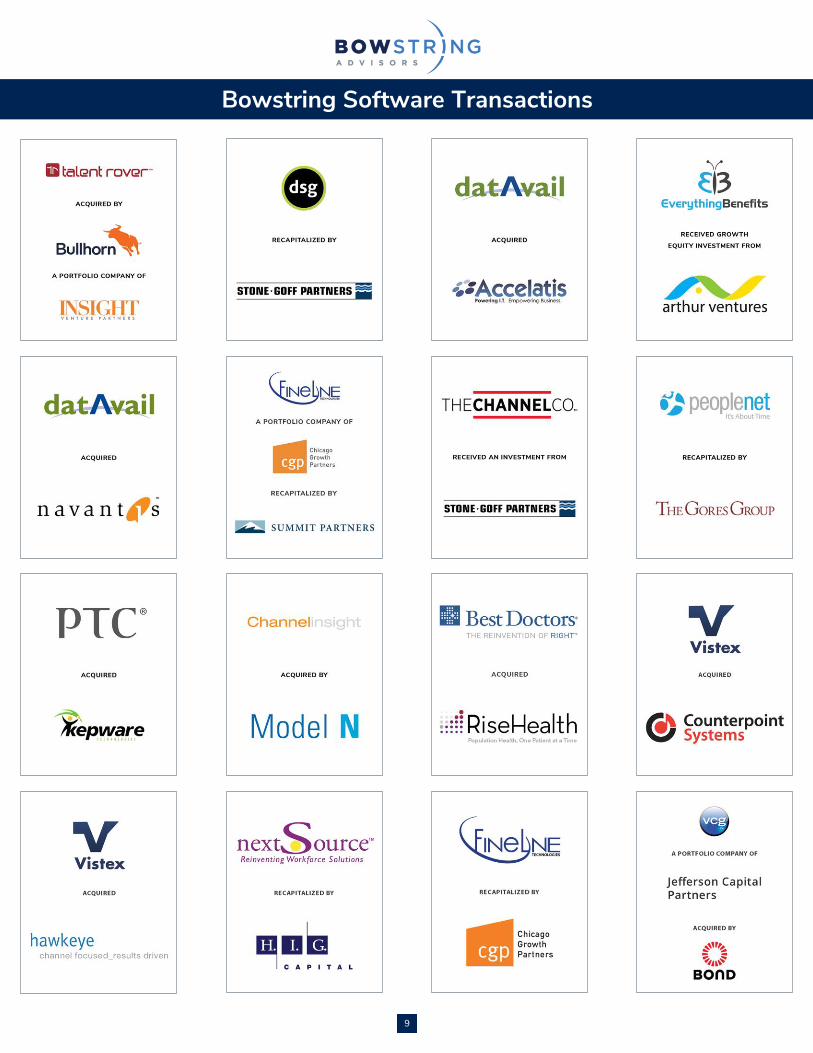
Bowstring Advisors served as the exclusive financial advisor to Talent Rover, a fast-growing, leading provider of global recruitment software powered by the Salesforceplatform with a number of global, marquee enterprise customers, in its acquisition byBullhorn, the world’s leading provider of software to staffing and recruiting organizations,backed by Insight Venture Partners and Genstar Capital.
“We are very excited to join the Bullhorn family and look forward to contributing to theircontinued success,” said Kent Gray, co-founder and CEO of Talent Rover. “I believe thecombination of our fast-growing software solution for the industry with the global scale andcustomer support of Bullhorn will produce amazing results for our investors and customers.The Bowstring team provided invaluable guidance and support as we considered a growthcapital raise or strategic sale.”
This transaction was led by Scott Rhodes, Managing Director at Bowstring, along with ourSoftware and Human Capital Management teams.
Why the Name Change to Bowstring Advisors?
After 10 years as CHILDS Advisory Partners,we officially announced our new name inMay.
Our firm continues to grow rapidly in terms ofprofessionals and practice areas thus we felta “non-personal” name was more reflective ofour broader reach. Our goal is to be a top 10player in the U.S. and we feel our new name,Bowstring Advisors, supports that vision.
A bowstring joins two ends of a bow andlaunches an arrow toward its target. It isdesigned for a singular purpose – to propel.Like the bowstring, we exist to give guidanceand counsel to clients that propels them andtheir companies toward their goals.
Save the Date: 5/14/19Bowstring Advisors 10th Annual Conference will be on May 14, 2019 atThe St. Regis Hotel in Atlanta. Last year, over 400 business owners,executives and investors interested in middle-market growth opportunitieswere in attendance.
Upcoming Sector Conferences
3
M&A Activity and Trends
Software M&A Valuations
Software Public Market Valuations
Quarterly Trends in U.S. Middle Market Software M&A Activity
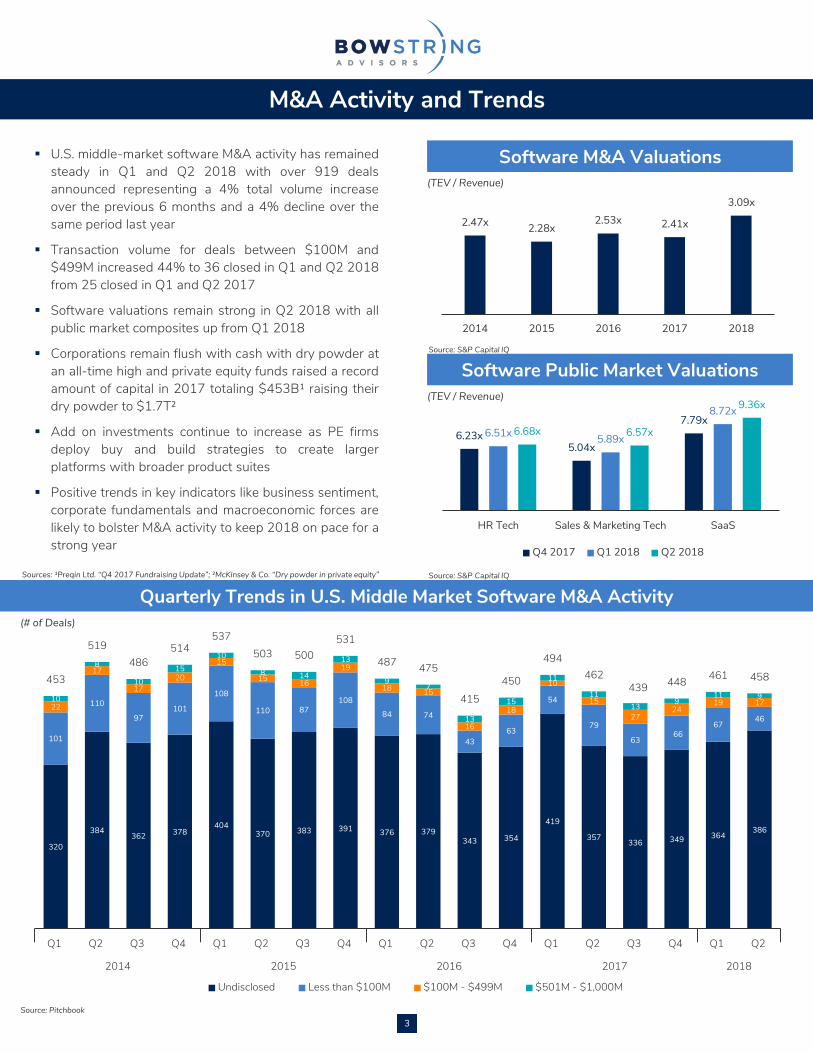
▪ U.S. middle-market software M&A activity has remainedsteady in Q1 and Q2 2018 with over 919 dealsannounced representing a 4% total volume increaseover the previous 6 months and a 4% decline over thesame period last year
▪ Transaction volume for deals between $100M and$499M increased 44% to 36 closed in Q1 and Q2 2018from 25 closed in Q1 and Q2 2017
▪ Software valuations remain strong in Q2 2018 with allpublic market composites up from Q1 2018
▪ Corporations remain flush with cash with dry powder atan all-time high and private equity funds raised a recordamount of capital in 2017 totaling $453B¹ raising theirdry powder to $1.7T²
▪ Add on investments continue to increase as PE firmsdeploy buy and build strategies to create largerplatforms with broader product suites
▪ Positive trends in key indicators like business sentiment,corporate fundamentals and macroeconomic forces arelikely to bolster M&A activity to keep 2018 on pace for astrong year
2.47x 2.28x2.53x 2.41x
3.09x
2014 2015 2016 2017 2018
320
384362 378
404370 383 391 376 379
343 354
419
357 336 349 364386
101
110
97101
108
110 87108
84 74
4363
54
79
6366
6746
22
17
1720
15
15 16
19
18 15
16
18
10
15
2724
19 1710
8
1015
10
8 14
13
97
13
15
11
1113
911 9
453
519486
514537
503 500531
487 475
415450
494462
439 448 461 458
0
100
200
300
400
500
600
Q1 Q2 Q3 Q4 Q1 Q2 Q3 Q4 Q1 Q2 Q3 Q4 Q1 Q2 Q3 Q4 Q1 Q2
2014 2015 2016 2017 2018
Undisclosed Less than $100M $100M - $499M $501M - $1,000M Deal Count
6.23x5.04x
7.79x6.51x 5.89x
8.72x
6.68x 6.57x
9.36x
HR Tech Sales & Marketing Tech SaaS
Q4 2017 Q1 2018 Q2 2018
(TEV / Revenue)
Source: S&P Capital IQ
Source: S&P Capital IQ
(TEV / Revenue)
Source: Pitchbook
(# of Deals)
Sources: ¹Preqin Ltd. “Q4 2017 Fundraising Update”; ²McKinsey & Co. “Dry powder in private equity”
4
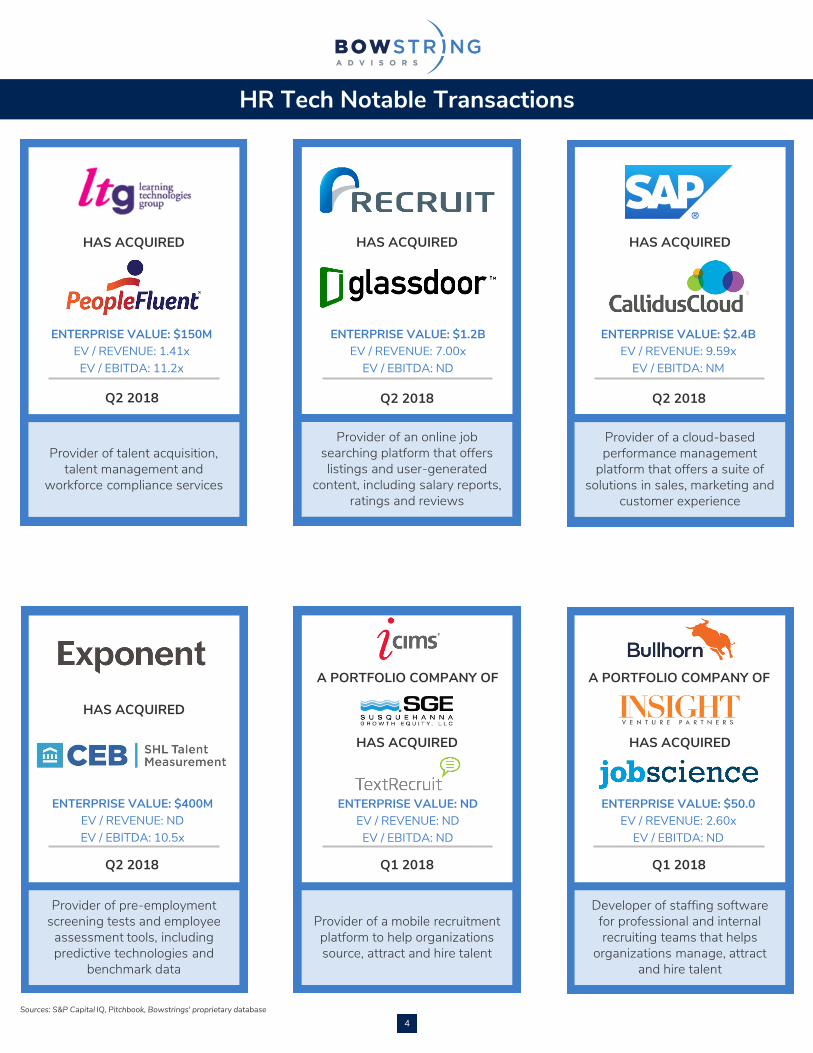
HR Tech Notable Transactions
Provider of talent acquisition, talent management and
workforce compliance services
Provider of a cloud-based performance management
platform that offers a suite of solutions in sales, marketing and
customer experience
Provider of an online job searching platform that offers listings and user-generated
content, including salary reports, ratings and reviews
Provider of pre-employment screening tests and employee
assessment tools, including predictive technologies and
benchmark data
Provider of a mobile recruitment platform to help organizations source, attract and hire talent
Developer of staffing software for professional and internal recruiting teams that helps
organizations manage, attract and hire talent
Q2 2018
HAS ACQUIRED
Q2 2018
HAS ACQUIRED
Q2 2018
HAS ACQUIRED
Q2 2018
HAS ACQUIRED
Q1 2018
HAS ACQUIRED
Q1 2018
HAS ACQUIRED
ENTERPRISE VALUE: $150MEV / REVENUE: 1.41xEV / EBITDA: 11.2x
ENTERPRISE VALUE: $1.2BEV / REVENUE: 7.00x
EV / EBITDA: ND
ENTERPRISE VALUE: $2.4BEV / REVENUE: 9.59x
EV / EBITDA: NM
ENTERPRISE VALUE: NDEV / REVENUE: NDEV / EBITDA: ND
A PORTFOLIO COMPANY OF
ENTERPRISE VALUE: $50.0EV / REVENUE: 2.60x
EV / EBITDA: ND
A PORTFOLIO COMPANY OF
ENTERPRISE VALUE: $400MEV / REVENUE: NDEV / EBITDA: 10.5x
Sources: S&P Capital IQ, Pitchbook, Bowstrings' proprietary database
5
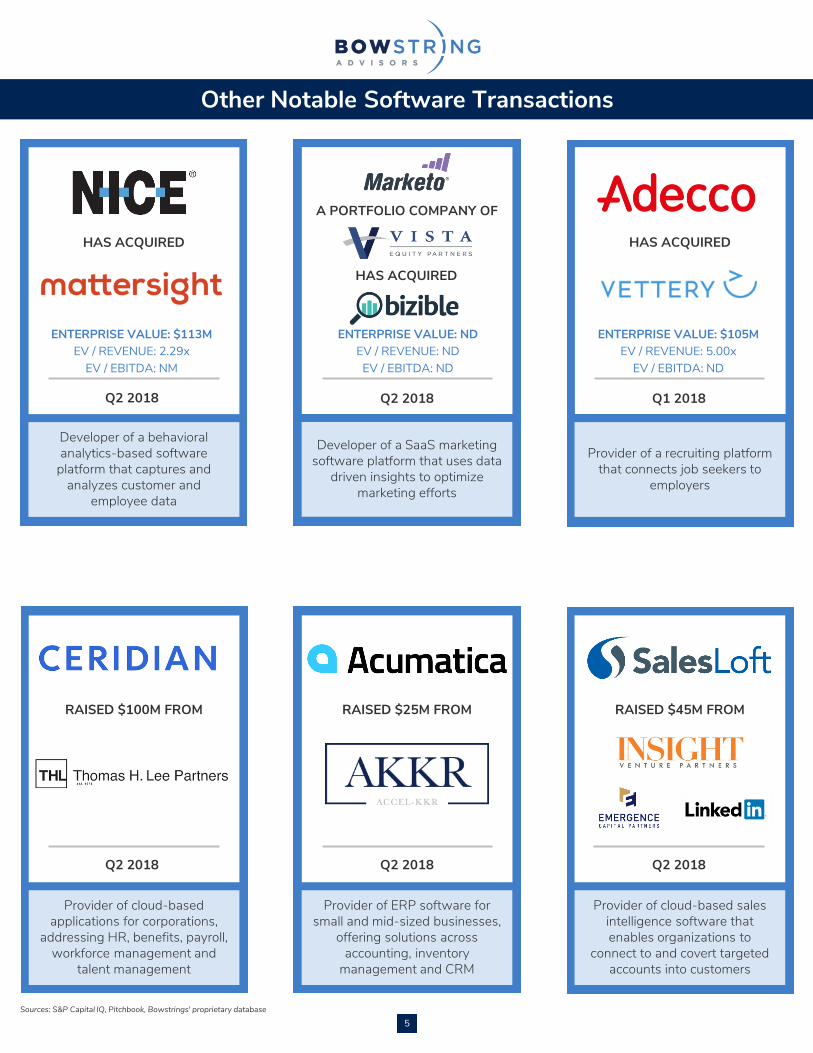
Other Notable Software Transactions
Developer of a behavioral analytics-based software
platform that captures and analyzes customer and
employee data
Provider of a recruiting platform that connects job seekers to
employers
Developer of a SaaS marketing software platform that uses data
driven insights to optimize marketing efforts
Provider of cloud-based applications for corporations,
addressing HR, benefits, payroll, workforce management and
talent management
Provider of ERP software for small and mid-sized businesses,
offering solutions across accounting, inventory
management and CRM
Provider of cloud-based sales intelligence software that enables organizations to
connect to and covert targeted accounts into customers
Q2 2018
HAS ACQUIRED
Q2 2018 Q1 2018
HAS ACQUIRED
Q2 2018
RAISED $100M FROM
Q2 2018 Q2 2018
ENTERPRISE VALUE: $113MEV / REVENUE: 2.29x
EV / EBITDA: NM
ENTERPRISE VALUE: NDEV / REVENUE: NDEV / EBITDA: ND
ENTERPRISE VALUE: $105MEV / REVENUE: 5.00x
EV / EBITDA: ND
HAS ACQUIRED
A PORTFOLIO COMPANY OF
RAISED $25M FROM RAISED $45M FROM
Sources: S&P Capital IQ, Pitchbook, Bowstrings' proprietary database
6
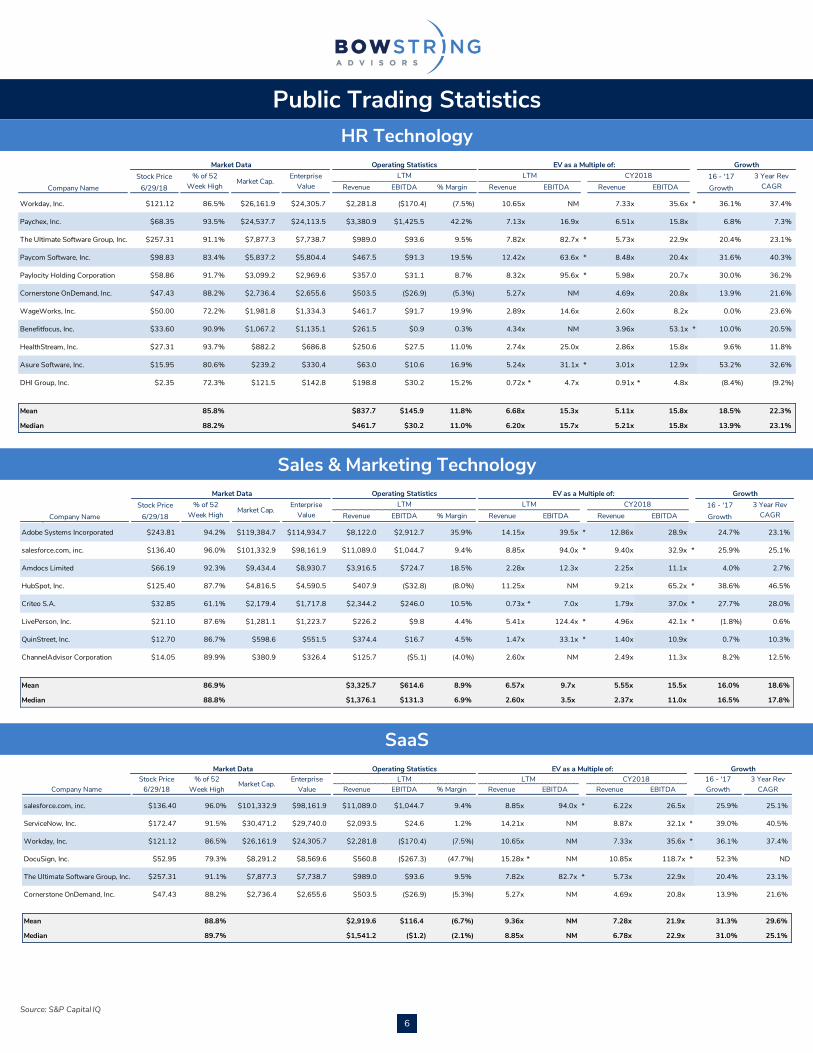
Market Data Operating Statistics EV as a Multiple of: GrowthStock Price LTM LTM CY2018 16 - '17
Company Name 6/29/18 Revenue EBITDA % Margin Revenue EBITDA Revenue EBITDA Growth
salesforce.com, inc. $136.40 96.0% $101,332.9 $98,161.9 $11,089.0 $1,044.7 9.4% 8.85x 94.0x * 6.22x 26.5x 25.9% 25.1%
ServiceNow, Inc. $172.47 91.5% $30,471.2 $29,740.0 $2,093.5 $24.6 1.2% 14.21x NM 8.87x 32.1x * 39.0% 40.5%
Workday, Inc. $121.12 86.5% $26,161.9 $24,305.7 $2,281.8 ($170.4) (7.5%) 10.65x NM 7.33x 35.6x * 36.1% 37.4%
DocuSign, Inc. $52.95 79.3% $8,291.2 $8,569.6 $560.8 ($267.3) (47.7%) 15.28x * NM 10.85x 118.7x * 52.3% ND
The Ultimate Software Group, Inc. $257.31 91.1% $7,877.3 $7,738.7 $989.0 $93.6 9.5% 7.82x 82.7x * 5.73x 22.9x 20.4% 23.1%
Cornerstone OnDemand, Inc. $47.43 88.2% $2,736.4 $2,655.6 $503.5 ($26.9) (5.3%) 5.27x NM 4.69x 20.8x 13.9% 21.6%
Mean 88.8% $2,919.6 $116.4 (6.7%) 9.36x NM 7.28x 21.9x 31.3% 29.6%
Median 89.7% $1,541.2 ($1.2) (2.1%) 8.85x NM 6.78x 22.9x 31.0% 25.1%
% of 52Week High
Market Cap.Enterprise
Value3 Year Rev
CAGR
Market Data Operating Statistics EV as a Multiple of: GrowthStock Price LTM LTM CY2018 16 - '17
Company Name 6/29/18 Revenue EBITDA % Margin Revenue EBITDA Revenue EBITDA GrowthAverage
Workday, Inc. $121.12 86.5% $26,161.9 $24,305.7 $2,281.8 ($170.4) (7.5%) 10.65x NM 7.33x 35.6x * 36.1% 37.4%
Paychex, Inc. $68.35 93.5% $24,537.7 $24,113.5 $3,380.9 $1,425.5 42.2% 7.13x 16.9x 6.51x 15.8x 6.8% 7.3%
The Ultimate Software Group, Inc. $257.31 91.1% $7,877.3 $7,738.7 $989.0 $93.6 9.5% 7.82x 82.7x * 5.73x 22.9x 20.4% 23.1%
Paycom Software, Inc. $98.83 83.4% $5,837.2 $5,804.4 $467.5 $91.3 19.5% 12.42x 63.6x * 8.48x 20.4x 31.6% 40.3%
Paylocity Holding Corporation $58.86 91.7% $3,099.2 $2,969.6 $357.0 $31.1 8.7% 8.32x 95.6x * 5.98x 20.7x 30.0% 36.2%
Cornerstone OnDemand, Inc. $47.43 88.2% $2,736.4 $2,655.6 $503.5 ($26.9) (5.3%) 5.27x NM 4.69x 20.8x 13.9% 21.6%
WageWorks, Inc. $50.00 72.2% $1,981.8 $1,334.3 $461.7 $91.7 19.9% 2.89x 14.6x 2.60x 8.2x 0.0% 23.6%
Benefitfocus, Inc. $33.60 90.9% $1,067.2 $1,135.1 $261.5 $0.9 0.3% 4.34x NM 3.96x 53.1x * 10.0% 20.5%
HealthStream, Inc. $27.31 93.7% $882.2 $686.8 $250.6 $27.5 11.0% 2.74x 25.0x 2.86x 15.8x 9.6% 11.8%
Asure Software, Inc. $15.95 80.6% $239.2 $330.4 $63.0 $10.6 16.9% 5.24x 31.1x * 3.01x 12.9x 53.2% 32.6%
DHI Group, Inc. $2.35 72.3% $121.5 $142.8 $198.8 $30.2 15.2% 0.72x * 4.7x 0.91x * 4.8x (8.4%) (9.2%)
Mean 85.8% $837.7 $145.9 11.8% 6.68x 15.3x 5.11x 15.8x 18.5% 22.3%
Median 88.2% $461.7 $30.2 11.0% 6.20x 15.7x 5.21x 15.8x 13.9% 23.1%
% of 52Week High
Market Cap.Enterprise
Value3 Year Rev
CAGR
Market Data Operating Statistics EV as a Multiple of: GrowthStock Price LTM LTM CY2018 16 - '17
Company Name 6/29/18 Revenue EBITDA % Margin Revenue EBITDA Revenue EBITDA GrowthAverage
Adobe Systems Incorporated $243.81 94.2% $119,384.7 $114,934.7 $8,122.0 $2,912.7 35.9% 14.15x 39.5x * 12.86x 28.9x 24.7% 23.1%
salesforce.com, inc. $136.40 96.0% $101,332.9 $98,161.9 $11,089.0 $1,044.7 9.4% 8.85x 94.0x * 9.40x 32.9x * 25.9% 25.1%
Amdocs Limited $66.19 92.3% $9,434.4 $8,930.7 $3,916.5 $724.7 18.5% 2.28x 12.3x 2.25x 11.1x 4.0% 2.7%
HubSpot, Inc. $125.40 87.7% $4,816.5 $4,590.5 $407.9 ($32.8) (8.0%) 11.25x NM 9.21x 65.2x * 38.6% 46.5%
Criteo S.A. $32.85 61.1% $2,179.4 $1,717.8 $2,344.2 $246.0 10.5% 0.73x * 7.0x 1.79x 37.0x * 27.7% 28.0%
LivePerson, Inc. $21.10 87.6% $1,281.1 $1,223.7 $226.2 $9.8 4.4% 5.41x 124.4x * 4.96x 42.1x * (1.8%) 0.6%
QuinStreet, Inc. $12.70 86.7% $598.6 $551.5 $374.4 $16.7 4.5% 1.47x 33.1x * 1.40x 10.9x 0.7% 10.3%
ChannelAdvisor Corporation $14.05 89.9% $380.9 $326.4 $125.7 ($5.1) (4.0%) 2.60x NM 2.49x 11.3x 8.2% 12.5%
Mean 86.9% $3,325.7 $614.6 8.9% 6.57x 9.7x 5.55x 15.5x 16.0% 18.6%
Median 88.8% $1,376.1 $131.3 6.9% 2.60x 3.5x 2.37x 11.0x 16.5% 17.8%
3 Year Rev CAGR
% of 52Week High
Market Cap.Enterprise
Value
Public Trading Statistics
Sales & Marketing Technology
SaaS
HR Technology
Source: S&P Capital IQ
7
-
3.0x
6.0x
9.0x
12.0x
15.0x
HR Tech Sales & Marketing Tech SaaS
-
50
100
150
200
250
300
HR Tech Sales & Marketing Tech SaaS S&P 500
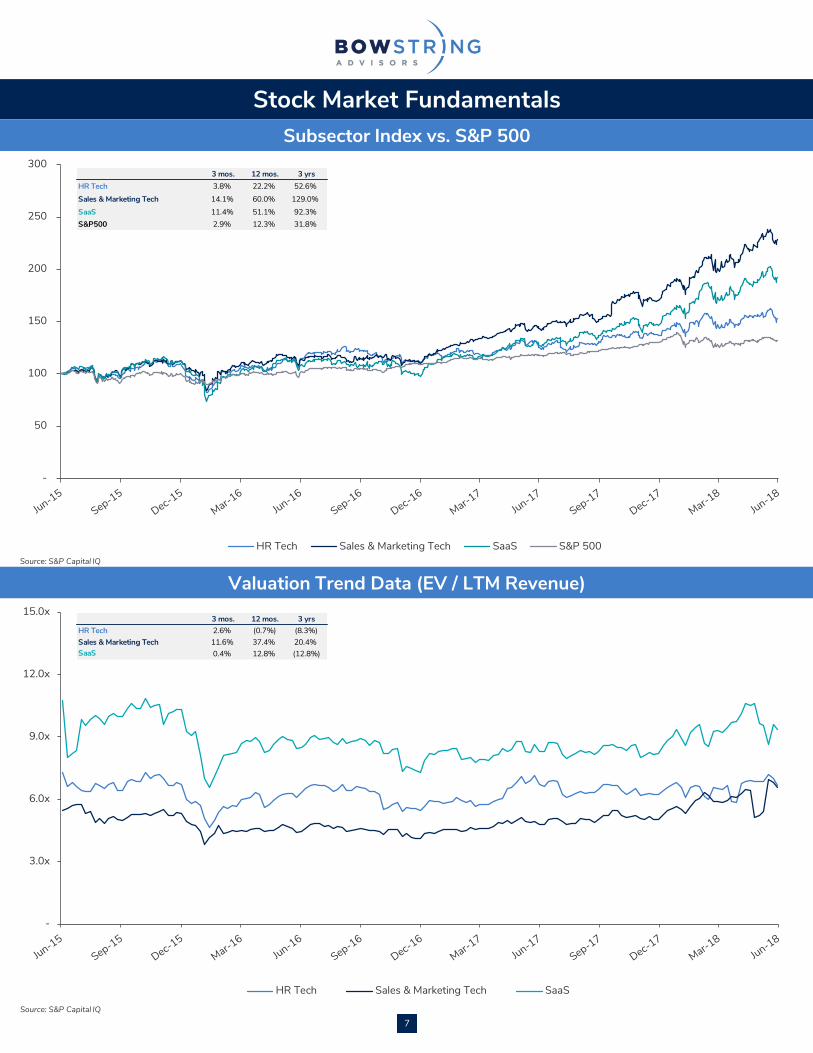
Stock Market FundamentalsSubsector Index vs. S&P 500
Valuation Trend Data (EV / LTM Revenue)
3 mos. 12 mos. 3 yrsHR Tech 3.8% 22.2% 52.6%Sales & Marketing Tech 14.1% 60.0% 129.0%SaaS 11.4% 51.1% 92.3%S&P500 2.9% 12.3% 31.8%
3 mos. 12 mos. 3 yrsHR Tech 2.6% (0.7%) (8.3%)Sales & Marketing Tech 11.6% 37.4% 20.4%SaaS 0.4% 12.8% (12.8%)
Source: S&P Capital IQ
Source: S&P Capital IQ
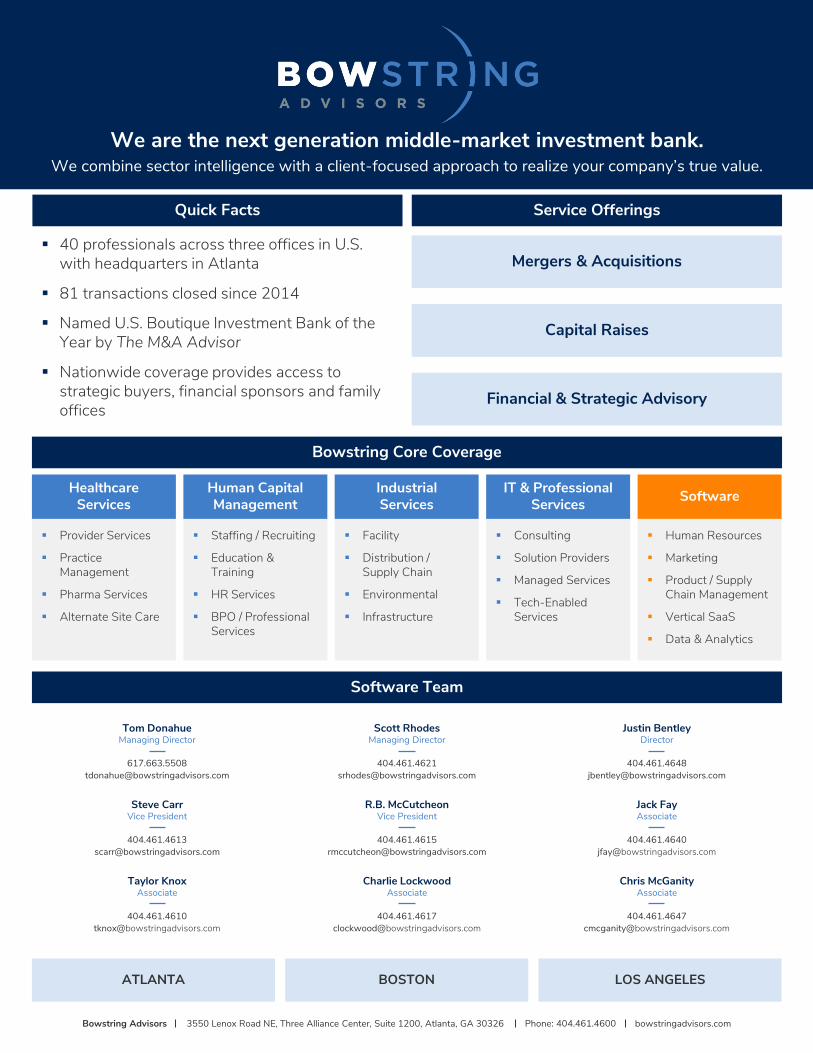
We are the next generation middle-market investment bank. We combine sector intelligence with a client-focused approach to realize your company’s true value.
Quick Facts
▪ 40 professionals across three offices in U.S. with headquarters in Atlanta
▪ 81 transactions closed since 2014
▪ Named U.S. Boutique Investment Bank of the Year by The M&A Advisor
▪ Nationwide coverage provides access to strategic buyers, financial sponsors and family offices
Service Offerings
Mergers & Acquisitions
Capital Raises
Financial & Strategic Advisory
Bowstring Core Coverage
Human Capital Management
▪ Staffing / Recruiting
▪ Education & Training
▪ HR Services
▪ BPO / Professional Services
Healthcare Services
▪ Provider Services
▪ Practice Management
▪ Pharma Services
▪ Alternate Site Care
IT & Professional Services
▪ Consulting
▪ Solution Providers
▪ Managed Services
▪ Tech-Enabled Services
Industrial Services
▪ Facility
▪ Distribution / Supply Chain
▪ Environmental
▪ Infrastructure
Software
▪ Human Resources
▪ Marketing
▪ Product / Supply Chain Management
▪ Vertical SaaS
▪ Data & Analytics
ATLANTA BOSTON LOS ANGELES
Bowstring Advisors 3550 Lenox Road NE, Three Alliance Center, Suite 1200, Atlanta, GA 30326 Phone: 404.461.4600 bowstringadvisors.com
Software Team
Jack Fay
Associate
Taylor Knox
Associate
Scott Rhodes
Managing Director
Charlie Lockwood
AssociateChris McGanity
Associate
Tom Donahue
Managing Director
Steve Carr
Vice PresidentR.B. McCutcheon
Vice President
Justin Bentley
Director
9
Bowstring Software Transactions