Embed Size (px)
Citation preview
75 Arlington Street Boston, MA 02116 800-497-0151 www.mindstreamanalytics.com
Enterprise Transformation Methodology
Strategic Roadmap Development
White Paper
75 Arlington Street Boston, MA 02116 800-497-0151 www.mindstreamanalytics.com
Contents
Think Big, Start Small, Deliver Quickly .................................................................................................. 3
Transformation Roadmap ......................................................................................................................... 3
Fundamental Business Drivers ................................................................................................................ 4
Enterprise Transformation Methodology: .............................................................................................. 5
Conclusion: ................................................................................................................................................. 7
75 Arlington Street Boston, MA 02116 800-497-0151 www.mindstreamanalytics.com
Think Big, Start Small, Deliver Quickly
We take a long-term, strategic view of Enterprise Transformation Methodology (ETM), including
enterprise performance management, process improvement, systems integration and data management,
but attack the problem with targeted, well-coordinated initiatives focused on delivering value rapidly.
Think Big: Develop a Roadmap that supports your long-term business objectives and ties in
existing, related quick hits. This Roadmap is the compass that steers your systems integration and
data management initiatives as you incrementally build the vision over time.
Start Small: Define and prioritize initiatives and carve out meaningful Phases to deliver the
highest value in the shortest amount of time. This builds ongoing support and momentum in the
organization. A Proof-of-Concept can be effectively structured around one of the earlier phases to
gain confidence and internal support.
Deliver Quickly in a Phased Approach: Develop and execute the Roadmap with 45-90 day
projects, typically grouped into phases of no longer than 12 months. This methodology allows
you to incrementally build toward the vision, while providing interim benefits to the business
along the way.
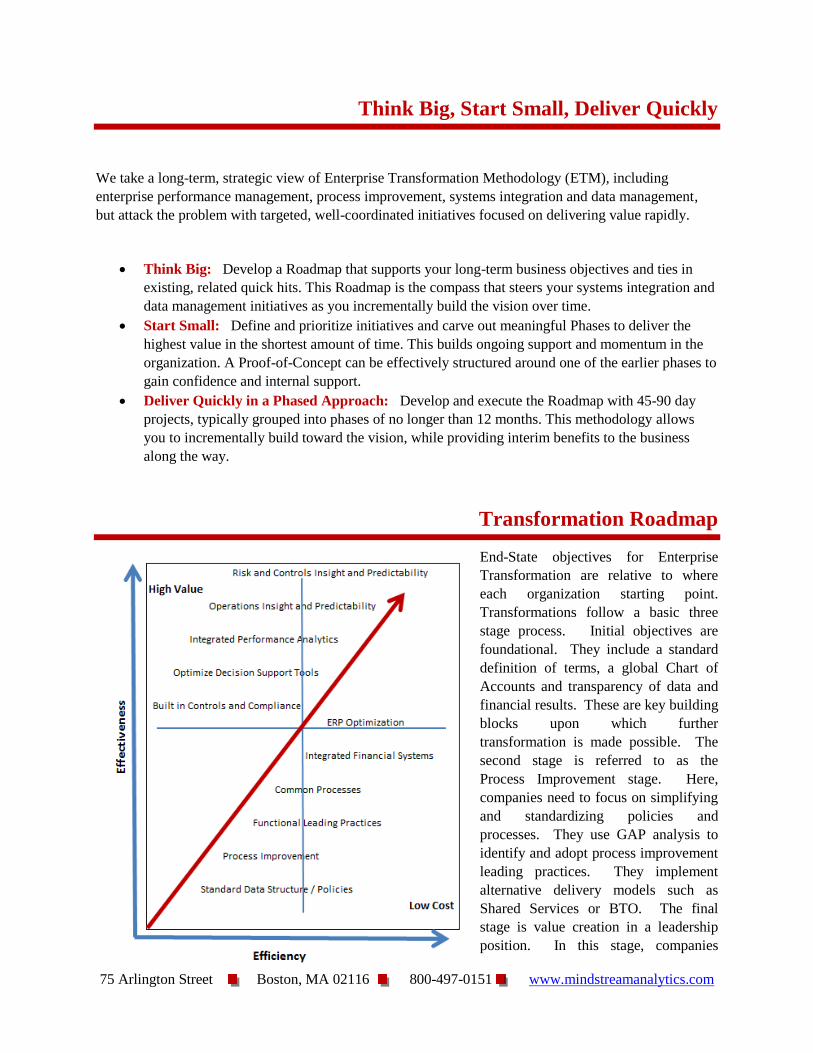
Transformation Roadmap
End-State objectives for Enterprise
Transformation are relative to where
each organization starting point.
Transformations follow a basic three
stage process. Initial objectives are
foundational. They include a standard
definition of terms, a global Chart of
Accounts and transparency of data and
financial results. These are key building
blocks upon which further
transformation is made possible. The
second stage is referred to as the
Process Improvement stage. Here,
companies need to focus on simplifying
and standardizing policies and
processes. They use GAP analysis to
identify and adopt process improvement
leading practices. They implement
alternative delivery models such as
Shared Services or BTO. The final
stage is value creation in a leadership
position. In this stage, companies
75 Arlington Street Boston, MA 02116 800-497-0151 www.mindstreamanalytics.com
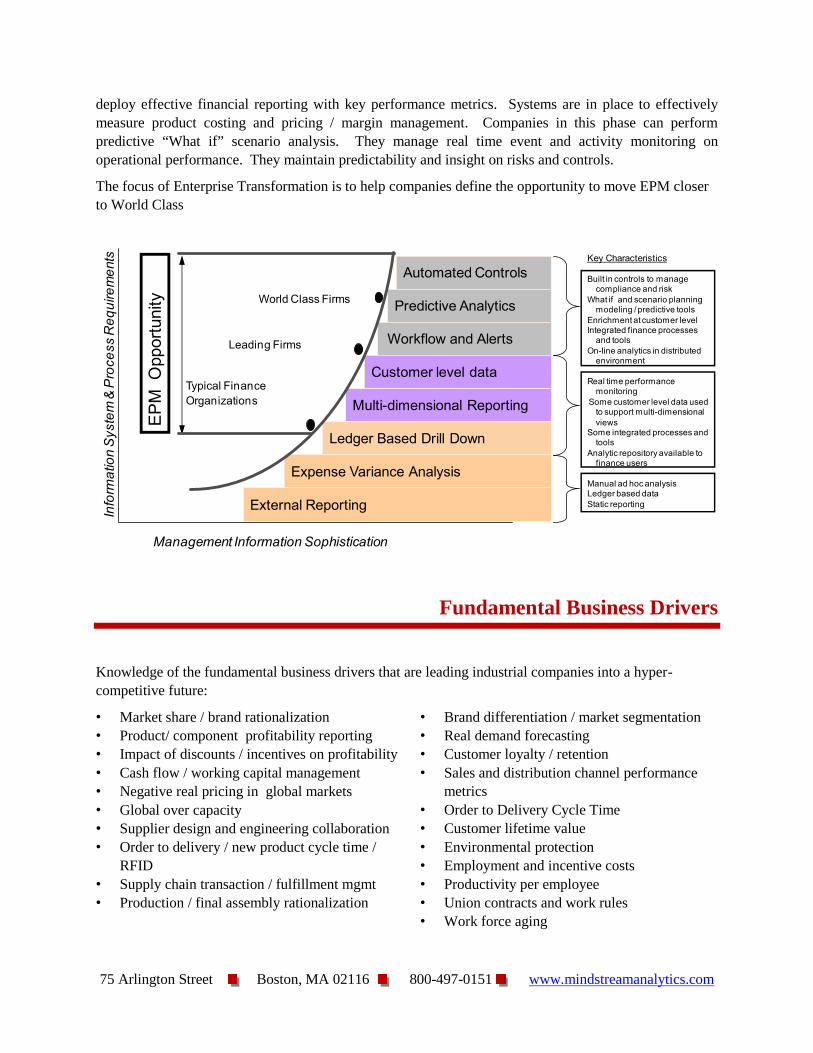
deploy effective financial reporting with key performance metrics. Systems are in place to effectively
measure product costing and pricing / margin management. Companies in this phase can perform
predictive “What if” scenario analysis. They manage real time event and activity monitoring on
operational performance. They maintain predictability and insight on risks and controls.
The focus of Enterprise Transformation is to help companies define the opportunity to move EPM closer
to World Class
Fundamental Business Drivers
Knowledge of the fundamental business drivers that are leading industrial companies into a hyper-
competitive future:
• Market share / brand rationalization
• Product/ component profitability reporting
• Impact of discounts / incentives on profitability
• Cash flow / working capital management
• Negative real pricing in global markets
• Global over capacity
• Supplier design and engineering collaboration
• Order to delivery / new product cycle time /
RFID
• Supply chain transaction / fulfillment mgmt
• Production / final assembly rationalization
• Brand differentiation / market segmentation
• Real demand forecasting
• Customer loyalty / retention
• Sales and distribution channel performance
metrics
• Order to Delivery Cycle Time
• Customer lifetime value
• Environmental protection
• Employment and incentive costs
• Productivity per employee
• Union contracts and work rules
• Work force aging
Key Characteristics
Built in controls to manage compliance and risk
What if and scenario planning modeling / predictive tools
Enrichment at customer levelIntegrated finance processes
and tools
On-line analytics in distributed environment
Real time performance monitoring
Some customer level data used to support multi-dimensional
viewsSome integrated processes and
tools
Analytic repository available to finance users
Manual ad hoc analysis Ledger based data
Static reporting
Info
rma
tio
n S
yste
m &
Pro
ce
ss R
eq
uire
me
nts
Management Information Sophistication
Typical Finance
Organizations
Leading Firms
World Class Firms
Automated Controls
Predictive Analytics
Workflow and Alerts
Customer level data
Multi-dimensional Reporting
Ledger Based Drill Down
Expense Variance Analysis
External Reporting
EP
M O
pport
unity
75 Arlington Street Boston, MA 02116 800-497-0151 www.mindstreamanalytics.com
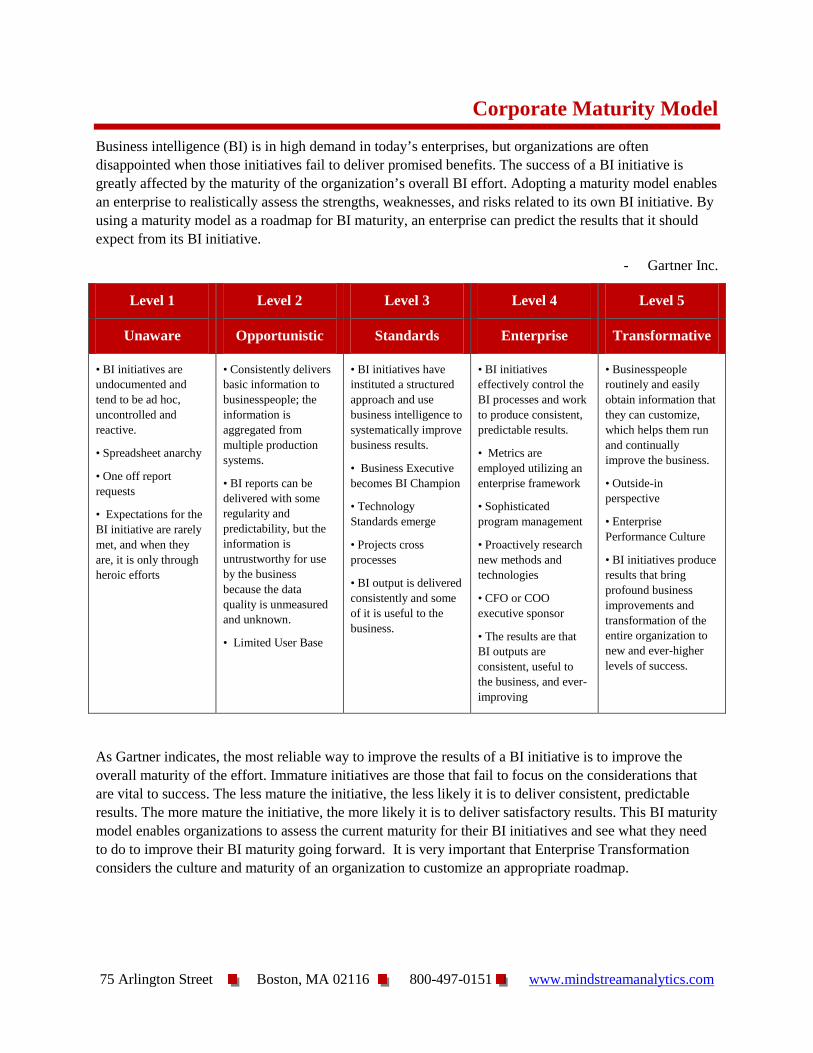
Corporate Maturity Model
Business intelligence (BI) is in high demand in today’s enterprises, but organizations are often
disappointed when those initiatives fail to deliver promised benefits. The success of a BI initiative is
greatly affected by the maturity of the organization’s overall BI effort. Adopting a maturity model enables
an enterprise to realistically assess the strengths, weaknesses, and risks related to its own BI initiative. By
using a maturity model as a roadmap for BI maturity, an enterprise can predict the results that it should
expect from its BI initiative.
- Gartner Inc.
Level 1 Level 2 Level 3 Level 4 Level 5
Unaware Opportunistic Standards Enterprise Transformative
• BI initiatives are
undocumented and
tend to be ad hoc,
uncontrolled and
reactive.
• Spreadsheet anarchy
• One off report
requests
• Expectations for the
BI initiative are rarely
met, and when they
are, it is only through
heroic efforts
• Consistently delivers
basic information to
businesspeople; the
information is
aggregated from
multiple production
systems.
• BI reports can be
delivered with some
regularity and
predictability, but the
information is
untrustworthy for use
by the business
because the data
quality is unmeasured
and unknown.
• Limited User Base
• BI initiatives have
instituted a structured
approach and use
business intelligence to
systematically improve
business results.
• Business Executive
becomes BI Champion
• Technology
Standards emerge
• Projects cross
processes
• BI output is delivered
consistently and some
of it is useful to the
business.
• BI initiatives
effectively control the
BI processes and work
to produce consistent,
predictable results.
• Metrics are
employed utilizing an
enterprise framework
• Sophisticated
program management
• Proactively research
new methods and
technologies
• CFO or COO
executive sponsor
• The results are that
BI outputs are
consistent, useful to
the business, and ever-
improving
• Businesspeople
routinely and easily
obtain information that
they can customize,
which helps them run
and continually
improve the business.
• Outside-in
perspective
• Enterprise
Performance Culture
• BI initiatives produce
results that bring
profound business
improvements and
transformation of the
entire organization to
new and ever-higher
levels of success.
As Gartner indicates, the most reliable way to improve the results of a BI initiative is to improve the
overall maturity of the effort. Immature initiatives are those that fail to focus on the considerations that
are vital to success. The less mature the initiative, the less likely it is to deliver consistent, predictable
results. The more mature the initiative, the more likely it is to deliver satisfactory results. This BI maturity
model enables organizations to assess the current maturity for their BI initiatives and see what they need
to do to improve their BI maturity going forward. It is very important that Enterprise Transformation
considers the culture and maturity of an organization to customize an appropriate roadmap.
75 Arlington Street Boston, MA 02116 800-497-0151 www.mindstreamanalytics.com
Enterprise Transformation Methodology:
Step 1: Diagnostics:
• Understand Executive vision
• Evaluate and determine Organizational Maturity and culture for change management
• Discuss and determine the major process, organization and systems prerequisites and
requirements
• Assess high level process efficiency (e.g., cycle time, workflow, error rates, etc.) and
effectiveness (e.g., degree of simplification and standardization, the right content etc.) versus
industry leading practices for:
o Planning and Forecasting
o Performance Management, Reporting and Analytics (e.g. scorecards, executive
dashboards)
o Sales
o Supply Chain
o Financial Management (Accounting / Financial Close)
o Internal Controls
o Accounting Processes (e.g., AP, AR)
o Tax Management
o Risk Management
• Assess the level and degree of automation including use of applications, data standards and
systems architecture
• Software vendor and tool selection
• Identify and prioritize improvement opportunities and recommended action items
Step 2: Business Modeling
Component Business Model (CBM) to model the enterprise and frame the business into logical
business components
Strategic Assessment of business components:
o B – Base
o C – Competitive
o D – Differentiation
• EPM Assessment: Model costs for each business component and related sensitivity to change
management
• Performance Assessment: Model performance of each business component through KPI’s and
benchmarking
75 Arlington Street Boston, MA 02116 800-497-0151 www.mindstreamanalytics.com
Step 3: Optimization
Prioritization grid to select critical business components that are most relevant for
optimization
Generate “Heat Map” to identify hot prioritized components and determine strategic approach
to optimization
Deep dives of “Hot” components to identify specific actions/levers
Roadmap developed for prioritization, sequencing and dependencies… including future year
impact
Conclusions:
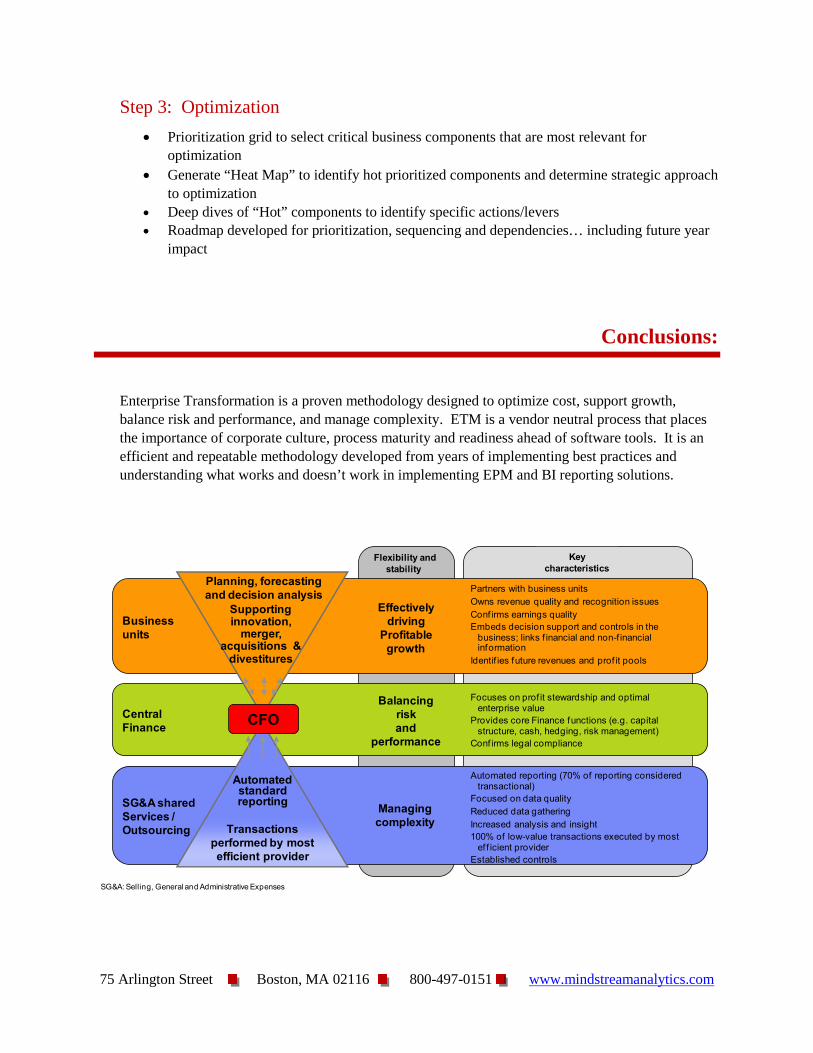
Enterprise Transformation is a proven methodology designed to optimize cost, support growth,
balance risk and performance, and manage complexity. ETM is a vendor neutral process that places
the importance of corporate culture, process maturity and readiness ahead of software tools. It is an
efficient and repeatable methodology developed from years of implementing best practices and
understanding what works and doesn’t work in implementing EPM and BI reporting solutions.
Flexibility and
stability
Key
characteristics
Business
units
Effectively
driving
Profitable
growth
Partners with business units
Owns revenue quality and recognition issues
Conf irms earnings quality
Embeds decision support and controls in the business; links f inancial and non-f inancial information
Identif ies future revenues and prof it pools
Central
Finance
Balancing
risk
and
performance
Focuses on prof it stewardship and optimal enterprise value
Provides core Finance functions (e.g. capital structure, cash, hedging, risk management)
Conf irms legal compliance
SG&A shared
Services /
Outsourcing
Managing
complexity
Automated reporting (70% of reporting considered transactional)
Focused on data quality
Reduced data gathering
Increased analysis and insight
100% of low-value transactions executed by most ef f icient provider
Established controls
Transactions
performed by most
efficient provider
Automated standard reporting
Planning, forecasting
and decision analysis
Supporting innovation,
merger, acquisitions &
divestitures
CFO
SG&A: Selling, General and Administrative Expenses