Embed Size (px)
Citation preview
8/12/2019 Enterprise Survey2013 Bangladesh
http://slidepdf.com/reader/full/enterprise-survey2013-bangladesh 1/15
BangladeshCountry Profile 2013
Region: South AsiaIncome Group: Low incomePopulation: 154,695,368
GNI per capita: US$840.00

8/12/2019 Enterprise Survey2013 Bangladesh
http://slidepdf.com/reader/full/enterprise-survey2013-bangladesh 2/15
C o
n t e n
t s13
IntroductionBusiness Environment Obstacles
Average FirmInfrastructureTradeRegulations, Taxes, and Business LicensingCorruptionCrime and InformalityFinanceInnovation and Workforce
Summary of Enterprise Survey Indicators

8/12/2019 Enterprise Survey2013 Bangladesh
http://slidepdf.com/reader/full/enterprise-survey2013-bangladesh 3/15

8/12/2019 Enterprise Survey2013 Bangladesh
http://slidepdf.com/reader/full/enterprise-survey2013-bangladesh 4/15
The Country Profile for Bangladesh is based on data from the Enterprise Surveys conducted by the World Bank. Thbenchmarks include the averages for the group of countries in South Asia and the Bangladesh income group.
Below is a snapshot of the biggest business environment obstacles as perceived by firms. The first graph presenthe top 10 constraints as identified by firms in Bangladesh benchmarked against the regional average. The secongraph shows the top 3 constraints broken down by large, medium, and small firms in Bangladesh.
EnterpriseSurveys:BANGLADESH-2013 http://www.enterprisesurveys.org
Snapshot of the Business Environment in Bangladesh
Business Environment Obstacles

8/12/2019 Enterprise Survey2013 Bangladesh
http://slidepdf.com/reader/full/enterprise-survey2013-bangladesh 5/15
Average Firm
The Enterprise Surveys collect informationfrom a representative sample of thenon-agricultural formal private economy. Inaddition to collecting information on thebusiness environment the surveys collectinformation on the characteristics of the
firms interviewed. Consequently, the datacollected provides a description of therepresentative private firm in the countryand also an estimate of how some of theattributes of the average firm are distributedacross the population of firms.
The first indicator shows the distribution offirms according to their age measured bythe number of years they have been inoperation. The effect the businessenvironment can have on the private sectormay depend on firms’ experience andlongevity. Seasoned firms and young firms
may differ in their ability to successfullynavigate the business environment.
The second set of indicators provides anillustration of female participation inmanagement and firm ownership. Theseindicators can help assess whether gendercan a determinant of the effect ofregulations on the firm and the level ofexposure of the firm to external factors,such as corruption, access to finance, andtechnology.
The third indicator shows the participation of
the domestic private sector, the governmentthe foreign sector and other sectors in theownership of the typical firm. Thedistribution provides insight into their levelsof equity in the private sector of theeconomy.
http://www.enterprisesurveys.org EnterpriseSurveys:BANGLADESH -2013

8/12/2019 Enterprise Survey2013 Bangladesh
http://slidepdf.com/reader/full/enterprise-survey2013-bangladesh 6/15
Infrastructure
A strong infrastructure enhances thecompetitiveness of an economy andgenerates a business environmentconducive to firm growth and development.Good infrastructure efficiently connectsfirms to their customers and suppliers, and
enables the use of modern productiontechnologies. Conversely, deficiencies ininfrastructure create barriers to productiveopportunities and increase costs for all firmsfrom micro enterprises to large multinationalcorporations.
The Enterprise Surveys capture the dualchallenge of providing a stronginfrastructure for electricity, water supply,telephone connections, etc., and thedevelopment of institutions that effectivelyprovide and maintain public services.
The first set of indicators shows the extentto which firms are faced with failures in theprovision of electricity and the effect ofthese failures on sales. Inadequateelectricity supply can increase costs, disruptproduction, and reduce profitability.
The second set of indicators measures theefficiency of the water supply for themanufacturing sector.*** Manymanufacturing sectors depend on reliableand efficient sources of water for theiroperations.
The third set of indicators evaluates theefficiency of infrastructure services byquantifying the delays in obtaining electricitywater, and telephone connections. Servicedelays impose additional costs on firms andmay act as barriers to entry and investment.
http://www.enterprisesurveys.org EnterpriseSurveys:BANGLADESH -2013
8/12/2019 Enterprise Survey2013 Bangladesh
http://slidepdf.com/reader/full/enterprise-survey2013-bangladesh 7/15
Trade
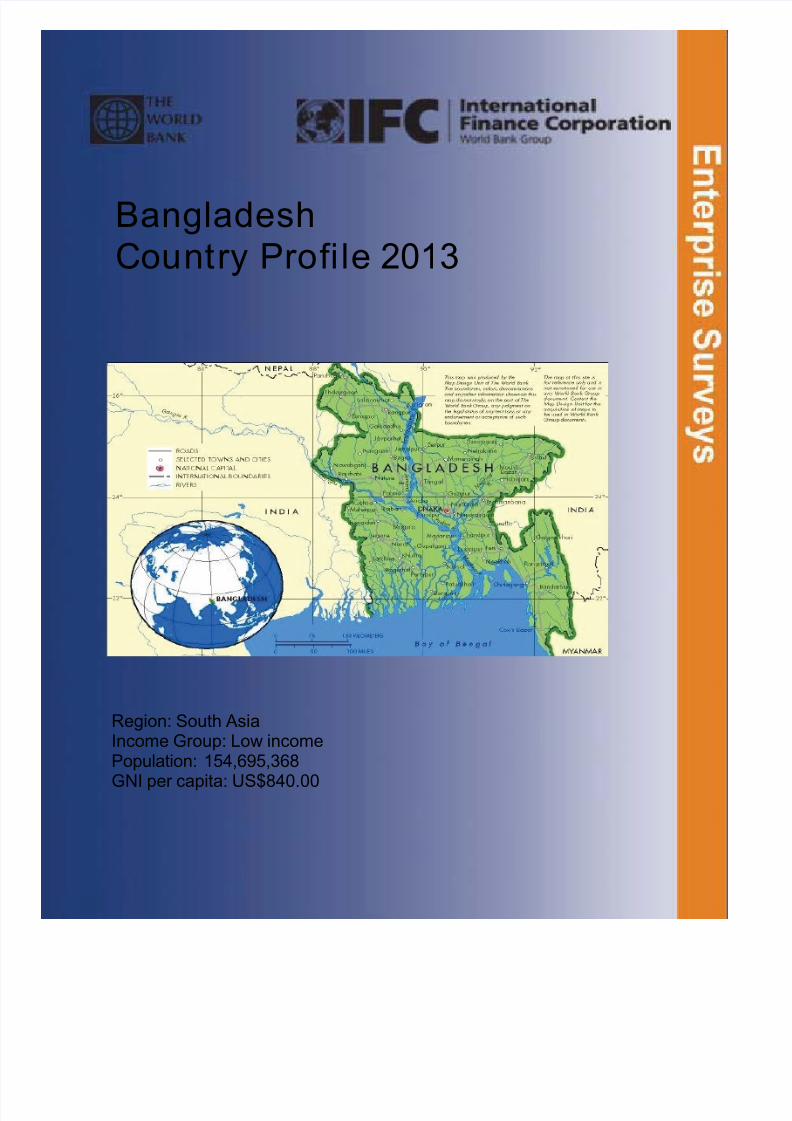
Open markets allow firms to expand, raisestandards for efficiency on exporters, andenable firms to import low cost supplies.However, trading also forces firms to dealwith customs services and trade regulationsobtain export and import licenses, and in
some cases, firms also face additional costsdue to losses during transport.
The Enterprise Surveys collect informationon the operational constraints faced byexporters and importers and also quantifiesthe trade activity of firms.
The first set of indicators provides ameasure of the intensity of foreign trade inthe private sector. The first graph shows thepercentage of firms who export directly orindirectly, i.e. using an intermediary. Thesecond panel shows the percentage of
manufacturing firms who use inputs orsupplies of foreign origin.***
The second set of indicators measures theaverage number of days to clear customsfor imports*** and exports. The delay inclearing customs for imports or exportscreates additional costs to the firm, caninterrupt production, interfere with sales,and result in damaged supplies ormerchandise.
The third set of indicators shows thepercent value of exports lost during
transport due to merchandise theft, andbreakage or spoilage, reflecting thetransport risks firms face during the exportprocess.
http://www.enterprisesurveys.org EnterpriseSurveys:BANGLADESH -2013

8/12/2019 Enterprise Survey2013 Bangladesh
http://slidepdf.com/reader/full/enterprise-survey2013-bangladesh 8/15
Regulations, Taxes, andBusiness Licensing
Good economic governance in areas suchas taxation, regulations, and businesslicensing is a fundamental pillar for thecreation of a favorable businessenvironment.
Effective regulations address marketfailures that inhibit productive investmentand reconcile private and public interests.The number of permits and approvals thatbusinesses need to obtain, and the time ittakes to obtain them, are expensive andtime consuming. The existing legislation ofa country also determines the mixed of legalforms private firms take and determines thelevel of protection for investors thusaffecting the incentives to invest.
The Enterprise Surveys provide qualitative
and quantitative measures of taxation,regulations, and business licensing.
The first set of indicators focuses on theefficiency of business licensing and permitservices. The indicators evaluate the delaysfaced when demanding these services.
The second set of indicators firstapproximates the “time tax” imposed byregulations: it measures the time spent bysenior management in meetings with publicofficials. Second, it measures the averagenumber of tax inspections or meetings with
tax inspectors in a given year.
The third indicator shows the relative use ofthe different legal forms in the private sector Most legal forms around the world can beclassified into shareholding companies withshares traded privately or non-traded at all(closed), shareholding companies publiclytraded (open), sole proprietorships,partnerships, and limited partnerships. Aresidual category is included to capturelegal forms not easily classified into theother categories.
http://www.enterprisesurveys.org EnterpriseSurveys:BANGLADESH -2013

8/12/2019 Enterprise Survey2013 Bangladesh
http://slidepdf.com/reader/full/enterprise-survey2013-bangladesh 9/15
Corruption
Corruption by public officials may present amajor administrative and financial burdenon firms. Corruption creates an unfavorablebusiness environment by undermining theoperational efficiency of firms and raisingthe costs and risks associated with doing
business.
Inefficient regulations constrain firmefficiency as they present opportunities forsoliciting bribes where firms are required tomake “unofficial” payments to public officialsto get things done. In many countries bribesare common and quite high and they add tothe bureaucratic costs in obtaining requiredpermits and licenses. They can be a seriousimpediment for firms’ growth anddevelopment.
The first set of indicators measures a
composite index of corruption, the GraftIndex****, that reflects the proportion oftimes a firm was asked or expected to pay abribe when soliciting six different publicservices, permits or licenses.
The second set of indicators identifies theextent to which specific regulatory andadministrative officials require bribepayments during meetings with taxinspectors or in order to secure agovernment contract.
The third set of indicators focuses on bribes
to obtain specific licenses or permits, andshows the share of firms that are expectedto make informal payments to secure importand operating licenses and to obtain aconstruction permit.
http://www.enterprisesurveys.org EnterpriseSurveys:BANGLADESH -2013
8/12/2019 Enterprise Survey2013 Bangladesh
http://slidepdf.com/reader/full/enterprise-survey2013-bangladesh 10/15
Crime and Informality
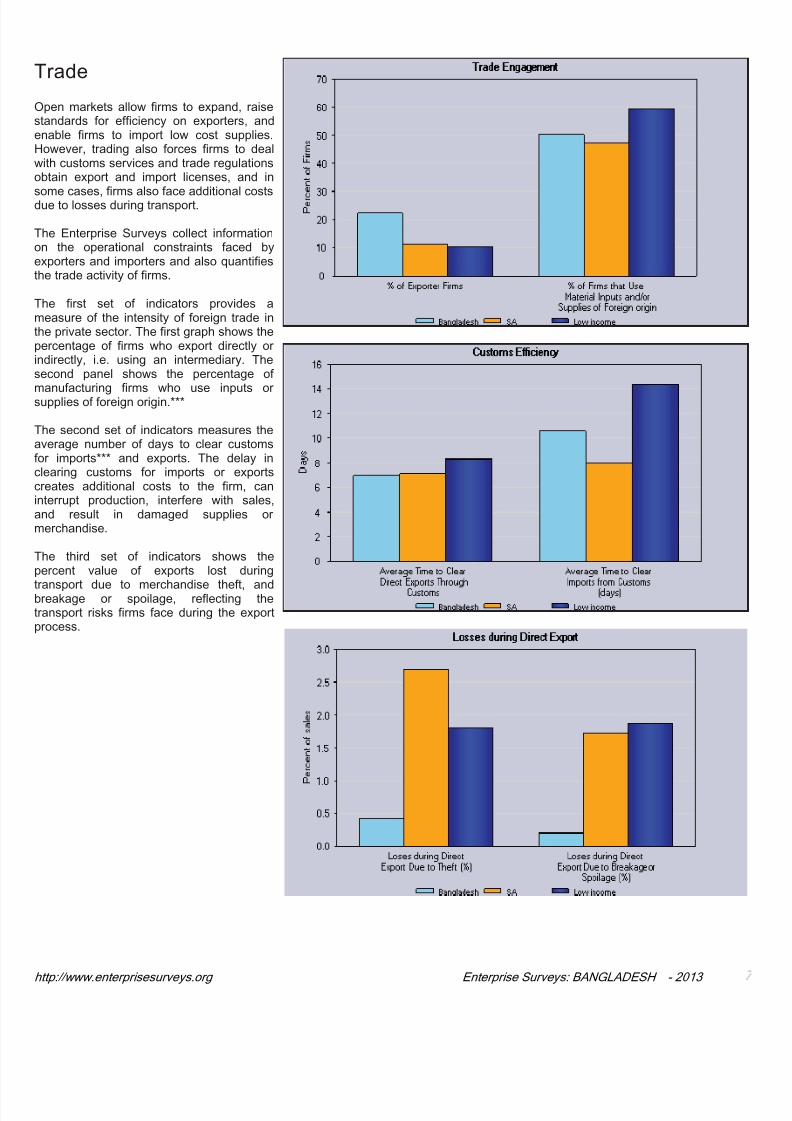
Crime imposes costs on firms when theyare forced to divert resources fromproductive uses to cover security costs.Both foreign and domestic investorsperceive crime as an indication of socialinstability, and crime drives up the cost of
doing business. Also, commercial disputesbetween firms and their clients occurregularly in the course of doing business.Resolving these disputes can bechallenging when legal institutions are weakor non existent.
Similarly, a large informal sector hasserious consequences for the formal privatesector. The informal sector may pose unfaircompetition for formal firms.
The Enterprise Surveys capture keydimensions of the effect of crime on firm
sales, the extent to which entrepreneursidentify courts as fair, and the degree ofinformality in an economy.
The first indicator shows the share of firmsthat recognize the functioning of the courtsas being fair, impartial, and uncorrupted.
The second set of indicators measures thedirect costs of security incurred by firms aswell as their direct losses due to crime.These resources represent an opportunitycost since they could have been invested inproductive activities.
The third set of indicators shows thepercentage of firms that started operationwithout begin formally registered. It is anapproximation to the prevalence ofinformality in the private economy.
http://www.enterprisesurveys.org EnterpriseSurveys:BANGLADESH -2013

8/12/2019 Enterprise Survey2013 Bangladesh
http://slidepdf.com/reader/full/enterprise-survey2013-bangladesh 11/15
Finance
Developed financial markets providepayment services, mobilize deposits, andease investment financing. Efficientfinancial markets reduce the reliance oninternal funds and on money from informalsources such as family and friends by
connecting firms to a broad range of lendersand investors.
The Enterprise Surveys provide indicatorsof how firms finance their operations and ofthe characteristics of their financialtransactions.
The first set of indicators compares therelative use of various sources to financeinvestment. Excessive reliance on internalfunds is a sign of potentially inefficientfinancial intermediation.
The second set of indicators measures theuse of financial markets by individual firms.It presents the percentage of workingcapital that is financed by external sourcesto the firm, and a measure of the burdenimposed by loan requirements measured bycollateral levels relative to the value of theloans.
The third set of indicators focuses on theuse of financial services by private firmsboth on the credit side, by measuring thepercentage of firms with bank loans or linesor credit, and on the deposit mobilization
side, by measuring the percentage of firmswith checking or savings accounts.
http://www.enterprisesurveys.org EnterpriseSurveys:BANGLADESH -2013
8/12/2019 Enterprise Survey2013 Bangladesh
http://slidepdf.com/reader/full/enterprise-survey2013-bangladesh 12/15
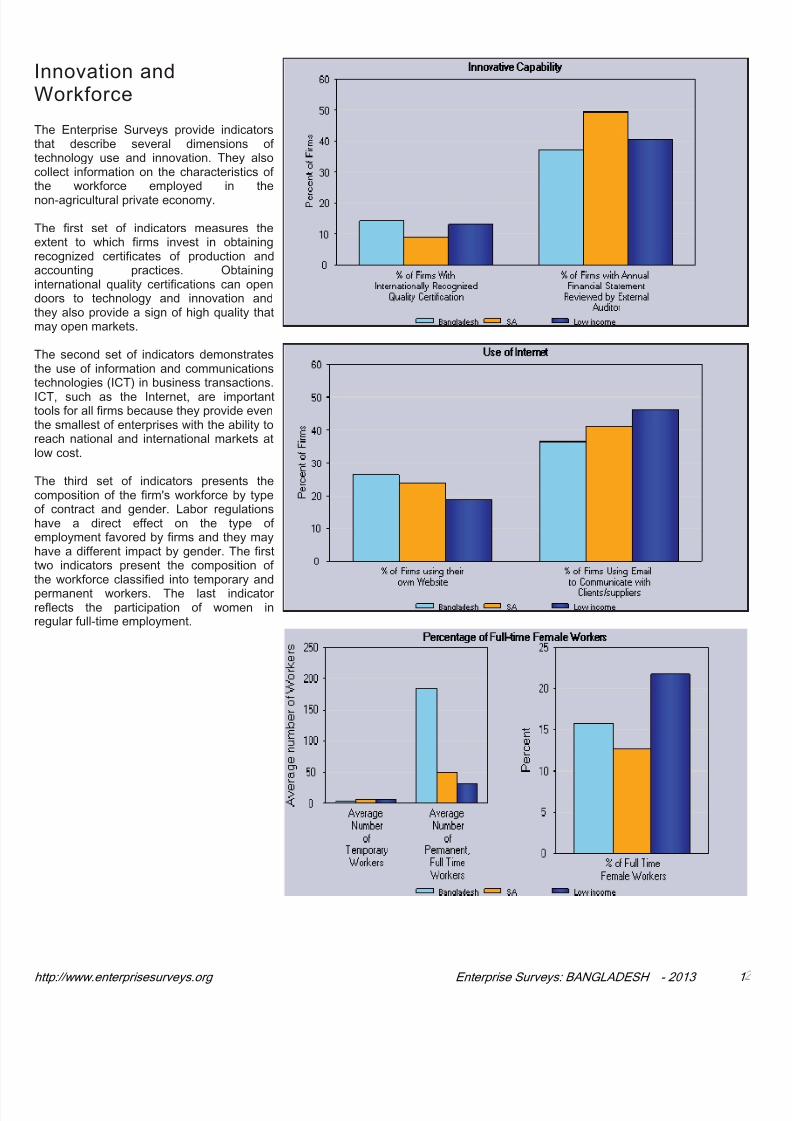
Innovation andWorkforce
The Enterprise Surveys provide indicatorsthat describe several dimensions oftechnology use and innovation. They alsocollect information on the characteristics ofthe workforce employed in the
non-agricultural private economy.
The first set of indicators measures theextent to which firms invest in obtainingrecognized certificates of production andaccounting practices. Obtaininginternational quality certifications can opendoors to technology and innovation andthey also provide a sign of high quality thatmay open markets.
The second set of indicators demonstratesthe use of information and communicationstechnologies (ICT) in business transactions.
ICT, such as the Internet, are importanttools for all firms because they provide eventhe smallest of enterprises with the ability toreach national and international markets atlow cost.
The third set of indicators presents thecomposition of the firm's workforce by typeof contract and gender. Labor regulationshave a direct effect on the type ofemployment favored by firms and they mayhave a different impact by gender. The firsttwo indicators present the composition ofthe workforce classified into temporary and
permanent workers. The last indicatorreflects the participation of women inregular full-time employment.
http://www.enterprisesurveys.org EnterpriseSurveys:BANGLADESH -2013

8/12/2019 Enterprise Survey2013 Bangladesh
http://slidepdf.com/reader/full/enterprise-survey2013-bangladesh 13/15
Summary of Enterprise Survey IndicatorsSouth Asia Low
incomeBangladesh Small Firms(1-19Employees)
MediumFirms(20-99Employees)
LargeFirms (100+Employees)
Corruption Indicators
Incidence of Graft index53.4 33.7 44.7 69.4 25.7 23.4
% of Firms Expected to Give Gifts In Meetings With Tax Inspectors 41.0 30.1 49.7 46.1 24.9 23.8
% of Firms Expected to Give Gifts to Secure a Government Contract 35.5 37.0 21.7 54.3 28.2 38.5
% of Firms Expected to Give Gifts to Get a Construction Permit 54.6 73.8 58.6 48.3 24.7 33.9
% of Firms Expected to Give Gifts to Get an Import License 77.2 19.8 72.3 85.9 23.8 22.7
% of Firms Expected to Give Gifts to Get an Operating License 58.0 47.8 45.4 73.3 19.9 26.2
Regulations, Taxes, and Busi ness Licensing Indicators
Days to Obtain Import License 10.1 18.1 44.8 2.1 12.7 16.0
Days to Obtain Construction-related Permit 53.4 78.2 50.6 48.7 45.8 56.3
Days to Obtain Operating License 33.5 23.2 81.8 9.8 17.2 21.2
Senior Management Time Spent in Dealing with Requirements of Government
Regulation (%)
3.3 1.9 3.0 5.6 5.2 8.0
Average number of visits or required meetings with tax officials. 1.9 1.9 1.4 2.3 1.5 2.5
Open Shareholding Company (%) 0.8 0.1 0.7 2.0 1.3 2.9
Closed Shareholding Company (%) 10.2 1.2 6.9 27.1 10.8 20.6
Sole Proprietorship (%) 65.0 79.9 75.9 29.4 72.1 56.3
Partnership (%) 23.6 18.7 15.8 40.9 13.2 9.6
Limited Partnership (%) 0.4 0.0 0.7 0.5 2.4 8.6
Other (%) 0.0 0.0 0.0 0.0 0.1 1.7
Average Firm Indi cators
Age (years) 18.5 18.9 17.8 19.0 16.3 13.2
% of Firms With Female Top Manager 4.8 3.6 2.7 9.4 7.9 14.9
% of Firms With Female Participation in Ownership 12.7 6.9 7.9 26.9 16.9 32.7
Private Domestic (%) 98.4 99.5 99.2 95.7 97.4 87.2
Private Foreign (%) 1.5 0.4 0.8 4.2 2.1 10.4
Government/State (%) 0.1 0.2 0.0 0.0 0.3 0.6
Other (%) 0.0 0.0 0.0 0.0 0.3 1.7
Finance Indicators
Internal Finance for Investment (%) 74.5 76.2 74.3 73.8 70.6 80.3
Bank Finance for Investment (%) 12.4 10.3 10.4 15.4 18.3 8.1
Trade Credit Financing for Investment (%) 1.8 2.0 2.3 1.1 1.2 3.2
Equity, Sale of Stock For Investment (%) 7.2 5.0 7.3 8.5 5.6 3.4
Other Financing for Investment (%) 4.1 6.5 5.7 1.2 4.3 5.0
Working Capital External Financing (%) 19.9 17.3 17.5 26.9 23.0 22.7
Value of Collateral Needed for a Loan (% of the Loan Amount) 271.1 291.4 290.6 236.5 238.9 185.4
% of Firms With Bank Loans/line of Credit 34.1 27.5 33.6 44.4 30.0 21.8
% of Firms With a Checking or Savings Account 86.4 70.5 93.7 98.9 82.0 82.8
http://www.enterprisesurveys.org EnterpriseSurveys:BANGLADESH -2013

8/12/2019 Enterprise Survey2013 Bangladesh
http://slidepdf.com/reader/full/enterprise-survey2013-bangladesh 14/15
Summary of Enterprise Survey IndicatorsSouth Asia Low
incomeBangladesh Small Firms(1-19Employees)
MediumFirms(20-99Employees)
LargeFirms (100+Employees)
Infrastructure Indicators
Number of Power Outages in a Typical Month 64.5 64.6 73.1 53.0 20.8 11.7
Value Lost Due to Power Outages (% of Sales) 3.7 4.8 3.2 2.8 4.9 5.6
Number of Water Shortages in a Typical Month*** 13.6 15.2 18.7 9.0 4.8 2.6
Average Duration of the Water Shortage (hours)*** 1.8 1.6 1.7 2.1 2.0 2.5
Delay in Obtaining an Electrical Connection 84.7 40.4 78.5 103.5 52.5 38.4
Delay in Obtaining a Water Connections 51.7 82.6 28.4 46.0 85.2 35.0
Delay in Obtaining a Mainline Telephone Connection N/A N/A N/A N/A 11.8 29.5
Trade Indicators
% of Exporter Firms 22.4 2.4 8.2 69.4 11.2 10.5
% of Firms that Use Material Inputs and/or Supplies of Foreign origin*** 50.3 31.7 43.9 71.7 47.4 59.5
Average Time to Clear Direct Exports Through Customs 7.0 5.1 5.9 7.1 7.1 8.3
Average Time to Clear Imports from Customs (days) *** 10.6 14.4 11.3 10.3 8.0 14.4
Loses during Direct Export Due to Theft (%) 0.4 0.4 0.2 0.4 2.7 1.8
Loses during Direct Export Due to Breakage or Spoilage (%) 0.2 0.0 0.7 0.2 1.7 1.9
Crime and Informality Indicators
% of Firms Believing the Court System is Fair, Impartial and Uncorrupted 20.3 24.0 18.9 16.9 42.9 43.6
Security Costs (% of Sales) 1.5 1.7 1.9 0.5 1.2 1.8
Losses Due to Theft, Robbery, Vandalism, and Arson Against the Firm (% of Sales) 0.3 0.5 0.3 0.0 0.7 1.3
% of Firms Formally Registered when Started Operations in the Country 86.0 78.3 87.6 94.4 88.1 85.9
Innovation and Workforce Indicators
% of Firms With Internationally Recognized Quality Certification 14.3 4.9 9.2 34.6 9.2 13.1
% of Firms with Annual Financial Statement Reviewed by External Auditor 37.2 20.6 25.8 75.7 49.4 40.7
% of Firms using their own Website 26.3 6.0 14.3 70.7 23.6 18.9
% of Firms Using Email to Communicate with Clients/suppliers 36.6 12.0 25.2 86.0 41.2 46.2
Average Number of Temporary Workers 3.3 1.1 2.3 8.0 6.6 6.3
Average Number of Permanent, Full Time Workers 184.0 11.1 37.0 6 29.3 51.0 3 1.9
% of Full Time Female Workers 15.8 5.2 8.0 41.4 12.7 21.8
* The sample for each country is stratified by industry, firm size, and geographic region. The level of detail of the stratif ication by industry depends on the size of the economy. Stratifi cation size follows the three levels presented in the text: small, medium, and large. Regional stratification includes the main economic regions in each country. Through this methodology estimatefor the different stratification levels can be calculated on a separate basis while, at the same time, inferences can be made for the non-agricultural private economy as a whole. For modetails on the sampling strategy, review the Sampling Note available at www.enterprisesurveys.org .** Regional and income group indicators are calculated as the averages of country-level indicators in the respective region and income group using country data available at the time publication.*** These indicators are computed only for the manufacturing sector.**** The Graft Index is the proportion of instances in which firms were either expected or requested to pay a gift or informal payment when applying for six different public services.***** SA-South Asia
Notes:
http://www.enterprisesurveys.org EnterpriseSurveys:BANGLADESH -2013

8/12/2019 Enterprise Survey2013 Bangladesh
http://slidepdf.com/reader/full/enterprise-survey2013-bangladesh 15/15
© 2011 The International Bank for Reconstruction and Development / The World Bank
1818 H Street NW
Washington, DC 20433
Enterprise Analysis Unit (GIAEA)
MSN-F4P-400
Fax: 001 202-522-2029
Telephone 202-473-1000
Internet :
e-mail :
All rights reserved.
Updated December, 2013
A co-publication of the World Bank and the International Finance Corporation.
This volume is a product of the staff of the World Bank Group. The findings, interpretations and conclusions expressed in this
volume do not necessarily reflect the views of the Executive Directors of The World Bank or the governments they represent.
The World Bank Group does not guarantee the accuracy of the data included in this work.
Rights and Permissions
The material in this publication is copyrighted. Copying and/or transmitting portions or all of this work without permission may
be a violation of applicable law. The World Bank Group encourages dissemination of its work and will normally grant
permission to reproduce portions of the work promptly. For permission to photocopy or reprint any part of this work, please
send a request with complete information to the Copyright Clearance Center Inc., 222 Rosewood Drive, Danvers, MA 01923,
USA; telephone: 978-750-8400; fax: 978-750-4470; Internet:
www.enterprisesurveys.org
www.copyright.com