Embed Size (px)
Citation preview

RIV000128 Submitted: October 11, 2012
United States Nuclear Regulatory Commission Official Hearing Exhibit
In the Matter of: Entergy Nuclear Operations, Inc. (Indian Point Nuclear Generating Units 2 and 3)
ASLBP #: 07-858-03-LR-BD01 Docket #: 05000247 | 05000286 Exhibit #: Identified: Admitted: Withdrawn: Rejected: Stricken:
Other:
RIV000128-00-BD01 10/15/201210/15/2012
Rand A. KATRIB
lted to the formation of a eU(II) .cal composition. This produces a strongly adherent to the surface. lcceptable performance and a high :entrations which is not affected by covered by a complex in which the
).
~89 (1971).
1973).
I). I. 11. Phenom. 10,79 (1977) . . eleCfroanai. Chem. 125,321 (1981).
electron Spectrosc. Relal. Phenom. 31,317
0010-938X186 $3.00 + 0.00 Pergamon Journals Ltd.
THE USE OF A CORROSION PROCESS TO OBTAIN MASS TRANSFER DATA
BRYAN POULSON* and RUSSEL ROBINSON*
NEI Nuclear Systems Ltd., Saltmeadows Road, Gateshead, Tyne and Wear, U.K.
W;: Ab~tr~lct--A new technique for measuring mass transfer coefficients has been developed and tested. The corroding copper specimens in dilute hydrochloric acid containing ferric ions. In this
corrosion rate is controlled by the arrival of ferric ions at the copper surface where they are to ferrous ions, the anodic reaction being the dissolution of copper in a monovalent state as a
I.> chlofI<le complex. This has been tested with a number of specimens including some having a 1 ·.·.vafyin!~ masstra.nsl'erprc,file In all cases the data generated were close to that predicted from the available
INTRODUCTION
~·.···T{"NTlrTA·rT()N.C;: where a reaction is controlled by diffusion its rate is related to the ~",cohcerltnlti(m driving force (~C) and the mass transfer coefficient (K) as shown in
1. Relationships between K and other hydrodynamic parameters are expressed '~;'irrt~rms of non-dimensional groups as outlined in Table 1. It is important to know
overall and local values of the mass transfer coefficients. These can be ri'(ibt:aitled in a number of ways. For relatively simple geometries, such as the rotating
!ise" theOl'etical solutions· have been available for some time; indeed these preceded !*pf:nnllerltal confirmation. More recently2 analytical solutions have been obtained
1;/;·'dFl\r lml"l'rp complicated geometries. Mass transfer coefficients are usually determined
TABLE 1. RELATIONSHIPS BETWEEN HYDRODYNAMIC PARAMETERS
dC Rate = (D + e) dZ
= KdC
Sh =f(ReSc)
K =!!... a RexScY
d
Sherwood No. = Sh = Kd D
Reynolds No. = Re = Vd v
Schmidt No. = Sc = vlD
Usually Sh = a ReXSc)'
Rate = !!... a RexScY dC d
d is the tube diameter, K is the mass transfer coefficient, D is the diffusivity of the relevant species, V is the velocity, v is the kinematic viscosity, e is the turbulent eddy diffusivity, dC is the concentration driving force between the surface and the bulk, y is usually 113 and x varies between 0.5 and 1 for most geometries, dCldZ is the concentration gradient.
Present address: International Research and Development Co. Ltd., Fossway, Newcastle upon U.K.
lYl1mu:;criot received 17 June 1985; in amended form 5 November 1985.
265
266 BRYAN POULSON and RUSSEL ROBINSON
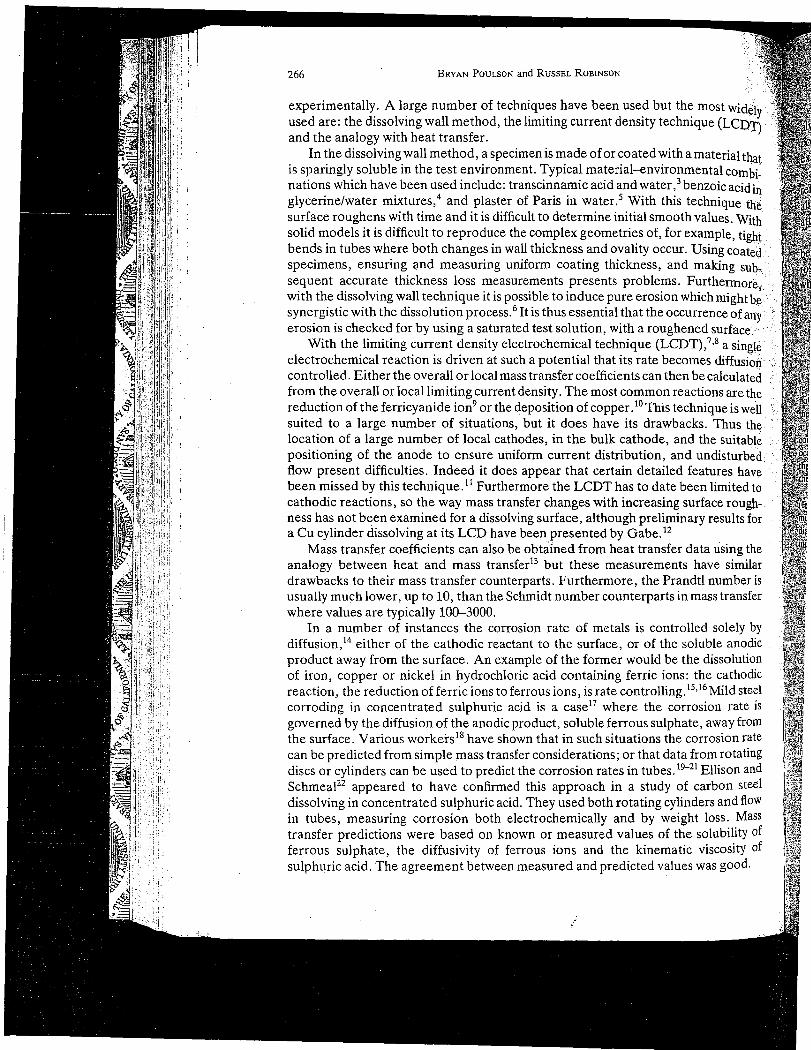
experimentally. A large number of techniques have been used but the most widdy used are: the dissolving wall method, the limiting current density technique (LCDT) . and the analogy with heat transfer.
In the dissolving wall method, a specimen is made of or coated with a material that is sparingly soluble in the test environment. Typical material-environmental combi~ nations which have been used include: transcinnamic acid and water, 3 benzoic acid in glycerine/water mixtures,4 and plaster of Paris in water.5 With this technique the surface roughens with time and it is difficult to determine initial smooth values. With solid models it is difficult to reproduce the complex geometries of, for example, tight bends in tubes where both changes in wall thickness and ovality occur. Using coated specimens, ensuring ;;Lnd measuring uniform coating thickness, and making sub- . sequent accurate thickness loss measurements presents problems. Furthermore .. with the dissolving wall technique it is possible to induce pure erosion which mightb~ synergistic with the dissolution process. 6 It is thus essential that the occurrence of any erosion is checked for by using a saturated test solution, with a roughened surface.
With the limiting current density electrochemical technique (LCDT)/·8 a single electrochemical reaction is driven at such a potential that its rate becomes diffusion controlled. Either the overall or local mass transfer coefficients can then be calculated from the overall or local limiting current density. The most common reactions are the reduction of the ferricyanide ion9 or the deposition of copper .10 This technique is well suited to a large number of situations, but it does have its drawbacks. Thus the location of a large number of local cathodes, in the bulk cathode, and the suitable positioning of the anode to ensure uniform current distribution, and undisturbed flow present difficulties. Indeed it does appear that certain detailed features have been missed by this technique. 11 Furthermore the LCDT has to date been limited to cathodic reactions, so the way mass transfer changes with increasing surface roughness has not been examined for a dissolving surface, although preliminary results for a Cu cylinder dissolving at its LCD have been presented by Gabe. 12
Mass transfer coefficients can also be obtaIned from heat transfer data using the analogy between heat and mass transfer13 but these measurements have similar drawbacks to their mass transfer counterparts. Furthermore, the Prandtl number is usually much lower, up to 10, than the Schmidt number counterparts in mass transfer where values are typically 100-3000.
In a number of instances the corrosion rate of metals is controlled solely by diffusion,14 either of the cathodic reactant to the surface, or of the soluble anodic product away from the surface. An example of the former would be the dissolution of iron, copper or nickel in hydrochloric acid containing ferric ions: the cathodic reaction., the reduction of ferric ions to ferrous ions, is rate controlling. 15. 16 Mild steel corroding in concentrated sulphuric acid is a case17 where the corrosion rate is governed by the diffusion of the anodic product, soluble ferrous sulphate, away from the surface. Various workers18 have shown that in such situations the corrosion rate can be predicted from simple mass transfer considerations; or that data from rotating discs or cylinders can be used to predict the corrosion rates in tubes. 19-21 Ellison and Schmeal22 appeared to have confirmed this approach in a study of carbon steel dissolving in concentrated sulphuric acid. They used both rotating cylinders and flow in tubes, measuring corrosion both electrochemically and by weight loss. Mass transfer predictions were based on known or measured values of the solubility of ferrous sulphate, the diffusivity of ferrous ions and the kinematic viscosity of sulph~ric acid. The agreement between measured and predicted values was good.

j but the most widel ty technique (LCD~
~d with a material that :nvironmental combi. vater,3 benzoic acid in th this technique the I smooth values. With of, for example, tight y occur. Using Coated ~ss, and making sub. blems. Furthermore rosion which might b~ the occurrence of any roughened surface .
. e (LCDT) Y a single lte becomes diffusion can then be calculated mon reactions are the This technique is well drawbacks. Thus the ode, and the suitable ion, and undisturbed .etailed features have ::> date been limited to 'easing surface rough· )reliminary results for Ibe. 12
ransfer data using the rements have similar the Prandtl number is rparts in mass transfer
; controlled solely by of the soluble anodic uld be the dissolution ric ions: the cathodic ~rolling.15.16 Mild steel the corrosion rate is s sulphate, away from ::ms the corrosion rate hat data from rotating tubes. 19-21 Ellison and ;tudy of carbon steel :ing cylinders and flow by weight loss. Mass es of the solubility of inematic viscosity of ~d values was good.
The use of a corrosion process to obtain mass transfer data 267
. There are a number of pieces of evidence that such a simple approach does not work, especially for geometries where the mass transfer is non-uniform,
leading to effects based on separation of anodic and cathodic areas. For La Que23 showed that the response of rotating iron and copper alloy discs in
water was radically different. In the case of iron discs the outer region tended to unattacked while the centre corroded (differential aeration); with the copper
the centre remained relatively un attacked with the outer regions being due to increased mass transfer and/or turbulence there. · .. ·.,aual;l\.v'u'
Bignold et al. 24 examined the erosion-corrosion rate of carbon steel in pure water . between 100 and 180°C using an orifice geometry. It was found that the erosion-corro~ion rate varied in proportion to the mass transfer coefficient raised to a power whith varied between 1 and 3, depending on the pH and temperature.
. This paper describes corrosion tests carried out to examine the feasibility of using a corrosion process to determine overall and local mass transfer coefficients,
.. especially on geometries where this is non-uniform.
EXPERIMENTAL METHOD '~>:Analysis and forms of the experimental materials are given in Table 2. All solutions were made from " .• ; reagent grade chemicals and de-ionized water. Testing was performed in a polyvinyliden fluoride (PVDF)
'flow loop. 11 17.5 I of the test solution was premixed in the 20 I glass-reinforced PVDF tank and brought to tbe right conditions in the bypass circuit. The solution was then circulated through the test specimen using irPVDF centrifugal pump with a HastaIIoy C shaft. The exposure times were chosen to ensure that the cQncentration of the ferric ion remained approximately constant and that an equal amount of dissolution ~ccurred under each flow condition. Average ferric concentrations during the test were calculated from tbeinitial values and the metal loss data. The flow rates were measured using calibrated rotameters, and th~ temperature was controlled to ±0.25°C.
•. ' •. Hydrodynamic entry lengths of either 36 or 52 tube diameters preceded these orifice type specimens (Fig. 5). No significant difference between these two conditions could be found. These entry lengths are
I.: . much greater than those recommended by Ross2S and the longer length is only slightly less than the 56 tube , .. diameters recommended in BS 1042,26 for flow measuring orifices. The impinging jet electrode test cell ('- included both large, small and multihole jets. ", 'A number of different measuring techniques were used to monitor specimen dimensional changes, (,'including the following. j' (a) Digital bore measuring equipment (Dia-test) utilizing a curved measuring head and cone to convert
, .radial to longitudinal motion which is measured by a linear transducer. Resolution is 1 /Lm on a smooth " .,.surface but repeatability on a rough surface is limited by the precision to which the head can be positioned ";<;down the tube (±0.25 mm). , '(b) Digital micrometer (Moore and Wright) resolution l/Lm. f" (c) Metallographic examination using both optical and scanning electron microscopy fqr local ". : dimensional changes and surface morphology. r (d) Weight loss. :." The value of the diffusion coefficient of ferric ion in 0.1 N HCI at 50°C was estimated to be 1.2 x 10⁻⁵
i,.':} cm2 S-I. This is the lower range of values measured by Case27 for ferrous ion diffusion in 0.1 N HCI, which
I' .... '.:.?silrprisingly , the evidence38 suggests is similar to ferric ion diffusio.n: it is higher than the value extrapolated !, from Russian work l9 using Wilkes rule. (Diffusion coefficient x dynamic viscosity/absolute temperature :.,.i,s a constant which gives 0.85 x 10⁻⁵ cm2 S-I). The kinematic viscosity of 0.1 N HCI containing2 g I-I ferric I ':ion added as FeCI3 was on the basis of available evidence taken to be 0.005534 cm2 S-I at 50°C, i.e. that of ," ''water.
I.' I. .'-c-ar-b-on-s-te-e-I:-l-"-o-.d-.-~,-, i-.d-.-tu-b-e-----0-~-1----0-~:-·7----;-.5-:----0.-:-I----0-.S-02
TABLE 2. ANALYSIS OF EXPERIMENTAL MATERIALS (wt %)
1\ COpper: I" o.d. n.d. tube Cu Fe 99.9 0.1

268
30
~
" 0 ~
20 E :0..,
UJ
< C!
Z 0 iii 0 C! C! 0 U
BRYAN POULSON and RUSSEL ROBINSON
Re
027309
613540
" 6BBB
Enhancement meosurod predicted
12 4-6
4 S'2
1·3 S·B
FIG. 1. Corrosion rate profiles of carbon steel specimens downstream of an orifice testedin oxygenated D.l N HCI + 1 M NaCI at 5DoC.
EXPERIMENTAL RESULTS
Initial tests using the orifice geometry A number of tests were carried out on steel specimens corroding in
oxygenated acidified 1 M NaCI orO.1 N HCI containing2gl-1 ferric ion both since previous work had suggested diffusion control in these systems. An
~ 300 lQi>~ ~ I q E ~"' ~ ::0.., ;{ ". ' w j ~ b\ I- :, ~ 6 ..: " \' a: -c?' -\\
2OO.-;l • b
Q ~1 ~~\ ~. : o 01 \ a: .q C! \\
8 '\ ~".
100 \ ". COPPER (, '. ~ \ ...... ~ ... ~ ... \ --.... - .......... -........ -.... -b\7""l ST1EEL I
0~-+--~~--+-~5~~6~~7~~e~~9~~1~0~11~~12~~
DISTANCE IN TUBE DIAMETERS
FIG. 2. Corrosion rate profiles downstream of an orifice after testing in 0.1 N HCI initially-containg2 g I-I Fe3+ at Re of27 3D9 and dido of2.67, not corrected for different average Cs.
z Q
_til o
1
20
IS
~ SI o U
mass tran --lhitial test result
shown in Fig. 2. J
IIeCllCl:ea enhancerr of the peak bl seems entire

.....
1-0
13
1 of an orifice tested
; corroding in either erric ion both at 50°C, ~ systems. An orifice
.n 0.1 N HCl initially fferent average Cs:
FIG. 4.
The use of a corrosion process to obtain mass transfer data
2OOr-----------------------------------,
Re
Corrosion rate profile downstream of an orifice, copper specimens tested in acid ferric chloride solution at 50°C.
269
'geometry was used because its mass transfer characteristics are well defined and . " rion-uniform.
, .. '.: .•. ' ....•. : Results for the oxygenated acidified NaCI solution are shown in Fig. 1. The
""profiles are interesting in that the peak rates downstream of the orifice appear to be 'c,:ontrolled by diffusion since the peak rates increase as the Reynolds number is raised
(to the power of 0.70r 0.8. Further downstream the rates of dissolution decrease with 1 >:increasing flow rate, and this was an unexpected result. This causes the enhancement
(i.e. the ratio of peak loss rate to the downstream asymptotic rate) to increase with ~'. ':, .> increasing velocity which is exactly the opposite of mass transfer predictions. 11 It
must be concluded that this metal environment combination is unsuitable for '.'',.:.:> I,;' producing mass transfer data. .' Initial test results for both copper and steel specimens in the acid FeCI3 solution r~,are shown in Fig. 2. Again it is clear that iron is not suitable, since a much higher than '.-c.:
i;'~' ,c~_predicted enhancement factor is produced, apparently by iron dissolution down-!c . stream of the peak being inhibited in some way. However, as shown in the discussion, ,copper seems entirely suitable since it produces an enhancement factor, profile and
actual rates in accord with mass transfer predictions. The morphology of the I,', .dissolution of the two metals was notably different (Fig. 3) with copper being
smoother and more crystallographic than the steel which was rougher, with some evidence of the drawing process influencing the attack.
The effect offlow velocity on corrosion downstream of an orifice The effect of flow velocity (0.035-1.18 m S-I) on corrosion downstream of an
orifice was examined. Typical corrosion rate profiles are shown in Fig. 4. Clearly the corrosion rate reaches a peak at about two tube diameters downstream of the orifice then slowly decays to what is probably close to the fully· developed turbulent flow by

270 BRYAN POULSON and RUSSEL ROBINSON
=i]f-.--=-f],"'76mm 12·7mm
10 ·1 VELOCITY m/s
kcm/s 1
FIG. 5. Correlation of peak corrosion rate following an orifice and orifice Reynolds number, for copper specimens tested in acid ferric chloride solution at 50°C.
the end of the specimen. In general the specimen did not develop roughening although scallops (shallow smooth craters) did develop on some mens tested at the higher Reynolds numbers after prolonged exposure especiallyin the region of highest mass transfer.
It was assumed that the corrosion rate was equal to the limiting current ferric ion reduction and, substituting in Faraday's law, the rate of ferric ion re(lU(;tlC)fl is given by:
f F ~+ d . f C . Cd' at. wt of Fe rate 0 e' re uctlOn = rate 0 u corrosIOn x u enslty x -----at. wt of eu
The mass transfer coefficient could then be obtained as well as the Sherwood" number. Figures 5 and 6 show the measured and derived quantities and their' variation with velocity for both peak and fully developed flow. The correlation
10
UJ
~ 0:: 10
z o ~ 0:: 0::
8
o
o 0/ kcm/s
/ ShooO" Rt'S,'
o r :·982
01
/ ·1
VELOCITY m/s
FIG. 6. Correlation of fully developed corrosion rate with Reynolds number for copper specimens tested in acid ferric chloride solution at 50°C.

10
kcm/s 1
Hifke Reynolds I at SO°c.
velop pronounced lop on some speci)osure especially in
~ current density for ferric ion reduction
x _a_t._w_t ,-o_f _F_e at. wt of Cu
I as the Sherwood uantities and theIr. w. The correlation
kcm/s
01
lumber for copper

FIG. 10. Attack produced by small jet on 25.5 mm dia. copper specimens using acid ferric chloride solutions. (a) and (b) Cross section and surface morphology at a Re of 49 000. (c) Surface morphology at Res between 15000 and 25 000. (d) Surface morphology below aRe
of 15000.

ecimens using acid ferric )gy at a Re of 49 DOn. (c) morphology below a Re
The use of a corrosion process to obtain mass transfer data
r· ·99 o 50
~ 40 o
FERRIC ION CONCENTRATION gm/t
FIG. 7. Effect of ferric ion concentration on corrosion rate of copper; large jet impinging on 25.4 mm dia. specimen at a Re of 10 000.
273
~i;;requations for the two situations were then obtained assuming a dependency on Sc 113
L,~s is usual; the equations were: i"; Sh peak = 0.286 ReO.65 SCO.33
~" Sh fully developed = 0.026 ReO.S2 SCO.33 .
. Enhancement factors, i.e. the ratio of peak to fully developed rates were also f6btained~ after much longer exposure times, when the concentration of ferric ions had been reduced significantly.
,;;The effect of concentration driving force and reactions involved C", The effect of ferric ion concentration on the corrosion of copper in 0.1 N HCI at
i:>'SO°C was ~xamined using the large diameter imI;'inging jet at a ~eynolds numbe~ of
/' ;\10000. ThIS geometry was used because the specImens are very sImple, the corrosIOn -is uniform thereby allowing weight loss measurement and finally because the ,concentration driving force will stay constant as a result of the small amount of metal loss. Average corrosion rates are plotted against ferric ion concentration in Fig. 7.
; Clearly there is no corrosion without ferric ions present and the rate is proportional up to a concentration of 2 g 1-1 which was the level used in this work.
To find if copper was dissolving as a monovalent or a divalent species static tests were performed in which copper was potentiostatically held in 0.1 N HCI at the potential at which it dissolved in the ferric containing solution. In all cases a Faradaic comparison of weight loss and total ~harge passed, i.e.
I () at. weight x charge passed (C)
wt oss g = ----~--~~~~--~~~~~---=~~--~=_ number of electrons involved (n) x Faraday (F)
indicating a value of n within 10% of 1, i.e. copper was dissolving as a monovalent ion in agreement with other workers. 28.29'
The effect of velocity using large impinging jet The effect of flow velocity on corrosion was examined using this geometry
because it causes uniform corrosion under laminar flow where the mass transfer rate is dependent on the square root of the Reynolds number. Velocities in the range 0.075 to 2.5 m S-I were examined, the results obtained are shown in Fig. 8. In this and other jet experiments it was the jet diameter that was used to calculate both Re and

274
Sh la
1~
BRYAN POULSON and RUSSEL ROBINSON
Re
UJ
~100
13m=m==~ q~5'~ z ~ ~ 0:::
8
10L-~--~~~.+I---L-L~LU~--~~-LLL~,
VELOCITY m/s
kem/s 1
FIG. 8. Correlation curve for large jet impinging onto 25.4 mm dia. copper specimens tested in acid ferric chloride solution at 50°C.
Sh. It was noted in these tests that the surface did not roughen and actually appeared smoother after testing. The equation correlating mass transfer and Reynolds number was:
Sh = 0.72 Reo.507 SCO. 33 .
The effect of velocity using a multi jet nozzle This was examined because we wanted to look at a geometry which was uniformly
highly turbulent and which had a known mass trarisfer dependency. Velocities over the range 0.1-7 m S-1 were used.
Attack on the specimen was fairly uniform but some effect of jet interaction, leading to surface roughening, could be seen. The results are shown in Fig. 9 and the correlation equation obtained is:
10
UJ
'<i: 0:::
z o gj 0::: 0::: o U
Sh = 0.195 Reo.65 SCO.33 •
Re
100
VELOCITY m/s
FIG. 9. Correlation curve for multihole turbulent jet impinging onto 12.7 mm dia. copper specimens teste!1 in acid ferric chloride solution at 50°C.

k em/s' 1
L copper specimens
and actually appeared and Reynolds number
y which was uniformly lency. Velocities over
~ct of jet interaction, lown in Fig. 9 and the
~.7 mm dia. copper
The use of a corrosion process to obtain mass transfer data 275
Tests using a single small jet A limited number of tests were performed using a 3 mm dia. jet impinging onto a
25.4 mm dia. specimen at a distance of 3 mm. These tests were carried out to see if the corrosion profile mirrored the known mass transfer profile. A cross section through a specimen tested at high Reynolds number is shown in Fig. lOa. The pattern of attack was similar in all cases but clear trends depending on the Reynolds number were noted: relatively uniform attack with little surface roughening up to 3 mm from the centre, a peak in the corrosion rate between 4 and 5 mm from the centre, the
. relative magnitude of which increased with Reynolds number, and finally a region of "<slowly decaying attack with radial distance. Above a Re of approx. 25000 small
scallops developed everywhere except the central region (Fig. lOb). Between values of Re 15000-25000 larger craters developed. In the region of peak mass transfer
,(Fig. 10c) below a Re of 15000 no scallops developed, only radial flow lines .. (Fig. lOd). On some specimens the central region appeared to be undercut by the
neVGIU'!-'U'F, peak.
DISCUSSION
There are a number of criteria, both qualitative and quantitative, which need to .' be satisfied before a corrosion reaction can be said to be simply dependent on the rate ,of mass transfer. These are:
1. The corrosion rate should be proportional to the concentration driving force (aC) and bezero when this is zero, i.e. no cathodic reactant or a saturated solution.
j " 2. For a reaction that is controlled by the rate of the cathodic reduction the rate . should be independent of the metal (with due allowance for the differences in atomic weight, density and the number of electrons involved in the transfer). .
3. The corrosion rate profile should be similar to the mass transfer profile. 4. Peaks, plateaux and enhancement factors should be the correct function of the
Reynolds number. 5. Actual corrosion rates should be close to those predicted from reliable existing
mass transfer correlations. From the practical viewpoint it would be desirable for the concentration driving
force to be constant or easily measurable, that the chemicals involved should be relatively benign and that production components, e.g. mild or low alloy steels, could be tested. Unfortunately steel in either ferric or oxygenated acid chloride solutions behaved anomalously and was thus rejected, but is nevertheless worthy of mechanistic interest. Mild steel in sulphuric acid remains a possibility, but has so far been rejected on the basis of the hazards involved in handling large quantities of concentrated sulphuric acid.
Copper corroding in acid ferric chloride solutions appears to corrode in accordance with mass transfer expectations. Before examining in detail the criteria to test this it is appropriate to review briefly the available mass transfer data of the specimens used in this investigation. These have recently been reviewed in detail. 11
For the case of fully developed turbulent flow in a straight pipe there is a large choice of correlations. The best known is the Chilton-Colburn analogy30 with heat transfer:
Shfd = 0.023 Reo.8 SeO.33 .
Probably the most detailed experimentai study of mass transfer is by Berger and Hue3
! using the LCDT. It was suggested that for values of Sc > 10
Shfd = 0.0165 ReO.86 SC°.33.

276
6
5
BRYAN POULSON and RUSSEL ROBINSON
CORRALATION OF CONEY ......... K S doto
USING -TPWdoto
EXPERIMENTAL RESULTS
DISTANCE IN TUBE DIAMETERS
o 0 0
• • • iioooo
FIG. 11. Comparison of degree of enhancement downstream of an orifice with Coney's correlation using the heat transfer data of Krall and Sparrow and the mass transfer data of Tagg, Patrick and Wragg; copper specimen tested in acid ferric chloride solution at 50°C and
a Reynolds number of 27 309.
For the case of an orifice the mass transfer profile downstream is of the form shown in Fig. 11. The peak occurring at approximately two tube diameters downstream has been correlated to the orifice Reynolds number Reo by both heat transfer work (Krall and Sparrow)32 and mass transfer (Tagg, Patrick and Wragg)33, the latter workers· using a nozzle.
Sh peak = 0.27 ReoO.67 Se 1l3.
The degree of enhancement, i.e. how much the peak exceeds the fully developed tube value can be obtained by dividing the peak equation by the Berger and Hue equation, i.e.:
Sh peak _ 0.27 [d J2/3 1 Shfd - 0.0165 d;; ReO. 19 '
i.e. it increases with the degree of restriction and decreasing Reynolds numbers. The actual enhancement profile downstream of the orifice has been described
empirically by Coney. 34 Using the data of Refs 32 and 33 he obtained
::;: = 1 + Ax [1 + Ex (0.0~~O;:O.86 - 21) J where Ax and Ex are empirical constants which vary with distance from the orifice and are given in tabular form in Ref. 11. For single jets impinging vertically on to a specimen at a small nozzle-to-specimen distance the profile is of the type shown in Fig. 12.35 With mUltiple turbulent jets the position is more complicated but there is general agreement35 that .mass transfer is proportional to ReO.66 •
We can now examine the criterion listed previously for determining whether the corrosion reaction, that of copper in acid FeCI3 , is controlled by the rate of mass transfer, in this case of ferric ions to the surface.
Figure 3 shows that copper does not corrode without ferric ions being present and the rate is proportional to ferric ion concentrat.ion when they are present. It should be mentioned that in other circumstances, especially with anodic polarization, the diffusion of copper ions away from the surface can be rate controlling.36 When the
FIG.
a.gteeme ....•. downstn
is close. .. Final
peak fall .• : the mass
•... the carre

G······· .. K 5 doto
-TPWdoto
:SULTS
o 0 0 . . . ~ i ••••
n orifice with Coney's ! mass transfer data of je solution at SO"C and
,m is of the form shown meters downstream has eat transfer work (Krall g)33, the latter workers
ds the fully developed Iy the Berger and Hue
:Zeynolds numbers. ce has been described btained
21)] stance from the orifice 19ing vertically on to a s of the type shown in Implicated but there is ;0
termining whether the :d by the rate of mass
ions being present and are present. It should lodic polarization, the mtrolling. 36 When the
The use of a corrosion process to obtain mass transfer data
600
500
1.00
Sh 300
I I I I (
I // I
/11 -( II
\.1 I I I
wall jet region ¥if x/d> 3. Ko<.Re"
and decays aslxJd)'
central stagnation ,region if x/d < I
/ K"'Re's
124000 7E()()0 34000
L--=J::=:::~~~~~10000 o 4 6 8~~08
DISTANCE (x/d)
Re
FIG. 12. Mass transfer from impinging small jet at small jet-to-specimen distances showing characteristic secondary peaks (Sc = 0.8) (Martin).
277
I data from Fig. 5 and similar results for a Ni specimen were corrected for different /. average concentration driving forces, and for the electrons involved in the reaction,
(
the peak dissolution rates were similar, in agreement with the second criterion. This
.. is in spite of the fact that steel does not fulfill all the criteria for diffusion controlled
mass transfer. \' In Fig. 11 we have plotted a typical set of results for the corrosion enhancement
profile downstream of an orifice against the predicted curve of Coney; the agreement is good. Similarly the complex profiles obtained with a single small diameter jet on a large specimen (Fig. 10) are very similar to the available mass transfer profiles (Fig. 12).
In Table 3 we have compared the Reynolds number dependency obtained for each of the four geometries in this investigation with the available data; again the
I agreement is good. The effect of Reynolds number on the degree of enhancement
'downstream of an orifice is compared to the predicted effect in Fig. 13; again the fit is close.
I Finally, to compare actual corrosion rates with predicted rates we have chosen the
I peak following the orifice, for which if we equate the corrosion rate to the product of ,j the mass transfer rate and the concentration driving force and include factors to get \ the corrosion rate in M-m h- 1
, with D in cm2 s- 1, din em andIlCingcm-3 , weobtain:
r CR (M-m h- I) = 0.276 D (Re )0.67 Se lJ3 xllC x 10000 x 60 x 60 x 63.54.
d v p eLl 55.85

278 BRYAN POULSON and RUSSEL ROBINSON
TABLE 3. OBSERVED AND PREDICTED REYNOLDS NUMBER DEPENDENCY
Geometry
Single large nozzle Multiplejet Peak downstream of orifice Fully developed turbulent tube
Observed (this work)
0.507 0.65 0.65 0.82
Data range"
0.6-0.76 0.6-0.82 0.8-1
Bestvalue
0.5 0.66 0.67 0.86
Predicted and measured corrosion rates are compared in Table 4. There is dearly a systematic overestimation of the corrosion rate by about 12%; but a very high, correlation (r = 0.998) between measured and predicted rates. This suggests that one of the parameters used to estimate the corrosion rate is in error. The most likely candidate is the diffusion coefficient of ferric ions. The corrosion rate is proportional to DO.67 and as outlined earlier the range of rates is between 0.85 and 1.4 x 10⁻⁵ cm2
S-1 but we are checking this as it could clearly lead to errors much larger than we have found. A different value of D would also lead to' the constant in the correlation equations which have been obtained being modified.
A number of criteria were suggested to test if the corrosion rate of copper in acid FeCl3 solutions was simply related to the mass transfer of ferric ions. These criteria have all been found to hold. Thus we have another method of measuring mass transfer rates on a dissolving surface. Since this work was completed it has come to the authors attention that Gregory and Riddiford 37 used the corrosion of zinc in an iodine-containing solution in their study of mass transfer to a rotating disc. However' the general validity of the method was not apparently tested, for example, for use on specimens having a non-uniform mass transfer profile.
We are using this technique to examine the enhancemen t of mass transfer in 1800
bends at Reynolds numbers between 103 and 105. Preliminary results for bends with a bend-to-tube diameter ratio of 6 suggest enhancement factors of between 1.3 and 1.8. Future work will use models of real bends with a bend-to-tube diameter ratio of one.
The changes in surface roughness observed in these tests are worth examining. In general there is much less surface roughening with the development of scallops than has been observed with the chemical dissolution technique. 5 With the small jet impinging on the large specimen the effect of Reynolds number on this was very marked: above Re of 25 000 small scallops developed everywhere except the central stagnation zone, between 15000 and 25 000 larger scallops developed but only in the
TABLE 4. COMPARISON OF MEASURED AND PREDICTED PEAK CORROSION RATES FOLLOWING ON ORIFICE
Predicted Orifice Reynolds Measured corrosion corrosion
number rate (jLm h-') (jLm h-')
73151 271 312 36145 180 196 18503 111 125 11188 69 89 4819 44 49 2151 29.5 33
% error
+15 +12 +11 +22 +10 +11

IEPENDENCY
I range I I
6-0.76 6-0.82 8-1
0.5 0.66 0.67 0.86 -
'able 4. There is clearly 12%; but a very high . This suggests that one ::rror. T.he most likely on rate IS proportional .85 and 1.4 x 10⁻⁵ cm2 Ich larger than we have ant in the correlation
1 rate of copper in acid ~ic ions. These criteria )d of measuring mass opleted it has come to ~orrosion of zinc in an otating disc. However :)f example, for use on
·f mass transfer in 1800
results for bends with rs of between 1.3 and tube diameter ratio of
e worth examining. In >ment of scallops than .5 With the small jet lber on this was very ere except the central eloped but only in the
) error
+15 +12 +11 +22 +10 +11
The use of a corrosion process to obtain mass transfer data
40
20
I-
aJ 10 ::E 8 tJ 6 z
~ '" z w
2
.., pr~dicl~d enhoncem<nl = ~ (..2.) I
\ ·0165 do R?
--I-I-1-.-I ____ LK
r=·9B9
Re FiG. 13. Effect of Reynolds number on maximum enhancement downstream of an orifice, range and average of data points shown. Copper specimens tested in acid ferric chloride
solution. '
279
region of peak mass transfer, below Re of approx. 15000 no scallops developed, only radial flow lines. This was not studied in detail with the orifice geometry but scallops were only observed on specimens tested at the higher Reynolds numbers, and only occurred in the region of maximum mass transfer; they were not accounted for in the correlation equation or in the measured enhancement factors. The corrosion rate profiles of steel in both acidified FeCl3 and oxygenated acidified NaCl are both practically and theoretically interesting. Corrosion reactions involve the occurrence of both an anodic and a ~athodic reaction. One possible reason for the higher than predicted enhancement is that these reactions become localized on the surface, i.e. the anodic dissolution reaction occurs at the region of maximum mass transfer and the cathodic reduction of ferric to ferrous ions occurs further downstream. These ideas are clearly speculative and are currently being examined.
CONCLUSIONS
1. A new technique has been developed to measure mass transfer coefficients from a dissolving surface, which involves the corrosion of copper in acid FeCl3 solutions.
2. Not all metal environment systems in which the corrosion rate is diffusion controlled produce a corrosion rate profile whicl;1 is directly related to the mass transfer profile. It is speculated that this is the result of the separation of anodic and cathodic areas.
3. Developing roughness in this technique is less than in the chemical dissolution technique, and appears to be a function of Reynolds number or more probably the rate of mass transfer.
Acknowledgements-The authors wish to thank the management of NEI Nuclear Systems Ltd. and the CEGB who have been associated with this work, for permission to publish the outcome of the
I development and the results. Thanks also to Mike Coney and Dr Geoff Bignold of the CEGB TPRD for most helpful discussions.
2XO BRYAN POULSON and RUSSEL ROBINSON
REFERENCES
1. V. LEVICH, Physiochemical Hydrodynamics. Prentice-Hall, New Jersey (1962).
2. M. A. PATRICK, D. J. TAGG, E. R. VALLIS and A. A. WRAGG, Paper to AIChE 20th Meeting, New York (1979).
3. V. V. RAA and O. TRASS, Can. 1. chern. Engng42, 95 (1964). 4. P. HARRIOTT and R. M. HAMILTON, Chem. engng Sci. 20, 1023 (1965).
5. M. CONEY, S. J. WILKIN and H. S. OATES, Proceedings of Meeting held at "Les Renardiercs" M 1982 on Corrosion-Erosion of Steels in High Temperature Water and Wet Steam (PH. BER~E a~d F. KHAN, eds). Electricite De France, Paris (1983).
6. F. GIRALT and O. TRASS, Can. 1. chem. Engng 54, 148 (1976). 7. A. A. WRAGG, The Chemical Engineer, 39, January (1977).
8. T. MIZUSHINA, Ad!'. Heat Transfer (IRVINE and.HARTNELL, eds), Vol. 7, No. 87. Academic Press, New York (1971). . ..•
9. M. EISENBERG, C. W. TOBIAS and C. R. WILKE,]. electrochem. Soc. 101,306 (1954). . 10. T. K. Ross and A. A. WRAGG, Electrochim. Acta 10, 1093 (1965). 11. B. POULSON, Corros. Sci. 23,391 (1983). 12. D. R. GABE, l. appl. Electrochem. 4, 91 (1974).
13. T. H. CHILTON and A. P. COLBURN, Ind. Engng Chem. 26,1183 (1934).
14. C. V. KING, in SUlface Chemistry of Metal and Semiconductors (H. C. GATUS, ed.), p. 357. Wiley; New York (1959). .
IS. A. C. MAKRIDES and N. HACKERMAN, 1. electrochem. Soc. 105, 156 (1958).
16. M. G. FONTANA and N. D. GREEN, Corrosion Engineering. McGraw-HilI, New York (1967). 17. I. N. PUTILOVA, S. A. BALEZIN and U. P. BARANNIK, Metallic Corrosion Inhibitors. Pergamon Press,
New York (1960).
18. T. K. Ross and B: P. L. HITCHEN, Corros. Sci. 1,65 (1961). 19. L. A. POLUBOYARTSEVA et al., 1. Appl. Chem. 36, 1210 (1963). 20. E. HEITZ, Werkst. Korros. 15,63 (1964).
21. G. WRANGLEN and J. BERENDSON, in Physiochemical Hydrodynamics (B. SPALDING, ed.), p. 461: (Conf. Honour of V. Levich.) Advance Publishers, London (1977).
22. B. T. ELLISON and W. R. SCHMEAL, 1. Electrochem. Soc. 125,521 (1978). 23. F. L. LA QUE, Corrosion 13, 303t (1957).
24. G. J. SIGNOLD et al., 2nd Int. Conf. on Water Chern. of Nuclear Reactor System. BNES, Bournemouth (1980).
25. T. K. Ross and D. H. JONES, 1. Appl. Chem. 12,314 (1962). 26. British Standards Institute 851042: Part 1. London (1964). 27. B. CASE, CERL Report RDfUR16I 1 (1969). 2R. M. TURNER and P. A. BROOK, Corros. Sci. 13,973 (1973). 29. A. H. TAYLOR, 1. electrochem. Soc. 118,854 (1971). 30. T. H. CHILTON and A. P. COLBURN, Ind. Engng Chem. 26, 1183'(1934). 3 I. F. P. BERGER and K. F. L. HUE, Int. 1. Heat Mass Transfer 20,1185 (1977). 32. K. M. KRALL and F. M. SPARROW, 1. Heat Transfer Trans. ASME, Feb. 131 (1966). 33. D. J. TAGG, M. A. PATRICK and A. A. WRAGG, Trans. I Chem. E 67,176 (1979). 34. M. CONEY, CERL Report RDfLlN197/S0. November (1980). 35. M. MARTIN. Advances in Heat Transfer (J. P. KORKNESS and 1. F. IRVINE, eds), Vol. 13, p.1. Academic
Press, New York (1977).
36. C. H. BONFIGLIO, H. C. ALBAYA and A. O. COBO, Corros. Sci. 13,717 (1973). 37. D. P. GREGORY and A. C. RIDDIFORD, 1. chem. Soc. 3756 (1956). 3X. S. G. ATEYA and G. AUSTIN, 1. electrochem. Soc. 120,1216 (1973).
oxidation of Ni ox;idation of N
. possibly, of CC electrode oxida
.oLgas compm significant at tt identical to tho current for the This was attrit COHS-, in add
Manuscript rece