Embed Size (px)
Citation preview

Utah State University Utah State University
DigitalCommons@USU DigitalCommons@USU
All Graduate Theses and Dissertations Graduate Studies
5-2012
Ensuring Microbial Safety in Food Product/Process Development: Ensuring Microbial Safety in Food Product/Process Development:
Alternative Processing of Meat Products and Pathogen Survival in Alternative Processing of Meat Products and Pathogen Survival in
Low-Salt Cheddar Cheese Low-Salt Cheddar Cheese
Subash Shrestha Utah State University
Follow this and additional works at: https://digitalcommons.usu.edu/etd
Part of the Nutrition Commons
Recommended Citation Recommended Citation Shrestha, Subash, "Ensuring Microbial Safety in Food Product/Process Development: Alternative Processing of Meat Products and Pathogen Survival in Low-Salt Cheddar Cheese" (2012). All Graduate Theses and Dissertations. 1163. https://digitalcommons.usu.edu/etd/1163
This Dissertation is brought to you for free and open access by the Graduate Studies at DigitalCommons@USU. It has been accepted for inclusion in All Graduate Theses and Dissertations by an authorized administrator of DigitalCommons@USU. For more information, please contact [email protected].
ENSURING MICROBIAL SAFETY IN FOOD PRODUCT/PROCESS
DEVELOPMENT: ALTERNATIVE PROCESSING OF MEAT PRODUCTS
AND PATHOGEN SURVIVAL IN LOW-SALT CHEDDAR CHEESE
by
Subash Shrestha
A dissertation submitted in partial fulfillment
of the requirements for the degree
of
DOCTOR OF PHILOSOPHY
in
Nutrition and Food Sciences
Approved:
Dr. Brian A. Nummer Dr. Daren P. Cornforth
Major Professor Committee Member
Dr. Marie K. Walsh Dr. Silvana Martini
Committee Member Committee Member
Dr. Bruce Miller Dr. Mark McLellan
Committee Member Vice President for Research and
Dean of the School of Graduate Studies
UTAH STATE UNIVERSITY
Logan, Utah
2012

ii
Copyright © Subash Shrestha 2012
All Rights Reserved

iii
ABSTRACT
Ensuring Microbial Safety in Food Product/Process Development:
Alternative Processing of Meat Products and Pathogen
Survival in Low-Salt Cheddar Cheese
by
Subash Shrestha, Doctor of Philosophy
Utah State University, 2012
Major Professor: Dr. Brian A. Nummer
Department: Nutrition, Dietetics, and Food Sciences
Most outbreaks of foodborne illness in the United States occur as a result of
improper food-handling and preparation practices in homes or food establishments. Some
food-safety recommendations that are difficult to incorporate into handling and cooking
procedures have contributed to a gap between food-safety knowledge and the actual
behavior. The first part (Chapter 3, 4) of this study sought to ensure microbial safety by
establishing alternative processing of meat products that can be easily practiced by food-
operators and consumers. In Chapter 3, a novel method was developed to thaw frozen
chicken-breast by submersion in hot water at 60 °C, an appropriate temperature setting
for foodservice hot-holding equipment. This method is rapid (compared to either
refrigerator or cold-water thawing that also uses a significant amount of water), safe, and
the final cooked-product sensory-quality was not different from refrigerator-thawed and
cooked product (microwave thawing results in localized overheating). Chapter 4

iv
developed marinade-cooking (91 °C) and holding (60 °C) procedures for hamburger-
patties. Frozen patties were partially grilled and finished cooking in marinade. The
moderate temperature of marinade cooking overcomes the chances of thick-patties being
surface-overcooked while innermost portions remain undercooked as seen in high-
temperature cooking methods (grilling and pan-frying). Consumers liked the marinade-
finished cooked and held patties (up to 4 h) equally or more (holding-time dependent)
compared to patties grilled and held in a hot-steam cabinet.
Reducing salt in perishable foods including cheese is microbial-safety concern
especially in their distribution and storage. The second part (Chapter 5, 6) of this study
sought to evaluate microbial safety of low-salt hard-type cheese. Aged Cheddar cheeses
were inoculated with either Listeria monocytogenes (3.5 log CFU/g) or Salmonella spp.
(4.0 log CFU/g) and their survival or growth was monitored at 4, 10, and 21°C for up to
90, 90, and 30 d, respectively. Low-salt (0.7% NaCl) Cheddar formulated at pH 5.1 or
5.7 exhibited no-growth or gradual reduction in L. monocytogenes and Salmonella
counts. The results suggest that low-salt Cheddar is as safe as its full-salt counterparts
(1.8% NaCl) and that salt may only be a minor food-safety hurdle regarding the post-
aging contamination and growth of L. monocytogenes and Salmonella.
(183 pages)

v
PUBLIC ABSTRACT
Ensuring Microbial Safety in Food Product/Process Development:
Alternative Processing of Meat Products and Pathogen
Survival in Low-Salt Cheddar Cheese
by
Subash Shrestha, Doctor of Philosophy
Utah State University, 2012
Most outbreaks of foodborne illness in the United States occur as a result of
improper food-handling and preparation practices in homes or food establishments. The
lack of food-safety knowledge is one of the several reasons for this. However, researchers
also suggest that food-operators and consumers with adequate food-safety knowledge,
attitudes, and intentions do not always follow the food-safety recommendations because
not all recommendations are easy to put into practice. Therefore, the first part of this
study sought to establish safe alternative processing of meat products that can be easily
practiced by food-operators and consumers. In Chapter 3, a novel method was developed
to thaw frozen chicken breast by submersion in hot water at 60 °C. This is an appropriate
temperature setting for foodservice hot-holding equipment. This method is rapid
(compared to either refrigerator or cold-water thawing that also uses lots of water), safe,
and the final cooked-product sensory-quality was not different from refrigerator-thawed
and cooked product (microwave thawing results in localized overheating potentially
lowering sensory quality). Chapter 4 developed a marinade-cooking (91 °C) and holding
(60 °C) procedures of hamburger-patties. Frozen patties were partially grilled and
finished cooking in marinade. The moderate temperature of marinade cooking overcomes
the chances of thick-patties being surface-overcooked (quality defect) while innermost
portions remain undercooked (temperature not sufficient enough to kill any harmful
bacteria if present) as seen in high-temperature cooking methods such as grilling and pan-
frying. Consumers liked the marinade-finished cooked and held patties (up-to 4 h)
equally or more compared to patties grilled and held in hot-steam cabinet.
Reducing salt in perishable foods including cheese is a microbial-safety concern
especially in their distribution and storage. The second part of this study (Chapter 5, 6)
sought to evaluate the microbial safety of low-salt hard-type cheese. Aged Cheddar
cheeses were inoculated with either Listeria monocytogenes or Salmonella spp. and their
survival or growth was monitored at 4, 10, and 21°C for up-to 90, 90, and 30 d,
respectively. Low-salt (0.7% NaCl) Cheddar exhibited no-growth or gradual reduction in
L. monocytogenes and Salmonella counts. The results suggest that low- or reduced-salt
cheeses are as safe as their full-salt counterparts (1.8% NaCl) and that salt may only be a
minor food-safety hurdle regarding the post-aging contamination and growth of L.
monocytogenes and Salmonella spp. However, as none of the treatments resulted in a
complete kill of these pathogens, the need for good sanitation practice exists.

vi
ACKNOWLEDGMENTS
Deepest gratitude goes to my advisor, Dr. Brian A. Nummer, for his excellent
encouragement, and guidance for speedy completion of this Ph.D. program. I wish to
thank committee members Dr. Daren Cornforth and Dr. Marie Walsh for valuable
guidance in the earlier part of the research and study-plan, respectively. I would also like
to thank the committee members Dr. Silvana Martini and Dr. Bruce Miller for their
valuable and timely advice and admirable assistance in this program.
I gratefully acknowledge Dr. Niranjan R. and Josephine N. Gandhi for their
support with Gandhi scholarship. Also, thanks to my friends especially Gaurav Shrestha,
Sakun Shrestha, Dick Whittier, Dave Irish and James Grieder for their support and love
over these years. My appreciation also goes to those people who participated and helped
in the discrimination and consumer acceptance tests in my research. I would also like to
thank all departmental staff for their support.
I would like to thank my family for their encouragement and support throughout
my career. Acknowledgment also goes to my little daughter, Shruti who revitalized my
passion every day. I would also like to thank my wife, Roshani Shrestha. She was always
there helping and cheering me up and stood by me through the good times and bad.
Finally, I sincerely dedicate this dissertation to my beloved mother, Subhadra Shrestha.
She inspired me to set this goal before she was taken away from me.
Subash Shrestha
vii
CONTENTS
Page
ABSTRACT ……………………………………………………………………………iii
PUBLIC ABSTRACT …………………………………………………………………v
ACKNOWLEDGMENTS……………………………………………………………...vi
LIST OF TABLES ……………………………………………………………………..x
LIST OF FIGURES ……………………………………………………………………xv
LIST OF SYMBOLS AND ABBREVIATIONS ……………………………………...xvi
CHAPTER
1. INTRODUCTION AND OBJECTIVES ………………………………………1
References ……………………………………………………………...4
2. LITERATURE RIVEW ……………………………………………………......7
Foodborne illness ……………………………………………………....7
Food establishment food safety ………………………………………..9
Consumer food safety ………………………………………………….10
Bridging the gap between food-safety knowledge and
safe food behaviors. ………………………………………………….12
Thawing of meat ……………………………………………………….13
Cooking of hamburger patties …………………………………………14
Hot holding of cooked hamburger patties ……………………………..15
Mathematical modeling of growth of pathogenic bacteria …………….16
Sensory test …………………………………………………………….16
Role of salt in human health and food preservation..…………………..18
Nutritional quality and microbial safety of cheese…...………………...19
Salmonella and Salmonellosis...…………………………………….......20
Listeria monocytogenes and Listeriosis...……………………………....21
Microbial challenge testing……... …….……………………………….23
References………………………………………………………………26

viii
3. SENSORY QUALITY AND FOOD SAFETY OF BONELESS
CHICKEN BREAST PORTIONS THAWED RAPIDLY
BY SUBMERSION IN HOT WATER ………………………………………..38
Abstract ………………………………………………………………...38
Introduction …………………………………………………………….38
Materials and methods …………………………………………………40
Results and discussion …………………………………………………43
References ……………………………………………………………...48
4. PROCESS OPTIMIZATION AND CONSUMER ACCEPTABILITY
OF SALTED GROUND BEEF PATTIES COOKED AND
HELD HOT IN FLAVORED MARINADE …………………………………..50
Abstract ………………………………………………………………...50
Practical application ……………………………………………………51
Introduction …………………………………………………………….51
Materials and methods …………………………………………………53
Results and discussion …………………………………………………60
Conclusions …………………………………………………………….67
References ……………………………………………………………...68
5. SURVIVAL OF LISTERIA MONOCYTOGENES INTRODUCED
AS A POST-AGING CONTAMINANT DURING STORAGE
OF LOW-SALT CHEDDAR CHEESE AT 4, 10, AND 21 ⁰C ……………….72
Abstract ………………………………………………………………...72
Introduction …………………………………………………………….73
Materials and methods …………………………………………………75
Results and discussion …………………………………………………79
References ……………………………………………………………...87
6. SURVIVAL OF SALMONELLA SEROVARS INTRODUCED AS A
POST-AGING CONTAMINANT DURING STORAGE OF
LOW-SALT CHEDDAR CHEESE AT 4, 10, AND 21 ⁰C...………………….92
Abstract ………………………………………………………………...92
Practical application ……………………………………………………93
Introduction …………………………………………………………….93
Materials and methods …………………………………………………96
Results and discussion …………………………………………………100
Conclusions …………………………………………………………….109
References ……………………………………………………………...110

ix
7. SUMMARY AND CONCLUSIONS .…………………………………………114
References ……………………………………………………………...119
APPENDICES …………………………………………………………………………121
APPENDIX A. STATISTICS FOR CHAPTER 3 ……………………………..122
APPENDIX B. B1. EXAMPLE OF SURVEY QUESTIONNAIRE USED
IN TRIANGLE TEST; B2. TRIANGLE TEST FOR DIFFERENCE:
CRITICAL NUMBER (MINIMUM) OF CORRECT ANSWERS...….125
APPENDIX C. STATISTICS FOR CHAPTER 4 ……………………………..128
APPENDIX D. EXAMPLE OF SURVEY QUESTIONNAIRE
AND NINE-POINT HEDONIC SCALE USED IN
CONSUMER ACCEPTANCE PANELS ……………………………...133
APPENDIX E. STATISTICS FOR CHAPTER 5 ……………………………..135
APPENDIX F. STATISTICS FOR CHAPTER 6……………………………...149
APPENDIX G. REPRINT PERMISSIONS …………………………………...157
CURRICULUM VITAE ……………………………………………………………….164

x
LIST OF TABLES
Table Page
1 Thawing of chicken breast portions at 60 ºC …………………………………..44
2 Thawing of chicken breast portions at
refrigeration temperatures (0-2.7 °C)...…………………………………………45
3 Time required to reach 57.5 ºC during hot water
thawing chicken breast portions ……………………………………………….45
4 Thawing rate of chicken breast portions versus
predicted Salmonella growth …………………………………………………..46
5 Summary of sensory panels for three different thickness
ranges of chicken breast thawed and grilled …………………………………...47
6 Cooking time, Hunter color values, and beef patty dimensions
after frying or cooking in hot water. Patties in both
methods were cooked from the frozen state
to an internal temperature of 69°C …………………………………………….60
7 Weight, proximate composition, and thiobarbituric acid (TBA)
values of raw (R) or cooked patties after frying or hot water
cooking/holding. Patties in both methods were cooked
from the frozen state to an internal temperature of
69°C. Water cooked patties were held
0 - 4 h in hot water (61°C) ……………………………………………………..62
8 Comparison of frying and hot water cooking/holding treatments
on sensory score of beef patties. Patties in both methods were
cooked from the frozen state to an internal temperature of
69°C. Grilled patties were served immediately. Hot
water cooked patties were held 0, 2, or 4 h in hot
water (61°C) before serving ……………………………………………………64
9 Effect of salt content and cooking method on sensory score of beef patties.
Grilled patties contained no salt. Marinade-cooked patties contained
0.75 % salt. All patties were cooked from the frozen state. After
cooking, patties were hot held 0 to 4 h at 61°C in a steam
cabinet (grilled) or hot marinade, respectively. The
marinade-cook process consisted of grilling frozen
xi
patties 5 min per side for browning and formation
of grill marks, then finish cooking in marinade
(0.75% salt and 0.3% caramel color) …………………………………………..67
10 Physicochemical characteristics of Cheddar cheese from 4 treatments ……….80
11 pH of treatment and control Cheddar cheeses during storage at 4°C ………….81
12 pH of treatment and control Cheddar cheeses during storage at 10°C ………...81
13 pH of treatment and control Cheddar cheeses during storage at 21°C ………...82
14 Survival (log cfu/g) of Listeria monocytogenes in different experimental
treatments of Cheddar cheese during storage at 4°C …………………………..82
15 Survival (log cfu/g) of Listeria monocytogenes in different experimental
treatments of Cheddar cheese during storage at 10°C …………………………83
16 Survival (log cfu/g) of Listeria monocytogenes in different experimental
treatments of Cheddar cheese during storage at 21°C …………………………85
17 Physicochemical characteristics of Cheddar cheese treatments ……………….101
18 pH of treatment and control Cheddar cheeses during storage at 4°C ………….102
19 pH of treatment and control Cheddar cheeses during storage at 10°C ………...102
20 pH of treatment and control Cheddar cheeses during storage at 21°C ………...103
21 Survival (log CFU/g) of Salmonella serovars in different experimental
treatments of Cheddar cheese during storage at 4 °C…………………………..104
22 Survival (log CFU/g) of Salmonella serovars in different experimental
treatments of Cheddar cheese during storage at 10 °C…………………………105
23 Survival (log CFU/g) of Salmonella serovars in different experimental
treatments of Cheddar cheese during storage at 21 °C…………………………106
A1 Raw data for chicken breasts thawed in hot water at 60 ± 3 °C ……………….122
A2 Raw data for chicken breasts thawed in refrigerator at 0 to 2.7 °C ……………122
A3 Main effect of thawing methods on thaw loss and thaw time ………………….124

xii
A4 ANOVA table for thaw loss and thaw time ……………………………………124
A5 ANOVA table for thaw loss and thaw time in hot water thawing method …….124
A6 ANOVA table for thaw loss and thaw time in refrigerator thawing method …..124
B1 Example of survey questionnaire used in triangle test …………………………125
B2 Triangle test for difference: Critical number (minimum) of correct answers..…126
C1 Hunter color values for fried or water-cooked patties held in hot
water at 61 °C. Patties in both methods were cooked from
frozen state to an internal temperature of 69 °C ……………………………….128
C2 Type 3 tests of fixed effects (ANOVA) for L* color measurement ……………128
C3 Type 3 tests of fixed effects (ANOVA) for a* color measurement…………….129
C4 Type 3 tests of fixed effects (ANOVA) for b* color measurement ……………129
C5 Type 3 tests of fixed effects (ANOVA) for moisture content of
fried or water-cooked patties held in hot water at 61 °C ………………………129
C6 Type 3 tests of fixed effects (ANOVA) for fat content of fried
or water-cooked patties held in hot water at 61 °C …………………………….129
C7 Type 3 tests of fixed effects (ANOVA) for protein content of
fried or water-cooked patties held in hot water at 61 °C ………………………130
C8 Type 3 tests of fixed effects (ANOVA) for TBA value of
fried or water-cooked patties held in hot water at 61 °C ………………………130
C9 Weight and compositional loss of fried or water-cooked patties held
in hot water at 61 °C. Patties in both methods were cooked
from frozen state to an internal temperature of 69 °C …………………………130
C10 ANOVA for different sensory attributes of fried or water-cooked patties
held in hot water at 61 °C (Consumer acceptance panel part I) ……………….131
C11 ANOVA for different sensory attributes of grilled or marinade cooked
patties and held at 61 °C in steam cabinet or marinade
respectively (Consumer acceptance panel part II) ……………………………..131
C12 Distribution (%) of gender and age of participants in the consumer

xiii
acceptance tests in part I and part II of the experiment ………………………..132
C13 Distribution (%) of hamburger consumption frequency of
participants in the consumer acceptance tests in
part I and part II of the experiment …………………………………………….132
D Example of survey questionnaire and nine-point hedonic scale
used in consumer acceptance panels …………………………………………...133
E1 Raw data count of Listeria monocytogenes in different experimental
treatments of Cheddar cheese during storage at 4 °C for up to 90 d …………..135
E2 Type 3 tests of fixed effects (ANOVA) for Listeria monocytogenes
counts in different experimental treatments of Cheddar cheese
during storage at 4 °C for up to 90 d .…………………………………………..139
E3 Raw data count of Listeria monocytogenes in different experimental
treatments of Cheddar cheese during storage at 10 °C for up to 90 d.…………139
E4 Type 3 tests of fixed effects (ANOVA) for Listeria monocytogenes
counts in different experimental treatments of Cheddar cheese
during storage at 10 °C for up to 90 d …………………………………………144
E5 Raw data count of Listeria monocytogenes in different experimental
treatments of Cheddar cheese during storage at 21 °C for up to 30 d …………144
E6 Type 3 tests of fixed effects (ANOVA) for Listeria monocytogenes
counts in different experimental treatments of Cheddar cheese
during storage at 21 °C for up to 30 d .…………………………………………148
F1 Raw data count of Salmonella serovars in different experimental treatments
of Cheddar cheese during storage at 4 °C for up to 90 d ………………………149
F2 Type 3 tests of fixed effects (ANOVA) for Salmonella serovars
counts in different experimental treatments of Cheddar
cheese during storage at 4 °C for up to 90 d …………………………………...151
F3 Raw data count of Salmonella serovars in different experimental treatments
of Cheddar cheese during storage at 10 °C for up to 90 d ……………………..151
F4 Type 3 tests of fixed effects (ANOVA) for Salmonella serovars
counts in different experimental treatments of Cheddar
cheese during storage at 10 °C for up to 90 d ………………………………….154

xiv
F5 Raw data count of Salmonella serovars in different experimental treatments
of Cheddar cheese during storage at 21 °C for up to 30 d ……………………..154
F6 Type 3 tests of fixed effects (ANOVA) for Salmonella serovars
counts in different experimental treatments of Cheddar
cheese during storage at 21 °C for up to 30 d ………………………………….156

xv
LIST OF FIGURES
Figure Page
1 Weight loss (%) after cooking and holding ground beef patties
for up to 4 h. (▲) Hot water cooked, then
held in hot water (61°C) ……………………………………………………….. 61

xvi
LIST OF SYMBOLS AND ABBREBIATIONS
Abbreviation key
AMI American Meat Institute
ANOVA Analysis of variance
AOAC Assn. Official Alalytical Chemists, Inc.
APHA American Public Health Association
ARS Agricultural Research Service (USDA)
aw Water activity
C Centigrade
CDC Centers for Disease Control and Prevention
CFU Colony forming unit
d Day
DEC Department of Environmental Conservation (Alaska)
F Fahrenheit
FDA Food and Drug Administration
FNS Food and Nutrition Service (USDA)
FSIS Food Safety and Inspection Service (USDA)
GR Growth Rate
h Hour
HACCP Hazard analysis and critical control points
ILSI International Life Sciences Institute

xvii
IOM Institute of Medicine
LSD Least Significance Difference
min Minute
mm Millimeter
MMWR Morbidity and Mortality Weekly Report (CDC)
NaCl Sodium Chloride
NACMCF National Advisory Committee on Microbiological
Criteria of Foods (USDA)
NCHFP National Center for Home Food Preservation (USDA)
QALY Quality-Adjusted Life Year
REEIS Research, Education, and Economics Information
System (USDA)
RTI Research Triangle Institute
s Second
SD Standard Deviation
Sqrt Square Root
TBA Thiobarbituric acid reactive substances
TSB Tryptic soy broth
USDA U.S. Department of Agriculture
USDHHS U.S. Department of Health & Human Services
VDH Vermont Department of Health

CHAPTER 1
INTRODUCTION AND OBJECTIVES
The product development process plays a pivotal role in assuring product safety
from the very beginning of the food-production process. The product developer has
intimate knowledge of the product formulation, raw materials and the process used to
manufacture it. It is essential that the product developer have a good grasp of the
principles of HACCP (hazard analysis and critical control points) and apply them during
the development process. The product developer is also responsible for ensuring that the
consumer can easily apply the safe-handling and preparation practices required for the
product. This study sought to ensure microbial safety in food product and process
developments.
The Centers for Disease Control and Prevention (CDC 2010) estimates that
roughly 48 million foodborne illness cases occur in the United States every year.
Researchers (Davey 1985; Wall and others 1995; Redmond and Griffith 2003; USDA
REEIS 2008; Byrd-Bredbenner and others 2010; Batz and others 2011) suggest that most
of the illnesses occur as a result of improper food handling and preparation practices in
homes or food establishments, including restaurants, catering businesses, cafeterias (in
schools, hospitals, nursing homes, prisons, etc.) and convenience stores. These studies
also highlighted a serious gap between food-safety knowledge and the actual behavior of
foodservice operators and consumers. The violations of the US FDA food code
recommendations in preparing and handling food results in a potential foodborne
outbreak.

2
Some of the food-safety recommendations are difficult to achieve in food-
handling and cooking procedures. This has been cited as one of the major reasons for
noncompliance of the US FDA food code (Koeppl 1998; Clayton and others 2003;
Porticella and others 2008). Meat products are the major food items implicated in
foodborne illness in terms of annual disease burden (Batz and others 2011). Therefore,
the first part of this study aims to process meat products by developing alternative
methods that can be easily practiced by food operators and consumers. I hypothesize that
the final product prepared using the developed process will be equally or more safe as the
product prepared using current recommendations for food preparations. I further
hypothesize that the quality and sensory attributes of the final product will be comparable
to or better than the product prepared by the current recommended methods. Hence the
objectives of Chapter 3 and Chapter 4 of this study were:
1. To validate the microbial safety of hot-water (60 °C) thawing method for chicken
breasts, and to compare the sensory quality of subsequently cooked chicken breast with
refrigerator-thawed and cooked chicken breast.
2. To optimize the marinade-cooking (91 °C) method for hamburger patties, and to
evaluate the consumer acceptability of cooked hamburger patties and the cooked patties
held in hot marinade (60 °C) for up-to 4 h, compared to that of grilled patties and grilled
patties held in hot steam cabinet.
Estimates of the US annual per capita cheese consumption have trended steadily
upward, from approximately 6.5 Kg in 1975 to 14.5 Kg in 2008 (USDA ERS 2010). The
consumption of cheese is expected to continue to rise. Cheese is a nutrient-dense food,

3
however, it is also perceived as being high in fat and sodium (Johnson and others 2009).
Cheddar cheese typically contains 310 mg sodium per 50 g (Guinee and O'Kennedy
2007; Johnson and others 2009; Agarwal and others 2011). Depending on age and other
individual characteristics of the population, a serving (28.5 g) of Cheddar cheese
contributes 7.5 to 12.0 % of the daily recommended limit (less than 2,300 or 1,500 mg)
for sodium. The 1,500 mg sodium recommendation limit applies for over two-third of the
US adults. Reducing the sodium content in cheese is expected to contribute to reducing
the overall dietary intake of sodium by the US consumers.
Reducing sodium (salt) is a microbial safety concern especially in the distribution
and serving of perishable foods including cheese although the current US dietary
guidelines recommend 35% reduction in sodium (salt) intake (USDHHS 2011). Studies
(WHO 2000; Redmond and Griffith 2003) have identified cross-contamination as the
major risk factor contributing to foodborne disease. Cross-contamination of low- or
reduced-salt cheese either in food establishments or consumer homes may allow the
growth of pathogens during distribution or storage of cheese. Salt along with pH and the
activity of lactic acid culture are multiple hurdles that inhibit pathogen growth and
contribute to the microbiological safety of traditional hard cheeses (Ryser 1999). I
hypothesize that low-salt Cheddar cheese if made at low-pH will not sacrifice the current
inherent safety hurdle. Therefore, the objectives of Chapter 5 and Chapter 6 of this study
were:
1. To evaluate the survival or growth of Listeria monocytogenes and Salmonella
serovars in low-salt Cheddar cheese produced either at low or high pH.

4
2. To compare the survival or growth of Listeria monocytogenes and Salmonella
serovars in low-salt Cheddar cheese with regular-salt Cheddar cheese produced either at
low or high pH.
References
Agarwal S, McCoy D, Graves W, Gerard PD, Clark S. 2011. Sodium content in retail
Cheddar, Mozzarella, and process cheeses varies considerably in the United
States. J Dairy Sci 94:1605-1615.
Batz MB, Hoffmann S, Morris JG Jr. 2011. Ranking the risks: The 10 pathogen-food
combinations with the greatest burdon on public health. Gainesville, FL:
Emerging Pathogens Institute, University of Florida. 68 p.
Byrd-Bredbenner C, Abbot J, Schaffner D. 2010. How food safe is your home kitchen?
A self-directed home kitchen audit. J Nutrition Education and Behavior 42:286-
289.
CDC (Centers for Disease Control and Prevention). 2010. Foodborne illness. Available
from: http://www.cdc.gov/ncidod/dbmd/diseaseinfo/food-
borneinfections_g.htm#howmanycases. Accessed Jun 21, 2011.
Clayton DA, Griffith CJ, Price P. 2003. An investigation of the factors underlying
consumers‘ implementation of specific food safety practices. British Food J 105:
434–453.
Davey GR. 1985. Food-poisoning in New South Wales 1977–1984. Food Technol
Australia 37: 453–456.

5
Guinee TP, O'Kennedy BT. 2007. Reducing salt in cheese and dairy spreads. In: Kilcast
D, Angus F, editors. Reducing salt in foods: practical strategies. Cambridge, UK:
Woodhead Publishing in Food Science, Technology and Nutrition. p 316-357.
Johnson ME, Kapoor R, McMahon DJ, McCoy DR, Narasimmon RG. 2009. Reduction
of sodium and fat levels in natural and processed cheeses: scientific and
technological aspects. Comp Rev Food Sci Food Safety 8: 252-268.
Koeppl PT. 1998. Final report. Focus groups on barriers that limit consumers‘ use of
thermometers when cooking meat and poultry products. Phase one contract no.
43-3A94-7-1637. Available from:
http://www.fsis.usda.gov/oa/topics/focusgp.pdf. Accessed Mar 20, 2010.
Porticella N, Shapiro MA, Gravani RB. 2008. Social barriers to safer food preparation
and storage practices among consumers. Paper presented at the International
Communication Association. Available from:
http://www.allacademic.com//meta/p_mla_apa_research_citation/2/3/2/5/8/pages2
32589/p232589-1.php. Accessed Mar 20, 2010.
Redmond EC, Griffith CJ. 2003. Consumer food handling in the home: a review of food
safety studies. J Food Prot 66:130–161.
Ryser ET. 1999. Incidence and behavior of Listeria monocytogenes in cheese and other
fermented dairy products. In: Ryser ET and Marth EH, editors. Listeria, listeriosis
and food safety. 2nd
ed. New York, NY: Marcel Dekker Inc. p 411-503.
6
USDA ERS. 2010. Long-term growth in U.S. cheese consumption may slow. Available
from: http://www.ers.usda.gov/Publications/LDP/2010/07Jul/LDPM19301/
ldpm19301.pdf. Accessed Jun 23, 2011.
USDA REEIS. 2008. Food handling and consumption knowledge, attitudes, and
behaviors of young adults and the impact of a food safety social marketing
campaign. Available from: http://www.reeis.usda.gov/web/crisprojectpages/
196870.html. Accessed Jun 22, 2011.
USDHHS. 2011. New US dietary guidelines focus on salt reduction. Available from:
http://www.healthfinder.gov/news/newsstory.aspx?docID=649411. Accessed Jun
23, 2011.
Wall PG, Adok G, Evans H, Le Baigue S, Ross D, Ryan M, Cowden, J. 1995. Outbreak
of foodborne infecious intestinal disease in England and Wales 1992–1993.
Proceedings of the Conference on Foodborne Diseases: Consequences and
Prevention; 30–31 March 1995; Oxford: Oxford Brooks University.
WHO. 2000. The WHO surveillance programme for control of food-borne infections and
intoxications in Europe: 7th Report (1993-1998). Available from:
www.who.int/foodsafety/publications/food-borne_disease/dec2000/en/ Accessed
December 22, 2009.
7
CHAPTER 2
LITERATURE REVIEW
Foodborne illness
Illness resulting from foodborne disease has become one of the most widespread
public-health problems in the world today (Josephson and others 1997; WHO 2012).
CDC (2010a) estimates that each year roughly 1 out of 6 Americans (or 48 million
people) gets sick, 128,000 are hospitalized and 3,000 die from foodborne diseases. Over
60% of illnesses occur as a result of improper food-handling and preparation practices in
food establishments and homes (Davey 1985; Wall and others 1995; Redmond and
Griffith 2003; Lynch and others 2006; Batz and others 2011). Pathogens such as
Campylobacter and Salmonella have been detected in commercial and domestic kitchens
after food preparation (Cogan and others 1999; Harrison and others 2001; Redmond and
others 2001). Jones and others (2004) cite that over 40% of the foodborne disease
outbreaks reported to CDC was attributed to commercial food establishments (cafeteria,
delicatessen, or restaurant). Likewise, improper food-handling practices in the home are
believed to be responsible for approximately 20% of foodborne illnesses in the US (CDC
2006). Howes and others (1996) suggested that improper food-handlers practices
contributed to approximately 97% of foodborne illnesses in food establishments and
homes in the US. Accordingly, improvement of food-safety practices associated with
foodborne illness in foodservice and retail establishments, and consumer homes have
been included as two of the six food-safety objectives in Healthy People 2020, the health
initiative goals of the U.S. Department of Health & Human Services (USDHHS 2011).

8
While most food-handlers know about safe food-handling procedures, the
compliance is generally low and has not been much improved by food-safety campaigns
(Clayton and others 2002; Shapiro and others 2011). Furthermore, positive attitudes
toward food-safety concepts did not corresponded with safe food-handling practices
(Redmond and Griffith 2003). Likewise, Unklesbay and others (1998) reported no
difference in practice for college students having higher attitude scores. Researchers
(Koeppl 1998; Clayton and others 2003; Porticella and others 2008) suggest that some
food-safety recommendations are difficult to implement into food-handling and cooking
procedures. The barriers preventing food handlers from implementing food safety
practices need to be taken into consideration when developing strategies to change food
handling practices and thereby improve food safety (Clayton and others 2002). Because
approximately half of all foodborne-illness outbreaks are associated with temperature
violations (Byrd-Bredbenner and others 2010) including thawing of frozen meat, cooking
and then holding of cooked meat products, the present study aims to develop user-
friendly alternative processing (thawing, cooking, and hot-holding) techniques for meat
products and validate safety of final products. As the same researchers also suggested the
other half of foodborne illness are associated with cleanliness or cross-contamination, the
present study further aims to evaluate microbial safety of post-processing contaminated
low-salt hard-type cheese. Both meat and dairy products are reported as being the major
food items implicated in foodborne illness in terms of annual disease burden (Batz and
others 2011).

9
Food establishment food safety
Over 40% of reported cases of foodborne illness in the US were attributed to
unsafe food-handling practices in the foodservice environment (Olsen and others 2000,
Jones and others 2004). There are over 1 million food establishments in the US, including
restaurants, grocery stores, cafeterias, schools, and correctional facilities (US FDA 2011).
Mitchell and others (2007) cite that an examination of foodborne illness risk factors
among randomly selected foodservice establishments in the US highlighted problems in
food-handling behaviors. For instance, over 53% of fast-food restaurants and 72% of full-
service restaurants were not in compliance regarding adequate hand washing by workers.
Likewise, over 41% of fast-food restaurants and 63% of full-service restaurants were out
of compliance regarding proper holding time and/or temperature. Similarly, a survey of
foodservice workers revealed high levels of self-reported risky food-handling behavior
(Green and others 2005).
Despite an increase in the number of food handlers receiving food-hygiene
training, a high proportion of food-poisoning outbreaks still occur as a result of poor
food-handling practices (Clayton and others 2002). In a survey of 137 foodservice
workers in small to mid-sized establishments, Clayton and others (2002) found that 95%
of respondents had received food-safety training. Nonetheless, 63% admitted to failing to
carry out safe food-handling practices that they knew were appropriate, citing several
barriers related to their work. Likewise, assessments of food-handling knowledge and
behavior in other food establishments like convenience stores, butcher shops, temporary
food operations at state fairs, beef demonstrations in grocery stores, mobile food vendor

10
operations, farmers' markets and others also suggested serious gaps in safe food-handling
practices by workers (Mitchell and others 2007). Apparently, the current worker
education and training interventions demonstrate only modest success in changing
foodservice workers behavior (Mitchell and others 2007). Therefore, using an
understanding of the barriers to create safe food products or processes with less barriers is
desirable.
Consumer food safety
The safety measures taken by consumers play a critical role in the prevention of
foodborne illnesses because they constitute the final step in the food-preparation process,
and safe food-handling by the consumer in the domestic kitchen is considered to be ―the
final line of defense‖(Redmond and Griffith 2003). However, microbial surveys of
domestic kitchens have found significant contamination with a variety of bacterial
contaminants, including fecal coliforms, Escherichia coli, Campylobacter, and
Salmonella (Josephson and others 1997). Rusin and others (1998) examined 14
households in Tucson, Arizona, and found that the kitchen environment was more heavily
contaminated with fecal and total coliforms than the bathroom, suggesting that the risk of
spreading infection in the home is highest in the kitchen environment. Small outbreaks
that originate in the home typically involve individuals or a small number of people and
thus are less likely to be identified by public health authorities (Worsfold 1997).
Therefore, the actual proportion of foodborne outbreaks and individual cases originating
in the home is likely to be much larger than it has been reported to be (Zhao and others
1998).

11
While consumers have become more food-safety conscious during the past
decade, this does not necessarily translate into safe food-handling practices (Wilcock and
others 2004; Patil and others 2005; Byrd-Bredbenner and others 2008). Clayton and
others (2003) found that, although all 40 participants correctly answered food-safety
questions regarding hand washing after preparing raw foods and before handling ready-
to-eat foods, fewer reported they were very likely to carry out appropriately safe
behaviors, and none actually performed the behaviors adequately when they were
observed preparing food. In a national study conducted on young adults, 97% of the
subjects rated their own food-safety knowledge as at least fair; however, 60% did not
wash their hands with soap and water, after touching raw poultry (Byrd-Bredbenner and
others 2007). Similarly, there is a knowledge-compliance gap for the other food safety
recommendations (Cates 2002; Shapiro and others 2011). For all food-handling behaviors
evaluated in a meta-analysis, consumer knowledge of safe-handling practices did not
corresponded with reported use of the practices, suggesting that knowledge is a poor
indicator of actual behavior (Patil and others 2005). In their review of 88 consumer food-
safety studies, Redmond and Griffith (2003) suggested that knowledge, attitudes,
intentions, and self-reported practices did not correspond to observed behaviors
(Redmond and Griffith 2003). Males and those consumers with higher levels of education
are more likely to practice unsafe food-handling behaviors and more likely to eat
potentially risky foods (Sean and others 1999). A survey of young adults (4,343) enrolled
at 21 colleges and universities located in 17 US states (Byrd-Bredbenner and others
2008) indicated no significant differences in risky eating-behavior between students who

12
have addressed food safety with those who had not completed such a course.
Nevertheless, a lack of knowledge does not mean that the use of an unsafe practice is
imminent. For example, although only 7% of consumers knew the temperatures required
for the adequate cooking of foods, 80% of consumers were observed to cook their foods
to proper temperatures (Redmond and Griffith 2003). These data imply that consumers
are concern about food safety however; barriers associated in implementing safe
practices, in general, may account for higher noncompliance. On the other hand, some
desired properties of foods (e.g. well-done meats) may lead to greater food safety.
Bridging the gap between food-safety
knowledge and safe food behaviors
Not all food-safety recommendations are easy to implement for food operators
and consumers (Koeppl 1998; Clayton and others 2003; Porticella and others 2008).
Therefore, Redmond and Griffith (2003) suggest that positive attitudes toward food-
safety concepts do not always correspond with safe food-handling practices. Researchers
(Koeppl 1998; Clayton and others 2002) have identified several barriers to safe food-
handling practices including time, inconvenience, lack of resources, lack of staff, lack of
easy-to-use instructions, and a lack of resources. The compliance to safety
recommendations will potentially increase if food operators and consumers are presented
with alternative ways that are convenient or advantageous to incorporate into their
procedures (Koeppl 1998; Clayton and others 2003; Porticella and others 2008). User-
friendly food processing options provided to operators and consumers can actually

13
support the food-safety objectives of the USDHHS (2011). This is the objective of
Chapter 3 and 4.
Thawing of meat
Meats are safe indefinitely while frozen; however, as soon as meat begins to
defrost and become warmer than 5 °C, any bacteria that may have been present before
freezing can begin to multiply. Improperly thawing of potentially hazardous foods
including meat has been identified as one of the most common food-safety problems
(Alaska DEC 2011; Redmond and Griffith 2003). Meat must be kept at a safe
temperature during defrosting or thawing. The US FDA does not recommend thawing
meat at room temperature or in warm water. Even though the center of a package may
still be frozen as it thaws on the counter or in the warm water, the outer surface of the
thawing meat or poultry will reach temperatures (5 and 57 °C) suitable for rapid growth
of bacterial pathogens. This rapid growth during the lengthy thawing period could result
in an increased risk of infection by enteric pathogens such as Salmonella and Escherichia
coli O157:H7. Although it is possible that these organisms would be subsequently killed
during proper cooking, it is also possible that Staphylococcus aureus would grow enough
during thawing to produce dangerous amounts of heat-stable enterotoxin (Ingham and
others 2005; USDA NCHFP 2006). Enterotoxin would not be inactivated by subsequent
cooking. The US Food and Drug Administration Model Food Code (2005) recommends
several thawing methods for raw meat products: thawing under refrigeration (≤ 5 °C),
thawing submerged under cold (≤ 21 °C) running water, and thawing as part of the
cooking process in the case of microwave thawing. The first two methods are time

14
consuming and microwave thawing produces poor quality product. Accordingly, Damen
and Steenbekkers (2007) reported differences between food-safety knowledge and actual
thawing behavior, which might result in a shortfall in the microbiological safety of the
consumed meat. Other studies (RTI 2002; Patil and others 2005) suggest that many
consumers follow the unsafe practice of defrosting meat and poultry at room temperature.
Therefore, it would be very helpful for food operators and consumers if, within a
reasonable time period, they could safely thaw a required amount of meat product and
subsequently cook it to serve without losing quality. A method that is both safe and quick
would assist foodservice operators and consumers and help provide options that maintain
food safety.
Cooking of hamburger patties
Cooking of potentially hazardous foods including raw hamburger to an adequate
temperature is essential to ensure microbial food-safety. Cooking to a recommended
minimum internal-temperature kills pathogens if present in such foods. Americans
consume more than 13 billion ground beef hamburgers annually at home and when
dining out (AMI 2003). Every day, over 30 million children sit down in school cafeterias
to eat a plateful of government-supplied food that includes occasional hamburgers
(USDA FNS 2011). The cooking process of hamburger patties has been questioned due
to outbreaks of foodborne illness (Rita and others 1993; Hague and others 1994; Ahmed
and others 1995; Jackson and others 1996). In most cases, these outbreaks have been
traced to undercooked ground beef contaminated with Escherichia coli O157:H7
(MMWR 1994; USDA FSIS 2003). Increased regulatory scrutiny and implementation of

15
new sanitary procedures by beef processors have reduced but not eliminated the number
of outbreaks traced to E. coli O157:H7 in recent years (MMWR 2002), and adequate
cooking is therefore still essential to protect consumers from potential infection by
hamburger products. Although the overall burden of disease caused by E. coli O157:H7
is not as high as the top five foodborne pathogens (Salmonella spp., Toxoplasma gondii,
Campylobacter spp., Listeria monocytogenes, Norovirus in decreasing order of burden
rank), individual cases of disease are devastating both physically and financially, and
often occur in small children, a sensitive sub population that warrants particular
protection (Batz and others 2011). In 2006, almost 20% of Americans reported
consuming pink hamburger (Lando 2006). On the other hand, participants in a focus
group study by RTI (2002) reported overcooking hamburger as an extra cautionary
measure for food safety. Therefore, a moderate-temperature treatment (lower temperature
than grill or pan-frying) that will cook a hamburger uniformly (without overcooking the
surface or undercooking the interior) will provide consumers and food operators with an
alternative method to prepare safe and quality hamburgers.
Hot holding of cooked hamburger patties
Growth of harmful bacteria and development of toxins (poisons) formed by
bacteria occur rapidly in potentially hazardous foods when held at temperatures between
5 and 57 °C. Therefore, food regulatory agencies suggest that the prepared potentially
hazardous foods that are later served warm be held at 57 °C or higher. However, hot
holding can cause considerable undesired additional cooking or ‗overcooking‘ of food.
The moisture or water present in food is lost during holding, potentially affecting the

16
sensory quality and yield (Hultin 1985). A method of safely holding cooked hamburger
patties without sacrificing its sensory attributes will be very helpful for both consumers
and food establishments. Holding cooked food hot without adversely affecting its sensory
quality would allow operators to expand their menus without increasing service times.
Mathematical modeling of growth
of pathogenic bacteria
Conducting microbiological challenge studies are time-consuming and expensive.
Mathematical microbiological models are increasingly being used to evaluate the
potential for growth of microorganisms in foods during processing and storage (Bovil and
others 2001). Predictive models are computer-based programs that simulate or predict
how specific microorganisms will behave in a formulation under specific conditions such
as pH, aw, moisture, salt, and preservatives (US FDA 2009). It is known that time and
temperature are two of the most important physical factors affecting the growth of
bacteria in foods. Therefore, modeling the effect of temperature on the growth of bacteria
in food products can reliably predict and estimate potential growth of the bacteria during
processing and storage (Juneja and others 2009). Several microbial growth models have
been developed that allows predicting growth without the need for large scale
microbiological testing. Those models can be used to predict the growth and inactivation
of foodborne bacteria, primarily pathogens, under various environmental conditions.
These predictions are specific to certain bacterial strains and specific environments (e.g.,
culture media, food, etc.) that were used to generate the models (USDA ARS 2006).

17
Sensory test
Sensory tests use human subjects as instruments to evaluate positive and negative
properties of food and other consumer products. Whenever a sensory test is conducted, a
group of subjects is selected as a sample of some larger population, about which the
sensory analyst hopes to draw some conclusion.
According to Meilgaard and others (1999), a triangle sensory test is used to
determine whether an overall sensory difference exists between two products including
food. This method is particularly useful in situations where treatment effects may have
produced product changes, which cannot be characterized simply by one or two
attributes. This test is effective to determine whether product differences result from
change in ingredients, processing, packaging, or storage. In this test, each subject (20 to
40) is presented with three coded samples. The subjects are instructed that two samples
are identical and one is different (odd). The subjects are asked to taste each product from
left to right and select the odd sample. The number of correct replies (correctly identified
odd samples) is counted and the result is interpreted in reference to the critical number of
correct responses in a triangle test (Appendix B). If the number of correct response is
equal to or greater than the critical number, the difference is significant at the stated
significance level for the corresponding number of respondents and the assumption of
―no difference‖ is rejected.
A consumer acceptance test in sensory science is used when there is a need to
determine how well a product is liked by consumers. The product is compared to a well-
liked company product or that of a competitor, and a hedonic scale is used to indicate the

18
degrees of unacceptable or acceptable, or dislike to like. From relative acceptance scores
one can infer preference; the sample with the higher score is preferred. A nine-point
hedonic scale is commonly used. Besides its other uses, this test helps in product
improvement/optimization, development of new products, and also to assess market
potential.
Role of salt in human health
and food preservation
Salt (NaCl) is the major source of sodium in foods we consume. Sodium is an
essential nutrient and is needed by the body in relatively small quantities, provided that
substantial sweating does not occur (USDA and USDHHS 2010). Too much sodium can
increase blood pressure and risk for a heart attack and stroke. Heart disease and stroke are
the first and third killers of men and women respectively in the United States each year
(CDC 2011). The estimated average intake of sodium for all Americans ages 2 years and
older is approximately 3,400 mg per day (USDA and USDHHS 2010). The 2005 dietary
guidelines for Americans recommend that adults in general should consume no more than
2,300 mg of sodium per day. However, individuals with high blood pressure, diabetes, or
chronic kidney disease; African Americans; and individuals aged 51 years or older should
consume no more than 1,500 mg of sodium per day. The 1,500 mg recommendation
applies to about half of the US population overall and the 69% of adults (CDC 2009;
CDC 2011).
Salt has been used to preserve meat, fish, vegetables, eggs, and even some fruit,
such as olives, for thousands of years. Its primary effect is to reduce water activity of
foods so that there is not enough water available for growth of pathogenic or spoilage

19
organisms (Doyle 2008). Sofos (1984) thoroughly reviewed the antimicrobial properties
of NaCl in foods and concluded that removal or reduction of salt from processed foods
should be based on the results of appropriate research.
Nutritional quality and microbial safety
of cheese
Johnson and others (2009) state the following: ―Cheese (hard type) is a nutrient-
dense food that contributes 9% of the protein, 11% of the phosphorus, and 27% of the
calcium in the US food supply. The 2005 Dietary Guidelines for America recognizes that
people who consume dairy foods have better overall diets, consume more nutrients, and
have improved bone health, compared to nondairy consumers. However, cheese is also
perceived as being high in fat and sodium (NaCl). This discourages some, especially
older consumers from including cheese in their diets.‖ Salt in Cheddar cheese comes
mainly from the direct addition of salt. Cheddar cheese typically contains 310 mg sodium
per 50 g (Guinee and O'Kennedy 2007; Johnson and others 2009; Agarwal and others
2011). Depending on age and other individual characteristics of the population, a serving
(28.5 g) of Cheddar cheese contains 7.5 to 12.0 % of the dairy recommended limit (less
than 2,300 or 1,500 mg depending on person) for sodium. The 1,500 mg sodium
recommendation limit applies for over two-thirds of US adults. Reducing the sodium
content in cheese is expected to contribute to reducing the overall dietary intake of
sodium by the US consumers.
Cheese is a fermented milk product, where the pH is reduced from 6.6 in milk to a
typical value of ≤ 5.3 in fresh curd due to the conversion of lactose in milk to lactic acid
by added starter culture. Together with a desired pH, water activity and redox potential,

20
salt has a major influence on the cheese microbiology, inhibiting the growth of pathogens
and controlling the populations of starter bacteria and adventitious, non-starter lactic acid
bacteria in the final cheese (Guinee and O'Kennedy 2007). Bishop and Smukowski
(2006) recommended that hard (≤ 39% moisture) and semi-soft (> 39 to < 50% moisture)
cheeses, manufactured under good manufacturing procedures with pasteurized or heat
treated (≥ 63 °C for ≥ 16 sec) milk, containing < 50% moisture and active lactic acid
starter cultures, along with traditional levels of salt, pH, and fat be allowed to be ripened,
stored and distributed at a temperature not exceeding 30°C. According to Code of Federal
Regulation, the minimum milkfat content in Cheddar cheese is 50% by weight of the
solids, and the maximum moisture content is 39% by weight.
Salmonella and Salmonellosis
According to CDC estimates, Salmonella is the leading pathogen in terms of
annual deaths and hospitalizations. It is also the leading pathogen when valued in dollars
($3.3 billion) or in impacts to health-related quality of life (loss of 17,000 QALY s) (Batz
and others 2011). The quality-adjusted life year (QALY) is a measure of disease burden,
including both the quality and the quantity of life lived. Salmonellosis, an infection
caused by Salmonella, is associated with a wide variety of foods regulated by both
USDA-FSIS and US-FDA (Batz and others 2011). According to FoodNet surveillance
data, Salmonella is also one of the few foodborne pathogens that has not significantly
declined over the past 10 years (Batz and others 2011).
Salmonella is found in feces, and in soil, dust, and water and on food contact
surfaces contaminated with feces. Illness can result from eating contaminated foods and

21
beverages. As few as one cell of Salmonella may cause illness. According to CDC
(2010b), most persons infected with Salmonella develop diarrhea, fever, and abdominal
cramps 12 to 72 hours after infection. The illness usually lasts 4 to 7 days, and most
persons recover without treatment. However, in some persons, the diarrhea may be so
severe that the patient needs to be hospitalized. In these patients, the Salmonella infection
may spread from the intestines to the blood stream, and then to other body sites and can
cause death unless the person is treated promptly with antibiotics. The elderly, infants,
and those with impaired immune systems are more likely to have a severe illness.
Salmonella can grow at water activity (aw) as low as 0.93. It can adapt to extreme
environmental conditions such as desiccation, pH, and temperature stress (Foster and
Spector 1995). The survival is enhanced at refrigeration and freezing temperatures and at
low aw. Its thermal tolerance is enhanced at pH near 7 and at low aw. Studies (Kotzekidou
1998; Uesugi and others 2006; Ristori and others 2007) have demonstrated its survival in
low aw foods such as halva (aw=0.176), almond, and black pepper (aw=0.663) for at least
8 months, 5 months, and 15 days, respectively.
Listeria monocytogenes and Listeriosis
L. monocytogenes is widely distributed in nature, and the organism has been
recovered from farm fields, vegetables, animals and other environments such as food
processing facilities, retail stores and home kitchens and ready-to-eat foods. Animals can
carry the bacterium without appearing ill and can contaminate foods of animal origin
such as meat and dairy products (VDH 2011). Foods can become contaminated with L.
monocytogenes along the continuum from farm to fork, in the produce growing
22
environment, during processing, or during handling and preparation (e.g. slicing of
cheese) in retail establishments and consumers‘ kitchens (ILSI 2005). The primary route
of transmission is through the ingestion of contaminated food. Unlike most other
foodborne pathogens, it can grow at proper refrigeration temperatures and at pH ≥4.4.
The International Life Sciences Institute (ILSI) in 2005 described high-risk foods for
causing listeriosis as those that are; ready-to-eat, requires refrigeration, and have longer
shelf life. L. monocytogenes infection has been frequently implicated in foodborne illness
associated with such high-risk foods including dairy products (Cole and others 1990;
Gengeorgis and others 1991; CDC 2011b).
Listeria can be a common contaminant in the dairy environment, both on the farm
and in the processing plant. On the farm, important sources include manure and
improperly fermented silage. In the dairy plant, Listeria has been isolated from a variety
of sites, although it is most frequently found in moist environments or areas with
condensed or standing water or milk, including drains, floors, coolers, conveyors and
case washing areas. Pasteurization of milk is effective in destroying L. monocytogenes.
However, post-pasteurization contamination can occur within the processing plant. L.
monocytogenes is capable of growing at refrigeration temperatures. Therefore, even very
low numbers of L. monocytogenes in processed dairy products can multiply to dangerous
levels, despite proper refrigeration. The dairy industry‘s trend toward production of
refrigerated products with longer shelf lives further exacerbates this problem.
According to CDC (2010c), a person with listeriosis, infection caused by Listeria,
usually has fever and muscle aches, often preceded by diarrhea or other gastrointestinal

23
symptoms. Almost everyone who is diagnosed with listeriosis has ―invasive‖ infection, in
which the bacteria spread beyond the gastrointestinal tract. The disease primarily affects
older adults, pregnant women, newborns, and adults with weakened immune systems.
The symptoms vary with the infected person. Pregnant women typically experience only
a mild, flu-like illness. However, infections during pregnancy can lead to miscarriage,
stillbirth, premature delivery, or life-threatening infection of the newborn. With persons
other than pregnant women, in addition to fever and muscle aches, symptoms can include
headache, stiff neck, confusion, loss of balance, and convulsions.
In the year 2009, L. monocytogenes infection was one of the three most expensive
food borne-illnesses in the US (CDC 2010a), with regard to health care cost and time lost
from work. It is one of the leading pathogen in terms of annual deaths (Batz and others
2011). Because L. monocytogenes is abundant in nature and can be found almost
anywhere, there can be a constant reintroduction of the organism into the food plant,
retail setting, foodservice establishment and home. The USDA FSIS (2000) and US FDA
requires absence of L. monocytogenes in 25 g sample (zero tolerance policy) of ready-to-
eat foods.
Microbiological challenge testing
According to US FDA (2009), microbiological challenge testing has been and
continues to be a useful tool for determining the ability of a food to support the growth of
spoilage organism or pathogens. A number of factors must be considered when
conducting a microbiological challenge study. These include the selection of appropriate
pathogens or surrogates, the level of challenge inoculums, the inoculums preparation and

24
method of inoculation, the duration of the study, formulation factors and storage
condition, and sample analyses. The US FDA (2009) states that:
―It is typical to challenge a food formulation with a ‗cocktail‘ or mixture of
multiple strains in order to account for potential strain variation. It is not unusual
to have a cocktail of 5 or more strains of each target pathogen in a challenge
study. The inoculum level used in the microbiological challenge study depends on
whether the objective of the study is to determine product stability and shelf life
or to validate a step in the process designed to reduce microbial numbers.
Typically, an inoculum level of between 102 - 10
3 cells/g of product is used to
ascertain the microbiological stability of a formulation. When validating a process
lethality step such as heat processing, high pressure processing, or irradiation,
however, it is usually necessary to use a high inoculum level (for example, 106 -
107 cells/g of product) to demonstrate the extent of reduction in challenge
organisms.‖
The objective of Chapter 5 and 6 in this dissertation was to determine the stability
of the low-salt Cheddar against pathogens. Additional objective was to enumerate the
pathogens and compare (statistically) the difference in pathogen reduction or survival
between low- and full-salt Cheddar over time. Therefore, the level of inoculum used was
103 – 10
4 cells/g of the product tested. This level of bacterium will enable to clearly/easily
trace any trends in the behavior. Scott and others (2005) suggest using 3 to 5 strains of L.
monocytogenes, either individually or in combination, to account for variations in growth
and survival among strains. The US FDA (2009) further states that:

25
―The method of inoculation must not change the critical parameters of the
product formulation undergoing challenge. The smallest amount of water or
buffer practical for suspension of the inoculum should be used. Products or
components with aw <0.92 must be ensured that the final product aw or moisture
level has not been changed. Enough product should be inoculated so that a
minimum of three replicates per sampling time is available throughout the
challenge study. In some cases, such as in certain revalidation studies and for un-
inoculated control samples, fewer replicates may be used. It is desirable to
challenge the product for its entire desired shelf life plus a margin beyond the
desired shelf life because it is important to determine what would happen if users
would hold and consume the product beyond its intended shelf life. Some
regulatory agencies require a minimum of data on shelf life plus at least one-third
of the intended shelf life. Another consideration impacting the duration of the
challenge study is the temperature of product storage. Refrigerated products may
be challenged for their entire shelf life under the target storage temperature, but
under abuse temperatures they are typically held for shorter time. The frequency
of testing is governed by the duration of the microbiological challenge study. It is
desirable to have a minimum of 5-7 data points over the shelf life in order to have
a good indication of the inoculum behavior. The storage temperature used in the
microbiological challenge study should include the typical temperature range at
which the product is to be held and distributed. A refrigerated product that may be
subject to temperature abuse should be challenged under representative abuse

26
temperatures. It is also important to track pertinent physico-chemical parameters
of the product over shelf life to see how they might change and influence the
behavior of the pathogen. Understanding how factors such as aw, moisture, salt
level, pH, MAP gas concentrations, preservative levels, and other variables
behave over product shelf life is key to understanding the microbiological
stability of the product. Selection of microorganisms to use in challenge testing
and/or modeling depends on the knowledge gained through commercial
experience and/or on epidemiological data that indicate that the food under
consideration or similar foods may be hazardous due to pathogen growth. In
addition, the intrinsic properties (for example, pH, water activity, and
preservatives) and extrinsic properties (for example, atmosphere, temperature, and
processing) should be considered while selecting the microorganisms.‖
References
Agarwal S, McCoy D, Graves W, Gerard PD, Clark S. 2011. Sodium content in retail
Cheddar, Mozzarella, and process cheeses varies considerably in the United
States. J Dairy Sci 94:1605–15.
Ahmed NM, Conner DE, Huffman DL. 1995. Heat-resistance of Escherichia coli
O157:H7 in meat and poultry as affected by product composition. J Food Sci
60:606–10.
Alaska DEC (Department of Environmental Conservation). 2011. Available from:
http://www.dec.state.ak.us/eh/fss/establishments/21reason.htm. Accessed Jun 21,
2011.

27
AMI (American Meat Inst).2003. Analysts say consumers still confident in U.S. beef
safety. Available from: http://www.meatami.com/ht/d/ArticleDetails/i/3276.
Accessed Jun 3, 2009.
Batz MB, Hoffmann S, Morris JG Jr. 2011. Ranking the risks: The 10 pathogen-food
combinations with the greatest burdon on public health. Gainesville, FL:
Emerging Pathogens Institute, University of Florida. 68 p.
Bishop JR, Smukowski M. 2006. Storage temperatures necessary to maintain cheese
safety. Food Prot Trends 26:714–724.
Bovil RA, Bew J, Baranyi J. 2001. Measurements and predictions of growth for Listeria
monocytogenes and Salmonella during fluctuating temperature. II. Rapidly
changing temperatures. Int J Food Microbiol 67: 131–137.
Byrd-Bredbenner C, Abbot J, Wheatley V, Schaffner D, Bruhn C, Blalock L. 2007. Food
safety self-reported behaviors and cognitions of young adults. Results of a
national study. J Food Prot 70:1917–1926.
Byrd-Bredbenner C, Abbot J, Wheatley V, Schaffner D, Bruhn C, Blalock L. 2008. Risky
eating behaviors of young adults—Implications for food safety education. J Am
Diet Assoc 108:549-52.
Byrd-Bredbenner C, Abbot J, Schaffner D. 2010. How food safe is your home kitchen?
A self-directed home kitchen audit. J Nutrition Education and Behavior 42:286-
289.
28
Cates S. 2002. Changes in consumer knowledge, behavior, and confidence since the 1996
pr/haccp final rule. Paper presented at the thinking globally—working locally.
Orlando, FL: Conference on Food Safety Education.
CDC (Centers for Disease Control and Prevention). 2006. Surveillance for food borne-
disease outbreaks—United States, 1998–2002. Morbidity and mortality weekly
report, 55(SS-10), 1–42.
CDC (Centers for Disease Control and Prevention). 2009. MMWR Highlights: Salt
consumption. Available from: http://www.cdc.gov/salt/pdfs/MMWR_06.pdf.
Accessed Nov 06, 2011.
CDC (Centers for Disease Control and Prevention). 2010a. Foodborne illness. Available
from: http://www.cdc.gov/ncidod/dbmd/diseaseinfo/food-
borneinfections_g.htm#howmanycases. Accessed Jun 21, 2011.
CDC (Centers for Disease Control and Prevention). 2010b. What is Salmonellosis?
Available from: http://www.cdc.gov/salmonella/general/index.html. Accessed Jun
21, 2011.
CDC (Centers for Disease Control and Prevention). 2010c. Listeriosis. Available from:
http://www.cdc.gov/nczved/divisions/dfbmd/diseases/listeriosis/. Accessed Jun
21, 2011.
CDC (Centers for Disease Control and Prevention). 2011. Most Americans Should
Consume Less Sodium. Available from: http://www.cdc.gov/salt/. Accessed Jun
21, 2011.

29
CDC (Centers for Disease Control and Prevention). 2011b. Listeriosis - causes. Available
from: http://www.cdc.gov/listeria/causes.html. Accessed Jan 24, 2012.
Clayton D, Griffith C, Price P, Peters A. 2002. Food handlers‘ beliefs and self-reported
practices. Int J Environ Health Res 12:25 – 39.
Clayton DA, Griffith CJ, Price P. 2003. An investigation of the factors underlying
consumers‘ implementation of specific food safety practices. British Food J
105:434–453.
Cogan TA, Bloomfield SF, Humphrey TJ. 1999. The effectiveness of hygiene procedures
for prevention of cross-contamination from chicken carcasses in the domestic
kitchen. Lett Appl Microbiol 29:1–18.
Cole MB, Jones MV, Holyoak C. 1990. The effect of pH, salt concentration and
temperature on the survival and growth of Listeria monocytogenes. J Appl
Bacteriol 69:63–72.
Damen FWM, Steenbekkers LPA. 2007. Consumer behaviour and knowledge related to
freezing and defrosting meat at home: an exploratory study. British Food J
109:511 – 518.
Davey GR. 1985. Food-poisoning in New South Wales 1977–1984. Food Technol
Australia 37: 453–456.
Doyle ME. 2008. FRI Briefings: Sodium reduction and its effects on food safety,
food quality, and human health-a brief review of the literature. Food Research
Institute, University of Wisconsin–Madison. Available from:

30
http://fri.wisc.edu/docs/pdf/FRI_Brief_Sodium_Reduction_11_08.pdf. Accessed
Sep 23, 2011.
Foster JW, Spector MP. 1995. How Salmonella survive against the odds. Annu Rev
Microbiol 49:145-174.
Genigeorgis C, Carniciu M, Dutulescu D, Farver TB. 1991. Growth and survival of
Listeria monocytogenes in market cheeses stored at 4 to 30 °C. J. Food Prot.
54:662–668.
Green LR, Selman C, Banerjee A, Marcus R, Medus C, Angulo F, Radke V, Buchanan S,
EHS-Net Working Group. 2005. Food service workers' self-reported food
preparation practices: An EHS-Net study. Int J Hyg Environ Health 208:27-35.
Guinee TP, O'Kennedy BT. 2007. Reducing salt in cheese and dairy spreads. In: Kilcast
D, Angus F, editors. Reducing salt in foods: practical strategies. Cambridge, UK:
Woodhead Publishing in Food Science, Technology and Nutrition. p 316-357.
Hague MA, Warren KE, Hunt MC, Kropf DH, Kastner CL, Stroda SL, Johnson DE.
1994. Endpoint temperature, internal cooked color, and expressible juice color
relationships in ground beef patties. J Food Sci 59:465–70.
Harrison WA, Griffith CJ, Tennant D. 2001. Determining exposure assessment and
modeling risks associated with the preparation of poultry products in institutional
catering and the home. A report for Food Standards Agency, London.
Howes M, McEwen S, Griffiths M, Harris L. 1996. Food handler certification by home
study: measuring changes in knowledge and behaviour. Dairy Food Environ Sanit
16: 737– 44.

31
Hultin H. 1985. Characteristics of muscle tissue. In: Fennema O, editor. Food chemistry.
New York: Marcel Dekker. p 725–89.
ILSI (International Life Sciences Institute). 2005. Achieving continuous improvement in
reductions in foodborne listeriosis – A risk based approach. J Food Prot 68:1932-
1994.
Ingham SC, Wadhera RK, Fanslau MA, Buege DR. 2005. Growth of Salmonella
serovars, Escherichia coli 0157:H7, and Staphylococcus aureus during thawing of
whole chicken and retail ground beef portions at 22 and 30 °C. J Food Prot 68:
1457–1461.
Jackson TC, Hardin MD, Acuff GR. 1996. Heat resistance of Escherichia coli O157:H7
in a nutrient medium and in ground beef patties as influenced by storage and
holding temperatures. J Food Prot 59:230–7.
Johnson ME, Kapoor R, McMahon DJ, McCoy DR, Narasimmon RG. 2009. Reduction
of sodium and fat levels in natural and processed cheeses: scientific and
technological aspects. Comp Rev Food Sci Food Safety 8: 252-268.
Jones TF, Pavlin BI, LaFleur BJ, Ingram LA, Schaffner W. 2004. Restaurant inspection
scores and foodborne disease. Emerg Infect Dis. Available from:
http://www.cdc.gov/ncidod/EID/vol10no4/03-0343.htm. Accessed Sep 23, 2011.
Josephson KL, Rubino JR, Pepper IL. 1997. Characterization and quantification of
bacterial pathogens and indicator organisms in household kitchens with and
without the use of a disinfectant cleaner. J Appl Microbiol 83:737–750.

32
Juneja VK, Melendres MV, Huang L, Subbiah J, Thippareddi H. 2009. Mathematical
modeling of growth of Salmonella in raw ground beef under isothermal
conditions from 10 to 45 °C. Int J Food Microbiol 131:106–111.
Koeppl PT. 1998. Final report. Focus groups on barriers that limit consumers‘ use of
thermometers when cooking meat and poultry products. Phase one contract no.
43-3A94-7-1637. Available from:
http://www.fsis.usda.gov/oa/topics/focusgp.pdf. Accessed Mar 20, 2010.
Kotzekidou P. 1998. Microbial stability and fate of Salmonella enteritidis in halva, a low-
moisture confection. J Food Prot. 61:181-185.
Lando A. 2006. Food handling and consumption—Population estimates from the 1988-
2006 FDA/FSIS food safety survey and 2006 demographic analysis. Presented at:
USDA Food Safety and Inspection Service 2006 Food Safety Education
Conference. September 2006, Denver, CO.
Lynch M, Painter J, Woodruff R, Braden C. 2006. Surveillance for foodborne-disease
outbreaks–United States, 1998–2002. MMWR Surveillence Summary 55:1–34.
Available from: http://www.cdc.gov/mmwr/preview/mmwrhtml/ss5510a1.htm.
Accessed Sep 23, 2011.
Meilgaard M, Civille GV, Carr BT. 1999. Sensory evaluation techniques. 3rd
ed. Boca
Raton, FL: CRC.
Mitchell RE, Fraser AM, Bearon LB. 2007. Preventing food-borne illness in food service
establishments: broadening the framework for intervention and research on safe
food handling behaviors. Int J Environ Health Res 17: 9-24.

33
MMWR (Morbidity and Mortality Weekly Report). 1994. Escherichia coli O157:H7
outbreak linked to home-cooked hamburger—California July 1993. MMWR
43:213–6.
MMWR (Morbidity and Mortality Weekly Report). 2002. Multistate outbreak of
Escherichia coli O157:H7 infections associated with eating ground beef—United
States, June–July 2002. MMWR 51(29):637–9.
Olsen S, MacKinon L, Goulding J, Bean N, Slutker L. 2000. Surveillance for foodborne
disease outbreaks – United States 1993 – 1997. MMWR Surveillance Summaries,
49 (SS01): 1 – 51. Available from: http://www.cdc.gov/mmwr/preview/mmwr
html/ss4901a1.htm. Accessed Jun 21, 2011.
Patil SR, Cates S, Morales R. 2005. Consumer food safety knowledge, practices, and
demographic differences: findings from a meta-analysis. J Food Prot 68: 1884-94.
Porticella N, Shapiro MA, Gravani RB. 2008. Social barriers to safer food preparation
and storage practices among consumers. Paper presented at the International
Communication. Available form:
http://citation.allacademic.com//meta/p_mla_apa_research_citation/2/3/2/5/8/page
s232589/p232589-2.php. Accessed Jun 21, 2011.
Redmond EC, Griffith CJ. 2003. Consumer food handling in the home: a review of food
safety studies. J Food Prot 66:130–161.
Redmond EC, Griffith CJ, Slader J, Humphrey TJ. 2001. The evaluation and application
of information on consumer hazard and risk to food safety education. CSA 5107.
Food Standards Agency, London.
34
Ristori CA, Pereira MAS, Gelli DS. 2007. Behavior of Salmonella Rubislaw on ground
black pepper (Piper nigrum L.). Food Control 18:268–272.
Rita M, Franzetti L, Mattioli A, Galli A. 1993. Microorganism lethality during
microwave cooking of ground meat. 1. Effect of dishomogeneity of surface power
density. Ann Microbiol Enzymol 43:115–29.
RTI (Research Triangle Institute). August 2002. PR/HACCP Rule Evaluation Report—
Focus Group Findings on Changes in Consumer Knowledge, Behavior, and
Confidence Since the 1996 PR/HACCP Final Rule. Final report prepared for the
U.S. Department of Agriculture, Food Safety and Inspection Service.
Rusin P, Orosz-Coughlin P, Gerba C. 1998. Reduction of faecal coliform and
hetertrophic plate count bacteria in the household kitchen and bathroom by
disinfection with hypochlorite cleaners. J Appl Microbiol 85:819–828.
Scott VN, Swanson KMJ, Freier TA, Pruett PJr, Sveum WH, Hall PA, Smoot LA, Brown
DG. 2005. Guidelines for conducting Listeria monocytogenes challenge testing of
foods. Food Protection Trends 25:818-25.
Sean FA, Samantha Y, Babagaleh B, Timbo, Frederick JA. 1999. A multi-state survey of
consumer food-handling and food-consumption practices. Am J Preventive
Medicine 16: 216-221.
Shapiro MA, Porticella N, Jiang LC, Gravani RB. 2011. Predicting intentions to adopt
safe home food handling practices. Applying the theory of planned behavior.
Appetite 56: 96-103.

35
Sofos JN. 1984. Antimicrobial effects of sodium and other ions in foods: a review. J Food
Safety 6:45–78.
Uesugi AR, Danyluk MD, Harris LJ. 2006. Survival of Salmonella enteritidis phage type
30 on inoculated almonds stored at -20, 4, 23, and 35 degrees C. J Food Prot
69:1851-7.
Unklesbay N, Sneed J, Toma R. 1998. College students' attitudes, practices, and
knowledge of food safety. J Food Prot 61: 1175-1180.
USDA ARS (Agricultural Research Service). 2006. Pathogen modeling program -
getting started. Available form:
http://ars.usda.gov/Services/docs.htm?docid=6784. Accessed Jun 21, 2011.
USDA FNS (Food and Nutrition Service). 2011. National School Lunch Program:
Program Fact Sheet. Available from: http://www.fns.usda.gov/cnd/lunch/.
Accessed Sep 23, 2011.
USDA FSIS (Food Safety and Inspection Service). 2000. FSIS Action Plan for
Addressing Listeria monocytogenes. Available from:
http://www.fsis.usda.gov/oa/background/lmplan.htm. Accessed Jun 22, 2011.
USDA FSIS (Food Safety and Inspection Service). 2003. Color of Cooked Ground Beef
as It Relates to Doneness. Available from:
http://www.fsis.usda.gov/Factsheets/Color_of_Cooked_Ground_Beef/index.asp.
Accessed Jun 3, 2009.
USDA NCHFP (National Center for Home Food Preservation). 2006. Available form:
http://www.uga.edu/nchfp/how/freeze/thawing.html. Accessed Jun 21, 2011.

36
USDHHS (US Department of Health and Human Services). 2011. US Government
Printing Office (GPO), Washington, DC — Health People 2020. Available from:
http://www.healthypeople.gov/2020/topicsobjectives2020/objectiveslist.aspx?topi
cId=14. Accessed Jun 22, 2011.
US Department of Agriculture and US Department of Health and Human Services. 2010.
Dietary guidelines for Americans, 2010. 7th
ed., Washington, DC: U.S.
Government Printing Office.
US FDA. 2005. Food code 3.501.13. Available from: http://
www.cfsan.fda.gov/~acrobat/fc05-3.pdf. Accessed 20.11.07.
US FDA. 2009. Chapter 6. Microbiological Challenge Testing. Available from:
http://www.fda.gov/Food/ScienceResearch/ResearchAreas/SafePracticesforFoodP
rocesses/ucm094154.htm. Accessed Nov 06, 2011.
US FDA. 2011. Retail Food Protection. Available from:
http://www.fda.gov/Food/FoodSafety/RetailFoodProtection/default.htm.
Accessed Jun 22, 2011.
Vermont DH (Department of Health). 2011. Listeriosis. Available from:
http://healthvermont.gov/prevent/listeriosis/Listeriosis.aspx. Accessed Nov 06,
2011.
Wall PG, Adok G, Evans H, Le Baigue S, Ross D, Ryan M, Cowden, J. 1995. Outbreak
of foodborne infecious intestinal disease in England and Wales 1992–1993.
Proceedings of the Conference on Foodborne Diseases: Consequences and
Prevention; 30–31 March 1995; Oxford: Oxford Brooks University.

37
WHO (World Health Organization). 2012. Food safety and foodborne illness. Available
from: http://www.who.int/mediacentre/factsheets/fs237/en/. Accessed Jan 24,
2012.
Wilcock A, Pun M, Khanona J, Aung M. 2004. Consumer attitudes, knowledge and
behavior. A review of food safety issues. Trends in Food Sci and Technol 15:56–
66.
Worsfold, D. 1997. Food safety behaviour in the home. Br Food J 99:97–104.
Zhao P, Zhao T, Doyle MP, Rubino JR, Meng J. 1998. Development of a model for
evaluation of microbial cross-contamination in the kitchen. J Food Prot 61:960–
963.

38
CHAPTER 3
SENSORY QUALITY AND FOOD SAFETY OF BONELESS CHICKEN BREAST
PORTIONS THAWED RAPIDLY BY SUBMERSION IN HOW WATER
Abstract
Boneless chicken breast portions were thawed by submersion in hot water (60 ºC)
and compared to refrigerator thawing. Thawing in hot water was significantly quicker (2–
8.5 min) than refrigerator thawing (10–15.5 h). Thawing time in hot water increased with
an increase in meat thickness. Sensory panelists could not distinguish a difference
between hot water versus refrigerator thawed and subsequently grilled chicken breast
portions. A model for Salmonella growth predicts that thawing chicken breast at the
slowest rate in this study (0.5 ºC/min) would result in a lower increase in the Salmonella
concentration than that expected for room temperature storage for 4 h.
1. Introduction
Freezing meats is an excellent mechanism to preserve both quality and safety. For
example, the USDA FSIS (2006) recommends that raw chicken be stored for no more
than 48 h under refrigerated temperatures to protect safety and quality. Quality shelf life
can be extended to 4 months if chicken breast meat is frozen under optimal conditions
and the ‗‗safety‖ shelf life is listed as indefinite by the USDA FSIS (2006). The difficulty
for foodservice operations lies not in the freezing process, but rather in the thawing
process. Most frozen meats require thawing before cooking. High temperature cooking
Reprinted with modifications from Shrestha S, Schaffner D, Nummer BA. 2009. Sensory
quality and food safety of boneless chicken breast portions thawed rapidly by submersion
in hot water. Food Control 20:706-708.

39
processes, such as grilling of frozen or partially frozen meats, increases the chance that
the innermost portions are undercooked and the outermost portions are overcooked
(National Advisory Committee on Microbiological Criteria for Foods, 2007).
The US Food and Drug Administration Model Food Code (2005) recommends
several thawing methods for raw meat products: thawing under refrigeration (≤ 5 ºC),
thawing submerged under cold (≤ 21 ºC) running water, and thawing as part of the
cooking process in the case of microwave thawing. Each of these thawing methods
presents some disadvantages to the foodservice operator. Thawing under refrigeration or
running water can be time consuming. In a study by Anderson, Sun, Erdogdu, and Singh
(2004) hamburger patties, salmon steak, and chicken breast portions required
approximately 4–12 h to thaw from -18 to -2 ºC. Leunga, Chinga, Leunga and Lamb
(2007) reported that 125 mm diameter pork portions required approximately 3.7 h to thaw
under 24 ºC running water. Additional disadvantages for running water thawing include
the potential for cross contamination of microorganisms and the excessive consumption
and discharge of water.
Microwave thawing requires significantly less time than refrigerator or running
water thawing (Li & Sun, 2002). Microwaves penetrate and produce heat deep within
food materials accelerating thawing. Since heat is generated in microwave thawing, it is
recommended only as part of the cooking process in the US FDA Model Food Code
(2005). The disadvantage of microwave thawing is localized overheating (run-away
heating) within a food that can result in a loss of quality (Li & Sun, 2002).

40
In this study we propose that submersion in hot water can be used to rapidly thaw
chicken breast portions, while retaining quality and safety. The hot water thawing
temperature was chosen as 60 ºC (140 ºF), an approximate temperature setting for
foodservice hot holding equipment. This temperature is also not expected to cause
localized or surface overheating of the meat. Thawing times and temperatures were used
to determine the risk of Salmonella growth. Hot water thawed and refrigerator thawed
(control) chicken breast portions were then grilled and subjected to a sensory panel.
2. Materials and methods
2.1. Sample preparation
Boneless, butterfly cut, chicken breast was obtained from a local grocery store
(Lee‘s Market, Logan, UT), transported within 15 min to the laboratory. Samples were
from the same supplier (Pilgram‘s Pride, Pittsburg, TX) and had no additives. Butterflied
chicken breast portions were cut in half. One portion of the butterfly half was subjected to
hot water thawing (treatment) and the other to refrigerator thawing (control). Portions
were trimmed as necessary to achieve more uniform thicknesses, weighed, and placed
inside a 3 mil thickness plastic bag (10 x 12 in.). Bags were not sealed. A thermocouple
probe (Omega Engineering Inc., HTTC36-K-316G-6, Stamford, CT) was inserted into
the center of the thickest portion of the meat. Samples were placed between metal trays
and weights were placed on top of the trays to help compress the meat and minimize the
difference in thickness within individual portions. Samples were frozen in a -22 ºC blast
freezer overnight. Maximum chicken breast thickness was measured using a Digimatic
caliper (Model CD-6‖ BS, Mitutoyo Corp., Aurora, IL) after freezing.

41
2.2. Thawing
Treatment samples with various thicknesses were thawed to -1 ºC in a
thermostatically controlled, restaurant-style, steam table (Vollrath Serve Well, Model
38102, Sheboygan, WI). The steam table held approximately 18 l of water and was set to
maintain a temperature of 60 ºC. Experimental temperatures deviated ±3 ºC. Control
samples (various thickness) were thawed in a consumer-style refrigerator (Admiral,
Chicago, IL) that experimentally maintained a temperature of 0.0 -2.7 ºC during the
study. Temperature probes frozen in chicken breast portions were connected to a data
logger (Measurement Computing Corp., Norton, MA) and thawing temperatures were
recorded on a PC. Thaw loss was measured as difference in weight of sample before and
after thawing.
2.3. Cooking and sensory analysis
Three thickness levels were chosen for sensory analysis and run independently.
Immediately after the thawing, both the treatment and control samples were cooked
uniformly on a gas grill (Sunbeam, Neosho, MO) to an internal temperature of 74 ºC.
Cooking temperature was measured using a thin probe digital thermometer (Cooper,
Middlefield, CT) inserted into the center of the thickest area. Cooked meat samples were
immediately served to waiting panelists. The three (different thicknesses) triangle test
analyses were performed with the same 18 panelists. Panelists were recruited by placing
poster notices in the USU Dairy bar and throughout the Nutrition, Dietetics, and Food
Sciences building. To participate, panelists were required to be 18 to 65 y old, with no
food allergies, and identify themselves as consumers of chicken meat. Panelists were

42
asked to discriminate between the control (refrigerator thawed and grilled) and treatment
(hot water thawed and grilled) chicken breasts. Panelists were required to select the
different sample (forced choice) and were also asked to comment on their criteria for
their choice. Panelists received an ice cream cone coupon redeemable in the USU Dairy
bar as compensation for their participation.
2.4. Mathematical modeling
A mathematical model for the effect of temperature on the growth rate of
Salmonella was developed based on 112 growth rates extracted from 12 previously
published studies (Dominguez & Schaffner, 2007). The data were modeled using an
extended square-root or Ratkowsky equation (Ratkowsky, Lowry, Mc Meekin, Stokes, &
Chandler, 1983) relating the square-root of the bacterial growth rate (GR) and storage
temperature (t) in °C
Sqrt(GR) = b x (t- tmin) x (1 – exp (c x (t- tmax)))
where tmin and tmax are the theoretical minimum and maximum temperatures (°C)
beyond which the growth is not possible; b and c are regression constants. Non-linear
regression analysis was performing using SigmaPlot version 8 (SYSTAT, San Jose, CA).
Model predictions were carried out using Excel (Microsoft, Redmond, WA).
2.5. Experimental design and statistics
To study the effect of sample thickness on thawing time, 27 values acquired from
six independent trials for each of the treatment were categorized into five different ranges
(10–13; 13–16; 16–19; 19–22; and 22–27 mm) of sample thickness. For each thickness

43
range, means and standard errors of means were calculated. Means were separated using
the Fisher‘s least significance difference (LSD) procedure of multivariate analysis of
variance (MANOVA; Statsoft Inc., Tulsa, OK, USA) and results analyzed at the 5% level
of significance. For the convenience, the treatments were categorized into three thickness
ranges for sensory analysis. Sensory data were collected and analyzed using SIMS 2000
software (Sensory Computer Systems, Morristown, NJ).
3. Results and discussion
3.1. Thawing chicken breast portions
Water in meat starts to crystallize at -2 ºC (Li & Sun, 2002). In frozen meat, water
crystals start to melt well below its crystallization temperature. Therefore, we believe that
most of the ice crystals formed in frozen meat will melt or at-least starting to melt at -2
ºC. Hence, a thawing endpoint temperature of -1 ºC was used. When chicken breast
samples were thawed by submersion in 60 ºC hot water, samples reached -1 ºC in about
2–8.5 min (111-520 s), significantly dependent on sample thickness (Table 1). The loss of
liquid (thaw loss) from the samples during the thawing process was 2.1–2.5% with no
significant difference between treatments related to thickness.
Chicken breast samples thawed at 0–2.7 ºC (experimental refrigerator
temperature) reached –1 ºC in 10–15.5 h (Table 2). The loss of liquid from the meat
during the thawing process was 0.8–1.7% with no significant difference related to
thickness. Thawing using the hot water versus refrigeration thawing was significantly
different (data not shown, P < 0.05) for both time and thaw loss. In the hot water method,
the time for thawing was significantly more rapid taking only minutes compared to hours.

44
Table 1
Thawing of chicken breast portions at 60 ºC
Thickness n Thickness Initial Time taken Initial Thaw loss
range
(mm)a temperature to reach -1 °C weight
(mm) (°C)
a (s)
a,b (g)
a (%)
a,b,c
10 - 13 7 11.5 ± 0.2 -16.6 ± 0.5 111 ± 9.4
e 152.7 ± 9.6 2.5 ± 0.3
e
13 - 16 6 14.5 ± 0.4 -17.1 ± 0.4 185 ± 10.4 f 203.4 ± 10.0 2.4 ± 0.3
e
16 - 19 6 17.5 ± 0.3 -18.4 ± 0.8 274 ± 16.2 g 214.9 ±16.7 2.4 ± 0.5
e
19 - 22 2 20.0 ± 0.5 -17.4 ± 0.1 342 ± 1.5 h 290.4 ± 25.9 2.6 ± 0.9
e
22 - 27 6 23.7 ± 0.6 -18.1 ± 0.5 520 ± 17.3 i 318.4 ± 11.1 2.1 ± 0.3
e
LSDd
68
1.8
a Data represent the mean ± standard error of mean
b Mean values in the same column with different letters (e-i) are significantly different (P
< 0.05).
n is the number of observations in a given thickness range.
c Thaw loss % = [(Initial weight - thawed weight)/initial weight] x 100
d LSD = least significant difference.
However, the overall thaw loss was significantly less (1.4% versus 2.4%) in the
refrigeration method compared to the hot water method. Visual observation indicated
only a minimal change in the surface color of the meat of the hot water thawed versus
refrigerator thawed samples. This suggests that the hot water temperature did not
significantly denature meat proteins that might reduce quality.
3.2. Food safety analysis
The US FDA Model Food Code (2005) specifies that foods held at temperatures
between 5 and 57 ºC can potentially allow growth of microorganisms and pathogens. If a
thawed chicken breast remains in hot water (60 ºC) for a longer period, the chicken
temperature may rise to temperature between 5 and 57 ºC. Hence, the time required for

45
Table 2
Thawing of chicken breast portions at refrigeration temperatures (0-2.7 °C)
Thickness n Thickness Initial Time taken Initial Thaw Loss
range
(mm)
a temperature to reach -1 °C Weight
(mm) (°C)
a (min)
ab (g)
a (%)
a,b,c
10 - 13 8 11.6 ± 0.2 -13.3 ± 0.3 601 ± 33.3 e 146.0 ± 8.1 1.5 ± 0.3
e
13 - 16 7 14.4 ± 0.3 -16.5 ± 0.4 654 ± 25.8 e 193.9 ± 9.1 1.3 ± 0.3
e
16 - 19 6 18.1 ± 0.3 -19.0 ± 0.9 825 ± 36.2 f 239.4 ± 9.7 1.7 ± 0.3
e
19 - 22 2 21.9 ± 0.1 -17.6 ± 0.8 880 ± 130 f 294.9 ± 18.6 1.6 ± 0.6
e
22 - 27 4 23.1 ± 0.3 -16.7 ± 0.8 930 ± 12.9 f 303.1 ± 9.7 0.8 ± 0.1
e
LSDd
179
1.7
a Data represent the mean ± standard error of mean
b Mean values in the same column with different letters (e-f) are significantly different (P
< 0.05). n is the number of replicates in a given thickness range.
c Thaw loss % = [(Initial weight - thawed weight)/initial weight] x 100
d LSD = least significant difference.
the thickest meat range (22–27 mm; requires significantly longer thawing time) to reach
an internal temperature of 57.5 ºC during this process was monitored to determine the
maximum possible time the meat was exposed to microbial growth temperatures. Data is
shown in Table 3.
Table 3
Time required to reach 57.5 ºC during hot water thawing chicken breast portions
Thickness (mm) Initial temperature ( °C ) Time to 57.5 °C (min)a
21 -10.3 24
22.5 -9.8 32
24 -11.1 32
24.5 -10.4 34
27.5 -11.2 40
a Time to 57.5 ºC was rounded up to the nearest minute.

46
Non-linear regression analysis of the Salmonella growth data produced the
following parameter estimates for the square-root model: tmin, 4.41; tmax, 50.64; b, 0.03; c,
0.20. Data from Table 3 were used to estimate approximate linear thawing rates in degree
centigrade per minute, and these ranged from the slowest thawing, at 1.71 ºC/ min
(thickness 27.5 mm) to the fastest thawing, at 2.83 ºC/min (thickness 21 mm). The model
predicts a 0.10 log CFU increase in the concentration of Salmonella at the fastest thawing
rates, and a 0.18 log CFU increase in the concentration of Salmonella at the slowest
thawing rates. Both of these predicted log increases are less than even a single generation
time of Salmonella (0.30 log increase).
If we use the model to predict the expected Salmonella increase if the food were
to be held at room temperature (20 ºC) for 4 h, the model predicts a 0.87 log CFU
increase. Changing the temperature to 25 ºC changes the predicted increase in 4 h to 1.51
log CFU. Considering these predicted growth increases as acceptable tolerances, and then
using the model to estimate acceptable linear thawing rates, results in the data shown in
Table 4. So, conservatively, using Table 4 as a guide, thawing poultry at a rate as slow at
0.5 ºC /min, going from -10 ºC to 60 ºC in about 2.3 h should result in a log CFU increase
Table 4
Thawing rate of chicken breast portions versus predicted Salmonella growth
Thawing rate (°C/m)a Predicted Salmonella increase (log CFU)
3
0.10
2
0.15
1
0.31
0.5
0.61
0.25
1.23
a Data from Table 3 were used to estimate approximate linear thawing rates in °C/m.
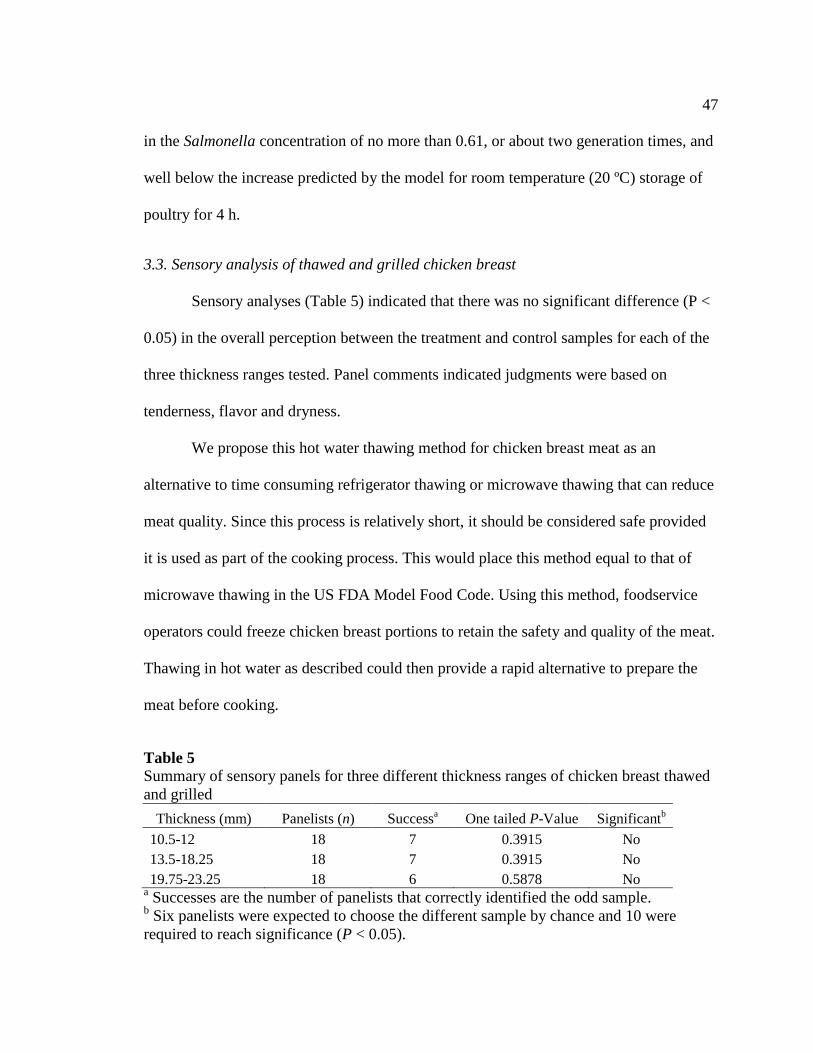
47
in the Salmonella concentration of no more than 0.61, or about two generation times, and
well below the increase predicted by the model for room temperature (20 ºC) storage of
poultry for 4 h.
3.3. Sensory analysis of thawed and grilled chicken breast
Sensory analyses (Table 5) indicated that there was no significant difference (P <
0.05) in the overall perception between the treatment and control samples for each of the
three thickness ranges tested. Panel comments indicated judgments were based on
tenderness, flavor and dryness.
We propose this hot water thawing method for chicken breast meat as an
alternative to time consuming refrigerator thawing or microwave thawing that can reduce
meat quality. Since this process is relatively short, it should be considered safe provided
it is used as part of the cooking process. This would place this method equal to that of
microwave thawing in the US FDA Model Food Code. Using this method, foodservice
operators could freeze chicken breast portions to retain the safety and quality of the meat.
Thawing in hot water as described could then provide a rapid alternative to prepare the
meat before cooking.
Table 5
Summary of sensory panels for three different thickness ranges of chicken breast thawed
and grilled
Thickness (mm) Panelists (n) Successa One tailed P-Value Significant
b
10.5-12 18 7 0.3915 No
13.5-18.25 18 7 0.3915 No
19.75-23.25 18 6 0.5878 No a Successes are the number of panelists that correctly identified the odd sample.
b Six panelists were expected to choose the different sample by chance and 10 were
required to reach significance (P < 0.05).

48
References
Anderson, B. A., Sun, S., Erdogdu, F., & Singh, R. P. (2004). Thawing and freezing of
selected meat products in household refrigerators. International Journal of
Refrigeration, 27(1), 63–72.
Dominguez, S. A., & Schaffner, D. W. (2007). Modeling the risk of Salmonella spp. in
raw poultry as influenced by different further processing and packaging practices.
Lake Buena Vista, Florida: International Association for Food Protection Annual
Meeting.
Leunga, M., Chinga, W.-H., Leunga, D. Y., & Lamb, G. C. (2007). Fluid dynamics and
heat transfer in cold water thawing. Journal of Food Engineering, 78(4), 1221–
1227.
Li, B., & Sun, D.-W. (2002). Novel methods for rapid freezing and thawing of foods –
A review. Journal of Food Engineering, 54, 175–182.
National Advisory Committee on Microbiological Criteria for Foods (2007). Response to
the questions posed by the food safety and inspection service regarding consumer
guidelines for the safe cooking of poultry products. Journal of Food Protection,
70, 251–260.
Ratkowsky, D. A., Lowry, R. K., Mc Meekin, T. A., Stokes, A. N., & Chandler, R. E.
(1983). Model for bacterial culture growth rate throughout the entire biokinetic
temperature range. Journal of Bacteriology, 154, 1222–1226.
United States Department of Agriculture – Food Safety Inspection Service (2006).
Focus on: Chicken. <http://www.fsis.usda.gov/Fact_Sheets/Chicken_Food_

49
Safety_Focus/index.asp> Accessed 20.11.07.
United States Food and Drug Administration (2005). Food code 3.501.13. <http://
www.cfsan.fda.gov/~acrobat/fc05-3.pdf> Accessed 20.11.07.

50
CHAPTER 4
PROCESS OPTIMIZATION AND CONSUMER ACCEPTABILITY OF
SALTED GROUND BEEF PATTIES COOKED AND HELD
HOT IN FLAVORED MARINADE
Abstract
Food safety is paramount for cooking hamburger. The center must reach 71 °C (or
68 °C for 15 s) to assure destruction of Escherichia coli O157:H7 and other food
pathogens. This is difficult to achieve during grilling or frying of thick burgers without
overcooking the surface. Thus, the feasibility of partially or completely cooking frozen
patties in liquid (93 °C water) together with hot holding in liquid was investigated. Initial
studies demonstrated that compared to frying, liquid cooking decreased (P < 0.05) patty
diameter (98 compared with 93 mm) and increased (P < 0.05) thickness (18.1 compared
with 15.6 mm). Liquid cooked patties had greater weight loss (P < 0.05) immediately
after cooking (29 compared with 21%), but reabsorbed moisture and were not different
from fried patties after 1 h hot water holding (61 °C). Protein and fat content were not
affected by cooking method. However, liquid cooked patties were rated lower (P < 0.05)
than fried patties for appearance (5.7 compared with 7.5) and flavor (5.9 compared with
7.5). An 8-member focus group then evaluated methods to improve both appearance and
flavor. Salted, grill-marked patties were preferred, and caramel coloring was needed in
the marinade to obtain acceptable flavor and color during liquid cooking or hot holding.
Reprinted with modifications from Shrestha S, Cornforth D, Nummer BA. 2010. Process
optimization and consumer acceptability of salted ground beef patties cooked and held
hot in flavored marinade. J Food Sci 75:C607-C612.

51
Patties with 0.75% salt that were grill-marked and then finish-cooked in hot marinade
(0.75% salt, 0.3% caramel color) were rated acceptable (P < 0.05) by consumers for up to
4 h hot holding in marinade, with mean hedonic panel ratings > 7.0 (like moderately) for
appearance, juiciness, flavor, and texture.
Practical Application
Grill-marked and marinade-cooked ground beef patties reached a safe internal
cooking temperature without overcooking the surface. Burgers cooked using this method
maintained high consumer acceptability right after cooking and for up to 4 h of hot
holding. Consumers and foodservice operations could use this method without
specialized equipment, and instead use inexpensive and common equipment such as a
soup pot or a restaurant steam table. Use of marinades (salt/caramel color or others) in
this cooking and holding method provides a nearly endless culinary flavoring
opportunity.
Introduction
Americans consume more than 13 billion ground beef hamburgers annually (AMI
2003) at home and when dining out. The cooking process of hamburger patties has been
questioned due to outbreaks of foodborne illness (Rita and others 1993; Hague and others
1994; Ahmed and others 1995; Jackson and others 1996). In most cases, these outbreaks
have been traced to undercooked ground beef contaminated with Escherichia coli
O157:H7 (MMWR 1994; USDA-FSIS 2003). Consequently, E. coli O157:H7 was
declared an adulterant in chopped and ground beef (USDA-FSIS 1994, 2010). Increased
regulatory scrutiny and implementation of new sanitary procedures by beef processors

52
have reduced but not eliminated the number of outbreaks traced to E. coli O157:H7 in
recent years (MMWR 2002), and adequate cooking is therefore still essential to protect
consumers from potential infection by hamburger products.
The primary method of destroying E. coli O157:H7 in hamburger patties is
cooking to a proper internal temperature. The USDA recommends consumers cook
hamburgers to an internal temperature of 71 °C (USDA-FSIS 2003) and the U.S. FDA
model food code (2005) requires that restaurants cook hamburger to 68 ◦C internal
temperature for 15 s. However, there are several issues that impede the proper and
thorough cooking of hamburgers. The first is that some consumers prefer undercooked
hamburger. In one study, 20% and 15% of consumers reported that they cook or order
hamburgers underdone, respectively (Ralston and others 2002). Some consumers desire
undercooked hamburger because they believe it to be more palatable (Ralston and others
2002). In fact, cooking to well done has been associated with a reduction of tenderness,
juiciness, and flavor (Berry 1994; Singh 2000).
Another barrier to thorough cooking of ground beef hamburgers is the size and
shape of the patty. Some consumers and restaurateurs choose to make thick or extra-thick
hamburger patties. High-temperature cooking methods such as grilling and pan frying
increase the chance that the surfaces of a thick ground beef patty are overcooked while
innermost portions remain undercooked (Singh 2000; NACMCF 2007). Overcooking can
char and dry out patties, with a resultant loss in texture and quality (Singh and others
1997). Consequently, consumers and restaurateurs may sometimes terminate the cooking
process early, choosing quality over safety (Ralston and others 2002).

53
Food regulatory agencies suggest that prepared food be held at 140 °F (60 °C) or
higher (US FDA 2005). However, hot holding can cause considerable undesired
additional cooking or ―overcooking‖ of food. If fat and water are lost during holding, the
sensory quality and yield can be adversely affected. Holding cooked food hot without
adversely affecting its sensory quality would allow operators to expand their menus
without increasing service times, while making the operation more efficient by reducing
labor and food costs.
This study sought to examine the consumer acceptability of a marinade cooking
and holding procedure that can help ensure proper cooking and hot holding of hamburger
patties without sacrificing quality and sensory attributes. The study was divided into 2
parts. Part I was designed to determine if hot water cooking/ holding was feasible with
regard to patty characteristics and sensory acceptability. Part II-A was designed to
address quality deficits identified in part I, followed by hedonic evaluation of product by
consumer acceptance panels (part II-B).
Materials and Methods
Experiment design and statistics
Part I. Three replications were conducted for treatment (water cooked and held in
hot water up to 4 h) and control (fried and held in hot water up to 4 h). In each
replication, 1 patty was removed from hot water at 0, 1, 2, 3, and 4 h and analyzed for
color, dimensions, proximate composition, and TBA values. A total of 30 patties were
analyzed (2 cooking methods × 5 holding times × 3 replications = 30). Zero-hour patties
were cooked but not held in hot water. The data were analyzed using SAS (Release 9.1,

54
SAS Institute Inc., Cary, N.C., U.S.A.). A split plot design was used with cooking
method (hot water or fried) as main factors and hot water holding time as a subplot
factor. Means were separated using the Tukey method and significance was accepted at
the 0.05 level. A consumer panel (n = 86) evaluated sensory acceptability of patties after
hot water cooking and holding for 0, 2, or 4 h. Panel datawere processed using Sensory
Information Management System 2000 (Morristown, N.J., U.S.A.) software.
Part II-A. The consumer hedonic panel in part I identified appearance and flavor
deficits of hot-water cooked patties. In part II-A, an 8-member focus group provided
input to optimize patty processing and marinade formulation. The product and cooking
method were modified by (1) addition of salt to patties before cooking, (2) grill-marking
the patties, and (3) cooking/holding in a salt/caramel color marinade.
Part II-B. Finally, consumer panels evaluated patties formulated/ cooked by the
preferred treatment method (identified by the focus group), after 0 to 1, 1 to 2, 2 to 3, and
3 to 4 h holding in hot marinade, compared to grilled patties held the same period in a
commercial steam cabinet. Mean sensory scores of each consumer panel (n = 72, 64, 84,
86 panelists, respectively) were calculated and compared for treatment differences by
analysis of variance (ANOVA) using Sensory Information Management System 2000
software.
Patty preparation
Part I. Finely ground fresh beef (<5 d postmortem, approximately 18% fat) was
prepared in the Utah State Univ. meat laboratory. Patties were manually formed in a 12
cm x 13 mm mold to weigh approximately 151 g and frozen at -22 ºC. Individual patties

55
were separated with 2 mil polyethylene film. Patties were overwrapped in film and
butcher paper (nr 40; Koch, Kansas City, Mo., U.S.A.). Patties were held frozen (-22 ºC)
for up to 14 d before use.
Part II-B. Patties for final consumer acceptance panels were prepared by adding
0.75% salt to finely ground beef (1 to 2 °C). Salt was hand-mixed with meat for 3 to 4
min (using sterile disposable gloves), manually formed into patties, and immediately
frozen as previously described.
Cooking
Ground beef patties were cooked from a frozen (-22 ºC) state to an internal
temperature of 69 ºC. Internal ground beef temperatures were monitored using a thin
probe thermocouple thermometer (Atkins VersaTuff Plus 396, Gainesville, Fla., U.S.A.)
inserted from the side (horizontally) into the center of the patties.
Part I. Control samples were fried on a preheated electric griddle (Circulon,
Fairfield, Calif., U.S.A.) set to achieve a surface temperature of 160 to 190 ºC during
cooking as measured using an infrared thermometer (Thermo Fisher Scientific Inc.,
Waltham, Mass., U.S.A.). The samples were flipped after every 5 min of cooking.
Treatment samples were cooked by submersion in hot water in a porcelain-lined roasting
pan. The pan held approximately 9 L of water, and was heated on a gas stove. The
cooking water temperature was maintained at 87 to 93 °C during cooking, as measured
using a Type K thermometer (Extech, Waltham, Mass., U.S.A.).
Part II-B. Control patties were cooked in a consumer-type gas grill (Char-broil
463247209, Columbus, Ga., U.S.A.). Grill surface temperature was 285 to 375 ºC, also

56
measured using the IR thermometer. The samples were flipped after every 5 min of
cooking. Treatment patties were grill marked 5 min per side and finish-cooked to an
internal temperature of 69 °C by submersion in a water-based marinade containing 0.75%
(w/v) salt and 0.3% (w/v) powdered caramel color concentrate 643 (Williamson Food
Ingredients, Louisville, Ky., U.S.A.) held in a porcelain-lined roasting pan. The marinade
temperature was maintained at 87 to 93° C during cooking.
Hot holding
Part I. Hot holding of patties was achieved by submersion in water maintained at
61 to 62 °C in a thermostatically controlled steam table (Vollrath Serve Well, model
38102, Sheboygan, Wis., U.S.A.).
Part II-B. Hot holding of treatment patties was achieved by submersion in water-
based salt and caramel color marinade maintained at 61 to 62 °C in a thermostatically
controlled steam table. Control patties were hot held in a commercial steam cabinet
(FWE model MTU-12, Crystal Lake, Ill., U.S.A.) set at 63 °C with humidity set at 3.5 on
a 0 to 5 scale (―high humidity‖), per manufacturer‘s specification. Once equilibrated, the
internal temperature of patties was maintained at 60 to 61 °C for up to 4 h for both
methods of hot holding (marinade or steam cabinet).
Cooked patty measurements
Part I. Weight loss. After cooking or holding, patties were placed on an inclined
plastic tray to allow excess liquid to drain. Samples were turned after 5 min, and then
weighed at 10 min. Weight loss (%) for cooking or cooking and holding was determined
as (raw weight – cooked, held weight)*100 / raw weight.

57
Part I. Color, dimension, composition, and TBA analyses. Surface color
measurements of cooked patties were taken using the Hunter L*, a*, b* system with a
Hunter Mini-scan portable colorimeter with a 5-mm aperture (Reston, Va., U.S.A.). The
instrument was set for illuminant D-65 and 10° observer angle, and standardized using a
white and black standard plate. Surface color was measured from both sides at room
temperature immediately after cooking. Three measurements were taken per side per
patty on 5 cooked patties per treatment. Diameter of ground beef patties was determined
by taking the mean of 4 different measurements per patty. Thickness was measured as a
mean of 4 different measurements per patty using a Digimatic caliper (model CD-6BS,
Mitutoyo Corp., Aurora, Ill., U.S.A.). Moisture content was determined by weight loss
after 16 to 18 h drying in a convection oven at 102 ºC (AOAC 1990). Fat (Soxhlet
method) and Kjeldahl protein determinations (AOAC 1990) were also obtained on raw,
cooked, and hot-held patties. Thiobarbituric acid (TBA) values as a measure of lipid
oxidation status were determined using the method of Buege and Aust (1978). Cooked /
hot-held patties were placed in sealed plastic bags (Ziploc; SC Johnson & Son, Inc,
Racine, Wis., U.S.A.) at 2°C until same-day analysis. Frozen raw patties were thawed at
room temperature (20 ºC) for analyses. Patties were cut into 10 x 10 mm cubes and
blended for 5 to 7 s (Vita-Mix, Cleveland, Ohio, U.S.A.) prior to sampling. Moisture, fat,
and TBA measurements were done in duplicate while protein was analyzed in triplicate
per sample.

58
Cooked patty sensory evaluation
Part I. A consumer acceptance panel (86 panelists) evaluated 4 treatments; water
cooked, water cooked and held in hot water for 2 or 4 h, and fried patties. Each panelist
evaluated 4 samples (1 per treatment).
Part II-A. To address the sensory deficiencies associated with hot water
cooking/holding, a focus group of 8 people participated in a series of product
assessments. Focus group participants were recruited from NDFS faculty, staff, and
students with prior participation as trained panelists for meat product descriptive panels.
Three levels of salt (0.5%, 0.75%, 1%) were added to raw beef patties and at the same
level to water during cooking and hot holding. Patties were cooked and evaluated
immediately and after 2 h holding in salted hot water. Based on group consensus, a
level of salt was selected for patties. Similarly, a preferred level of caramel color (0.1%,
0.3%, or 0.5%) was determined for marinade used to cook/hold patties in the final
consumer acceptance panels (part II-B), compared to grilled controls.
Part II-B. Four separate consumer acceptance panels evaluated the sensory
characteristics of experimental patties (grill marked, marinade cooked, marinade held)
compared to control patties (grilled and held in a steam cabinet). Panels 1 to 4 (72, 64,
84, and 86 panelists) evaluated treatment and control patties at 0 to 1, 1 to 2, 2 to 3, and 3
to 4 h, respectively. Each panelist evaluated 2 samples (treatment and control for a given
holding time).

59
Consumer panel methodology
All samples in part I and part II-B consisted of a one-quarter portion of a patty on
a prewarmed ceramic plate. Panelists were asked to cleanse their palate with water
between samples. Samples were served under white fluorescent light in individual
booths. Each booth was equipped with a PC and keyboard for rapid data entry, recording,
and processing using Sensory Information Management System 2000 software. Samples
were assigned random 3-digit numbers and order was altered to minimize bias. Panelists
evaluated appearance, juiciness, flavor, and texture on a 9-point hedonic scale where 1 =
dislike extremely, 2 = dislike very much, 3 = dislike moderately, 4 = dislike slightly, 5 =
neither like nor dislike, 6 = like slightly, 7 = like moderately, 8 = like very much, and 9 =
like extremely (sample in Appendix D). Panel demographics (gender, age) and beef patty
consumption frequency data were collected. Panelists were given an opportunity to
comment on each sample. Consumer panelists were recruited by placing an ad in the
campus newspaper a week before the panel session(s), and by placing poster notices in
the USU Dairy Bar and throughout the Nutrition, Dietetics, and Food Sciences (NDFS)
building. Panelists received an ice cream cone coupon redeemable in the USU Dairy Bar
as compensation for their participation. To participate, consumer panelists were required
to be 18 to 65 y old, with no food allergies, and identify themselves as at least once a
month consumers of beef burgers. Approval from the Institutional Review Board, USU
was obtained prior to the consumer test.

60
Results and Discussion
Part I—Hot water cooking/holding of ground beef patties
Cooking method significantly affected beef patty appearance and dimensions.
Patties cooked in hot water were lighter, less red, and less yellow (P < 0.05) than fried
patties (Table 6). Water cooked patties were slightly but significantly smaller in diameter
than fried patties (93 and 98 mm), but thicker (18.1 and 15.6 mm, respectively). Greater
thickness of water-cooked patties was associated with bulging in the patty center.
Cooking time for frozen patties to reach an internal temperature of 69 °C was not
different among treatments (12 and 14.5 min for water-cooked and fried patties,
respectively; Table 6).
Mean raw and cooked patty weights after 1 to 4 h hot holding are shown in Table
7, and expressed as percent weight loss in Figure 1. Water-cooked patties had higher (P <
0.05) weight loss than fried patties immediately after cooking (28.9% and 21.1%,
Table 6. Cooking time, Hunter color values, and beef patty dimensions after frying or
cooking in hot water. Patties in both methods were cooked from the frozen state to an
internal temperature of 69 °C. Cook
method
Cook
time
(min)
Hunter color measurementsab
Patty
diameterb
(mm)
Patty
thicknessb
(mm)
L* a* b*
Frying 14.5 2 b 39.5 8.7 b 8.7 1.4 b 19.5 2.2 b 98.0 3.1 b 15.6 1.3 b
Hot
water 12.0 2a 49.6 3.0 a 4.5 0.8 a 15.3 2.1 a 93.2 4.3 a 18.1 1.0 a
a L* = lightness, a* = redness, b* = yellowness.
b Data represent the mean SD. Values in the same column sharing letters are not
significantly different (P ≥ 0.05).

61
respectively; Figure 1). This was partly due to higher moisture and fat loss in water
cooked (21.2% and 5.2%, respectively) compared to pan fried patties (17.5% and 4.1%,
respectively). Rodriguez-Estrada and others (1997) also reported higher fat and moisture
loss in hamburger patties cooked in boiling water as compared to frying. Another factor
contributing to higher weight loss is the slight solubilization of the patty surface while
cooking in water. According to Bejerholm and Aaslyng (2003), cooking loss of meat
depends on the cooking technique and the raw meat quality. In their study, weight loss of
patties fried at 155 °C ranged from 18% to 21%. In agreement, fried patties in this
Figure 1. Weight loss (%) after cooking and holding ground beef patties for up to 4 h.
(▲) Hot water cooked, then held in hot water (61°C). () Fried then held in hot water
(61°C). Means with different letters (a-c) are significantly different (P < 0.05).
20.0
21.0
22.0
23.0
24.0
25.0
26.0
27.0
28.0
29.0
30.0
31.0
32.0
33.0
0 1 2 3 4
Wei
ght
Loss
(%
)
Holding Time (h)
a
abc abc abc
ab
c
bc
c
bc bc

62
Table 7. Weight, proximate composition, and thiobarbituric acid (TBA) values of raw
(R) or cooked patties after frying or hot water cooking/holding. Patties in both methods
were cooked from the frozen state to an internal temperature of 69°C. Water cooked
patties were held 0 - 4 h in hot water (61°C).
Cook
Method
Hot hold
time (h)
Cooked
patty wt
(g)
Moisture z (%) Fat
z
(%)
Protein z
(%)
TBA z
(ppm malon-
dialdehyde)
Fry R 150.0 62.9 ± 1.4 a 18.7 ± 0.7 a 19.5 ± 0.5 c 0.41 ± 0.13 b
0 118.5 57.6 ± 0.2 de 18.4 ± 0.9 a 24.5 ± 1.2 b 0.64 ± 0.12 a
1 115.4 59.6 ± 0.6 bcd 17.5 ± 1.2 a 24.5 ± 0.9 b 0.83 ± 0.16 a
2 117.1 59.0 ± 0.9 cde 17.4 ± 0.8 a 24.3 ± 0.5 b 0.82 ± 0.08 a
3 113.8 58.8 ± 0.8 cde 18.2 ± 0.3 a 24.6 ± 0.6 b 0.66 ± 0.11 a
4 111.0 58.6 ± 0.2 cde 18.0 ± 0.1 a 24.3 ± 0.7 b 0.62 ± 0.12 a
Water R 150.3 61.6 ± 0.9 ab 17.8 ± 0.8 a 19.3 ± 0.5 c 0.39 ± 0.11 b
0 106.7 56.8 ± 0.3 e 17.8 ± 0.2 a 27.2 ± 0.5 a 0.74 ± 0.14 a
1 112.2 59.3 ± 0.9 bcd 16.7 ± 0.3 a 25.2 ± 0.8 ab 0.75 ± 0.19 a
2 112.7 59.9 ± 0.9 bcd 16.8 ± 1.3 a 26.1 ± 1.0 ab 0.76 ± 0.12 a
3 112.0 59.8 ± 0.3 bcd 16.8 ± 1.2 a 25.5 ± 1.1 ab 0.77 ± 0.15 a
4 113.5 60.3 ± 1.5 bc 16.8 ± 2.1 a 24.9 ± 0.5 b 0.63 ± 0.26 a
z Data represent the mean SD. Values in the same column sharing letters are not
significantly different (P ≥ 0.05).
study also had a weight loss of 21%. According to Aaslyng and others (2003), the water
is probably lost due to heat-induced protein denaturation during cooking of the meat,
which causes less water to be entrapped within protein structures. During hot water
holding, however, percent weight loss was not different between water cooked or fried
63
patties. Predictably, moisture content of cooked patties increased by 2% to 3% during the
hot water holding period.
Cooking by either method increased (P <0.05) protein content, compared to raw
patties (Table 7). Protein in food is a rather stable component, and change in its
percentage in food is usually attributed to the change in its concentration due to the water
evaporation and fat loss (Danowska-Ozeiwicz 2009). A similar increase in the protein
content of cooked beef patties was observed by Ju and Mittal (2000). The higher protein
in water-cooked patties can be attributed to the lower fat and moisture in total as
compared to that of fried patties. Protein content of water cooked patties decreased from
27.3% after cooking (not held in hot water) to 24.9% after 4 h of hot holding treatment,
due to water resorption during hot holding (Table 7). Protein content of fried patties
remained constant at 24.3% to 24.6% through 4 h of hot holding (Table 7). Fat content of
cooked patties (water-cooked or fried) ranged from 16.8% to 18.4%, and remained
unchanged during the hot holding period (Table 7).
Heating can cause lipid oxidation and rancid flavor development in food.
Oxidation of unsaturated fatty acids in cooked meat results in stale or rancid flavors
known as warmed-over flavor. TBA measurement is the most frequently used test to
assess the rancidity in meat. TBA numbers greater than 1 are commonly associated with
rancid flavor/odor by sensory panelists (Greene and Cumuze 1981). In this study, TBA
values of cooked patties were higher (P < 0.05) than that of raw patties, but less than 1,
indicating that extensive lipid oxidation (rancidity) did not occur during hot water
holding. There were no differences in TBA values between cooking treatments.
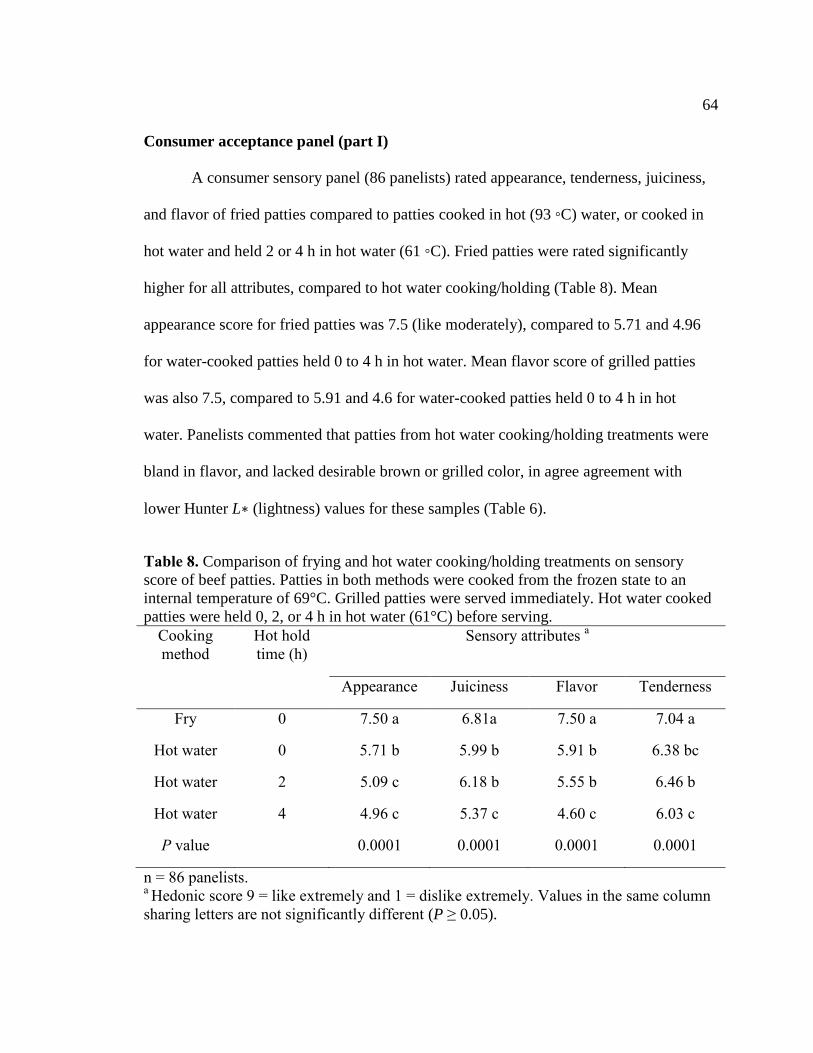
64
Consumer acceptance panel (part I)
A consumer sensory panel (86 panelists) rated appearance, tenderness, juiciness,
and flavor of fried patties compared to patties cooked in hot (93 ◦C) water, or cooked in
hot water and held 2 or 4 h in hot water (61 ◦C). Fried patties were rated significantly
higher for all attributes, compared to hot water cooking/holding (Table 8). Mean
appearance score for fried patties was 7.5 (like moderately), compared to 5.71 and 4.96
for water-cooked patties held 0 to 4 h in hot water. Mean flavor score of grilled patties
was also 7.5, compared to 5.91 and 4.6 for water-cooked patties held 0 to 4 h in hot
water. Panelists commented that patties from hot water cooking/holding treatments were
bland in flavor, and lacked desirable brown or grilled color, in agree agreement with
lower Hunter L∗ (lightness) values for these samples (Table 6).
Table 8. Comparison of frying and hot water cooking/holding treatments on sensory
score of beef patties. Patties in both methods were cooked from the frozen state to an
internal temperature of 69°C. Grilled patties were served immediately. Hot water cooked
patties were held 0, 2, or 4 h in hot water (61°C) before serving.
Cooking
method
Hot hold
time (h)
Sensory attributes a
Appearance Juiciness Flavor Tenderness
Fry 0 7.50 a 6.81a 7.50 a 7.04 a
Hot water 0 5.71 b 5.99 b 5.91 b 6.38 bc
Hot water 2 5.09 c 6.18 b 5.55 b 6.46 b
Hot water 4 4.96 c 5.37 c 4.60 c 6.03 c
P value 0.0001 0.0001 0.0001 0.0001
n = 86 panelists. a Hedonic score 9 = like extremely and 1 = dislike extremely. Values in the same column
sharing letters are not significantly different (P ≥ 0.05).

65
Patty and marinade formulation
(part II-A; focus group)
It was apparent that hot water cooking/holding of beef patties was not feasible for
retail establishments, unless appearance and flavor could be improved. Accordingly,
trials were conducted to evaluate pre-grilling of frozen patties to increase browning and
create grill marks, with finish cooking in hot (93 ◦C) water. Grilling has previously been
demonstrated to be equal to frying, and superior to deep-fat frying or roasting, with
regard to consumer acceptability of beef burgers (Dreeling and others 2000). To improve
flavor, trials were conducted with salt (0.5%, 0.75%, 1.0%) added to meat before
cooking, and to cooking/holding water. To maintain grilled color during cooking/hot
holding, trials were conducted with caramel color (0.1%, 0.3%, 0.5%) added to water,
creating a salt + caramel color marinade. A focus group of 8 people with previous
experience on meat product sensory panels was used to provide input. Based on group
discussion and consensus, a level of salt was selected for patties. Similarly, a preferred
level of caramel color (0.1%, 0.3%, or 0.5%) was determined for marinade used to
cook/hold patties. Grill-marked patties were preferred over patties without grill marks.
The focus group preferred flavor and appearance of patties formulated with 0.75% salt,
then cooked/held in a marinade of 0.75% salt and 0.3% caramel color. Other salt levels
(0.5%, 1.0%) were less flavorful or too salty, respectively. Patties held in marinade with
0.1% caramel color were light and nonuniform in appearance, and patties in marinade
with 0.5% caramel color were too dark.

66
Consumer panel (part II-B)
In part II-B, a series of 4 separate consumer hedonic panels were conducted to
rate appearance, juiciness, flavor, and texture of grilled patties, compared to patties that
were grill-marked and then finish-cooked in hot marinade (0.75% salt, 0.3% caramel
color). The 2 treatments were compared after hot (61 °C) holding for 0 to 1, 1 to 2, 2 to 3,
or 3 to 4 h in a steam cabinet or in marinade, respectively. After 0 to 1 h hot holding
(panel 1), panelists rated all sensory attributes equally between grilled or marinade-
cooked patties (Table 9). Mean sensory scores ranged from 6.84 to 7.54, where 7 = like
moderately. Sensory scores were similar after 1 to 2 h hot holding (panel 2), and again
there were no differences (P < 0.05) in overall acceptability between grilled or marinade-
cooked patties. After 2 to 3 h hot holding, however, marinade-cooked patties were liked
more (P < 0.05) over grilled patties for juiciness (7.46 compared with 6.88, respectively).
After 3 to 4 h hot holding, the marinade treatment was liked more (P < 0.05) over grilling
for both juiciness (7.6 compared with 6.95) and texture (7.43 compared with 6.95,
respectively). When cooked patties were held in hot water (Expt-part I), there was a trend
of moisture increase (Table 7) in patties. We hypothesize that this increase in moisture
content increases the juiciness in patties, thereby increasing the juiciness-liking score
overtime. In addition, the moisture is also associated with the dryness or tenderness of
patties. Presumably, the treatment patties were liked more for texture overtime due to its
moisture content. In conclusion, patties from both cooking methods were quite acceptable
to panelists, and patties prepared by the marinade-cook method were actually preferred
for juiciness and texture, compared to grilled patties at longer hot holding times.

67
Table 9. Effect of salt content and cooking method on sensory score of beef patties.
Grilled patties contained no salt. Marinade-cooked patties contained 0.75 % salt. All
patties were cooked from the frozen state. After cooking, patties were hot held 0 to 4 h at
61°C in a steam cabinet (grilled) or hot marinade, respectively. The marinade-cook
process consisted of grilling frozen patties 5 min per side for browning and formation of
grill marks, then finish cooking in marinade (0.75% salt and 0.3% caramel color).
Panel Cooking
method
Hot
hold
time (h)
na Sensory attributes
b
Appearance Juiciness Flavor Texture
1 Grill 0-1 72 7.10 a 7.30 abc 7.54 a 7.29 ab
Marinade 6.84 a 7.36 ab 7.27 a 6.99 b
2 Grill 1-2 64 7.31 a 6.97 bc 7.70 a 7.20 ab
Marinade 7.17 a 7.36 ab 7.52 a 7.03 b
3 Grill 2-3 84 7.07 a 6.88 c 7.46 a 7.11 ab
Marinade 7.35 a 7.46 a 7.32 a 6.99b
4 Grill 3-4 86 7.31 a 6.95 bc 7.34 a 6.95 b
Marinade 7.19 a 7.60 a 7.53 a 7.43 a
P-value 0.2423 0.0001 0.2458 0.0097
a n = number of panelists per session (4 separate panels).
b Hedonic score 9 = like extremely and 1 = dislike extremely.
Values in the same column
sharing letters are not significantly different (P ≥ 0.05).
Conclusions
Based on this study, foodservice operators and consumers can ensure food safety
and enhance food quality and achieve convenience and economic benefits at the same
time. Ground beef patties of many sizes and dimensions could be surface browned using
a high heat cooking method (grilling or pan frying). After surface cooking to develop
browning, patties could be cooked at a lower temperature in liquid marinade to prevent
overcooking the surface. A variety of different marinade compositions and flavors could

68
be used, suitable to individual tastes. After patties reach an internal temperature of 69 °C
they can be hot held in the same marinade at 61 °C or greater for up to 4 h and remain
palatable. The consumer liking score for appearance as well as flavor of treatment patties
were not different as compared to grilled patties held in a commercial steam cabinet. The
score was better for the juiciness and texture of marinade cooked/held patties over time.
Restaurateurs could cook patties in advance, then hold in hot marinade for several hours,
ready to serve consumers rapidly during busy periods. Alternatively, commissaries could
cook burgers in advance and transport them for simple hot holding in satellite facilities.
For home use, many consumer grills have an optional burner that could be used to heat a
pot of cooking or hot holding marinade.
References
Aaslyng MM, Bejerholm C, Ertbjerg P, Bertram HC, Andersen HJ. 2003. Cooking loss
and juiciness of pork in relation to raw meat quality and cooking procedure. Food
Qual Prefer14:277–88.
Ahmed NM, Conner DE, Huffman DL. 1995. Heat-resistance of Escherichia coli
O157:H7 in meat and poultry as affected by product composition. J Food Sci
60:606–10.
[AMI] American Meat Inst. 2003. Analysts say consumers still confident in U.S. beef
safety. Available from: http://www.meatami.com/ht/d/ArticleDetails/i/3276.
Accessed Jun 3, 2009.

69
[AOAC] Assn. Official Analytical Chemists, Inc. 1990. Official methods of analysis.
15th ed. Vol. 2. Procedures 950.46 (moisture), 960.39 (fat), 928.08 (protein).
Arlington, VA.: AOAC.
Bejerholm C, Aaslyng MD. 2003. The influence of cooking technique and core
temperature on results of a sensory analysis of pork – depending on the raw meat
quality. Food Qual Prefer 15:19–30.
Berry BW. 1994. Fat level, high temperature cooking and degree of doneness affect
sensory, chemical and physical properties of beef patties. J Food Sci 59:10–4, 19.
Buege JA, Aust SD. 1978. Microsomal lipid peroxidation. Methods Enzymol 52:302–4.
Danowsks-Oziewicz M. 2009. The influence of cooking method on the quality of pork
patties. J Food Proc Preserv 33:473–85.
Dreeling N, Allen P, Butler F. 2000. Effect of cooking method on sensory and
instrumental texture attributes of low-fat beefburgers. Lebensm–Wiss u–Technol
33:234–8.
Greene BE, Cumuze TH. 1981. Relationship between TBA numbers and inexperienced
panelists‘ assessment of oxidized flavor in cooked beef. J Food Sci 47:52–4, 58.
Hague MA, Warren KE, Hunt MC, Kropf DH, Kastner CL, Stroda SL, Johnson DE.
1994. Endpoint temperature, internal cooked color, and expressible juice color
relationships in ground beef patties. J Food Sci 59:465–70.
Jackson TC, Hardin MD, Acuff GR. 1996. Heat resistance of Escherichia coli O157:H7
in a nutrient medium and in ground beef patties as influenced by storage and
holding temperatures. J Food Prot 59:230–7.

70
Ju J, Mittal GS. 2000. Relationships of physical properties of fat-substitutes, cooking
methods and fat levels with quality of ground beef patties. J Food Process Preserv
24:125–42.
[MMWR] Morbidity and Mortality Weekly Report. 1994. Escherichia coli O157:H7
outbreak linked to home-cooked hamburger—California July 1993. MMWR
43:213–6.
[MMWR] Morbidity and Mortality Weekly Report. 2002. Multistate outbreak of
Escherichia coli O157:H7 infections associated with eating ground beef—United
States, June–July 2002. MMWR 51(29):637–9.
[NACMCF] Natl. Advisory Committee on Microbiological Criteria for Foods. 2007.
Response to the questions posed by the food safety and inspection service
regarding consumer guidelines for the safe cooking of poultry products. J Food
Prot 70:251–60.
Ralston K, Brent CP, Starke Y, Riggins T, Jordan-Lin CT. 2002. Measuring hamburger
cooking and ordering behavior. In: Consumer food safety behavior: a case study
in hamburger cooking and ordering. USDA Econ Res Service Rept Nr AER-804.
p 3–6.
Rita, M, Franzetti L, Mattioli A, and Galli A. 1993. Microorganism lethality during
microwave cooking of ground meat. 1. Effect of dishomogeneity of surface power
density. Ann Microbiol Enzymol 43:115–29.
71
Rodriguez-EstradaMT, Penazzi G, Caboni MF, Bertacco G, Lercker G. 1997. Effect of
different cooking methods on some lipid and protein components of hamburgers.
Meat Sci 45:365–75.
Singh RP. 2000. Unpublished data. New approaches to improve safety and quality in
cooking hamburger patties. Available from: http://rpaulsingh.com/research/
Presentations/hamburger/hamburgeronweb.htm. Accessed Jun 3, 2009.
Singh RP, Pan Z, Vijayan J. 1997. Use of predictive modeling in hamburger cooking.
Food Australia 49:526–31.
USDA-FSIS. 1994. FSIS notice 50–94.
USDA-FSIS. 2003. Color of cooked ground beef as it relates to doneness. Available
from: http://www.fsis.usda.gov/Factsheets/Color_of_Cooked_Ground_Beef/
index.asp. Accessed Jun 3, 2009.
USDA-FSIS. 2010. E. coli O157 timeline. Available from: http://www.fsis.usda.gov/
PDF/Ecoli_O157_Timeline.pdf. Accessed Apr 21, 2010.
US FDA. 2005 Food Code. Available from: http://www.fda.gov/Food/FoodSafety/Retail
FoodProtection/FoodCode/FoodCode2005/default.htm. Accessed Jun 3, 2009.

72
CHAPTER 5
SURVIVAL OF LISTERIA MONOCYTOGENES INTRODUCED AS A
POST-AGING CONTAMINANT DURING STORAGE OF
LOW-SALT CHEDDAR CHEESE AT 4, 10, AND 21°C
ABSTRACT
Traditional aged Cheddar cheese does not support Listeria monocytogenes growth
and, in fact, gradual inactivation of the organism occurs during storage due to intrinsic
characteristics of Cheddar cheese, such as presence of starter cultures, salt content, and
acidity. However, consuming high-salt (sodium) levels is a health concern and the dairy
industry is responding by creating reduced-salt cheeses. The microbiological stability of
low-salt cheese has not been well documented. This study examined the survival of L.
monocytogenes in low-salt compared with regular-salt Cheddar cheese at 2 pH levels
stored at 4, 10, and 21°C. Cheddar cheeses were formulated at 0.7% and 1.8% NaCl
(wt/wt) with both low and high pH and aged for 10 wk, resulting in 4 treatments: 0.7%
NaCl and pH 5.1 (low salt and low pH); 0.7% NaCl and pH 5.5 (low salt and high pH);
1.8% NaCl and pH 5.8 (standard salt and high pH); and 1.8% NaCl and pH 5.3 (standard
salt and low pH). Each treatment was comminuted and inoculated with a 5-strain cocktail
of L. monocytogenes at a target level of 3.5 log cfu/g, then divided and incubated at 4, 10,
and 21°C. Survival or growth of L. monocytogenes was monitored for up to 90, 90, and
30 d, respectively. Listeria monocytogenes decreased by 0.14 to 1.48 log cfu/g in all
Reprinted with modifications from Shrestha S, Grieder JA, McMahon DJ, Nummer BA.
2011. Survival of Listeria monocytogenes introduced as post-aging contaminant during
storage of low-salt Cheddar cheese at 4, 10, and 21 ⁰C. J Dairy Sci 94:4329-4335.
73
treatments. At the end of incubation at a given temperature, no significant difference
existed in L. monocytogenes survival between the low and standard salt treatments at
either low or high pH. Listeria monocytogenes counts decreased gradually regardless of a
continuous increase in pH (end pH of 5.3 to 6.9) of low-salt treatments at all study
temperatures. This study demonstrated that post-aging inoculation of L. monocytogenes
into low-salt (0.7%, wt/wt) Cheddar cheeses at an initial pH of 5.1 and 5.5 does not
support growth at 4, 10, and 21°C up to 90, 90, and 30 d, respectively. As none of the
treatments demonstrated more than a 1.5 log reduction in L. monocytogenes counts, the
need for good sanitation practices to prevent postmanufacturing cross contamination
remains.
INTRODUCTION
Traditional Cheddar cheese manufacturing, including pasteurization of milk and
good manufacturing practices, minimizes the occurrence and growth of Listeria
monocytogenes (Ryser and Marth, 1987; Genigeorgis et al., 1991; US FDA 2009). In
addition, Bishop and Smukowski (2006) cite that intrinsic characteristics of hard and
semi-hard cheese developed during fermentation and aging create a hostile environment
for bacterial pathogens. Cheddar cheese is typically manufactured to a pH range of 4.9 to
5.4 (Lawrence et al., 1984), water activity (aw) from 0.93 to 0.97, and water phase salt
(WPS) from 4.6 to 5.4% (Lawrence and Gilles, 1980, 1982; Marcos et al., 1981). The US
FDA (2009) has listed pH <4.4, aw <0.92, and WPS >10% as growth limiting for L.
monocytogenes. Therefore, it is believed that the multiple hurdles of low pH and WPS,
together with the activity of starter and non-starter cultures contribute to the inhibition of
74
L. monocytogenes growth in Cheddar cheese (Ryser, 1999) during both fermentation and
aging. After aging, Cheddar cheese is typically further processed by both manufacturers
and retailers into consumer-friendly blocks, shreds, or slices. Listeria monocytogenes is
considered a common environmental contaminant in both manufacturer and retailer
facilities and significant risk exists for contamination at this stage in processing (CFP,
2004–2006).
It has been recognized for several decades that Americans consume unhealthy
amounts of sodium in their food. Consuming too much sodium increases the risk for high
blood pressure that can lead to a variety of diseases (IOM, 2001; Dickinson and Havas,
2007). It has been estimated that population-wide reductions in sodium could prevent
more than 100,000 deaths annually (Danaei et al., 2009). The dairy industry has
responded to these concerns by developing reduced-sodium cheese varieties. To be
labeled as low-sodium, the product cannot contain more than 140 mg of sodium/50 g (US
FDA, 2008), equivalent to 0.7% (wt/wt) NaCl. This is in comparison to the typical
sodium content of 310 mg of sodium/50 g [1.6% (wt/wt) NaCl] in Cheddar cheese
(Johnson et al., 2009).
Sodium chloride, along with pH, aw, and lactic acid content are multiple hurdles
contributing to the microbiological safety of traditional cheeses. Lowering the salt
content (sodium chloride) may be a food safety and shelf-life concern (Johnson et al.,
2009). The goal of this study was to evaluate whether low-salt Cheddar cheese at 2
different pH levels could support the growth of L. monocytogenes at refrigeration or
abuse temperatures, simulating post-manufacturing contamination. Specifically, the

75
objectives were to monitor the growth of inoculated L. monocytogenes at 4, 10, and 21°C
in low-salt Cheddar cheese produced with low and high-pH compared with standard salt
Cheddar cheese.
MATERIALS AND METHODS
Cheese Production
Cheddar cheese was made from 272 kg of pasteurized (73°C, 15 s) milk (Gary
Haight Richardson Dairy Products Laboratory, Utah State University, Logan, UT),
standardized to a protein-to-fat ratio of 0.85. Starter (34 g of Lactococcus lactis,
DVS850; 12 g of L. lactis ssp. cremoris, DVS 213; and 6 g of Lactobacillus helveticus,
LH 32; Chr. Hansen Inc., Milwaukee, WI) was added to the milk at 31°C, followed by
CaCl2 (0.12 mL/kg of milk) and annatto (0.07 mL/kg of milk; single strength; DSM Food
Specialties USA Inc., Eagleville, PA). Milk was ripened for 30 min and then set using 20
mL of double-strength rennet (0.07 mL/kg of milk; Maxiren; DSM Food Specialties USA
Inc.). After 30 min the curd was cut and allowed to heal for 5 min. Cheese curd was
stirred for 25 min and then cooked by gradually raising the temperature to 39°C in 35
min. The curd was held at 39°C for 40 min until the pH reached 6.32. Whey was drained
and curd was Cheddared (stacking block of cheese curd to expel additional whey and to
knead the curd) until a pH 5.8 was reached. The curd was finally milled and divided into
4 approximately 7-kg portions. Treatment A curd (low salt and low pH) was held at
36°C until the curd reached pH 5.45 and 8.2 g of salt/ kg was added. Treatment B curd
(low salt and high pH) was washed with 3 L of water (at 12°C) to remove lactose and
minimize acid production, and then salt was added at 8.2 g/kg. Treatment C curd

76
(standard salt and high pH) had 24.2 g of salt/kg added. Treatment D curd (standard salt
and low pH) was held at 36°C until the curd reached pH 5.25 and then 24.9 g of salt/kg
was added. All treatments were hooped and pressed overnight at ambient temperature.
Blocks were vacuum packaged in PE-EVOH-PE 3.5-mil thickness bags (Vilutis and Co.
Inc., Frankfort, IL) and aged for 10 wk at 6°C.
Proximate Analysis
Cheese pH, moisture content, aw, and fat and salt content were determined after
10 wk of aging for each treatment (A to D). The cheese pH was determined by combining
20 g of finely grated cheese with 10 g of distilled water in a stomacher bag (Model 400;
Seward, Riverview, FL). Samples were homogenized in a stomacher (Model 400,
Seward) for 1 min at 260 strokes/ min. The pH was measured using a Xerolyt
combination electrode (Model HA405; Mettler Toledo Inc., Columbus, OH) and an
Accumet pH meter (Model AR 25; Fisher Scientific Inc., Pittsburgh, PA). The moisture
content was measured using a microwave oven (Model 907875; CEM Corp., Matthews,
NC) at 70% power with an endpoint setting of <0.4 mg of weight change over 2 s. A
water activity meter (AquaLab LITE; Decagon Devices Inc., Pullman, WA) was used to
measure the aw. The fat content was determined using the Babcock method 15.8.A
(American Public Health Association, 1992). The salt content was measured by
combining 5 g of finely grated cheese with 98.2 g of water and stomached for 4 min at
260 strokes/ min. The slurry was filtered through a Whatman no. 1 filter paper and the
filtrate was analyzed for sodium chloride using a chloride analyzer (Model 926; Corning,
Medfield, MA).

77
Inoculum Preparation
Five strains of L. monocytogenes, J1–177 (serotype 1/2b, human isolate), C1–056
(serotype 1/2a, human isolate), N3–013 (serotype 4b, food isolate), R2–499 (serotype
1/2a, sliced turkey isolate), and N1–227 (serotype 4b, food isolate) were obtained from
the Utah State University culture collection of Dr. Jeffery Broadbent. Stock cultures were
maintained frozen (−80°C). Working cultures were prepared by transferring 0.1 mL of
thawed frozen stock into 10 mL of fresh tryptic soy broth (TSB; Neogen Corp., Lansing,
MI) and incubating at 37°C for 24 h. Individual strains were then grown in TSB for 24h
at 37°C before inoculation. The 5-strain mixture was prepared by combining 2-mL
aliquots of each strain in a sterile, conical, 15-mL centrifuge tube. Cells were pelleted by
centrifugation (1509 X g for 15 min) and resuspended in 10 mL of fresh 0.1% peptone
solution 3 times. Appropriate dilutions of washed cell suspensions were prepared in 0.1%
peptone solution to achieve approximately 103 to 10
4 cells/g of cheese.
Sample Inoculation and Storage
Ten-week-old cheese treatments A to D were comminuted (Comitrol 1700;
Urschel Laboratories Inc., Valparaiso, IN) to 3-mm particle size. A portion of each
treatment was retained as an uninoculated control. The 5 strain mixture of L.
monocytogenes was pipetted (10 mL/kg) dropwise into comminuted cheese treatments
while mixing (Model Classic; KitchenAid, St. Joseph, MI) at speed setting 1 for 5 min.
Each inoculated cheese treatment (A to D) was subdivided into 3 equal portions. All
inoculated portions (A to D) and uninoculated controls (A to D) were vacuum packaged
in 2-ply nylon, 3.5-mil thickness bags (North Central Food Processing Supply, Sioux

78
Falls, SD). Portions of each inoculated and uninoculated control were incubated at 4, 10,
or 21°C for up to 90, 90, and 30 d, respectively.
Listeria monocytogenes Survival and pH Measurement
Treatments were first enumerated approximately 30 min after inoculation.
Thereafter, treatments placed at 4 and 10°C were enumerated at 15, 30, 45, 60, 75, and 90
d. Treatments placed at 21°C were enumerated at 5, 10, 15, 20, 25, and 30 d. After
sampling, cheese treatments were again vacuum packaged in 2-ply nylon, 3.5-mil
thickness bags. For L. monocytogenes enumeration, 11 g of cheese was added to 99 mL
of sterile 2% sodium citrate at 42°C and stomached at normal speed for 2 min
(Duncan et al., 2004). Serial dilutions were prepared using 0.1% peptone water and
plated in duplicate on PALCAM agar (Neogen Corp.) containing PALCAM supplement
(Dalynn Biologicals Inc., Calgary, Alberta, Canada). Colonies were enumerated after 48
h of incubation at 35°C. For pH measurement, 10 g of cheese was stomached with 5 mL
of distilled water for 30 s and measured using Double Junction pH Testr 30 (Oakton
Instruments, Vernon Hills, IL).
Experimental Design and Statistical Analysis
Cheddar cheese with 2 salt levels [low = 0.7% (wt/wt) and standard = 1.8%
(wt/wt)] at 2 target pH levels (low = 5.2 and high = 5.7 at 10 wk of aging) were prepared.
The 4 treatments were low salt and low-pH (A); low salt and high pH (B); standard salt
and high pH (C); and standard salt and low pH (D). Three replications of the experiment
were conducted using the prepared cheeses. In each replication, comminuted cheese
samples were inoculated and analyzed in duplicate for L. monocytogenes counts at 7

79
different day points. Data points are expressed as mean ± standard deviation. A repeated-
measure design was used, where cheese type was the treatment between subjects and
repeated measure was carried out at 7 different day points. Analysis of variance for
repeated measures was performed using the MIXED procedure of SAS (version 9.1; SAS
Institute Inc., Cary, NC). The effect of replication was blocked to avoid the variations for
each replicate. The compound symmetry covariance structure was used based on
goodness of fit as indicated by Akaike‘s information criterion. The Tukey method was
used to determine the significance differences of mean values at an α = 0.05 over all
comparisons.
RESULTS AND DISCUSSION
Cheese Analysis
The average composition of uninoculated treatments A to D is shown in Table 10.
The moisture content in low-salt treatments (A and B) was higher as compared with that
of standard salt treatments (C and D). Less syneresis of curd during manufacturing of
low-salt cheese yielded cheese with higher moisture content, which may have
significance in microbiological activity. During syneresis, some added salt was also lost
with whey and, therefore, the salt concentration measured later in cheese (Table 10) was
lower than the amount of salt added during manufacturing. This loss of added salt is
higher in standard salt cheese due to comparative higher syneresis. The amount of salt
added was based on the previous experience of manufacturing cheese with different salt
concentrations. Due to less controllable lactose fermentation in low-salt cheeses along
with proteolysis of cheeses during aging, the observed pH values at 10 wk in treatments

80
Table 10. Physicochemical characteristics of Cheddar cheese from 4 treatments
Treatment1
A B C D
Moisture2(% wt/wt) 39.0±0.2 39.3±0.4 35.9±0.3 34.2±0.2
Fat (% wt/wt) 33 33 33 33
Salt2 (% NaCl wt/wt) 0.68±0.02 0.70±0.01 1.88±0.02 1.74±0.03
WPS3 1.7 1.8 5.0 4.8
Water activity 0.98 0.97 0.95 0.95
pH at 1 wk 5.06 5.30 5.66 5.28
pH at 10 wk 5.11 5.50 5.77 5.28
1A = low salt, low pH; B = low salt, high pH; C = standard salt, high pH; D = standard
salt, low pH. 2mean of 3 replicates.
3Water phase salt (WPS) = % salt x 100 / (% salt + % moisture)
varied slightly from targets. At all study temperatures, the pH (Tables 11,12, and 13) of
low-salt treatments (A and B) gradually increased throughout the incubation period,
possibly due to proteolysis in cheese (final pH of 5.32 to 5.63 in cheese A and 6.46 to
6.87 in cheese B at different incubation temperatures). Stadhouders (1962) and
Peichevski and Petrova (1979) reported comparatively higher proteolysis in washed
cheese, as seen in cheese B in the present study. Stadhouders (1962) observed that
cheeses that were manufactured by washing the curds for 20 min had about 1.7 times
more rennet than the cheeses that were not washed. Also, Upreti et al. (2006) reported
that cheeses with low lactose (as in cheese B in the present study, which has been washed
to lower lactose content) exhibited significantly more proteolysis than cheeses with high
lactose. Cheddar cheese is not typically curd washed. However, this pH increase has
implications for other cheese varieties when considering production with higher pH. For
standard salt treatments (C and D), the pH decreased initially, possibly due to production

81
Table 11. pH of treatment and control Cheddar cheeses during storage at 4°C1
Treatment Control
Day A B C D A B C D 0 5.08±0.03 5.45±0.02 5.73±0.03 5.27±0.01 5.11±.02 5.50±0.02 5.77±0.01 5.28±0.02
5 5.09±0.02 5.51±0.01 5.50±0.03 5.28±0.03 na na na na
10 5.13±0.02 5.67±0.04 5.35±0.02 5.22±0.02 na na na na
15 5.21±0.02 5.96±0.05 5.26±0.04 5.22±0.02 5.21±0.01 6.00±0.04 5.28±0.04 5.24±0.01
20 5.33±0.06 6.30±0.06 5.32±0.04 5.28±0.03 na na na na
25 5.25±0.01 6.37±0.06 5.30±0.02 5.20±0.01 na na na na
30 5.32±0.03 6.46±0.05 5.34±0.04 5.25±0.01 5.33±0.03 6.40±0.05 5.47±0.02 5.32±0.01
1Data are presented as the mean values of 3 replications ± standard deviation.
Treatments and Control: A = low salt, low pH; B = low salt, high pH; C = standard salt,
high pH; D = standard salt, low pH. Treatment and control cheeses were aged for 10 wk
before the inoculation study. na = not analyzed.
Table 12. pH of treatment and control Cheddar cheeses during storage at 10°C1
Treatment Control
Day A B C D A B C D 0 5.08±0.03 5.45±0.02 5.73±0.03 5.27±0.01 5.11±0.03 5.50±0.03 5.77±0.02 5.28±0.02
15 5.21±0.01 5.73±0.02 5.22±0.01 5.14±0.01 na na na na
30 5.18±0.03 6.13±0.05 5.19±0.01 5.16±0.04 na na na na
45 5.32±0.03 6.44±0.01 5.32±0.01 5.26±0.02 5.33±0.03 6.34±0.04 5.31±0.05 5.27±0.03
60 5.41±0.06 6.65±0.08 5.47±0.01 5.38±0.01 na na na na
75 5.38±0.02 6.65±0.04 5.57±0.06 5.36±0.03 na na na na
90 5.54±0.07 6.87±0.02 5.91±0.08 5.44±0.06 5.42±0.02 6.84±0.03 5.88±0.02 5.38±0.02
1Data are presented as the mean values of 3 replications ± standard deviation.
Treatments and Control: A = low salt, low pH; B = low salt, high pH; C = standard salt,
high pH; D = standard salt, low pH. Treatment and control cheeses were aged for 10 wk
before the inoculation study. na = not analyzed.
of lactic acid, and later increased gradually (final pH of 5.34 to 5.91 in cheese C and 5.25
to 5.54 in cheese D at different incubation temperatures), again possibly due to
proteolysis in cheese.
Survival of Listeria monocytogenes
For treatments A to D, the mean inoculum level was 3.55 to 3.78 log cfu/g
(Tables 14, 15, and 16). Listeria monocytogenes numbers decreased between 0.14 to 1.48

82
Table 13. pH of treatment and control Cheddar cheeses during storage at 21°C1
Treatment Control
Day A B C D A B C D 0 5.08±0.03 5.45±0.02 5.73±0.03 5.27±0.01 5.11±0.02 5.50±0.02 5.77±0.03 5.28±0.02
15 5.19±0.01 5.76±0.01 5.30±0.02 5.19±0.01 na na na na
30 5.15±0.02 6.06±0.01 5.15±0.02 5.17±0.01 na na na na
45 5.22±0.02 6.28±0.06 5.23±0.03 5.26±0.01 5.20±0.05 6.25±0.03 5.22±0.04 5.23±0.05
60 5.40±0.03 6.42±0.04 5.41±0.02 5.40±0.01 na na na na
75 5.45±0.06 6.60±0.04 5.57±0.04 5.39±0.04 na na na na
90 5.63±0.03 6.70±0.04 5.85±0.11 5.54±0.02 5.58±0.04 6.59±0.04 5.77±0.02 5.51±0.02
1Data are presented as the mean values of 3 replications ± standard deviation.
Treatments and Control: A = low salt, low pH; B = low salt, high pH; C = standard salt,
high pH; D = standard salt, low pH. Treatment and control cheeses were aged for 10 wk
before the inoculation study. NA = not analyzed.
Table 14. Survival (log cfu/g) of Listeria monocytogenes in different experimental
treatments of Cheddar cheese during storage at 4°C1
Treatment2
Day A B C D
0
3.66 ± 0.22A,a
3.67 ± 0.21A,a
3.55 ± 0.48A,a
3.78 ± 0.29A,a
15
3.53 ± 0.19A,a
3.67 ± 0.26A,a
3.47 ± 0.21A,ab
3.44 ± 0.29A,b
30
3.32 ± 0.22A,b
3.51 ± 0.18A,a
3.32 ± 0.18A,bc
3.22 ± 0.32A,c
45
3.10 ± 0.20A,c
3.27 ± 0.25A,b
3.20 ± 0.23A,c
3.05 ± 0.30A,d
60
2.94 ± 0.29A,cd
3.18 ± 0.24A,bc
2.99 ± 0.24A,d
2.98 ± 0.26A,d
75
2.80 ± 0.23AB,de
3.10 ± 0.22A,c
2.78 ± 0.19AB,e
2.58 ± 0.28B,e
90
2.76 ± 0.27ABC,e
3.13 ± 0.33A,c
2.86 ± 0.25AB,de
2.30 ± 0.13C,f
A-CMeans followed by the same uppercase letters in the same row within each day of
storage are not significantly different (P ≥ 0.05). a-f
Means followed by the same lowercase letters in the same column within each
treatment are not significantly different (P ≥ 0.05). 1Data are presented as the mean values of 3 replications ± standard deviation.
2A = low salt, low pH; B = low salt, high pH; C = standard salt, high pH; D = standard
salt, low pH. Treatment cheeses were aged for 10 wk before the inoculation study.

83
log cfu/g in all treatments incubated at 4, 10, and 21°C for up to 90, 90, and 30 d,
respectively. Counts of L. monocytogenes decreased (0.54 to1.48 log cfu/g) significantly
(P < 0.05) in all treatments incubated at 4°C for 90 d (Table 14). This is in agreement
with the L. monocytogenes growth in the cheese model proposed by Tienungoon et al.
(2000). That model predicts no growth at pH levels below 5.5 at 4°C, regardless of salt
content.
Table 15. Survival (log cfu/g) of Listeria monocytogenes in different experimental
treatments of Cheddar cheese during storage at 10°C1
Treatment2
Day A B C D
0
3.66 ± 0.22A,a
3.67 ± 0.21A,a
3.55 ± 0.48A,a
3.78 ± 0.29A,a
15
3.47 ± 0.28A,b
3.71 ± 0.22A,a
3.56 ± 0.25A,a
3.49 ± 0.25A,b
30
3.28 ± 0.16A,c
3.57 ± 0.27A,a
3.37 ± 0.22A,b
3.21 ± 0.23A,c
45
3.11 ± 0.26A,d
3.37 ± 0.25A,b
3.18 ± 0.23A,c
3.02 ± 0.33A,d
60
3.00 ± 0.30AB,de
3.31 ± 0.25A,bc
2.99 ± 0.20AB,d
2.80 ± 0.27B,e
75
2.92 ± 0.29AB,e
3.20 ± 0.26A,c
2.83 ± 0.27AB,e
2.46 ± 0.24B,f
90
2.68 ± 0.26AB,f
3.01 ± 0.28A,d
2.72 ± 0.21AB,e
2.51 ± 0.20B,f
A-BMeans followed by the same uppercase letters in the same row within each day of
storage are not significantly different (P ≥ 0.05). a-f
Means followed by the same lowercase letters in the same column within each
treatment are not significantly different (P ≥ 0.05). 1Data are presented as the mean values of 3 replications ± standard deviation.
2A = low salt, low pH; B = low salt, high pH; C = standard salt, high pH; D = standard
salt, low pH. Treatment cheeses were aged for 10 wk before the inoculation study.

84
The counts of L. monocytogenes decreased (0.66 to1.27 log cfu/g) significantly (P
< 0.05) in all treatments incubated at 10°C for 90 d (Table 15). Applying the salt and pH
levels used in this study to the ordinal logistic regression model of L. monocytogenes
growing in cheese (Bolton and Frank, 1999) indicates probabilities of growth at 10°C for
treatments A to D at 70.5, 98.8, 65, and 36.4%, respectively. Note that the Bolton and
Frank (1999) model does not account for any effect from lactic acid starter cultures. This
may account for the high probability of growth in the model where no growth occurred
experimentally.
Treatments A, B, and D exhibited a significant (P < 0.05) inoculum decrease
(0.48 to 1.11 log cfu/g) after 30 d at 21°C (Table 16). Listeria monocytogenes counts
were 2 to 5 times lower in treatments A, B, and D at 21°C storage (Table 16) as
compared with 4 and 10°C after 30 d (Tables 14 and 15). Except for treatment C, in
which greater reduction in L. monocytogenes counts was not observed, other studies have
seen this same effect of higher storage temperature. Genigeorgis et al. (1991) reported
that low-pH, low-salt Monterey jack cheese (pH 5.0 and WPS 1.3%) surface inoculated
with approximately 4 log cfu of L. monocytogenes/g dropped 2 log cycles in 13 d of
storage at 30°C compared with 30 and 19 d of 4 and 8°C storage, respectively. Ryser and
Marth (1987) inoculated pasteurized whole milk with 5 × 10²
cells of L. monocytogenes
(strain Scott A, V7, or California)/mL and observed greater log reduction for strain V7
when prepared Cheddar cheese was aged at 13°C compared with 6°C. The rate of
metabolism of L. monocytogenes is increased at higher temperature, which probably
results in faster inactivation due to autolysis. Also, the greater activity of starter and

85
Table 16. Survival (log cfu/g) of Listeria monocytogenes in different experimental
treatments of Cheddar cheese during storage at 21°C1
Treatment2
Day A B C D
0
3.66 ± 0.22A,a
3.67 ± 0.21A,ab
3.55 ± 0.48A,a
3.78 ± 0.29A,a
5
2.88 ± 0.28B,b
3.71 ± 0.27A,a
3.58 ± 0.25A,a
3.26 ± 0.33AB,bc
10
2.60 ± 0.57B,cd
3.54 ± 0.18A,abc
3.55 ± 0.19A,a
3.34 ± 0.27A,b
15
2.77 ± 0.45B,bc
3.46 ± 0.16A,bcd
3.52 ± 0.28A,a
3.13 ± 0.17AB,bcd
20
2.51 ± 0.54B,d
3.31 ± 0.15A,cde
3.49 ± 0.23A,a
3.03 ± 0.29AB,cde
25
2.59 ± 0.46B,cd
3.23 ± 0.22A,de
3.39 ± 0.13A,a
2.91 ± 0.39AB,de
30
2.55 ± 0.34C,cd
3.19 ± 0.28AB,e
3.41 ± 0.20A,a
2.82 ± 0.28BC,e
A-CMeans followed by the same uppercase letters in the same row within each day of
storage are not significantly different (P ≥ 0.05). a-e
Means followed by the same lowercase letters in the same column within each
treatment are not significantly different (P ≥ 0.05). 1Data are presented as the mean values of 3 replications ± standard deviation.
2A = low salt, low pH; B = low salt, high pH; C = standard salt, high pH; D = standard
salt, low pH. Treatment cheeses were aged for 10 wk before the inoculation study.
nonstarter cultures in cheese at higher temperatures presumably will inhibit L.
monocytogenes due to microbial competition.
Treatments A and B were low salt compared with C and D. The low-salt
treatments exhibited slightly lower L. monocytogenes reductions between 0.54 to 0.98 log
cfu/g at either 4 or 10°C compared with standard salt treatments (0.69 to 1.48; Table 14
and 15) after 90 d. At 21°C incubation the low-salt treatments exhibited L.
monocytogenes reductions between 0.48 to 1.11 log cfu/g compared with standard salt

86
treatments (0.14 to 0.96 log cfu/g; Table 16) after 30 d. The data suggest that the low or
standard salt levels used in this study did not greatly affect the survival of L.
monocytogenes at the experimental incubation temperatures. These data are supported by
previous studies. Larson et al. (1999) reported L. monocytogenes survived in cheese
brines from 5.6 to 24% (pH 5.0 to 5.3) with less than 1 log reduction for over 200 d at 4
and 10°C. Cole et al. (1990) demonstrated that at pH 7.0 it required greater than 8% salt
to inhibit growth of L. monocytogenes in tryptic phosphate broth at 5°C. Six and eight
percent salt were required to inhibit L. monocytogenes growth at pH 5.13 incubated at 10
and 30°C, respectively (Cole et al. 1990). Ryser (1999) cites that Mehta and Tatini (1992)
observed destruction of L. monocytogenes (strains Scott A and V7) in both 1.3% NaCl
and 2.5% NaCl Cheddar cheese after 10 wk of aging at 7°C.
Treatments A and D were low-pH treatments compared with B and C. The low-
pH treatments exhibited L. monocytogenes log reductions between 0.90 to 1.48 cfu/g at
either 4 or 10°C compared with high-pH treatments (0.54 to 0.83; Tables 14 and 15) after
90 d. At 21°C incubation, the low-pH treatments exhibited L. monocytogenes log
reductions between 0.96 to 1.11 cfu/g compared with high-pH treatments (0.14 to 0.48
log cfu/g; Table 16) after 30 d. The data indicate that low pH provides a greater decrease
in L. monocytogenes at all 3 incubation temperatures. Interestingly, despite reaching a pH
between 6.46 and 6.87, the washed curd treatment B still did not permit L.
monocytogenes growth at any of the incubation temperatures. The Bolton and Frank
(1999) ordinal logistic regression model predicted a 98.8% probability that L.
monocytogenes would grow in this cheese. It did have the least log reduction of L.

87
monocytogenes of all treatments at either 4 or 10°C incubated for 90 d (Tables 14 and
15). Schaak and Marth (1988) reported significant inhibition of L. monocytogenes in
lactic acid-cultured fermented milk when compared with that of the control even at the
final pH of 5.99. Similarly, Gilliland and Speck (1972) noted that lactic cultures inhibited
salmonellae and staphylococci at a pH of 6.6 and this may be the effect seen in L.
monocytogenes inhibition in the present study.
This study demonstrated that post-aging inoculation of L. monocytogenes into
low-salt (0.7%, wt/wt) Cheddar cheeses at an initial pH of 5.1 to 5.5 does not support
growth at 4, 10, and 21°C up to 90, 90, and 30 d, respectively. In fact, a modest log
reduction (~0.5 to 1.5 log cfu/g) of L. monocytogenes occurred when the cheese was
stored at 4 or 10°C for 90 d or 21°C for 30 d. The results suggest that low- or reduced-
salt cheeses are equally safe to their full salt counterparts and that salt may only be a
minor food safety hurdle regarding the post-aging contamination and growth of L.
monocytogenes. As none of the treatments demonstrated a substantial reduction in L.
monocytogenes counts, the need for good sanitation practices to prevent post-
manufacturing cross-contamination remains.
REFERENCES
American Public Health Association. 1992. Standard Methods for the Examination of
Dairy Products. 16th ed. R. T. Marshall, ed. Am. Publ. Health Assoc. Inc.,
Washington, DC.
Bishop, J. R., and M. Smukowski. 2006. Storage temperatures necessary to maintain
cheese safety. Food Protect. Trends 26:714–724.

88
Bolton, L. F., and J. F. Frank. 1999. Defining the growth/no-growth interface for Listeria
monocytogenes in Mexican-style cheese based on salt, pH, and moisture content.
J. Food Prot. 62:601–609.
CFP (Conference for Food Protection). 2004–2006. Voluntary guidelines of sanitation
practices, standard operating procedures, and good retail practices to minimize
contamination and growth of Listeria monocytogenes within food establishments.
Accessed Mar 23, 2011. http://extension.usu.edu/files/publications/publication/
pub__8847508.pdf.
Cole, M. B., M. V. Jones, and C. Holyoak. 1990. The effect of pH, salt concentration and
temperature on the survival and growth of Listeria monocytogenes. J. Appl.
Bacteriol. 69:63–72.
Danaei, G., E. L. Ding, D. Mozaffarian, B. Taylor, J. Rehm, C. J. Murray, and M. Ezzati.
2009. The preventable causes of death in the United States: Comparative risk
assessment of dietary, lifestyle, and metabolic risk factors. PLoS Med.
6:e1000058 doi:10.1371/journal.pmed.1000058.
Dickinson, B. D., and S. Havas. 2007. Reducing the population burden of cardiovascular
disease by reducing sodium intake: A report of the Council on Science and Public
Health. Arch. Intern. Med.167:1460–1468.
Duncan, S. E., B. R. Yaun, and S. S. Summer. 2004. Microbiological methods for dairy
products. Pages 258–261 in Standard Methods for the Examination of Dairy
Products. 17th ed. H. M. Wehr and J. F. Frank, ed. Am. Publ. Health Assoc. Inc.,
Washington, DC.

89
Genigeorgis, C., M. Carniciu, D. Dutulescu, and T. B. Farver. 1991. Growth and survival
of Listeria monocytogenes in market cheeses stored at 4 to 30 °C. J. Food Prot.
54:662–668.
Gilliland, S. E., and M. L. Speck. 1972. Interactions of food starter cultures and
foodborne pathogens: Lactic streptococci versus staphylococci and salmonellae. J.
Milk Food Technol. 35:307–310.
IOM (Institute of Medicine). 2001. Sodium and Chloride. Pages 269– 423 in Dietary
Reference Intakes for Water, Potassium, Sodium, Chloride and Sulfate. The
National Academies Press, Washington, DC.
Johnson, M. E., R. Kapoor, D. J. McMahon, D. R. McCoy, and R. G. Narasimmon. 2009.
Reduction of sodium and fat levels in natural and processed cheeses: Scientific
and technological aspects. Comp. Rev. Food Sci. Food Safety. 8:252–268.
Larson, A. E., E. A. Johnson, and J. H. Nelson. 1999. Survival of Listeria monocytogenes
in commercial cheese brines. J. Dairy Sci. 82:1860–1868.
Lawrence, R. C., and J. Gilles. 1980. The assessment of the potential quality of young
Cheddar cheese. N.Z. J. Dairy Sci. Tech. 15:1–12.
Lawrence, R. C., and J. Gilles. 1982. Factors that determine the pH of young Cheddar
cheese. N.Z. J. Dairy Sci. Tech. 17:1–14.
Lawrence, R. C., H. A. Heap, and J. Gilles. 1984. A controlled approach to cheese
technology. J. Dairy Sci. 67:1632–1645.
Marcos, A., M. Alcalá, F. León, J. Fernández-Salguero, and M. A. Esteban. 1981. Water
activity and chemical composition of cheese. J. Dairy Sci. 64:622–626.
90
Mehta, A., and S. R. Tatini. 1992. Behavior of Listeria monocytogenes in Cheddar cheese
made with NaCl or equimolar mixture of NaCl and KCl. J. Dairy Sci. 75(Suppl.
1):93.
Peichevski, I., and N. Petrova. 1979. Effect of lactose content on biochemical processes
during ripening of Vitosha cheese. Nauchni Trudove, Vissh Institut po
Zootekhnika i Veterinarna Meditsina. 26:221–229.
Ryser, E. T. 1999. Incidence and behavior of Listeria monocytogenes in cheese and other
fermented dairy products. Pages 411–503 in Listeria, Listeriosis and Food Safety.
2nd ed. E. T. Ryser and E. H. Marth, ed. Marcel Dekker Inc., New York, NY.
Ryser, E. T., and E. H. Marth. 1987. Behavior of Listeria monocytogenes during the
manufacture and ripening of Cheddar cheese. J. Food Prot. 50:7–13.
Schaak, M. M., and E. H. Marth. 1988. Behavior of Listeria monocytogenes in skim milk
during fermentation with mesophilic lactic starter cultures. J. Food Prot. 51:600–
606.
Stadhouders, J. 1962. The proteolytic activity of rennet and starter bacteria in cheese with
reference to bitter flavour. Pages 353–361 in Proc. XVI Int. Dairy Congress,
volume B, International Dairy Federation, Copenhagen, Denmark.
Tienungoon, S., D. A. Ratkowsky, T. A. McMeekin, and T. Ross. 2000. Growth limits of
Listeria monocytogenes as a function of temperature, pH, NaCl, and lactic acid.
Appl. Environ. Microbiol. 66:4979–4987.

91
Upreti, P., L. E. Metzger, and K. D. Hayes. 2006. Influence of calcium and phosphorus,
lactose, and salt-to-moisture ratio on Cheddar cheese quality: Proteolysis during
ripening. J. Dairy Sci. 89:444–453.
US FDA. 2008. 21 CFR, Part 101.61. Nutrient content claims for the sodium content of
foods. Food and Drug Administration, Department of Health and Human
Services, Washington, DC.
US FDA. 2009. Retail Food Safety Program Information Manual on Date Marking of
Cheese. Accessed Dec 15, 2010.
http://www.fda.gov/Food/FoodSafety/RetailFoodProtection/IndustryandRegulator
yAssistanceandTrainingResources/ucm113942.htm.

92
CHAPTER 6
SURVIVAL OF SALMONELLA SEROVARS INTRODUCED AS A POST-AGING
CONTAMINANT DURING STORAGE OF LOW-SALT
CHEDDAR CHEESE AT 4, 10, AND 21°C
Abstract
The microbiological stability of low-salt cheese has not been well documented.
This study examined the survival of Salmonella in low-salt compared to regular salt
Cheddar cheese with 2 pH levels. Cheddar cheeses were formulated at 0.7% and 1.8%
NaCl (wt/wt) with both low and high-pH and aged for 12 weeks resulting in four
treatments: 0.7% NaCl and pH 5.1 (low-salt and low-pH); 0.7% NaCl and pH 5.5 (low-
salt and high-pH); 1.8% NaCl and pH 5.7 (standard-salt and high-pH); and 1.8% NaCl
and pH 5.3 (standard-salt and low-pH). Each treatment was comminuted and inoculated
with a 5-serovar cocktail of Salmonella at a target level of 4 log CFU/g, then divided and
incubated at 4, 10 and 21 °C for up to 90, 90, and 30 d, respectively. Salmonella counts
decreased by 2.8 to 3.9 log CFU/g in all treatments. In the initial period of survival
study, standard-salt treatments exhibited significantly lower Salmonella counts compared
to low-salt treatments. The pH levels did not exhibit obvious significant effect in the
Salmonella survival in low-salt treatments. Salmonella counts declined gradually
regardless of a continuous increase in pH (end pH of 5.3 to 5.9) of low-salt treatments at
all study temperatures. Salmonella counts were reduced faster at 21°C storage. Although
Reprinted with modifications from Shrestha S, Grieder JA, McMahon DJ, Nummer BA.
2011. Survival of Salmonella serovars introduced as post-aging contaminant during
storage of low-salt Cheddar cheese at 4, 10, and 21 ⁰C. J Food Sci 76: M616–M621.

93
there were significant reductions in Salmonella counts, the treatments demonstrated
survival of Salmonella for up to 90 d when stored at 4 or 10 ºC and for up to 30 d at 21
ºC, the need for good sanitation practices to prevent postmanufacturing cross
contamination remains.
Practical Application
Low-salt aged Cheddar cheese could not support the growth of inoculated
Salmonella and in fact gradual reduction in Salmonella count occurred during storage.
Besides being nutritionally better, low or reduced salt Cheddar are safe as their full salt
counterparts and that salt may only be a minor food safety hurdle regarding the post-
aging contamination and growth of Salmonella. However, the treatments could not
demonstrate complete destruction of Salmonella for up to 90 d when stored at 4 or 10 ºC
and for up to 30 d at 21 ºC, the need for good sanitation practices to prevent
postmanufacturing cross-contamination remains.
Introduction
The Centers for Disease Control and Prevention reports that Salmonella is the
leading cause of laboratory-confirmed cases of food borne bacterial infection (CDC
2010a). Approximately 40000 cases of salmonellosis are reported annually in the United
States (CDC 2010b). Traditional Cheddar cheese manufacturing, including pasteurization
of milk and good manufacturing practices, minimizes the occurrence and growth of
Salmonella (Goepfert and others 1968; Hargrove and others 1969; Norholt 1984; Wood
and others 1984). In addition, Bishop and Smukowski (2006) cite that intrinsic
characteristics of hard (≤ 39% moisture) and semi-soft (> 39 to < 50% moisture) cheese

94
developed during fermentation and aging create a hostile environment for bacterial
pathogens. They recommended that cheeses, manufactured under good manufacturing
procedures with pasteurized or heat treated (≥ 63°C for ≥ 16 s) milk, containing < 50%
moisture and active lactic acid starter cultures, along with traditional levels of salt, pH,
and fat be allowed to be ripened, stored and distributed at a temperature not exceeding 30
°C. Cheddar cheese is typically manufactured to pH range of 4.9 to 5.4 (White and Custer
1976; Lawrence and others 1984), water activity (aw) from 0.93 to 0.97 and water phase
salt (WPS) from 4.6 to 5.4% (Lawerence and Gilles 1980, 1982; Marcos and others
1981). The US FDA (2009) has listed temperature < 5 °C, pH < 4.2, aw < 0.94, as growth
limiting for Salmonella. White and Custer (1976) cite that critical NaCl level for survival
of Salmonella is 8%. Therefore, it is believed that the multiple hurdles of low-pH and
WPS, together with the activity of starter and non-starter cultures contribute to the
inhibition of Salmonella growth in Cheddar cheese (Hargrove and others 1969; El-Gazzar
and Marth 1992) during both fermentation and aging.
It has been recognized for several decades that Americans consume unhealthy
amounts of sodium in their food. Consuming too much sodium increases the risk for high
blood pressure that can lead to a variety of diseases (IOM 2001; Dickinson and Havas
2007). It has been estimated that population-wide reductions in sodium could prevent
more than 100,000 deaths annually (Danaei and others 2009). According to Johnson and
others (2009), cheese (a nutrient-dense food in the U.S. food supply) is also perceived as
being high in sodium (salt) content. This discourages some consumers, especially older,
from including cheese in their diets. Salt addition is the major source of sodium in natural

95
cheese. Cheese has often been reduced in the meals of children in school systems in the
United States because of concern, in part, for high salt intake (Johnson and others 2009).
The dairy industry has responded to these concerns by developing reduced sodium cheese
varieties. To be labeled as low-sodium, the product cannot contain more than 140 mg
sodium per 50 g (US FDA 2008) equivalent to 0.7% wt/wt NaCl. This is in comparison to
the typical sodium content of 310 mg sodium per 50 g (1.6% wt/wt NaCl) in Cheddar
cheese (Johnson and others 2009).
Sodium chloride, along with pH, water activity, and lactic acid content are
multiple hurdles contributing to the microbiological safety of traditional hard and semi-
soft cheeses. Lowering the salt content (sodium chloride) may be a food safety and shelf-
life concern especially in the distribution and serving of cheese (Johnson and others
2009). Outbreaks due to Salmonella are mostly associated with consumption of animal
products such as poultry, meat, or eggs, and fresh produce (Shacher and Yaron 2006).
However, Redmond and Griffith (2003) report that a substantial number of consumers
frequently use unsafe practices during food handling and preparation at home. Low-salt
Cheddar cheese contaminated with raw foods (meat, poultry, eggs, and vegetables) after
the opening of the packages by consumers could support the growth of Salmonella and
other bacterial pathogens. Previously, our lab (see Chapter 5) examined the survival of
Listeria monocyotegenes in low-salt Cheddar cheese at refrigeration or abuse
temperatures. The goal of the present study was to evaluate whether Salmonella,
introduced as post-ageing contaminant, can grow in low-salt Cheddar cheese at
refrigeration or abuse temperatures. We examined the growth at 2 different pH levels of

96
low-salt Cheddar cheese. Specifically, the objectives were to monitor the growth of
inoculated Salmonella at 4, 10, and 21 °C in low-salt aged Cheddar cheese produced with
low and high-pH, compared to standard-salt aged Cheddar cheese.
Materials and Methods
Cheese production
Cheddar cheese was made from 272 kg of pasteurized (73 °C, 15 s) milk (Gary
Haight Richardson Dairy Products Lab., Utah State Univ., Logan, Utah, U.S.A.)
standardized to a protein to fat ratio of 0.85. Starter (34 g Lactococcus lactis, DVS850,
12 g L. lactis ssp. cremoris, DVS 213, and 6 g Lactobacillus helveticus, LH 32, Chr.
Hansen Inc. Milwaukee, Wis., U.S.A.) was added to the milk at 31 °C, followed by CaCl2
(0.12 ml/kg milk) and annatto (0.07 ml/kg milk; single strength, DSM, Eagleville, Pa.,
U.S.A.). Milk was ripened for 30 min and then set using 20mL of double-strength rennet
(0.07 ml/kg milk; Maxiren, DSM). After 30 min the curd was cut and allowed to heal for
5 min. Cheese curd was stirred for 25 min and then cooked by gradually raising the
temperature to 39 °C in 35 min. The curd was held at 39 °C for 40 min until the pH
reached 6.32. Whey was drained and curd was cheddared (stacking block of cheese curd
to expel additional whey and to knead the curd) until pH 5.8. The curd was finally milled
and divided into 4 approximately 7-kg portions. Treatment A curd (low-salt and low-pH)
was held at 36 °C until the curd reached pH 5.45 and 8.2 g/kg salt was added. Treatment
B curd (low-salt and high-pH) at pH 5.8 was washed with 3 L water (at 12 °C) to remove
lactose and minimize acid production, and then salt was added at 8.2 g/kg. Treatment C
curd (standard-salt and high-pH) had 24.2 g/kg of salt added at pH 5.8. Treatment D curd
97
(standard-salt and low-pH) was held at 36 °C until curd reached pH 5.25 and then 24.9
g/kg salt was added. All treatments were hooped and pressed overnight at ambient
temperature. Blocks were vacuum packaged in PE-EVOH-PE 3.5 mil thickness bags
(Vilutis and Co. Inc., Frankfort, Ill., U.S.A.) and aged for 12 wk at 6 °C.
Proximate analysis
Cheese pH, moisture, aw, fat, and salt were determined after 12 wk of aging for
each treatment (A to D). Cheese pH was determined by combining 20g finely grated
cheese with 10g distilled water in a stomacher bag (Model 400, Seward, Riverview, Fla.,
U.S.A.). Samples were homogenized in a stomacher (Model 400, Seward) for 1 min at
260 strokes per min. The pH was measured using a Xerolyt combination electrode
(Model HA405, Mettler Toledo, Columbus, Ohio, U.S.A.) and an Accumet pH meter
(Model AR 25, Fisher Scientific, Pittsburgh, Pa., U.S.A.). Moisture was measured using a
microwave oven (Model 907875, CEM, Matthews, N.C., U.S.A.) at 70% power with an
endpoint setting of < 0.4 mg of weight change over 2 s. Water activity meter (AquaLab
LITE; Decagon Devices Inc., Pullman, Wash., U.S.A.) was used to measure the water
activity. Fat was determined using the Babcock method 15.8.A (APHA 1992). Salt was
measured by combining 5 g finely grated cheese with 98.2 g water and stomached for 4
min at 260 strokes per min. The slurry was filtered through a Whatman nr 1 filter paper
and the filtrate was analyzed for sodium chloride using a chloride analyzer (Model 926,
Corning, Medfield, Mass., U.S.A.).

98
Inoculum preparation
Total of 5 serovars of Salmonella, Thompson FSIS 120 (chicken isolate),
Enteritidis H3502 (clinical isolate, phage type 4), Enteritidis H3527 (clinical isolate,
phage type 13a), Typhimurium H3380 (clinical isolate, phage type DT104), Heidelberg
F5038BG1 (ham isolate), were obtained from the Utah State Univ. culture collection of
Dr. Jeff Broadbent. Stock cultures were maintained frozen (-80 °C). Working cultures
were prepared by transferring 0.1 mL thawed frozen stock into 10 mL fresh tryptic soy
broth (TSB; Neogen, Lansing, Mich., U.S.A.) and incubating at 37 °C for 24 h.
Individual strains were then grown in TSB for 24h at 37 °C before inoculation. The 5
serovar cocktail mixture was prepared by combining 2 mL aliquots of each strain in a
sterile, conical, 15-mL centrifuge tube. Cells were pelleted by centrifugation (2100 x g
for 15 min) and re-suspended in 10 mL fresh 0.1% peptone solution 3 times. Appropriate
dilutions of washed cell suspensions were prepared in 0.1% peptone solution to achieve
approximately 104 cells per gram of cheese.
Sample inoculation and storage
Total of 12-wk-old cheese treatments A to D were comminuted (Comitrol 1700,
Urschel Lab. Inc, Valparaiso, Ind., U.S.A.) to 3 mm particle size. A portion of each
treatment was retained as un-inoculated control. The 5 serovar cocktail mixture of
Salmonella was pipetted (10 mL/kg) drop-wise into comminuted cheese treatments while
mixing (Model Classic, Kitchen-Aid, St Joseph, Mich., U.S.A.) at speed setting 1 for 5
min. Each inoculated cheese treatment (A to D) was subdivided into 3 equal portions.
All inoculated portions (A to D) and uninoculated controls (A to D) were vacuum

99
packaged in 2 ply nylon, 3.5 mil thickness bags (North Central Food Processing Supply,
Sioux Falls, S.Dak., U.S.A.). Portions of each inoculated and uninoculated control were
placed at 4, 10 or 21 °C and incubated for up to 90, 90, and 30 d, respectively.
Salmonella survival and pH measurement
Treatments were first enumerated approximately 30 min after inoculation.
Thereafter, treatments placed at 4 and 10 °C were enumerated at 15, 30, 45, 60, 75, and
90 d. Treatments placed at 21 °C were enumerated at 5, 10, 15, 20, 25, and 30 d. After
sampling, cheese treatments were again vacuum packaged in 2-ply nylon, 3.5 mil
thickness bags. For Salmonella enumeration, 11 g of cheese was added to 99 mL of
sterile 2% sodium citrate at 42 °C and stomached at normal speed for 2 min (Duncan and
others 2004). Serial dilutions were prepared using 0.1% peptone water and plated in
duplicate on Salmonella-Shigella agar (Acumedia Manufacturers Inc., Lansing, Mich.,
U.S.A.). Colonies were enumerated after 48 h incubation at 35°C. Colonies counting was
performed and reported in all plates up-to lower limit of 1 CFU/g of cheese. The presence
or absence of Salmonella was determined by pre-enriching 11 g cheese sample in 99 mL
of lactose broth (Acumedia) for 24 h at 35 °C. The pre-enriched culture (0.1 mL) was
sub-cultured (selective enrichment) into 10 mL of Rappaport-Vassiliadis R10 broth
(Acumedia) and incubated for 24 to 48 h at 35 °C. Confirmation of the presence or
absence of Salmonella was done by further plating the enriched culture into Salmonella-
Shigella agar and incubated for 24 to 48 h at 35 °C. For pH measurement, 10 g cheese
was stomached with 5 mL distilled water for 30 s and measured using double junction pH
Testr 30 (Oakton Instruments, Vernon Hills, Ill., U.S.A.).
100
Experimental design and statistical analysis
Cheddar cheese with 2 salt levels (low = 0.7% wt/wt and high = 1.8% wt/wt) at 2
target pH levels (low = 5.2 and high = 5.6 at 12 wk of ageing) were prepared. The 4
treatments were low-salt and low-pH (A); low-salt and high-pH (B); standard-salt and
high-pH (C); and standard-salt and low-pH (D). Total of 3 replications of experiment
were conducted using the prepared cheeses. In each replication, comminuted cheese
samples were inoculated and analyzed in duplicate for Salmonella counts at 7 different
day points. Data points are expressed as mean ± standard deviation. A repeated measure
design was used where cheese type was the treatment between subjects and repeated
measure was carried out at 7 different day points. Analysis of variance (ANOVA) for
repeated measures was performed using the MIXED procedure of SAS (version 9.1; SAS
Institute Inc., Cary, N.C., U.S.A.). The effect of replication was blocked to avoid the
variations for each replicate. The covariance structure used was based on goodness of fit
as indicated by Akaike‘s information criterion. The Tukey‘s method was used to
determine the significance differences of mean values at an alpha = 0.05 over all
comparisons.
Results and Discussion
Physicochemical analysis of cheese
The average composition of un-inoculated treatments A to D at 12 wk of ageing is
shown in Table 17. The moisture content in low-salt treatments (A and B) is higher as
compared to that of standard-salt treatments (C and D). Less syneresis of curd during

101
Table 17. Physicochemical characteristics of Cheddar cheese treatments.
Treatmenta
A B C D
Moistureb(% wt/wt) 39.0±0.2 39.3±0.4 35.9±0.3 34.2±0.2
Fat (% wt/wt) 33 33 33 33
Saltb (% NaCl wt/wt) 0.68±0.02 0.70±0.01 1.88±0.02 1.74±0.03
WPSc 1.7 1.8 5.0 4.8
Water activity 0.98 0.97 0.95 0.95
pH at 1 wk 5.06 5.30 5.66 5.28
pH at 12 wk 5.12 5.52 5.67 5.28 aTreatments: A = low-salt low-pH; B = low-salt high-pH;
C = standard-salt high-pH; D = standard-salt low-pH.
bMean of 3 replicates
cWater phase salt (WPS) = %salt x 100 / (%salt+%moisture)
manufacturing of low-salt cheese yields cheese with higher moisture content that may
have significance in microbiological activity. During syneresis, some added salt is also
lost with whey and therefore the salt concentration measured later in cheese (Table 17) is
lower than the amount of salt added during manufacturing. This loss of added salt is
higher in standard-salt cheese due to comparative higher syneresis. The amount of salt
added was based on the previous experience of manufacturing cheese with different salt
concentrations. Due to less controllable lactose fermentation in low-salt cheeses along
with proteolysis of cheeses during ageing, the observed pH values at 12 wk in treatments
vary slightly from our targets. At all study temperatures, pH (Table 18, 19 and 20) of
low-salt treatments (A and B) gradually increased throughout the incubation period
possibly due to proteolysis in cheese (final pH of 5.30 to 5.59 in cheese A and 5.66 to
5.94 in cheese B at different incubation temperatures). Treatment C (standard-salt) was
salted at pH 5.8, and probably had larger amount of un-utilized (un-fermented) lactose.

102
Table 18. pH of treatment and control Cheddar cheeses during storage at 4 °C1.
Treatment1
Control1
Day A B C D A B C D 0 5.04±0.02 5.46±0.06 5.61±0.02 5.22±0.03 5.12±.02 5.52±0.03 5.67±0.02 5.28±0.02
5 5.11±0.03 5.52±0.02 5.57±0.02 5.27±0.03 na na na na
10 5.13±0.01 5.58±0.01 5.49±0.02 5.27±0.03 na na na na
15 5.15±0.02 5.61±0.02 5.37±0.02 5.24±0.03 5.18±0.02 5.61±0.01 5.45±0.04 5.33±0.03
20 5.20±0.03 5.67±0.02 5.32±0.06 5.27±0.02 na na na na
25 5.26±0.05 5.71±0.03 5.29±0.05 5.28±0.02 na na na na
30 5.30±0.03 5.66±0.01 5.29±0.02 5.25±0.02 5.32±0.03 5.70±0.03 5.36±0.01 5.30±0.03
1Data are presented as the mean values of 3 replications ± standard deviation.
Treatments and Control: A = low-salt low-pH; B = low-salt high-pH; C = standard salt
high-pH; D = standard salt low-pH. Treatments and Control were aged for 12 wk before
inoculation study.
na = not analyzed.
Table 19. pH of treatment and control Cheddar cheeses during storage at 10 °C1.
Treatment1
Control1
Day A B C D A B C D 0 5.04±0.02 5.46±0.06 5.61±0.02 5.22±0.03 5.12±0.03 5.52±0.03 5.67±0.02 5.28±0.02
15 5.11±0.05 5.53±0.02 5.35±0.02 5.20±0.02 na na na na
30 5.19±0.03 5.62±0.03 5.22±0.01 5.19±0.01 na na na na
45 5.29±0.04 5.68±0.04 5.32±0.01 5.23±0.02 5.32±0.03 5.74±0.04 5.28±0.05 5.22±0.03
60 5.41±0.03 5.75±0.03 5.40±0.05 5.31±0.04 na na na na
75 5.47±0.04 5.85±0.01 5.41±0.01 5.35±0.02 na na na na
90 5.59±0.03 5.94±0.03 5.40±0.02 5.39±0.06 5.55±0.02 5.81±0.03 5.42±0.02 5.35±0.02
1Data are presented as the mean values of 3 replications ± standard deviation.
Treatments and Control: A = low-salt low-pH; B = low-salt high-pH; C = standard salt
high-pH; D = standard salt low-pH. Treatments and Control were aged for 12 wk before
inoculation study.
na = not analyzed.
The pH (5.61 at 0 d inoculation study) of this treatment decreased at all study
temperatures possibly due to further production of lactic acid (from un-utilized lactose).
This decrease was faster at higher temperature (lowest pH of 5.19, 5.22, and 5.29 at 10,
30, and 90 d for 21, 10, and 4 °C, respectively). The pH later increased gradually in 10
and 21 °C treatment (final pH of 5.40 at 10 and 21 °C incubation temperatures) again
possibly due to proteolysis in cheese. In agreement with the observed changes in pH of

103
Table 20. pH of treatment and control Cheddar cheeses during storage at 21 °C1.
Treatment1
Control1
Day A B C D A B C D 0 5.04±0.02 5.46±0.06 5.61±0.02 5.22±0.03 5.12±0.03 5.52±0.02 5.67±0.02 5.28±0.02
15 5.15±0.02 5.55±0.01 5.37±0.01 5.21±0.02 na na na na
30 5.18±0.02 5.63±0.02 5.19±0.02 5.19±0.03 na na na na
45 5.30±0.02 5.71±0.02 5.26±0.03 5.26±0.01 5.27±0.02 5.70±0.03 5.25±0.03 5.23±0.03
60 5.33±0.01 5.76±0.01 5.29±0.01 5.31±0.01 na na na na
75 5.37±0.01 5.81±0.02 5.36±0.01 5.39±0.01 na na na na
90 5.47±0.02 5.92±0.03 5.40±0.02 5.42±0.01 5.48±0.04 5.89±0.03 5.45±0.02 5.35±0.02
1Data are presented as the mean values of 3 replications ± standard deviation.
Treatments and Control: A = low-salt low-pH; B = low-salt high-pH; C = standard salt
high-pH;D = standard salt low-pH. Treatments and Control were aged for 12 wk before
inoculation study.
na = not analyzed.
treatment C, White and Custer (1976) reported the pH of Cheddar cheese to be 5.56, 5.43
(decreased) and 5.78 (increased) at 0, 4 and 9 months storage, respectively. In treatment
D (standard-salt), the pH increased to 5.39 and 5.42 at the end of study for 10 and 21 °C
storage, respectively. Shrestha and others (see Chapter 5) reported similar changes in the
pH of Cheddar cheese treatments in similar experimental conditions.
Survival of Salmonella
The mean inoculum level for treatments A to D was 3.5 to 4.3 log CFU/g (Table
21, 22, and 23). Salmonella counts decreased between 2.8 to 3.9 log CFU/g in all
treatments incubated at 4, 10 and 21 °C for up to 90, 90, and 30 d, respectively. Counts of
Salmonella decreased (2.8 to 3.8 log CFU/g) significantly (P < 0.05) in all treatments
incubated at 4 °C after 90 d (Table 21). Counts reached <1 CFU/g in treatments C and D
(all 3 replicates) after 90 and 30 d, respectively, at 4 °C. The count then remained <1
CFU/g in treatment D over 90 d storage. Similarly, the counts of Salmonella decreased
(3.5 to 3.9 log cfu/g) significantly (P < 0.05) in all treatments incubated at 10 °C after 90

104
Table 21. Survival (log CFU/g) of Salmonella serovars in different experimental
treatments of Cheddar cheese during storage at 4 °C1.
1Data are presented as the mean values of 3 replications ± standard deviation.
(1,1,UD) = CFU/g for 3 replicates; UD = undetectable (< 1CFU/g).
^(+, -) = presence and absence of Salmonella respectively per 10g cheese sample. A to C
Means preceded by the same capital letters in the same row with each day of storage
are not significantly different (P ≥ 0.05). a to d
Means followed by the lowercase letters in the same column within each treatment
are not significantly different (P ≥ 0.05). 2Treatments: A = low-salt low-pH; B = low-salt high-pH; C = standard salt high-pH;
D = standard salt low-pH. Treatments were aged for 12 wk before inoculation study.
d (Table 22). Counts reached <1 CFU/g in treatment C and D (all 3 replicates) after 90
and 45 d, respectively, at 10 °C. The count then remained <1 CFU/g in treatment D over
90 d storage. Treatments at 21 °C also exhibited a significant (P < 0.05) inoculum
decrease (3.2 to 3.9 log cfu/g) after 30 d (Table 23). Counts reached <1 CFU/g in
treatment C and D (all 3 replicates) after 30 and 20 d, respectively at 21 °C.
Day
0A
4.3 ± 0.1a AB
4.2 ± 0.1a AB 3.8 ± 0.2
a B3.5 ± 0.3
a
15A
3.3 ± 0.1b A
2.7 ± 0.2b B
1.3 ± 0.1b C
0.5 ± 0.1b
30A
2.2 ± 0.1c A
2.0 ± 0.1c B
0.4 ± 0.2c C b
45A
1.3 ± 0.6cd A
1.8 ± 0.1c B c B b
60 AB 0.6 ± 0.8d A
1.6 ± 0.2c B c B b
75 AB 1.0 ± 0.9cd A
1.5 ± 0.2c B c B b
90 AB 1.0 ± 0.6d A
1.4 ± 0.1c B c B b
(+,+,+)
(UD,UD,UD)
(+,+,+)
Treatment2
A B C D
(UD,1,UD) (UD,UD,UD)
(1,1,UD)*
(+,+,+)^
(UD,UD,UD)
(+,+,+)
(UD,2,UD)
(+,+,+)
(UD,UD,UD)
(+,+,+)
(+,+,+)
(UD,UD,UD)
(+,-,-)
(UD,UD,UD)
(+,-,-)

105
Table 22. Survival (log CFU/g) of Salmonella serovars in different experimental
treatments of Cheddar cheese during storage at 10 °C1.
1Data are presented as the mean values of 3 replications ± standard deviation.
*(1,1,UD) = CFU/g for 3 replicates; UD = undetectable (< 1CFU/g).
^(+, -) = presence and absence of Salmonella respectively per 10g cheese sample. A to C
Means preceded by the same capital letters in the same row with each day of storage
are not significantly different (P ≥ 0.05). a to e
Means followed by the lowercase letters in the same column within each treatment
are not significantly different (P ≥ 0.05). 2Treatments: A = low-salt low-pH; B = low-salt high-pH; C = standard salt high-pH;
D = standard salt low-pH. Treatments were aged for 12 wk before inoculation study.
The count then remained <1 CFU/g in treatment D over 30 d storage. At 30 d, Salmonella
counts were 1.1 and 1.7 log CFU/g lower in treatments A and B, respectively at 21 °C
storage (Table 23) as compared to 4 and 10 °C (Table 21 and 22). For treatment C,
Salmonella counts were slightly (about 0.5 log CFU/g) lower at 21 °C storage (Table 23)
as compared to 4 and 10 °C after 30 d. There was about 3 log reduction for treatment D
after 5 d storage at 21 °C, while 15 d was required for equal log reduction at either
Day
0A
4.3 ± 0.1a AB
4.2 ± 0.1a AB
3.8 ± 0.2a B
3.5 ± 0.3a
15A
3.2 ± 0.1b A
2.7 ± 0.2b B
1.4 ± 0.2b C
0.4 ± 0.1b
30A
2.0 ± 0.3c A
2.0 ± 0.2c B
0.6 ± 0.2c C b
45A
1.4 ± 0.3d A
1.6 ± 0.1c B d B b
60A
1.0 ± 0.5d A
1.0 ± 0.1d B cd B b
75A
0.8 ± 0.5d AB
0.4 ± 0.1de B d B b
90A
0.8 ± 0.7d AB
0.3 ± 0.2e B d B b
(1,UD,UD)
(1,UD,UD)
(+,+,+)
(UD,UD,UD)
(+,+,-)
(UD,UD,UD)
(+,+,+)
(+,+,+)
(UD,UD,UD)
(+,+,+) (+,+,-)
(UD,UD,UD)
(+,+,-)
(UD,UD,1)
Treatment2
(UD,UD,1)*
(+,+,+)^
(1,UD,2)
(+,+,+)
A B C D
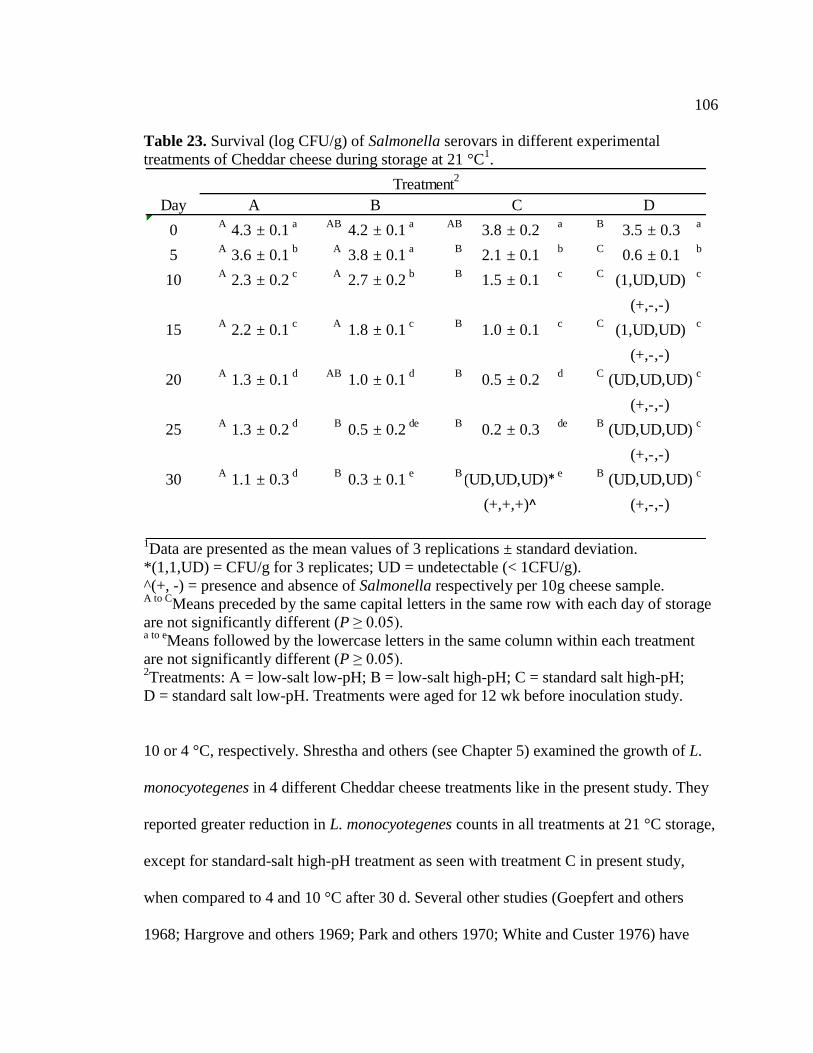
106
Table 23. Survival (log CFU/g) of Salmonella serovars in different experimental
treatments of Cheddar cheese during storage at 21 °C1.
1Data are presented as the mean values of 3 replications ± standard deviation.
*(1,1,UD) = CFU/g for 3 replicates; UD = undetectable (< 1CFU/g).
^(+, -) = presence and absence of Salmonella respectively per 10g cheese sample. A to C
Means preceded by the same capital letters in the same row with each day of storage
are not significantly different (P ≥ 0.05). a to e
Means followed by the lowercase letters in the same column within each treatment
are not significantly different (P ≥ 0.05). 2Treatments: A = low-salt low-pH; B = low-salt high-pH; C = standard salt high-pH;
D = standard salt low-pH. Treatments were aged for 12 wk before inoculation study.
10 or 4 °C, respectively. Shrestha and others (see Chapter 5) examined the growth of L.
monocyotegenes in 4 different Cheddar cheese treatments like in the present study. They
reported greater reduction in L. monocyotegenes counts in all treatments at 21 °C storage,
except for standard-salt high-pH treatment as seen with treatment C in present study,
when compared to 4 and 10 °C after 30 d. Several other studies (Goepfert and others
1968; Hargrove and others 1969; Park and others 1970; White and Custer 1976) have
Day
0A
4.3 ± 0.1a AB
4.2 ± 0.1a AB
3.8 ± 0.2a B
3.5 ± 0.3a
5A
3.6 ± 0.1b A
3.8 ± 0.1a B
2.1 ± 0.1b C
0.6 ± 0.1b
10A
2.3 ± 0.2c A
2.7 ± 0.2b B
1.5 ± 0.1c C c
15A
2.2 ± 0.1c A
1.8 ± 0.1c B
1.0 ± 0.1c C c
20A
1.3 ± 0.1d AB
1.0 ± 0.1d B
0.5 ± 0.2d C c
25A
1.3 ± 0.2d B
0.5 ± 0.2de B
0.2 ± 0.3de B c
30A
1.1 ± 0.3d B
0.3 ± 0.1e B e B c
(1,UD,UD)
(UD,UD,UD)*
(+,+,+)^ (+,-,-)
(UD,UD,UD)
(+,-,-)
(UD,UD,UD)
Treatment2
A B C D
(+,-,-)
(UD,UD,UD)
(+,-,-)
(1,UD,UD)
(+,-,-)
107
reported rapid decline of Salmonella count in Cheddar cheese when cured (stored) at
higher temperatures compared with low temperatures. The rate of metabolism of
Salmonella is increased at higher temperature that probably results in faster inactivation
due to autolysis. Also, the greater activity of starter and non-starter cultures in cheese at
higher temperatures presumably will inhibit Salmonella due to microbial competition.
Treatments A and B were low-salt compared to C and D. The low-salt treatments
exhibited lower Salmonella reductions between 2.8 to 3.3 log CFU/g at 4 ºC compared to
standard-salt treatments (3.5 to 3.8 log CFU/g; Table 21) after 90 d. Also, the Salmonella
reduction was significantly faster (P < 0.05) in treatment C and D compared to treatment
A and B (3.2 to 3.5 log CFU/g against 2.1 to 2.2 log CFU/g reductions) after 30 d of
storage at either 4 or 10 ºC. At 21 ºC incubation, the low-salt treatments exhibited
Salmonella reductions between 1.5 to 2.0 log CFU/g compared to standard-salt
treatments 2.3 to 3.5 log CFU/g (Table 23) after 10 d. The Salmonella counts in standard-
salt treatments were lowered to <1CFU/g either before or after the final days of storage at
all temperatures. The data suggest that the salt levels (0.7% against 1.8%) used in this
study greatly affect the survival of Salmonella at the experimental incubation
temperatures. Hargrove and others (1969) reported gradual reduction from initial log 6
CFU/g Salmonella in Colby (< 40% moisture) cheese with 1.80% to 2.63% salt content
during curing for 7 mo. They, however, reported no differences of salt levels (1.80%,
2.01% and 2.63%) in the inhibition of Salmonella. After the third enumeration day-point
at all study temperatures, the Salmonella count was significantly low (P < 0.05) in
treatment D (standard-salt and low-pH; most inhibitory treatment in terms of salt and pH

108
level) as compared with treatment C (standard-salt and high-pH) and low-salt treatments
A and B. The data indicate that lower pH in standard-salt Cheddar cheese provides a
greater decrease in Salmonella count at all 3 incubation temperatures. Hargrove and
others (1969) also reported significantly greater reduction of Salmonella count in
traditional Cheddar cheese with pH 5.3 (after 21 h pressing) as compared to pH 5.65
throughout curing at 4.4 °C. Low-salt treatments A and B exhibited no significant effect
of pH levels in the Salmonella count for up to 90 d storage at 4 or 10 ºC. However, it is
interesting to note that treatment B (high-pH) had significantly lower Salmonella count as
compared to treatment A (low-pH) at 21 ºC after 25 and 30 d. The present study could
not explain either insignificance or less inhibitory effect of lower pH in low-salt Cheddar
cheese. Despite reaching a pH of 5.66 to 5.94 the treatment B still did not permit
Salmonella growth at any of the incubation temperatures. Gilliland and Speck (1972)
noted that lactic cultures inhibited salmonellae and staphylococci even at higher pH of
6.6 and this may be the effect seen in Salmonella inhibition in the present study.
None of the treatments exhibited complete absence of Salmonella in the present
study. Goepfert and others (1968) also reported survival of Salmonella Typhimurium
(population at the start of curing approximately log 4 CFU/g) in Cheddar cheese for at
least 12 wk when cured at 7.5 to 13 ºC. Several other researchers (Hargrove and others
1969; White and Custer 1976; Wood and others 1984) have documented the ability of
Salmonella to survive in Cheddar cheese for several months at storage temperature 5 or
10 ºC. D‘ Aoust and others (1985) reported that Cheddar cheese with fewer than 10 cells
of Salmonella Typhimurium (0.36 to 9.3/100 g) was implicated in a major food borne

109
illness outbreak which emphasizes the need for the absence of Salmonella. These
findings highlight the need to maintain strict adherence to proper sanitary procedures.
In our previous study, we found that L. monocytogenes could not grow in low-salt
Cheddar cheese at either refrigeration or abuse temperatures. These studies are very
supportive findings for the Natl. Salt Reduction Initiative led by New York City that
targets all foods in equal measure and seeking a gradual 25% sodium reduction over 5 y.
These findings also encourage salt reduction in other cheese varieties and fermented
foods.
Conclusions
This study demonstrated that post-aging Salmonella contamination of low-salt
(0.7% w/w) Cheddar cheeses at an initial pH of 5.1 to 5.5 does not support growth at 4,
10 and 21 °C up to 90, 90, and 30 d, respectively. In fact, Salmonella count reduced by
2.8 to 3.9 log CFU/g when the cheese was stored at 4 or 10 ºC for 90 d or 21 ºC for 30 d.
The room temperature (21 ºC) storage results faster reduction in Salmonella counts than
the lower temperatures. The results suggest that low or reduced salt cheeses besides being
nutritionally better are also safe as their full salt counterparts and that salt may only be a
minor food safety hurdle regarding the post-aging contamination and growth of
Salmonella. Although there was significant reduction in Salmonella count, all the
treatments demonstrated presence of Salmonella for up to 90 d when stored at 4 or 10 ºC
and for up to 30 d at 21 ºC, the need for good sanitation practices to prevent post
manufacturing cross contamination remains.

110
References
[APHA] American Public Health Assoc. 1992. Standard methods for the examination of
dairy products. 16th
ed. Marshall RT, editor. Washington, D.C.: Am. Public
Health Assoc. Inc.
Bishop JR, Smukowski M. 2006. Storage temperatures necessary to maintain cheese
safety. Food Protect Trends 26:714–724.
[CDC] Centers for Disease Control and Prevention. 2010a. Preliminary foodnet data on
the incidence of infection with pathogens transmitted commonly through food ---
10 States, 2009. Available from:
http://www.cdc.gov/mmwr/preview/mmwrhtml/mm5914a2.htm Accessed 2011
April 21.
[CDC] Centers for Disease Control and Prevention. 2010b. What is salmonellosis?
Available from: http://www.cdc.gov/salmonella/general/index.html Accessed
2011 April 21.
Danaei G, Ding EL, Mozaffarian D, Taylor B, Rehm J, Murray CJ, Ezzati M. 2009. The
preventable causes of death in the United States: Comparative risk assessment of
dietary, lifestyle, and metabolic risk factors. PLoS Med 6: 1-23.
D‘ Aoust JY, Warburton DW, Sewell AM. 1985. Salmonella typhimurium phage type 10
from Cheddar cheese implicated in a major Canadian foodborne outbreak. J Food
Prot 48:1062-1066.

111
Dickinson BD, Havas S. 2007. Reducing the population burden of cardiovascular disease
by reducing sodium intake: a report of the Council on Science and Public Health.
Arch Intern Med 167:1460-8.
Duncan SE, Yaun BR, Summer SS. 2004. Microbiological methods for dairy products.
In: Wehr HM, Frank JF, editors. Standard methods for the examination of dairy
products. 17th
ed. Washington, D.C.: Am. Publ. Health Assoc. Inc. p 258-261.
El-Gazzar FE, Marth EH. 1992. Salmonella, salmonellosis, and dairy foods: a review. J
Dairy Sci 75:2327-43.
Gilliland SE, Speck ML. 1972. Interactions of food starter cultures and food-borne
pathogens: Lactic streptococci versus staphylococci and salmonellae. J Milk Food
Technol 35:307-310.
Goepfert JM, Olson NF, Marth EH. 1968. Behavior of Salmonella Typhimurium during
manufacture and curing of Cheddar cheese. Appl Microbiol 16:862–6.
Hargrove RE, McDonough FE, Mattingly WA. 1969. Factors affecting survival of
Salmonella in Cheddar and Colby cheese. J Milk Food Technol 32:480–4.
[IOM] Institute of Medicine. 2001. Sodium and chloride. In: Dietary reference intakes for
water, potassium, sodium, chloride and sulfate. Washington, D.C.: The Natl.
Academies Press, p 269-423.
Johnson ME, Kapoor R, McMahon DJ, McCoy DR, Narasimmon RG. 2009. Reduction
of sodium and fat levels in natural and processed cheeses: scientific and
technological aspects. Comp Rev Food Sci and Food Safety 8: 252-268.

112
Lawrence RC, Gilles J. 1980. The assessment of the potential quality of young Cheddar
cheese. NZ J Dairy Sci Technol 15:1-12.
Lawrence RC, Gilles J. 1982. Factors that determine the pH of young Cheddar cheese.
NZ J Dairy Sci Technol 17:1-14.
Lawrence RC, Heap HA, Gilles J. 1984. A controlled approach to cheese technology. J
Dairy Sci 67:1632-45.
Marcos A, Alcalá M, León F, Fernández-Salguero J, Esteban MA. 1981. Water activity
and chemical composition of cheese. J Dairy Sci 64:622–6.
Norholt MD. 1984. Growth and inactivation of pathogenic microorganisms during
manufacture and storage of fermented dairy products: a review. Neth Milk Dairy J
38:135–50.
Park HS, Marth EH, Goepfert JM, Olson NF. 1970. The fate of Salmonella typhimurium
in the manufacture and ripening of low-acid Cheddar cheese. J Milk Food
Technol 33:280-4.
Redmond EC, Griffith CJ. 2003. Consumer food handling in the home: a review of food
safety studies. J Food Prot 66:130-61.
Shacher D, Yaron S. 2006. Heat tolerance of Salmonella enteric serovars Agona,
Enteritidis, and Typhimurium in peanut butter. J Food Protect 69:2687-91.
US FDA. 2008. 21 CFR, Part 101.61. Nutrient content claims for the sodium content of
foods. Washington, D.C.: Food and Drug Administration, Dept. of Health and
Human Services.

113
US FDA. 2009. Factors that Influence Microbial Growth. Available from:
http://www.fda.gov/Food/ScienceResearch/ResearchAreas/SafePracticesforFoodP
rocesses/ucm094145.htm Accessed 2011 April 21.
White CH, Custer EW. 1976. Survival of Salmonella in Cheddar cheese. J Milk Food
Technol 39(5): 328-31.
Wood DS, Collins-Thompson DL, Irvine DM, Myhr AN.1984. Source and persistence of
Salmonella muenster in naturally contaminated Cheddar cheese. J Food Prot
47:20–2.

114
CHAPTER 7
SUMMARY AND CONCLUSIONS
This study focused on ensuring microbial safety in food product/process
development. The first part of this study developed and validated the safety of user-
friendly alternative processing techniques for meat products: hot-water (60 °C) thawing
of frozen chicken-breast, marinade cooking (91 °C) of hamburger, and marinade holding
(60 °C) of the cooked hamburger. The developed techniques ensured the safety and
maintained the quality of the final products. Because these processes are easier, more
convenient and economically advantageous, food handlers may choose them over
processes with a much greater food safety risk. Therefore, the processes have potential to
reduce the serious gap existing between the operators‘ food-safety knowledge and the
actual behavior (compliance). Reducing the gap will lower the frequency of food-borne
illness originating from food-service establishments and homes. Currently, over 60% of
food-borne illness in the US occurs as a result of improper food-handling and preparation
practices in food-service establishments and consumer homes.
The thawing methods currently recommended by the US FDA present some
disadvantages to the foodservice operator and consumer. Thawing under refrigeration or
running water is time consuming. Additional disadvantages for running water thawing
include the potential for cross-contamination of microorganisms and the excessive
consumption and discharge of water. Though microwave thawing is faster than
refrigerator or cold-water thawing, it also results in localized overheating that can result
in loss of quality. Therefore, an alternative method was developed to thaw frozen
115
chicken-breast by submersion in hot water at 60 °C, an appropriate temperature setting
for foodservice hot-holding equipment. The method was significantly quicker (2 to 8.5
min) than refrigerator thawing (10 to 15.5 h). Thawing time in hot water increased with
an increase in thickness of chicken breast. A mathematical model for Salmonella growth
validated that the method was safe. Three separate triangle tests suggested that overall
sensory quality of the subsequently cooked product was not different from refrigerator-
thawed and cooked product.
High-temperature cooking methods such as grilling and pan-frying increase the
chances of thick hamburger-patties being surface-overcooked while innermost portions
remain undercooked. Therefore, feasibility of cooking frozen patties in hot water at 91 °C
(moderate temperature) together with holding the cooked patties in hot water at 60 °C for
up-to 4 h were studied. Protein and fat content and thiobarbituric acid value were not
different between the water-cooked and pan-fried patties and were also not different
when both were held in hot water. However, consumers rated color and flavor of the
water-cooked and water-held patties significantly lower in acceptability. An 8-member
focus group evaluated methods to improve the appearance and flavor. Accordingly,
frozen patties with 0.75% salt were initially grilled to develop grill-mark on surface and
then finish-cooked in hot marinade at 91 °C containing 0.75% salt and 0.3% caramel
color. The cooked patties were held in the marinade maintained at 60 °C. Consumers
accepted appearance, juiciness, flavor, and texture of the marinade-finished cooked and
held patties (up-to 4 h) equally or more compared to patties grilled and held in a
commercial hot-steam cabinet.
116
The second part of this study evaluated the safety of low-salt aged Cheddar
cheese at retail and consumer level. Aged Cheddar cheese was inoculated with either
Listeria monocytogenes or Salmonella, simulating post-processing contamination. The
low-salt Cheddar cheese (0.7 % NaCl) was found to be as safe as the full-salt counterpart
(1.8 % NaCl) in terms of the growth of L. monocytogenes and Salmonella at 4, 10, and 21
°C. However, in overall, Salmonella counts were reduced faster in full-salt Cheddar as
compared to low-salt Cheddar. This effect of salt levels was not evident in viable L.
monocytogenes counts. Studies (Glass and other 1998; Larson and others 1999; Taormina
2010) suggest that L. monocytogenes is a salt tolerant bacterium. Therefore, the full-salt
Cheddar is probably not sufficiently high in salt concentration to produce comparative
faster reduction in the L. monocytogenes counts. The viable counts of Salmonella were
reduced to a greater extent than L. monocytogenes in all treatments. This is also probably
attributed to the salt tolerance of L. monocytogenes.
Reducing salt in perishable foods including cheese is a microbial-safety concern
especially in their distribution and storage although the current US dietary guidelines
recommend 35% reduction in sodium (salt) intake. Cross-contamination of low-salt
cheese at food establishments and consumer homes may support growth of bacterial
pathogens; cross-contamination is the major factor causing foodborne illness. Therefore,
this study also sought to evaluate the microbial safety of low-salt hard-type cheese
inoculated with either Listeria monocytogenes or Salmonella, simulating post-processing
contamination. Both of these pathogens are the major causative organisms of foodborne
illness in the US. Aged Cheddar cheeses were inoculated with either L. monocytogenes
117
(3.5 log CFU/g) or Salmonella spp. (4.0 log CFU/g) and their survival or growth in the
cheeses was monitored at 4, 10, and 21 °C for up-to 90, 90, and 30 d, respectively. Low-
salt (0.7% NaCl) Cheddar formulated at pH 5.1 or 5.7 (low and high pH respectively)
exhibited no-growth or gradual reduction in L. monocytogenes and Salmonella counts. At
the end of incubation at a given temperature, there was no significant difference in L.
monocytogenes survival between the low- and standard-salt (1.8% NaCl) treatments at
either low or high pH. On the other hand, in the initial period of the survival study,
standard-salt treatments exhibited significantly lower Salmonella counts compared to
low-salt treatments. The pH levels, however, did not exhibit obvious significant effect in
the Salmonella survival in low-salt treatments. The results suggest that low- or reduced-
salt cheeses are as safe as their full-salt counterparts and that salt may only be a minor
food-safety hurdle regarding the post-aging contamination and growth of L.
monocytogenes and Salmonella spp. Although there were significant reductions in L.
monocytogenes and Salmonella counts, the treatments demonstrated survival of L.
monocytogenes and Salmonella for up to 90 d when stored at 4 or 10 ºC and for up to 30
d at 21 ºC. Therefore, the need for good sanitation practices to prevent post
manufacturing cross contamination remains.
There may be some concern over the chances of post-processing contamination
(at retail or consumer level) of Cheddar with other pathogens like E. coli O157:H7 and
Staphylococcus aureus (Johnson and others 1990). Bishop and Smukowski (2006)
suggest that Salmonella, enteropathogenic E. coli., Staphylococcus aureus, and L.
monocytogenes are inactivated or inhibited in growth by metabolites of lactic acid

118
bacteria in natural hard cheese including Cheddar (produced with regular salt content). In
addition, Ashenafi and Busse (1991) studied the growth potential of E. coli and
Salmonella infantis in fermenting tempeh (a low-salt product) made from either
horsebean, pea or chickpea. During the 18 h tempeh fermentation period, E. coli and
Salmonella infantis were inactivated or inhibited in growth in the cooked beans (both
unacidified and acidified treatments) inoculated with Lactobacillus plantarum, while they
multiplied rapidly in control samples that were not inoculated with L. plantarum. The
researcher suggested that the metabolites of L. plantarum (lactic acid bacteria) probably
are inhibitory to the test organisms in the temeph (low-salt product). Therefore, we
believe that lactic acid bacteria will have similar effect on the growth of E. coli O157:H7
in low-salt Cheddar. Although E. coli O157:H7 is not considered as a salt tolerant
bacterium, Glass and others (1998) cite that E. coli O157:H7 is comparatively more
tolerant to sodium chloride than Salmonella. Therefore, we assume that E. coli
inactivation rate in low-salt Cheddar cheese will probably be between Salmonella and L.
monocytogenes. Future research is recommended to validate the statement.
Staphylococcus aureus is the most salt resistant pathogen (Taormina 2010).
Therefore, lowering the salt content in Cheddar will probably not have any effect in its
growth or survival. It also does not compete well with other microorganisms such as
lactic acid bacteria present in properly fermented products like Cheddar cheese (US FDA
2009). Accordingly, Johnson and others (1990) listed Staphylococcus aureus as a low
risk threat in lactic culture fermented cheese.

119
Therefore, it is concluded that low- or reduced-salt fermented hard cheeses,
besides being nutritionally better in terms of sodium content, are also microbiologically
safe. The findings also support the 2010 Dietary Guidelines for Americans that
recommends 35% reduction in sodium intake. Reducing the sodium content in cheese is
expected to contribute to reducing the overall dietary intake of sodium by the US
consumers.
References
Ashenafi M, Busse M. 1991. Growth potential of Salmonella infantis and Escherichia
coli in fermenting tempeh made from horsebean, pea and chickpea and their
inhibition by Lactobacillus plantarum. J Sci Food and Agriculture 55:607-615.
Bishop JR, Smukowski M. 2006. Storage temperatures necessary to maintain cheese
safety. Food Prot Trends 26:714–724.
Glass KA, Kaufmann KM, Johnson EA. 1998. Survival of bacterial pathogens in
pasteurized process cheese slices stored at 30 °C. J Food Prot 61:290–4.
Johnson EA, Nelson JH, Johnson ME. 1990. Microbiological safety of cheese made from
heat-treated milk, Part III. Technology, discussion, recommendations,
bibliography. J. Food Prot. 53: 610–623.
Larson AE, Johnson EA, Nelson JH. 1999. Survival of Listeria monocytogenes in
commercial cheese brines. J Dairy Sci 82:1860–1868.
Taorimina PJ. 2010. Implications of salt and sodium reduction on microbial food safety.
Critical Reviews in Food Sci and Nut 50:209–27.

120
US FDA. 2009. Chapter 6. Microbiological challenge testing. Available from:
http://www.fda.gov/Food/ScienceResearch/ResearchAreas/SafePracticesforFoodP
rocesses/ucm094154.htm. Accessed Nov 06, 2011.

121
APPENDICES
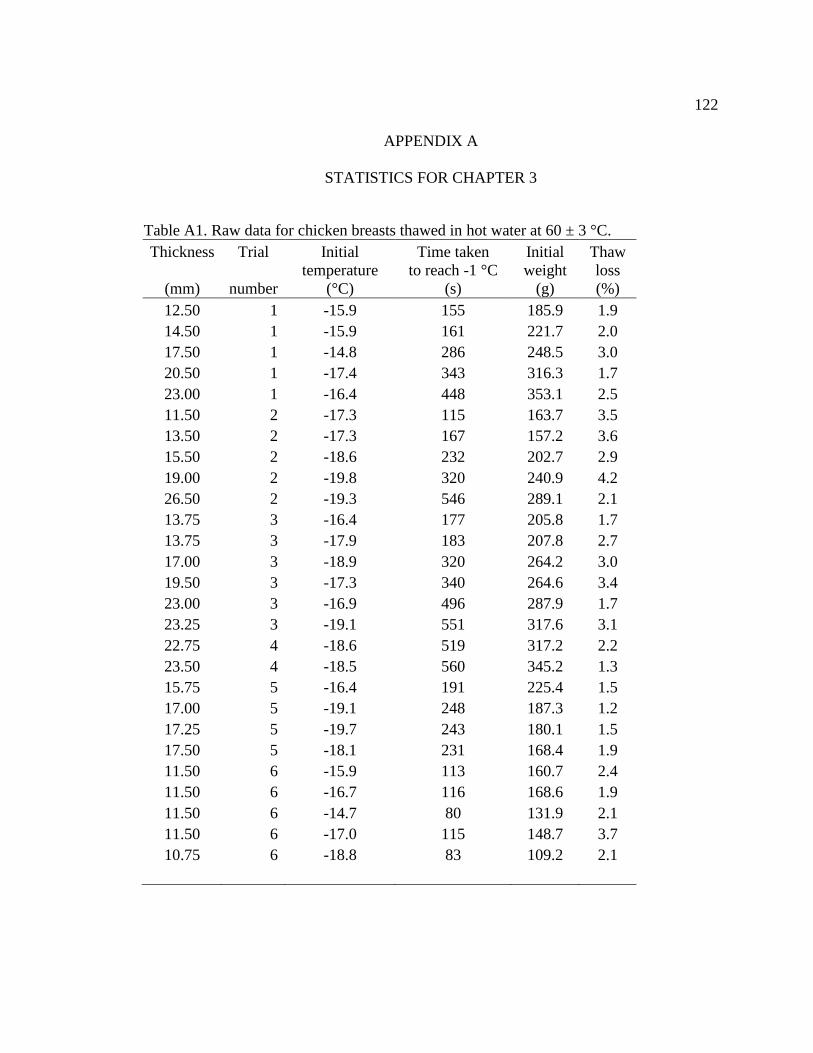
122
APPENDIX A
STATISTICS FOR CHAPTER 3
Table A1. Raw data for chicken breasts thawed in hot water at 60 ± 3 °C.
Thickness Trial Initial Time taken Initial Thaw
(mm) number
temperature
(°C)
to reach -1 °C
(s)
weight
(g)
loss
(%)
12.50 1 -15.9 155 185.9 1.9
14.50 1 -15.9 161 221.7 2.0
17.50 1 -14.8 286 248.5 3.0
20.50 1 -17.4 343 316.3 1.7
23.00 1 -16.4 448 353.1 2.5
11.50 2 -17.3 115 163.7 3.5
13.50 2 -17.3 167 157.2 3.6
15.50 2 -18.6 232 202.7 2.9
19.00 2 -19.8 320 240.9 4.2
26.50 2 -19.3 546 289.1 2.1
13.75 3 -16.4 177 205.8 1.7
13.75 3 -17.9 183 207.8 2.7
17.00 3 -18.9 320 264.2 3.0
19.50 3 -17.3 340 264.6 3.4
23.00 3 -16.9 496 287.9 1.7
23.25 3 -19.1 551 317.6 3.1
22.75 4 -18.6 519 317.2 2.2
23.50 4 -18.5 560 345.2 1.3
15.75 5 -16.4 191 225.4 1.5
17.00 5 -19.1 248 187.3 1.2
17.25 5 -19.7 243 180.1 1.5
17.50 5 -18.1 231 168.4 1.9
11.50 6 -15.9 113 160.7 2.4
11.50 6 -16.7 116 168.6 1.9
11.50 6 -14.7 80 131.9 2.1
11.50 6 -17.0 115 148.7 3.7
10.75 6 -18.8 83 109.2 2.1

123
Table A2. Raw data for chicken breasts thawed in refrigerator at 0 to 2.7 °C.
Thickness Trial Initial Time taken Initial Thaw
(mm) number
temperature
(°C)
to reach -1 °C
(min)
weight
(g)
loss
(%)
13.50 1 -14.8 660 197.9 1.0
16.00 1 -15.5 780 229.0 1.7
19.00 1 -16.2 900 225.7 1.1
22.00 1 -16.8 750 276.3 2.2
23.00 1 -15.2 960 303.5 1.0
12.00 2 -14.6 505 146.5 2.0
11.50 2 -15 480 168.5 3.5
14.75 2 -17.6 610 206.6 3.0
18.50 2 -18.5 705 237.8 2.8
24.00 2 -18.9 900 282.5 0.6
14.00 3 -16.5 580 208.9 1.0
17.50 3 -20.7 820 212.5 1.5
17.00 3 -19.8 825 250.7 2.4
21.75 3 -18.4 1010 313.5 1.0
18.50 3 -21.7 945 280.5 1.7
18.25 3 -16.9 755 229.2 0.6
22.50 4 -16.3 920 297.4 0.9
23.00 4 -16.2 940 328.9 0.8
13.50 5 -17.2 595 175.1 0.9
14.25 5 -17.3 680 182.7 0.4
15.00 5 -16.9 675 156.8 1.0
12.25 5 -13.4 745 131.5 0.8
11.75 6 -12.5 575 151.7 0.6
10.75 6 -12.5 555 139.6 2.1
12.25 6 -13 705 179.9 1.1
11.75 6 -12.8 660 104.7 1.0
10.50 6 -12.9 580 145.9 1.2

124
Table A3. Main effect of thawing methods on thaw loss and thaw time.
Thawing
method Means
Thaw loss
(%)
Thaw time
(s)
Hot water 2.410619 286.47
Refrigerator 1.378798 46678.93
Table A4. ANOVA table for thaw loss and thaw time.
Main Effect: Thawing method
Dependent
Mean
Square
Mean
Square f(df1,2) p-level
Variable Effect Error 1, 44
Thaw loss 1.14E+01 7.13E-01 16.046 0.0002348
Thaw time 2.31E+10 1.35E+07 1710.439 0.0000000
Table A5. ANOVA table for thaw loss and thaw time in hot water thawing method.
Main Effect: Thickness range
Dependent
Mean
Square
Mean
Square f(df1,2) p-level
Variable Effect Error 4,22
Thaw loss 1.00E-01 7.53E-01 0.1788 0.9469366
Thaw time 1.51E+05 1.08E+03 139.8085 0.0000000
Table A6. ANOVA table for thaw loss and thaw time in refrigerator thawing method.
Main Effect: Thickness range
Dependent
Mean
Square
Mean
Square f(df1,2) p-level
Variable Effect Error 4,22
Thaw loss 5.26E-01 6.72E-01 0.78343 0.5480881
Thaw time 3.89E+08 2.70E+07 14.4089 0.0000064

125
APPENDIX B
B1. EXAMPLE OF SURVEY QUESTIONNAIRE USED IN TRIANGLE TEST
1. Please taste all 3 samples from left to right. There is an empty drinking cup for you to
expectorate your sample in after tasting. Please rinse your mouth out with water between
samples. Then select the one sample which is different from the other two.
Sample XXX Sample XXX Sample XXX
Comment (any additional comments after tasting the samples):
________________________________________________________________________
________________________________________________________________________
________________________________________________________________________
2. What is your gender?
Male Female
3. What is your age group?
18-25 26-35 36-45 46-55 >56

126
B2. TRIANGLE TEST FOR DIFFERENCE:
CRITICAL NUMBER (MINIMUM) OF CORRECT ANSWERS
Entries are the minimum number of correct responses required for significance at
the stated significance level (i.e., column) for the corresponding number of respondents
"n" (i.e., row). Reject the assumption of "no difference" if the number of correct
responses is greater than or equal to the tabled value.
Significance level (%) Significance level (%)
n 10 5 1 0.1 n 10 5 1 0.1
3 3 3 - - 26 13 14 15 17
4 4 4 - - 27 13 14 16 18
5 4 4 5 - 28 14 15 16 18
29 14 15 17 19
30 14 15 17 19
6 5 5 6 - 31 15 16 18 20
7 5 5 6 7 32 15 16 18 20
8 5 6 7 8 33 15 17 18 21
9 6 6 7 8 34 16 17 19 21
10 6 7 8 9 35 16 17 19 22
11 7 7 8 10 36 17 18 20 22
12 7 8 9 10 42 19 20 22 25
13 8 8 9 11 48 21 22 25 27
14 8 9 10 11 54 23 25 27 30
15 8 9 10 12 60 26 27 30 33
16 9 9 11 12 66 28 29 32 35
17 9 10 11 13 72 30 32 34 38
18 10 10 12 13 78 32 34 37 40
19 10 11 12 14 84 35 36 39 43
20 10 11 13 14 90 37 38 42 45
96 39 41 44 48

127
21 11 12 13 15
22 11 12 14 15
23 12 12 14 16
24 12 13 15 16
25 12 13 15 17

128
APPENDIX C
STATISTICS FOR CHAPTER 4
Table C1. Hunter color values for fried or water-cooked patties held in hot water at
61 °C. Patties in both methods were cooked from frozen state to an internal temperature
of 69 °C.
Cook Hot hold Hunter color measurementsab
method time (h) L* a* b*
Fry 0 39.5 ± 8.7 b 8.7 ± 1.4 a 19.5 ± 2.2 ab
1 47.3 ± 5.3 a 5.1 ± 0.7 b 18.3 ± 1.6 bc
2 48.8 ± 5.4 a 4.5 ± 1.1 bc 18.8 ± 2.1 abc
3 46.8 ± 6.1 a 4.7 ± 1.1 b 20.6 ± 1.5 a
4 49.0 ± 4.6 a 4.0 ± 0.7 bc 19.0 ± 1.1 abc
Water 0 49.6 ± 3.0 a 4.5 ± 0.8 b 15.3 ± 2.1 d
1 49.4 ± 2.8 a 4.0 ± 1.0 bc 16.9 ± 1.1 cd
2 49.7 ± 2.3 a 3.5 ± 0.8 bc 18.2 ± 1.2 bc
3 49.8 ± 1.7 a 3.1 ± 0.8 c 18.2 ± 0.9 bc
4 50.1 ± 2.7 a 3.0 ± 1.1 c 18.3 ± 1.3 bc
a L* = lightness, a* = redness, b* = yellowness.
b Data represent mean ± standard deviation. Mean was calculated from measurements
taken for five different patties in a trail. The experiment was repeated twice. Values in the
same column sharing letters are not significantly different (P ≥ 0.05).
Table C2. Type 3 tests of fixed effects (ANOVA) for L* color measurement.
Effect df Sum of Mean F Value P-value
Squares Square
Treatment 1 294.8089 294.8089 1.6 0.2417
Time 4 317.6936 79.4234 12.16 <.0001
Treatment*Time 4 290.8576 72.7144 11.13 <.0001

129
Table C3. Type 3 tests of fixed effects (ANOVA) for a* color measurement.
Effect df Sum of Mean F Value P-value
Squares Square
Treatment 1 76.28276 76.28276 29.79 0.0006
Time 4 119.8964 29.9741 37.98 <.0001
Treatment*Time 4 37.80441 9.451103 11.98 <.0001
Table C4. Type 3 tests of fixed effects (ANOVA) for b* color measurement.
Effect df Sum of Mean F Value P-value
Squares Square
Treatment 1 88.36 88.36 40.97 0.0002
Time 4 53.2166 13.30415 5.27 0.0008
Treatment*Time 4 46.797 11.69925 4.64 0.002
Table C5. Type 3 tests of fixed effects (ANOVA) for moisture content of fried or water-
cooked patties held in hot water at 61 °C.
Effect df Sum of Mean F Value P-value
Squares Square
Treatment 1 8.76E-07 8.76E-07 0.29 0.6415
Time 5 0.000157 3.14E-05 26.53 <.0001
Treatment*Time 5 2.1E-05 4.19E-06 3.54 0.0187
Table C6. Type 3 tests of fixed effects (ANOVA) for fat content of fried or water-cooked
patties held in hot water at 61 °C.
Effect df Sum of Mean F Value P-value
Squares Square
Treatment 1 7.380278 7.380278 4.81 0.1596
Time 5 7.328056 1.465611 1.69 0.1827
Treatment*Time 5 0.941389 0.188278 0.22 0.951

130
Table C7. Type 3 tests of fixed effects (ANOVA) for protein content of fried or water-
cooked patties held in hot water at 61 °C.
Effect df Sum of Mean F Value P-value
Squares Square
Treatment 1 10.02778 10.02778 42.03 0.023
Time 5 166.69 33.338 66.31 <.0001
Treatment*Time 5 7.008889 1.401778 2.79 0.0455
Table C8. Type 3 tests of fixed effects (ANOVA) for TBA value of fried or water-cooked
patties held in hot water at 61 °C.
Effect df Sum of Mean F Value P-value
Squares Square
Treatment 1 0.0009 0.0009 0.01 0.9187
Time 5 0.646689 0.129338 15.55 <.0001
Treatment*Time 5 0.048767 0.009753 1.17 0.3571
Table C9. Weighty and compositional
z loss of fried or water-cooked patties held in hot
water at 61 °C. Patties in both methods were cooked from frozen state to an internal
temperature of 69 °Cx.
Cook Hot hold Weight Moisture Fat Protein
method time (h) loss (%) loss (%) loss (%) loss (%)
Fry 0 21.1 ± 0.8 c 17.5 ± 1.4 ab 4.1 ± 1.5 a 0.2 ± 0.6 a
1 23.0 ± 0.3 bc 17.1 ± 1.5 ab 5.2 ± 1.5 a 0.7 ± 0.6 a
2 22.0 ± 1.5 c 16.9 ± 2.7 b 5.1 ± 0.4 a 0.6 ± 0.5 a
3 24.1 ± 1.1 bc 18.3 ± 2.0 ab 4.9 ± 1.0 a 0.8 ± 0.9 a
4 26.0 ± 0.4 ab 19.6 ± 1.2 ab 5.3 ± 0.9 a 1.5 ± 0.2 a
Water 0 28.9 ± 3.1 a 21.2 ± 2.5 a 5.2 ± 0.7 a 0.0 ± 1.1 a
1 25.3 ± 2.2 abc 17.3 ± 2.0 ab 5.4 ± 0.8 a 0.6 ± 0.6 a
2 24.9 ± 1.2 abc 16.6 ± 1.6 b 5.2 ± 0.5 a -0.2 ± 1.1 a
3 25.5 ± 2.7 abc 17.0 ± 1.8 b 5.3 ± 1.6 a 0.3 ± 0.7 a
4 24.5 ± 1.4 bc 16.1 ± 1.0 b 5.2 ± 1.2 a 0.5 ± 0.5 a
xData represent the mean standard deviation. Values in the same column sharing letters
are not significantly different (P ≥ 0.05). yWeight loss (%) = (Raw weight – Final product weight) x 100/Raw weight.
zCompositional loss = [initial content (g) in raw patties – total content (g) in final
product] x 100/ initial content (g) in raw patties.

131
Table C10. ANOVA for different sensory attributes of fried or water-cooked patties held
in hot water at 61 °C (Consumer acceptance panel part I).
Attribute Source df Sum of Mean F Value P-value
Squares Square
Appearance Judge 93 388.468 4.17708 2.56 <.0001
Appearance Sample 3 387.074 129.025 79.04 <.0001
Juiciness Judge 93 363.354 3.90703 1.98 <.0001
Juiciness Sample 3 98.6676 32.8892 16.68 <.0001
Flavor Judge 93 405.779 4.36322 2.1 <.0001
Flavor Sample 3 411.838 137.279 65.93 <.0001
Tenderness Judge 93 316.617 3.40448 2.18 <.0001
Tenderness Sample 3 45.1702 15.0567 9.64 <.0001
Table C11. ANOVA for different sensory attributes of grilled or marinade cooked patties
and held at 61 °C in steam cabinet or marinade respectively (Consumer acceptance panel
part II).
Attribute Source df Sum of Mean F Value P-value
Squares Square
Appearance Judge 305 693.367 2.28834 1.85 <.0001
Appearance Sample 4 6.7994 1.69985 1.38 0.2423
Juiciness Judge 305 648.895 2.14157 1.48 0.0003
Juiciness Sample 4 37.5213 9.38033 6.49 <.0001
Flavor Judge 305 497.711 1.64261 1.44 0.0008
Flavor Sample 4 6.24095 1.56024 1.37 0.2458
Texture Judge 305 804.248 2.65429 2.5 <.0001
Texture Sample 4 14.4638 3.61595 3.4 0.0097
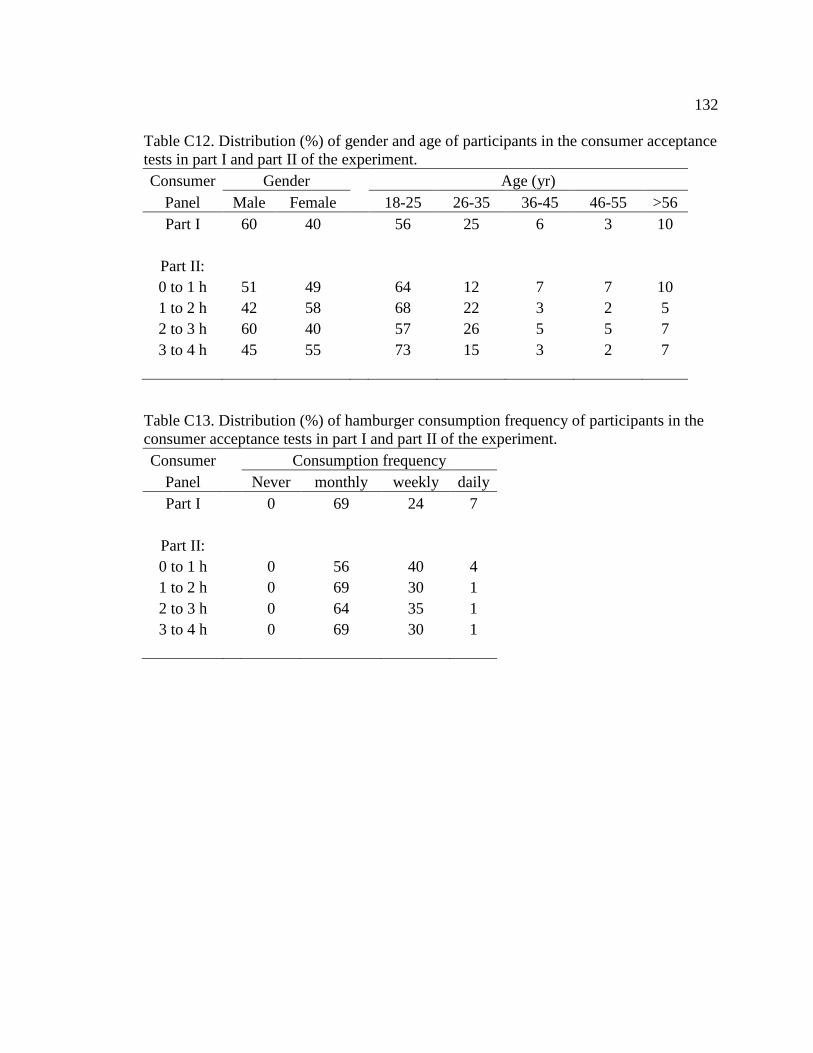
132
Table C12. Distribution (%) of gender and age of participants in the consumer acceptance
tests in part I and part II of the experiment.
Consumer Gender Age (yr)
Panel Male Female 18-25 26-35 36-45 46-55 >56
Part I 60 40
56 25 6 3 10
Part II:
0 to 1 h 51 49
64 12 7 7 10
1 to 2 h 42 58
68 22 3 2 5
2 to 3 h 60 40
57 26 5 5 7
3 to 4 h 45 55
73 15 3 2 7
Table C13. Distribution (%) of hamburger consumption frequency of participants in the
consumer acceptance tests in part I and part II of the experiment.
Consumer Consumption frequency
Panel Never monthly weekly daily
Part I
0 69 24 7
Part II:
0 to 1 h
0 56 40 4
1 to 2 h
0 69 30 1
2 to 3 h
0 64 35 1
3 to 4 h
0 69 30 1

133
APPENDIX D
EXAMPLE OF SURVEY QUESTIONNAIRE AND NINE-POINT HEDONIC SCALE
USED IN CONSUMER ACCEPTANCE PANELS
Please analyze the samples from left to right. There is an empty drinking cup for you to
expectorate your sample in after tasting. Please rinse your mouth out with water after
each sample. Continue to the next sample.
Sample ###:
1. Rate how much you like the appearance of this sample:
Extremely
dislike
Dislike
Very
Much
Dislike
Moderately
Dislike
Slightly
Neither
like
nor
dislike
Like
Slightly
Like
Moderately
Like
Very
Much
Like
Extremely
2. Rate how much you like the juiciness of this sample:
Extremely
dislike
Dislike
Very
Much
Dislike
Moderately
Dislike
Slightly
Neither
like
nor
dislike
Like
Slightly
Like
Moderately
Like
Very
Much
Like
Extremely
3. Rate how much you like the flavor of this sample:
Extremely
dislike
Dislike
Very
Much
Dislike
Moderately
Dislike
Slightly
Neither
like
nor
dislike
Like
Slightly
Like
Moderately
Like
Very
Much
Like
Extremely

134
4. Rate how much you like the texture of this sample:
Extremely
dislike
Dislike
Very
Much
Dislike
Moderately
Dislike
Slightly
Neither
like
nor
dislike
Like
Slightly
Like
Moderately
Like
Very
Much
Like
Extremely
Comment (any additional comments after tasting the samples):
________________________________________________________________________
________________________________________________________________________
________________________________________________________________________
5. What is your gender?
Male Female
6. What is your age group?
18-25 26-35 36-45 46-55 >56
7. How often do you consume hamburger?
never atleast
once a
month
atleast
once a
week
atleast
once a
day

135
APPENDIX E
STATISTICS FOR CHAPTER 5
Table E1. Raw data count of Listeria monocytogenes in different experimental treatments
of Cheddar cheese during storage at 4 °C for up to 90 d.
Treatmenta Block
b Day Subject
c log CFU/g
A 1 0 1A 3.41
A 1 0 1A 3.38
A 2 0 2A 3.72
A 2 0 2A 3.81
A 3 0 3A 3.71
A 3 0 3A 3.95
A 1 15 1A 3.30
A 1 15 1A 3.32
A 2 15 2A 3.60
A 2 15 2A 3.53
A 3 15 3A 3.72
A 3 15 3A 3.72
A 1 30 1A 3.06
A 1 30 1A 3.13
A 2 30 2A 3.33
A 2 30 2A 3.26
A 3 30 3A 3.56
A 3 30 3A 3.59
A 1 45 1A 2.91
A 1 45 1A 2.90
A 2 45 2A 3.06
A 2 45 2A 3.04
A 3 45 3A 3.40
A 3 45 3A 3.26
A 1 60 1A 2.62
A 1 60 1A 2.61
A 2 60 2A 2.98
A 2 60 2A 2.91
A 3 60 3A 3.24
A 3 60 3A 3.30
A 1 75 1A 2.60
A 1 75 1A 2.43
A 2 75 2A 2.95

136
A 2 75 2A 2.90
A 3 75 3A 3.00
A 3 75 3A 2.91
A 1 90 1A 2.36
A 1 90 1A 2.64
A 2 90 2A 2.60
A 2 90 2A 2.90
A 3 90 3A 3.08
A 3 90 3A 2.95
B 1 0 1B 3.62
B 1 0 1B 3.71
B 2 0 2B 3.34
B 2 0 2B 4.00
B 3 0 3B 3.61
B 3 0 3B 3.73
B 1 15 1B 3.33
B 1 15 1B 3.41
B 2 15 2B 3.68
B 2 15 2B 3.68
B 3 15 3B 3.95
B 3 15 3B 3.96
B 1 30 1B 3.34
B 1 30 1B 3.30
B 2 30 2B 3.45
B 2 30 2B 3.56
B 3 30 3B 3.76
B 3 30 3B 3.66
B 1 45 1B 2.96
B 1 45 1B 3.03
B 2 45 2B 3.21
B 2 45 2B 3.38
B 3 45 3B 3.48
B 3 45 3B 3.58
B 1 60 1B 2.89
B 1 60 1B 2.94
B 2 60 2B 3.16
B 2 60 2B 3.21
B 3 60 3B 3.46
B 3 60 3B 3.41
B 1 75 1B 2.86
B 1 75 1B 2.83

137
B 2 75 2B 3.08
B 2 75 2B 3.15
B 3 75 3B 3.33
B 3 75 3B 3.34
B 1 90 1B 2.85
B 1 90 1B 2.78
B 2 90 2B 2.95
B 2 90 2B 3.15
B 3 90 3B 3.54
B 3 90 3B 3.52
C 1 0 1C 3.02
C 1 0 1C 3.00
C 2 0 2C 3.59
C 2 0 2C 3.52
C 3 0 3C 4.09
C 3 0 3C 4.06
C 1 15 1C 3.21
C 1 15 1C 3.21
C 2 15 2C 3.49
C 2 15 2C 3.61
C 3 15 3C 3.65
C 3 15 3C 3.63
C 1 30 1C 3.06
C 1 30 1C 3.13
C 2 30 2C 3.45
C 2 30 2C 3.34
C 3 30 3C 3.43
C 3 30 3C 3.48
C 1 45 1C 2.95
C 1 45 1C 2.88
C 2 45 2C 3.28
C 2 45 2C 3.27
C 3 45 3C 3.41
C 3 45 3C 3.40
C 1 60 1C 2.80
C 1 60 1C 2.63
C 2 60 2C 3.00
C 2 60 2C 3.03
C 3 60 3C 3.18
C 3 60 3C 3.30
C 1 75 1C 2.68

138
C 1 75 1C 2.46
C 2 75 2C 2.89
C 2 75 2C 2.77
C 3 75 3C 3.01
C 3 75 3C 2.89
C 1 90 1C 2.62
C 1 90 1C 2.57
C 2 90 2C 2.90
C 2 90 2C 2.78
C 3 90 3C 3.19
C 3 90 3C 3.09
D 1 0 1D 3.59
D 1 0 1D 3.38
D 2 0 2D 3.83
D 2 0 2D 3.68
D 3 0 3D 4.16
D 3 0 3D 4.05
D 1 15 1D 3.03
D 1 15 1D 3.16
D 2 15 2D 3.52
D 2 15 2D 3.48
D 3 15 3D 3.71
D 3 15 3D 3.72
D 1 30 1D 2.83
D 1 30 1D 2.79
D 2 30 2D 3.38
D 2 30 2D 3.35
D 3 30 3D 3.51
D 3 30 3D 3.48
D 1 45 1D 2.70
D 1 45 1D 2.69
D 2 45 2D 3.09
D 2 45 2D 3.11
D 3 45 3D 3.38
D 3 45 3D 3.34
D 1 60 1D 2.63
D 1 60 1D 2.72
D 2 60 2D 3.03
D 2 60 2D 3.00
D 3 60 3D 3.17
D 3 60 3D 3.30

139
D 1 75 1D 2.31
D 1 75 1D 2.26
D 2 75 2D 2.51
D 2 75 2D 2.57
D 3 75 3D 2.91
D 3 75 3D 2.91
D 1 90 1D 2.18
D 1 90 1D 2.16
D 2 90 2D 2.23
D 2 90 2D 2.34
D 3 90 3D 2.43
D 3 90 3D 2.48
aTreatment: A = low salt, low pH; B = low salt, high pH; C = standard salt, high pH; D =
standard salt, low pH. Treatment and control cheeses were aged for 10 wk before the
inoculation study. b
Block = Replicate within the research study. c Subject = Replicate within a block
Table E2. Type 3 tests of fixed effects (ANOVA) for Listeria monocytogenes counts in
different experimental treatments of Cheddar cheese during storage at 4 °C for up to 90 d.
Effect Num df Den df F Value P-value
Treatment 3 8 0.75 0.5537
Day 6 48 136.35 <.0001
Treatment*Day 18 48 4.90 <.0001
Table E3. Raw data count of Listeria monocytogenes in different experimental treatments
of Cheddar cheese during storage at 10 °C for up to 90 d.
Treatmenta Block
b Day Subject
c log CFU/g
A 1 0 1A 3.41
A 1 0 1A 3.38
A 2 0 2A 3.72
A 2 0 2A 3.81
A 3 0 3A 3.71
A 3 0 3A 3.95
A 1 15 1A 3.06
A 1 15 1A 3.22
A 2 15 2A 3.54
A 2 15 2A 3.46

140
A 3 15 3A 3.81
A 3 15 3A 3.70
A 1 30 1A 3.08
A 1 30 1A 3.11
A 2 30 2A 3.26
A 2 30 2A 3.38
A 3 30 3A 3.43
A 3 30 3A 3.45
A 1 45 1A 2.80
A 1 45 1A 2.79
A 2 45 2A 3.13
A 2 45 2A 3.20
A 3 45 3A 3.41
A 3 45 3A 3.32
A 1 60 1A 2.66
A 1 60 1A 2.62
A 2 60 2A 2.99
A 2 60 2A 3.09
A 3 60 3A 3.34
A 3 60 3A 3.28
A 1 75 1A 2.54
A 1 75 1A 2.62
A 2 75 2A 2.94
A 2 75 2A 3.02
A 3 75 3A 3.30
A 3 75 3A 3.11
A 1 90 1A 2.40
A 1 90 1A 2.41
A 2 90 2A 2.70
A 2 90 2A 2.60
A 3 90 3A 2.94
A 3 90 3A 3.02
B 1 0 1B 3.62
B 1 0 1B 3.71
B 2 0 2B 3.34
B 2 0 2B 4.00
B 3 0 3B 3.61
B 3 0 3B 3.73
B 1 15 1B 3.46
B 1 15 1B 3.42
B 2 15 2B 3.78

141
B 2 15 2B 3.79
B 3 15 3B 3.89
B 3 15 3B 3.93
B 1 30 1B 3.22
B 1 30 1B 3.26
B 2 30 2B 3.66
B 2 30 2B 3.62
B 3 30 3B 3.80
B 3 30 3B 3.83
B 1 45 1B 3.07
B 1 45 1B 3.03
B 2 45 2B 3.49
B 2 45 2B 3.49
B 3 45 3B 3.51
B 3 45 3B 3.61
B 1 60 1B 3.01
B 1 60 1B 2.98
B 2 60 2B 3.43
B 2 60 2B 3.43
B 3 60 3B 3.58
B 3 60 3B 3.45
B 1 75 1B 3.05
B 1 75 1B 2.88
B 2 75 2B 3.08
B 2 75 2B 3.20
B 3 75 3B 3.58
B 3 75 3B 3.43
B 1 90 1B 2.68
B 1 90 1B 2.68
B 2 90 2B 3.15
B 2 90 2B 3.00
B 3 90 3B 3.26
B 3 90 3B 3.30
C 1 0 1C 3.02
C 1 0 1C 3.00
C 2 0 2C 3.59
C 2 0 2C 3.52
C 3 0 3C 4.09
C 3 0 3C 4.06
C 1 15 1C 3.27
C 1 15 1C 3.35

142
C 2 15 2C 3.54
C 2 15 2C 3.46
C 3 15 3C 3.85
C 3 15 3C 3.89
C 1 30 1C 3.08
C 1 30 1C 3.18
C 2 30 2C 3.38
C 2 30 2C 3.34
C 3 30 3C 3.59
C 3 30 3C 3.65
C 1 45 1C 2.93
C 1 45 1C 2.95
C 2 45 2C 3.20
C 2 45 2C 3.11
C 3 45 3C 3.48
C 3 45 3C 3.43
C 1 60 1C 2.77
C 1 60 1C 2.79
C 2 60 2C 2.94
C 2 60 2C 2.99
C 3 60 3C 3.20
C 3 60 3C 3.26
C 1 75 1C 2.49
C 1 75 1C 2.52
C 2 75 2C 2.90
C 2 75 2C 2.90
C 3 75 3C 3.15
C 3 75 3C 3.00
C 1 90 1C 2.40
C 1 90 1C 2.52
C 2 90 2C 2.73
C 2 90 2C 2.82
C 3 90 3C 2.92
C 3 90 3C 2.90
D 1 0 1D 3.59
D 1 0 1D 3.38
D 2 0 2D 3.83
D 2 0 2D 3.68
D 3 0 3D 4.16
D 3 0 3D 4.05
D 1 15 1D 3.15
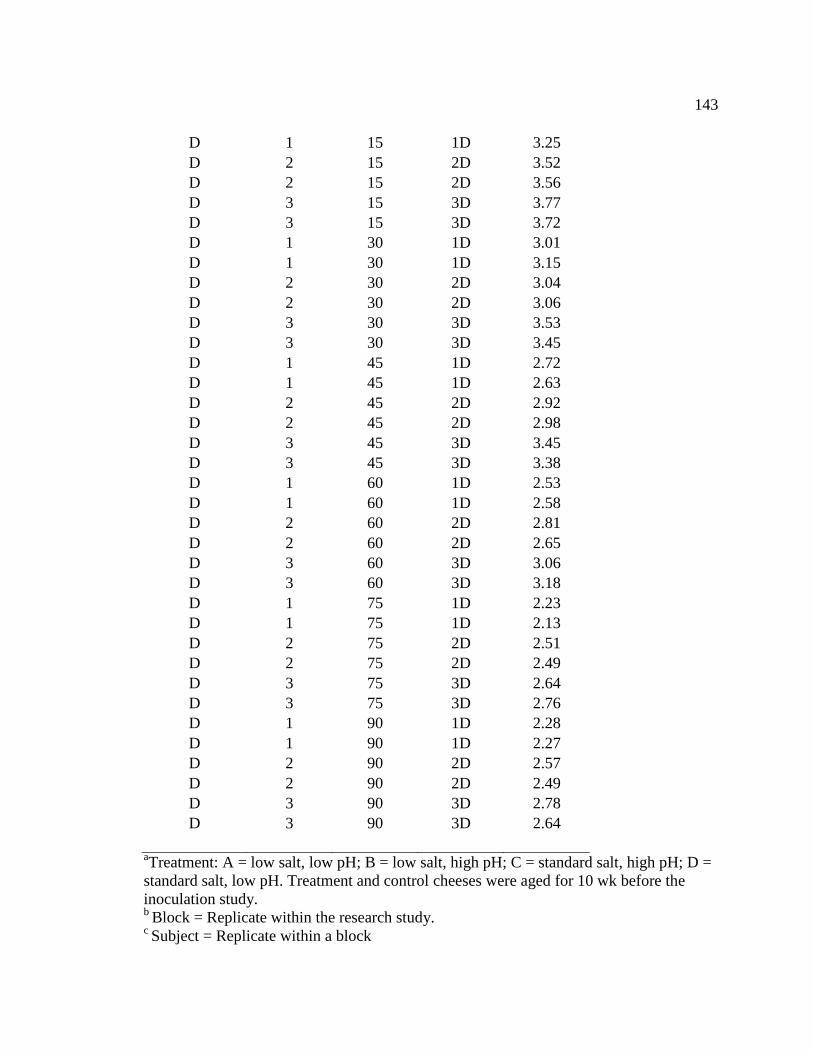
143
D 1 15 1D 3.25
D 2 15 2D 3.52
D 2 15 2D 3.56
D 3 15 3D 3.77
D 3 15 3D 3.72
D 1 30 1D 3.01
D 1 30 1D 3.15
D 2 30 2D 3.04
D 2 30 2D 3.06
D 3 30 3D 3.53
D 3 30 3D 3.45
D 1 45 1D 2.72
D 1 45 1D 2.63
D 2 45 2D 2.92
D 2 45 2D 2.98
D 3 45 3D 3.45
D 3 45 3D 3.38
D 1 60 1D 2.53
D 1 60 1D 2.58
D 2 60 2D 2.81
D 2 60 2D 2.65
D 3 60 3D 3.06
D 3 60 3D 3.18
D 1 75 1D 2.23
D 1 75 1D 2.13
D 2 75 2D 2.51
D 2 75 2D 2.49
D 3 75 3D 2.64
D 3 75 3D 2.76
D 1 90 1D 2.28
D 1 90 1D 2.27
D 2 90 2D 2.57
D 2 90 2D 2.49
D 3 90 3D 2.78
D 3 90 3D 2.64
aTreatment: A = low salt, low pH; B = low salt, high pH; C = standard salt, high pH; D =
standard salt, low pH. Treatment and control cheeses were aged for 10 wk before the
inoculation study. b
Block = Replicate within the research study. c Subject = Replicate within a block

144
Table E4. Type 3 tests of fixed effects (ANOVA) for Listeria monocytogenes counts in
different experimental treatments of Cheddar cheese during storage at 10 °C for up to 90
d.
Effect Num df Den df F Value P-value
Treatment 3 8 0.97 0.4535
Day 6 48 152.73 <.0001
Treatment*Day 18 48 4.40 <.0001
Table E5. Raw data count of Listeria monocytogenes in different experimental treatments
of Cheddar cheese during storage at 21 °C for up to 30 d.
Treatmenta Block
b Day Subject
c log CFU/g
A 1 0 1A 3.41
A 1 0 1A 3.38
A 2 0 2A 3.72
A 2 0 2A 3.81
A 3 0 3A 3.71
A 3 0 3A 3.95
A 1 5 1A 2.54
A 1 5 1A 2.52
A 2 5 2A 3.00
A 2 5 2A 2.98
A 3 5 3A 3.04
A 3 5 3A 3.18
A 1 10 1A 2.11
A 1 10 1A 2.01
A 2 10 2A 2.45
A 2 10 2A 2.43
A 3 10 3A 3.31
A 3 10 3A 3.31
A 1 15 1A 2.60
A 1 15 1A 2.51
A 2 15 2A 2.40
A 2 15 2A 2.45
A 3 15 3A 3.38
A 3 15 3A 3.30
A 1 20 1A 1.90
A 1 20 1A 1.83
A 2 20 2A 2.56

145
A 2 20 2A 2.67
A 3 20 3A 3.02
A 3 20 3A 3.08
A 1 25 1A 2.02
A 1 25 1A 1.99
A 2 25 2A 2.76
A 2 25 2A 2.85
A 3 25 3A 2.98
A 3 25 3A 2.92
A 1 30 1A 2.17
A 1 30 1A 2.08
A 2 30 2A 2.62
A 2 30 2A 2.69
A 3 30 3A 2.88
A 3 30 3A 2.84
B 1 0 1B 3.62
B 1 0 1B 3.71
B 2 0 2B 3.34
B 2 0 2B 4.00
B 3 0 3B 3.61
B 3 0 3B 3.73
B 1 5 1B 3.39
B 1 5 1B 3.38
B 2 5 2B 3.74
B 2 5 2B 3.76
B 3 5 3B 3.99
B 3 5 3B 4.01
B 1 10 1B 3.32
B 1 10 1B 3.30
B 2 10 2B 3.67
B 2 10 2B 3.60
B 3 10 3B 3.65
B 3 10 3B 3.68
B 1 15 1B 3.24
B 1 15 1B 3.30
B 2 15 2B 3.51
B 2 15 2B 3.52
B 3 15 3B 3.67
B 3 15 3B 3.51
B 1 20 1B 3.11
B 1 20 1B 3.14

146
B 2 20 2B 3.39
B 2 20 2B 3.38
B 3 20 3B 3.46
B 3 20 3B 3.38
B 1 25 1B 3.00
B 1 25 1B 2.93
B 2 25 2B 3.24
B 2 25 2B 3.36
B 3 25 3B 3.41
B 3 25 3B 3.46
B 1 30 1B 2.98
B 1 30 1B 2.79
B 2 30 2B 3.13
B 2 30 2B 3.26
B 3 30 3B 3.52
B 3 30 3B 3.45
C 1 0 1C 3.02
C 1 0 1C 3.00
C 2 0 2C 3.59
C 2 0 2C 3.52
C 3 0 3C 4.09
C 3 0 3C 4.06
C 1 5 1C 3.28
C 1 5 1C 3.28
C 2 5 2C 3.63
C 2 5 2C 3.69
C 3 5 3C 3.84
C 3 5 3C 3.79
C 1 10 1C 3.34
C 1 10 1C 3.28
C 2 10 2C 3.64
C 2 10 2C 3.62
C 3 10 3C 3.73
C 3 10 3C 3.67
C 1 15 1C 3.20
C 1 15 1C 3.16
C 2 15 2C 3.61
C 2 15 2C 3.59
C 3 15 3C 3.81
C 3 15 3C 3.76
C 1 20 1C 3.26

147
C 1 20 1C 3.23
C 2 20 2C 3.51
C 2 20 2C 3.45
C 3 20 3C 3.76
C 3 20 3C 3.74
C 1 25 1C 3.21
C 1 25 1C 3.23
C 2 25 2C 3.46
C 2 25 2C 3.48
C 3 25 3C 3.48
C 3 25 3C 3.49
C 1 30 1C 3.15
C 1 30 1C 3.21
C 2 30 2C 3.41
C 2 30 2C 3.46
C 3 30 3C 3.64
C 3 30 3C 3.60
D 1 0 1D 3.59
D 1 0 1D 3.38
D 2 0 2D 3.83
D 2 0 2D 3.68
D 3 0 3D 4.16
D 3 0 3D 4.05
D 1 5 1D 2.92
D 1 5 1D 2.90
D 2 5 2D 3.24
D 2 5 2D 3.20
D 3 5 3D 3.63
D 3 5 3D 3.67
D 1 10 1D 3.05
D 1 10 1D 2.96
D 2 10 2D 3.40
D 2 10 2D 3.43
D 3 10 3D 3.61
D 3 10 3D 3.57
D 1 15 1D 3.02
D 1 15 1D 2.96
D 2 15 2D 3.11
D 2 15 2D 3.01
D 3 15 3D 3.30
D 3 15 3D 3.38

148
D 1 20 1D 2.63
D 1 20 1D 2.76
D 2 20 2D 3.05
D 2 20 2D 3.03
D 3 20 3D 3.34
D 3 20 3D 3.34
D 1 25 1D 2.32
D 1 25 1D 2.51
D 2 25 2D 3.04
D 2 25 2D 3.16
D 3 25 3D 3.15
D 3 25 3D 3.27
D 1 30 1D 2.56
D 1 30 1D 2.49
D 2 30 2D 2.87
D 2 30 2D 2.78
D 3 30 3D 3.23
D 3 30 3D 2.99
aTreatment: A = low salt, low pH; B = low salt, high pH; C = standard salt, high pH; D =
standard salt, low pH. Treatment and control cheeses were aged for 10 wk before the
inoculation study. b
Block = Replicate within the research study. c Subject = Replicate within a block
Table E6. Type 3 tests of fixed effects (ANOVA) for Listeria monocytogenes counts in
different experimental treatments of Cheddar cheese during storage at 21 °C for up to 30
d.
Effect Num df Den df F Value P-value
Treatment 3 8 3.22 0.0826
Day 6 48 28.06 <.0001
Treatment*Day 18 48 4.33 <.0001

149
APPENDIX F
STATISTICS FOR CHAPTER 6
Table F1. Raw data count of Salmonella serovars in different experimental treatments of
Cheddar cheese during storage at 4 °C for up to 90 d.
Treatmenta Block
b Day Average
c log CFU/g
A 1 0 4.29
A 2 0 4.20
A 3 0 4.35
A 1 15 3.32
A 2 15 3.27
A 3 15 3.41
A 1 30 2.06
A 2 30 2.10
A 3 30 2.28
A 1 45 1.86
A 2 45 1.41
A 3 45 0.70
A 1 60 1.57
A 2 60 0.30
A 3 60 0.00
A 1 75 1.78
A 2 75 1.11
A 3 75 0.00
A 1 90 1.60
A 2 90 0.90
A 3 90 0.48
B 1 0 4.26
B 2 0 4.19
B 3 0 4.10
B 1 15 2.87
B 2 15 2.63
B 3 15 2.53
B 1 30 2.10
B 2 30 1.93
B 3 30 2.06
B 1 45 1.88
B 2 45 1.77
B 3 45 1.88
B 1 60 1.78
B 2 60 1.52
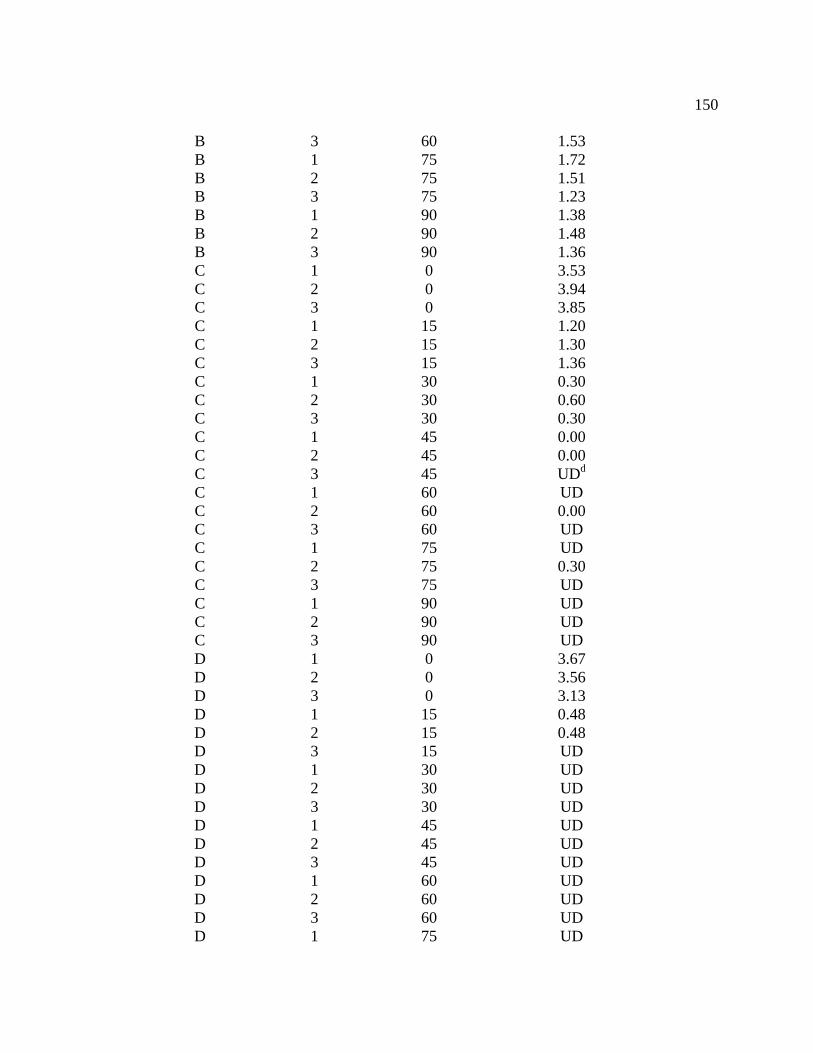
150
B 3 60 1.53
B 1 75 1.72
B 2 75 1.51
B 3 75 1.23
B 1 90 1.38
B 2 90 1.48
B 3 90 1.36
C 1 0 3.53
C 2 0 3.94
C 3 0 3.85
C 1 15 1.20
C 2 15 1.30
C 3 15 1.36
C 1 30 0.30
C 2 30 0.60
C 3 30 0.30
C 1 45 0.00
C 2 45 0.00
C 3 45 UDd
C 1 60 UD
C 2 60 0.00
C 3 60 UD
C 1 75 UD
C 2 75 0.30
C 3 75 UD
C 1 90 UD
C 2 90 UD
C 3 90 UD
D 1 0 3.67
D 2 0 3.56
D 3 0 3.13
D 1 15 0.48
D 2 15 0.48
D 3 15 UD
D 1 30 UD
D 2 30 UD
D 3 30 UD
D 1 45 UD
D 2 45 UD
D 3 45 UD
D 1 60 UD
D 2 60 UD
D 3 60 UD
D 1 75 UD

151
aTreatment: A = low salt, low pH; B = low salt, high pH; C = standard salt, high pH; D =
standard salt, low pH. Treatment and control cheeses were aged for 10 wk before the
inoculation study. b
Block = Replicate of the experiment. cAverage = Average of two replicates within a block.
dUD = undetectable (< 1CFU/g).
Table F2. Type 3 tests of fixed effects (ANOVA) for Salmonella serovars counts in
different experimental treatments of Cheddar cheese during storage at 4 °C for up to 90 d.
Effect Num df Den df F Value P-value
Treatment 3 8 57.75 <.0001
Day 6 8 2095.74 <.0001
Treatment*Day 18 8 65.16 <.0001
Table F3. Raw data count of Salmonella serovars in different experimental treatments of
Cheddar cheese during storage at 10 °C for up to 90 d.
D 2 75 UD
D 3 75 UD
D 1 90 UD
D 2 90 UD
D 3 90 UD
Treatmenta Block
b Day Average
c log CFU/g
A 1 0 4.29
A 2 0 4.20
A 3 0 4.35
A 1 15 3.19
A 2 15 3.24
A 3 15 3.08
A 1 30 2.33
A 2 30 2.00
A 3 30 1.72
A 1 45 1.67
A 2 45 1.49
A 3 45 1.08
A 1 60 1.56
A 2 60 0.95
A 3 60 0.48

152
A 1 75 1.23
A 2 75 0.85
A 3 75 0.30
A 1 90 1.38
A 2 90 0.95
A 3 90 0.00
B 1 0 4.26
B 2 0 4.19
B 3 0 4.10
B 1 15 2.92
B 2 15 2.61
B 3 15 2.57
B 1 30 2.08
B 2 30 2.00
B 3 30 1.79
B 1 45 1.65
B 2 45 1.58
B 3 45 1.58
B 1 60 0.95
B 2 60 1.00
B 3 60 1.00
B 1 75 0.30
B 2 75 0.48
B 3 75 0.48
B 1 90 0.30
B 2 90 0.48
B 3 90 0.00
C 1 0 3.53
C 2 0 3.94
C 3 0 3.85
C 1 15 1.53
C 2 15 1.18
C 3 15 1.60
C 1 30 0.60
C 2 30 0.48
C 3 30 0.78
C 1 45 UDd
C 2 45 UD
C 3 45 0.00
C 1 60 0.00
C 2 60 0.30
C 3 60 UD

153
aTreatment: A = low salt, low pH; B = low salt, high pH; C = standard salt, high pH; D =
standard salt, low pH. Treatment and control cheeses were aged for 10 wk before the
inoculation study. b
Block = Replicate of the experiment. cAverage = Average of two replicates within a block.
dUD = undetectable (< 1CFU/g).
C 1 75 UD
C 2 75 UD
C 3 75 0.00
C 1 90 UD
C 2 90 UD
C 3 90 UD
D 1 0 3.67
D 2 0 3.56
D 3 0 3.13
D 1 15 0.30
D 2 15 0.48
D 3 15 0.48
D 1 30 UD
D 2 30 0.00
D 3 30 UD
D 1 45 UD
D 2 45 UD
D 3 45 UD
D 1 60 UD
D 2 60 UD
D 3 60 UD
D 1 75 0.00
D 2 75 UD
D 3 75 UD
D 1 90 UD
D 2 90 UD
D 3 90 UD

154
Table F4. Type 3 tests of fixed effects (ANOVA) for Salmonella serovars counts in
different experimental treatments of Cheddar cheese during storage at 10 °C for up to 90
d.
Effect Num df Den df F Value P-value
Treatment 3 8 53.77 <.0001
Day 6 48 469.72 <.0001
Treatment*Day 18 48 12.82 <.0001
Table F5. Raw data count of Salmonella serovars in different experimental treatments of
Cheddar cheese during storage at 21 °C for up to 30 d.
Treatmenta Block
b Day Average
c log CFU/g
A 1 0 4.29
A 2 0 4.20
A 3 0 4.35
A 1 5 3.67
A 2 5 3.55
A 3 5 3.54
A 1 10 2.27
A 2 10 2.48
A 3 10 2.20
A 1 15 2.31
A 2 15 2.09
A 3 15 2.19
A 1 20 1.36
A 2 20 1.20
A 3 20 1.41
A 1 25 1.51
A 2 25 1.45
A 3 25 1.08
A 1 30 1.38
A 2 30 1.08
A 3 30 0.78
B 1 0 4.26
B 2 0 4.19
B 3 0 4.10
B 1 5 3.89
B 2 5 3.78
B 3 5 3.80
B 1 10 2.88
B 2 10 2.48
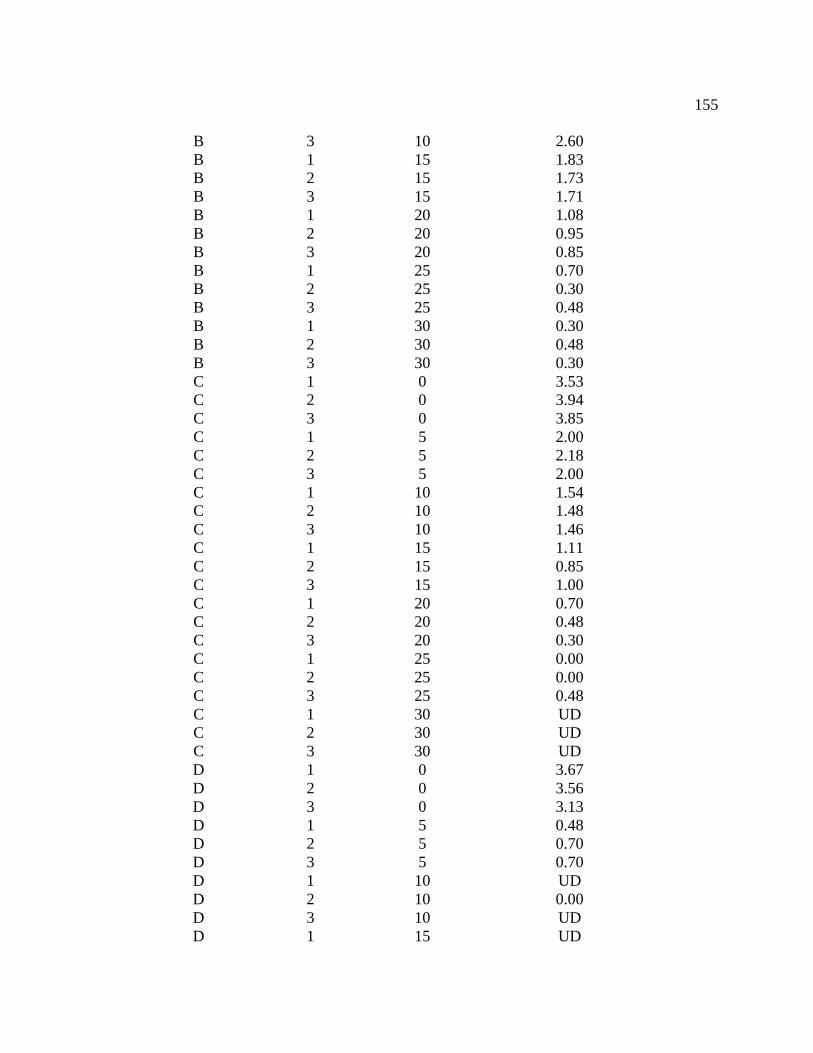
155
B 3 10 2.60
B 1 15 1.83
B 2 15 1.73
B 3 15 1.71
B 1 20 1.08
B 2 20 0.95
B 3 20 0.85
B 1 25 0.70
B 2 25 0.30
B 3 25 0.48
B 1 30 0.30
B 2 30 0.48
B 3 30 0.30
C 1 0 3.53
C 2 0 3.94
C 3 0 3.85
C 1 5 2.00
C 2 5 2.18
C 3 5 2.00
C 1 10 1.54
C 2 10 1.48
C 3 10 1.46
C 1 15 1.11
C 2 15 0.85
C 3 15 1.00
C 1 20 0.70
C 2 20 0.48
C 3 20 0.30
C 1 25 0.00
C 2 25 0.00
C 3 25 0.48
C 1 30 UD
C 2 30 UD
C 3 30 UD
D 1 0 3.67
D 2 0 3.56
D 3 0 3.13
D 1 5 0.48
D 2 5 0.70
D 3 5 0.70
D 1 10 UD
D 2 10 0.00
D 3 10 UD
D 1 15 UD

156
D 2 15 UD
D 3 15 0.00
D 1 20 UD
D 2 20 UD
D 3 20 UD
D 1 25 UD
D 2 25 UD
D 3 25 UD
D 1 30 UD
D 2 30 UD
D 3 30 UD
aTreatment: A = low salt, low pH; B = low salt, high pH; C = standard salt, high pH; D =
standard salt, low pH. Treatment and control cheeses were aged for 10 wk before the
inoculation study. b
Block = Replicate of the experiment. cAverage = Average of two replicates within a block.
dUD = undetectable (< 1CFU/g).
Table F6. Type 3 tests of fixed effects (ANOVA) for Salmonella serovars counts in
different experimental treatments of Cheddar cheese during storage at 21 °C for up to 30
d.
Effect Num df Den df F Value P-value
Treatment 3 8 327.68 <.0001
Day 6 8 5619.11 <.0001
Treatment*Day 18 8 100.35 <.0001

157
APPENDIX G
REPRINT PERMISSIONS
REPRINT PERMISSIONS FOR CHAPTER 3, 5
Dear Dr. Subash Shrestha,
Thank you for your e-mail, and apologies for the delay that you have experienced.
Please accept this as confirmation that, as part of your author rights, you are allowed to
reproduce your article (in full or part) in your thesis without the need to obtain specific
permission from Elsevier.
For more information on the rights you retain as a journal author, please see
http://www.elsevier.com/wps/find/authorsview.authors/copyright##rights.
If you have any queries about this, please feel free to contact me.
Kind regards,
Kayleigh
INTRODUCTION
1. The publisher for this copyrighted material is Elsevier. By clicking "accept" in
connection with completing this licensing transaction, you agree that the following terms
and conditions apply to this transaction (along with the Billing and Payment terms and
conditions established by Copyright Clearance Center, Inc. ("CCC"), at the time that you
opened your Rightslink account and that are available at any time at
http://myaccount.copyright.com).
GENERAL TERMS
2. Elsevier hereby grants you permission to reproduce the aforementioned material
subject to the terms and conditions indicated.
3. Acknowledgement: If any part of the material to be used (for example, figures) has
appeared in our publication with credit or acknowledgement to another source,
permission must also be sought from that source. If such permission is not obtained then
that material may not be included in your publication/copies. Suitable acknowledgement

158
to the source must be made, either as a footnote or in a reference list at the end of your
publication, as follows:
―Reprinted from Publication title, Vol /edition number, Author(s), Title of article / title of
chapter, Pages No., Copyright (Year), with permission from Elsevier [OR APPLICABLE
SOCIETY COPYRIGHT OWNER].‖ Also Lancet special credit - ―Reprinted from The
Lancet, Vol. number, Author(s), Title of article, Pages No., Copyright (Year), with
permission from Elsevier.‖
4. Reproduction of this material is confined to the purpose and/or media for which
permission is hereby given.
5. Altering/Modifying Material: Not Permitted. However figures and illustrations may be
altered/adapted minimally to serve your work. Any other abbreviations, additions,
deletions and/or any other alterations shall be made only with prior written authorization
of Elsevier Ltd. (Please contact Elsevier at [email protected])
6. If the permission fee for the requested use of our material is waived in this instance,
please be advised that your future requests for Elsevier materials may attract a fee.
7. Reservation of Rights: Publisher reserves all rights not specifically granted in the
combination of (i) the license details provided by you and accepted in the course of this
licensing transaction, (ii) these terms and conditions and (iii) CCC's Billing and Payment
terms and conditions.
8. License Contingent Upon Payment: While you may exercise the rights licensed
immediately upon issuance of the license at the end of the licensing process for the
transaction, provided that you have disclosed complete and accurate details of your
proposed use, no license is finally effective unless and until full payment is received from
you (either by publisher or by CCC) as provided in CCC's Billing and Payment terms and
conditions. If full payment is not received on a timely basis, then any license
preliminarily granted shall be deemed automatically revoked and shall be void as if never
granted. Further, in the event that you breach any of these terms and conditions or any of
CCC's Billing and Payment terms and conditions, the license is automatically revoked
and shall be void as if never granted. Use of materials as described in a revoked license,
as well as any use of the materials beyond the scope of an unrevoked license, may
constitute copyright infringement and publisher reserves the right to take any and all
action to protect its copyright in the materials.
9. Warranties: Publisher makes no representations or warranties with respect to the
licensed material.
10. Indemnity: You hereby indemnify and agree to hold harmless publisher and CCC,
and their respective officers, directors, employees and agents, from and against any and

159
all claims arising out of your use of the licensed material other than as specifically
authorized pursuant to this license.
11. No Transfer of License: This license is personal to you and may not be sublicensed,
assigned, or transferred by you to any other person without publisher's written
permission.
12. No Amendment Except in Writing: This license may not be amended except in a
writing signed by both parties (or, in the case of publisher, by CCC on publisher's
behalf).
13. Objection to Contrary Terms: Publisher hereby objects to any terms contained in any
purchase order, acknowledgment, check endorsement or other writing prepared by you,
which terms are inconsistent with these terms and conditions or CCC's Billing and
Payment terms and conditions. These terms and conditions, together with CCC's Billing
and Payment terms and conditions (which are incorporated herein), comprise the entire
agreement between you and publisher (and CCC) concerning this licensing transaction.
In the event of any conflict between your obligations established by these terms and
conditions and those established by CCC's Billing and Payment terms and conditions,
these terms and conditions shall control.
14. Revocation: Elsevier or Copyright Clearance Center may deny the permissions
described in this License at their sole discretion, for any reason or no reason, with a full
refund payable to you. Notice of such denial will be made using the contact information
provided by you. Failure to receive such notice will not alter or invalidate the denial. In
no event will Elsevier or Copyright Clearance Center be responsible or liable for any
costs, expenses or damage incurred by you as a result of a denial of your permission
request, other than a refund of the amount(s) paid by you to Elsevier and/or Copyright
Clearance Center for denied permissions.

160
REPRINT PERMISSIONS FOR CHAPTER 4, 6
Dear Subash Shrestha,
Thank you for your email request.
Permission is granted for you to use the material requested for your thesis/dissertation
subject to the usual acknowledgements and on the understanding that you will reapply for
permission if you wish to distribute or publish your thesis/dissertation commercially. I
can confirm that you are permitted to modify your work, providing that you include a line
in the acknowledgement stating that the material has been modified from its original
published form.
Permission is granted solely for use in conjunction with the thesis, and the article may not
be posted online separately.
Any third party material is expressly excluded from this permission. If any material
appears within the article with credit to another source, authorisation from that source
must be obtained.
Best Wishes
Verity Butler
Permissions Assistant
John Wiley & Sons Ltd.
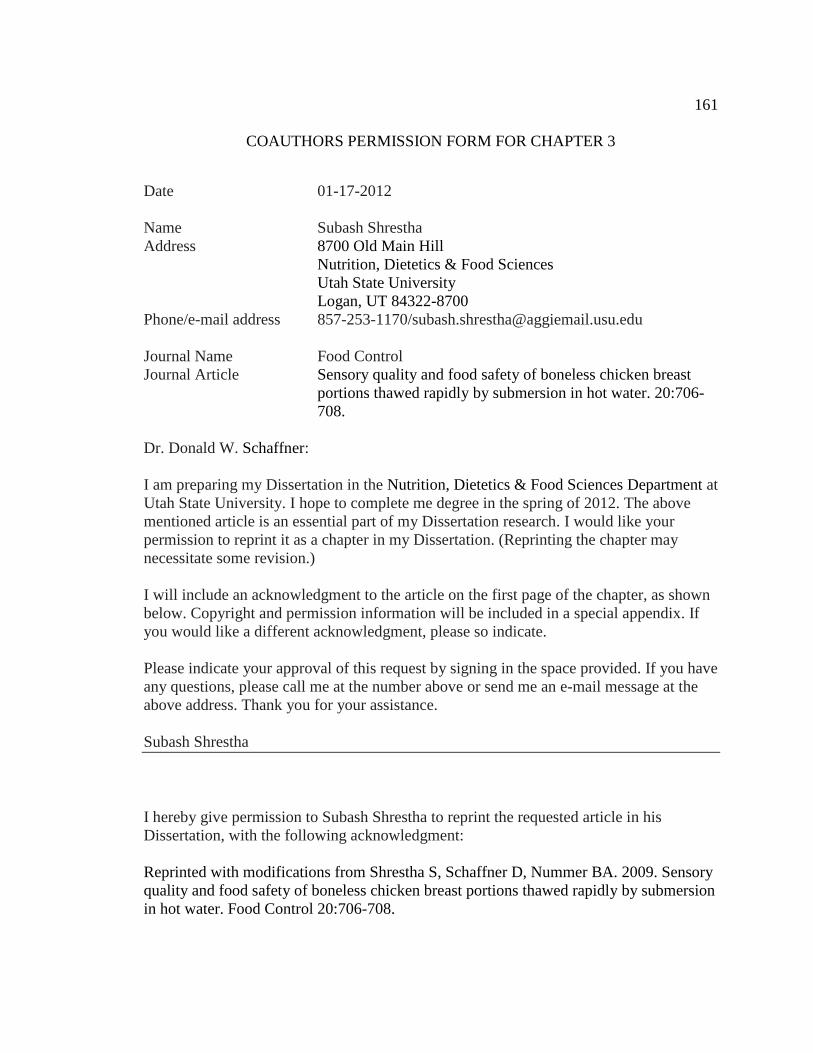
161
COAUTHORS PERMISSION FORM FOR CHAPTER 3
Date 01-17-2012
Name Subash Shrestha
Address 8700 Old Main Hill
Nutrition, Dietetics & Food Sciences
Utah State University
Logan, UT 84322-8700
Phone/e-mail address 857-253-1170/[email protected]
Journal Name Food Control
Journal Article Sensory quality and food safety of boneless chicken breast
portions thawed rapidly by submersion in hot water. 20:706-
708.
Dr. Donald W. Schaffner:
I am preparing my Dissertation in the Nutrition, Dietetics & Food Sciences Department at
Utah State University. I hope to complete me degree in the spring of 2012. The above
mentioned article is an essential part of my Dissertation research. I would like your
permission to reprint it as a chapter in my Dissertation. (Reprinting the chapter may
necessitate some revision.)
I will include an acknowledgment to the article on the first page of the chapter, as shown
below. Copyright and permission information will be included in a special appendix. If
you would like a different acknowledgment, please so indicate.
Please indicate your approval of this request by signing in the space provided. If you have
any questions, please call me at the number above or send me an e-mail message at the
above address. Thank you for your assistance.
Subash Shrestha
I hereby give permission to Subash Shrestha to reprint the requested article in his
Dissertation, with the following acknowledgment:
Reprinted with modifications from Shrestha S, Schaffner D, Nummer BA. 2009. Sensory
quality and food safety of boneless chicken breast portions thawed rapidly by submersion
in hot water. Food Control 20:706-708.

162
COAUTHORS PERMISSION FORM FOR CHAPTER 5 AND 6
Date 01-17-2012
Name Subash Shrestha
Address 8700 Old Main Hill
Nutrition, Dietetics & Food Sciences
Utah State University
Logan, UT 84322-8700
Phone/e-mail address 857-253-1170/[email protected]
Journal Name Journal of Dairy Science / Journal of Food Science
Journal Article 1) Survival of Listeria monocytogenes introduced as post-aging
contaminant during storage of low-salt Cheddar cheese at 4, 10, and 21 ⁰C.
J Dairy Sci 94:4329-4335.
2) Survival of Salmonella serovars introduced as post-aging contaminant
during storage of low-salt Cheddar cheese at 4, 10, and 21 ⁰C. J Food Sci
76: M616–M621.
Dr. Donald McMahon:
I am preparing my Dissertation in the Nutrition, Dietetics & Food Sciences Department at Utah State
University. I hope to complete me degree in the spring of 2012. The above mentioned articles are the
essential part of my Dissertation research. I would like your permission to reprint them as chapters in my
Dissertation. (Reprinting the chapter may necessitate some revision.)
I will include an acknowledgment to the articles on the first page of the chapter, as shown below. Copyright
and permission information will be included in a special appendix. If you would like a different
acknowledgment, please so indicate.
Please indicate your approval of this request by signing in the space provided. If you have any questions,
please call me at the number above or send me an e-mail message at the above address. Thank you for your
assistance.
Subash Shrestha
I hereby give permission to Subash Shrestha to reprint the requested articles in his Dissertation, with the
following acknowledgment:
1) Reprinted with modifications from Shrestha S, Grieder JA, McMahon DJ, Nummer BA. 2011. Survival
of Listeria monocytogenes introduced as post-aging contaminant during storage of low-salt Cheddar cheese
at 4, 10, and 21 ⁰C. J Dairy Sci 94:4329-4335.
2) Reprinted with modifications from Shrestha S, Grieder JA, McMahon DJ, Nummer BA. 2011. Survival
of Salmonella serovars introduced as post-aging contaminant during storage of low-salt Cheddar cheese at
4, 10, and 21 ⁰C. J Food Sci 76: M616–M621.

163
COAUTHORS PERMISSION FORM FOR CHAPTER 5 AND 6
Date 01-17-2012
Name Subash Shrestha
Address 8700 Old Main Hill
Nutrition, Dietetics & Food Sciences
Utah State University
Logan, UT 84322-8700
Phone/e-mail address 857-253-1170/[email protected]
Journal Name Journal of Dairy Science / Journal of Food Science
Journal Article 1) Survival of Listeria monocytogenes introduced as post-aging
contaminant during storage of low-salt Cheddar cheese at 4, 10, and 21 ⁰C.
J Dairy Sci 94:4329-4335.
2) Survival of Salmonella serovars introduced as post-aging contaminant
during storage of low-salt Cheddar cheese at 4, 10, and 21 ⁰C. J Food Sci
76: M616–M621.
Dear James Grieder:
I am preparing my Dissertation in the Nutrition, Dietetics & Food Sciences Department at Utah State
University. I hope to complete me degree in the spring of 2012. The above mentioned articles are the
essential part of my Dissertation research. I would like your permission to reprint them as chapters in my
Dissertation. (Reprinting the chapter may necessitate some revision.)
I will include an acknowledgment to the articles on the first page of the chapter, as shown below. Copyright
and permission information will be included in a special appendix. If you would like a different
acknowledgment, please so indicate.
Please indicate your approval of this request by signing in the space provided. If you have any questions,
please call me at the number above or send me an e-mail message at the above address. Thank you for your
assistance.
Subash Shrestha
I hereby give permission to Subash Shrestha to reprint the requested articles in his Dissertation, with the
following acknowledgment:
1) Reprinted with modifications from Shrestha S, Grieder JA, McMahon DJ, Nummer BA. 2011. Survival
of Listeria monocytogenes introduced as post-aging contaminant during storage of low-salt Cheddar cheese
at 4, 10, and 21 ⁰C. J Dairy Sci 94:4329-4335.
2) Reprinted with modifications from Shrestha S, Grieder JA, McMahon DJ, Nummer BA. 2011. Survival
of Salmonella serovars introduced as post-aging contaminant during storage of low-salt Cheddar cheese at
4, 10, and 21 ⁰C. J Food Sci 76: M616–M621.

164
164
CURRICULUM VITAE
SUBASH SHRESTHA
Education:
Ph.D. candidate in Food Science, Utah State University, UT. (GPA 3.94/4.00).
B. Tech. in Food Technology, 2001, Tribhuvan University, Nepal.
Work Experience:
1) Extension Associate
Utah State University Cooperative Extension. Job includes (June 2007 – Present):
a) Assisted over 30 ―small /start-up‖ food companies in Utah to develop quality and
safe products. Advised in formulations and evaluated safety of products like
nutrition bar, sauce, hummus, salsa, preserve, pickle, pie, muffin, cake, trial mix,
and so forth.
Estimated or helped to estimate product shelf life.
Written/assisted in writing ‗Process Authority‘ letter for the food processors.
Generated Nutrition Facts using ESHA genesis.
b) Assisted in ‗Low Acid Food Canning‘ workshops held at several counties in Utah.
2) Quality Assurance/Research & Development Manager
Himalayan Snax and Noodles Pvt Ltd, Nepal. Job included (2001-2006):
a) Implemented ISO 9001:2000; Developed HACCP plan.
b) Analyzed/supervised raw material, in-process and finished product quality; and
plant sanitation.
c) Supplier Audit / Supplier Development.
d) Supervision and Training of laboratory staffs and process operators.
e) New Product Development, Sensory Evaluation and Shelf Life study.
f) Trouble shooting customer complaints.
g) Identify and test opportunities for cost reduction and product improvement.
Professional Trainings & Certifications:
1) Better Process Control, GMP, HACCP, ISO 9001, ISO 14001 and SQF 2000.
2) ISO 9001:2000 Lead Auditor.
3) Internship at Pepsi Cola Nepal, 1999.

165
Research Works/Publications:
1) Sensory quality and food safety of boneless chicken breast portions thawed
rapidly by submersion in hot water.
S. Shrestha, D. Schaffner, and B. A. Nummer. Food Control 20(8):706-708.
2) Process optimization and consumer acceptability of salted ground beef patties
cooked and held hot in flavored marinade.
S. Shrestha, D. Cornforth, and B. A. Nummer. J Food Sci 75(7):607-612;
Also published in News section of IFT Food Technology Magazine (Oct 2010).
3) Survival of Listeria monocytogenes introduced as a post-aging contaminant
during storage of low-salt Cheddar cheese at 4, 10 and 21 °C.
S. Shrestha, J. A. Grieder, D. J. McMahon, and B. A. Nummer. J Dairy Sci
94(9):4329-4335.
4) Survival of Salmonella spp. introduced as a post-aging contaminant during
storage of low-salt Cheddar cheese at 4, 10 and 21 °C.
S. Shrestha, J. A. Grieder, D. J. McMahon, and B. A. Nummer. J Food Sci 76(9):
M616-M621.
5) Survival of Salmonella in a high-sugar, low-Aw, peanut-butter flavored candy
fondant.
B. A. Nummer, J. Smith, and S. Shrestha. Food Control (in press).
6) Survival of Salmonella spp. in inoculated chicken-flavor paste and powder stored
at 21 °C.
S. Shrestha, and B. A. Nummer (Manuscript in progress).
7) Use of K Levulinate enhancement solution to extend the beef steak shelf life.
Awards/Scholarships:
1) Utah State University (USU) College of Agriculture ―Outstanding Graduate
Researcher of the Year Award‖ 2011-12 nominee.
2) Won 2nd
prize ($5,000) at IMPA Product Development Competition, Idaho, Aug
2011.
Team of six developed “Saucearella” - mozzarella coextruded with fresh sauce.
3) ―American Association of Candy Technologist Scholarship‖ (2010-11) to develop
―Yogolate‖ - a healthier chocolate candy filled with ‗Yogurt cheese‘.
4) 1st & 2
nd prizes at Intermountain Graduate Research Symposium Presentations
(Nutrition and Food Science Section) held at USU on 2011 & 2010 respectively.

166
5) USU Gandhi Graduate Student Scholarship, 2010-11 and 2008-09.
6) Won 1st
prize ($10,000) at IMPA Product Development Competition, Idaho, Aug
2010.
Led a team of two to develop yogurt based mayonnaise substitute- ―Yogonnaise‖.
Patent pending for the product and process.
Presentations:
Oral Presentations:
1) Survival of Listeria monocytogenes and Salmonella spps. in Aged Low-Salt
Cheddar Cheese at 4, 10 and 21°C.
Western Dairy Center Annual Meeting, Logan, UT, May 10-11, 2011.
2) Yogolate- A healthier chocolate candy.
Institute of Food Technologist Bonneville Section, Salt Lake City, April 05, 2011.
3) Survival of Listeria monocytogenes, Introduced as a Post-Aging Contaminant
During Storage of Low-Salt Cheddar Cheese at 4, 10 and 21°C (1st Prize winner).
Intermountain Graduate Research Symposium, USU, Logan, March 31, 2011.
4) Yogonnaise (1st Prize winner).
Annual IMPA Conference, Sun Valley, ID, August 12-13, 2010.
5) Process Optimization and Consumer Acceptability of Salted Ground Beef
Patties Cooked and Held Hot in Flavored Marinade (2nd
Prize winner).
Intermountain Graduate Research Symposium, USU, Logan, March 31, 2010.
6) Home Food Preservation –Meat and Vegetable Canning
Tooele, Utah and Salt Lake County Offices, June 2010.
Poster presentation:
Effect of hot water cooking and holding on composition and yield of ground beef
patties.
Institute of Food Technologist Annual Meeting & Food Expo, Anaheim, CA,
June, 2009.
Leadership/ Professional Affiliations:
1) Senator, Graduate Student Senate (2010-11), Utah State University.
2) Institute of Food Technologist member since 2007.
3) USU Food Science Club member since 2007.