Embed Size (px)
Citation preview
Ensemble Methods for Object DetectionAngela Casado-Garcıa and Jonathan Heras1
Abstract. Object detection is one of the most important topicsof computer vision since it has many applications in several fields.Object detection models can be improved thanks to ensemble tech-niques; however, the process of ensembling object detectors posesseveral challenges. In this paper, we present an ensemble algorithmthat can be applied with any object detection model independently ofthe underlying algorithm. In addition, our ensemble method has beenemployed to define a test-time augmentation procedure for object de-tection models. Our ensemble algorithm and test-time augmentationprocedure can be used to apply data and model distillation for ob-ject detection, two semi-supervised learning techniques that reducethe number of necessary annotated images to train a model. We havetested our methods with several datasets and algorithms, obtainingup to a 10% improvement from the base models. All the methods areimplemented in an open-source library.
1 INTRODUCTION
Object detection is a fundamental task in computer vision since itis a key step in many real-world applications such as security [2],satellite imagery [12] or healthcare [35]. Over the last few years,a lot of progress has been made in this field thanks to the use ofdeep convolutional neural networks [51], and deep detectors haveachieved impressive results in large detection datasets such as PascalVOC [13] and MS COCO [28]. In addition, as in many other machinelearning tasks, the accuracy and robustness of object detectors can begreatly improved thanks to the application of ensemble methods [50];for instance, the mmAP in the COCO dataset was improved from50.6 to 52.5 in [33], or the mAP in the Pascal VOC dataset increasedby 3.2% in [37]. In fact, the leading methods on datasets like PascalVOC or MS COCO are based on the usage of ensembles [18, 20, 33].
However, the process of ensembling object detectors poses severalchallenges. First of all, some ensemble approaches for object detec-tion depend on the nature of the detection models — for example, theprocedure to ensemble models explained in [18] can only be appliedto models based on the FasterRCNN algorithm — therefore, thesemethods cannot be generalised and lack the diversity provided bythe ensemble of different algorithms. Related to the previous point,those ensemble methods require the modification of the underlyingalgorithms employed to construct the models, and this might be chal-lenging for many users. In order to deal with this problem, there areensemble methods that work with the output of the models [44, 48];but, again, they are focused on concrete models, and only work ifthe models are constructed using the same framework. Finally, itdoes not exist an open-source library that provides general ensem-ble methods for object detection, and this hinders their use.
1 Department of Mathematics and Computer Science, Universidad de La Ri-oja, Spain, email: {angela.casado,jonathan.heras}@unirioja.es
In this paper, we tackle the aforementioned challenges by design-ing a generic method that serves to ensemble the output produced bydetection algorithms; that is, bounding boxes which indicate the po-sition and category of the objects contained in an image. The methodcan be employed with any detection model independently of its un-derlying algorithm and the framework employed to construct it. Inparticular, the contributions of this work are the following:
• We present a general method for ensembling object detectors inde-pendently of the underlying algorithm; and, in addition, we deviseseveral voting strategies to carry out the ensembling process.
• As a by-product of our ensemble method, we define a test-timeaugmentation procedure that can be applied to boost the accuracyof object detection models. Moreover, we explain how to reducethe burden of annotating images in the context of object detectionusing two semi-supervised learning techniques, based on ensem-ble methods, known as model and data distillation.
• We conduct a comprehensive study of the impact of our ensemblemethod and the devised voting strategies, and show the benefits ofthis method as well as the advantages of using test-time augmen-tation and distillation methods.
• We implement our methods in the EnsembleObjectDetec-tion library, available at https://github.com/ancasag/ensembleObjectDetection. This open-source library canbe extended to work with any object detection model indepen-dently of the algorithm and framework employed to construct it.
The rest of the paper is organised as follows. In the next section,we provide the necessary background to understand the rest of thepaper. Subsequently, our approach to ensemble object detection algo-rithms, and the extension of such an approach for test-time augmen-tation, and data and model distillation are presented in Section 3. Inaddition, and also in Section 3, we present the main highlights of thelibrary that implements our methods. After that, an analysis of theimpact of our methods on different datasets is provided in Section 4.The paper ends with a section of conclusions and further work.
2 BACKGROUND
In this section, we briefly provide the necessary background and no-tation needed to understand the rest of the paper. We start by formallypresenting the task of object detection.
2.1 Object detection
Object detection is the task of determining the position and categoryof multiple objects in an image. Formally, an object detection modelcan be seen as a function that given an image I returns a list of detec-tions D = [d1, . . . , dN ] where each di is given by a triple [bi, ci, si]
that consists of a bounding box, bi, the corresponding category, ci,and the corresponding confidence score, si.
Currently, the most successful object detection models are basedon deep learning algorithms, and they can be split into two groups:one-stage and two-stage detectors. The former divide the image intoregions that are passed into a convolutional neural network to obtainthe list of detections — these algorithms include techniques such asSSD [30] or YOLO [38]. The two-stage object detectors employ re-gion proposal methods, based on features of the image, to obtain in-teresting regions, that are later classified to obtain the predictions —among these algorithms, we can find the R-CNN family of object de-tectors [39] or Feature Pyramid Network (FPN) [29]. Independentlyof the underlying algorithm, the accuracy of these detection modelscan be improved thanks to the application of ensemble methods.
2.2 Ensemble learning
Ensemble methods combine the predictions produced by multiplemodels to obtain a final output [50]. These methods have been suc-cessfully employed for improving accuracy in several machine learn-ing tasks, and object detection is not an exception. We can distinguishtwo kinds of ensembling techniques for object detection: those thatare based on the nature of the algorithms employed to construct thedetection models, and those that work with the output of the models.
In the case of ensemble methods based on the nature of the al-gorithms, different strategies have been mainly applied to two-stagedetectors. Some works have been focused on ensembling featuresfrom different sources before feeding them to the region proposalalgorithm [25, 33], others apply an ensemble in the classificationstage [17, 7], and others employ ensembles in both stages of the algo-rithm [18, 20, 24]. In the case of ensemble methods based on the out-put of the models, the common approach consists in using a primarymodel which predictions are adjusted with a secondary model. Thisprocedure has been applied in [48] by combining Fast-RCNN andFaster-RCNN models, in [37] by combining Fast-RCNN and YOLOmodels, and in [44] by using RetinaNet and Mask R-CNN mod-els. Another approach to combine the output of detection models isthe application of techniques to eliminate redundant bounding boxeslike Non-Maximum Suppression [19], Soft-NMS [4], NMW [52], fu-sion [49] or WBF [45]. However, these techniques do not take intoaccount the classes of the detected objects, or the number of modelsthat detected a particular object; and, therefore, if they are blindlyapplied, they tend to produce lots of false positives.
In our work, we propose a general method for ensembling the out-put of detection models using different voting strategies, see Sec-tion 3.1. The method is independent of the underlying algorithmsand frameworks, and allows us to easily combine a variety of multi-ple detection models. In addition, our method opens the door to applytechniques based on ensembles such as test-time augmentation.
2.3 Test-time augmentation
Data augmentation [42, 41] is a technique widely employed to traindeep learning models that consists in generating new training sam-ples from the original training dataset by applying transformationsthat do not alter the class of the data. There is a variant of data aug-mentation for the test dataset known as test-time augmentation [43].This technique creates random modifications of the test images, per-forms predictions on them, and, finally, returns an ensemble of thosepredictions.
Due to the cost of collecting data in the context of object detec-tion, data augmentation strategies such as random scaling [37] orcropping [30] are widely employed [54]. On the contrary, and dueto the lack of a general method to combine predictions of object de-tectors, test-time augmentation has been mainly applied in the con-text of image classification [43]. As far as we are aware, test-timeaugmentation has only been applied for object detectors in [49], andonly using colour transformations. This limitation is due to the factthat some transformations, like flips or rotations, change the posi-tion of the objects in the image and this issue must be taken intoaccount when combining the predictions. The method presented inSection 3.2 deals with this problem and allows us to apply test-timeaugmentation with any object detection model.
3 METHODSIn this section, we explain our ensemble algorithm for combining theoutput of object detection models. Such an algorithm can be particu-larised with different strategies that are also explained in this section.Moreover, we explain how our algorithm can be applied for test-timeaugmentation, and data and model distillation. This section ends byhighlighting the main features of the library where we have imple-mented our methods.
3.1 Ensemble of object detectorsWe start by explaining the procedure that we have designed to com-bine object detections obtained from several sources. The input ofour ensemble algorithm is a list LD = [D1, . . . , Dm] where eachDi, with i ∈ {1 . . .m}, is a list of detections for a given image Ias explained in Section 2.1. Usually, each Di comes from the pre-dictions of a detection model; but, as we will see in Section 3.2, thisis not always the case. In general, each list Di is a list of detectionsproduced using a particular method Mi for a given image.
Given the list LD, our ensemble algorithm consists of four steps.First of all, the list LD is flattened in a list F = [d1, . . . , dk], sincethe provenance of each detection di is not relevant for the ensemblingalgorithm. Subsequently, the elements di of F are grouped togetherbased on the overlapping of their bounding boxes and their classes.In order to determinate the overlap of bounding boxes, the IoU met-ric [40] is employed. Considering two bounding boxes b1 and b2, theIoU formula for finding the overlapped region between them is givenby
IoU(b1, b2) =area(b1 ∩ b2)
area(b1 ∪ b2)
This measure is employed to group the elements of F produc-ing as a result a list G = [DG
1 , . . . , DGm] where each DG
i is a listof detections such that for all d(= [b, c, s]), d(= [b, c, s]) ∈ DG
i ,IoU(b, b) > 0.5, and c = c. At this point, each DG
i ∈ G is fo-cused on a particular region of the image, and the size of DG
i willdetermine whether our algorithm considers whether such a regionactually contains an object. Namely, this decision can be taken usingthree different voting strategies:
• Affirmative. In this strategy, all the lists DGi are kept. This means
that whenever one of the methods that produce the initial predic-tions says that a region contains an object, such a detection is con-sidered as valid.
• Consensus. In this case, only the lists DGi which length is greater
than m/2 (where m is the size of the initial list LD) are kept.
This means that the majority of the initial methods must agree toconsider that a region contains an object. The consensus strategyis analogous to the majority voting strategy commonly applied inensemble methods for images classification [3].
• Unanimous. In the last strategy, only the lists DGi which length is
equal to m are kept. This means that all the methods must agreeto consider that a region contains an object.
After applying one of the aforementioned strategies, we end up
with a list G′ ⊆ G. Since each list DG′
k ∈ G′ might contain sev-eral detections for the same region, the last step of our algorithm isthe application of the non-maximum suppression (NMs) algorithm to
each DG′
k . The final result is a list D = [d1, . . . , dn] with the ensem-ble detections. Our ensemble algorithm is summarised graphically inFigure 1.
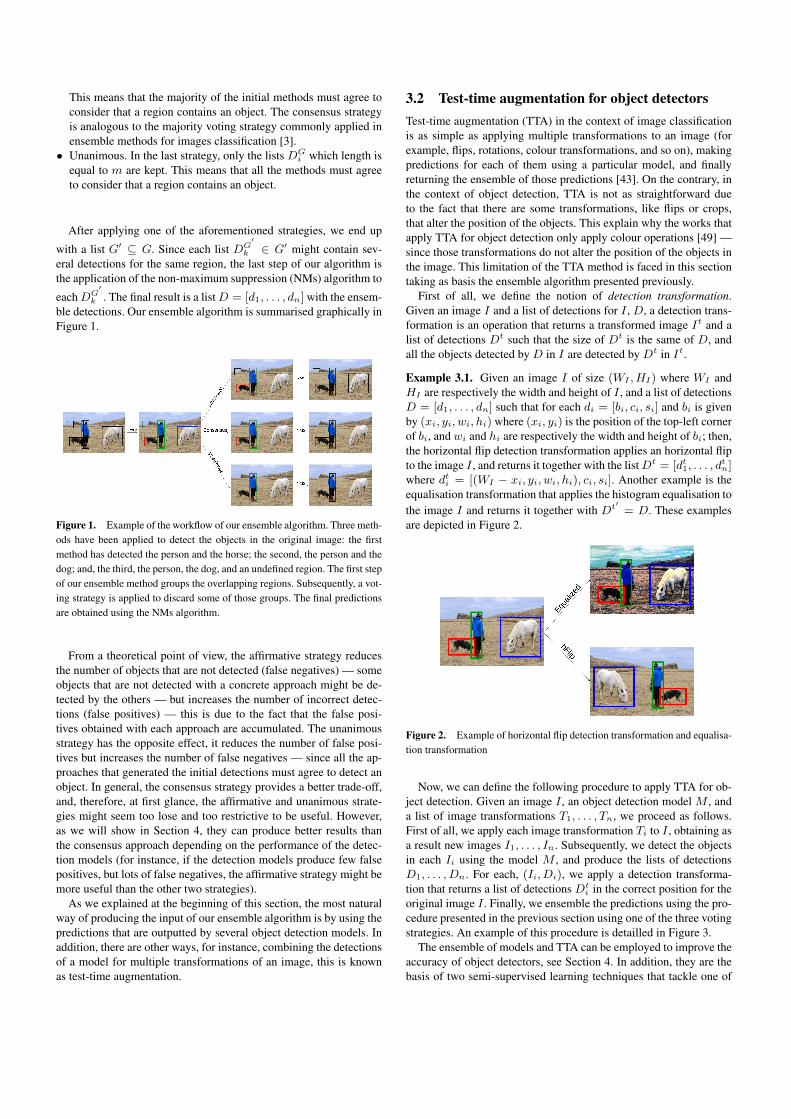
Figure 1. Example of the workflow of our ensemble algorithm. Three meth-ods have been applied to detect the objects in the original image: the firstmethod has detected the person and the horse; the second, the person and thedog; and, the third, the person, the dog, and an undefined region. The first stepof our ensemble method groups the overlapping regions. Subsequently, a vot-ing strategy is applied to discard some of those groups. The final predictionsare obtained using the NMs algorithm.
From a theoretical point of view, the affirmative strategy reducesthe number of objects that are not detected (false negatives) — someobjects that are not detected with a concrete approach might be de-tected by the others — but increases the number of incorrect detec-tions (false positives) — this is due to the fact that the false posi-tives obtained with each approach are accumulated. The unanimousstrategy has the opposite effect, it reduces the number of false posi-tives but increases the number of false negatives — since all the ap-proaches that generated the initial detections must agree to detect anobject. In general, the consensus strategy provides a better trade-off,and, therefore, at first glance, the affirmative and unanimous strate-gies might seem too lose and too restrictive to be useful. However,as we will show in Section 4, they can produce better results thanthe consensus approach depending on the performance of the detec-tion models (for instance, if the detection models produce few falsepositives, but lots of false negatives, the affirmative strategy might bemore useful than the other two strategies).
As we explained at the beginning of this section, the most naturalway of producing the input of our ensemble algorithm is by using thepredictions that are outputted by several object detection models. Inaddition, there are other ways, for instance, combining the detectionsof a model for multiple transformations of an image, this is knownas test-time augmentation.
3.2 Test-time augmentation for object detectorsTest-time augmentation (TTA) in the context of image classificationis as simple as applying multiple transformations to an image (forexample, flips, rotations, colour transformations, and so on), makingpredictions for each of them using a particular model, and finallyreturning the ensemble of those predictions [43]. On the contrary, inthe context of object detection, TTA is not as straightforward dueto the fact that there are some transformations, like flips or crops,that alter the position of the objects. This explain why the works thatapply TTA for object detection only apply colour operations [49] —since those transformations do not alter the position of the objects inthe image. This limitation of the TTA method is faced in this sectiontaking as basis the ensemble algorithm presented previously.
First of all, we define the notion of detection transformation.Given an image I and a list of detections for I , D, a detection trans-formation is an operation that returns a transformed image It and alist of detections Dt such that the size of Dt is the same of D, andall the objects detected by D in I are detected by Dt in It.
Example 3.1. Given an image I of size (WI , HI) where WI andHI are respectively the width and height of I , and a list of detectionsD = [d1, . . . , dn] such that for each di = [bi, ci, si] and bi is givenby (xi, yi, wi, hi) where (xi, yi) is the position of the top-left cornerof bi, and wi and hi are respectively the width and height of bi; then,the horizontal flip detection transformation applies an horizontal flipto the image I , and returns it together with the list Dt = [dt1, . . . , d
tn]
where dti = [(WI − xi, yi, wi, hi), ci, si]. Another example is theequalisation transformation that applies the histogram equalisation tothe image I and returns it together with Dt′ = D. These examplesare depicted in Figure 2.
Figure 2. Example of horizontal flip detection transformation and equalisa-tion transformation
Now, we can define the following procedure to apply TTA for ob-ject detection. Given an image I , an object detection model M , anda list of image transformations T1, . . . , Tn, we proceed as follows.First of all, we apply each image transformation Ti to I , obtaining asa result new images I1, . . . , In. Subsequently, we detect the objectsin each Ii using the model M , and produce the lists of detectionsD1, . . . , Dn. For each, (Ii, Di), we apply a detection transforma-tion that returns a list of detections Dt
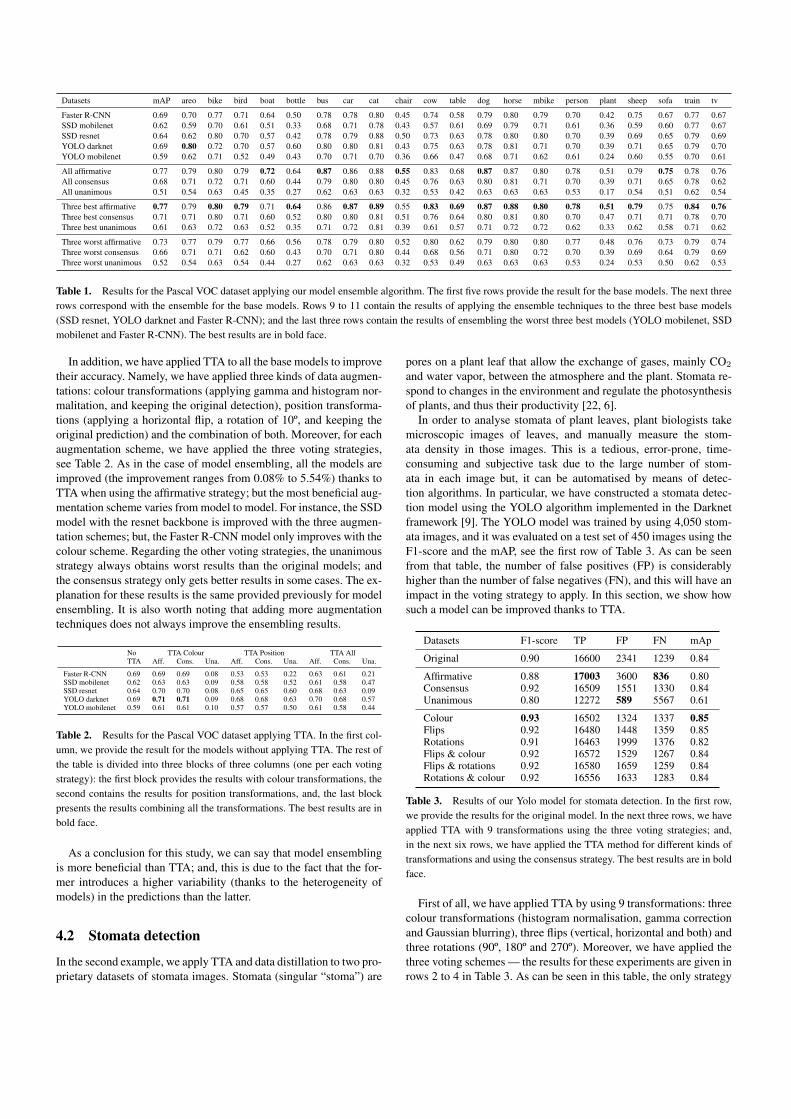
i in the correct position for theoriginal image I . Finally, we ensemble the predictions using the pro-cedure presented in the previous section using one of the three votingstrategies. An example of this procedure is detailled in Figure 3.
The ensemble of models and TTA can be employed to improve theaccuracy of object detectors, see Section 4. In addition, they are thebasis of two semi-supervised learning techniques that tackle one of
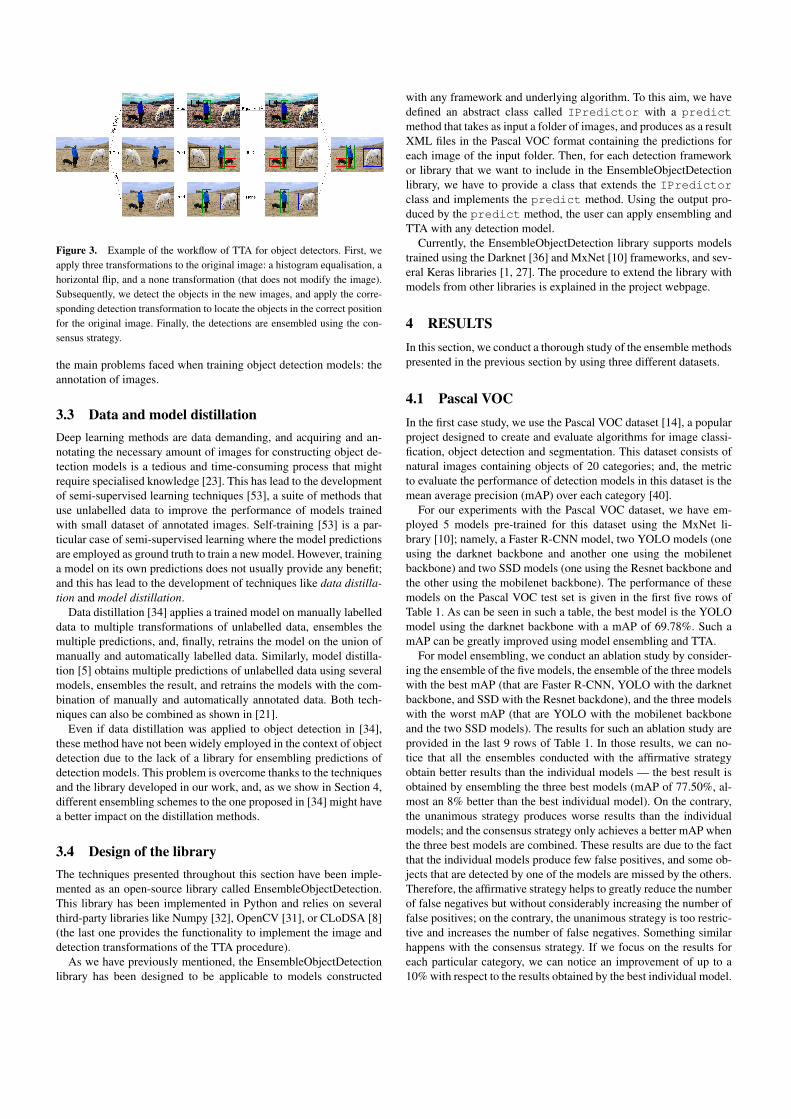
Figure 3. Example of the workflow of TTA for object detectors. First, weapply three transformations to the original image: a histogram equalisation, ahorizontal flip, and a none transformation (that does not modify the image).Subsequently, we detect the objects in the new images, and apply the corre-sponding detection transformation to locate the objects in the correct positionfor the original image. Finally, the detections are ensembled using the con-sensus strategy.
the main problems faced when training object detection models: theannotation of images.
3.3 Data and model distillationDeep learning methods are data demanding, and acquiring and an-notating the necessary amount of images for constructing object de-tection models is a tedious and time-consuming process that mightrequire specialised knowledge [23]. This has lead to the developmentof semi-supervised learning techniques [53], a suite of methods thatuse unlabelled data to improve the performance of models trainedwith small dataset of annotated images. Self-training [53] is a par-ticular case of semi-supervised learning where the model predictionsare employed as ground truth to train a new model. However, traininga model on its own predictions does not usually provide any benefit;and this has lead to the development of techniques like data distilla-tion and model distillation.
Data distillation [34] applies a trained model on manually labelleddata to multiple transformations of unlabelled data, ensembles themultiple predictions, and, finally, retrains the model on the union ofmanually and automatically labelled data. Similarly, model distilla-tion [5] obtains multiple predictions of unlabelled data using severalmodels, ensembles the result, and retrains the models with the com-bination of manually and automatically annotated data. Both tech-niques can also be combined as shown in [21].
Even if data distillation was applied to object detection in [34],these method have not been widely employed in the context of objectdetection due to the lack of a library for ensembling predictions ofdetection models. This problem is overcome thanks to the techniquesand the library developed in our work, and, as we show in Section 4,different ensembling schemes to the one proposed in [34] might havea better impact on the distillation methods.
3.4 Design of the libraryThe techniques presented throughout this section have been imple-mented as an open-source library called EnsembleObjectDetection.This library has been implemented in Python and relies on severalthird-party libraries like Numpy [32], OpenCV [31], or CLoDSA [8](the last one provides the functionality to implement the image anddetection transformations of the TTA procedure).
As we have previously mentioned, the EnsembleObjectDetectionlibrary has been designed to be applicable to models constructed
with any framework and underlying algorithm. To this aim, we havedefined an abstract class called IPredictor with a predictmethod that takes as input a folder of images, and produces as a resultXML files in the Pascal VOC format containing the predictions foreach image of the input folder. Then, for each detection frameworkor library that we want to include in the EnsembleObjectDetectionlibrary, we have to provide a class that extends the IPredictorclass and implements the predict method. Using the output pro-duced by the predict method, the user can apply ensembling andTTA with any detection model.
Currently, the EnsembleObjectDetection library supports modelstrained using the Darknet [36] and MxNet [10] frameworks, and sev-eral Keras libraries [1, 27]. The procedure to extend the library withmodels from other libraries is explained in the project webpage.
4 RESULTSIn this section, we conduct a thorough study of the ensemble methodspresented in the previous section by using three different datasets.
4.1 Pascal VOCIn the first case study, we use the Pascal VOC dataset [14], a popularproject designed to create and evaluate algorithms for image classi-fication, object detection and segmentation. This dataset consists ofnatural images containing objects of 20 categories; and, the metricto evaluate the performance of detection models in this dataset is themean average precision (mAP) over each category [40].
For our experiments with the Pascal VOC dataset, we have em-ployed 5 models pre-trained for this dataset using the MxNet li-brary [10]; namely, a Faster R-CNN model, two YOLO models (oneusing the darknet backbone and another one using the mobilenetbackbone) and two SSD models (one using the Resnet backbone andthe other using the mobilenet backbone). The performance of thesemodels on the Pascal VOC test set is given in the first five rows ofTable 1. As can be seen in such a table, the best model is the YOLOmodel using the darknet backbone with a mAP of 69.78%. Such amAP can be greatly improved using model ensembling and TTA.
For model ensembling, we conduct an ablation study by consider-ing the ensemble of the five models, the ensemble of the three modelswith the best mAP (that are Faster R-CNN, YOLO with the darknetbackbone, and SSD with the Resnet backdone), and the three modelswith the worst mAP (that are YOLO with the mobilenet backboneand the two SSD models). The results for such an ablation study areprovided in the last 9 rows of Table 1. In those results, we can no-tice that all the ensembles conducted with the affirmative strategyobtain better results than the individual models — the best result isobtained by ensembling the three best models (mAP of 77.50%, al-most an 8% better than the best individual model). On the contrary,the unanimous strategy produces worse results than the individualmodels; and the consensus strategy only achieves a better mAP whenthe three best models are combined. These results are due to the factthat the individual models produce few false positives, and some ob-jects that are detected by one of the models are missed by the others.Therefore, the affirmative strategy helps to greatly reduce the numberof false negatives but without considerably increasing the number offalse positives; on the contrary, the unanimous strategy is too restric-tive and increases the number of false negatives. Something similarhappens with the consensus strategy. If we focus on the results foreach particular category, we can notice an improvement of up to a10% with respect to the results obtained by the best individual model.
Datasets mAP areo bike bird boat bottle bus car cat chair cow table dog horse mbike person plant sheep sofa train tv
Faster R-CNN 0.69 0.70 0.77 0.71 0.64 0.50 0.78 0.78 0.80 0.45 0.74 0.58 0.79 0.80 0.79 0.70 0.42 0.75 0.67 0.77 0.67SSD mobilenet 0.62 0.59 0.70 0.61 0.51 0.33 0.68 0.71 0.78 0.43 0.57 0.61 0.69 0.79 0.71 0.61 0.36 0.59 0.60 0.77 0.67SSD resnet 0.64 0.62 0.80 0.70 0.57 0.42 0.78 0.79 0.88 0.50 0.73 0.63 0.78 0.80 0.80 0.70 0.39 0.69 0.65 0.79 0.69YOLO darknet 0.69 0.80 0.72 0.70 0.57 0.60 0.80 0.80 0.81 0.43 0.75 0.63 0.78 0.81 0.71 0.70 0.39 0.71 0.65 0.79 0.70YOLO mobilenet 0.59 0.62 0.71 0.52 0.49 0.43 0.70 0.71 0.70 0.36 0.66 0.47 0.68 0.71 0.62 0.61 0.24 0.60 0.55 0.70 0.61
All affirmative 0.77 0.79 0.80 0.79 0.72 0.64 0.87 0.86 0.88 0.55 0.83 0.68 0.87 0.87 0.80 0.78 0.51 0.79 0.75 0.78 0.76All consensus 0.68 0.71 0.72 0.71 0.60 0.44 0.79 0.80 0.80 0.45 0.76 0.63 0.80 0.81 0.71 0.70 0.39 0.71 0.65 0.78 0.62All unanimous 0.51 0.54 0.63 0.45 0.35 0.27 0.62 0.63 0.63 0.32 0.53 0.42 0.63 0.63 0.63 0.53 0.17 0.54 0.51 0.62 0.54
Three best affirmative 0.77 0.79 0.80 0.79 0.71 0.64 0.86 0.87 0.89 0.55 0.83 0.69 0.87 0.88 0.80 0.78 0.51 0.79 0.75 0.84 0.76Three best consensus 0.71 0.71 0.80 0.71 0.60 0.52 0.80 0.80 0.81 0.51 0.76 0.64 0.80 0.81 0.80 0.70 0.47 0.71 0.71 0.78 0.70Three best unanimous 0.61 0.63 0.72 0.63 0.52 0.35 0.71 0.72 0.81 0.39 0.61 0.57 0.71 0.72 0.72 0.62 0.33 0.62 0.58 0.71 0.62
Three worst affirmative 0.73 0.77 0.79 0.77 0.66 0.56 0.78 0.79 0.80 0.52 0.80 0.62 0.79 0.80 0.80 0.77 0.48 0.76 0.73 0.79 0.74Three worst consensus 0.66 0.71 0.71 0.62 0.60 0.43 0.70 0.71 0.80 0.44 0.68 0.56 0.71 0.80 0.72 0.70 0.39 0.69 0.64 0.79 0.69Three worst unanimous 0.52 0.54 0.63 0.54 0.44 0.27 0.62 0.63 0.63 0.32 0.53 0.49 0.63 0.63 0.63 0.53 0.24 0.53 0.50 0.62 0.53
Table 1. Results for the Pascal VOC dataset applying our model ensemble algorithm. The first five rows provide the result for the base models. The next threerows correspond with the ensemble for the base models. Rows 9 to 11 contain the results of applying the ensemble techniques to the three best base models(SSD resnet, YOLO darknet and Faster R-CNN); and the last three rows contain the results of ensembling the worst three best models (YOLO mobilenet, SSDmobilenet and Faster R-CNN). The best results are in bold face.
In addition, we have applied TTA to all the base models to improvetheir accuracy. Namely, we have applied three kinds of data augmen-tations: colour transformations (applying gamma and histogram nor-malitation, and keeping the original detection), position transforma-tions (applying a horizontal flip, a rotation of 10º, and keeping theoriginal prediction) and the combination of both. Moreover, for eachaugmentation scheme, we have applied the three voting strategies,see Table 2. As in the case of model ensembling, all the models areimproved (the improvement ranges from 0.08% to 5.54%) thanks toTTA when using the affirmative strategy; but the most beneficial aug-mentation scheme varies from model to model. For instance, the SSDmodel with the resnet backbone is improved with the three augmen-tation schemes; but, the Faster R-CNN model only improves with thecolour scheme. Regarding the other voting strategies, the unanimousstrategy always obtains worst results than the original models; andthe consensus strategy only gets better results in some cases. The ex-planation for these results is the same provided previously for modelensembling. It is also worth noting that adding more augmentationtechniques does not always improve the ensembling results.
No TTA Colour TTA Position TTA AllTTA Aff. Cons. Una. Aff. Cons. Una. Aff. Cons. Una.
Faster R-CNN 0.69 0.69 0.69 0.08 0.53 0.53 0.22 0.63 0.61 0.21SSD mobilenet 0.62 0.63 0.63 0.09 0.58 0.58 0.52 0.61 0.58 0.47SSD resnet 0.64 0.70 0.70 0.08 0.65 0.65 0.60 0.68 0.63 0.09YOLO darknet 0.69 0.71 0.71 0.09 0.68 0.68 0.63 0.70 0.68 0.57YOLO mobilenet 0.59 0.61 0.61 0.10 0.57 0.57 0.50 0.61 0.58 0.44
Table 2. Results for the Pascal VOC dataset applying TTA. In the first col-umn, we provide the result for the models without applying TTA. The rest ofthe table is divided into three blocks of three columns (one per each votingstrategy): the first block provides the results with colour transformations, thesecond contains the results for position transformations, and, the last blockpresents the results combining all the transformations. The best results are inbold face.
As a conclusion for this study, we can say that model ensemblingis more beneficial than TTA; and, this is due to the fact that the for-mer introduces a higher variability (thanks to the heterogeneity ofmodels) in the predictions than the latter.
4.2 Stomata detection
In the second example, we apply TTA and data distillation to two pro-prietary datasets of stomata images. Stomata (singular “stoma”) are
pores on a plant leaf that allow the exchange of gases, mainly CO2
and water vapor, between the atmosphere and the plant. Stomata re-spond to changes in the environment and regulate the photosynthesisof plants, and thus their productivity [22, 6].
In order to analyse stomata of plant leaves, plant biologists takemicroscopic images of leaves, and manually measure the stom-ata density in those images. This is a tedious, error-prone, time-consuming and subjective task due to the large number of stom-ata in each image but, it can be automatised by means of detec-tion algorithms. In particular, we have constructed a stomata detec-tion model using the YOLO algorithm implemented in the Darknetframework [9]. The YOLO model was trained by using 4,050 stom-ata images, and it was evaluated on a test set of 450 images using theF1-score and the mAP, see the first row of Table 3. As can be seenfrom that table, the number of false positives (FP) is considerablyhigher than the number of false negatives (FN), and this will have animpact in the voting strategy to apply. In this section, we show howsuch a model can be improved thanks to TTA.
Datasets F1-score TP FP FN mAp
Original 0.90 16600 2341 1239 0.84
Affirmative 0.88 17003 3600 836 0.80Consensus 0.92 16509 1551 1330 0.84Unanimous 0.80 12272 589 5567 0.61
Colour 0.93 16502 1324 1337 0.85Flips 0.92 16480 1448 1359 0.85Rotations 0.91 16463 1999 1376 0.82Flips & colour 0.92 16572 1529 1267 0.84Flips & rotations 0.92 16580 1659 1259 0.84Rotations & colour 0.92 16556 1633 1283 0.84
Table 3. Results of our Yolo model for stomata detection. In the first row,we provide the results for the original model. In the next three rows, we haveapplied TTA with 9 transformations using the three voting strategies; and,in the next six rows, we have applied the TTA method for different kinds oftransformations and using the consensus strategy. The best results are in boldface.
First of all, we have applied TTA by using 9 transformations: threecolour transformations (histogram normalisation, gamma correctionand Gaussian blurring), three flips (vertical, horizontal and both) andthree rotations (90º, 180º and 270º). Moreover, we have applied thethree voting schemes — the results for these experiments are given inrows 2 to 4 in Table 3. As can be seen in this table, the only strategy
that improves the results is the consensus approach, that improvesa 2% the F1-score. Note that each strategy has the expected effect,the affirmative scheme increases the number of FP and decreases thenumber of FN; on the contrary, the unanimous strategy has the oppo-site effect. Then, the consensus strategy provides the best trade-off byconsiderably reducing the number of FP but only slightly increasingthe number of FN.
In addition to the above results, we have also inspected the impactof each kind of transformation for this dataset. In particular, we haveapplied TTA using colour transformations, rotation transformations,flip transformations, and their combinations — see the last 6 rows ofTable 3. In this case, we only included the consensus strategy in Ta-ble 3 since the other strategies produced the same effect previouslyexplained. As can be seen from those results, the same improvementobtained using all the transformation can be achieved by using onlysome of them — this considerably reduces the tome needed to applyTTA. In fact, we achieved better results by applying TTA using onlycolour transformations. This indicates that it is necessary to studydifferent combinations of transformations to find the one that pro-duces the best results; and this shows the benefits of having a librarylike the one presented in this work.
Finally, we have also studied the benefits of data distillation inthe context of stomata detection. It is worth noting that each stom-ata image contains approximately 45 stomata, and, hence, annotatingthose images is a time-consuming task. Therefore, the applicationof semi-supervised learning techniques, like data distillation, can re-duce the burden of annotating those images. In our data distillationexperiments, see Table 4, we have employed a dataset of stomataimages from a different variety than the original dataset employedfor the results of Table 3. Such a dataset contains 450 annotated im-ages for training, 150 annotated images for testing, and 1,620 un-labelled images. Using the 450 annotated images, we constructed aYOLO model that achieved a F1-score of 0.85 and a mAP of 0.8when using a confidence threshold of 0.25, and a F1-score of 0.83and a mAP of 0.79 when using a confidence threshold of 0.5. Usingsuch a model, we have applied data distillation using three schemes:applying colour transformations (gamma correction, histogram, nor-malisation and Gaussian blurring), applying flips (vertical, horizontaland both), and combining colour and flip transformations. Moreover,we have used the three voting schemes, see Table 4. In this case,the best strategy consists in applying all the transformations togetherwith the unanimous voting scheme. This improves a 3% the F1-scorevalue, and an 8% the mAP. Note that using the unanimous strategy,we can increase the threshold to consider a detection as correct sinceusing such a strategy the new model is trained with images where thedetections have been agreed by the predictions of the 9 transforma-tions.
Based on the results obtained for this example, we have shown thebenefits of trying different alternatives for TTA; and, in addition, thattechniques like data distillation can produce accurate models startingfrom small datasets of images.
4.3 Table detection
In the last case study, we analyse the effects of model ensemblingand model distillation for table detection — an important problemsince it is a key step to extract the semantics from tabular data [11].To this aim, we have employed the ICDAR2013 dataset [16], and theWord part of the TableBank dataset [26]. Both datasets have been de-signed to test table detection algorithms; however, the ICDAR2013 istoo small to directly apply deep learning algorithms (it only contains
Confidence 0.25 Confidence 0.5Datasets F1-score mAP F1-score mAP
Original 0.85 0.80 0.83 0.79
All Aff. 0.84 0.82 0.80 0.82All Cons. 0.86 0.85 0.87 0.85All Una. 0.86 0.88 0.88 0.88
Colour Aff. 0.86 0.86 0.83 0.86Colour Cons. 0.82 0.78 0.77 0.78Colour Una. 0.74 0.77 0.62 0.77
Flips Aff. 0.83 0.80 0.76 0.78Flips Cons. 0.04 0.61 0 0.55Flips Una. 0.01 0.30 0 0.30
Table 4. Results of data distillation for the stomata dataset. This table isdivided into two blocks: in the first block (columns 2 and 3), we use a con-fidence threshold of 0.25; and, in the second block (the last two columns),we use a confidence threshold of 0.5. In the first row of the table, we providethe result for the original model. In the next three rows, we present the resultsof applying data distillation with colour and flip transformations. In rows 5to 7, we include the results of applying data distillation only using colourtransformations, and the last three rows present the results of applying datadistillation using flip transformations. The best results are in bold face.
238 images), and the TableBank dataset is a big enough dataset (160kimages) but it was semi-automatically annotated and contains severalincorrect annotations. Therefore, these two datasets provide the per-fect scenario for applying model ensembling and model distillation.In particular, we have trained different models for the ICDAR2013dataset, and have improved them by using our ensemble algorithm,and by applying model distillation using the TableBank dataset.
[email protected] [email protected] [email protected] [email protected] WAvgF1
Mask R-CNN 0.58 0.52 0.39 0.19 0.39SSD 0.85 0.79 0.62 0.26 0.59YOLO 0.83 0.8 0.69 0.33 0.63
Affirmative 0.86 0.81 0.69 0.37 0.65Consensus 0.88 0.84 0.75 0.42 0.69Unanimous 0.4 0.36 0.28 0.08 0.26
Mask R-CNN Aff. 0.58 0.54 0.39 0.11 0.37Mask R-CNN Cons. 0.68 0.63 0.49 0.13 0.45Mask R-CNN Una. 0.57 0.48 0.29 0.06 0.32
SSD Aff. 0.77 0.71 0.58 0.24 0.54SSD Cons. 0.87 0.8 0.67 0.32 0.63SSD Una. 0.82 0.74 0.56 0.26 0.56
YOLO Aff. 0.75 0.71 0.57 0.18 0.52YOLO Cons. 0.88 0.8 0.67 0.32 0.63YOLO Una. 0.77 0.69 0.52 0.16 0.50
Table 5. Results for the ICDAR2013 dataset applying model ensemblingand model distillation. The first three rows are the results for the base models.The next three rows include the results of applying our ensemble methodwith the three different voting strategies; and, the next three blocks providethe results of applying model distillation to the three base algorithms. Thebest results are in bold face.
In our experiments, we have split the ICDAR2013 dataset into atraining set of 178 images and a testing set of 60 images. Using thetraining set, we have constructed three models using the YOLO algo-rithm, implemented in Darknet, the SSD algorithm, implemented inMxNet, and the Mask RCNN algorithm, implemented in the Keraslibrary [15] — note that we have employed different libraries and al-gorithms, but our ensemble library can deal with all of them. Thesethree models have been evaluated (see the three first rows of Table 5)in the testing set using the W1Avg F1-score [46], a metric that com-
putes the weighted sum of the F1-score using different IOU thresh-olds ranging from 0.6 to 0.9 — the F1-score at 0.6 is employed tomeasure the number of tables that are detected, even if the detectionbounding boxes are not perfectly adjusted; and, on the contrary, theF1-score at 0.9 measures the tables that are detected with a bound-ing box perfectly adjusted to them. As can be seen in Table 5, thebest model is obtained using the YOLO algorithm (WAvgF1-scoreof 0.63).
The three models can be improved thanks to model ensembling,and model distillation. First of all, we have ensembled the three mod-els using the three voting strategies (see rows 3 to 5 of Table 5), andwe have obtained an improvement of 2% using the affirmative strat-egy, and a 6% using the consensus approach; as we have seen pre-viously, the unanimous approach is too restrictive and obtains worstresults.
Moreover, we have applied model distillation using the TableBankdataset; applying the three voting strategies, and retraining the threemodels, see the last 9 rows of Table 5. Using this approach we haveimproved the SSD model a 4%, the Mask R-CNN model a 6%; but,the YOLO model does not improve at all. However, if we inspectthe F1-score value at 0.6, the improvement is more evident, SSD im-proves a 2%, Mask R-CNN a 10%, and YOLO a 5%. This is dueto the fact that the ensemble of models usually produces boundingboxes that are not perfectly adjusted to the objects; the issue of im-proving those adjustments remain as further work.
As a conclusion of this example, we can again notice the bene-fits of applying our ensemble algorithm, and the improvements thatcan be achieved applying model distillation when a large dataset ofimages is available, even if it is not annotated.
5 CONCLUSIONS AND FURTHER WORK
In this work, we have presented an ensemble algorithm that workswith the bounding boxes produced by object detection models, and,hence, it is independent of the underlying algorithm employed toconstruct those models. Our ensemble algorithm can be particu-larised with three voting strategies (affirmative, consensus, and unan-imous) that have a different effect depending on the performance ofthe base models. Namely, the affirmative strategy works better whenthe detections of the base models are mostly correct (that is, there arefew false positives) but several objects are left undetected (that is,there are lots of false negatives); the unanimous strategy obtains bet-ter results in the opposite case; and, the consensus strategy providesa better trade-off when there is not a significant difference betweenfalse negatives and false positives in the base models.
In addition, the ensemble method presented here has been em-ployed to define a test-time augmentation procedure for object de-tection that improves the accuracy of object detection models. More-over, the ensemble of models and test-time augmentation are thebasis for data and model distillation, two semi-supervised learningtechniques that can considerably reduce the number of images thatmust be manually annotated to train an object detection model; butthat, up to now, have not been broadly adopted in the context of ob-ject detection due to the lack of a clear ensemble method.
As a by-product of this work, we have developed the open-sourceEnsembleObjectDetection library that implements all the methodspresented here. This library provides support for models constructedwith several algorithms and deep learning frameworks, and can beeasily extended with others. Our methods and library have beentested with several datasets, and we have improved some models upto a 10%.
Several tasks remain as further work. First of all, we want to testour techniques with other datasets like COCO [28]. Moreover, wewould like to test whether techniques like Soft-NMS [4], NMW [52],fusion [49] or WBF [45] produce better results than the NMS algo-rithm currently employed, or, at least, more fine-grained detections.Another interesting aspect to study is whether our ensembling proce-dure can be employed as a defense against adversarial attacks [47].Finally, both in test-time augmentation and data distillation, it re-mains the question of deciding the image transformations that pro-duce better results. Currently, this decision is taken by the users thatemploy our method, but it would be interesting to study automaticmethods like the ones presented in [54].
ACKNOWLEDGEMENTS
This work was partially supported by Ministerio de Economıa yCompetitividad [MTM2017-88804-P], Ministerio de Ciencia, Inno-vacion y Universidades [RTC-2017-6640-7], Agencia de DesarrolloEconomico de La Rioja [2017-I-IDD-00018], and the computing fa-cilities of Extremadura Research Centre for Advanced Technologies(CETA-CIEMAT), funded by the European Regional DevelopmentFund (ERDF). CETA-CIEMAT belongs to CIEMAT and the Gov-ernment of Spain. We also thank Alvaro San-Saez for providing uswith the stomata datasets.
REFERENCES[1] W. Abdulla. Mask R-CNN for object detection and instance seg-
mentation on Keras and TensorFlow. https://github.com/matterport/Mask_RCNN, 2017.
[2] S. Akcay et al., ‘Using Deep Convolutional Neural Network Architec-tures for Object Classification and Detection Within X-Ray BaggageSecurity Imagery’, IEEE Transactions on Information Fosics and Secu-rity, 13(9), 2203–2215, (2018).
[3] D. Ballabio, R. Todeschini, and V. Consonni, ‘Recent Advances inHigh-Level Fusion Methods to Classify Multiple Analytical ChemicalData’, Data Handling in Science and Technology, 31, 129–155, (2019).
[4] N. Bodla et al., ‘Soft-NMS: improving object detection with one line ofcode’, in Proceedings of the IEEE Conference on Computer Vision andPattern Recognition, CVPR’17, pp. 5561–5569, (2017).
[5] C. Bucila, R. Caruana, and A. Niculescu-Mizil, ‘Model compression:making big, slow models practical’, in Proceedings of the 12th In-ternational Conference on Knowledge Discovery and Data Mining,KDD’06, pp. 535–541, (2006).
[6] B. R. Buttery, C. S. Tan, R. I. Buzzell, J. D. Gaynor, and D. C. Mac-Tavish, ‘Stomatal numbers of soybean and response to water stress’,Plant and Soil, 149(2), 283–288, (1993).
[7] Z. Cai and N. Vasconcelos, ‘Cascade R-CNN: Delving Into HighQuality Object Detection’, in Proceedings of the IEEE Conference onComputer Vision and Pattern Recognition, CVPR’18, pp. 6154–6162,(2018).
[8] A. Casado-Garcıa et al., ‘CLoDSA: A Tool for Image Augmentationin Classification, Localization, Detection and Semantic SegmentationTasks’, BMC in Bioinformatics, 20(323), (2019).
[9] A. Casado-Garcıa, J. Heras, and A. Sanz-Saez, ‘Towards the automaticanalysis of stomata images’, in Proceedings of the International Con-ference on Computer Aided Systems Theory (EUROCAST’19), (2019).
[10] T. Chen et al., ‘MXNet: A Flexible and Efficient Machine Learning Li-brary for Heterogeneous Distributed Systems’, CoRR, abs/1512.01274,(2015).
[11] B. Couasnon and A. Lemaitre, Handbook of Document Image Process-ing and Recognition, chapter Recognition of Tables and Forms, 647–677, Springer International Publishing, 2014.
[12] A. V. Etten, ‘You Only Look Twice: Rapid Multi-Scale Object Detec-tion In Satellite Imagery’, CoRR, abs/1805.09512, (2018).
[13] M. Everingham et al., ‘The Pascal Visual Object Classes (VOC) Chal-lenge’, International Journal of Computer Vision, 88(2), 303–338,(2010).
[14] M. Everingham et al., ‘The Pascal Visual Object Classes Challenge: ARetrospective’, International Journal of Computer Vision, 111(1), 98–136, (2015).
[15] F. Chollet and others. Keras. https://github.com/fchollet/keras, 2015.
[16] M. C. Gobel, T. Hassan, E. Oro, and G. Orsi, ‘ICDAR2013 Table Com-petition’, in 12th ICDAR Robust Reading Competition, ICDAR’13, pp.1449–1453. IEEE, (2013).
[17] J. Guo and S. Gould, ‘Deep CNN Ensemble with Data Augmentationfor Object Detection’, CoRR, abs/1506.07224, (2015).
[18] K. He et al., ‘Deep Residual Learning for Image Recognition’, in Pro-ceedings of the IEEE Conference on Computer Vision and PatternRecognition, CVPR’16, pp. 770–778, (2016).
[19] J. Hosang, R. Benenson, and B. Schiele, ‘Learning non-maximum sup-pression’, CoRR, abs/1705.02950, (2017).
[20] J. Huang et al., ‘Speed/accuracy trade-offs for modern convolutionalobject detectors’, in Proceedings of the IEEE Conference on ComputerVision and Pattern Recognition, CVPR’17, pp. 3296–3305, (2017).
[21] T. Huang, J. A. Noble, and A. I. L. Namburete, ‘Omni-SupervisedLearning: Scaling Up to Large Unlabelled Medical Datasets’, in Pro-ceedings of the International Conference on Medical Image Comput-ing and Computer-Assisted Intervention, MICCAI’17, pp. 572–580,(2018).
[22] J. Hughes et al., ‘Reducing Stomatal Density in Barley ImprovesDrought Tolerance without Impacting on Yield’, Plant Physiology,174(2), 776–787, (2017).
[23] J. Irvin et al., ‘Chexpert: A large chest radiograph dataset with uncer-tainty labels and expert comparison’, in Proceedings of the Thirty-ThirdAAAI Conference on Artificial Intelligence, volume 33 of AAAI’19, pp.590–597, (2019).
[24] J. Lee, S. Lee, and S-I. Yang, ‘An Ensemble Method of CNN Mod-els for Object Detection ’, in Proceedings of the IEEE Conference on-Information and Communication Technology Convergence (ICTC’18),ICTC’18, pp. 898–901, (2018).
[25] J. Li, J. Qian, and Y. Zheng, ‘Ensemble R-FCN for Object Detectio’, inProceedings of the International Conference on Computer Science andits Applications, volume 474 of CSA’17, pp. 400–406, (2017).
[26] M. Li et al., ‘TableBank: Table Benchmark for Image-based Table De-tection and Recognition’, CoRR, abs/1903.01949, (2019).
[27] T. Lin, P. Goyal, R. Girshick, K. He, and P. Dollar. Keras retinanet.https://github.com/fizyr/keras-retinanet, 2017.
[28] T-Y. Lin et al., ‘Microsoft COCO: Common Objects in Context’, inProceedings of the European Conference on Computer Vision, volume8693 of ECCV’14, pp. 740–755, (2014).
[29] T-Y. Lin et al., ‘Feature Pyramid Networks for Object Detection ’, inProceedings of the IEEE Conference on Computer Vision and PatternRecognition, CVPR’17, pp. 936–944, (2017).
[30] W. Liu et al., ‘Ssd: Single shot multibox detector’, in Proceedings ofthe European Conference on Computer Vision, volume 9905 of ECCV2016, pp. 21–37, (2016).
[31] J. Minichino and J. Howse, Learning OpenCV 3 Computer Vision withPython, Packt Publishing, 2015.
[32] T. E. Oliphant, A guide to NumPy, volume 1, Trelgol Publishing USA,2006.
[33] C. Peng et al., ‘MegDet: A Large Mini-Batch Object Detector ’, inProceedings of the IEEE Conference on Computer Vision and PatternRecognition, CVPR’18, pp. 6181–6189, (2018).
[34] I. Radosavovic et al., ‘Data Distillation: Towards Omni-SupervisedLearning’, in Proceedings of the IEEE Conference on Computer Visionand Pattern Recognition, CVPR’18, pp. 4119–4128, (2018).
[35] S. Ramachandran et al., ‘Using YOLO based deep learning networkfor real time detection and localization of lung nodules from low doseCT scans’, in Proceedings of Medical Imaging 2018: Computer-AidedDiagnosis, p. 53, (2018).
[36] J. Redmon. Darknet: Open Source Neural Networks in C. http://pjreddie.com/darknet/, 2013–2016.
[37] J. Redmon et al., ‘You Only Look Once: Unified, Real-Time ObjectDetection ’, in Proceedings of the IEEE Conference on Computer Visionand Pattern Recognition, CVPR’16, pp. 779–788, (2016).
[38] J. Redmon and A. Farhadi, ‘Yolov3: An incremental improvement’,CoRR, abs/1804.02767, (2018).
[39] S. Ren, K. He, R. Girshick, and J. Sun, ‘Faster R-CNN: Towards Real-Time Object Detection with Region Proposal Networks’, Advances inNeural Information Processing Systems, 28, 91–99, (2015).
[40] A. Rosebrock, ‘Intersection over union (iou) for ob-ject detection’, in PyImageSearch, (2018). https://www.pyimagesearch.com/2016/11/07/intersection-over-union-iou-for-object-detection/.
[41] P. Simard et al., ‘Tangent prop – a formalism for specifying selectedinvariances in an adaptive network’, in Proceedings of the InternationalConference on Neural Information Processing Systems, volume 4 ofNIPS’91, pp. 895–903, (1992).
[42] P. Simard, D. Steinkraus, and J. C. Platt, ‘Best practices for convolu-tional neural networks applied to visual document analysis’, in Pro-ceedings of the International Conference on Document Analysis andRecognition, volume 2 of ICDAR’03, pp. 958–964, (2003).
[43] K. Simonyan and A. Zisserman, ‘Very deep convolutional networks forlarge-scale image recognition’, in Proceedings of the 3rd InternationalConference on Learning Representations, ICLR’15, (2015). http://arxiv.org/abs/1409.1556.
[44] I. Sirazitdinov et al., ‘Deep neural network ensemble for pneumonialocalization from a large-scale chest x-ray database’, Computers andElectrical Engineering, 78, 388–399, (2019).
[45] R. Solovyev and W. Wang, ‘Weighted Boxes Fusion: ensembling boxesfor object detection models’, CoRR, abs/1910.13302, (2019).
[46] C. Y. Suen et al. ICDAR2019 Table Competition. http://icdar2019.org/, 2019.
[47] F. Tramer et al., ‘Ensemble Adversarial Training: Attacks and De-fenses’, in Proceedings of the 6th International Conference on LearningRepresentations, ICLR’18, pp. 1–20, (2018).
[48] N. Vo et al., ‘Ensemble of Deep Object Detectors for Page Object De-tection’, in Proceedings of the International Conference on UbiquitousInformation Management and Communication, IMCOM’18, pp. 1–5,(2018).
[49] P. Wei, J. E. Ball, and D. T. Anderson, ‘Fusion of an Ensemble of Aug-mented Image Detectors for Robust Object Detection’, Sensors, 18(3),1–21, (2018).
[50] Ensemble Machine Learning: Methods and Applications, eds.,C. Zhang and Y. Ma, Springer, 2012.
[51] Z-Q. Zhao et al., ‘Object Detection With Deep Learning: A Review’,IEEE Transactions on Neural Networks and Learning Systems, 1–21,(2019).
[52] H. Zhou et al., ‘CAD: Scale Invariant Framework for Real-Time ObjectDetection’, in Proceedings of the IEEE Conference on Computer Visionand Pattern Recognition, CVPR’17, pp. 760–768, (2017).
[53] Introduction to Semi-Supervised Learning, eds., X. Zhu and A. B. Gold-berg, Morgan & Claypool Publishers, 2009.
[54] B. Zoph et al., ‘Learning Data Augmentation Strategies for Object De-tection’, CoRR, abs/1906.11172, (2019).


![Home []...Auo.usto do Carmo Affonso, casado, Corn- merciante, idem Auousto Lopes da Rocha, casado, proprie- tario, Almofala de Baixo Francisco Rod rigues Ferreira, casado, commerciante,](https://img.pdfslide.us/doc/110x75/6091a8f88edcee4ad757b679/home-auousto-do-carmo-affonso-casado-corn-merciante-idem-auousto-lopes.jpg)