Embed Size (px)
Citation preview

Enrollment to 2054
Dr. Jim Hundrieser
Plymouth State University

What is your desired future state?
Student Enrollment
Cheaper
MoreBetter
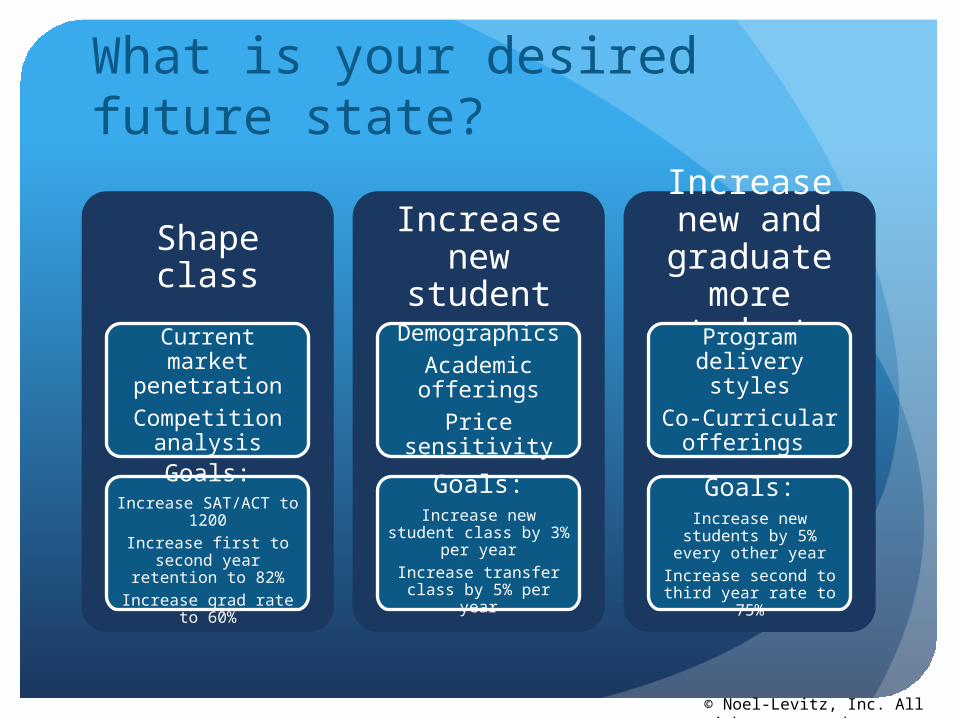
What is your desired future state?
Shape class
Current market penetrationCompetition
analysis
Goals:Increase SAT/ACT to
1200Increase first to second year retention to 82%Increase grad rate to
60%
Increase new student
DemographicsAcademic offerings
Price sensitivity
Goals:Increase new student class by 3% per year
Increase transfer class by 5% per year
Increase new and
graduate more
studentsProgram
delivery stylesCo-Curricular
offerings
Goals:Increase new students by 5% every other year
Increase second to third year rate to 75%
© Noel-Levitz, Inc. All rights reserved
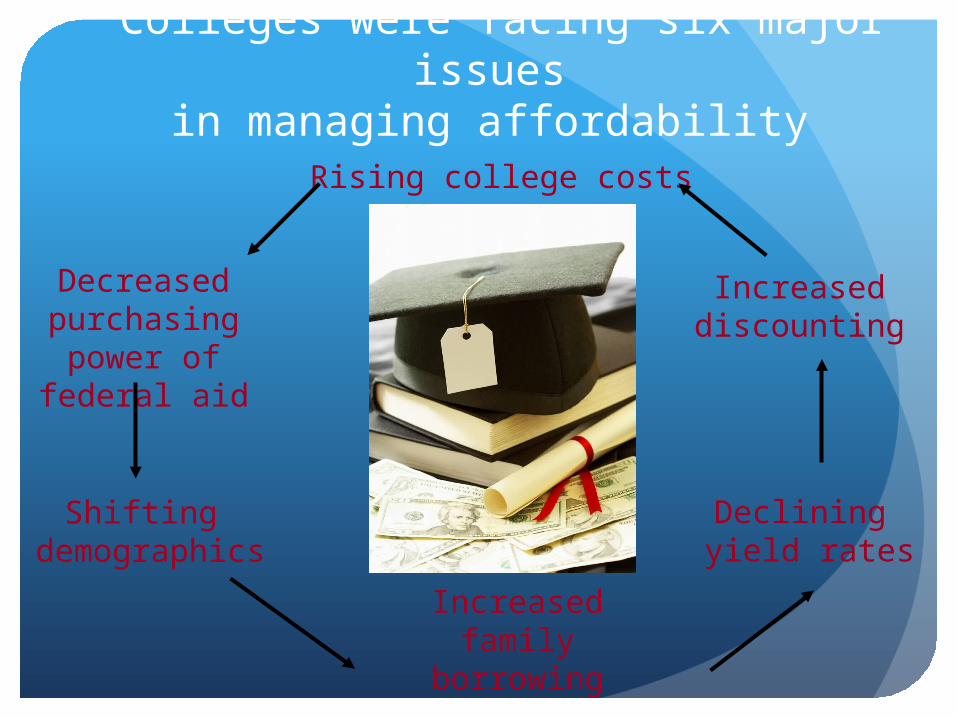
Rising college costs
Declining yield rates
Shifting demographics
Increaseddiscounting
Decreased purchasing power
of federal aid
Increased family
borrowing
Colleges were facing six major issues in managing affordability
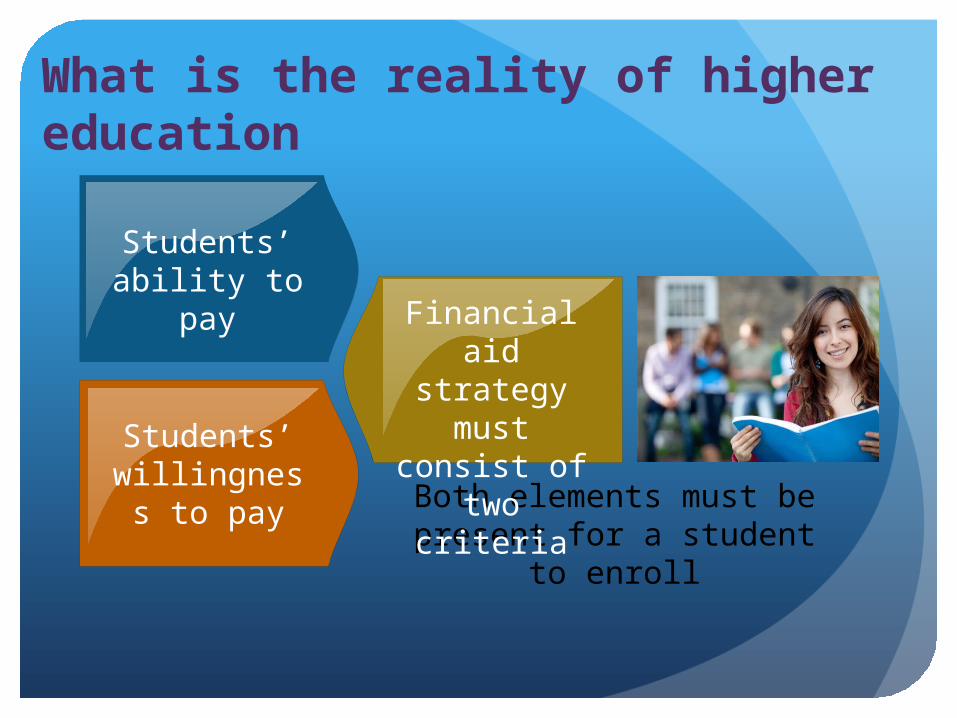
Students’ ability to pay
Both elements must be present for a student to enroll
Students’ willingness to
pay
Financial aid strategy must consist of two
criteria
What is the reality of higher education

Students aren’t
learning
We need to increase attainment
We need to truly educate the 21st century student
Our systems must be
more productiv
e and more
expanisive
What is the reality facing higher education?
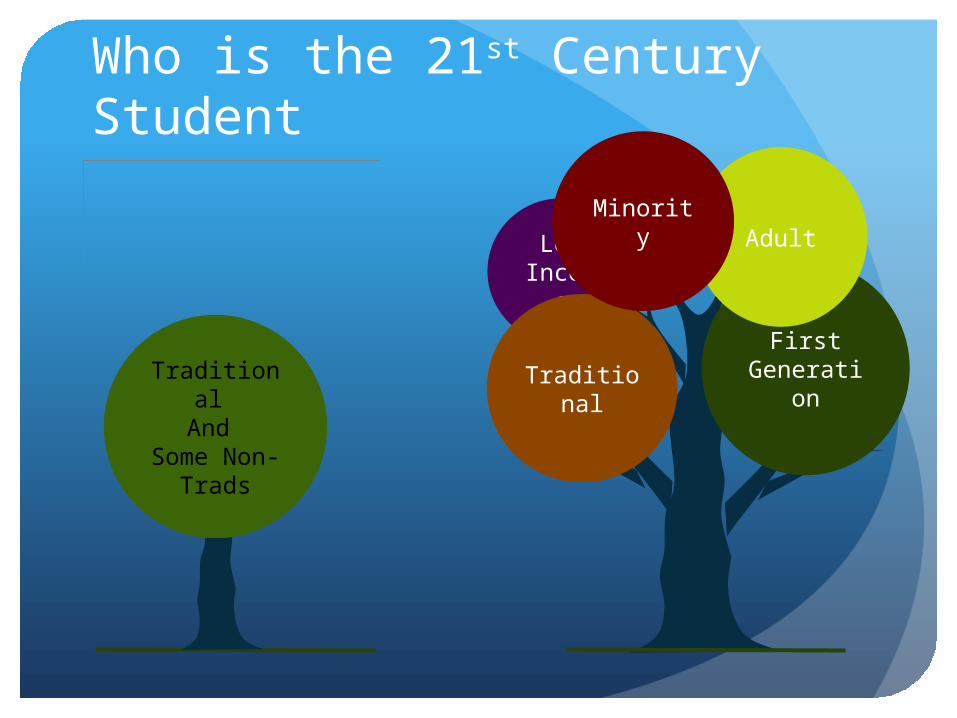
First Generatio
n
AdultLow Incom
e
Traditional
Minority
Who is the 21st Century Student
Traditional And
Some Non-Trads
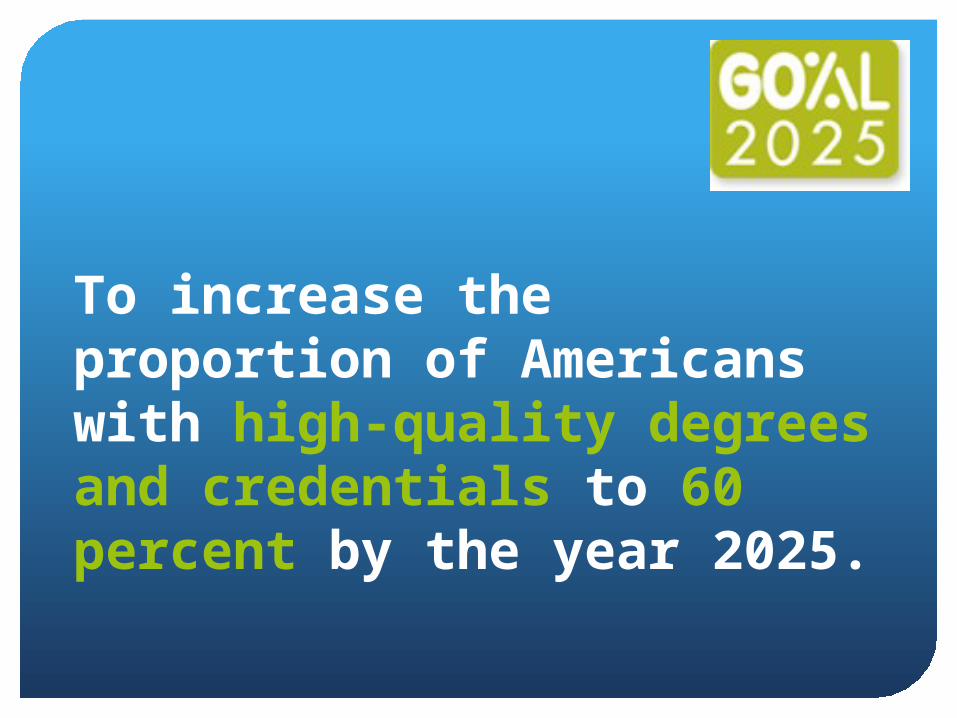
To increase the proportion of Americans with high-quality degrees and credentials to 60 percent by the year 2025.

Future degree need predictions
Between 2008 and 2018, The U.S. economy will create 46.8 million job openings from new jobs and retirement.
29.8 million of these job vacancies will be for those with postsecondary credentials.
16 million will require a bachelors degree.
Only 17.9 million will be for high school graduates and dropouts.
63% of job openings will require some postsecondary training beyond high school by 2018.
Source: Help Wanted: Projections of Jobs and Education Requirements Through 2018
The Georgetown University Center on Education and the Workforce
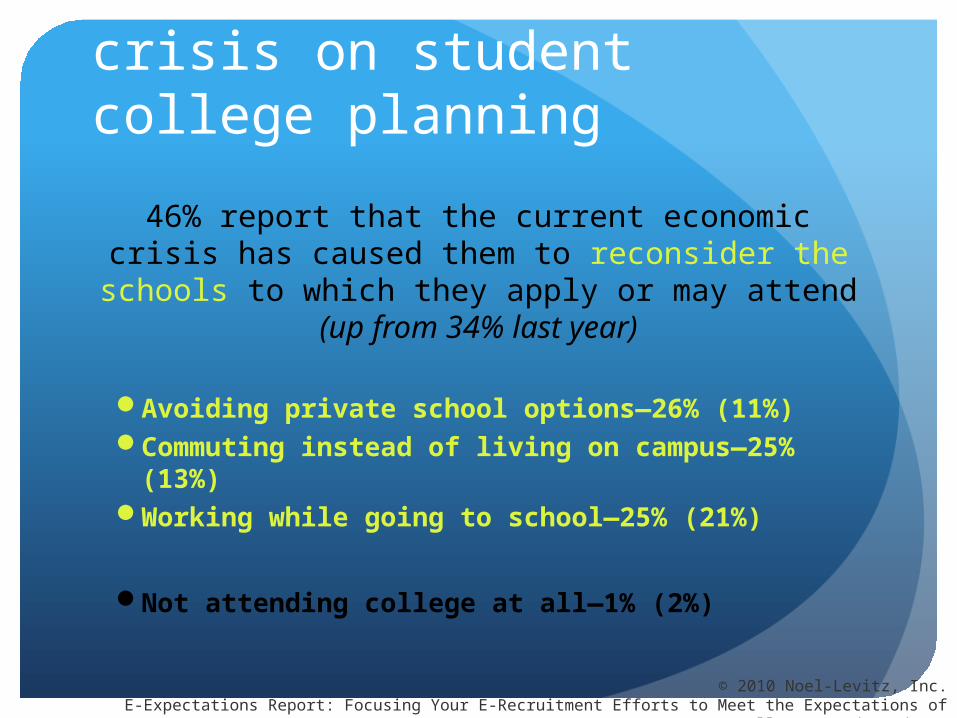
Impact of the economic crisis on student college planning
46% report that the current economic crisis has caused them to reconsider the schools to which
they apply or may attend (up from 34% last year)
Avoiding private school options—26% (11%)Commuting instead of living on campus—25%
(13%)Working while going to school—25% (21%)
Not attending college at all—1% (2%)
© 2010 Noel-Levitz, Inc.E-Expectations Report: Focusing Your E-Recruitment Efforts to Meet the Expectations of College-Bound Students

©2010, Noel-Levitz, Inc. All rights reserved2010 Noel-Levitz Sophomore Survey
And about half of all second year students report college financing concerns
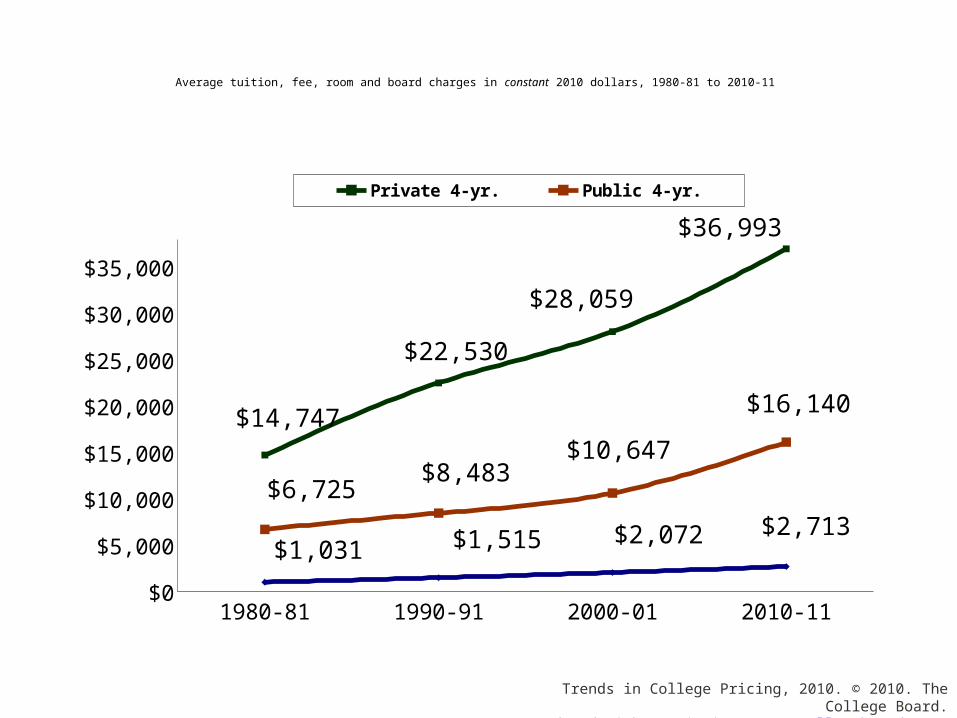
1980-81 1990-91 2000-01 2010-11$0
$5,000
$10,000
$15,000
$20,000
$25,000
$30,000
$35,000
$14,747
$22,530
$28,059
$36,993
$6,725$8,483
$10,647
$16,140
$1,031 $1,515 $2,072 $2,713
Private 4-yr. Public 4-yr. Public 2-yr.
Trends in College Pricing, 2010. © 2010. The College Board.Reproduced with permission. www.collegeboard.com.
Average tuition, fee, room and board charges in constant 2010 dollars, 1980-81 to 2010-11
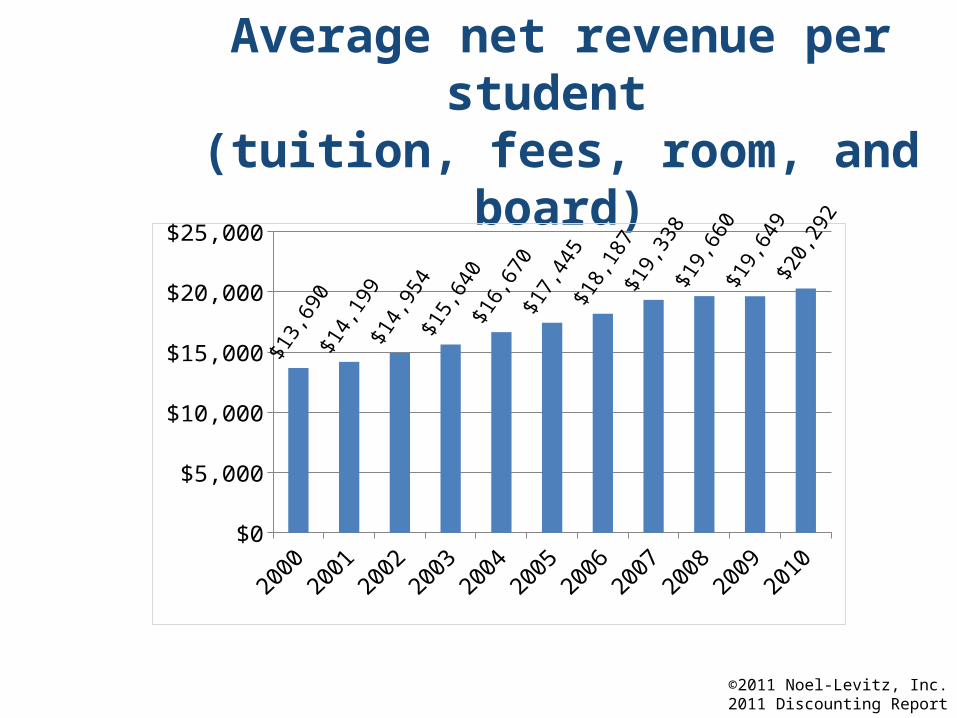
Average net revenue per student (tuition, fees, room, and board)
©2011 Noel-Levitz, Inc.2011 Discounting Report
2000 2001 2002 2003 2004 2005 2006 2007 2008 2009 2010$0
$5,000
$10,000
$15,000
$20,000
$25,000
$13,
690
$14,
199
$14,
954
$15,
640
$16,
670
$17,
445
$18,
187
$19,
338
$19,
660
$19,
649
$20,
292
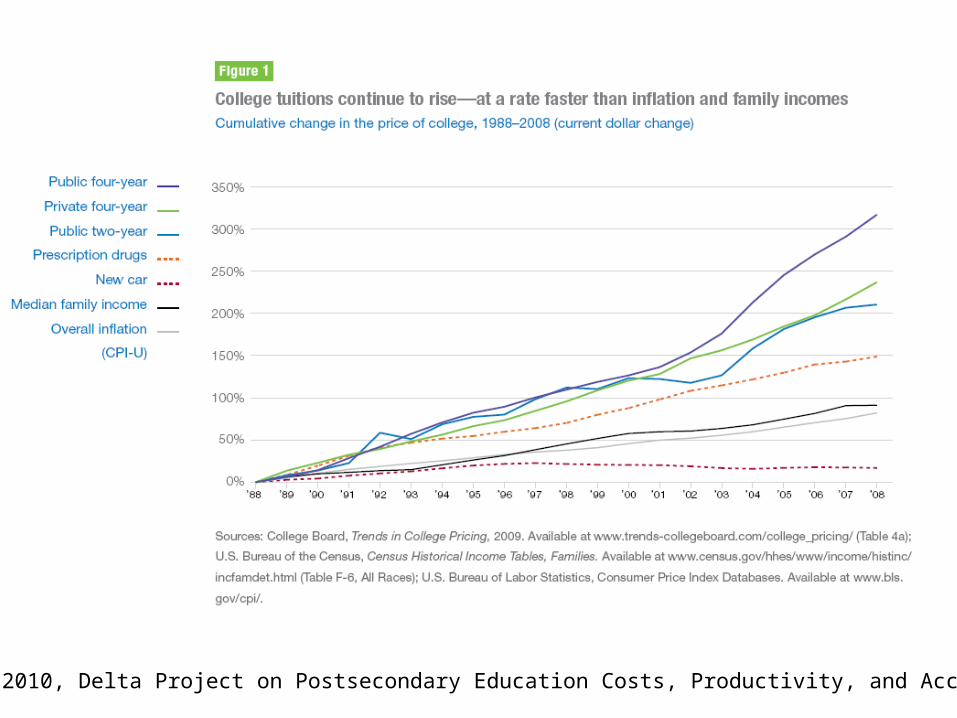
Copyright © 2010, Delta Project on Postsecondary Education Costs, Productivity, and Accountability.
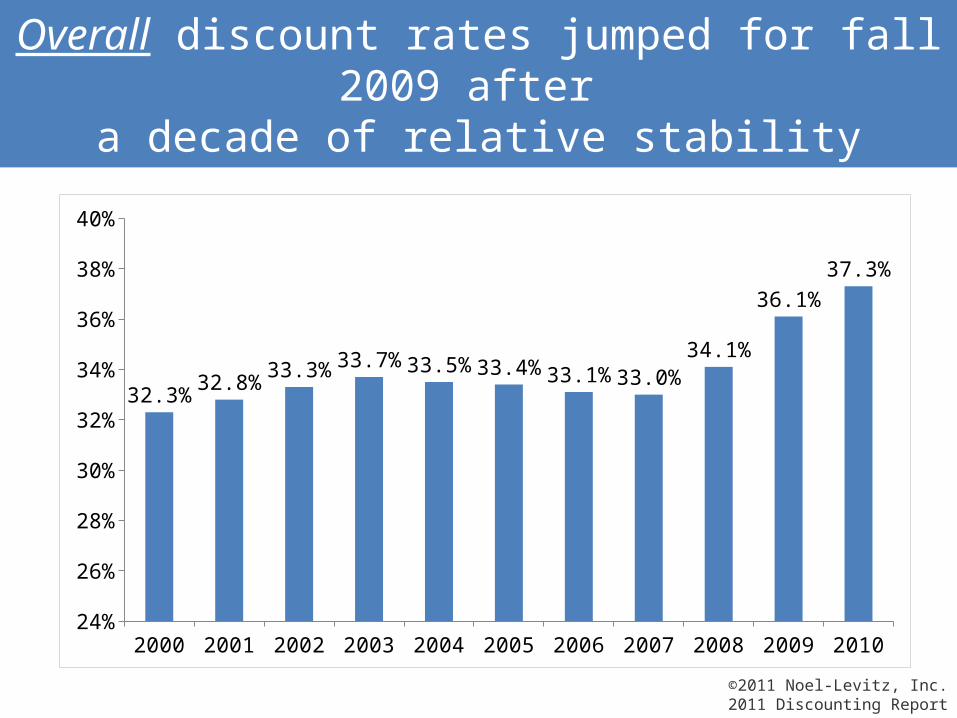
Overall discount rates jumped for fall 2009 after a decade of relative stability
2000 2001 2002 2003 2004 2005 2006 2007 2008 2009 201024%
26%
28%
30%
32%
34%
36%
38%
40%
32.3% 32.8% 33.3% 33.7% 33.5% 33.4% 33.1% 33.0%34.1%
36.1%37.3%
©2011 Noel-Levitz, Inc.2011 Discounting Report

And the percentage of freshmen receiving institutional grants is on the rise
© 2010. NACUBO 2009 Tuition Discounting Study. Reprinted with permission. This material may not be posted, published, or distributed without permission from NACUBO

Virtual tours
Site personalization
RSS feeds
Online course catalog
Cost calculator
Campus visit request form
Online application
0% 20% 40% 60% 80% 100%
26%
27%
32%
34%
39%
40%
50%
32%
32%
32%
33%
29%
37%
31%
Extreme value A lot of value
© 2010 Noel-Levitz, Inc.E-Expectations 2010: Focusing your E-Recruitment Efforts to Meet the Expectations of College-Bound Students
Value of interactive Web features
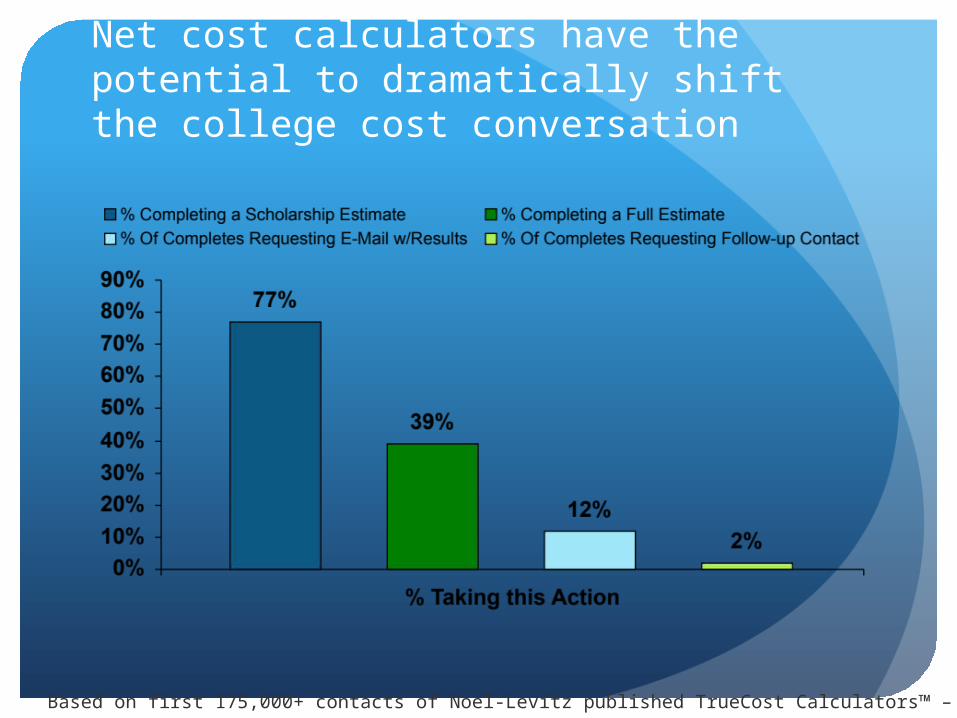
Net cost calculators have the potential to dramatically shift the college cost conversation
Based on first 175,000+ contacts of Noel-Levitz published TrueCost Calculators™ – June 2011

Percentage of students satisfied or very satisfied with their
overall experience
© 2011 Noel-Levitz, Inc.2011 National Student Satisfaction and Priorities Report
Four-year privates
Four-year publics
Community colleges
Career schools48%
50%
52%
54%
56%
58%
60%
62%
57%
54%
61%
53%
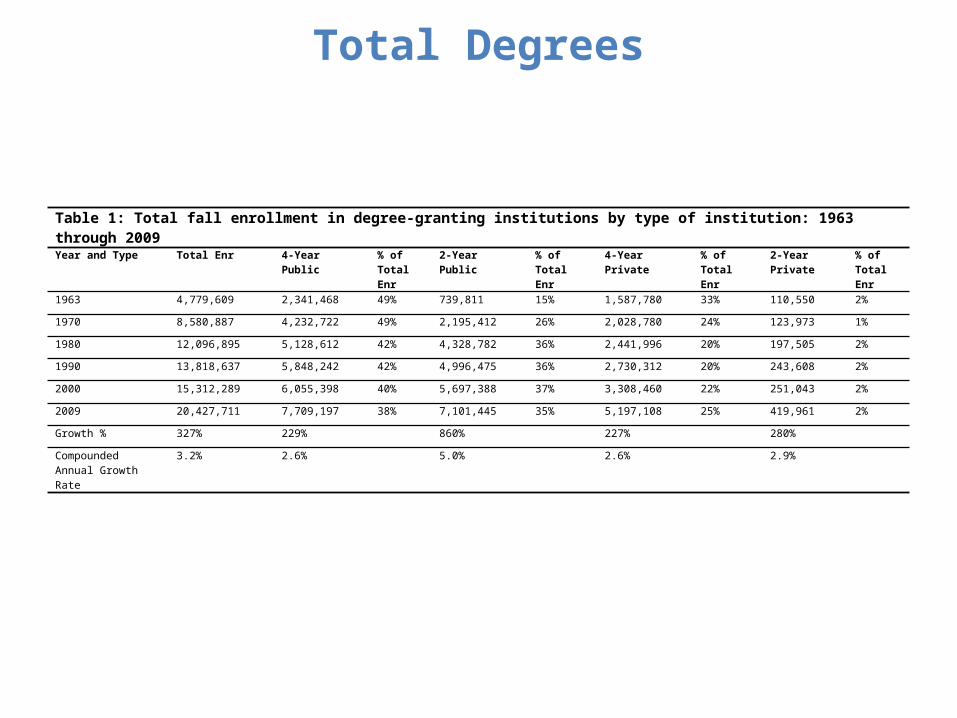
Total Degrees
Table 1: Total fall enrollment in degree-granting institutions by type of institution: 1963 through 2009
Year and Type Total Enr 4-Year Public % of Total Enr
2-Year Public % of Total Enr
4-Year Private % of Total Enr
2-Year Private % of Total Enr
1963 4,779,609 2,341,468 49% 739,811 15% 1,587,780 33% 110,550 2%
1970 8,580,887 4,232,722 49% 2,195,412 26% 2,028,780 24% 123,973 1%
1980 12,096,895 5,128,612 42% 4,328,782 36% 2,441,996 20% 197,505 2%
1990 13,818,637 5,848,242 42% 4,996,475 36% 2,730,312 20% 243,608 2%
2000 15,312,289 6,055,398 40% 5,697,388 37% 3,308,460 22% 251,043 2%
2009 20,427,711 7,709,197 38% 7,101,445 35% 5,197,108 25% 419,961 2%
Growth % 327% 229% 860% 227% 280%
Compounded Annual Growth Rate
3.2% 2.6% 5.0% 2.6% 2.9%
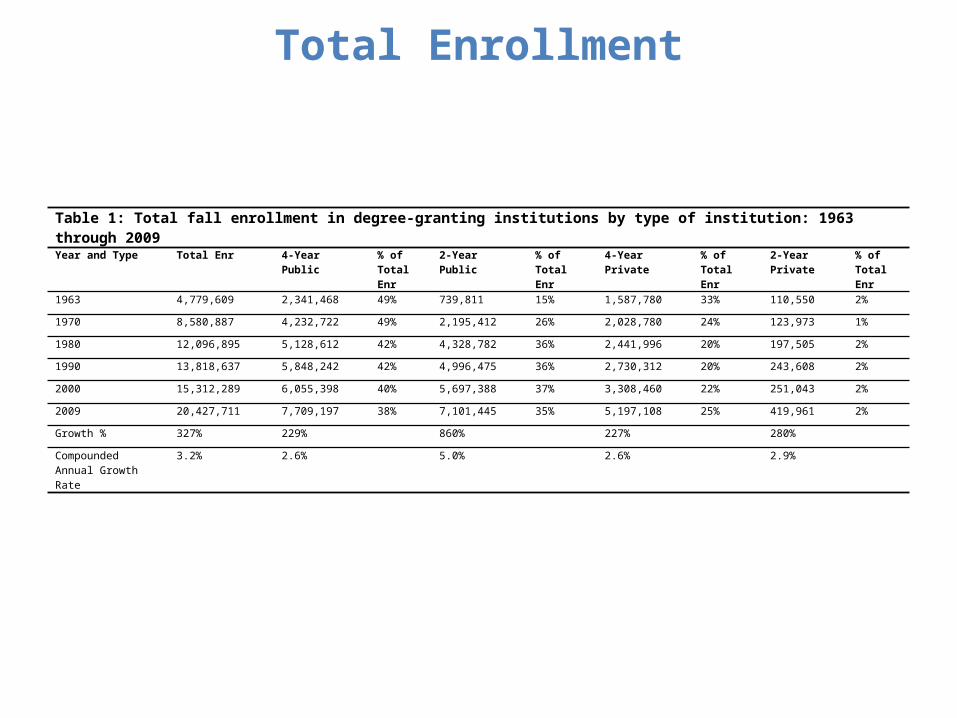
Total Enrollment
Table 1: Total fall enrollment in degree-granting institutions by type of institution: 1963 through 2009
Year and Type Total Enr 4-Year Public % of Total Enr
2-Year Public % of Total Enr
4-Year Private % of Total Enr
2-Year Private % of Total Enr
1963 4,779,609 2,341,468 49% 739,811 15% 1,587,780 33% 110,550 2%
1970 8,580,887 4,232,722 49% 2,195,412 26% 2,028,780 24% 123,973 1%
1980 12,096,895 5,128,612 42% 4,328,782 36% 2,441,996 20% 197,505 2%
1990 13,818,637 5,848,242 42% 4,996,475 36% 2,730,312 20% 243,608 2%
2000 15,312,289 6,055,398 40% 5,697,388 37% 3,308,460 22% 251,043 2%
2009 20,427,711 7,709,197 38% 7,101,445 35% 5,197,108 25% 419,961 2%
Growth % 327% 229% 860% 227% 280%
Compounded Annual Growth Rate
3.2% 2.6% 5.0% 2.6% 2.9%
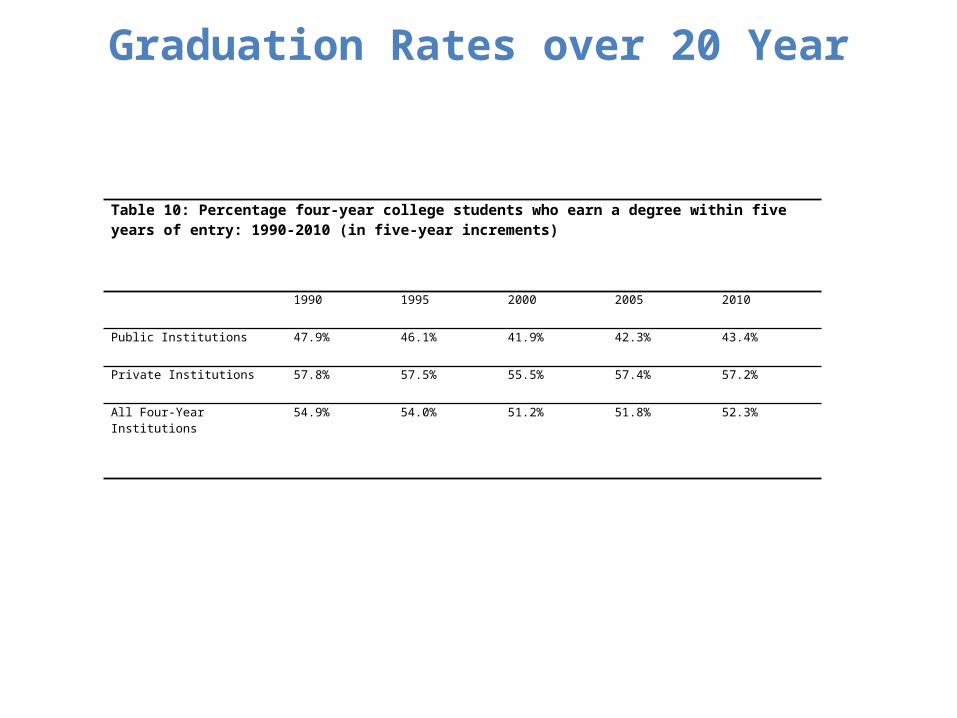
Graduation Rates over 20 Year
Table 10: Percentage four-year college students who earn a degree within five years of entry: 1990-2010 (in five-year increments)
1990 1995 2000 2005 2010
Public Institutions 47.9% 46.1% 41.9% 42.3% 43.4%
Private Institutions 57.8% 57.5% 55.5% 57.4% 57.2%
All Four-Year Institutions 54.9% 54.0% 51.2% 51.8% 52.3%
Six in ten college presidents say the system of higher
education in this country is headed in the right direction,
but a substantial minority (38%) say it is headed in the
wrong direction. © Copyright 2011, Pew Research Center: Is College Worth It
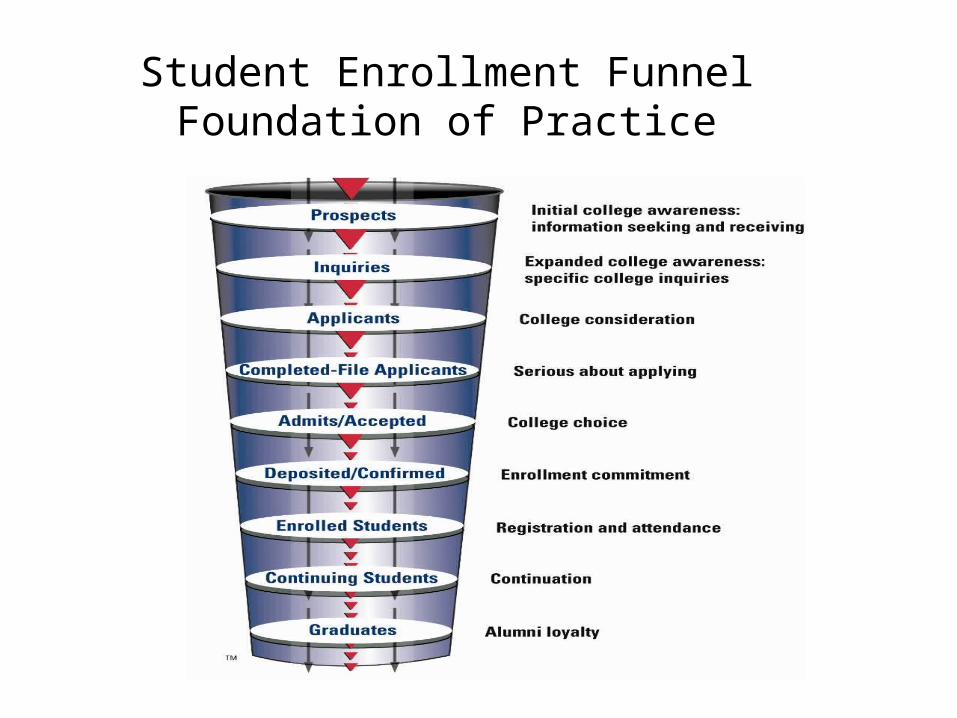
Student Enrollment FunnelFoundation of Practice
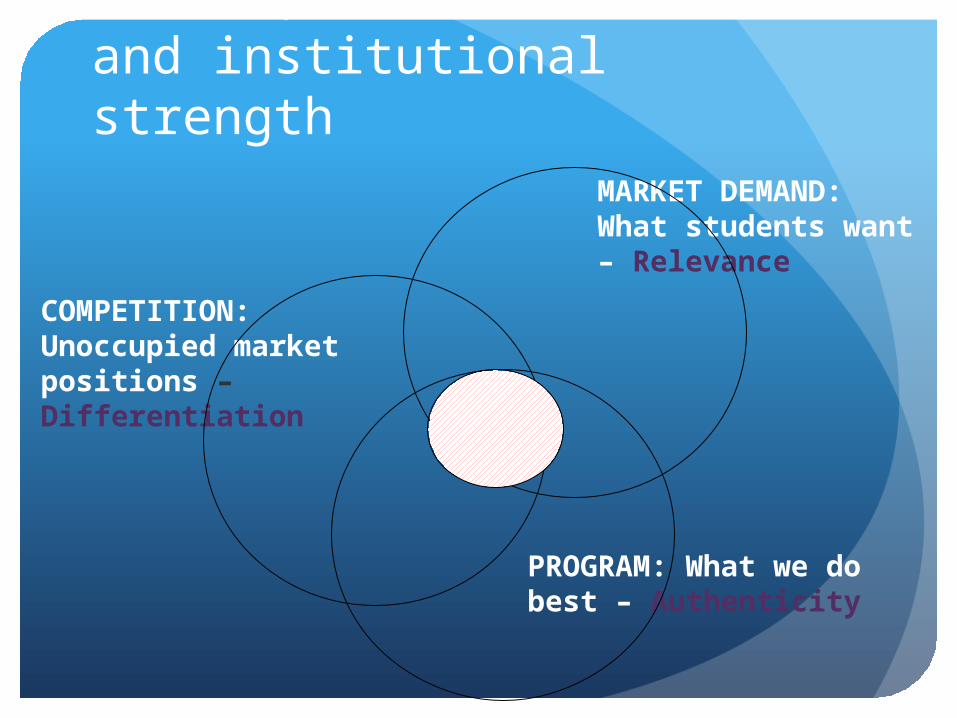
Competition, market demand,
and institutional strengthMARKET DEMAND: What students want – Relevance
COMPETITION: Unoccupied market positions – Differentiation
PROGRAM: What we do best – Authenticity
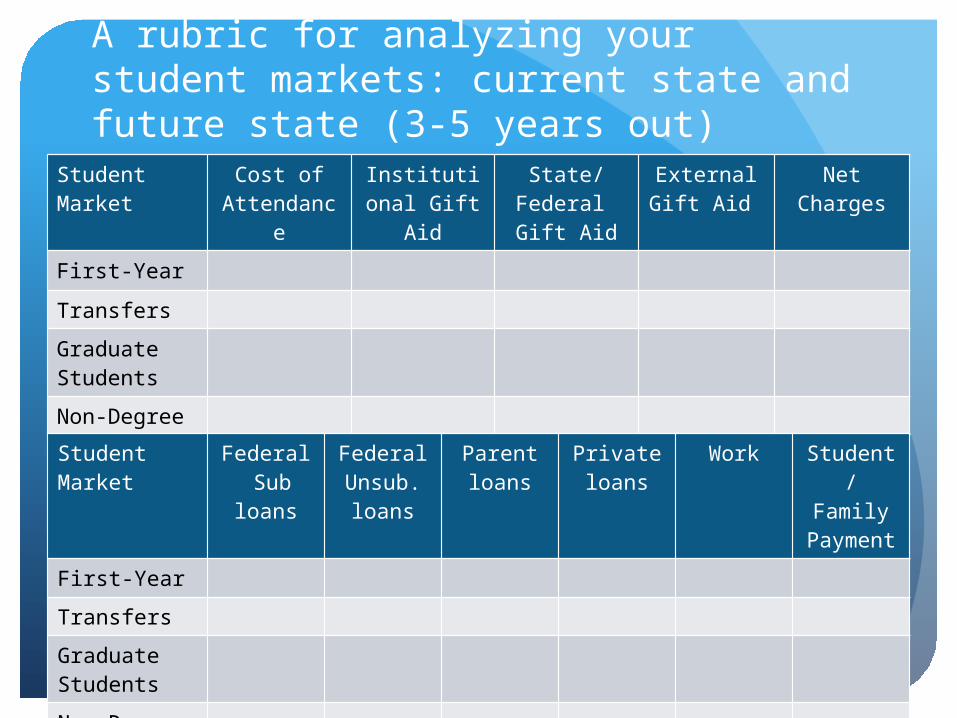
A rubric for analyzing your student markets: current state and future state (3-5 years out)
Student Market
Cost of Attendance
Institutional Gift Aid
State/Federal Gift Aid
External Gift Aid
Net Charges
First-Year
Transfers
Graduate Students
Non-Degree
Student Market
Federal Sub
loans
Federal Unsub. loans
Parent loans
Private loans
Work Student/Family
Payment
First-Year
Transfers
Graduate Students
Non-Degree
• What student markets do you currently serve and how do they finance your cost of attendance?
• How is their ability to finance your cost of attendance likely to change over the next 3-5 years?
• What strategies will you adopt to help your students manage your cost of attendance?
Do you have a pricing and positioning strategy?
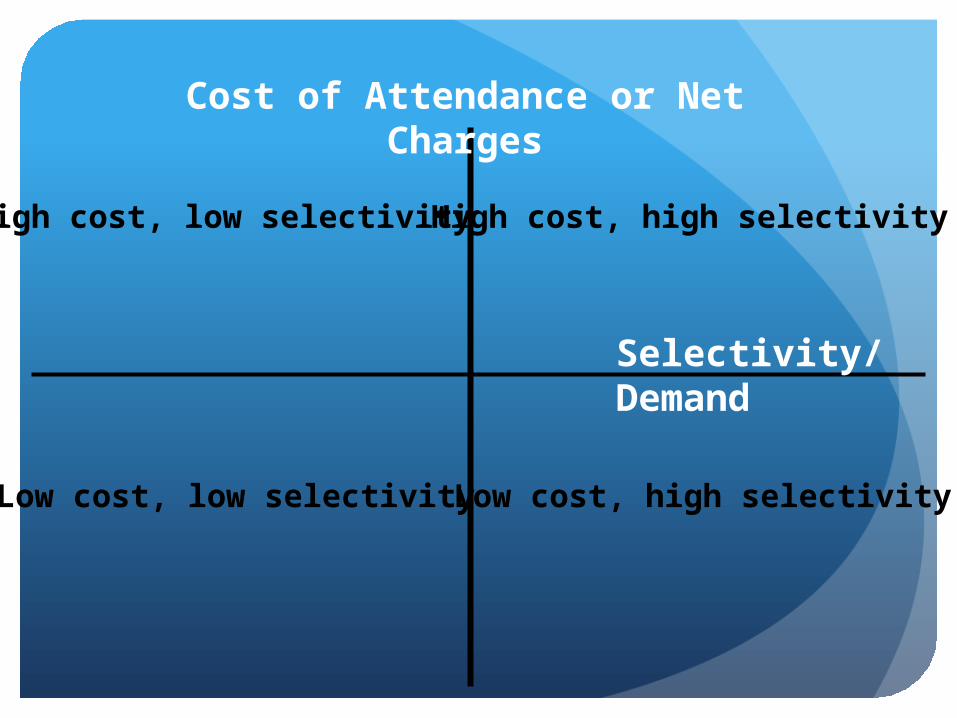
Selectivity/Demand
Cost of Attendance or Net Charges
High cost, high selectivityHigh cost, low selectivity
Low cost, low selectivity Low cost, high selectivity
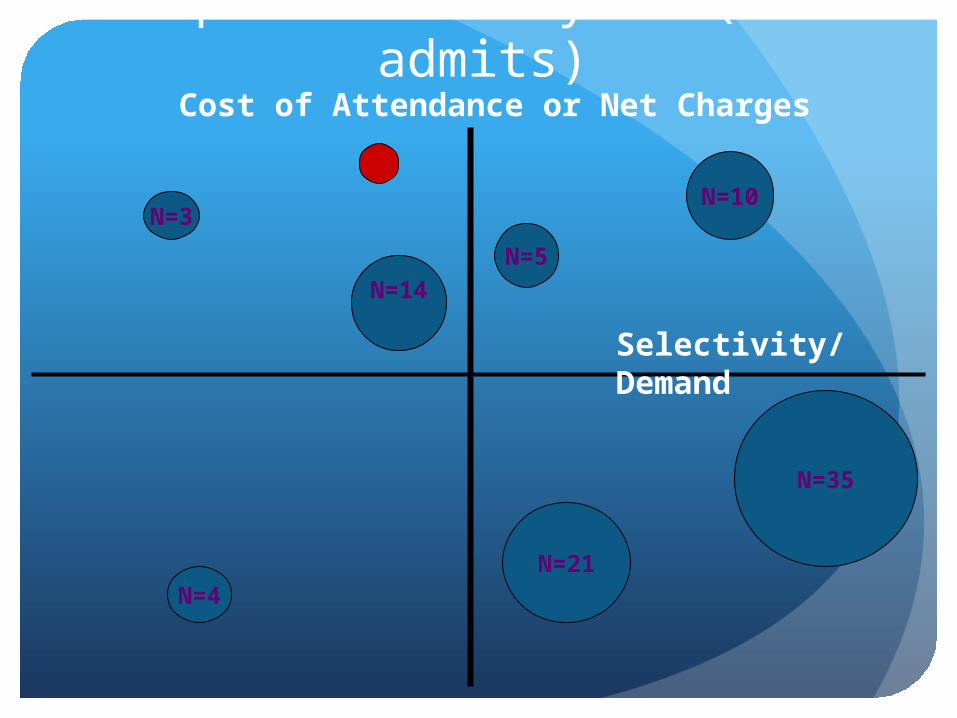
Selectivity/Demand
Cost of Attendance or Net Charges
N=21
N=35
N=4
N=14
Competitor analysis (lost admits)
N=10
N=5
N=3
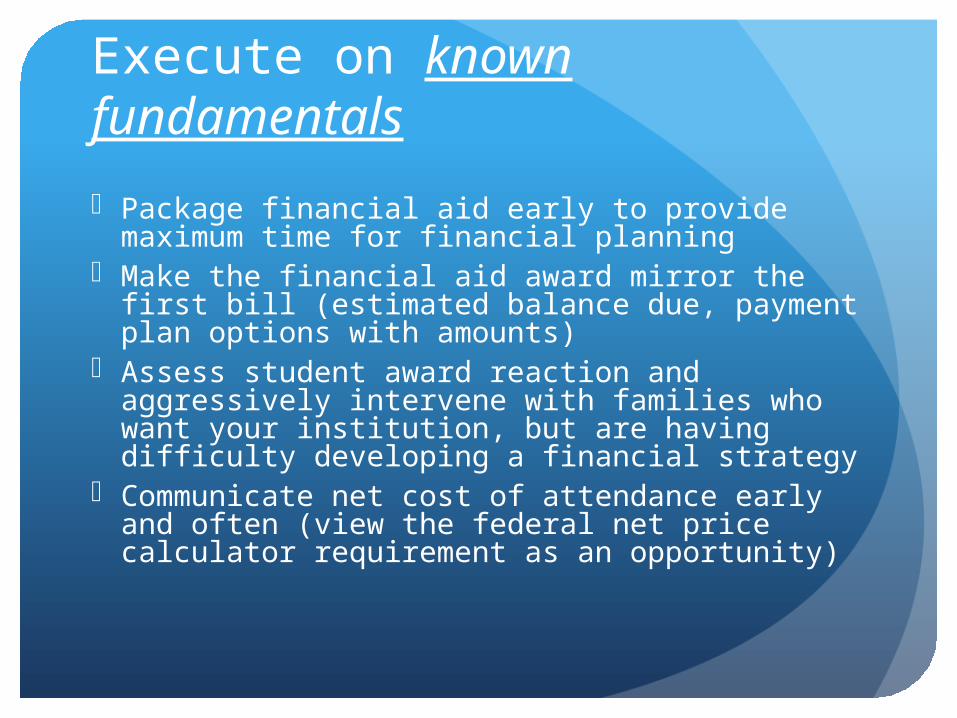
Execute on known fundamentals
• Package financial aid early to provide maximum time for financial planning
• Make the financial aid award mirror the first bill (estimated balance due, payment plan options with amounts)
• Assess student award reaction and aggressively intervene with families who want your institution, but are having difficulty developing a financial strategy
• Communicate net cost of attendance early and often (view the federal net price calculator requirement as an opportunity)
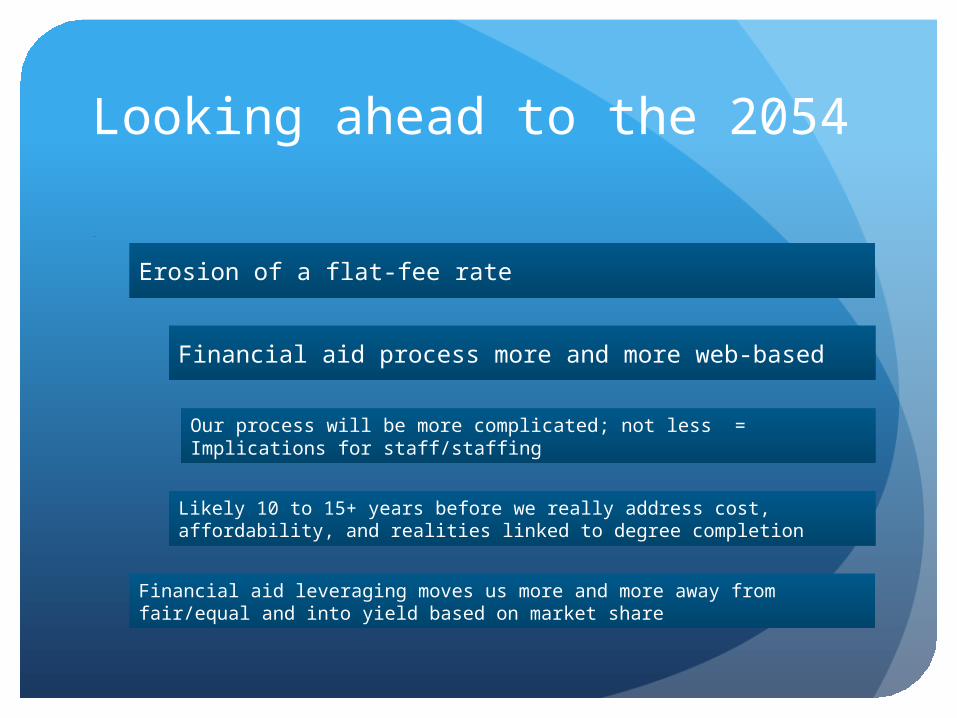
Looking ahead to the 2054
Erosion of a flat-fee rate
Financial aid process more and more web-based
Our process will be more complicated; not less = Implications for staff/staffing
Likely 10 to 15+ years before we really address cost, affordability, and realities linked to degree completion
Financial aid leveraging moves us more and more away from fair/equal and into yield based on market share

My Thanks to You!