Embed Size (px)
Citation preview
Enrollment Projection Study
Annual Update March 15, 2018
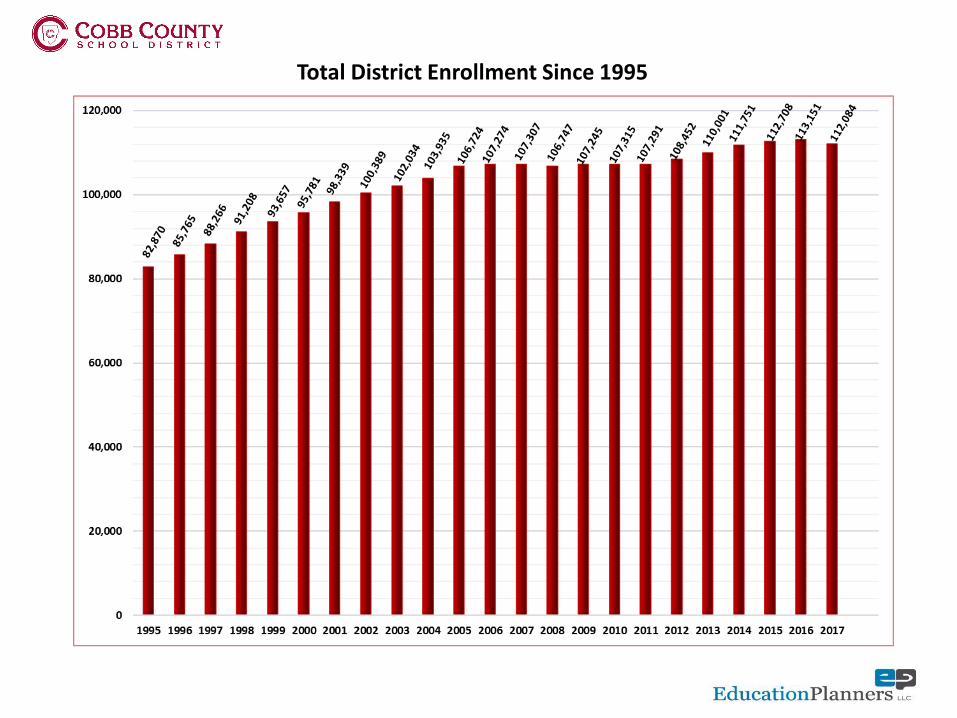
Total District Enrollment Since 1995
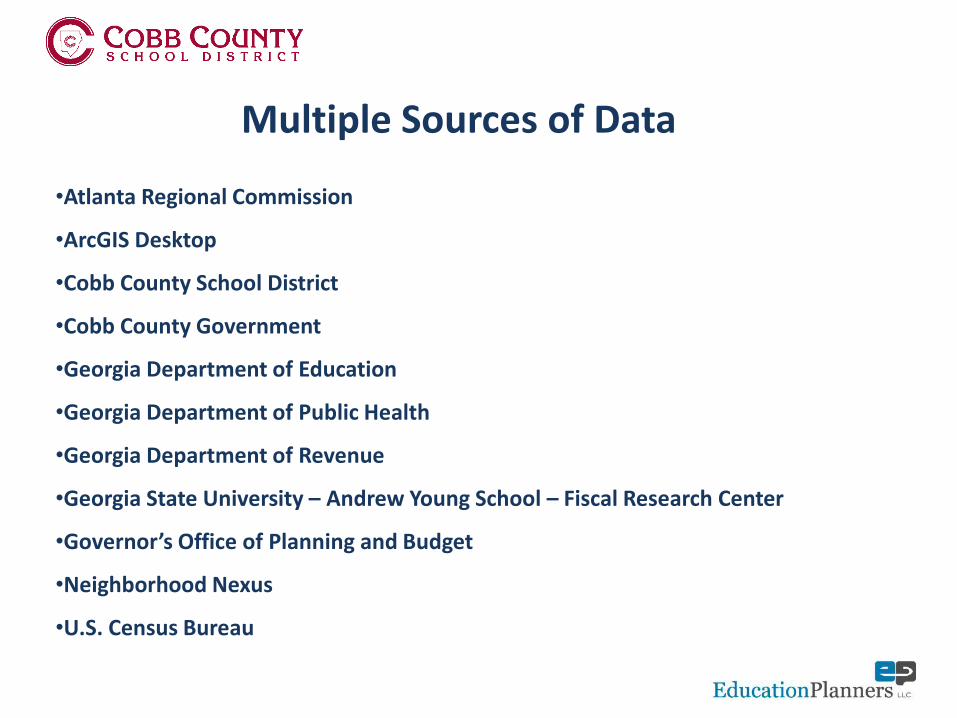
Multiple Sources of Data
•Atlanta Regional Commission
•ArcGIS Desktop
•Cobb County School District
•Cobb County Government
•Georgia Department of Education
•Georgia Department of Public Health
•Georgia Department of Revenue
•Georgia State University – Andrew Young School – Fiscal Research Center
•Governor’s Office of Planning and Budget
•Neighborhood Nexus
•U.S. Census Bureau
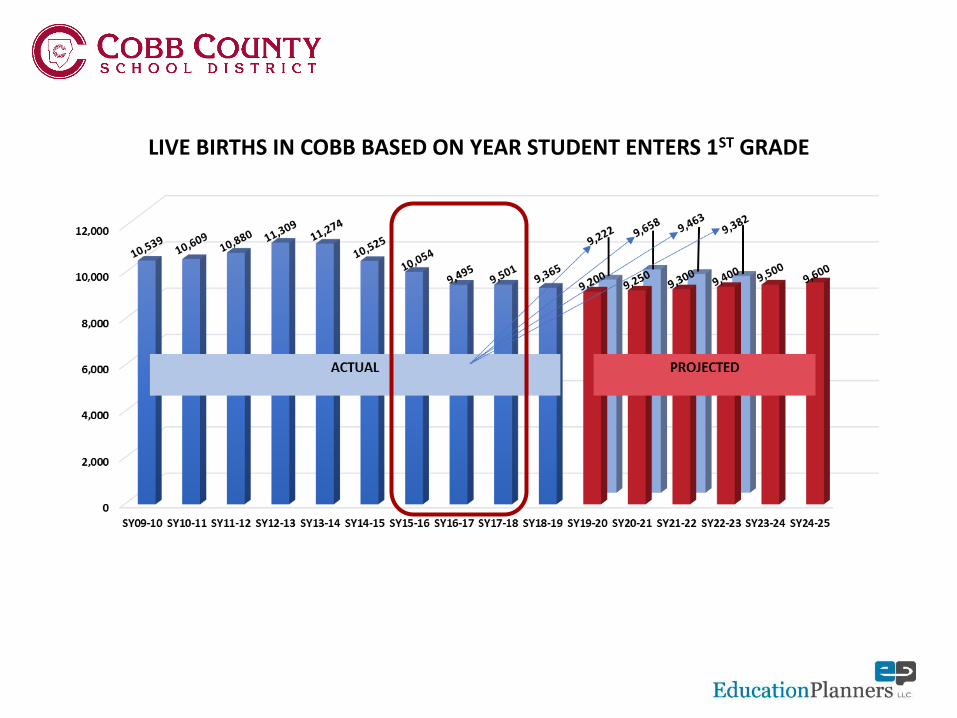
LIVE BIRTHS IN COBB BASED ON YEAR STUDENT ENTERS 1ST GRADE
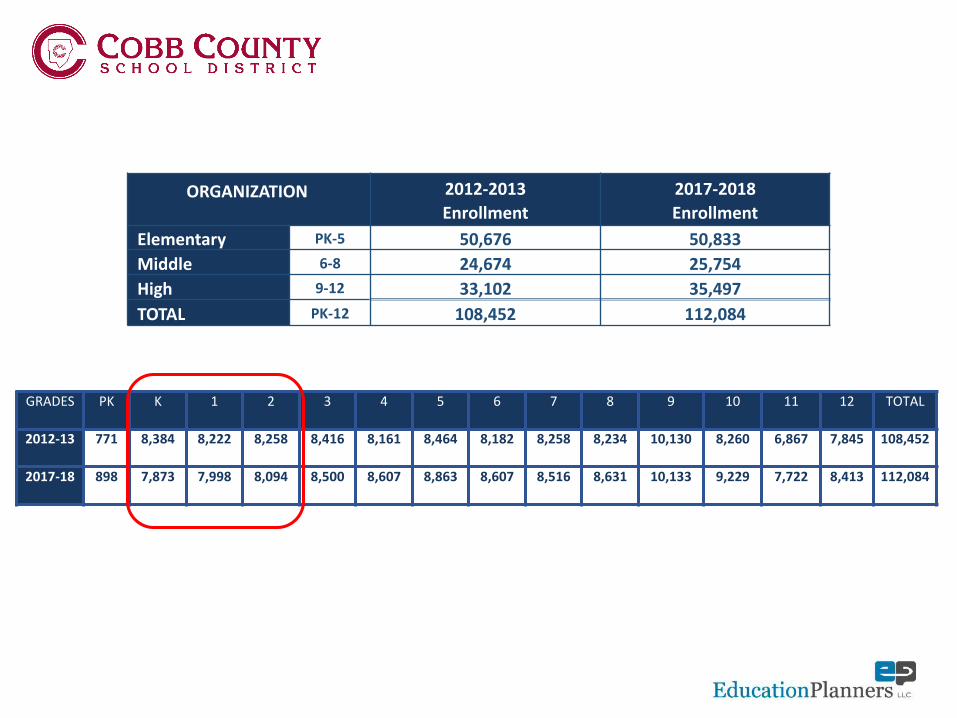
ORGANIZATION 2012-2013
Enrollment
2017-2018
Enrollment
Elementary PK-5 50,676 50,833
Middle 6-8 24,674 25,754
High 9-12 33,102 35,497
TOTAL PK-12 108,452 112,084
GRADES PK K 1 2 3 4 5 6 7 8 9 10 11 12 TOTAL
2012-13 771 8,384 8,222 8,258 8,416 8,161 8,464 8,182 8,258 8,234 10,130 8,260 6,867 7,845 108,452
2017-18 898 7,873 7,998 8,094 8,500 8,607 8,863 8,607 8,516 8,631 10,133 9,229 7,722 8,413 112,084
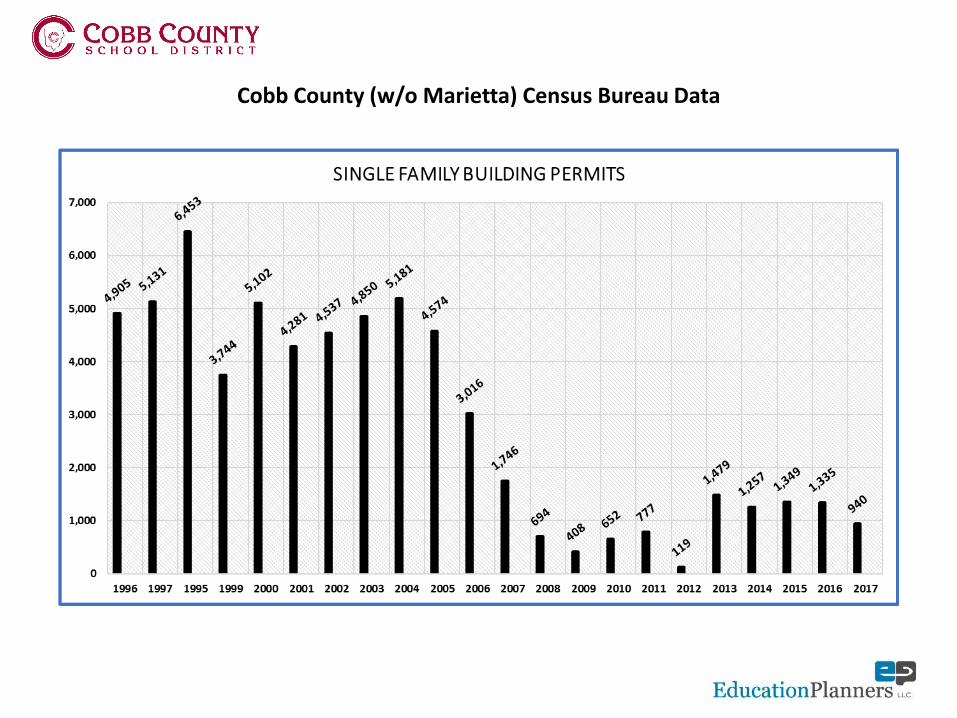
Cobb County (w/o Marietta) Census Bureau Data
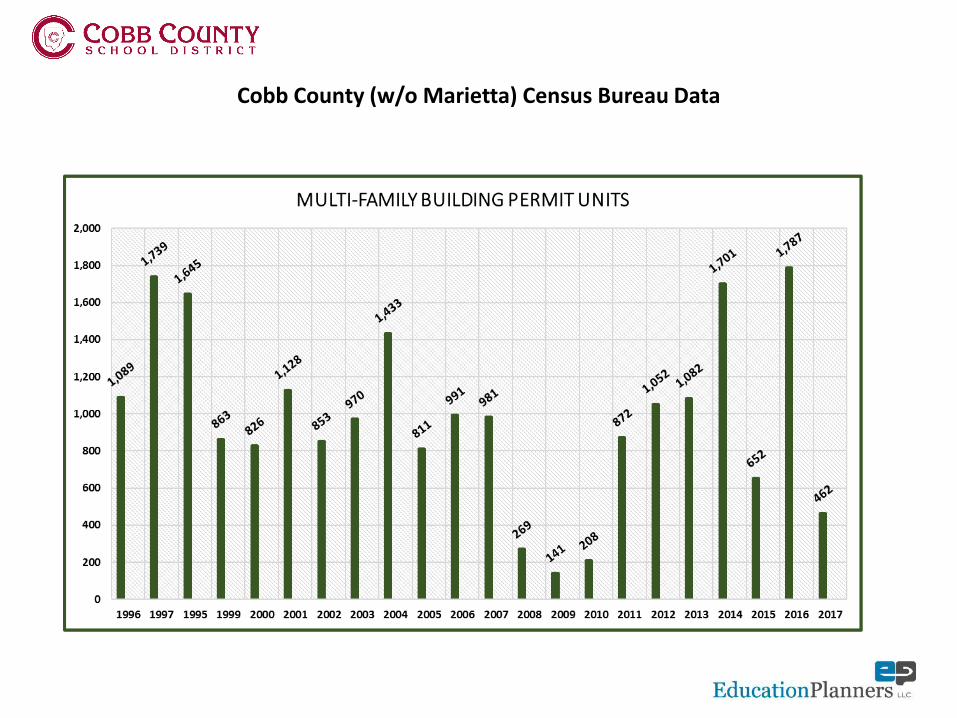
Cobb County (w/o Marietta) Census Bureau Data
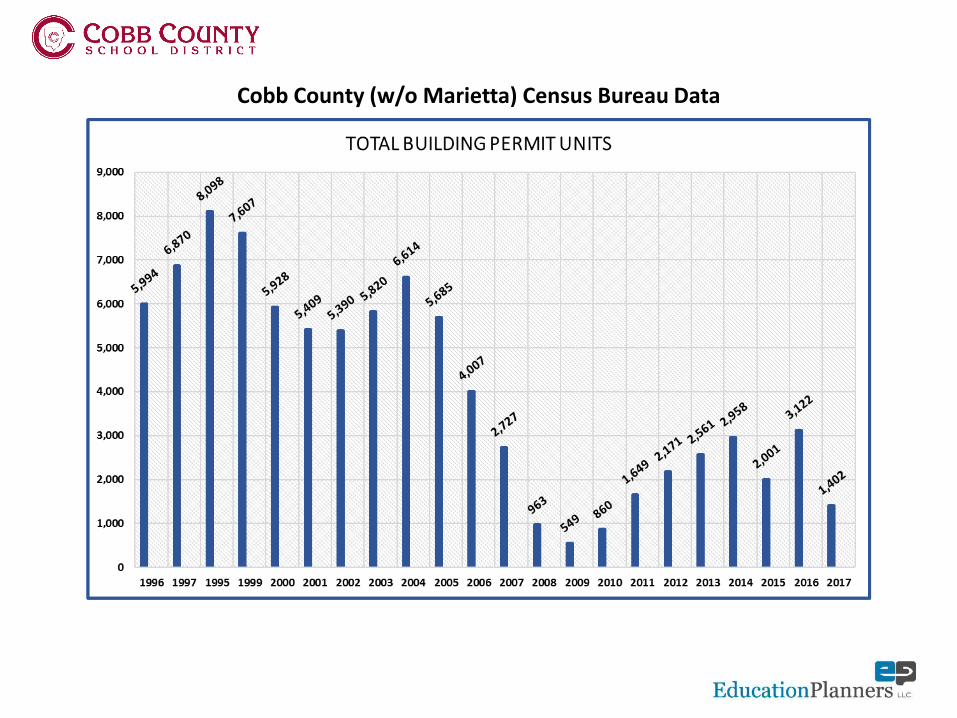
Cobb County (w/o Marietta) Census Bureau Data
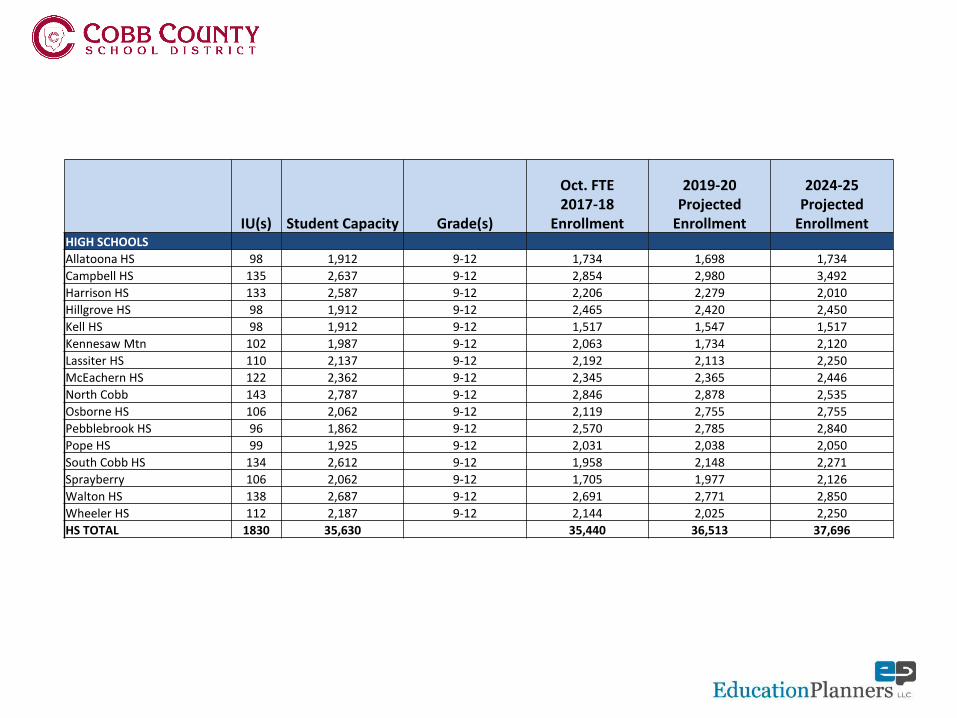
IU(s) Student Capacity Grade(s)
Oct. FTE 2017-18
Enrollment
2019-20 Projected
Enrollment
2024-25 Projected
EnrollmentHIGH SCHOOLS
Allatoona HS 98 1,912 9-12 1,734 1,698 1,734
Campbell HS 135 2,637 9-12 2,854 2,980 3,492
Harrison HS 133 2,587 9-12 2,206 2,279 2,010
Hillgrove HS 98 1,912 9-12 2,465 2,420 2,450
Kell HS 98 1,912 9-12 1,517 1,547 1,517
Kennesaw Mtn 102 1,987 9-12 2,063 1,734 2,120
Lassiter HS 110 2,137 9-12 2,192 2,113 2,250
McEachern HS 122 2,362 9-12 2,345 2,365 2,446
North Cobb 143 2,787 9-12 2,846 2,878 2,535
Osborne HS 106 2,062 9-12 2,119 2,755 2,755
Pebblebrook HS 96 1,862 9-12 2,570 2,785 2,840
Pope HS 99 1,925 9-12 2,031 2,038 2,050
South Cobb HS 134 2,612 9-12 1,958 2,148 2,271
Sprayberry 106 2,062 9-12 1,705 1,977 2,126
Walton HS 138 2,687 9-12 2,691 2,771 2,850
Wheeler HS 112 2,187 9-12 2,144 2,025 2,250
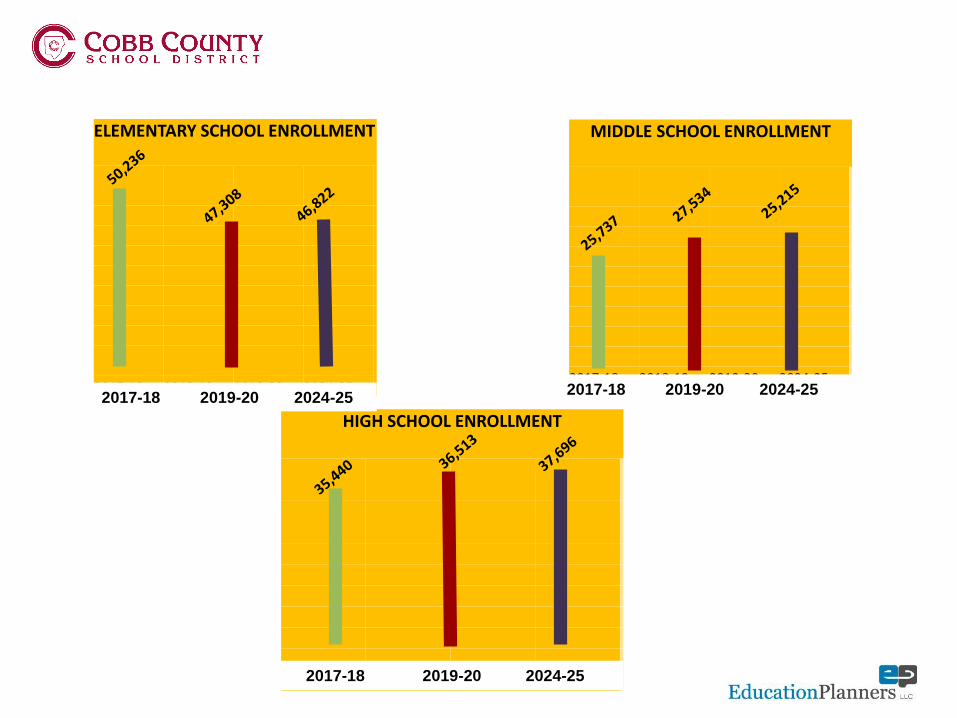
HS TOTAL 1830 35,630 35,440 36,513 37,696
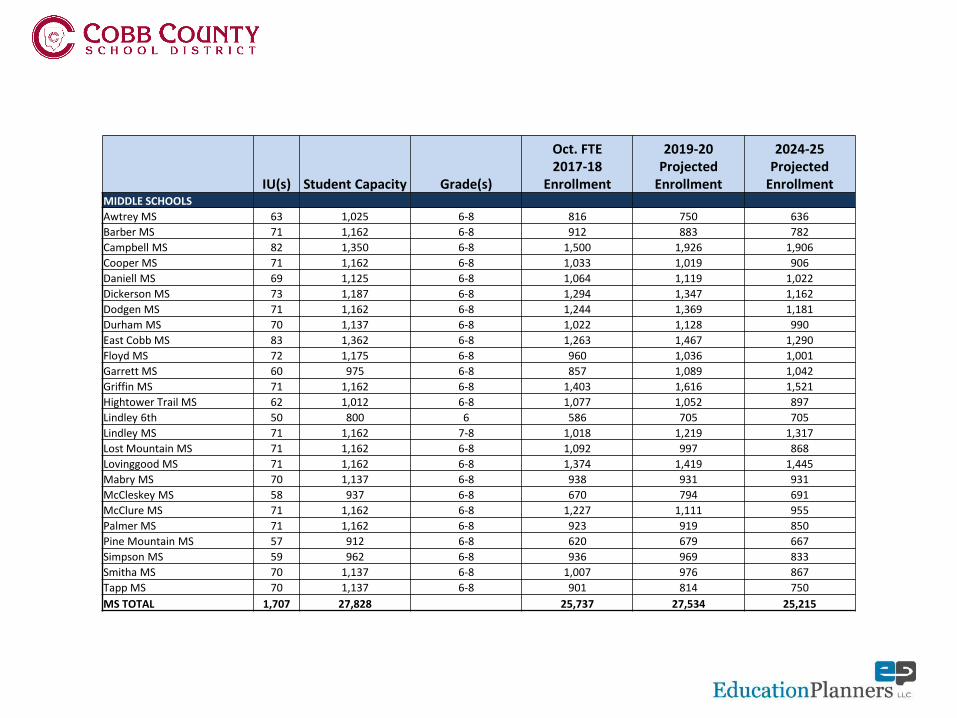
IU(s) Student Capacity Grade(s)
Oct. FTE 2017-18
Enrollment
2019-20 Projected
Enrollment
2024-25 Projected
EnrollmentMIDDLE SCHOOLS
Awtrey MS 63 1,025 6-8 816 750 636
Barber MS 71 1,162 6-8 912 883 782
Campbell MS 82 1,350 6-8 1,500 1,926 1,906
Cooper MS 71 1,162 6-8 1,033 1,019 906
Daniell MS 69 1,125 6-8 1,064 1,119 1,022
Dickerson MS 73 1,187 6-8 1,294 1,347 1,162
Dodgen MS 71 1,162 6-8 1,244 1,369 1,181
Durham MS 70 1,137 6-8 1,022 1,128 990
East Cobb MS 83 1,362 6-8 1,263 1,467 1,290
Floyd MS 72 1,175 6-8 960 1,036 1,001
Garrett MS 60 975 6-8 857 1,089 1,042
Griffin MS 71 1,162 6-8 1,403 1,616 1,521
Hightower Trail MS 62 1,012 6-8 1,077 1,052 897
Lindley 6th 50 800 6 586 705 705
Lindley MS 71 1,162 7-8 1,018 1,219 1,317
Lost Mountain MS 71 1,162 6-8 1,092 997 868
Lovinggood MS 71 1,162 6-8 1,374 1,419 1,445
Mabry MS 70 1,137 6-8 938 931 931
McCleskey MS 58 937 6-8 670 794 691
McClure MS 71 1,162 6-8 1,227 1,111 955
Palmer MS 71 1,162 6-8 923 919 850
Pine Mountain MS 57 912 6-8 620 679 667
Simpson MS 59 962 6-8 936 969 833
Smitha MS 70 1,137 6-8 1,007 976 867
Tapp MS 70 1,137 6-8 901 814 750
MS TOTAL 1,707 27,828 25,737 27,534 25,215
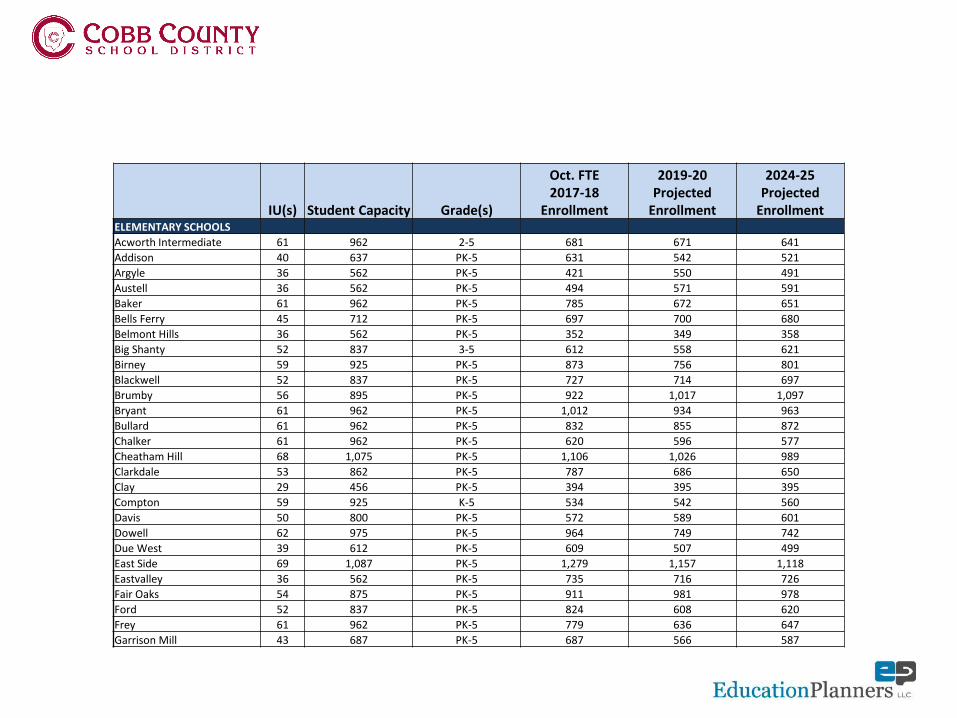
IU(s) Student Capacity Grade(s)
Oct. FTE 2017-18
Enrollment
2019-20 Projected
Enrollment
2024-25 Projected
EnrollmentELEMENTARY SCHOOLS
Acworth Intermediate 61 962 2-5 681 671 641
Addison 40 637 PK-5 631 542 521
Argyle 36 562 PK-5 421 550 491
Austell 36 562 PK-5 494 571 591
Baker 61 962 PK-5 785 672 651
Bells Ferry 45 712 PK-5 697 700 680
Belmont Hills 36 562 PK-5 352 349 358
Big Shanty 52 837 3-5 612 558 621
Birney 59 925 PK-5 873 756 801
Blackwell 52 837 PK-5 727 714 697
Brumby 56 895 PK-5 922 1,017 1,097
Bryant 61 962 PK-5 1,012 934 963
Bullard 61 962 PK-5 832 855 872
Chalker 61 962 PK-5 620 596 577
Cheatham Hill 68 1,075 PK-5 1,106 1,026 989
Clarkdale 53 862 PK-5 787 686 650
Clay 29 456 PK-5 394 395 395
Compton 59 925 K-5 534 542 560
Davis 50 800 PK-5 572 589 601
Dowell 62 975 PK-5 964 749 742
Due West 39 612 PK-5 609 507 499
East Side 69 1,087 PK-5 1,279 1,157 1,118
Eastvalley 36 562 PK-5 735 716 726
Fair Oaks 54 875 PK-5 911 981 978
Ford 52 837 PK-5 824 608 620
Frey 61 962 PK-5 779 636 647
Garrison Mill 43 687 PK-5 687 566 587
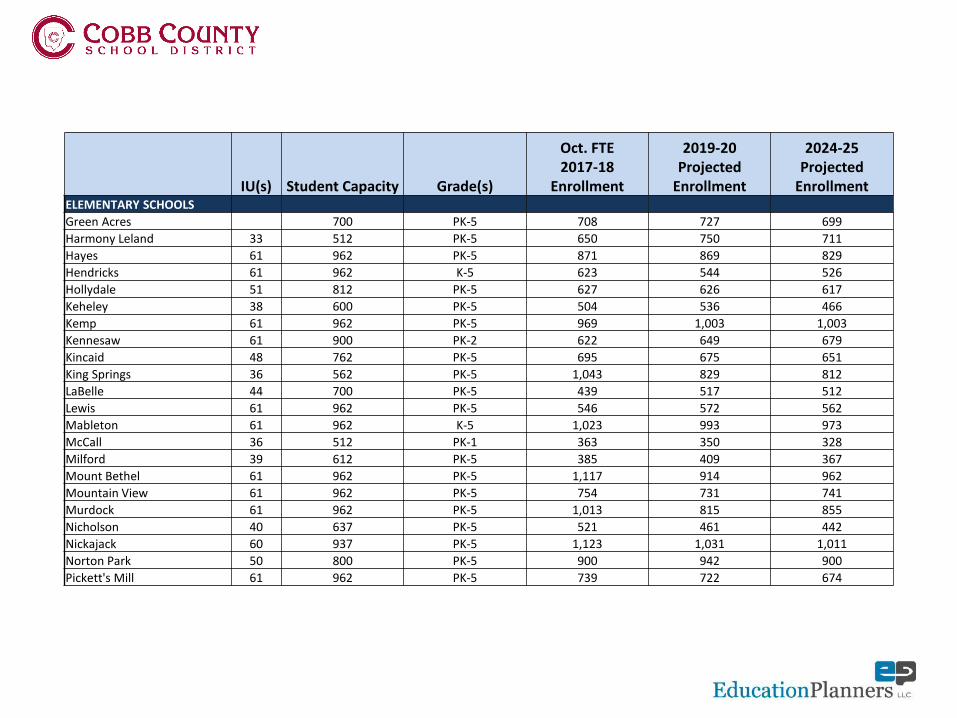
IU(s) Student Capacity Grade(s)
Oct. FTE 2017-18
Enrollment
2019-20 Projected
Enrollment
2024-25 Projected
EnrollmentELEMENTARY SCHOOLS
Green Acres 44 700 PK-5 708 727 699
Harmony Leland 33 512 PK-5 650 750 711
Hayes 61 962 PK-5 871 869 829
Hendricks 61 962 K-5 623 544 526
Hollydale 51 812 PK-5 627 626 617
Keheley 38 600 PK-5 504 536 466
Kemp 61 962 PK-5 969 1,003 1,003
Kennesaw 61 900 PK-2 622 649 679
Kincaid 48 762 PK-5 695 675 651
King Springs 36 562 PK-5 1,043 829 812
LaBelle 44 700 PK-5 439 517 512
Lewis 61 962 PK-5 546 572 562
Mableton 61 962 K-5 1,023 993 973
McCall 36 512 PK-1 363 350 328
Milford 39 612 PK-5 385 409 367
Mount Bethel 61 962 PK-5 1,117 914 962
Mountain View 61 962 PK-5 754 731 741
Murdock 61 962 PK-5 1,013 815 855
Nicholson 40 637 PK-5 521 461 442
Nickajack 60 937 PK-5 1,123 1,031 1,011
Norton Park 50 800 PK-5 900 942 900
Pickett's Mill 61 962 PK-5 739 722 674
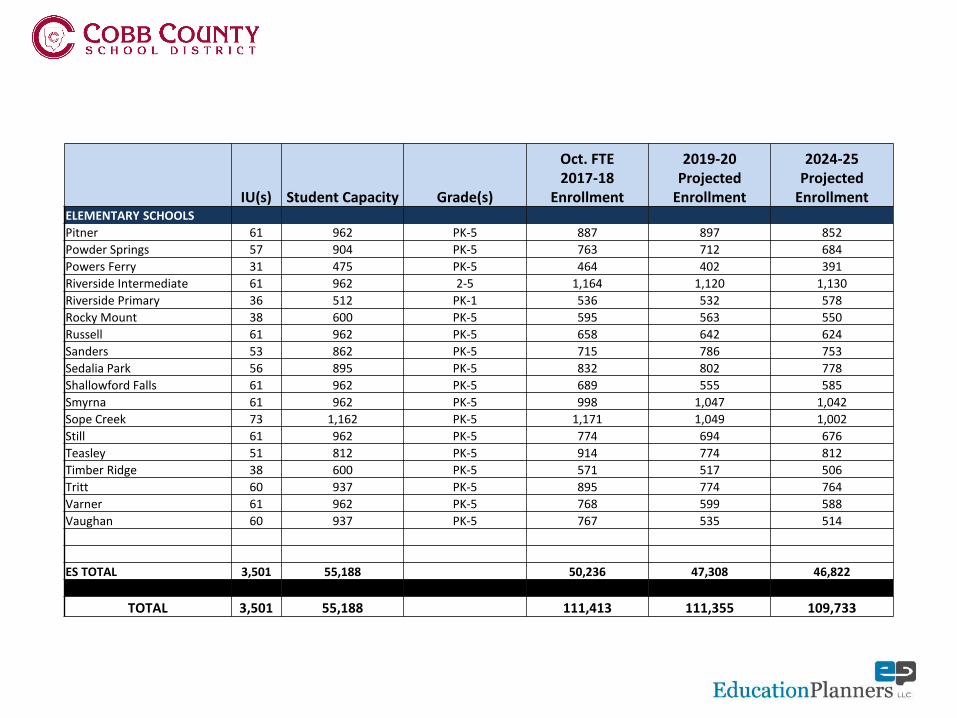
IU(s) Student Capacity Grade(s)
Oct. FTE 2017-18
Enrollment
2019-20 Projected
Enrollment
2024-25 Projected
EnrollmentELEMENTARY SCHOOLS
Pitner 61 962 PK-5 887 897 852
Powder Springs 57 904 PK-5 763 712 684
Powers Ferry 31 475 PK-5 464 402 391
Riverside Intermediate 61 962 2-5 1,164 1,120 1,130
Riverside Primary 36 512 PK-1 536 532 578
Rocky Mount 38 600 PK-5 595 563 550
Russell 61 962 PK-5 658 642 624
Sanders 53 862 PK-5 715 786 753
Sedalia Park 56 895 PK-5 832 802 778
Shallowford Falls 61 962 PK-5 689 555 585
Smyrna 61 962 PK-5 998 1,047 1,042
Sope Creek 73 1,162 PK-5 1,171 1,049 1,002
Still 61 962 PK-5 774 694 676
Teasley 51 812 PK-5 914 774 812
Timber Ridge 38 600 PK-5 571 517 506
Tritt 60 937 PK-5 895 774 764
Varner 61 962 PK-5 768 599 588
Vaughan 60 937 PK-5 767 535 514
ES TOTAL 3,501 55,188 50,236 47,308 46,822
TOTAL 3,501 55,188 111,413 111,355 109,733
ELEMENTARY SCHOOL ENROLLMENT
2017-18 2018-19 2019-20 2024-25
MIDDLE SCHOOL ENROLLMENT
2017-18 2018-19 2019-20 2024-25
HIGH SCHOOL ENROLLMENT
2017-18 2018-19 2019-20 2024-25
2017-18 2019-20 2024-252017-18 2019-20 2024-25
2017-18 2019-20 2024-25
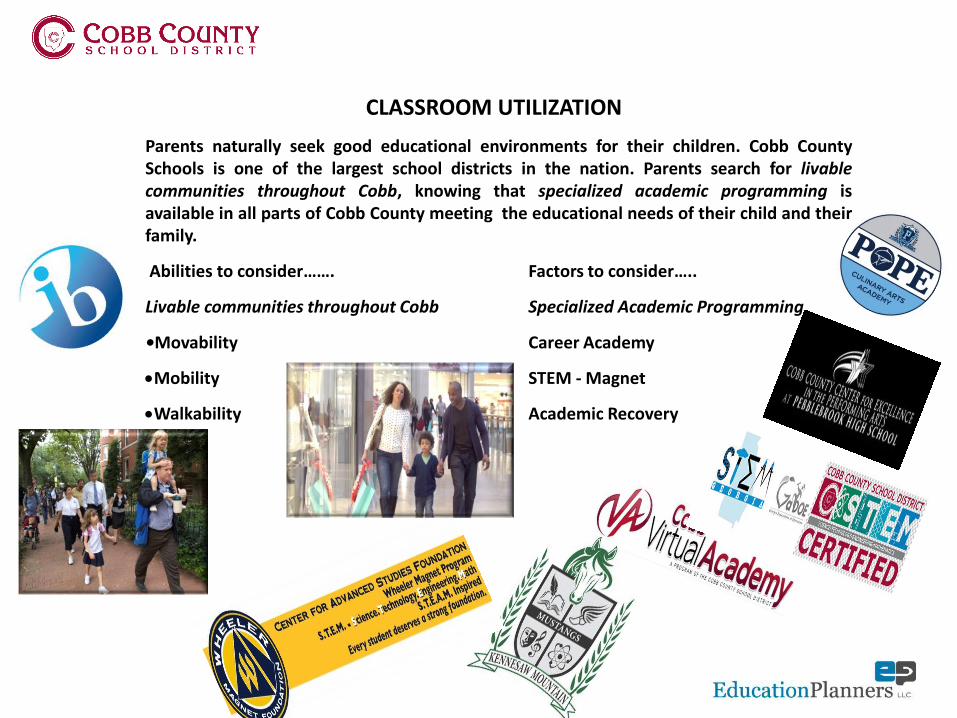
CLASSROOM UTILIZATION
Parents naturally seek good educational environments for their children. Cobb CountySchools is one of the largest school districts in the nation. Parents search for livablecommunities throughout Cobb, knowing that specialized academic programming isavailable in all parts of Cobb County meeting the educational needs of their child and theirfamily.
Abilities to consider……. Factors to consider…..
Livable communities throughout Cobb Specialized Academic Programming
•Movability Career Academy
Mobility STEM - Magnet
Walkability Academic Recovery
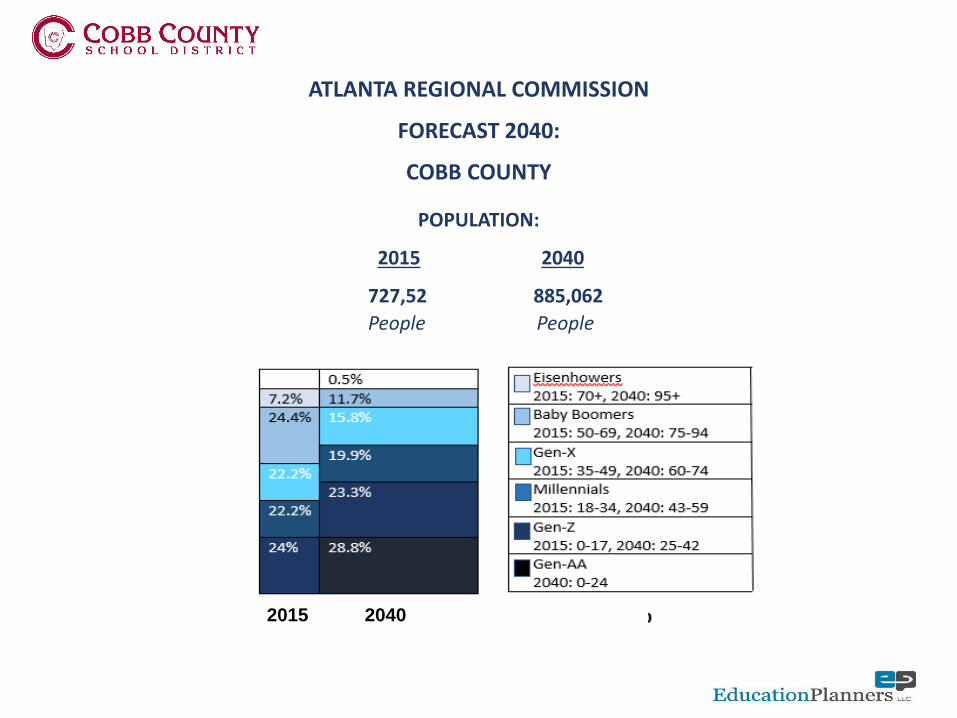
ATLANTA REGIONAL COMMISSION
FORECAST 2040:
COBB COUNTY
POPULATION:
2015 2040
727,52 885,062
People People
2015 2040
EXECUTIVE SUMMARY
• A trend of declining live births resulted in a “bubble” that will affect enrollment,already evident in the early elementary grades, we will monitor closely in thecoming years.
• Five-year projections are strong, in the coming months we will provide a more in-depth look going further to 2024-25.
• The school district with the successful passage of SPLOST V has positioned itselfto address the housing needs of students across the district.
• Because demographic projections can be affected by unforeseen economicfactors, the continued updating of this report helps to ensure accuracy.
• Signs of economic recovery continue to be positive.• There is a very noticeable development increase in senior adult living
construction throughout the county.• This yearly update still shows the original thinking has not changed. Enrollment
projections are as predicted.• Growth is occurring throughout the County.


![Report of the Committee emergency incident operations ... · Karen E. Strumlock, lntertek Testing Services, NY [RT] (Alt. to C. 1L Dodgen) Committee Scope: This Committee shall have](https://img.pdfslide.us/doc/110x75/5e6fd56a1b010a638e7e3f18/report-of-the-committee-emergency-incident-operations-karen-e-strumlock-lntertek.jpg)