Embed Size (px)
Citation preview
Abstract The Faraoni Level is a short-lived oxygen-
deficient event that took place during the latest Hau-
terivian. In order to improve our understanding of the
palaeoenvironmental conditions that occurred during
this event, we have analysed the contents of several
redox-sensitive trace elements (U, V, Mo, As, Co, Cd,
Cu, Zn, Ni, Pb, Cr) from bulk limestone samples of late
Hauterivian–early Barremian age from three reference
sections. U, V, Mo and As show consistent and sig-
nificant enrichments during the Faraoni event whereas
the other redox-sensitive trace elements analysed here
are not systematically enriched. In order to explain this
discrepant behaviour, we propose that the Faraoni
Level was deposited during a period of anoxic condi-
tions near the sediment–water interface. The distinc-
tive peaks in U, V, Mo and As contents are traceable
throughout the three studied sections and represent a
good correlation tool which helps to identify the
Faraoni Level and its equivalents in the western
Tethyan realm and outside of the Tethys. For example,
a peak in U contents in upper Hauterivian sediments of
the northwestern Pacific realm (ODP leg 185, site
1149) may well be an expression of the Faraoni event
in this particular basin.
Keywords Hauterivian Æ Barremian ÆChemostratigraphy Æ Western Tethys Æ Trace metals
Introduction
Since the first description by Cecca et al. (1994) of
an organic-rich guide level—the so-called Faraoni
Level—in upper Hauterivian (late Spathicrioceras ang-
ulicostatum ammonite zone) pelagic carbonates of the
Umbria-Marche Basin (Italy), it has been shown that
correlatable organic-rich levels occur throughout the
western Tethyan realm. Equivalents of the Faraoni Le-
vel have been identified on the Trento Plateau in Italy
(Cecca et al. 1996; Coccioni et al. 1998), in the Vocon-
tian Trough in France (Baudin et al. 1999), and in the
Swiss Prealpes (Busnardo et al. 2003). It is for this rea-
son that Baudin et al. (2002) associated this level with a
short-lived oxygen-deficient event in the western Teth-
yan realm. And following Baudin (2005), the Faraoni
Level and its equivalent can be qualified as an anoxic
event (compare this reference for a detailed biostrati-
graphic definition of this event). With the Valanginian
event (Erba et al. 2004), the Faraoni event is one of the
first palaeoceanographic events which led to major
change in the carbon cycle during the early Cretaceous.
The environmental circumstances leading to this
short-lived oxygen-deficient event in the late Hauteri-
vian are still not clear. In contrast to the anoxic events
S. Bodin ( ) Æ A. Godet Æ V. Matera Æ P. Steinmann ÆT. Adatte Æ K. B. FollmiInstitut de Geologie, Universite de Neuchatel,Rue Emile Argand 11, CP 158, 2009 Neuchatel, Switzerlande-mail: [email protected]
J. VermeulenGrand Rue, 04330 Barreme, France
S. GardinCNRS-UMR 5143 ‘‘Paleodiversite etPaleolenvironnement’’, case 104, Universite Paris 6,4 Place Jussieu, 75252 Paris Cedex 05, France
R. CoccioniIstituto di Geologia e Centro di Geobiologia dell’Universita,Campus Scientifico, Localita Crocicchia,61029 Urbino, Italy
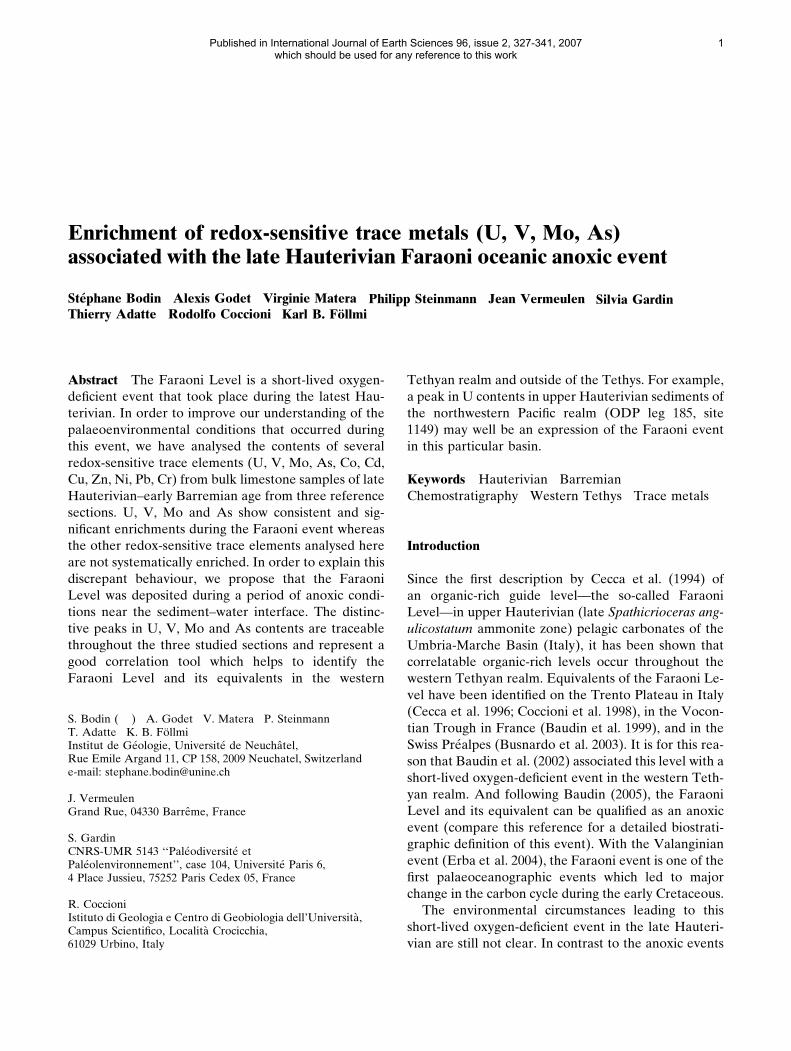
Enrichment of redox-sensitive trace metals (U, V, Mo, As)associated with the late Hauterivian Faraoni oceanic anoxic event
Stephane Bodin Æ Alexis Godet Æ Virginie Matera Æ Philipp Steinmann Æ Jean Vermeulen Æ Silvia GardinThierry Adatte Æ Rodolfo Coccioni Æ Karl B. Follmi
Published in International Journal of Earth Sciences 96, issue 2, 327-341, 2007which should be used for any reference to this work
1

in the Valanginian, the early Aptian, and near the
Cenomanian/Turonian boundary (e.g. Schlanger and
Jenkyns 1976; Schlanger et al. 1987; Lini et al. 1992;
Jones and Jenkyns 2001; Sanfourche and Baudin 2001),
the Faraoni Level is not accompanied by a major car-
bon isotope excursion toward more positive values, but
rather by a small long-term increase culminating
around the Faraoni event (Follmi et al. 1994; Erba
et al. 1999; Van de Schootbrugge et al. 2000; Company
et al. 2005; Godet et al. 2006). Furthermore, no major
volcanic episode has, of yet, been identified for the late
Hauterivian. This means that the classical model pos-
tulated for the origin of oceanic anoxic events in gen-
eral, i.e. increased volcanism leading to an increase in
atmospheric CO2, climate warming, increased weath-
ering and nutrient availability, higher productivity and
consequently higher preservation rates of organic
matter (e.g. Jenkyns 1999, 2003) cannot be applied in
this case.
The Faraoni event corresponds in time to the onset
of drowning episode D3 during the evolution of a
carbonate platform system located along the northern
Tethyan margin (Follmi et al. 1994). But, in contrast to
the Valanginian and the Aptian–Albian drowning
episodes (D1, D4 and D5), the drowning episode
D3—not being mirrored by a distinct positive excur-
sion in carbon isotopes, is also in need of an alternative
explanation (Van de Schootbrugge et al. 2000, 2003). It
is therefore important to identify the palaeoenviron-
mental conditions leading to the Faraoni event, whilst
also respecting the coeval drowning event on the
northern Tethyan carbonate platform, which may have
been linked to this anoxic event.
We investigated three (hemi-) pelagic key sections
representing a north–south transect through the wes-
tern Tethys and including micritic carbonates and
marls of the Hauterivian–Barremian transition with
regard to their redox-sensitive trace-element concen-
trations. The studied trace elements are uranium (U),
vanadium (V), molybdenum (Mo), arsenic (As), cobalt
(Co), cadmium (Cd), cupper (Cu), zinc (Zn), nickel
(Ni), lead (Pb) and chromium (Cr). Their behaviour
around the Faraoni Level is quite distinct and helps us
to improve our understanding of redox conditions and
changes therein in this basin during the Faraoni event.
In this paper, the term ‘‘Faraoni Level’’ and
‘‘Faraoni Level equivalent’’ refers to the interval
composed of organic-rich sediments and the interven-
ing carbonate beds that are associated with the Faraoni
oceanic anoxic event. The term ‘‘Faraoni Level’’ is
used when the lithological characteristics are the same
as in the type area (e.g. Cecca et al. 1994), whereas the
term ‘‘Faraoni Level equivalent’’ is used when the
lithology is different from that of the type area (i.e.
lacking a distinct enrichment in organic matter). The
redox classification of sedimentary environments used
here is adapted from Algeo and Maynard (2004) and
references therein. Thus, oxic, suboxic and anoxic
environments are characterized by >2.0, 2.0–0.2 and
< 0.2 ml O2 l–1H2O, respectively. Anoxia and euxinia
are distinguished by the absence or presence of free
H2S in the water column, respectively.
Studied sections and palaeogeographic setting
The studied sections were chosen according to the
following criteria: (1) presence of the Faraoni Level or
its equivalent; (2) good age control based on biostra-
tigraphy (ammonites, nannofossils); (3) presence of
pelagic carbonates; and (4) representative of different
areas of the western Tethys (Fig. 1).
The first studied section is the Fiume-Bosso section,
located between Urbino and Gubbio, near Cagli
(central Italy; see also Cecca et al. 1994). This section
represents the type section for the Faraoni Level
(Cecca et al. 1994). The lithology consists of pelagic
limestone and chert, which locally includes thin or-
ganic-rich marl layers and laminae, characteristic of the
Maiolica Formation. The Faraoni Level is composed
by a succession of three laminated black-shale layers
and intervening calcareous beds.
The Veveyse de Chatel-St Denis (VCD) is the sec-
ond studied section. It is situated in the canton of
Fribourg, along the Veveyse river, in western Swit-
zerland (see Busnardo et al. 2003, for a detailed geo-
graphic description). Its lithology consists of a
succession of alternating pelagic marls and marly
limestones, which are rich in macrofossils. The equiv-
alent of the Faraoni Level (identified by ammonite
dating) is represented by the ‘‘couches a poissons’’ (an
alternation of more or less organic-rich shale and marly
limestone, rich in fish fossils) (Busnardo et al. 2003).
The third studied section is along the ‘‘route d’An-
gles,’’ near Barreme in southeastern France, and is
situated in the Vocontian Trough (see Busnardo 1965,
for a detailed geographic description). Its lithology
consists of a fossiliferous, hemi-pelagic succession of
regularly alternating marlstone and limestone.
Ammonite dating indicates that the Faraoni Level
equivalent is situated around the bed AN 53. Black
shale has not been distinguished within this interval,
which is characterized by an alternation of limestone
and laminated shale. In the sedimentary interval
attributed to the P. mortilleti zone, no marls were
sampled due to poor outcrop quality.
2

During the late Hauterivian, the Angles and the
VCD sections were situated along the northern Teth-
yan margin. The VCD section is part of the Ultra-
helvetic realm, which is considered as the deeper
offshore prolongation of the Vocontian Trough to the
northeast (Trumpy 1960). The Fiume-Bosso section,
which is the deepest section, was situated in the
southern part of the Tethys, in the Umbria-Marche
Basin, remote from any continent.
Methods
ICP-MS analyses were performed on bulk rock sam-
ples from limestone and marlstone for all three sec-
tions. The limestone samples were sawed in order to
eliminate altered parts and rock veins. Then, powders
were obtained for both limestone and marls using a
mechanic agate crusher. A portion of approximately
250 mg was transferred into a digestion vessel and
10 ml of concentrated nitric acid (suprapur, Merck,
Darmstadt, Germany) were added. The sample was
digested in a microwave oven (MSL-Ethos plus,
Milestone) using the heating program recommended
by the EPA 3051 method. After cooling, the resulting
solution was filtered (0.45 lm) and diluted to 100 ml
with ultrapure water. For the limestone, dissolution
percentages determined after filtration were about
91% of initial sample weight in the Angles section,
83% in the VCD section, and 98% in the Fiume-Bosso
section. Moreover, no correlation was observed be-
tween the concentration of the different analysed
samples and the dissolution percentage obtained dur-
ing digestion procedure (e.g. U in Fig. 2). This shows
that the studied elements are present in the soluble
authigenic phase and are not due to partial leaching of
the detrital insoluble fraction.
In the marls, the dissolution percentages were close
to 50%. Mineralogical analyses indicate that clay and
quartz grains constitute the insoluble part of the rock.
No trace of carbonate is found, allowing us to postulate
that the entire authigenic portion of the rock is dis-
solved with this method.
A second dilution (1/20) was then performed prior
to analysis. To correct for matrix-induced ion signal
variation and instrumental drift, rhodium was used as
the internal standard. The element concentrations of
the acid digests were determined by ICP-MS (Perkin-
Elmer ELAN 6100, Perkin-Elmer Corp., Wellesley,
MA, USA) using a semi-quantitative mode (Total-
quant). Totalquant (TQ) is a simple, rapid and accu-
rate panoramic method based on full mass-spectra scan
methods and was successfully applied to the analysis of
various biological and environmental samples (Jitaru
et al. 2003) like, for instance, in sediments (Bayon
et al. 1998). TQ enables spectral interpretation of a full
mass spectrum by comparison with an internal re-
sponse table which includes assignment of element
intensities based on internal response factors and an
interpretation of interferences based on implemented
algorithms for numerical calculation of interference
corrections. The response table is usually updated be-
fore analysis by determination of a blank and one
standard solution. Two Certified Reference Materials
(CRM) (NIST-1640 natural water, LKSD-1 lake sedi-
ment from Canadian Centre for Mineral and Energy
Technology—CANMET—Canada) were measured to
evaluate the accuracy which is achieved in panoramic
analysis with the Elan 6100. Here we present the re-
sults obtained for the four principal trace elements
Fig. 1 a Actual location ofthe three studied sections. bPaleogeographic position ofthe three studied sections atthe Hauterivian–Barremianboundary. Palaeomapmodified from Hay et al.(1999). Modified from Bodinet al. (2006)
3

discussed in this study (V, Mo, As and U). The mean
recovery rates were determined for V, Mo and As (no
certified concentration values for U are available for
the two CRM) and were, for the NIST-1640 CRM
(N = 11) 101% for V, 99% for Mo and 101% for As,
and relative standard deviation (RSD) was better than
±9% for V, ±6% for Mo and ±7% for As; for the
LKSD-1 CRM (N = 12 digestions) mean recovery
rates were 90% for V, 89% for Mo and 110% for As
(for this CRM, recovery rates are based on certified
concentration values obtained by partial extraction
using concentrated HNO3 and HCl whereas we used
concentrated HNO3 digestion); analytical precision
(RSD) was about ±8% for V, ±9% for Mo and ±12%
for As.
Furthermore, multiple digestions (N = 10) of a
sample corresponding to the Faraoni Level of the
Angles section (bed AN 53-2) were analysed. The RSD
of these analyses were about ±15% for V, ±12% for
Mo, ±12% for As and ±3% for U. A detection limit
lower than 1 lg/kg was observed for the four trace
elements studied.
The content and the type of organic matter were
determined using Rock-Eval pyrolysis (Rock-Eval 6;
Behar et al. 2001). The parameters TOC (total organic
carbon in weight %) was obtained using the standard
temperature cycle. Two standards (an in-house stan-
dard and the ‘‘IFP 160000’’ standard from the Institut
Francais du Petrole, Paris, France) were passed at the
beginning and at the end of a batch of approximately
15 samples.
Results
Redox-sensitive trace elements
The data for U, V, Mo, As, Co, Cd, Cu, Zn, Ni, Pb and
Cr are shown in Tables 1 and 2 for limestone and marl
for the three sections.
The Fiume-Bosso section
In limestone samples, the data obtained for U, V, Mo
and As contents show comparable variations, with a
consistently low background level, contrasted by a
maximum in concentrations in and close to the Faraoni
Level (Fig. 3; Table 1). The average values for the
background level correspond to approximately 0.2, 0.9,
0.03 and 0.3 ppm and the maximum values to approx-
imately 3.1, 11.6, 0.5 and 3.0 ppm, for the U, V, Mo and
As contents, respectively.
The data obtained in the marlstones show equally a
clear enrichment of U, V, Mo and As around the
Faraoni Level (Table 2). The maximum values reach
15.4 ppm for U, 345.9 ppm for V, 61.8 ppm for Mo and
177.4 ppm for As, whereas background level are equal
to approximately 2.9, 54.1, 2.3 and 13.2 ppm, respec-
tively.
Despite a small negative shift in the upper part of
the section, the global trend of Co in limestone samples
seems to be more or less constant (Table 1), fluctuating
around 1.8 ppm. The Faraoni Level is marked by a
short negative shift toward 0.9 ppm. In the shale, the
Co curve shows a small positive shift within the Fara-
oni Level. A maximum of 106.6 ppm is present just
above the Faraoni Level (Table 2) whereas the back-
ground level values correspond to approximately
50 ppm.
For the other elements, only Cd and Zn show a
small positive shift in limestone levels within the
Faraoni Level. In the upper part of the section, a po-
sitive shift (up to 66.1 ppm) of Zn is remarked. In the
Faraoni shale samples, a positive shift of Cd, Cu, Zn,
Ni is present, with very high maximum values (10.5,
273.7, 1068.2 and 533.5 ppm, respectively). On the
other hand, it appears that Pb and Cr record a negative
shift.
The VCD section
In this section, the data obtained in limestone samples
for U, V, Mo and As contents show a behaviour similar
to that of the Fiume-Bosso section, with the difference
that peaks are less pronounced in comparison to the
0
0.5
1
1.5
2
2.5
3
3.5
70 75 80 85 90 95 100% of solubilization
U (
pp
m)
AnglesVeveyse de Châtel - St. DenisFiume-Bosso
Fig. 2 U (ppm) versus percentage of dissolution in the threestudied sections. No correlation is observed. See text fordiscussion
4

Table 1 Redox-sensitive trace elements analyses in limestones for the three studied sections (expressed in ppm). The dark grey bandindicates the Faraoni Level or its equivalent. No value is indicated when below the limit of detection
5

background level (Fig. 4; Table 1). We also note that
the background levels are generally higher in the lower
part of the section, below the ‘‘couches a poissons’’
(Faraoni Level equivalent), with the exception of Mo,
which shows an interval of increased values only in the
first 40 m of the measured section. Interestingly, U and
Table 1 continued
6
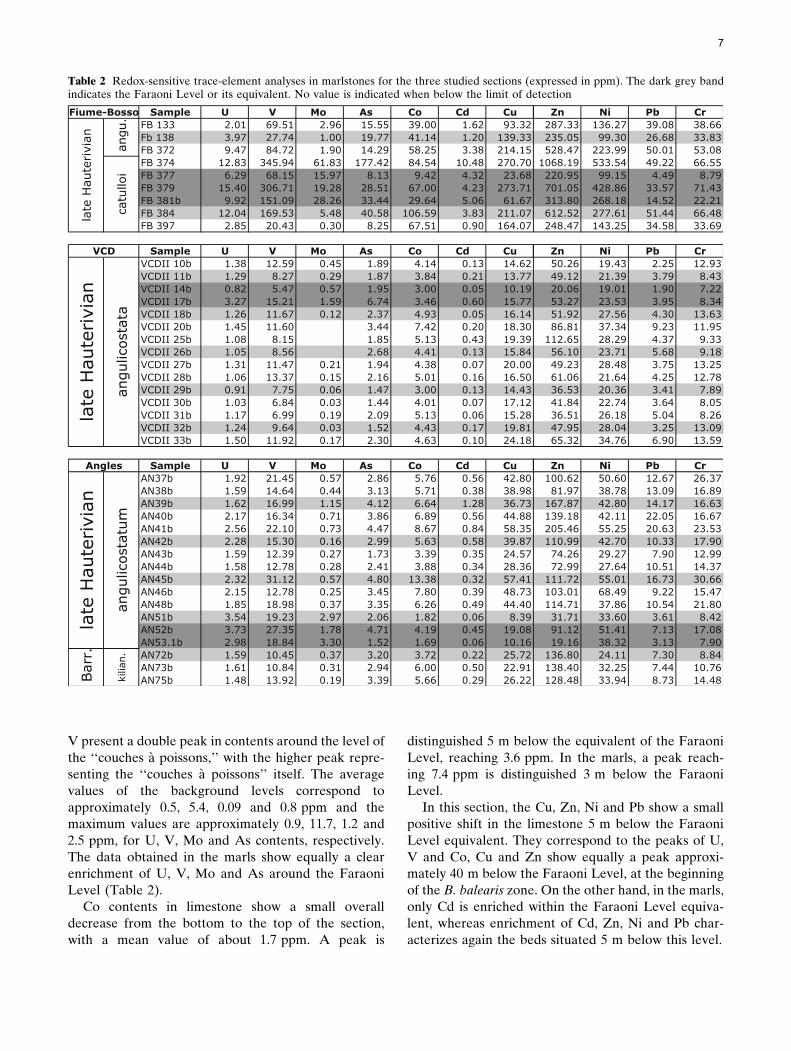
V present a double peak in contents around the level of
the ‘‘couches a poissons,’’ with the higher peak repre-
senting the ‘‘couches a poissons’’ itself. The average
values of the background levels correspond to
approximately 0.5, 5.4, 0.09 and 0.8 ppm and the
maximum values are approximately 0.9, 11.7, 1.2 and
2.5 ppm, for U, V, Mo and As contents, respectively.
The data obtained in the marls show equally a clear
enrichment of U, V, Mo and As around the Faraoni
Level (Table 2).
Co contents in limestone show a small overall
decrease from the bottom to the top of the section,
with a mean value of about 1.7 ppm. A peak is
distinguished 5 m below the equivalent of the Faraoni
Level, reaching 3.6 ppm. In the marls, a peak reach-
ing 7.4 ppm is distinguished 3 m below the Faraoni
Level.
In this section, the Cu, Zn, Ni and Pb show a small
positive shift in the limestone 5 m below the Faraoni
Level equivalent. They correspond to the peaks of U,
V and Co, Cu and Zn show equally a peak approxi-
mately 40 m below the Faraoni Level, at the beginning
of the B. balearis zone. On the other hand, in the marls,
only Cd is enriched within the Faraoni Level equiva-
lent, whereas enrichment of Cd, Zn, Ni and Pb char-
acterizes again the beds situated 5 m below this level.
Table 2 Redox-sensitive trace-element analyses in marlstones for the three studied sections (expressed in ppm). The dark grey bandindicates the Faraoni Level or its equivalent. No value is indicated when below the limit of detection
7
The Angles section
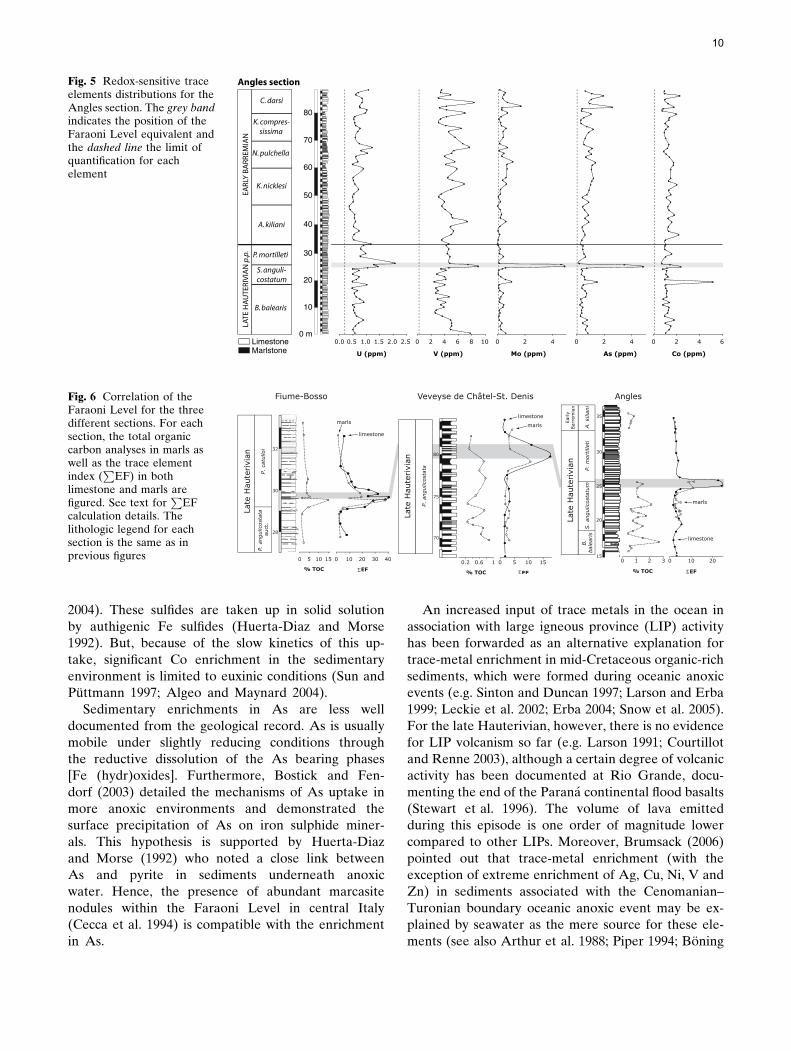
In the limestone samples, the trends in U, V, Mo and
As contents are comparable to the other two sections,
with peak values at the level of the Faraoni Level
equivalent (Fig. 5; Table 1). Whereas the background
levels are low and rather constant for U, Mo and As, V
contents show a more variable evolution, with a series
of positive excursions above the Faraoni Level equiv-
alent. The average values for the background levels are
at about 0.7, 4.5, 0.2 and 0.6 ppm and the maximum
values correspond to approximately 2.1, 8.9, 4.9 and
6.3 ppm, for U, V, Mo and As contents, respectively.
The data obtained in the marl samples show equally a
clear enrichment of U, V, Mo and As around the
Faraoni Level equivalent (Table 2).
The overall trend in Co contents in limestone is
more or less constant, with average values oscillating
around 1.3 ppm. A peak with a value of 5.1 ppm is
distinguished approximately 6 m below the equivalent
of the Faraoni Level (bed AN 38). In the same bed, a
small peak is present in the Mo and the As curves.
Within the equivalent of the Faraoni Level, a small
peak of Co reaching 2.4 ppm is distinguished. The data
obtained in the marls show equally a clear enrichment
of U, V, Mo and As around the Faraoni Level equiv-
alent (Table 2). In the marl samples, a remarkable
peak in Co contents characterizing the Faraoni Level
equivalent has not been observed. A maximum of
13.4 ppm is seen within bed AN 45b.
In this section, a clear peak of Cd, Zn, Ni and Pb
occurs within the limestone beds of the Faraoni Level
equivalent. Moreover, a peak of Ni and Pb marks bed
AN 38. On the other hand, no significant peak of these
elements has been found in the Faraoni Level equiv-
alent marls. We notice, however, that all these ele-
ments are more concentrated in the marls below the
Faraoni equivalent than above.
Total organic carbon
In the limestone samples, measured TOC values are
not higher than 0.1%. We will therefore restrict our
discussion to the results obtained in the marl samples
(see Fig. 6). In the Fiume-Bosso section, a maximum
TOC value of 14.8% has been measured in the thin
marl level interval just below the Faraoni Level.
Within the Faraoni Level, the average value of TOC is
close to 3.25%. These values are not significantly dif-
ferent from those obtained in marl samples above and
below the Faraoni Level.
In the VCD section, no major variations have
been measured (Fig. 6). The average value is close to
0.5% and the Faraoni Level equivalent TOC value
is equal to 0.31%. In the Angles section, no
major variation has been observed as well. The TOC
values are however higher and reach 2.63%. TOC
values in the Faraoni Level equivalent are close to
1.25%.
Discussion
Comparison between the three sections
Trends in U, V, Mo and As contents are all charac-
terized by pronounced positive peaks marking the
Faraoni Level and its equivalent, and are very distinct
relative to the measured intervals below and above this
level, representing the upper Hauterivian and the
lower Barremian. This positive peak is present in both
limestone and marl samples, despite differing back-
ground level values. For the trends in Co, Cd, Cu, Zn,
Ni, Pb and Cr contents, no significant overall variations
are observed and no specific enrichments are recorded
for the Faraoni Level and its equivalent apart from
local variations.
Behaviour of U, V, Mo, Co and As
Enrichments in U, V and Mo are well known for
numerous black shales of the Phanerozoic (e.g.
Brumsack and Gieskes 1983; Brumsack 1989, 2006;
Coveney et al. 1991; Sun and Puttmann 1997; Nijenhuis
et al. 1999; Warning and Brumsack 2000; Yarincik
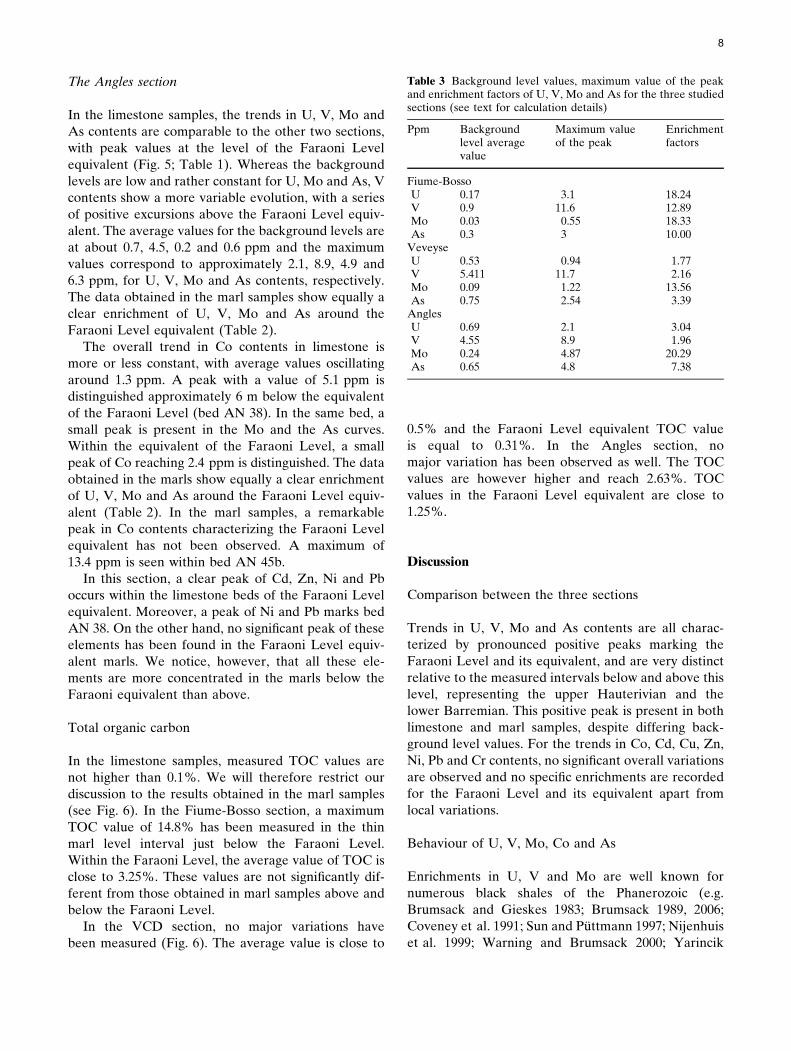
Table 3 Background level values, maximum value of the peakand enrichment factors of U, V, Mo and As for the three studiedsections (see text for calculation details)
Ppm Backgroundlevel averagevalue
Maximum valueof the peak
Enrichmentfactors
Fiume-BossoU 0.17 3.1 18.24V 0.9 11.6 12.89Mo 0.03 0.55 18.33As 0.3 3 10.00
VeveyseU 0.53 0.94 1.77V 5.411 11.7 2.16Mo 0.09 1.22 13.56As 0.75 2.54 3.39
AnglesU 0.69 2.1 3.04V 4.55 8.9 1.96Mo 0.24 4.87 20.29As 0.65 4.8 7.38
8

et al. 2000; Mangini et al. 2001; Tribovillard et al. 2004;
Wilde et al. 2004). U and V enrichments are usually
associated to anoxic to euxinic bottom-water condi-
tions during the time of deposition (e.g. Hastings et al.
1996; Morford and Emerson 1999; Mangini et al. 2001).
Under mildly reducing and anoxic conditions, U and V
may be removed from the ocean by the formation of
organo-metal ligands in humic acids; by crystalline
precipitation [UO2 and V2O3 or V(OH)3], and V may
also be removed by surface-adsorption processes (Al-
geo and Maynard 2004). For Mo, Algeo and Maynard
(2004) propose adsorption onto humic substances as a
main possible mechanism to transfer this element from
the water column into the sediment, and under euxinic
conditions, by a rapid uptake by authigenic/syngenetic
sulfides.
Overall, the solubility of these three elements de-
creases in the reduced state, and their precipitation and
enrichment in sediments is favored during periods of
anoxia (e.g. Yarincik et al. 2000; Mangini et al. 2001;
Algeo and Maynard 2004).
Co shows a more complex behaviour in the three
sections studied here. This element should behave
similar to U, V and Mo, and indeed, in oxygen-
depleted waters, Co forms an insoluble sulfide (CoS)
that is trapped in sediments (Algeo and Maynard
Fig. 3 Redox-sensitive traceelements distributions for theFiume-Bosso section. Thegrey band indicates theposition of the Faraoni Leveland the dashed line the limitof quantification for eachelement
Fig. 4 Redox-sensitive traceelements distributions for theVeveyse de Chatel-St Denissection. The grey bandindicates the position of the‘‘couche a poissons’’ (FaraoniLevel equivalent) and thedashed line the limit ofquantification for eachelement
9
2004). These sulfides are taken up in solid solution
by authigenic Fe sulfides (Huerta-Diaz and Morse
1992). But, because of the slow kinetics of this up-
take, significant Co enrichment in the sedimentary
environment is limited to euxinic conditions (Sun and
Puttmann 1997; Algeo and Maynard 2004).
Sedimentary enrichments in As are less well
documented from the geological record. As is usually
mobile under slightly reducing conditions through
the reductive dissolution of the As bearing phases
[Fe (hydr)oxides]. Furthermore, Bostick and Fen-
dorf (2003) detailed the mechanisms of As uptake in
more anoxic environments and demonstrated the
surface precipitation of As on iron sulphide miner-
als. This hypothesis is supported by Huerta-Diaz
and Morse (1992) who noted a close link between
As and pyrite in sediments underneath anoxic
water. Hence, the presence of abundant marcasite
nodules within the Faraoni Level in central Italy
(Cecca et al. 1994) is compatible with the enrichment
in As.
An increased input of trace metals in the ocean in
association with large igneous province (LIP) activity
has been forwarded as an alternative explanation for
trace-metal enrichment in mid-Cretaceous organic-rich
sediments, which were formed during oceanic anoxic
events (e.g. Sinton and Duncan 1997; Larson and Erba
1999; Leckie et al. 2002; Erba 2004; Snow et al. 2005).
For the late Hauterivian, however, there is no evidence
for LIP volcanism so far (e.g. Larson 1991; Courtillot
and Renne 2003), although a certain degree of volcanic
activity has been documented at Rio Grande, docu-
menting the end of the Parana continental flood basalts
(Stewart et al. 1996). The volume of lava emitted
during this episode is one order of magnitude lower
compared to other LIPs. Moreover, Brumsack (2006)
pointed out that trace-metal enrichment (with the
exception of extreme enrichment of Ag, Cu, Ni, V and
Zn) in sediments associated with the Cenomanian–
Turonian boundary oceanic anoxic event may be ex-
plained by seawater as the mere source for these ele-
ments (see also Arthur et al. 1988; Piper 1994; Boning
U (ppm)
0.0 0.5 1.0 1.5 2.0 2.5
V (ppm)
0 2 4 6 8 10
Mo (ppm)
0 2 4
As (ppm)
0 2 4
0 m
10
20
30
40
50
60
70
80
EARL
Y B
ARR
EMIA
NLA
TE H
AU
TERI
VIA
N p
.p.
B. balearis
P. mortilleti
S. anguli-costatum
A. kiliani
K. nicklesi
N. pulchella
K. compres-sissima
C. darsi
Angles section
Co (ppm)
0 2 4 6LimestoneMarlstone
Fig. 5 Redox-sensitive traceelements distributions for theAngles section. The grey bandindicates the position of theFaraoni Level equivalent andthe dashed line the limit ofquantification for eachelement
Fig. 6 Correlation of theFaraoni Level for the threedifferent sections. For eachsection, the total organiccarbon analyses in marls aswell as the trace elementindex (
PEF) in both
limestone and marls arefigured. See text for
PEF
calculation details. Thelithologic legend for eachsection is the same as inprevious figures
10

et al. 2004). The trace-metal enrichments calculated
for the Faraoni event (Table 3) are on the same order
of magnitude as those calculated for present-day
coastal upwelling zones and anoxic basins (e.g. Brum-
sack 2006). We therefore exclude volcanic activity as a
major source of trace-metal enrichment during the
Faraoni event.
Redox conditions during the Faraoni event
The behaviour of the redox-sensitive elements, mea-
sured in and around the Faraoni Level and its
equivalents, allows us to precise the redox conditions
that were present during the Faraoni event. The
enrichment of U, V, Mo and As are interpreted as a
signature of anoxic and euxinic conditions (Algeo and
Maynard 2004). The conservative behaviour of Co
during the Faraoni event with regard to its back-
ground level is characteristic of dysoxic to anoxic fa-
cies according to these authors. The Faraoni Level is
therefore clearly the expression of an anoxic event
(with eventually locally weakly euxinic conditions
such as is indicated at Angles with regard to a small
increase of the Co content). The fact that the other
redox-sensitive trace elements studied here are not
systematically enriched within the Faraoni Level
underlines the limit of our comprehension of this
system. Partial diagenetic remobilization or differ-
ences in sediment uptake processes may be evoked to
explain the non-systematic presence of enrichments in
the other studied trace elements. Such remobilization
processes are thus thought to be responsible of the
slight shift of Mo and As peak within the Angles
section. Further investigations are however needed to
resolve this problem.
Using total sulphur versus TOC plots, Baudin et al.
(2002) argued for dysoxic rather than for truly anoxic
conditions for the Faraoni Level. This observation to-
gether with the conservative behaviour of Co may hint
at the possibility that the anoxic conditions were not so
strong and closer to the dysoxia/anoxia threshold that
to the anoxia/euxinic threshold (O2 close to 0.2 ml/l of
H2O), with the exception of the section at Angles,
where conditions may have been more severe.
Local oxygen-deficient conditions below
the Faraoni Level
In the Angles and the VCD sections, isolated maxima
in trace-metal contents are recognized, notably below
the Faraoni Level equivalent. In the VCD section, U,
V, Zn, Ni and Co contents show a peak 5 m below the
Faraoni equivalent. In the Angles section, Mo, As, Ni,
Pb and Co contents show a peak 6 m below the Fara-
oni Level equivalent. These peaks are not correlated in
time between the two sections and could have resulted
from local changes in bottom-water oxygen conditions,
resulting in local anoxia or euxinia.
Enrichment factors
For each separated lithology (i.e. limestones or marls),
enrichment factors (EFs) were calculated for U, V, Mo
and As according to the following equation (see Ta-
ble 3; Fig. 6):
EFs ¼ ½Me�peak=½Me�background ð1Þ
In this equation, [Me]background represents the aver-
age value of the background level of the different
curves and [Me]peak is the maximum value of the
different peaks. The EFs thus obtained are coher-
ent with those obtained by Morford and Emerson
(1999) (for U, V and Mo, and based on refer-
ences therein) for anoxic conditions, representing
another clue for anoxic conditions during the Faraoni
event.
In order to compare the different sections, an
enrichment factor index (P
EF) is calculated by adding
the EFs of U, V and Mo (see Fig. 6). A clear peak is
thus obtained for the three sections for both litholo-
gies, underlining the higher uptake of U, V and Mo in
the sediment during the Faraoni event.
A remarkable feature of the Faraoni Level is the
alternation between limestones and laminated shales,
which is interpreted, in a first approximation, as the
results of variations in oxygen content (see Westphal
et al. 2004 for a review). The higher values of redox-
sensitive trace elements in the Faraoni shales com-
pared with the Faraoni limestones seem to confirm this
hypothesis. However, if we look at the enrichment
factors index (P
EF) calculated for both marls and
limestones (Fig. 6), such a dichotomy is not found. The
variation of these indices is more or less the same
within the same section. On the contrary, it seems that
the limestones are a little bit more enriched in redox-
sensitive trace elements than the marls during the
Faraoni event compared to ‘‘normal’’ conditions. The
higher redox-sensitive trace element content of the
marlstones (compared to the limestones) is thus not
induced by difference of synsedimentary redox condi-
tions between marlstones and limestones (as already
shown by Westphal et al. 2004), but is rather the result
of synsedimentary condensation or early diagenetic
processes. This underlines the importance of the
lithology effect on analyses and the need to consider
11
‘‘mono-lithologic’’ analyses when discussing temporal
variations.
In Fig. 6, where the TOC is plotted versus theP
EF,
we remark that TOC is only clearly enriched in the
Faraoni Level of the Fiume-Bosso section, whereasPEF shows a positive shift in all three sections. This
allows us to postulate that the enrichment of redox-
sensitive trace elements is a more conservative tracer
of anoxic conditions than TOC contents. This latter
may be more easily removed during diagenetic pro-
cesses.
Chemostratigraphic tools
The distinct enrichment of the redox-sensitive ele-
ments U, V, Mo and As in the sedimentary environ-
ment during the Faraoni event appears to be unique
for the examined time interval of the Late Hauteri-
vian–Early Barremian and is therefore useful as a
tracer of the Faraoni event within the Tethyan realm.
Outside the Tethyan realm, a distinct enrichment in
U contents occurs in sediments of the Late Hauterivian
of the Izu-Mariana margin, northwestern Pacific, in
ODP hole 1149b (ODP leg 185; Plank et al. 2000, up-
per part of the lithologic unit IV, interval 185-1149B-
19R-1; see Figs. F27, F72). This peak is associated with
a layer containing elevated quantities of euhedral
barite, along with dolomite rhombs and phosphatic fish
remains. Plank et al. (2000) argue that this peculiar
mineral assemblage indicates an episode of enhanced
organic-matter accumulation, which they correlate
with the Faraoni event. According to the data pre-
sented here, the enrichment in U represents a further
strong argument in favor of this assumption. This
suggests that the Faraoni event was not restricted to
the western Tethyan realm, but may also be recorded
in sediments of the northwestern Pacific. Further
investigations—especially in sediments of the southern
hemisphere—are required to confirm the global char-
acter of this event.
In the Fiume-Bosso section, the enrichment in U, V
and Mo contents began slightly before and ended
slightly after the Faraoni Level s.s. This may indicate
that the Faraoni anoxic event may have started slightly
earlier and lasted longer than the time associated with
the formation of the Faraoni Level itself. This would
signify that the organic-rich facies of the Faraoni Level
in the Italian sections does not reflect the entire period
of oxygen depletion, but rather the time of important
organic matter preservation and/or accumulation dur-
ing the culmination of this event. This may be taken
into account when tracing the equivalent of the Fara-
oni Level by using trace-metal enrichment in sections
were ammonites are absent or extremely rare. The
here described trace-metal enrichments trace the
Faraoni anoxic event rather than the Faraoni Level
itself.
Initiating factors of the Faraoni event
As recognized by Baudin et al. (2002) and Baudin
(2005), the Faraoni Level and its equivalent can be
qualified as an anoxic event. An important difference
between the Faraoni event and other Cretaceous
OAE’s consists, however, in the fact that the anoxic
event is not mirrored by a major shift in the carbon-
isotope record (e.g. Erba et al. 1999; Van de Schoo-
tbrugge et al. 2000; Company et al. 2005; Godet et al.
2006), but only by a small positive excursion (0.5&).
Godet et al. (2006) explain this attenuated signal by a
buffering effect on the carbon-isotope record exerted
by the large size of the oceanic dissolved inorganic
carbon reservoir. Furthermore, the classical scenario
invoking an episode of intensified volcanism and rein-
forced greenhouse conditions (e.g. Jenkyns 1999, 2003)
is difficult to apply to this peculiar event. As previously
said, there is no evidence for LIP volcanism during the
late Hauterivian so far, even if a certain degree of
volcanism has been documented in Rio Grande. This
volcanic activity is however one order of magnitude
lower than that associated with LIP (e.g. Larson 1991;
Courtillot and Renne 2003). We therefore consider the
Rio Grande volcanism as not responsible for the
Faraoni event, even if slightly stronger greenhouse
conditions may have been induced by this volcanic
episode.
As discussed by Baudin et al. (2002), the Faraoni
Level corresponds to the maximum flooding surface
(mfs) of the Ha6 sequence (Haq et al. 1987; Hard-
enbol et al. 1998). For the VCD section, Busnardo
et al. (2003) attributed the ‘‘couches a poissons’’ to
the transgressive surface of the Ha6 sequence, but A.
Strasser (Fribourg, personal communication) corre-
lates the same horizon also to the mfs of the Ha6
sequence (see also Bodin et al. 2006). The Ha6 mfs
corresponds to the maximum of a second-order
transgression (Haq et al. 1987; Hardenbol et al.
1998), which led to the connection of the Tethyan
and the Boreal realms, as is suggested by belemnite
migration patterns observed by Mutterlose and
Bornemann (2000) and the presence of boreal nan-
noplankton in the Angles section around the Faraoni
Level (Godet et al. 2006). This second-order trans-
gression may have lead to the flooding of large epi-
continental areas. Bodin et al. (2006) pointed out the
role of this mechanism as the main trigger for the
12
onset of anoxic conditions during the Faraoni anoxic
event, by increased nutrient delivery, and the related
increase in primary productivity (see also Company
et al. 2005). Baudin et al. (2002) also proposed in-
creased primary productivity as the prime factor
leading to the origin of the Faraoni event along the
line of the scenario proposed here.
Conclusions
Redox-sensitive trace elemental analysis is a fruitful
method to better understand and constrain anoxic
events. Indeed, the multi-element analysis discussed
here provides additional insight into the oxygenation
conditions during the Faraoni anoxic event and serves
as a promising correlation tool, especially if biostrati-
graphic information is lacking.
By comparing the behaviour of the redox-sensitive
trace elements with the specific enrichments in U, V
and Mo contents, the Faraoni Level appears to be the
expression of anoxic conditions at least near the
sediment–water interface. This interpretation is sup-
ported by the enrichment of As, which is largely
controlled by its sorption onto sulfide minerals in
anoxic environments (Bostick and Fendorf 2003). The
lack of systematic enrichment of Cd, Cu, Zn, Ni, Pb
and Cr may be related to diagenetic removal or un-
known synsedimentary differences in uptake pro-
cesses.
In the sections analysed, the distinct enrichments
in U, V and Mo are a feature characteristic of the
Faraoni Level, and are unique with regards to the
time interval of the late Hauterivian and the early
Barremian. We therefore propose to use this feature
to correlate the Faraoni Level throughout the entire
Tethys, and especially in sections where organic-rich
intervals are lacking such as in the section of Angles,
and to search for expressions of the Faraoni event
also in other basins. For example, a distinct enrich-
ment in U in sediments of late Hauterivian age in
the northwestern Pacific may well be correlated with
the Faraoni event (Plank et al. 2000; see Figs.
F27, F72).
According to the general behaviour of the redox-
sensitive trace elements in the three analysed sections,
the Faraoni Level may be the expression of a climax
situation during a longer period of steadily increasing
anoxia induced by a second-order sea level rise. The
mobilization of nutrients during this sea level rise may
have played an important role in the onset of the
Faraoni event.
Acknowledgments We thank B. Van de Schootbrugge,H. Mort, P. Linder and C. Rambeau for their help in the field,J. Charollais, H. Mort and F. Baudin for stimulating discussions,T. Monnier for help in the laboratory work and the team of the‘‘Reserve Geologique de Haute-Provence’’ for providing theauthorization for field work and sampling in this region. We alsothank E. Erba and J. Holemann for constructive criticism of themanuscript. Financial support from the Swiss National ScienceFoundation is gratefully acknowledged (projects 2100-067807/1and 200020-105206/1).
References
Algeo TJ, Maynard JB (2004) Trace-element behavior and redoxfacies in core shales of Upper Pennsylvanian Kansas-typecyclothems. Chem Geol 206:289–318
Arthur MA, Jenkyns HC, Brumsack H-J, Schlanger SO (1988)Stratigraphy, geochemistry, and paleoceanography of or-ganic carbon-rich Cretaceous sequences. In: Ginsburg RN,Beaudoin B (eds) Cretaceous resources, events andrhythms: background and plans for research. Proceedings ofARW, Kluwer Academic Publishers, Digne, France, pp. 75–119
Baudin F (2005) A Late Hauterivian short-lived anoxic event inthe Mediterranean Tethys: the ‘‘Faraoni Event’’. CR Geosci337:1532–1540
Baudin F, Bulot LG, Cecca F, Coccioni R, Gardin S, Renard M(1999) Un equivalent du ‘‘Niveau Faraoni’’ dans le bassin duSud-Est de la France, indice possible d’un evenement an-oxique fini-hauterivien etendu a la Tethys mediterraneenne.Bull Soc Geol Fr 170:487–498
Baudin F, Cecca F, Galeotti S, Coccioni R (2002) Palaeoenvi-ronmental controls of the distribution of organic matterwithin a Corg-rich marker bed (Faraoni Level, uppermostHauterivian, central Italy). Eclogae geologicae Helvetiae95:1–13
Bayon MM, Alonso JIG, Medel AS (1998) Enhanced semi-quantitative multi-analysis of trace elements in environ-mental samples using inductively coupled plasma massspectrometry. J Anal At Spectrom 13:277–282
Behar F, Beaumont V, Penteado HLD (2001) Rock-Eval 6technology: performances and developments. Oil Gas SciTechnol 56:111–134
Bodin S, Godet A, Follmi KB, Vermeulen J, Arnaud H, StrasserA, Fiet N, Adatte T (2006) The Late Hauterivian Faraonioceanic anoxic event in the western Tethys: evidence fromphosphorus burial rates. Palaeogeogr Palaeoclimatol Pal-aeoecol 235:238–257
Boning P, Brumsack H-J, Bottcher ME, Schnetger B, Kriete C,Kallmeyer J, Borchers SL (2004) Geochemistry of Peruviannear-surface sediments. Geochim Cosmochim Acta68:4429–4451
Bostick BC, Fendorf S (2003) Arsenite sorption on troilite (FeS)and pyrite (FeS2). Geochim Cosmochim Acta 67:909–921
Brumsack H-J (1989) Geochemistry of recent TOC-rich sedi-ments from the Gulf of California and the Black Sea. GeolRundsch 78:851–882
Brumsack H-J (2006) The trace metal content of recent organiccarbon-rich sediments: implications for Cretaceous blackshale formation. Palaeogeogr Palaeoclimatol Palaeoecol232:344–361
Brumsack H-J, Gieskes JM (1983) Interstitial water trace-ele-ment chemistry of laminated sediments of the Gulf of Cal-ifornia (Mexico). Mar Chem 14:89–106
13
Busnardo R (1965) Le stratotype du Barremien. Mem Bur RechGeol Min 34:101–116
Busnardo R, Charollais J, Weidmann M, Clavel B (2003) LeCretace inferieur de la Veveyse de Chatel (Ultrahelvetiquedes Prealpes externes; canton de Fribourg, Suisse). RevPaleobiol Geneve 22:1–174
Cecca F, Marini A, Pallini G, Baudin F, Begouen V (1994) Aguide-level of the uppermost Hauterivian (Lower Creta-ceous) in the pelagic succession of Umbria–Marche Apen-nines (Central Italy): the Faraoni Level. Riv Ital PaleontolStratigr 99:551–568
Cecca F, Galeotti S, Coccioni R, Erba E (1996) The equivalentof the ‘‘Faraoni Level’’ (uppermost Hauterivian, LowerCretaceous) recorded in the eastern part of Trento Plateau(Venetian southern Alps, Italy). Riv Ital Paleontol Stratigr102:417–424
Coccioni R, Baudin F, Cecca F, Chiari M, Galeotti S, Gardin S,Salvini G (1998) Integrated stratigraphic, palaeontological,and geochemical analysis of the uppermost HauterivianFaraoni Level in the Fiume Bosso section, Umbria–MarcheApennines, Italy. Cretaceous Res 19:1–23
Company M, Aguado R, Sandoval J, Tavera JM, Jimenez deCisneros C, Vera JA (2005) Biotic changes linked to a minoranoxic event (Faraoni Level, latest Hauterivian, EarlyCretaceous). Palaeogeogr Palaeoclimatol Palaeoecol224:186–199
Courtillot VE, Renne PR (2003) On the ages of flood basaltevents. C R Geosci 335:113–140
Coveney JRM, Lynn Watney W, Maples CG (1991) Contrastingdepositional models for Pennsylvanian black shale discernedfrom molybdenum abundances. Geology 19:147–150
Erba E (2004) Calcareous nannofossils and Mesozoic oceanicanoxic events. Mar Micropaleontol 52:85–106
Erba E, Channell JET, Claps M, Jones CE, Larson RL, OpdykeB, Premoli-Silva I, Riva A, Salvini G, Torriceli S (1999)Integrated stratigraphy of the Cismon APTICORE(Southern Alps, Italy): a ‘‘reference section’’ for the Bar-remian-Aptian interval at low latitudes. J Foraminiferal Res29:371–391
Erba E, Bartolini A, Larson RL (2004) Valanginian Weissertoceanic anoxic event. Geology 32:149–152
Follmi KB, Weissert H, Bisping M, Funk H (1994) Phospho-genesis, carbon-isotope stratigraphy, and carbonate-plat-form evolution along the Lower Cretaceous northernTethyan margin. Geol Soc Am Bull 106:729–746
Godet A, Bodin S, Follmi KB, Vermeulen J, Gardin S, Fiet N,Adatte T, Berner Z, Stuben D, Van de Schootbrugge B(2006) Evolution of the marine stable carbon-isotope recordduring the early Cretaceous: a focus on the late Hauterivianand Barremian in the Tethyan realm. Earth Planet Sci Lett242:254–271
Haq BU, Hardenbol J, Vail PR (1987) Chronology of fluctuatingsea levels since the Triassic. Science 235:1156–1167
Hardenbol J, Thierry J, Farley MB, de Graciansky P-C, VailPR (1998) Mesozoic and cenozoic sequence chronostrati-graphic framework of European Basins. In: de GracianskyP-C, Hardenbol J, Jacquin T, Vail PR (eds) Mesozoic andcenozoic sequence stratigraphy of European Basins. Spe-cial Publication Society for Sedimentary Geology, pp. 3–13
Hastings DW, Emerson SR, Mix AC (1996) Vanadium in fora-miniferal calcite as a tracer for changes in the areal extendof reducing sediments. Paleoceanography 11:665–678
Hay WW, DeConto R, Wold CN, Wilson KM, Voigt S, SchulzM, Wold-Rossby A, Dullo W-C, Ronov AB, BalukhovskyAN, Soeding E (1999) Alternative global Cretaceous
paleogeography. In: Barrera E, Johnson C (eds) The evo-lution of Cretaceous ocean/climate systems. GeologicalSociety of America Special Paper, p. 332
Huerta-Diaz MA, Morse JW (1992) Pyritization of trace metalsin anoxic marine sediments. Geochim Cosmochim Acta56:2681–2702
Jenkyns HC (1999) Mesozoic anoxic events and palaeoclimate.Zentralbl Geol Palaontol 1 Heft 7–9:943–949
Jenkyns HC (2003) Evidence for rapid climate change in theMesozoic–Palaeogene greenhouse world. Philos Trans RSoc Lond A 361:1885–1916
Jitaru P, Tirez K, De Brucker N (2003) Panoramic analysis formonitoring trace metals in natural waters by ICP-MS. AtSpectr 24:1–10
Jones CE, Jenkyns HC (2001) Seawater strontium isotopes,oceanic anoxic events, and seafloor hydrothermal activity inthe Jurassic and Cretaceous. Am J Sci 301:112–149
Larson RL (1991) Latest pulse of Earth: evidence for a mid-Cretaceous superplume. Geology 19:547–550
Larson RL, Erba E (1999) Onset of the mid-Cretaceous green-house in the Barremian–Aptian: igneous events and thebiological, sedimentary and geochemical responses. Pale-oceanography 14:663–678
Leckie RM, Bralower TJ, Cashman R (2002) Oceanic anoxicevents and plankton evolution: biotic response to tectonicforcing during the mid-Cretaceous. Paleoceanography17:PA000623
Lini A, Weissert H, Erba E (1992) The Valanginian carbonisotope event: a first episode of greenhouse climate condi-tions during the Cretaceous. Terra Nova 4:374–384
Mangini A, Jung M, Laukenmann S (2001) What do we learnfrom peaks of uranium and of manganese in deep sea sed-iments? Mar Geol 177:63–78
Morford JL, Emerson SR (1999) The geochemistry of redoxsensitive trace metals in sediments. Geochim CosmochimActa 63:1735–1750
Mutterlose J, Bornemann A (2000) Distribution and facies pat-terns of Lower Cretaceous sediments in northern Germany:a review. Cretaceous Res 21:733–759
Nijenhuis IA, Bosch H-J, Sinninghe Damste JS, Brumsack H-J,De Lange GJ (1999) Organic matter and trace element richsapropels and black shales: a geochemical comparison.Earth Planet Sci Lett 169:277–290
Piper DZ (1994) Seawater as the source of minor elements inblack shales, phosphorites and other sedimentary rocks.Chem Geol 114:95–114
Plank T, Ludden JN, Escutia C et al (2000) Proceeding of theOcean Drilling Program, Initial Reports, 185 [Online],Available from World Wide Web: http://www-odp.tamu.e-du/publications/185_IR/185ir.htm
Sanfourche J, Baudin F (2001) La genese des evenementsanoxiques de la periode moyenne du Cretace. Examen del’hypothese du meromictisme oceanique. Ann Soc GeolNord 8:107–119
Schlanger SO, Jenkyns HC (1976) Cretaceous oceanic anoxicevents: causes and consequences. Geologie en Mijnbouw55:179–184
Schlanger SO, Arthur MA, Jenkyns HC, Scholle PA (1987) TheCenomanian–Turonian oceanic anoxic event. I. Stratigraphyand distribution of organic-rich beds and the marine 13Cexcursion. In: Brooks J, Fleet AJ (eds) Marine petroleumsources rocks. Geological Society, London, Special Publi-cations, pp. 371–399
Sinton CW, Duncan RA (1997) Potential links between oceanplateau volcanism and global ocean anoxia at the Ceno-manian–Turonian boundary. Econ Geol 92:836–842
14
Snow LJ, Duncan RA, Bralower TJ (2005) Trace elementabundances in the Rock Canyon Anticline, Pueblo, Colo-rado, marine sedimentary section and their relationship toCaribbean plateau construction and oxygen anoxic event 2.Paleoceanography 20:PA3005
Stewart K, Turner S, Kelley S, Hawkesworth C, Kirstein L,Mantovani M (1996) 3-D, 40Ar–39Ar geochronology in theParana continental flood basalt province. Earth Planet SciLett 143:95–109
Sun Y, Puttmann W (1997) Metal accumulation during and afterdeposition of the Kupferschiefer from the SangerhausenBasin, Germany. Appl Geochem 12:577–592
Tribovillard N, Riboulleau A, Lyons T, Baudin F (2004) En-hanced trapping of molybdenum by sulfurized marine or-ganic matter of marine origin in Mesozoic limestones andshales. Chem Geol 213:385–401
Trumpy R (1960) Paleotectonic evolution of the Central andWestern Alps. Bull Geol Soc Am 71:843–908
Van de Schootbrugge B, Follmi KB, Bulot LG, Burns SJ (2000)Paleoceanographic changes during the early Cretaceous(Valanginian–Hauterivian): evidence from oxygen and car-bon stable isotopes. Earth Planet Sci Lett 181:15–31
Van de Schootbrugge B, Kuhn O, Adatte T, Steinmann P, FollmiKB (2003) Decoupling of P- and Corg-burial followingEarly Cretaceous (Valanginian–Hauterivian) platformdrowning along the NW Tethyan margin. Palaeogeogr Pal-aeoclimatol Palaeoecol 199:315–331
Warning B, Brumsack H-J (2000) Trace metal signatures ofeastern Mediterranean sapropels. Palaeogeogr Palaeocli-matol Palaeoecol 158:293–309
Westphal H, Munnecke A, Pross J, Herrle JO (2004) Multiproxyapproach to understanding the origin of Cretaceous pelagiclimestone-marl alternations (DSDP site 391, Blake-BahamaBasin). Sedimentology 51:109–126
Wilde P, Lyons TW, Quinby-Hunt MS (2004) Organic carbonproxies in black shales: molybdenum. Chem Geol 206:167–176
Yarincik KM, Murray RW, Lyons TW, Peterson LC, Haug GH(2000) Oxygenation history of bottom waters in the CariacoBasin, Venezuela, over the past 578,000 years: results fromredox-sensitive metals (Mo, V, Mn, and Fe). Paleoceanog-raphy 15:593–604
15


![GEOBIOLOGIA-prevencion.ppt [Modo de compatibilidad]rayonexlatinoamerica.com/articulos/geobiologia-prevencion.pdf · UN POCO DE HISTORIA GEA=Tierra BIOS=Vida GEOBIOLOGIA=Cienciadelavidadelatierra](https://img.pdfslide.us/doc/110x75/5b1658e87f8b9a4f6d8b736f/geobiologia-modo-de-compatibilidadrayonexlatinoamericacomarticulosgeobiologia-prevencionpdf.jpg)


![PHILIPPINE LAW CENTRAL_ the National Building Code of the Philippines [RA 6541]](https://img.pdfslide.us/doc/110x75/577cb9781a28aba7118d776f/philippine-law-central-the-national-building-code-of-the-philippines-ra-6541.jpg)