Embed Size (px)
Citation preview
Politecnico Di Milano
Department of Electronics, Information
and Bioengineering
Enrichment of City Accessibility
Maps with Crowdsourcing
Techniques
Master Dissertation of:
Ana-Maria Salai
Supervisor:
Prof. Sara Comai
Co-Supervisor:
Prof. Marco Brambilla
2015 - XXVIII

- 2 -

I
Abstract
Currently, one in six people in the European Union – around 80 million –
have a disability that ranges from mild to severe. Over one third of people
aged over 75 have disabilities that restrict them to some extent. These
numbers are set to rise as the EU population grows progressively older.
Most of these people are all too often prevented from fully participating in
society and contribute to the economy because of physical or other
barriers, as well as discrimination. Whilst the European Union raises new
policies regarding accessibility, creating an application which eases the life
of in need people is an important step in building accessible cities.
Large cities are built and designed based on the needs of mobile
people, architectural preferences and budgets. Unfortunately, this
constitutes a big disadvantaged for those with mobility disabilities.
Wheelchair users are regularly hindered by barriers from participating in
daily life on their own.
The purpose of this thesis is to develop a set of solutions for the
enrichment of geographical maps with information about the accessibility
of urban pedestrian for people with mobility problems. The Maps for Easy
Paths project (MEP), of which the thesis is part of, aims in creating a system
able to detect automatically non-accessible features in an urban
environment in order to compute a new accessible path to reach a
destination. The system makes use of a smartphone or tablet which will
guide the users with disabilities throughout the city by visualizing the
accessible path inside the application.
The research work presented in this thesis aims in solving this problem by
means of crowdsourcing and street view images. The process consists of
street view images which are sent to users via crowdsourcing platform and

II
are marked as accessible and non-accessible based on their feedback.
These images focuse on specific points (crossings, traffic lights and
intersections) and precise questions are being asked in order to determine
the accessibility of these points.
III
Sommario
Oggigiorno, una persona su sei nell'Unione europea - circa 80 milioni - ha
una disabilità che varia da lieve a grave. Oltre un terzo delle persone di età
superiore ai 75 anni hanno disabilità che li limitano in qualche modo.
Questi numeri sono destinati ad aumentare in quanto il numero di persone
anzioane dell'UE cresce progressivamente. La maggior parte di queste
persone sono troppo spesso impossibilitate a partecipare pienamente nella
società e contribuire alla sua economia, a causa di barriere fisiche o altro,
così come la discriminazione. L'Unione Europea solleva nuove politiche in
materia di accessibilità, creando così un'applicazione che facilita la vita
delle persone in stato di bisogno, il che e’ un notevole miglioramento per la
costruzione di città accessibili.
Le grandi città sono state costruite e progettate in base alle
esigenze delle persone senza problemi di mobilità, così come in base alle
preferenze architettoniche e il relativo budget. Purtroppo, ciò costituisce
un grosso svantaggio per le persone con disabilità motorie. Le sedie a
rotelle sono regolarmente ostacolate da barriere architettoniche, problema
che rende difficile la vita quotidiana e lo spostamento dei disabili per conto
proprio.
Lo scopo di questa tesi è quello di sviluppare un set di soluzioni per
l'arricchimento di mappe geografiche con informazioni sull'accessibilità di
percorsi pedonali urbani per le persone con problemi di motorietà. Le
Maps for Easy Paths, progetto (MEP) di cui la tesi fa parte, mira a creare un
sistema in grado di rilevare automaticamente le caratteristiche non
accessibili in un ambiente urbano, al fine di calcolare un nuovo percorso
accessibile e di raggiungere più facilmente una destinazione. Il sistema si
avvale di uno smartphone o tablet che guideranno gli utenti con disabilità
motorie in tutta la città, visualizzando il percorso accessibile all'interno
dell'applicazione.
Il lavoro di ricerca, presentato in questa tesi, mira a risolvere questo
problema tramite crowdsourcing e immagini di Google Street View. Il

IV
processo consiste nelle immagini di Street View che vengono inviate agli
utenti tramite piattaforma di crowdsourcing e contrassegnate come
accessibili e non accessibili, in base al loro feedback. Queste immagini si
concentrano su punti particolari (incroci, semafori e intersezioni) e
richieste specifiche in modo da definire l'accessibilità di questi punti.
V
Content
Chapter 1 ............................................................................................ - 1 -
Introduction ........................................................................................ - 1 -
1.1 Thesis goal..................................................................................... - 2 -
1.2 Structure of the thesis .................................................................... - 3 -
Chapter 2 ............................................................................................ - 5 -
Overview ............................................................................................. - 5 -
2.1 MEP Project ................................................................................... - 5 -
2.2 Thesis Work Phases ....................................................................... - 8 -
2.3 Literature Analysis ......................................................................... - 9 -
Chapter 3 .......................................................................................... - 12 -
State of the art .................................................................................. - 12 -
3.1 OpenStreetMap ........................................................................... - 12 -
3.2 Google Street View Image ........................................................... - 17 -
3.3 Crowdsourcing ............................................................................. - 19 -
Chapter 4 .......................................................................................... - 24 -
Requirements Analysis ...................................................................... - 24 -
Chapter 5 .......................................................................................... - 29 -
Design Phase ..................................................................................... - 29 -
VI
Chapter 6 .......................................................................................... - 41 -
Implementation ................................................................................ - 41 -
Chapter 7 .......................................................................................... - 64 -
User Interface ................................................................................... - 64 -
Chapter 8 .......................................................................................... - 70 -
Conclusion ......................................................................................... - 70 -
Chapter 9 .......................................................................................... - 72 -
Future Work ...................................................................................... - 72 -
9.1 Thesis Future Contributions .......................................................... - 72 -
9.2 MEP Project Future Contributions ................................................ - 78 -
Chapter 10 ........................................................................................ - 83 -
Bibliography ...................................................................................... - 83 -
Appendix A ........................................................................................ - 85 -
Appendix B ........................................................................................ - 87 -
VII
List of Figures
Figure 2.1: MEP Project ....................................................................... - 6 -
Figure 2.2: Thesis Work Phases ............................................................ - 8 -
Figure 3.1: OSM Drinking Water Example .......................................... - 14 -
Figure 3.2: Crossings .......................................................................... - 16 -
Figure 3.3: Traffic Signals................................................................... - 16 -
Figure 3.4: Task Life Cycle .................................................................. - 21 -
Figure 3.5: System Architecture ......................................................... - 22 -
Figure 5.1: Como City – Entire region ................................................. - 39 -
Figure 5.2: Como City – Considered region ......................................... - 39 -
Figure 6.1: Sequence Diagram ........................................................... - 41 -
Figure 6.2: Flowchart ......................................................................... - 45 -
Figure 6.3: Street Network ................................................................. - 49 -
Figure 6.4: Query representation on the map – high level .................. - 52 -
Figure 6.5: Query representation on the map – detailed level ............. - 52 -
Figure 7.2: Evaluation of street accessibility ....................................... - 68 -
Figure 7.3: Evaluation of sidewalk accessibility .................................. - 69 -
Figure A.1: Accessible Path ................................................................ - 85 -
VIII
List of Tables
Tabel 3.1: OSM Tags .......................................................................... - 13 -
Table 4.1: Accessibility Features ........................................................ - 26 -
Table 4.2: Framework of responses on attributes ............................... - 27 -
Table 6.1: XAPI Request Elements ...................................................... - 43 -
Table 6.2: Excluded Key Values .......................................................... - 47 -

IX
Chapter 1 - 1 -
- 1 -
Chapter 1
Introduction
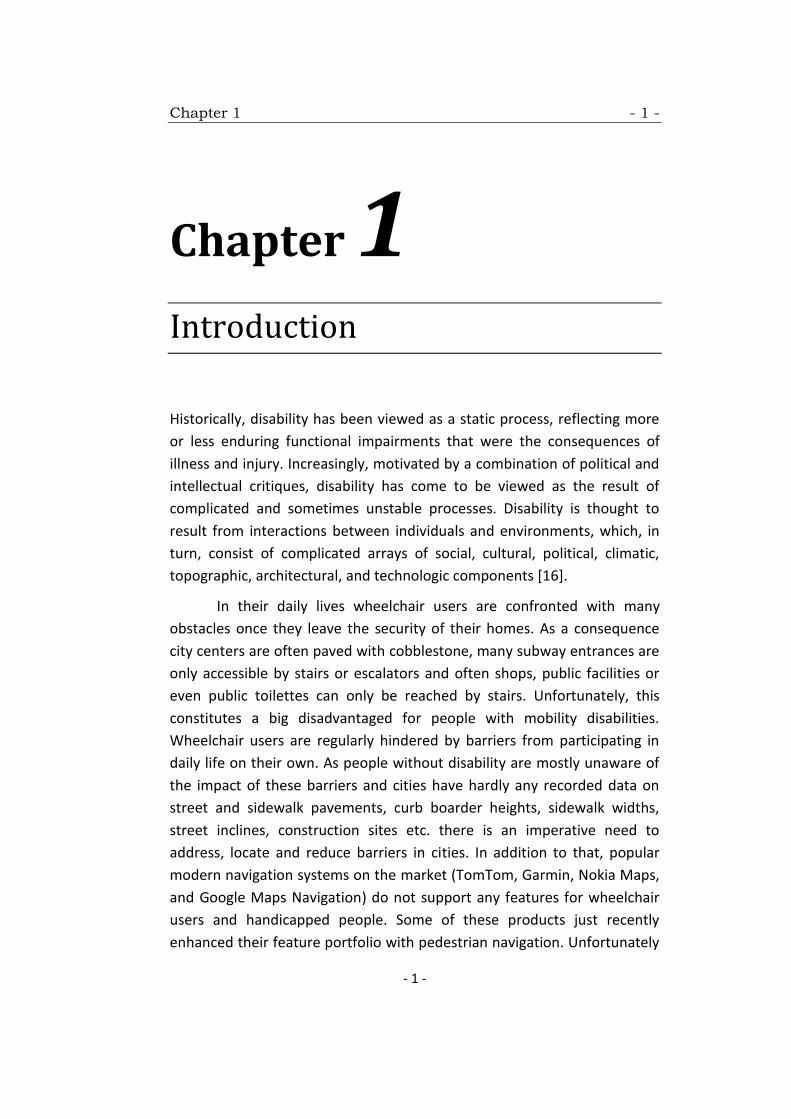
Historically, disability has been viewed as a static process, reflecting more
or less enduring functional impairments that were the consequences of
illness and injury. Increasingly, motivated by a combination of political and
intellectual critiques, disability has come to be viewed as the result of
complicated and sometimes unstable processes. Disability is thought to
result from interactions between individuals and environments, which, in
turn, consist of complicated arrays of social, cultural, political, climatic,
topographic, architectural, and technologic components [16].
In their daily lives wheelchair users are confronted with many
obstacles once they leave the security of their homes. As a consequence
city centers are often paved with cobblestone, many subway entrances are
only accessible by stairs or escalators and often shops, public facilities or
even public toilettes can only be reached by stairs. Unfortunately, this
constitutes a big disadvantaged for people with mobility disabilities.
Wheelchair users are regularly hindered by barriers from participating in
daily life on their own. As people without disability are mostly unaware of
the impact of these barriers and cities have hardly any recorded data on
street and sidewalk pavements, curb boarder heights, sidewalk widths,
street inclines, construction sites etc. there is an imperative need to
address, locate and reduce barriers in cities. In addition to that, popular
modern navigation systems on the market (TomTom, Garmin, Nokia Maps,
and Google Maps Navigation) do not support any features for wheelchair
users and handicapped people. Some of these products just recently
enhanced their feature portfolio with pedestrian navigation. Unfortunately
1.1 Thesis goal - 2 -
- 2 -
none of these enhancements include or support data sets that are able to
capture important street condition parameters such as incline, pavement
etc. which would all be necessary for efficient and accurate wheelchair and
handicapped navigation [14].
Currently, one in six people in the European Union – around 80 million –
have a disability that ranges from mild to severe. Over one third of people
aged over 75 have disabilities that restrict them to some extent. These
numbers are set to rise as the EU population grows progressively older.
Most of these people are all too often prevented from fully participating in
society and contribute to the economy because of physical or other
barriers, as well as discrimination. Whilst the European Union raises new
policies regarding accessibility, creating an application which eases the life
of in need people is an important step in building accessible cities.
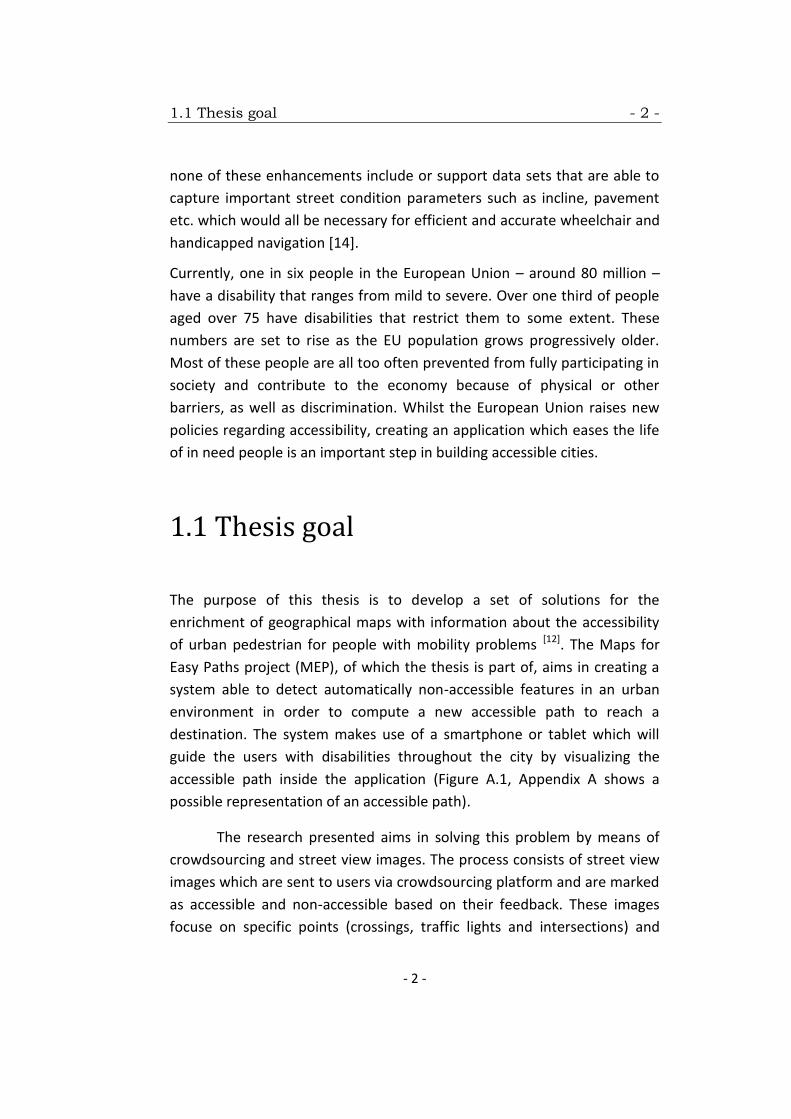
1.1 Thesis goal
The purpose of this thesis is to develop a set of solutions for the
enrichment of geographical maps with information about the accessibility
of urban pedestrian for people with mobility problems [12]. The Maps for
Easy Paths project (MEP), of which the thesis is part of, aims in creating a
system able to detect automatically non-accessible features in an urban
environment in order to compute a new accessible path to reach a
destination. The system makes use of a smartphone or tablet which will
guide the users with disabilities throughout the city by visualizing the
accessible path inside the application (Figure A.1, Appendix A shows a
possible representation of an accessible path).
The research presented aims in solving this problem by means of
crowdsourcing and street view images. The process consists of street view
images which are sent to users via crowdsourcing platform and are marked
as accessible and non-accessible based on their feedback. These images
focuse on specific points (crossings, traffic lights and intersections) and
1.2 Structure of the thesis - 3 -
- 3 -
precise questions are being asked in order to determine the accessibility of
these points.
The work done was developed based on the following objectives:
Download of images containing accessibility features which need to
be marked as accessible or non-accessible
Evaluation of images with crowdsourcing techniques
Enrichment of map with accessibility and non-accessibility info
1.2 Structure of the thesis
The structure of the thesis is as follows:
In Chapter 2, an Overview of the thesis is given by introducing the
MEP project, which this thesis is a contribution to. The goals of the
MEP project are presented, the main scenario is described and the
target users of the project are defined. Besides these, the thesis
work phases are also described at a high level of details together
with the selected papers used for research.
Chapter 3 contains the State of the Art, in which the focus will be on
the three main aspects used in the development of the thesis:
OpenStreetMap, Google Street View Image and Crowdsourcing. For
each of them I am offering the amount of details needed for a
better understanding of the future chapter.
Chapter 4 presents the Requirements Analysis, in which I will mainly
focus on the process of designing the questions related to the
accessibility of our points of interest.
In Chapter 5 I am presenting the Design Phase, more precisely the
high level implementation of the process: the OpenStreetMap tags
and bounding box used, details related to the Google Street View
Image link and the accessibility questions.
1.2 Structure of the thesis - 4 -
- 4 -
Chapter 6 offers the low level Implementation by highlighting the
most important pieces of Java software developed for downloading
the images required for the crowdsourcing platform.
In Chapter 7 I will present the User Interface, the end part with
which the users will interact in order to provide their feedback .
In Chapter 8 the Conclusion of the current thesis are presented.
Chapter 9 presents several suggestions as possible Future Works.
In Appendix A, I offer additional images to better highlight the
development of the thesis.
In Appendix B, I offer the entire developed software.
Chapter 2 - 5 -
- 5 -
Chapter 2
Overview
2.1 MEP Project
„Maps for Easy Paths”, or MEP, is a Polisocial project (a program of social
responsibility of Politecnico di Milano) that aims to develop an automated
system to enrich a public map with information about accessibility of city
routes (roads, sidewalks, walkways, etc.) through the active contribution
and participation of the following target users:
Users with mobility impairments: for the moment the focus is on
people with manual or electric wheelchairs but it can be extended
to elder people with or without mechanical support, injured or in
temporary situations of reduces mobility. Users can take part
actively by contributing to enrich the accessibility information or by
notifying any problems related to the paths.
Municipalities, local governments and organizations that might be
interested in this type of information to better plan interventions
and help in creating accessible cities. With respect to location, the
solutions presented in this thesis were designed for Como City.
2.1 MEP Project - 6 -
- 6 -
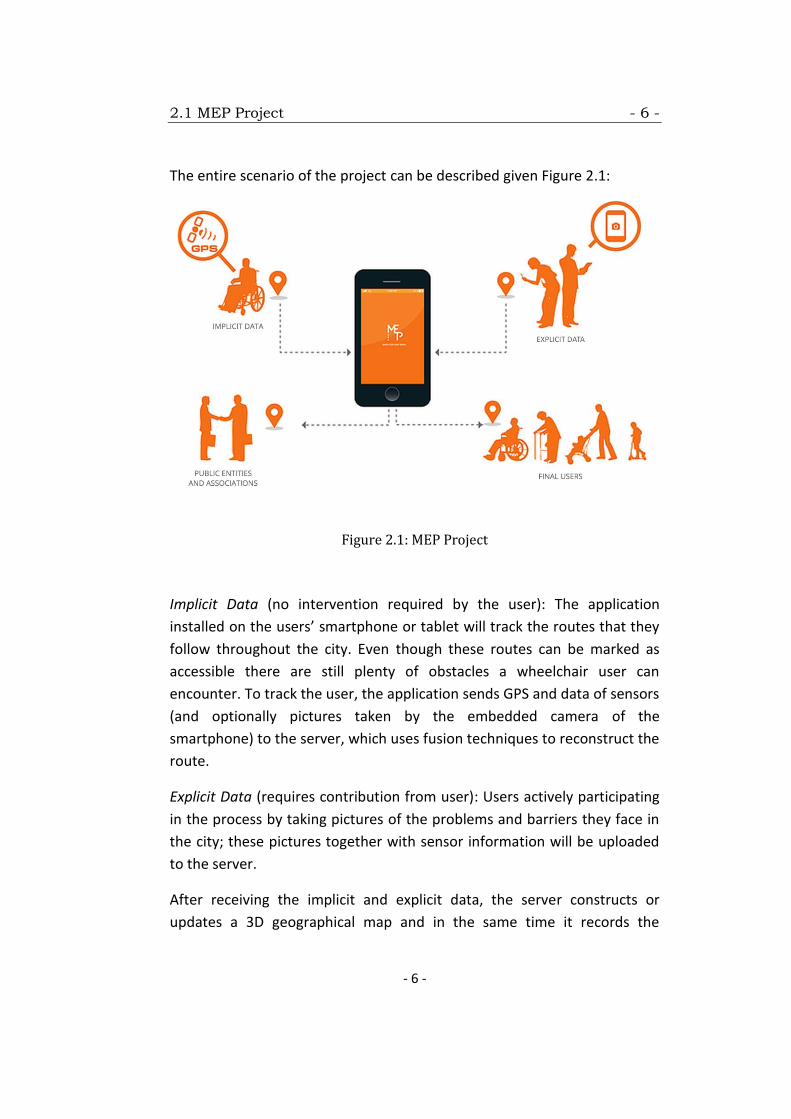
The entire scenario of the project can be described given Figure 2.1:
Figure 2.1: MEP Project
Implicit Data (no intervention required by the user): The application
installed on the users’ smartphone or tablet will track the routes that they
follow throughout the city. Even though these routes can be marked as
accessible there are still plenty of obstacles a wheelchair user can
encounter. To track the user, the application sends GPS and data of sensors
(and optionally pictures taken by the embedded camera of the
smartphone) to the server, which uses fusion techniques to reconstruct the
route.
Explicit Data (requires contribution from user): Users actively participating
in the process by taking pictures of the problems and barriers they face in
the city; these pictures together with sensor information will be uploaded
to the server.
After receiving the implicit and explicit data, the server constructs or
updates a 3D geographical map and in the same time it records the
2.1 MEP Project - 7 -
- 7 -
accessible routes and the corresponding information received from the
users.
The goal of the project is to offer support to people with motor
impairments in finding the accessible paths throughout the city and to help
them be able to move freely in the urban context without the limitations of
architectural barriers. The Final Users can range from people with manual
or electric wheelchair, elder people with or without mechanical support
and people in temporary situations of reduced mobility (injured or with
small children). By using this application, the users request an accessible
path to reach their destination; the server will be able to suggest them one
based on the collected data.
The aim of the application is not only for people with motor impairments,
but also for Public Institutions, Associations and Entities which focus and
deal with these aspects. It is desirable that these collected data will
improve not only the users’ life but also the urban design leading to
accessible cities.
The contribution brought by this thesis stands in the Explicit Data category
and focuses on determining what obstacles can people with motor
disabilities encounter on the streets by means of crowdsourcing. More
precisely, images from different key points in the city (intersections,
crossings, sidewalks) where accessibility problems can be encountered will
be collected and sent to users via crowdsourcing platform. Each image will
have several questions and based on the answers received we can
determine if we have an accessible or non-accessible situation and
consider it in the configuration of the accessible path.
The accessibility features considered were mostly related to crossings and
sidewalks: dropped kerbs, high curbsides, potholes, surface, drains and
many more. Since the images were retrieved using the Google Street View
Image API, one major rollback was the presence of people on the sidewalks
and cars on the crossings which were blocking the view (besides the fact
that some images were not offering a good view or were not having a good
quality).
2.2 Thesis Work Phases - 8 -
- 8 -
2.2 Thesis Work Phases
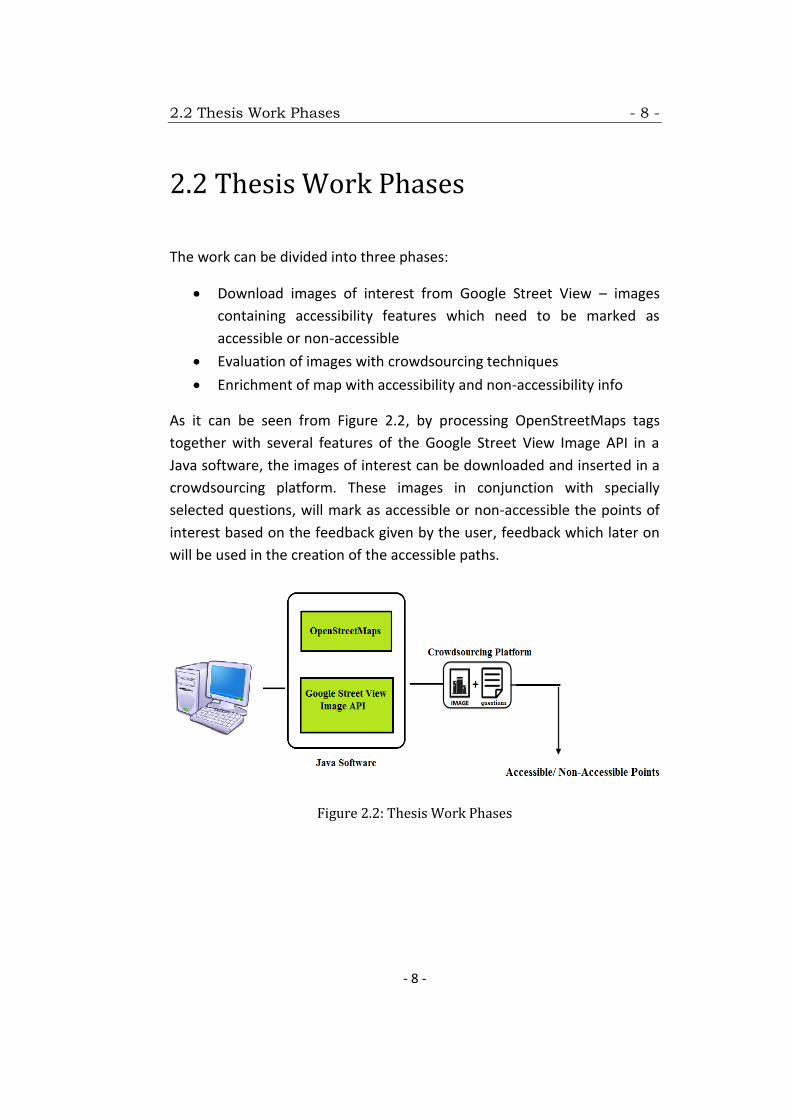
The work can be divided into three phases:
Download images of interest from Google Street View – images
containing accessibility features which need to be marked as
accessible or non-accessible
Evaluation of images with crowdsourcing techniques
Enrichment of map with accessibility and non-accessibility info
As it can be seen from Figure 2.2, by processing OpenStreetMaps tags
together with several features of the Google Street View Image API in a
Java software, the images of interest can be downloaded and inserted in a
crowdsourcing platform. These images in conjunction with specially
selected questions, will mark as accessible or non-accessible the points of
interest based on the feedback given by the user, feedback which later on
will be used in the creation of the accessible paths.
Figure 2.2: Thesis Work Phases
2.3 Literature Analysis - 9 -
- 9 -
2.3 Literature Analysis
In order to better understand the needs of people with disabilities and to
design important features of the application, specialized literature has
been reviewed. The following list presents the papers used for research
together with a short description of each:
Lorena de Freitas Pereira, Mariana Silva de Albuquerque, Licínio da
Silva Portugal, „Access of wheelchair users in sportive mega events:
the case of Confederation Cup” , E340XVIII Congreso Panamericano
de Ingeniería de Tránsito, Transporte y Logística (PANAM 2014) -
This article aims to evaluate the access conditions for wheelchair
users in sporting mega-events. It will show the characterization of
some attributes related with the walk, as the variables that express
them, showing the studied group particularities. The data collect
was made in June, 2013 by questionnaire application during the
competitions of The World Confederation Cup realized in Rio de
Janeiro on the Maracanã Stadium.
Rosemary D.F. Bromley , David L. Matthews and Colin J. Thomas,
„City centre accessibility for wheelchair users: The consumer
perspective and the planning implications” – The research
presented in this paper is drawn from 150 detailed interviews with
wheelchair users, to investigate and reassess current city centre
accessibility 10 years after the introduction of the Disability
Discrimination Act, 1995 in the UK. It shows that aspects of the built
environment, public transport, and current levels of shopper
activity continue to present a range of difficulties for wheelchair
users, which restrict their physical mobility in the city centre.
2.3 Literature Analysis - 10 -
- 10 -
Hugh Matthews, Linda Beale, Phil Picton and David Briggs,
„Modelling Access with GIS in Urban Systems (MAGUS): capturing
the experiences of wheelchair users” - This paper describes a project
undertaken with wheelchair users, which has developed, tested and
applied a Geographic Information System model. This model acts
both as a navigational device for wheelchairs users - enabling them
to make informed route choices through urban places - and as a
decision support and planning tool for urban planners - making
visible the ways in which built environments are often distorted and
hostile spaces for wheelchair users.
Christian Menkens, Julian Sussmann, Miriam Al-Ali, Emanuel
Breitsameter, Jelena Frtunik, Tobias Nendel, Tobias Schneiderbauer,
„EasyWheel - A Mobile Social Navigation and Support System for
Wheelchair Users”, Eighth International Conference on Information
Technology: New Generations, 2011 – The research work presented
in this paper tries to solve different problems faced by wheelchair
users by providing EasyWheel, a mobile social navigation and
support system. EasyWheel allows them to access accessibility
information for all sorts of points of interests (POI) such as public
transport, shops, etc and helps them navigate throughout a city
while following the ideal route and avoiding all barriers and
obstacles. To connect EasyWheel with the whole community of
wheelchair users and helpers, EasyWheel includes a social
community system including reputation and reward features
leveraging Facebook.
Carlos Cardonha, Diego Gallo, Priscilla Avegliano, Ricardo
Herrmann, Fernando Koch, and Sergio Borger, „A Crowdsourcing
Platform for the Construction of Accessibility Maps” - This article
presents a crowdsourcing platform that enables the collaborative
creation of accessibility maps. The platform provides means for
integration of different kind of data, collected automatically or with
2.3 Literature Analysis - 11 -
- 11 -
user intervention, to augment standard maps with accessibility
information.
Allan R. Meyers, Jennifer J. Anderson, Donald R. Miller, Kathy Shipp,
Helen Hoenig, „Barriers, facilitators, and access for wheelchair
users: substantive and methodologic lessons from a pilot study of
environmental effects” - A month-long intensive pilot study was
undertaken on a sample of adult wheelchair-users in Boston,
Massachusetts and Durham, North Carolina, USA. The study had
four objectives; to: (1) measure experiences of reaching and failing
to reach specific destinations; (2) measure encounters with
environmental facilitators and barriers, including both those
overcome and not overcome; (3) determine the frequencies of
destinations, facilitators, and barriers, and (4) test for consistency
between daily reports and retrospective reports. Full participation
entailed baseline and exit telephone interviews, and 28 daily
telephone contacts.
Chapter 3 - 12 -
- 12 -
Chapter 3
State of the art
In this chapter I will describe the State of the Art of the application and, in
particular, I will focus on three main aspects:
Open Street Map: I will describe the tools and approaches that aim
to facilitate the development of the application;
Google Street View Image Link: I will focus on the characteristics of
the link and downloading aspects;
Crowdsourcing: I will focus on general aspects related to
crowdsourcing.
3.1 OpenStreetMap
OpenStreetMap (OSM) is a collaborative project to create a free editable
map of the world[1]. It represents physical features on the ground (e.g.,
roads or buildings) using tags attached to its basic data structures (its
nodes, ways, and relations). Each tag describes a geographic attribute of
the feature being shown by that specific node, way or relation.
OpenStreetMap's free tagging system allows the map to include an
unlimited number of attributes describing each feature. The community
agrees on certain key and value combinations for the most commonly used
tags, which act as informal standards. However, users can create new tags
to improve the style of the map or to support analysis that rely on
previously unmapped attributes of the features.
3.1 OpenStreetMap - 13 -
- 13 -
A tag consists of a 'key' and a 'value':
The key describes a broad class of features (for example, highways).
The value details the specific feature that was generally classified by
the key (e.g. highway=motorway). If multiple values would be
needed for one key the semi-colon value separator may be used in
some situations[3].
Each tag describes a specific feature of a data element (nodes, ways and
relations) or changesets. Both the key and value are free format text fields.
In practice, however, there are agreed conventions of how tags are used
for most common purposes.
The key can be modified with a prefix, infix or suffix namespace to further
qualify it. Common namespaces are language specification and a date
namespace specification for name keys.
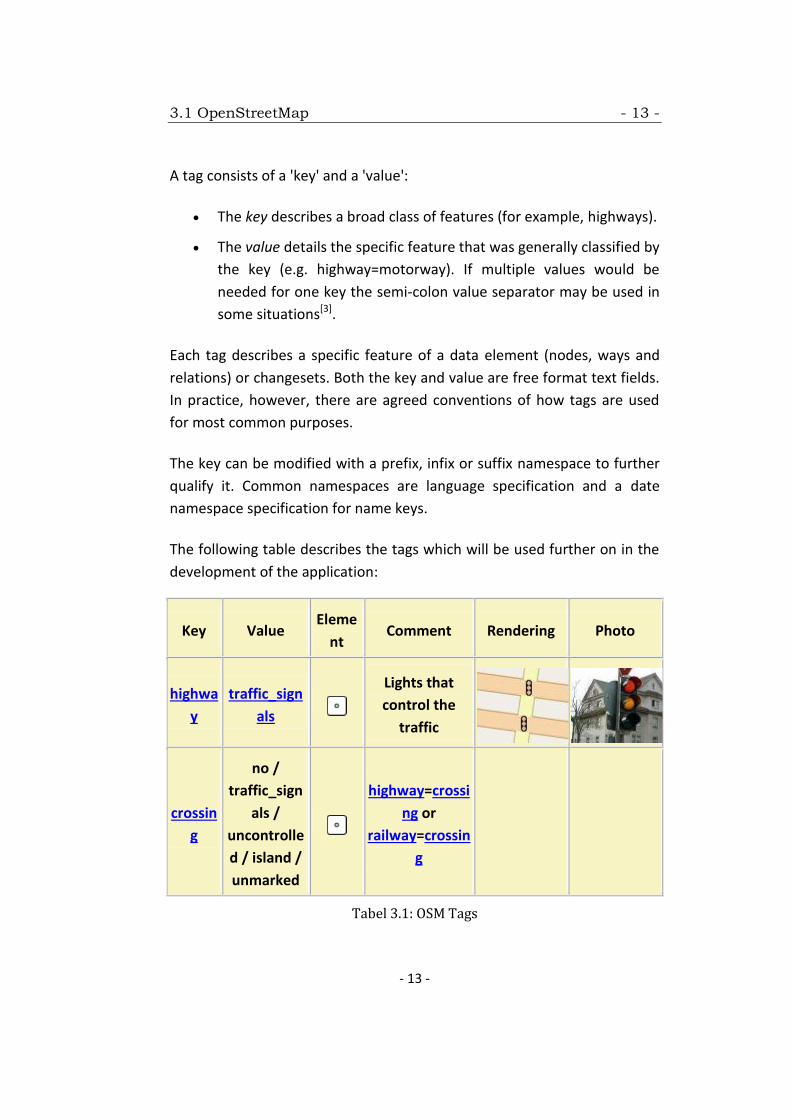
The following table describes the tags which will be used further on in the
development of the application:
Key Value Eleme
nt Comment Rendering Photo
highwa
y
traffic_sign
als
Lights that
control the
traffic
crossin
g
no /
traffic_sign
als /
uncontrolle
d / island /
unmarked
highway=crossi
ng or
railway=crossin
g
Tabel 3.1: OSM Tags
3.1 OpenStreetMap - 14 -
- 14 -
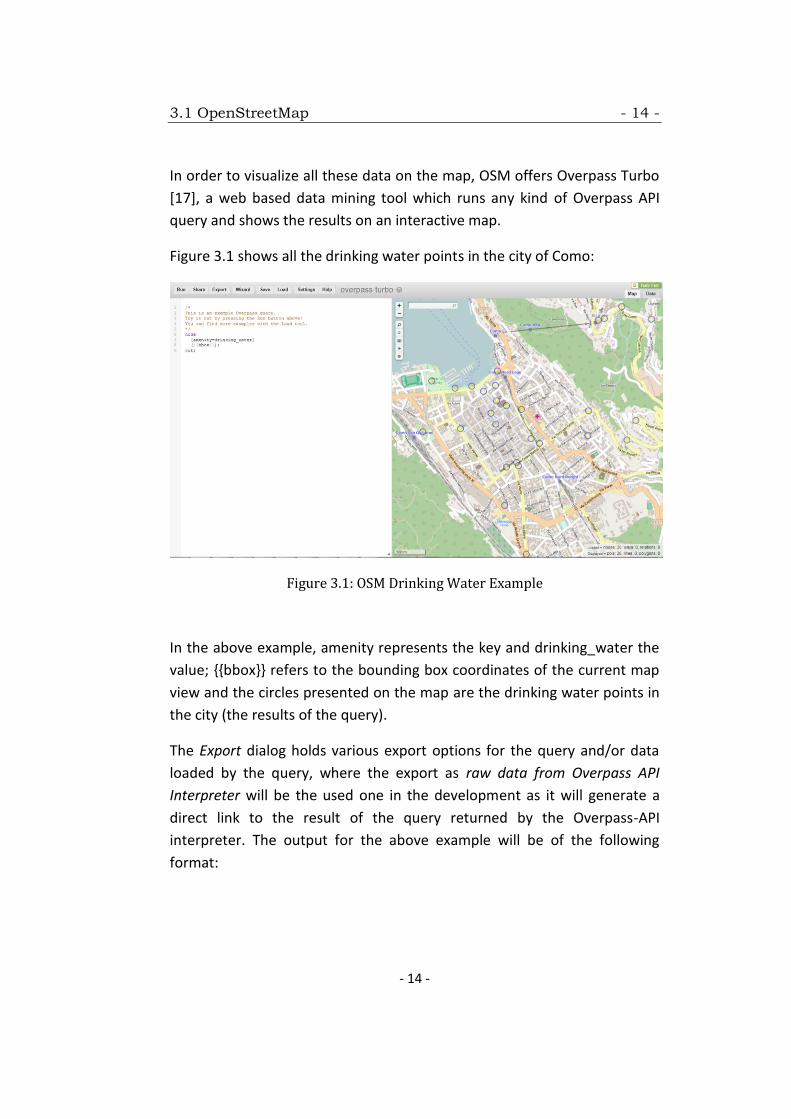
In order to visualize all these data on the map, OSM offers Overpass Turbo
[17], a web based data mining tool which runs any kind of Overpass API
query and shows the results on an interactive map.
Figure 3.1 shows all the drinking water points in the city of Como:
Figure 3.1: OSM Drinking Water Example
In the above example, amenity represents the key and drinking_water the
value; {{bbox}} refers to the bounding box coordinates of the current map
view and the circles presented on the map are the drinking water points in
the city (the results of the query).
The Export dialog holds various export options for the query and/or data
loaded by the query, where the export as raw data from Overpass API
Interpreter will be the used one in the development as it will generate a
direct link to the result of the query returned by the Overpass-API
interpreter. The output for the above example will be of the following
format:
3.1 OpenStreetMap - 15 -
- 15 -
/****************************************************************/
<osm generator="Overpass API" version="0.6">
<note>The data included in this document is from
www.openstreetmap.org. The data is made available under
ODbL.</note>
<meta osm_base="2015-09-09T15:35:02Z" />
<node lon="9.0884129" lat="45.8083123"
id="349815060">
<tag v="drinking_water" k="amenity" />
</node>
<node lon="9.0855381" lat="45.8066350"
id="1046778326">
<tag v="drinking_water" k="amenity" />
</node>
<node lon="9.0873451" lat="45.8087394"
id="1051805160">
<tag v="drinking_water" k="amenity" />
<tag v="yes" k="wheelchair" />
</node>
[....]
</osm>
/***************************************************************/
However, in order to generate all these data, queries like the one above
have to be written. Overpass QL is the second query language for the
Overpass API and was designed as an alternative to Overpass XML. It has a
C style syntax: The whole query source code is divided in statements, and
every statement ends with a semicolon.
3.1 OpenStreetMap - 16 -
- 16 -
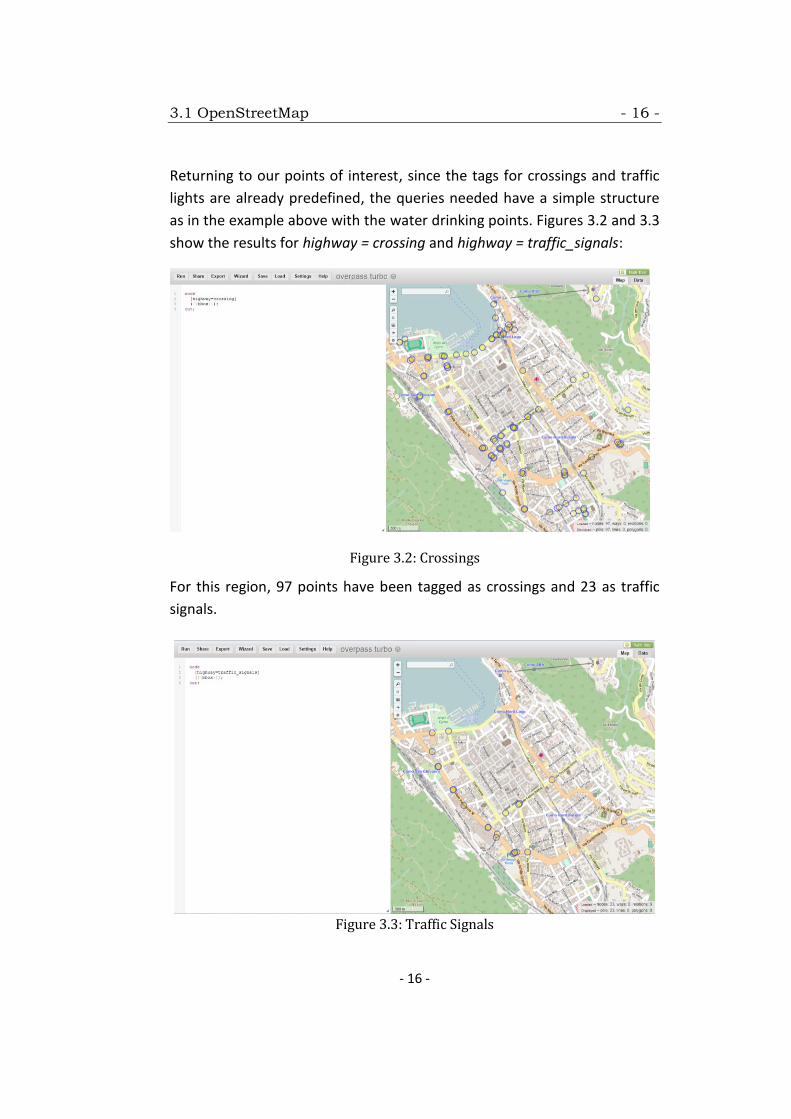
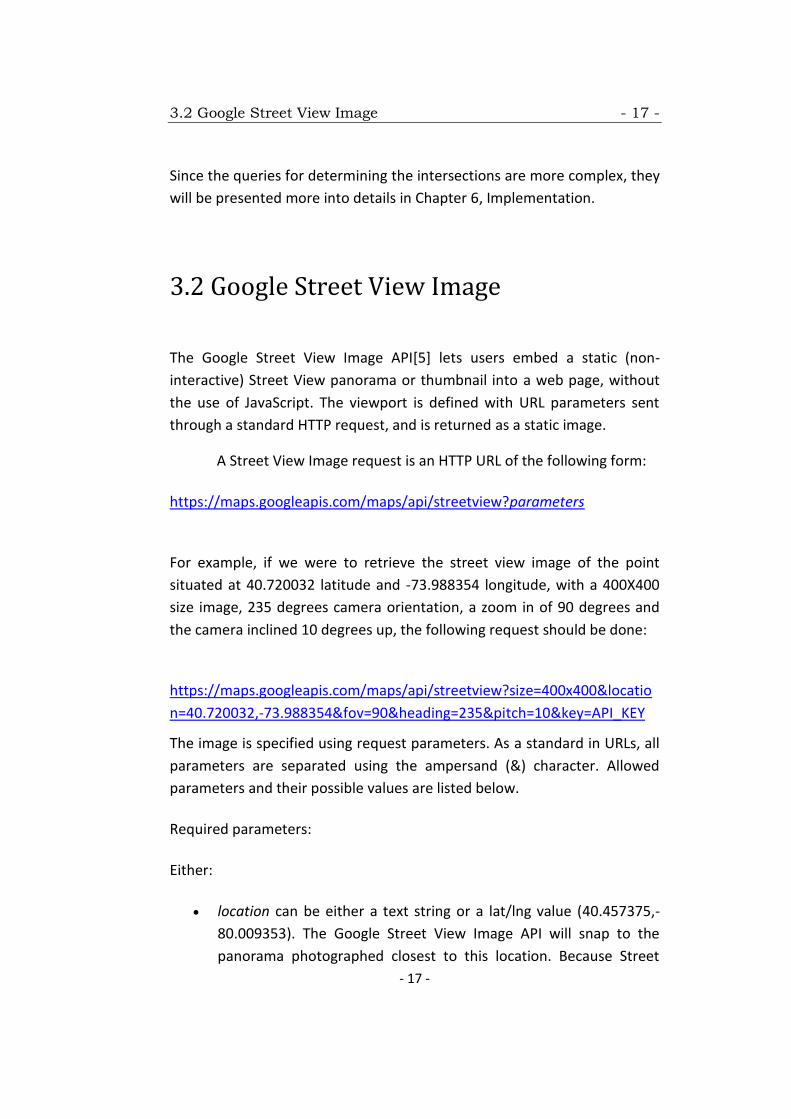
Returning to our points of interest, since the tags for crossings and traffic
lights are already predefined, the queries needed have a simple structure
as in the example above with the water drinking points. Figures 3.2 and 3.3
show the results for highway = crossing and highway = traffic_signals:
Figure 3.2: Crossings
For this region, 97 points have been tagged as crossings and 23 as traffic
signals.
Figure 3.3: Traffic Signals
3.2 Google Street View Image - 17 -
- 17 -
Since the queries for determining the intersections are more complex, they
will be presented more into details in Chapter 6, Implementation.
3.2 Google Street View Image
The Google Street View Image API[5] lets users embed a static (non-
interactive) Street View panorama or thumbnail into a web page, without
the use of JavaScript. The viewport is defined with URL parameters sent
through a standard HTTP request, and is returned as a static image.
A Street View Image request is an HTTP URL of the following form:
https://maps.googleapis.com/maps/api/streetview?parameters
For example, if we were to retrieve the street view image of the point
situated at 40.720032 latitude and -73.988354 longitude, with a 400X400
size image, 235 degrees camera orientation, a zoom in of 90 degrees and
the camera inclined 10 degrees up, the following request should be done:
https://maps.googleapis.com/maps/api/streetview?size=400x400&locatio
n=40.720032,-73.988354&fov=90&heading=235&pitch=10&key=API_KEY
The image is specified using request parameters. As a standard in URLs, all
parameters are separated using the ampersand (&) character. Allowed
parameters and their possible values are listed below.
Required parameters:
Either:
location can be either a text string or a lat/lng value (40.457375,-
80.009353). The Google Street View Image API will snap to the
panorama photographed closest to this location. Because Street
3.2 Google Street View Image - 18 -
- 18 -
View imagery is periodically refreshed, and photographs may be
taken from slightly different positions each time, it's possible that
the location may snap to a different panorama when imagery is
updated.
Or:
pano is a specific panorama ID. These are generally stable.
As well as:
size specifies the output size of the image in pixels. Size is specified
as {width}x{height} - for example, size=600x400 returns an image
600 pixels wide, and 400 high.
key allows to monitor the application's API usage in the Google
Developers Console; enables per-key instead of per-IP-address
quota limits and ensures that Google can contact the user about the
application if necessary.
Optional parameters:
heading indicates the compass heading of the camera. Accepted
values are from 0 to 360 (both values indicating North, with 90
indicating East, and 180 South). If no heading is specified, a value
will be calculated that directs the camera towards the specified
location, from the point at which the closest photograph was taken.
fov (default is 90) determines the horizontal field of view of the
image. The field of view is expressed in degrees, with a maximum
allowed value of 120. When dealing with a fixed-size viewport, as
with a Street View image of a set size, field of view in essence
represents zoom, with smaller numbers indicating a higher level of
zoom.
pitch (default is 0) specifies the up or down angle of the camera
relative to the Street View vehicle. This is often, but not always, flat
horizontal. Positive values angle the camera up (with 90 degrees
3.3 Crowdsourcing - 19 -
- 19 -
indicating straight up); negative values angle the camera down
(with -90 indicating straight down).
key (optional) identifies the application for quota purposes, and
enables reports in the Google Developers Console[5].
The key elements in the next phases of the development will be the
location, the heading, the fov and the pitch as I will try to calculate them
automatically.
3.3 Crowdsourcing
Crowdsearcher[6] is a platform for crowd management written in
Javascript running on Node.js server; this is a full-fledged event-based
system, which fits the need of a rule-based approach. It offers a plugin
environment to transparently interface with social networks and
crowdsourcing platforms and it implements the following model and
process.
In general, a crowdsourcing application can be modeled with three entities:
a requester, a system, and the crowd. The requester is the one who has a
problem he wants to solve with the crowd. In order to do so he has to
utilize the system in order to interact with the crowd.
The problem can comprehend a wide range of use cases: translating a text,
transcribing an audio file, annotating images, and so on. Currently,
crowdsourcing has been applied in very different scenarios like: databases,
information retrieval, artificial intelligence and social science. The crowd
can be very heterogeneous and can range from the anonymous worker on
Amazon Mechanical Turk to a friend on Facebook or an expert on a
Question Answering platform like StackOverflow. Usually the type of crowd
the requester wants to involve depends on the type of problem needed to
be solved.
3.3 Crowdsourcing - 20 -
- 20 -
This process allows to easily define multi-platform crowd-based
applications through step-by-step specifications, where the application is
initially configured and then automatically generated.
The crowdsourcing task configuration is covered by a 7-step wizard[6] that
guides the task designer in the creation of a task:
Task Design: The Task Design step consists in the selection of the
task types that will be performed in the task. These task types are
selected from an abstract model, crafted after a careful analysis of
the systems for human task executions and of many applications
and case studies.
Object Design: Object Design consists of defining the dataset which
is subject to the analysis. In particular, it entails schema definition,
instance collection and data cleaning (so as to eliminate irrelevant
objects and make them conforming to their schema). In this step
the designer can upload the set of objects of interest (e.g., as a
JSON file), possibly together with a partial ground truth, i.e. correct
solutions for a subset of the objects.
Execution Design: In this stage the user selects the execution
platform. Execution can be performed on traditional crowdsourcing
platforms (e.g., AMT), on social networks (e.g. Facebook), or on
custom user interfaces, implemented ad hoc by the designer.
Performer Selection or Invitation Design: In this step the user selects
the invitation channel to be used to invite people to perform the
task. The supported invitation platforms are:
Mail: the invitation is sent via email to a list of contacts
provided by the user;
Facebook: the invitation to perform the task is posted on
the wall of the user’s account;
3.3 Crowdsourcing - 21 -
- 21 -
Twitter: the invitation to perform the task is posted as a
tweet on the timeline of the user’s account.
Furthermore, a URL pointing to the task execution UI is generated
by the system and can be sent manually, at any time, by the
designer, through the channels of choice.
Adaptation Design: The adaptation design consists in the definition
of active rules that change the behavior of the system according to
the status of the execution of the crowdsourcing task.
Once the task is created, the Crowdsearcher takes the specification built in
this process and generates the data structure needed for its execution.
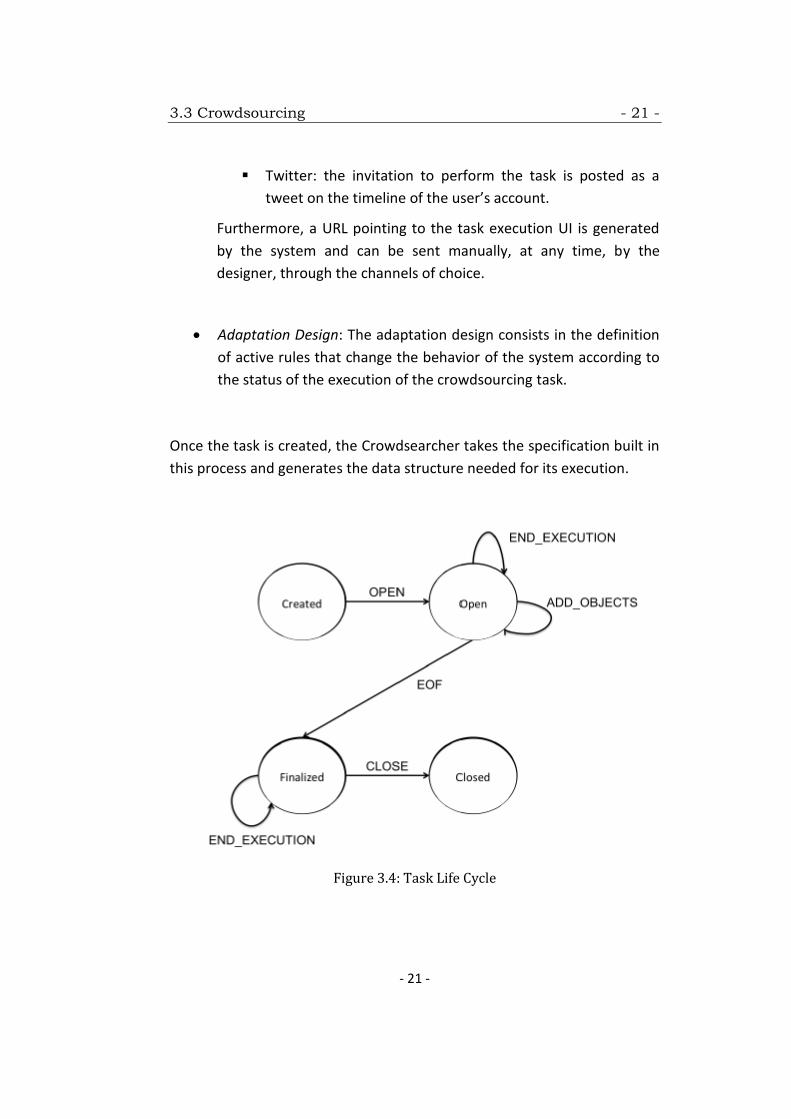
Figure 3.4: Task Life Cycle
3.3 Crowdsourcing - 22 -
- 22 -
Figure 3.4 shows the life cycle of a task in the system. The circles are the
states, while the arrows represent the internal events that occur in the
reactive environment. Once a task is created it only exists as a persistent
object in the database; in order to be executed by the workers it needs to
be deployed to the platforms through the opening phase. In this phase the
system instantiates the reactive rules and the data structure required for
the task control (the control mart) and deploys the task on the correct
platform; afterwards it creates the post on the social networks or the HIT
on Amazon Mechanical Turk. While the task is in the OPEN state, the
system receives and aggregates the answers given by the performer
(represented by the END_EXECUTION arrows). Once the EOF event is sent,
no more objects are accepted, but the answers are still collected. When,
according to some control rules, the evaluation is completed, the task is
closed.
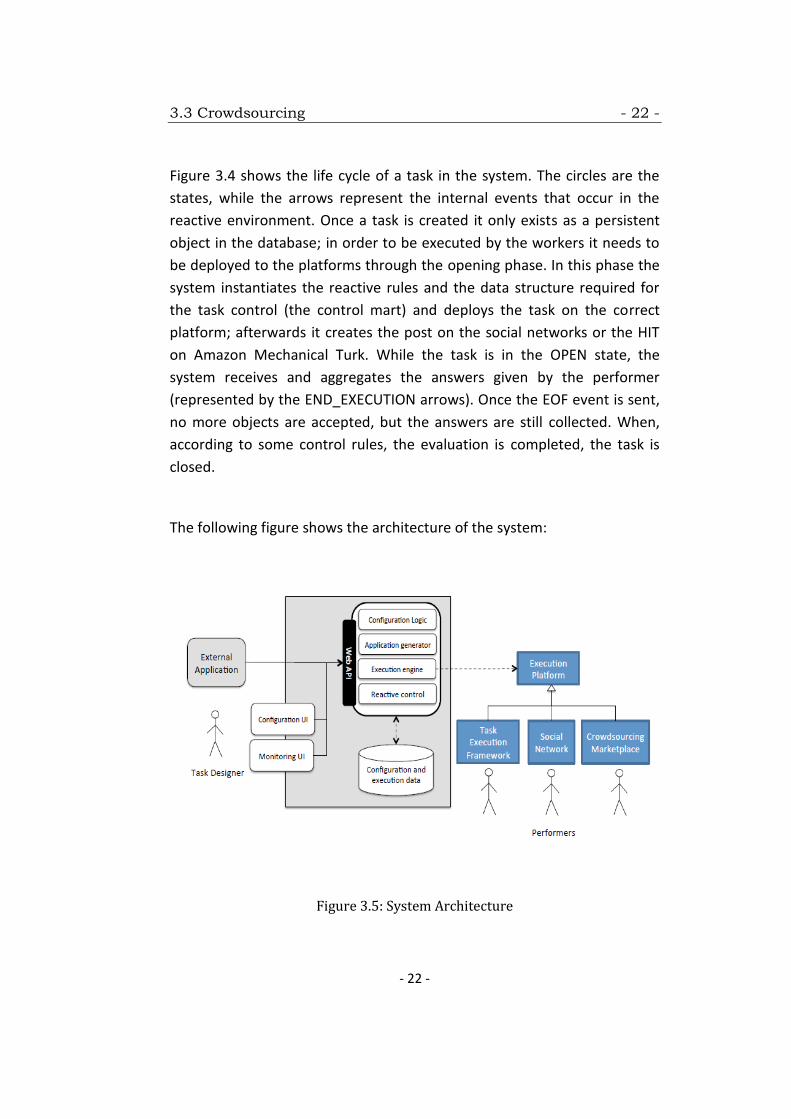
The following figure shows the architecture of the system:
Figure 3.5: System Architecture
3.3 Crowdsourcing - 23 -
- 23 -
The core of the system is a Node.js application, integrating the data
structures stored in a non-sql data source (namely a MongoDB instance)
connected to the reactive control engine, and offering a set of APIs to
support integration with external applications. The Task Designer can
create and manage tasks either through the CrowdSearcher web interface
or through a custom application invoking the API. The application
generator takes the task model and generates the data structure, the rules
and the objects required for the task execution and control; finally, it
deploys the task on the execution platform of choice. Reactive rules are
translated into scripts, whose triggering is modeled through internal
platform events. Precedence between rules is implicitly obtained by
defining the scripts in the proper order.
CrowdSearcher offers also a dashboard that allows designer to
continuously monitor crowd-based applications[6]. For our purposes, the
results generated by the platform will influence the future street view
images and the level of accessibleness for a specific point.
Chapter 4 - 24 -
- 24 -
Chapter 4
Requirements Analysis
In this chapter I will present the requirements phase, a phase which plays
an important role as it is the starting point in designing the proper
solutions for the question: „How to identify street-level accessibility
problems by involving users?”. Within this, the answer lies in combining
crowdsourcing with Google Street View.
Street View Images focusing on several accessibility features will be
sent to users via a crowdsourcing platform and will be marked by them as
accessible or non-accessible based on different aspects, which will be
detailed later in Chapter 5.
Google Street View offers the possibility to download up to 25.000 images
per day and, together with OpenStreetMap, these images can be
customized in such a way to represent only the points of interest strictly
related to our question. Even though the list of accessibility features which
can be analyzed is long, for the time being the project limits itself to only
two major features: crossings and pedestrian areas.
Downloading the images is realized by software written in Java
programming language, Eclipse platform. Java, a general-purpose
computer programming language that is concurrent, class-based, object-
oriented, and specifically designed to have as few implementation
dependencies as possible[7], was the first choice because of its free and
open-source software and good execution speed.
Requirements Analysis - 25 -
- 25 -
Since the purpose is to download all these images in an automatic way, we
need to have the precise location of the crossings, traffic lights and
intersections. The output of the Overpass turbo queries presented in
Chapter 3 is an xml file containing the geographical position of the points
(latitude and longitude); by inserting these two in the Google Street View
Image link, we will be having an automatic downloading process.
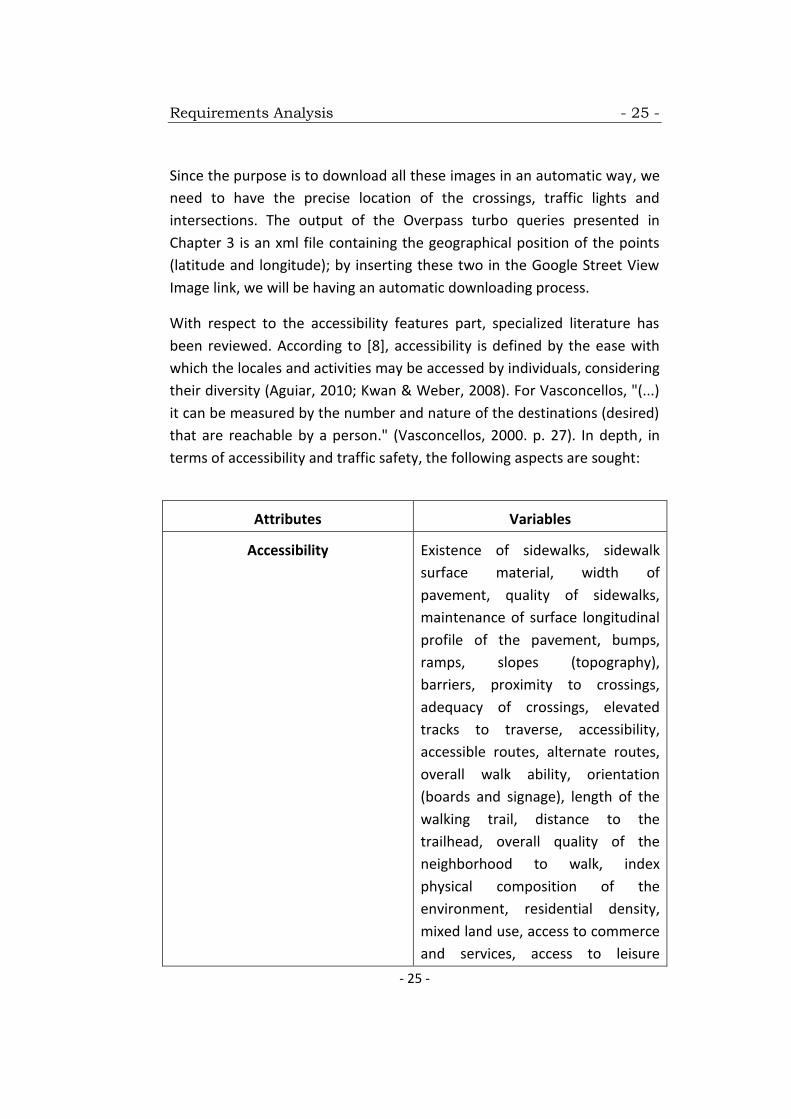
With respect to the accessibility features part, specialized literature has
been reviewed. According to [8], accessibility is defined by the ease with
which the locales and activities may be accessed by individuals, considering
their diversity (Aguiar, 2010; Kwan & Weber, 2008). For Vasconcellos, "(...)
it can be measured by the number and nature of the destinations (desired)
that are reachable by a person." (Vasconcellos, 2000. p. 27). In depth, in
terms of accessibility and traffic safety, the following aspects are sought:
Attributes Variables
Accessibility Existence of sidewalks, sidewalk
surface material, width of
pavement, quality of sidewalks,
maintenance of surface longitudinal
profile of the pavement, bumps,
ramps, slopes (topography),
barriers, proximity to crossings,
adequacy of crossings, elevated
tracks to traverse, accessibility,
accessible routes, alternate routes,
overall walk ability, orientation
(boards and signage), length of the
walking trail, distance to the
trailhead, overall quality of the
neighborhood to walk, index
physical composition of the
environment, residential density,
mixed land use, access to commerce
and services, access to leisure
Requirements Analysis - 26 -
- 26 -
(beaches, rivers etc.), access to open
areas, facilities, access by car and
public transport, multimodal
facilities, parking.
Traffic Safety Nearby traffic (volume), traffic
speed, traffic interference with
walking, sense of safety around
adjacent traffic, road width, number
of crossings, ease to cross, safe
crossings, signage, lowering of
sidewalks, view of approaching
vehicles, traffic flow at intersections,
roadway separation between
pavement with grass or flower beds,
unsafe sidewalks (holes), difficulty
walking, low walking speed, drivers
who respect the law, visibility.
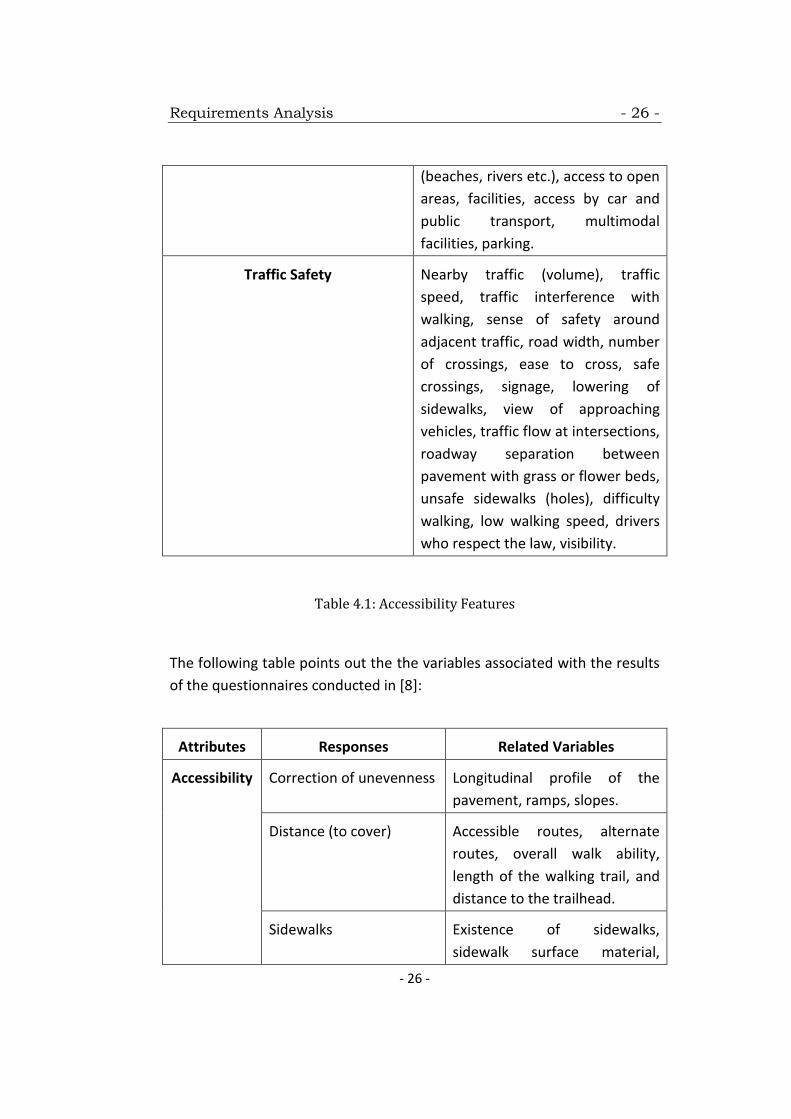
Table 4.1: Accessibility Features
The following table points out the the variables associated with the results
of the questionnaires conducted in [8]:
Attributes Responses Related Variables
Accessibility Correction of unevenness Longitudinal profile of the
pavement, ramps, slopes.
Distance (to cover) Accessible routes, alternate
routes, overall walk ability,
length of the walking trail, and
distance to the trailhead.
Sidewalks Existence of sidewalks,
sidewalk surface material,
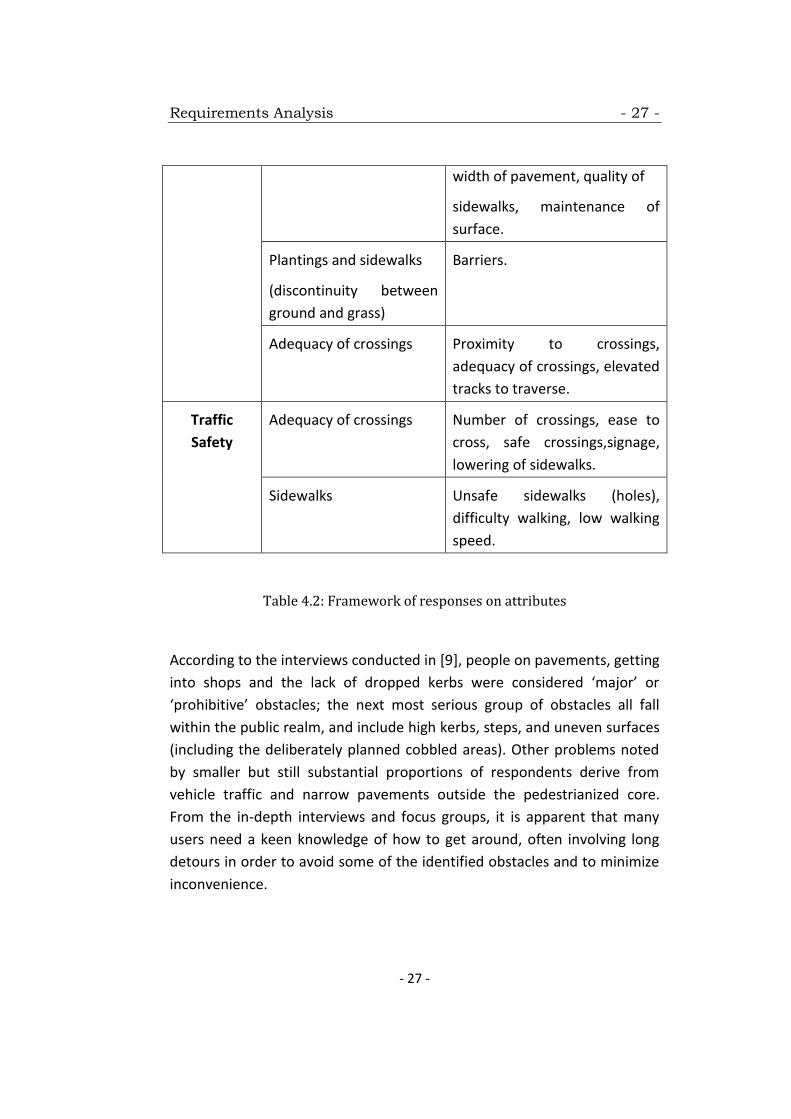
Requirements Analysis - 27 -
- 27 -
width of pavement, quality of
sidewalks, maintenance of
surface.
Plantings and sidewalks
(discontinuity between
ground and grass)
Barriers.
Adequacy of crossings Proximity to crossings,
adequacy of crossings, elevated
tracks to traverse.
Traffic
Safety
Adequacy of crossings Number of crossings, ease to
cross, safe crossings,signage,
lowering of sidewalks.
Sidewalks Unsafe sidewalks (holes),
difficulty walking, low walking
speed.
Table 4.2: Framework of responses on attributes
According to the interviews conducted in [9], people on pavements, getting
into shops and the lack of dropped kerbs were considered ‘major’ or
‘prohibitive’ obstacles; the next most serious group of obstacles all fall
within the public realm, and include high kerbs, steps, and uneven surfaces
(including the deliberately planned cobbled areas). Other problems noted
by smaller but still substantial proportions of respondents derive from
vehicle traffic and narrow pavements outside the pedestrianized core.
From the in-depth interviews and focus groups, it is apparent that many
users need a keen knowledge of how to get around, often involving long
detours in order to avoid some of the identified obstacles and to minimize
inconvenience.
Requirements Analysis - 28 -
- 28 -
As documented in [10], long inclines without a resting place, high kerbs,
steps or uneven surfaces may prove to be insurmountable obstacles for
wheelchair users. Road crossing represents a big problem; together with
very busy main roads and the nature and positioning of the dropped kerb
can make a difficult maneuvering. Narrowness of main access roads or
even bustling shopping streets can cause considerable frustration. Uneven
and poorly maintained pavements, temporary street obstacles together
with slippery and difficult to negotiate cobbles can cause pain and
discomfort. Last but not least, other problems noticed by users are uphill
journeys without resting places and inaccessible toilets.
Taking all these issues into consideration and as it will be seen in Chapter 5,
proper questions have been composed in order to determine the
accessibleness of several street features.
Based on the research conducted, the following aspects have been
selected for questioning:
Existence of sidewalks
Sidewalk surface material
Quality of sidewalks
Quality of streets
Adequacy of crossings
Since accessibleness is determined by visualizing street view images,
aspects such as traffic speed, access to open areas, accessible toilets
cannot be evaluated; even the questions for the five criteria presented
above have been carefully selected in order to target features which can be
analyzed by image viewing.
Chapter 5 - 29 -
- 29 -
Chapter 5
Design Phase
In this chapter I will be describing the high level implementation of the
entire process in which I will be focusing on several aspects of Open Street
Map and Google Street View Image together with the accessibility features
considered for the crowdsourcing platform.
I would like to remember the most common problems wheelchair users
can encounter when moving around the streets of a city:
Long inclines/ Uphill going without a resting place
High kerbs
Position and nature of dropped kerbs
Pavements in bad state / Uneven surfaces
Crowdedness – especially for narrow streets
Temporary obstacles
Cobbles
Gratings and drains
Potholes
Inaccessible shops
Inaccessible toilets
Design Phase - 30 -
- 30 -
Since the purpose of the project is to determine accessibility via images,
aspects such as street crowdedness, inaccessible shops and toilets will not
be taken into consideration as they cannot be analyzed from images.
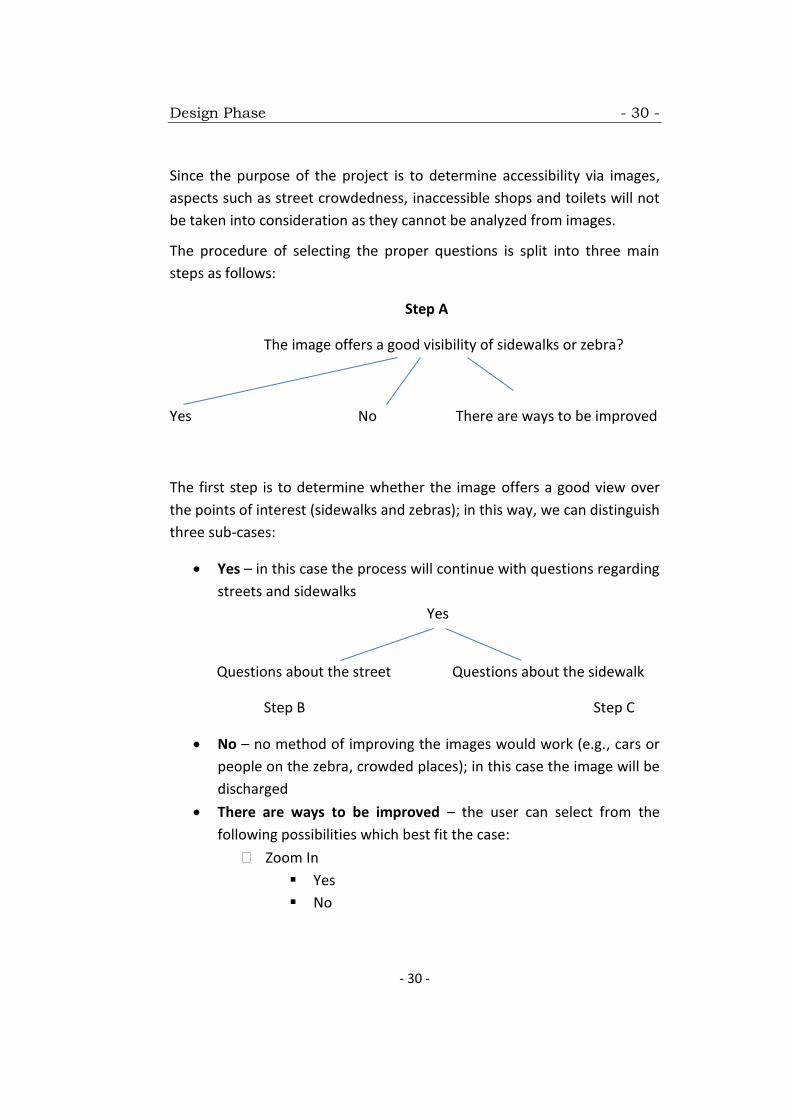
The procedure of selecting the proper questions is split into three main
steps as follows:
Step A
The image offers a good visibility of sidewalks or zebra?
Yes No There are ways to be improved
The first step is to determine whether the image offers a good view over
the points of interest (sidewalks and zebras); in this way, we can distinguish
three sub-cases:
Yes – in this case the process will continue with questions regarding
streets and sidewalks
Yes
Questions about the street Questions about the sidewalk
Step B Step C
No – no method of improving the images would work (e.g., cars or
people on the zebra, crowded places); in this case the image will be
discharged
There are ways to be improved – the user can select from the
following possibilities which best fit the case:
Zoom In
Yes
No

Design Phase - 31 -
- 31 -
Zoom Out
Yes
No
Higher Pitch
Yes
No
Lower Pitch
Yes
No
Rotate Right
Yes
No
Rotate Left
Yes
No
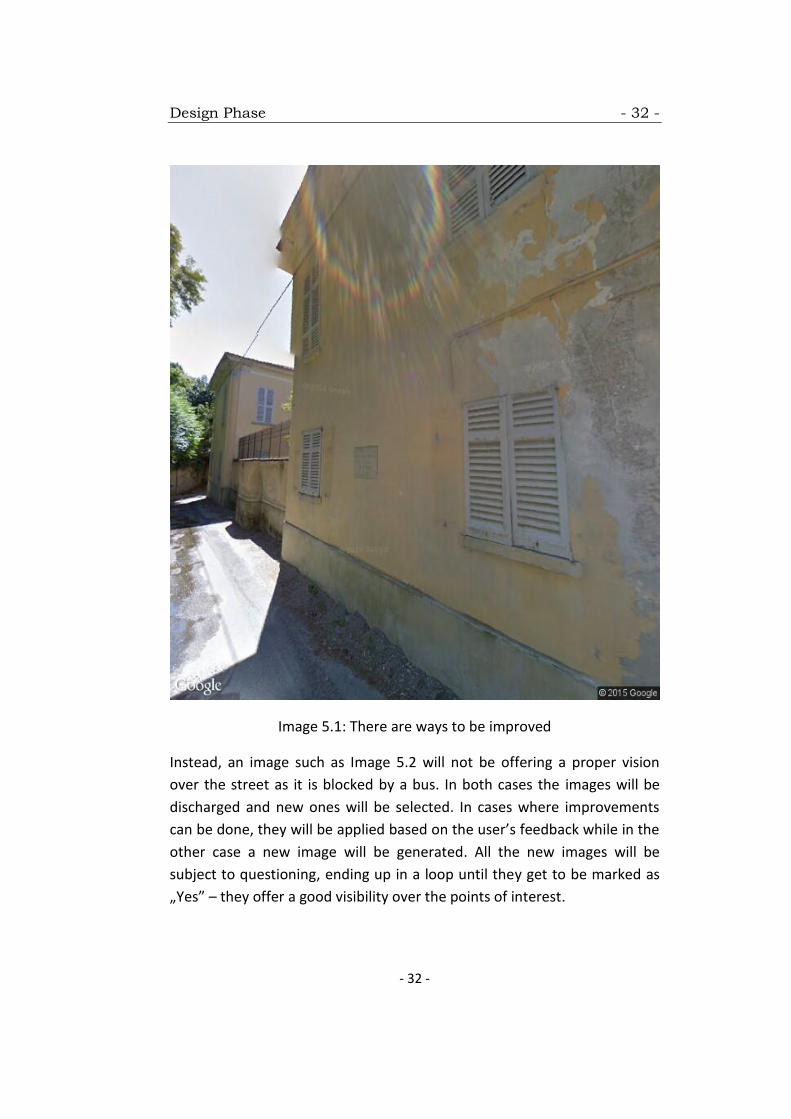
For example, an image such as Image 5.1 stands in the category of „There
are ways to be improved” as, by performing a zoom out, it can offer a
proper vision over the street.
Design Phase - 32 -
- 32 -
Image 5.1: There are ways to be improved
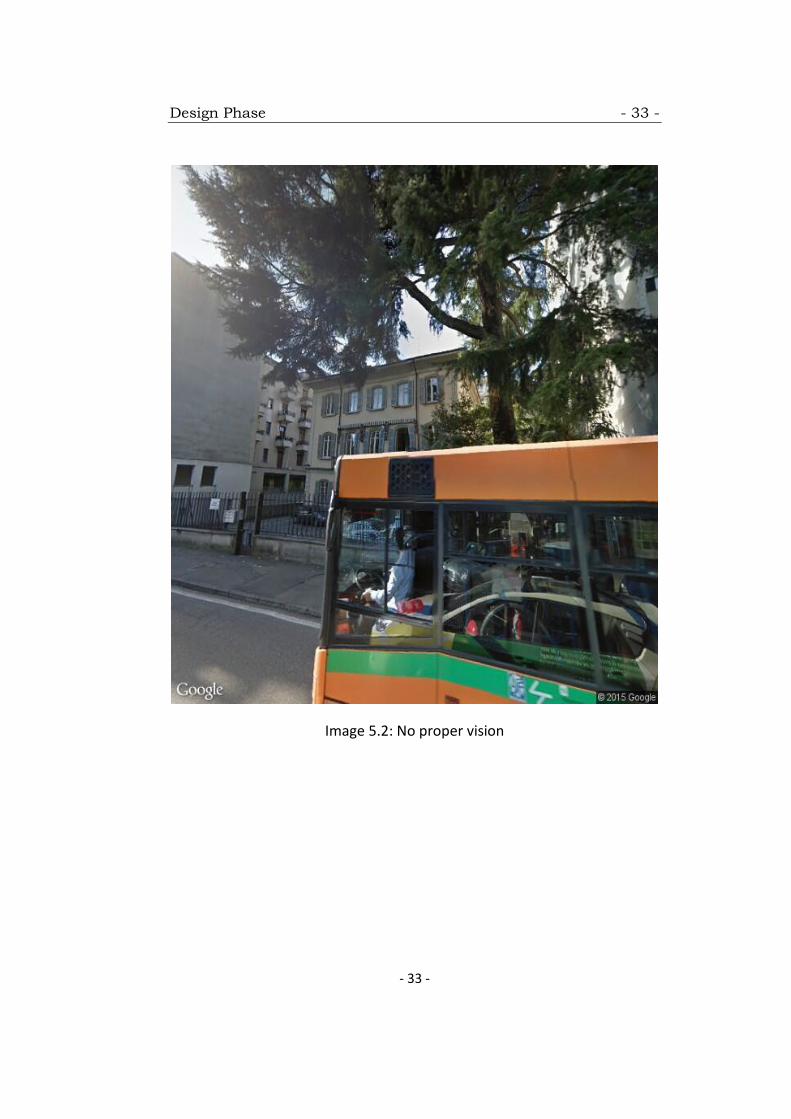
Instead, an image such as Image 5.2 will not be offering a proper vision
over the street as it is blocked by a bus. In both cases the images will be
discharged and new ones will be selected. In cases where improvements
can be done, they will be applied based on the user’s feedback while in the
other case a new image will be generated. All the new images will be
subject to questioning, ending up in a loop until they get to be marked as
„Yes” – they offer a good visibility over the points of interest.
Design Phase - 33 -
- 33 -
Image 5.2: No proper vision
Design Phase - 34 -
- 34 -
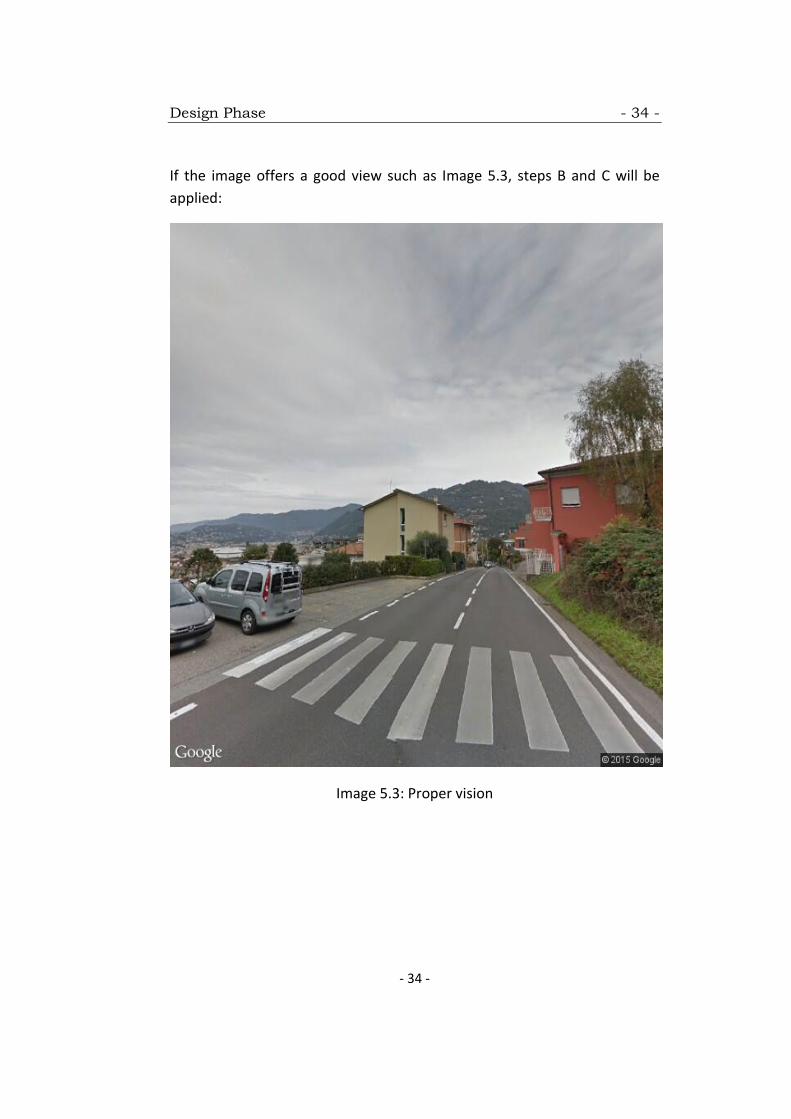
If the image offers a good view such as Image 5.3, steps B and C will be
applied:
Image 5.3: Proper vision
Design Phase - 35 -
- 35 -
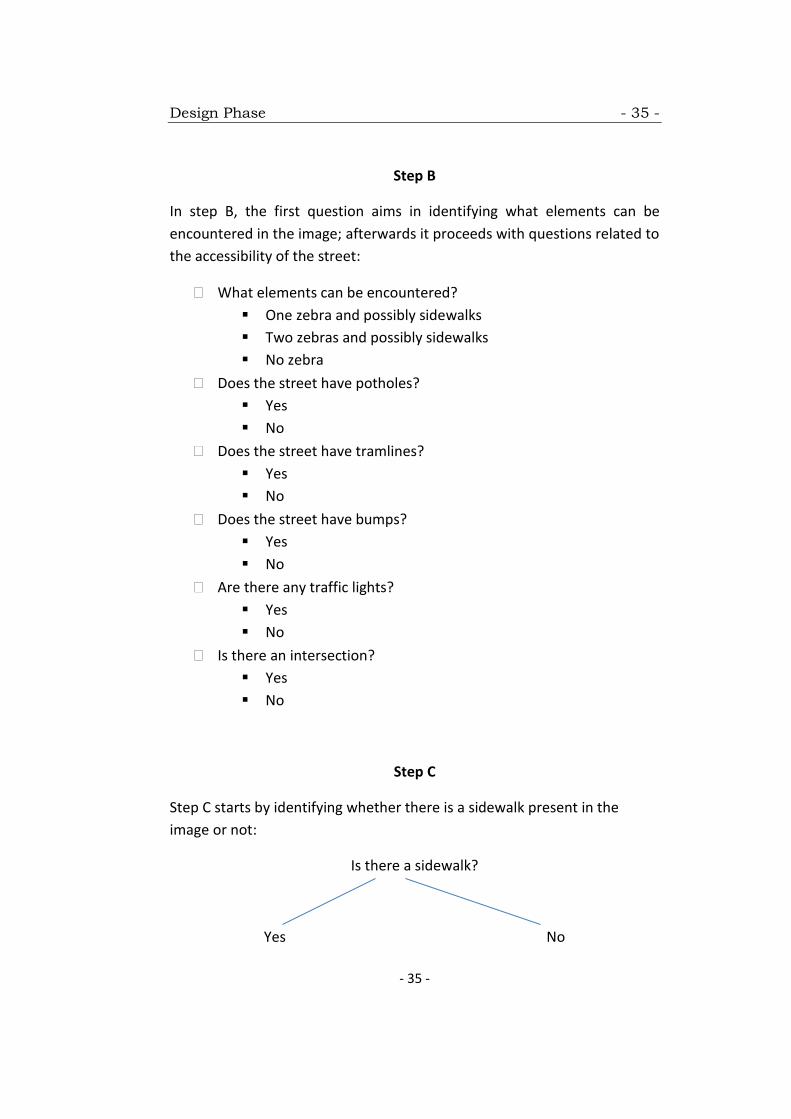
Step B
In step B, the first question aims in identifying what elements can be
encountered in the image; afterwards it proceeds with questions related to
the accessibility of the street:
What elements can be encountered?
One zebra and possibly sidewalks
Two zebras and possibly sidewalks
No zebra
Does the street have potholes?
Yes
No
Does the street have tramlines?
Yes
No
Does the street have bumps?
Yes
No
Are there any traffic lights?
Yes
No
Is there an intersection?
Yes
No
Step C
Step C starts by identifying whether there is a sidewalk present in the
image or not:
Is there a sidewalk?
Yes No
Design Phase - 36 -
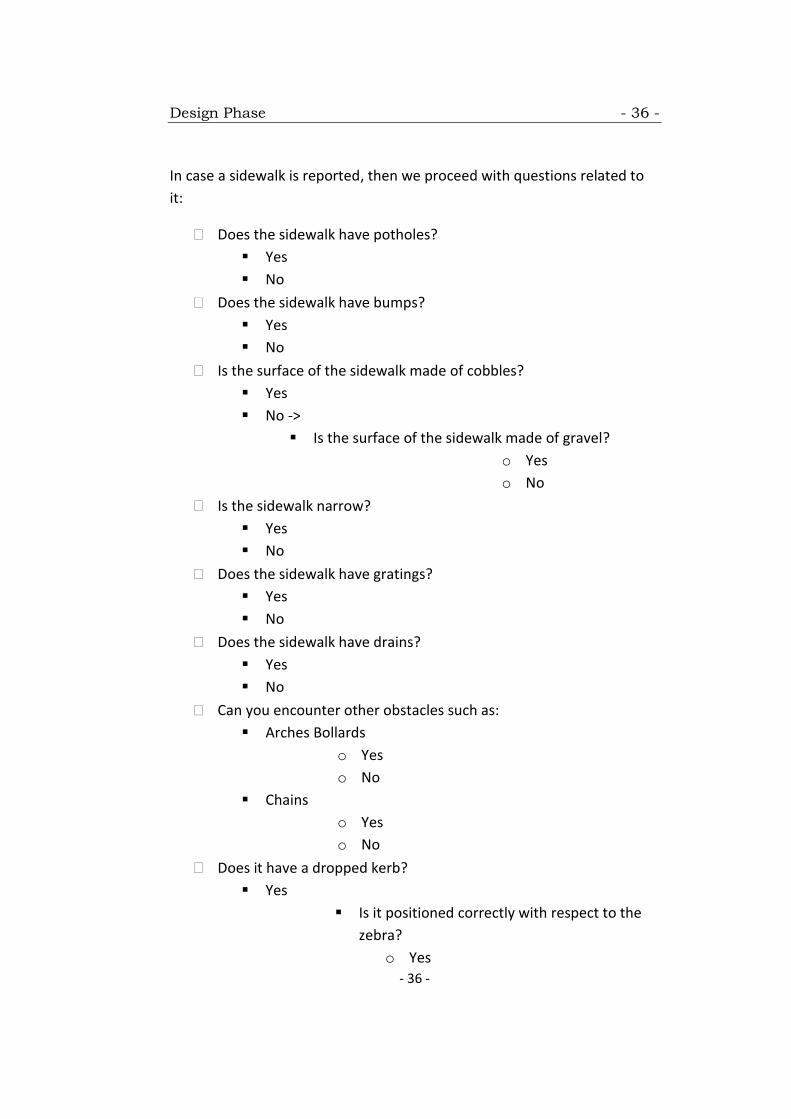
- 36 -
In case a sidewalk is reported, then we proceed with questions related to
it:
Does the sidewalk have potholes?
Yes
No
Does the sidewalk have bumps?
Yes
No
Is the surface of the sidewalk made of cobbles?
Yes
No ->
Is the surface of the sidewalk made of gravel?
o Yes
o No
Is the sidewalk narrow?
Yes
No
Does the sidewalk have gratings?
Yes
No
Does the sidewalk have drains?
Yes
No
Can you encounter other obstacles such as:
Arches Bollards
o Yes
o No
Chains
o Yes
o No
Does it have a dropped kerb?
Yes
Is it positioned correctly with respect to the
zebra?
o Yes

Design Phase - 37 -
- 37 -
o No
Is the surface neat?
o Yes
o No
Does it have a proper inclination?
o Yes
o No
No
Does the sidewalk have high curbsides?
o Yes
o No
It is considered that a dropped kerb will always be correlated to a sidewalk
even though there are exceptions from the rules as it can be seen in Image
A.2, Appendix A.
If no sidewalk is reported, which can be valid as there are places where the
sidewalk is part of the street (Image A.1, Appendix A), then we proceed
with additional questions related to the street:
Is the surface of the sidewalk made of cobbles?
Yes
No ->
Is the surface of the sidewalk made of gravel?
o Yes
o No
Is the sidewalk narrow?
Yes
No
Does the sidewalk have gratings?
Yes
No
Does the sidewalk have drains?
Yes
No
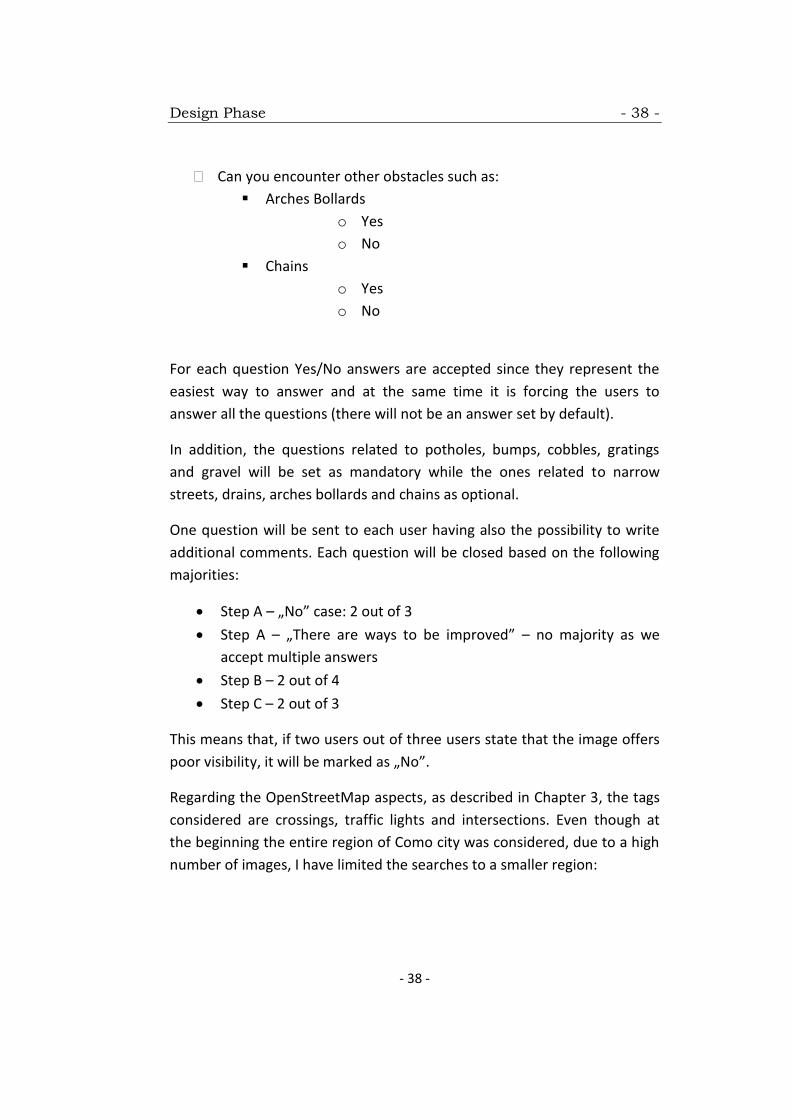
Design Phase - 38 -
- 38 -
Can you encounter other obstacles such as:
Arches Bollards
o Yes
o No
Chains
o Yes
o No
For each question Yes/No answers are accepted since they represent the
easiest way to answer and at the same time it is forcing the users to
answer all the questions (there will not be an answer set by default).
In addition, the questions related to potholes, bumps, cobbles, gratings
and gravel will be set as mandatory while the ones related to narrow
streets, drains, arches bollards and chains as optional.
One question will be sent to each user having also the possibility to write
additional comments. Each question will be closed based on the following
majorities:
Step A – „No” case: 2 out of 3
Step A – „There are ways to be improved” – no majority as we
accept multiple answers
Step B – 2 out of 4
Step C – 2 out of 3
This means that, if two users out of three users state that the image offers
poor visibility, it will be marked as „No”.
Regarding the OpenStreetMap aspects, as described in Chapter 3, the tags
considered are crossings, traffic lights and intersections. Even though at
the beginning the entire region of Como city was considered, due to a high
number of images, I have limited the searches to a smaller region:
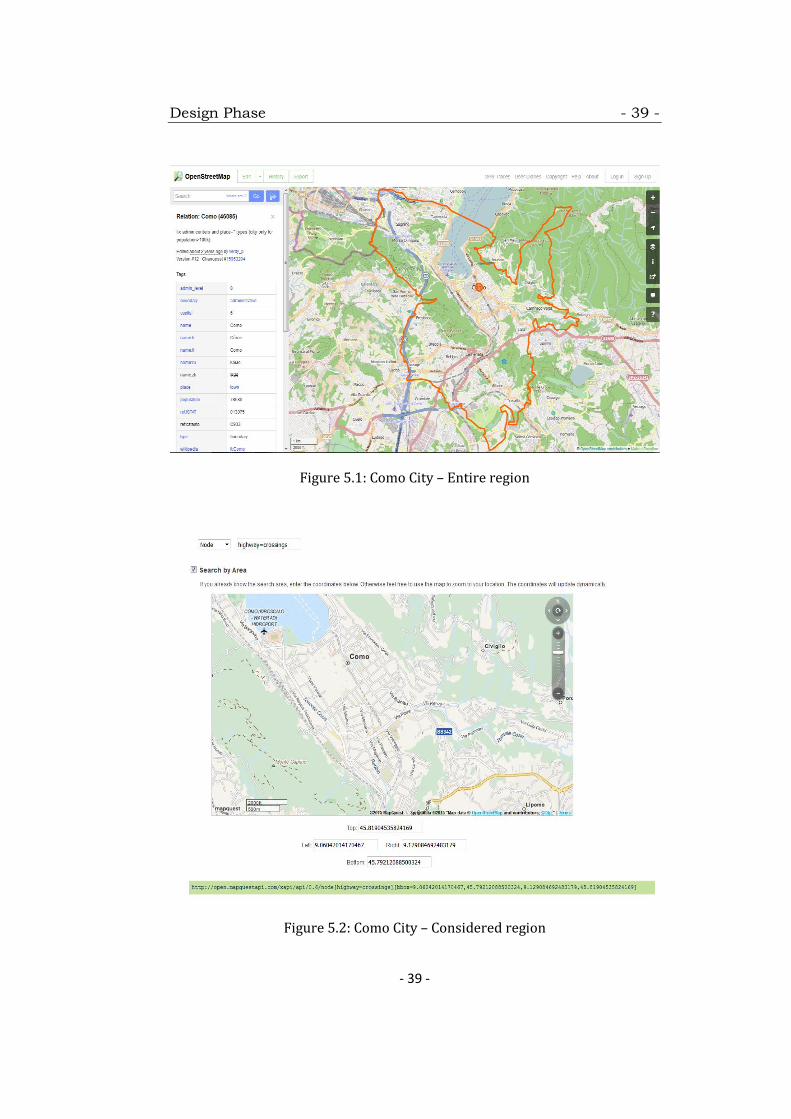
Design Phase - 39 -
- 39 -
Figure 5.1: Como City – Entire region
Figure 5.2: Como City – Considered region

Design Phase - 40 -
- 40 -
After manually analyzing several Google Street View images, it has been
decided that the parameters fov and pitch can be set as fixed (fov = 90;
pitch = 10) while only the heading needs to be calculated (in the case of
crossings and traffic lights it is manually set to 0 while for the intersections
it is calculated based on several method as shown in the next chapter).
Chapter 6 - 41 -
- 41 -
Chapter 6
Implementation
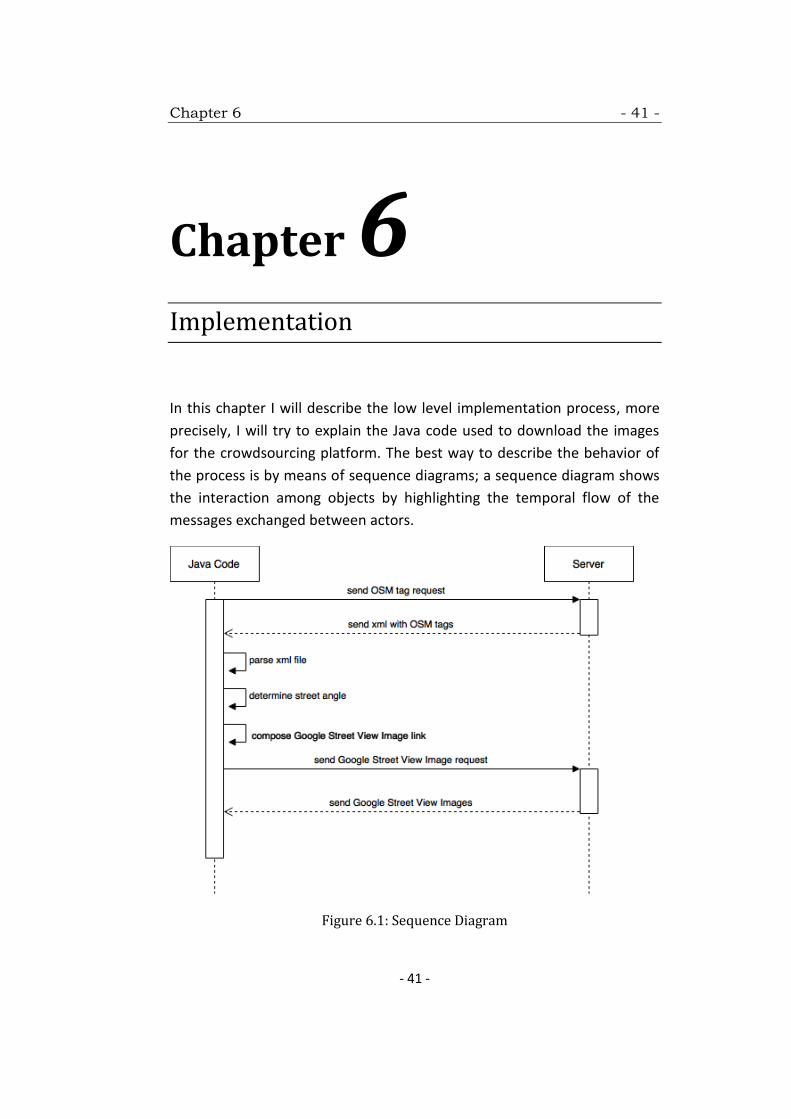
In this chapter I will describe the low level implementation process, more
precisely, I will try to explain the Java code used to download the images
for the crowdsourcing platform. The best way to describe the behavior of
the process is by means of sequence diagrams; a sequence diagram shows
the interaction among objects by highlighting the temporal flow of the
messages exchanged between actors.
Figure 6.1: Sequence Diagram
Implementation - 42 -
- 42 -
The Java Code and the Server represent the two main actors which
exchange messages between them; these messages are mostly requests
being sent to the Server and answers coming from its side.
As it can be seen from Figure 6.1, the first step of the process is to
determine all the Open Street Map tags automatically. Since there are
already predefined tags in Open Street Map, for crossings and traffic lights
they can be obtained straightforward by using a XAPI request:
/*****************************************************************/
String url_crossing =
"http://open.mapquestapi.com/xapi/api/0.6/node%5Bhighway=crossings%
5D%5Bbbox=8.9904,45.7581,9.1175,45.8428%5D";
String url_traffic_lights =
"http://open.mapquestapi.com/xapi/api/0.6/node%5Bhighway=traffic_si
gnals%5D%5Bbbox=8.9904,45.7581,9.1175,45.8428%5D";
/*****************************************************************/
Xapi is a read-only OpenStreetMap Extended API that provides enhanced
search and querying capabilities for nodes, ways and relations. The query
can be defined by OSM tags and/or a bounding box and will return all
current data that match the entered search terms[11].
The key elements of the XAPI request are the tags and the bbox; the
following table describes the selection predicates that may be included in
the request[11]:
Predicates Description
tags Features with the specified OSM tags will be returned.
Format must be in the form [key=value].
node - node[key=value]
way - way[key=value]
relation - relation[key=value]
Implementation - 43 -
- 43 -
bbox Bounding box used to limit the extent of the result
document. Usage of bbox is currently limited to 10 square
degrees.
Must be in the following order:
[bbox=left,bottom,right,top]
Table 6.1: XAPI Request Elements
For our case the tags required are highway = crossings and highway =
traffic_signals while the bbox=8.9904,45.7581,9.1175,45.8428 corresponds
to the city of Como.
The response of the XAPI request will be an xml file of the following
format:
/*****************************************************************/
<node id="152649789" version="10" timestamp="2012-11-
25T20:19:42Z" uid="668137" user="ilGianlu"
changeset="14036107" lat="45.8021613" lon="9.0863774">
<tag k="highway" v="traffic_signals"/>
</node>
/*****************************************************************/
Where the latitude and longitude attributes represent our point of interest
as they will be later used in the composition of the Google Street View
Image link.
Downloading the intersection tags is not that straightforward as a XAPI
request cannot be used. The issue can be solved instead by using queries in
Overpass turbo, as follows:
/*****************************************************************/
[out:xml][timeout:3600];
// filter ways
way[highway][highway!~"footway|cycleway|path|service|tr
ack"](45.7581,8.9904,45.8428,9.1775)->.hw;
Implementation - 44 -
- 44 -
// for each way
foreach.hw->.eachw(
// get ways which share the same nodes minus current
way into .otherws
node(w.eachw)->.ns;
way(bn.ns)[highway][highway!~"footway|cycleway|path|ser
vice|track"]->.w2;
(way.w2; - way.eachw;)->.otherws;
// get shared nodes
node(w.otherws)->.n2;
node(w.eachw)->.n3;
(((node.n2; node.n3;) -(node.n2; - node.n3;);) -
(node.n3; - node.n2;);)->.shrdnodes;
// ways which are in junction
way(bn.shrdnodes)->.outways;
// union ways and nodes
(way.outways; node.n2.n3); out geom;
);
/*****************************************************************/
Implementation - 45 -
- 45 -
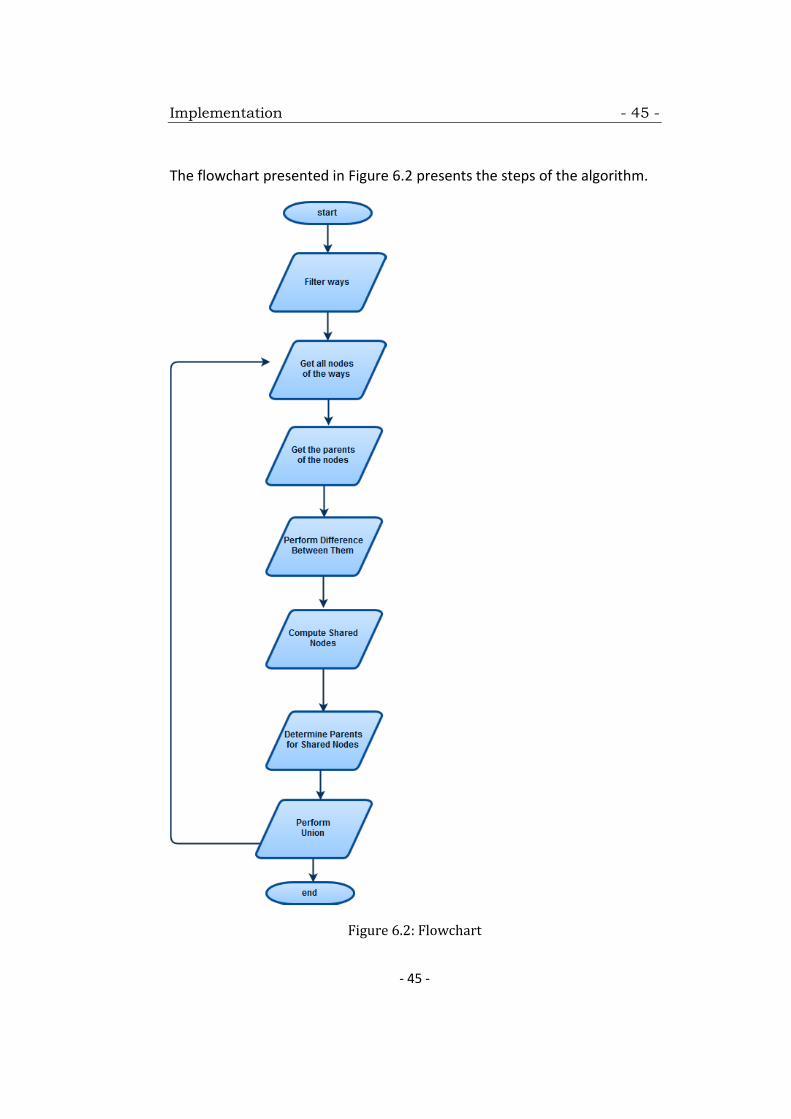
The flowchart presented in Figure 6.2 presents the steps of the algorithm.
Figure 6.2: Flowchart
Implementation - 46 -
- 46 -
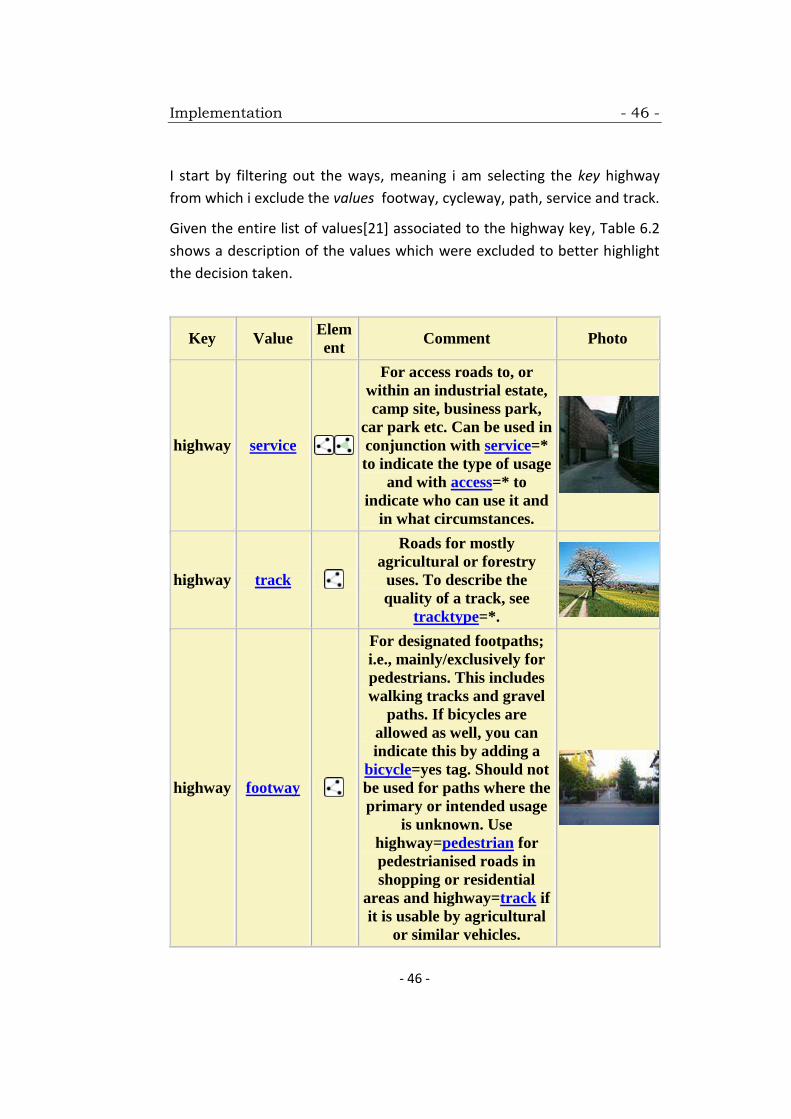
I start by filtering out the ways, meaning i am selecting the key highway
from which i exclude the values footway, cycleway, path, service and track.
Given the entire list of values[21] associated to the highway key, Table 6.2
shows a description of the values which were excluded to better highlight
the decision taken.
Key Value Elem
ent Comment Photo
highway service
For access roads to, or
within an industrial estate,
camp site, business park,
car park etc. Can be used in
conjunction with service=*
to indicate the type of usage
and with access=* to
indicate who can use it and
in what circumstances.
highway track
Roads for mostly
agricultural or forestry
uses. To describe the
quality of a track, see
tracktype=*.
highway footway
For designated footpaths;
i.e., mainly/exclusively for
pedestrians. This includes
walking tracks and gravel
paths. If bicycles are
allowed as well, you can
indicate this by adding a
bicycle=yes tag. Should not
be used for paths where the
primary or intended usage
is unknown. Use
highway=pedestrian for
pedestrianised roads in
shopping or residential
areas and highway=track if
it is usable by agricultural
or similar vehicles.
Implementation - 47 -
- 47 -
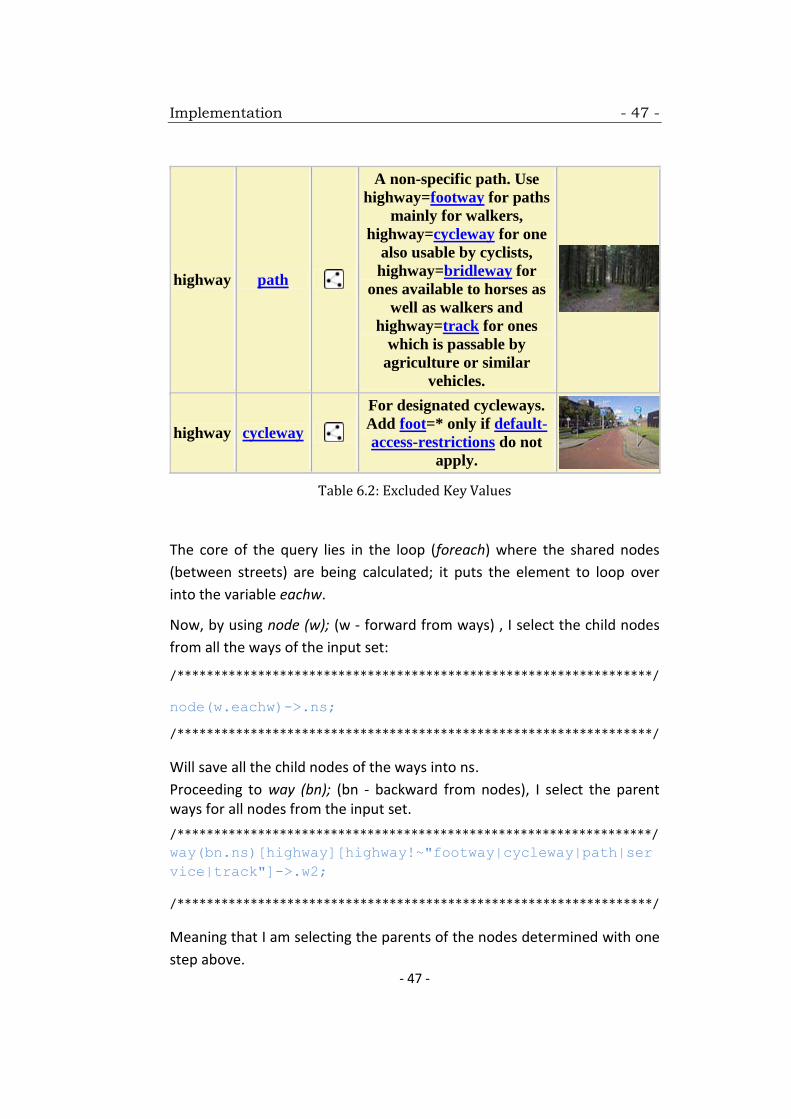
highway path
A non-specific path. Use
highway=footway for paths
mainly for walkers,
highway=cycleway for one
also usable by cyclists,
highway=bridleway for
ones available to horses as
well as walkers and
highway=track for ones
which is passable by
agriculture or similar
vehicles.
highway cycleway
For designated cycleways.
Add foot=* only if default-
access-restrictions do not
apply.
Table 6.2: Excluded Key Values
The core of the query lies in the loop (foreach) where the shared nodes
(between streets) are being calculated; it puts the element to loop over
into the variable eachw.
Now, by using node (w); (w - forward from ways) , I select the child nodes
from all the ways of the input set:
/*****************************************************************/
node(w.eachw)->.ns;
/*****************************************************************/
Will save all the child nodes of the ways into ns.
Proceeding to way (bn); (bn - backward from nodes), I select the parent ways for all nodes from the input set.
/*****************************************************************/
way(bn.ns)[highway][highway!~"footway|cycleway|path|ser
vice|track"]->.w2;
/*****************************************************************/
Meaning that I am selecting the parents of the nodes determined with one
step above.
Implementation - 48 -
- 48 -
At this moment, if we were to stop here, by applying the difference
between them, I get all the junction nodes and the junction ways but
without their other child nodes:
/*****************************************************************/
(way.w2; - way.eachw;)->.otherws;
node(w.otherws)->.n2;
node(w.eachw)->.n3;
/*****************************************************************/
In order to get also the other points of the ways, a union needs to be
applied between the shared nodes and the ways they belong to.
/*****************************************************************/
(((node.n2; node.n3;) -(node.n2; - node.n3;);) -
(node.n3; - node.n2;);)->.shrdnodes;
// ways which are in junction
way(bn.shrdnodes)->.outways;
// union ways and nodes
(way.outways; node.n2.n3); out geom;);
/*****************************************************************/
Where node.n2.n3; calculates the intersection of the input set .n2 and .n3
The three differences to determine the shared nodes stand for the
following: (all the nodes from n2 and n3 together) – (all the nodes from n2
which are not in n3) – (all the nodes from n3 which are not in n2).
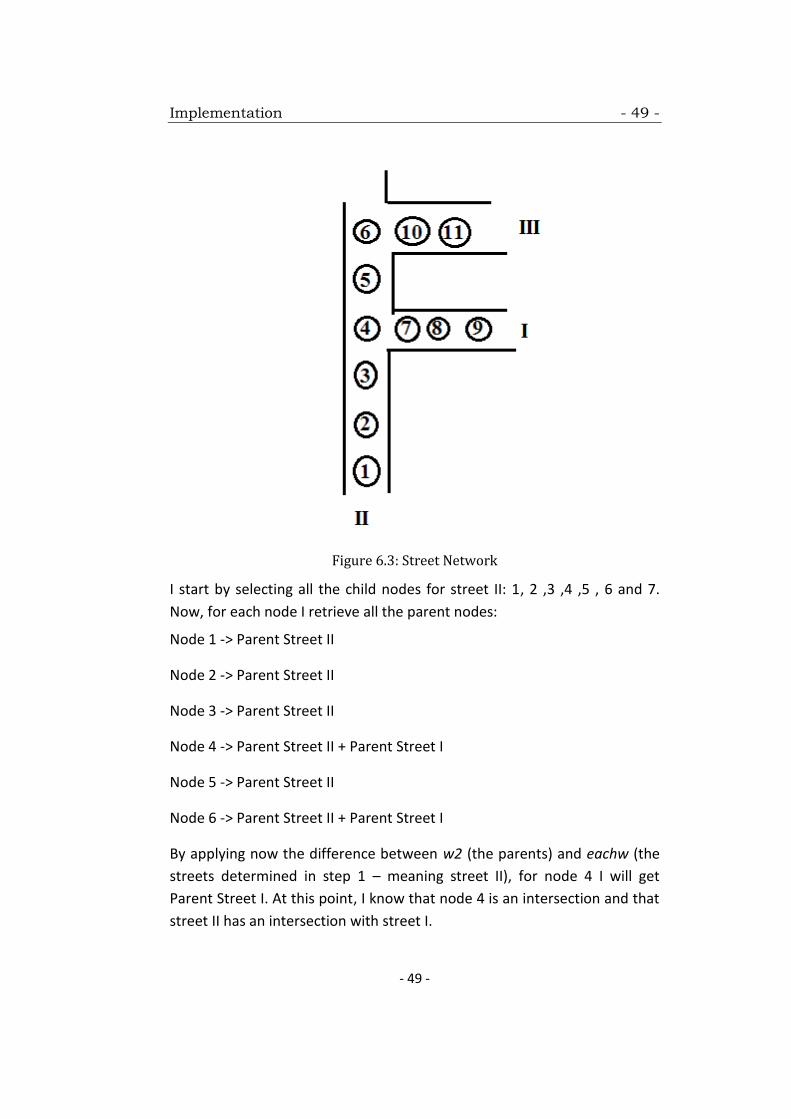
The idea of the query can be better highlighted using the street network
shown in Figure 6.3 where we have the main street (number II) and
additional streets with which it forms intersections.
Implementation - 49 -
- 49 -
Figure 6.3: Street Network
I start by selecting all the child nodes for street II: 1, 2 ,3 ,4 ,5 , 6 and 7.
Now, for each node I retrieve all the parent nodes:
Node 1 -> Parent Street II
Node 2 -> Parent Street II
Node 3 -> Parent Street II
Node 4 -> Parent Street II + Parent Street I
Node 5 -> Parent Street II
Node 6 -> Parent Street II + Parent Street I
By applying now the difference between w2 (the parents) and eachw (the
streets determined in step 1 – meaning street II), for node 4 I will get
Parent Street I. At this point, I know that node 4 is an intersection and that
street II has an intersection with street I.
Implementation - 50 -
- 50 -
In order to determine the precise shared nodes and the ways they belong
to, I continue by retrieving all the nodes from Street I and II and applying
differences among them:
Street I: 4, 7, 8, 9
Street II: 1, 2 ,3 ,4 ,5 , 6 and 7
(all the nodes from Street I and II together) – (all the nodes from Street I
which are not in II) – (all the nodes from Street II which are not in I) = (1, 2
,3 ,4 ,5 , 6, 7, 8, 9) – (7, 8, 9) – (1, 2 ,3,5 , 6) = 4
The query can be exported as a link and, as in the crossings and traffic
lights case, it is possible to download all the tags automatically as an xml
file:
/*****************************************************************/
String url_intersections = "http://overpass-
api.de/api/interpreter?data=%0A%5Bout%3Axml%5D%5Btimeout%3A3600%5D%
3B%0A%2F%2F%20filter%20ways%0Away%5Bhighway%5D%5Bhighway%21~%22foot
way%7Ccycleway%7Cpath%7Cservice%7Ctrack%22%5D%2845.7581%2C8.9904%2C
45.8428%2C9.1775%29-
%3E.hw%3B%0A%0A%2F%2F%20foreach%20way%0Aforeach.hw-
%3E.eachw%28%0A%20%20%2F%2F%20get%20ways%2C%20which%20shares%20same
%20nodes%20minus%20current%20way%0A%20%20%2F%2F%20into%20.otherws%0
A%20%20node%28w.eachw%29-
%3E.ns%3B%0A%20%20way%28bn.ns%29%5Bhighway%5D%5Bhighway%21~%22footw
ay%7Ccycleway%7Cpath%7Cservice%7Ctrack%22%5D-
%3E.w2%3B%0A%20%20%28way.w2%3B%20-%20way.eachw%3B%29-
%3E.otherws%3B%0A%0A%20%20%2F%2F%20get%20shared%20nodes%0A%20%20nod
e%28w.otherws%29-%3E.n2%3B%0A%20%20node%28w.eachw%29-
%3E.n3%3B%0A%0A%20%28%28%28node.n2%3B%20node.n3%3B%29%20-
%28node.n2%3B%20-%20node.n3%3B%29%3B%29%20-%28node.n3%3B%20-
%20node.n2%3B%29%3B%29-
%3E.shrdnodes%3B%0A%0A%20%20%2F%2F%20ways%20which%20are%20in%20junc
tion%0A%20%20way%28bn.shrdnodes%29-
%3E.outways%3B%0A%0A%20%20%2F%2F%20union%20ways%20and%20nodes%0A%20
%20%28way.outways%3B%20node.n2.n3%29%3B%20out%20geom%3B%20%0A%29%3B
%0A%20%20%0A%20%20%0A%20%20%0A%20%20%0A%20%20%0A";
/*****************************************************************/

Implementation - 51 -
- 51 -
The output, containing all intersection points and the ways they belong to,
will be of the following format:
/*****************************************************************/
<node id="283338852" lat="45.7795789" lon="8.9933379"/>
<node id="676633881" lat="45.7821164" lon="8.9749494"/>
<node id="946751825" lat="45.7811333" lon="8.9895299"/>
<way id="53560605">
<bounds minlat="45.7821164" minlon="8.9718081"
maxlat="45.7852767" maxlon="8.9754394"/>
<nd ref="676633881" lat="45.7821164"
lon="8.9749494"/>
<nd ref="946753392" lat="45.7822876"
lon="8.9749637"/>
<nd ref="676633883" lat="45.7824795"
lon="8.9749256"/>
<nd ref="946751727" lat="45.7826806"
lon="8.9748991"/>
<tag k="highway" v="unclassified"/>
<tag k="name" v="Via Luraschi"/>
</way>
/*****************************************************************/
e.g. , node 676633881 belongs to way 53560605
Implementation - 52 -
- 52 -
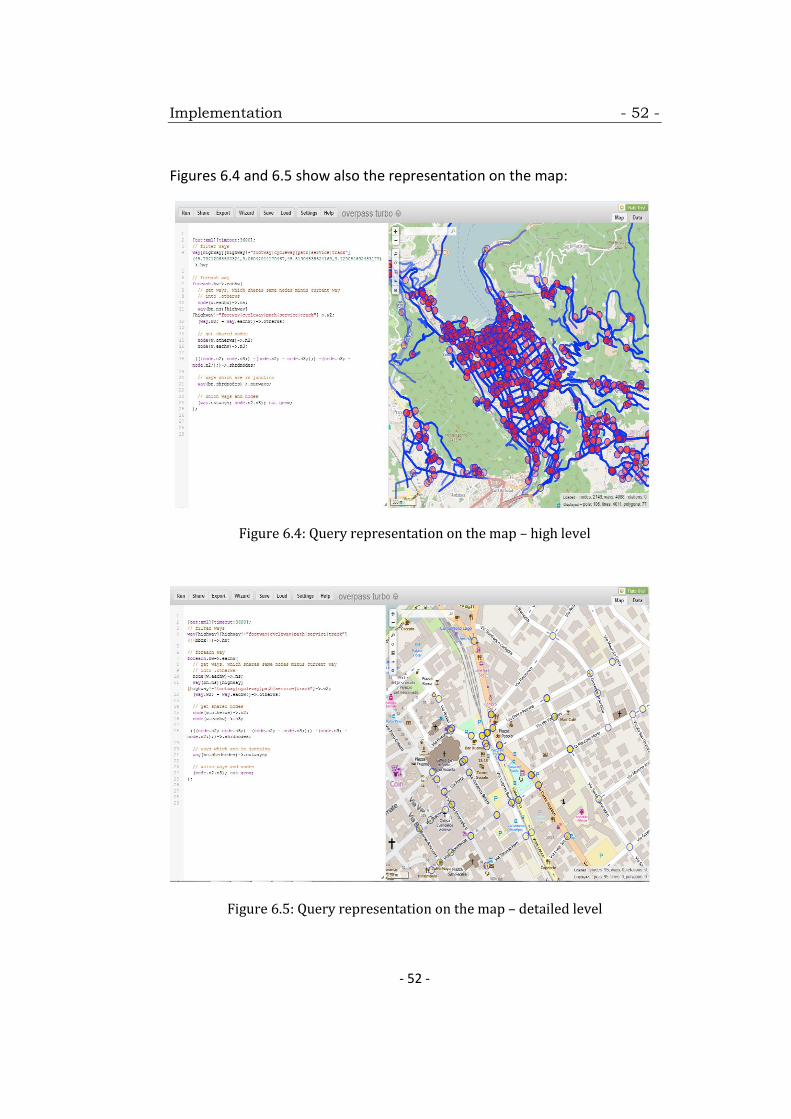
Figures 6.4 and 6.5 show also the representation on the map:
Figure 6.4: Query representation on the map – high level
Figure 6.5: Query representation on the map – detailed level
Implementation - 53 -
- 53 -
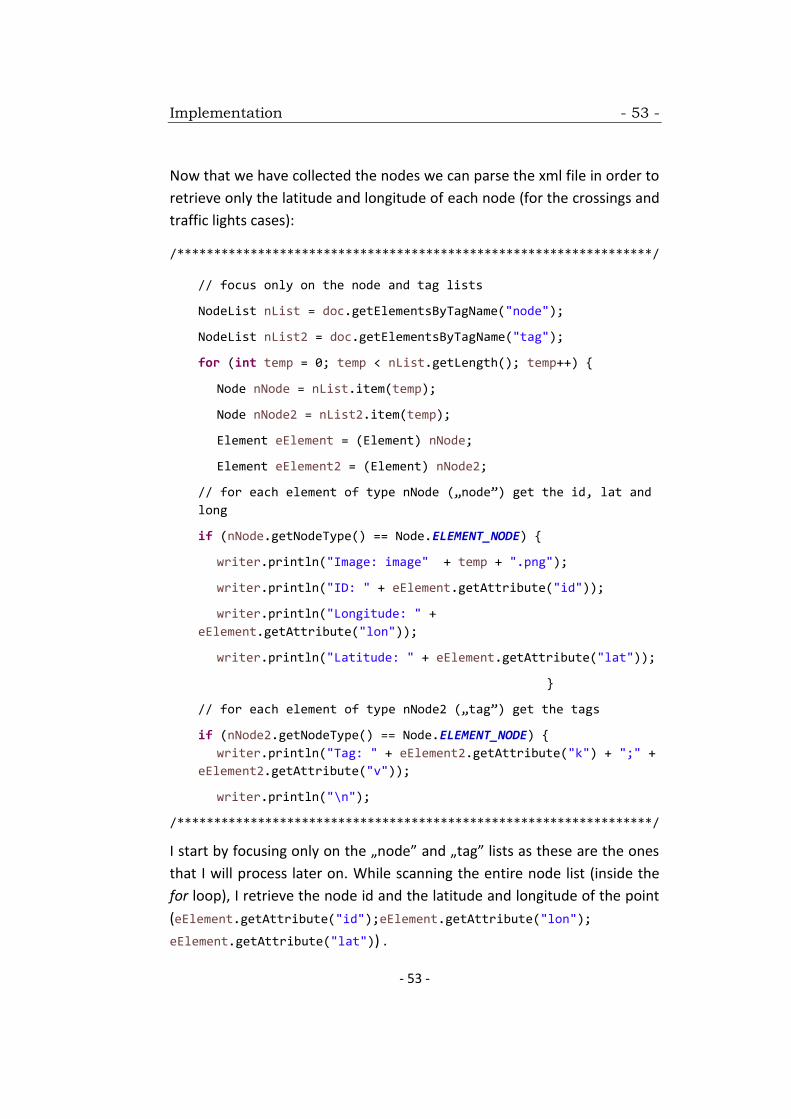
Now that we have collected the nodes we can parse the xml file in order to
retrieve only the latitude and longitude of each node (for the crossings and
traffic lights cases):
/*****************************************************************/
// focus only on the node and tag lists
NodeList nList = doc.getElementsByTagName("node");
NodeList nList2 = doc.getElementsByTagName("tag");
for (int temp = 0; temp < nList.getLength(); temp++) {
Node nNode = nList.item(temp);
Node nNode2 = nList2.item(temp);
Element eElement = (Element) nNode;
Element eElement2 = (Element) nNode2;
// for each element of type nNode („node”) get the id, lat and
long
if (nNode.getNodeType() == Node.ELEMENT_NODE) {
writer.println("Image: image" + temp + ".png");
writer.println("ID: " + eElement.getAttribute("id"));
writer.println("Longitude: " +
eElement.getAttribute("lon"));
writer.println("Latitude: " + eElement.getAttribute("lat"));
}
// for each element of type nNode2 („tag”) get the tags
if (nNode2.getNodeType() == Node.ELEMENT_NODE) {
writer.println("Tag: " + eElement2.getAttribute("k") + ";" +
eElement2.getAttribute("v"));
writer.println("\n");
/*****************************************************************/
I start by focusing only on the „node” and „tag” lists as these are the ones
that I will process later on. While scanning the entire node list (inside the
for loop), I retrieve the node id and the latitude and longitude of the point
(eElement.getAttribute("id");eElement.getAttribute("lon");
eElement.getAttribute("lat")) .
Implementation - 54 -
- 54 -
Due to the fact that the tag list is inside the node one, by simply checking if
it’s a tag, we can retrieve what type of OSM tag it is
(eElement2.getAttribute("k"); eElement2.getAttribute("v")).
The output will be of the following format:
/*****************************************************************/
Image: image0.png
ID: 152649789
Longitude: 9.0863774
Latitude: 45.8021613
Tag: highway;traffic_signals
/*****************************************************************/
The same code applies also for the intersection case, just that here we also
want to determine the street inclination (angle) the node belongs to.
The general formula for calculating the angle (bearing) between two
points, each having a latitude and longitude, is as follows:
θ = atan2(sin(Δlong)*cos(lat2), cos(lat1)*sin(lat2) −
sin(lat1)*cos(lat2)*cos(Δlong))
Where Δlong = long2 - long1.
atan2 is a common function found in almost all programming languages
(mostly in the Math package) which returns the angle whose tangent is the
quotient of two specified numbers. The return value is the angle in the
Cartesian plane formed by the x-axis, and a vector starting from the origin,
(0,0), and terminating at the point, (x,y)[18]. Since it returns values in the
range of -π ... +π, in order to convert the result to a compass bearing, θ
needs to be multiplied by 180/π and after to use (θ+360) % 360, where % is
modulus division operation returning the remainder of the division.
Implementation - 55 -
- 55 -
In Java the formula can be implemented using the below method:
/*****************************************************************/
static double angleFromCoordinate(double lat1, double long1, double
lat2, double long2) {
double dLon = (long2 - long1);
double y = Math.sin(dLon) * Math.cos(lat2);
double x = Math.cos(lat1) * Math.sin(lat2) -
Math.sin(lat1) * Math.cos(lat2) * Math.cos(dLon);
double brng = Math.atan2(y, x);
brng = Math.toDegrees(brng);
brng = (brng + 360) % 360;
brng = 360 - brng;
return brng;
}
/*****************************************************************/
For example, the following request with the heading being calculated using
the above method will give a proper output:
https://maps.googleapis.com/maps/api/streetview?size=600x600&locatio
n=45.7979860,9.0631094&fov=90&heading=187.24566002145684&pitch=
10
Implementation - 56 -
- 56 -
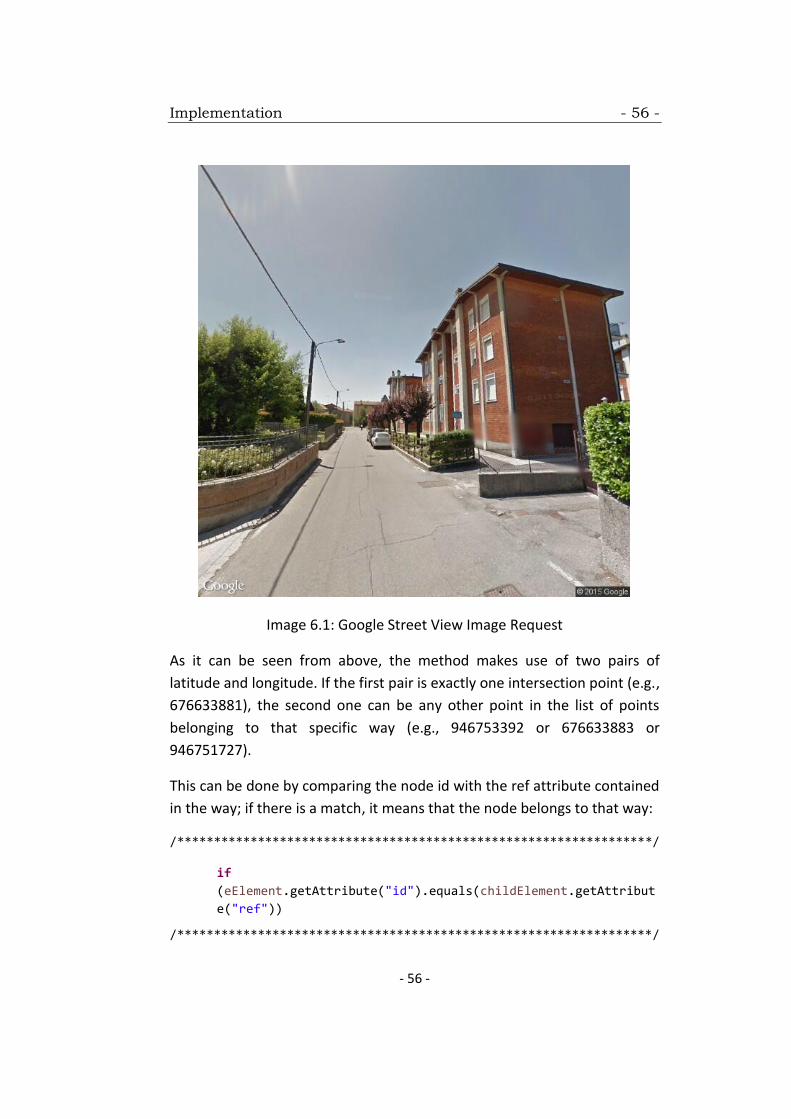
Image 6.1: Google Street View Image Request
As it can be seen from above, the method makes use of two pairs of
latitude and longitude. If the first pair is exactly one intersection point (e.g.,
676633881), the second one can be any other point in the list of points
belonging to that specific way (e.g., 946753392 or 676633883 or
946751727).
This can be done by comparing the node id with the ref attribute contained
in the way; if there is a match, it means that the node belongs to that way:
/*****************************************************************/
if
(eElement.getAttribute("id").equals(childElement.getAttribut
e("ref"))
/*****************************************************************/
Implementation - 57 -
- 57 -
Selecting the second node required by the angleFromCoordinate method
means scanning the entire ways the first node belongs to and retrieve any
other node from the way. In order to achieve this, some check-ups need to
be performed.
Going back to the above example, we see that node 676633881 occupies
the first position in the list but it can occupy any other position including
the last one. Therefore, the positions need to be checked accordingly:
- If it’s the first position => retrieve the second one
- If it’s in the middle => retrieve any other position
- If it’s the last position => retrieve the first one
/*****************************************************************/
NodeList nList2 = doc.getElementsByTagName("way");
for (int i = 0; i < nList2.getLength(); i++) {
Node nNode2 = nList2.item(i);
Element eElement2 = (Element) nNode2;
Node childNode = eElement2.getFirstChild();
Element childElementFirst= null;
Element childElementSecond= null;
if (nNode2.getNodeType() == Node.ELEMENT_NODE) {
int count=0;
while( childNode.getNextSibling() !=null ){
count++;
childNode = childNode.getNextSibling();
if (childNode.getNodeType() == Node.ELEMENT_NODE) {
Element childElement = (Element) childNode;
if(count <= 3){
childElementFirst=(Element) childNode;
}
if
(eElement.getAttribute("id").equals(childElement.getAttribut
e("ref")) &&
Implementation - 58 -
- 58 -
(!(eElement.getAttribute("id").equals(childElementFirst.getA
ttribute("ref"))))){
writer.println("WAY ID: " +
eElement2.getAttribute("id"));
writer.println("first: ID:
"+childElementFirst.getAttribute("ref") + " ; Lat: "+
childElementFirst.getAttribute("lat") +" ; Lon:"+
childElementFirst.getAttribute("lon"));
}
else if
(eElement.getAttribute("id").equals(childElement.getAttribute("ref"
)) &&
(eElement.getAttribute("id").equals(childElementFirst.getAttribute(
"ref")))){
writer.println("WAY ID: " +
eElement2.getAttribute("id"));
String[] rnd_pos =
arr_get_one(reflist,childElementFirst.getAttribute("ref"));
writer.println("next position: id: "+ rnd_pos[0] + " ;
lat:" + rnd_pos[1] + " ; lon:" + rnd_pos[2]);;}}
/*****************************************************************/
While count <= 3 means the first position in the way; it goes until 3
because, while scanning all the siblings, it takes into consideration also the
elements above the first "nd" – e.g. bounds.
/*****************************************************************/
(eElement.getAttribute("id").equals(childElement.getAttribute("ref"
)) &&
(!(eElement.getAttribute("id").equals(childElementFirst.getAttribut
e("ref")))))
/*****************************************************************/
If the node id == ref and it is not the first position => give me the first one.
/*****************************************************************/
(eElement.getAttribute("id").equals(childElement.getAttribute("ref"
)) &&
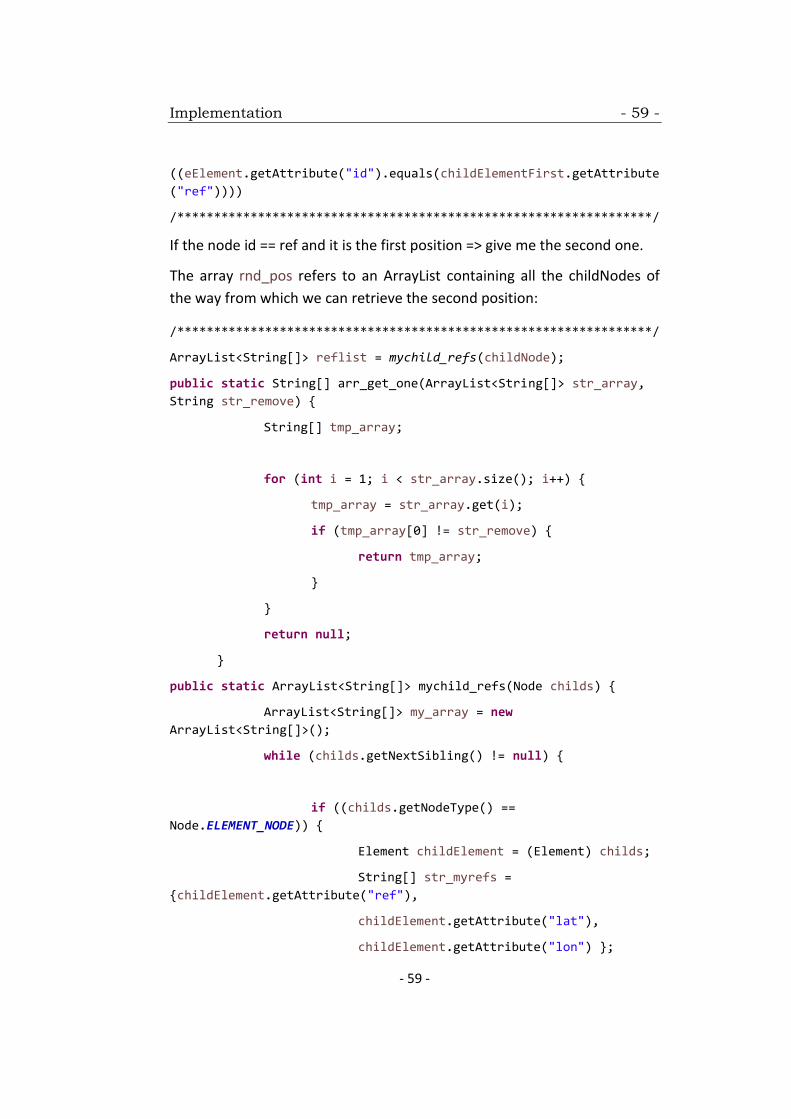
Implementation - 59 -
- 59 -
((eElement.getAttribute("id").equals(childElementFirst.getAttribute
("ref"))))
/*****************************************************************/
If the node id == ref and it is the first position => give me the second one.
The array rnd_pos refers to an ArrayList containing all the childNodes of
the way from which we can retrieve the second position:
/*****************************************************************/
ArrayList<String[]> reflist = mychild_refs(childNode);
public static String[] arr_get_one(ArrayList<String[]> str_array,
String str_remove) {
String[] tmp_array;
for (int i = 1; i < str_array.size(); i++) {
tmp_array = str_array.get(i);
if (tmp_array[0] != str_remove) {
return tmp_array;
}
}
return null;
}
public static ArrayList<String[]> mychild_refs(Node childs) {
ArrayList<String[]> my_array = new
ArrayList<String[]>();
while (childs.getNextSibling() != null) {
if ((childs.getNodeType() ==
Node.ELEMENT_NODE)) {
Element childElement = (Element) childs;
String[] str_myrefs =
{childElement.getAttribute("ref"),
childElement.getAttribute("lat"),
childElement.getAttribute("lon") };
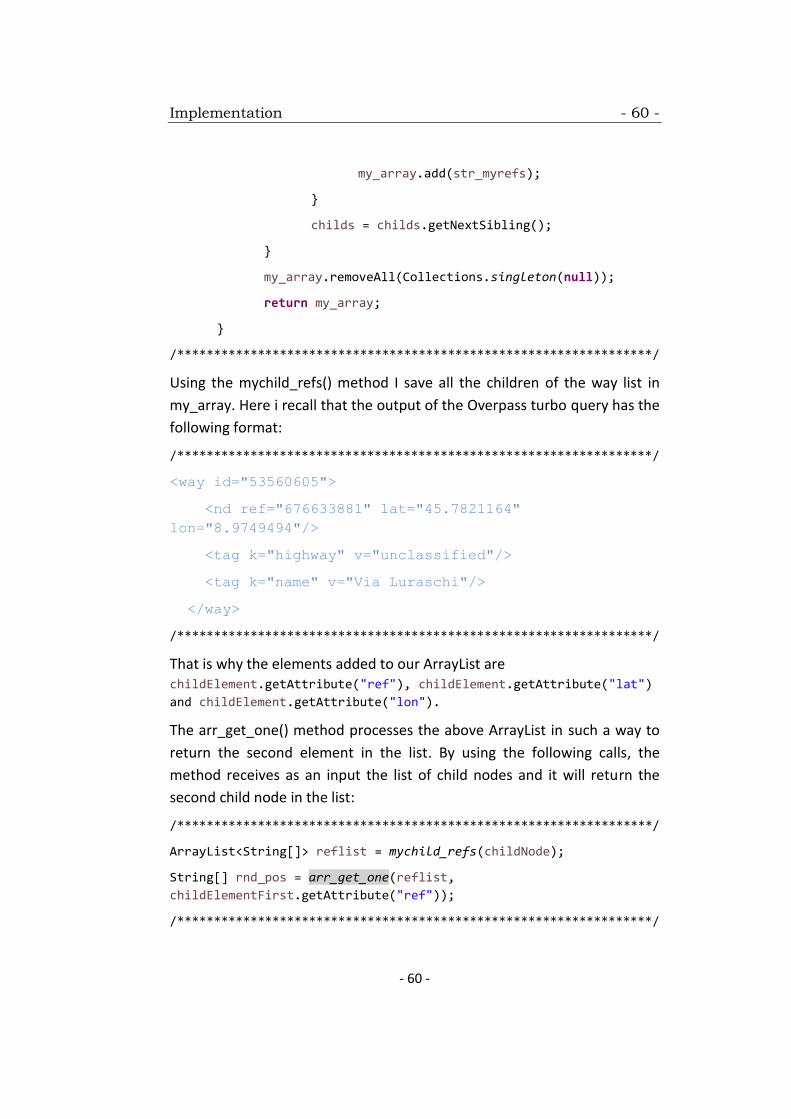
Implementation - 60 -
- 60 -
my_array.add(str_myrefs);
}
childs = childs.getNextSibling();
}
my_array.removeAll(Collections.singleton(null));
return my_array;
}
/*****************************************************************/
Using the mychild_refs() method I save all the children of the way list in
my_array. Here i recall that the output of the Overpass turbo query has the
following format:
/*****************************************************************/
<way id="53560605">
<nd ref="676633881" lat="45.7821164"
lon="8.9749494"/>
<tag k="highway" v="unclassified"/>
<tag k="name" v="Via Luraschi"/>
</way>
/*****************************************************************/
That is why the elements added to our ArrayList are childElement.getAttribute("ref"), childElement.getAttribute("lat")
and childElement.getAttribute("lon").
The arr_get_one() method processes the above ArrayList in such a way to
return the second element in the list. By using the following calls, the
method receives as an input the list of child nodes and it will return the
second child node in the list:
/*****************************************************************/
ArrayList<String[]> reflist = mychild_refs(childNode);
String[] rnd_pos = arr_get_one(reflist,
childElementFirst.getAttribute("ref"));
/*****************************************************************/
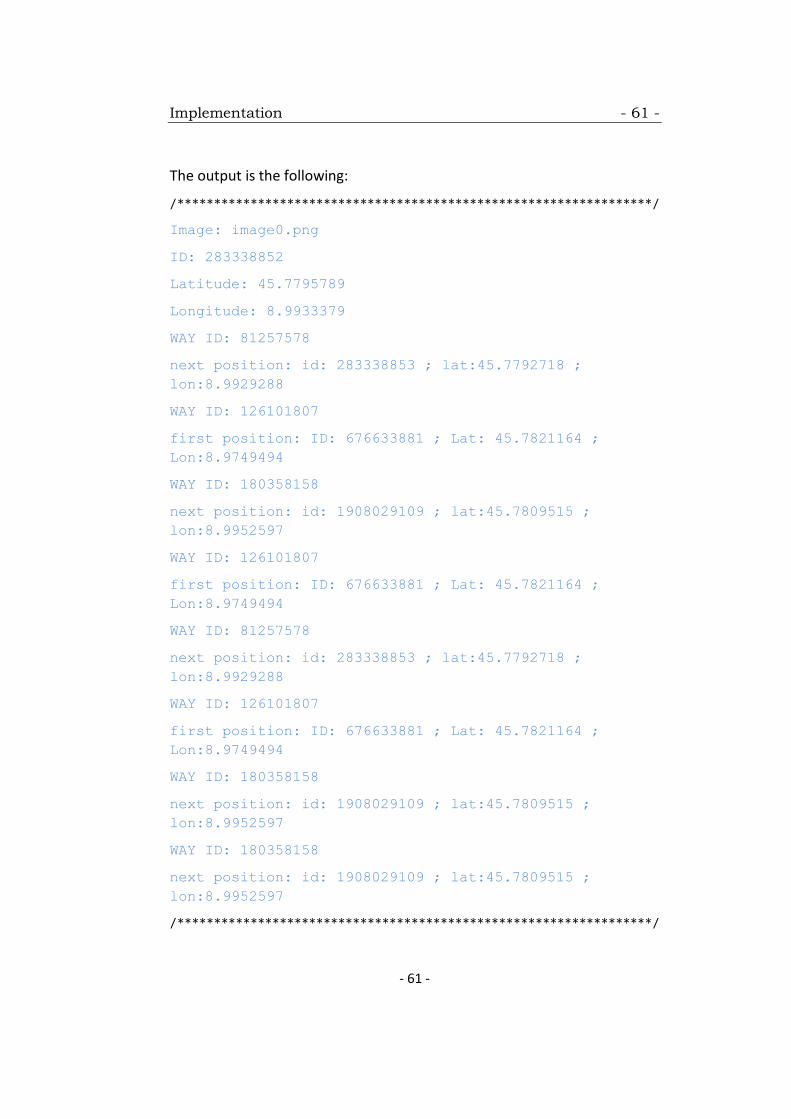
Implementation - 61 -
- 61 -
The output is the following:
/*****************************************************************/
Image: image0.png
ID: 283338852
Latitude: 45.7795789
Longitude: 8.9933379
WAY ID: 81257578
next position: id: 283338853 ; lat:45.7792718 ;
lon:8.9929288
WAY ID: 126101807
first position: ID: 676633881 ; Lat: 45.7821164 ;
Lon:8.9749494
WAY ID: 180358158
next position: id: 1908029109 ; lat:45.7809515 ;
lon:8.9952597
WAY ID: 126101807
first position: ID: 676633881 ; Lat: 45.7821164 ;
Lon:8.9749494
WAY ID: 81257578
next position: id: 283338853 ; lat:45.7792718 ;
lon:8.9929288
WAY ID: 126101807
first position: ID: 676633881 ; Lat: 45.7821164 ;
Lon:8.9749494
WAY ID: 180358158
next position: id: 1908029109 ; lat:45.7809515 ;
lon:8.9952597
WAY ID: 180358158
next position: id: 1908029109 ; lat:45.7809515 ;
lon:8.9952597
/*****************************************************************/
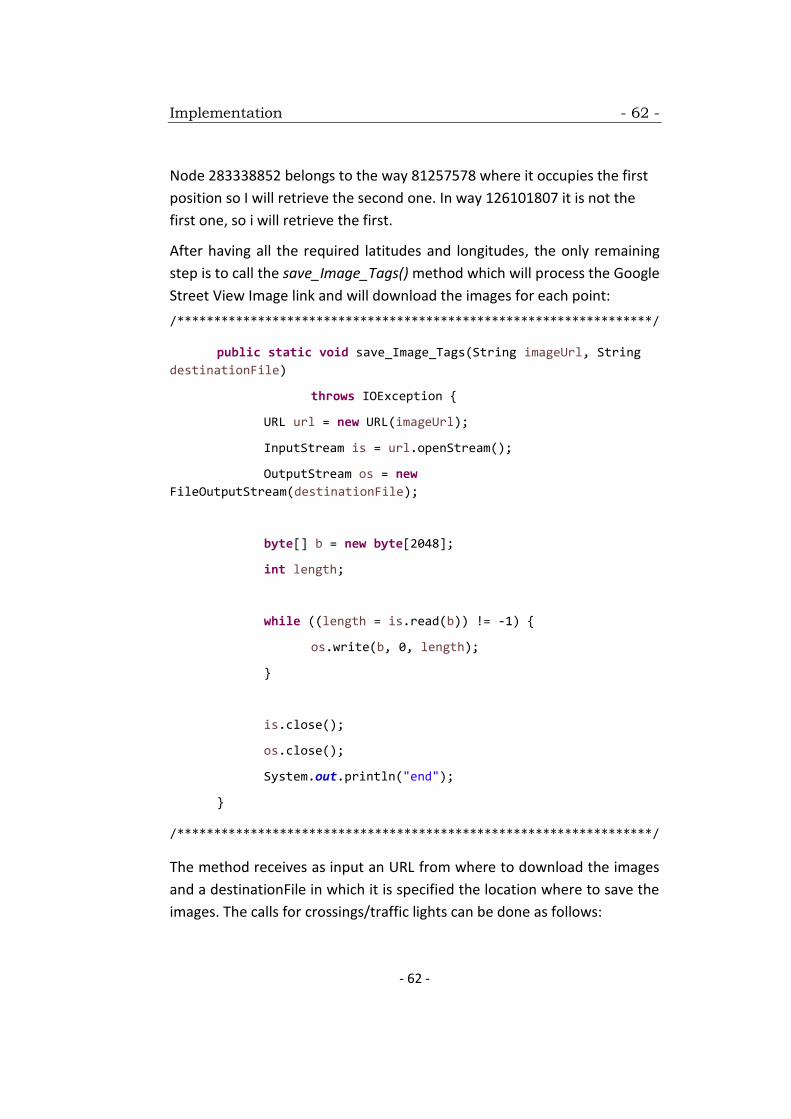
Implementation - 62 -
- 62 -
Node 283338852 belongs to the way 81257578 where it occupies the first
position so I will retrieve the second one. In way 126101807 it is not the
first one, so i will retrieve the first.
After having all the required latitudes and longitudes, the only remaining
step is to call the save_Image_Tags() method which will process the Google
Street View Image link and will download the images for each point:
/*****************************************************************/
public static void save_Image_Tags(String imageUrl, String
destinationFile)
throws IOException {
URL url = new URL(imageUrl);
InputStream is = url.openStream();
OutputStream os = new
FileOutputStream(destinationFile);
byte[] b = new byte[2048];
int length;
while ((length = is.read(b)) != -1) {
os.write(b, 0, length);
}
is.close();
os.close();
System.out.println("end");
}
/*****************************************************************/
The method receives as input an URL from where to download the images
and a destinationFile in which it is specified the location where to save the
images. The calls for crossings/traffic lights can be done as follows:

Implementation - 63 -
- 63 -
/*****************************************************************/
String imageUrl =
"https://maps.googleapis.com/maps/api/streetview?size=600x600&locat
ion="+eElement.getAttribute("lat") + ","
+eElement.getAttribute("lon") + "&fov=90&heading=0&pitch=10";
String destinationFile =
"/Users/Salai/workspaceEclipse/DownloadImagesForCrowdSourcing/cross
ings/image" + temp + ".png";
save_Image_Tags(imageUrl, destinationFile);
/*****************************************************************/
While for the intersections:
/*****************************************************************/
String imageUrl =
"https://maps.googleapis.com/maps/api/streetview?size=600x600&locat
ion="+ eElement.getAttribute("lat")+ "," +
eElement.getAttribute("lon") + "&fov=90&heading=" +
angleFromCoordinate(
Double.parseDouble(eElement.getAttribute("lat")),
Double.parseDouble(eElement.getAttribute("lon")),Double.parseDouble
(childElementFirst.getAttribute("lat")),Double.parseDouble(childEle
mentFirst.getAttribute("lon"))) + "&pitch=10";
/*****************************************************************/
And
/*****************************************************************/
String imageUrl =
"https://maps.googleapis.com/maps/api/streetview?size=600x600&locat
ion="+ eElement.getAttribute("lat")+ "," +
eElement.getAttribute("lon") + "&fov=90&heading=" +
angleFromCoordinate(
Double.parseDouble(eElement.getAttribute("lat")),
Double.parseDouble(eElement.getAttribute("lon")),Double.parseDouble
(rnd_pos[1]),Double.parseDouble(rnd_pos[2])) + "&pitch=10";
/*****************************************************************/
At this point we have downloaded all the images required which now can
be passed over to the crowdsourcing platform.
Chapter 7 - 64 -
- 64 -
Chapter 7
User Interface
The User Interface occupies a very important part in the thesis as it
represents the end point by which the users will interact with the project
itself. The goal of this interaction is to allow effective operation and control
of the process/machine from the human end, whilst the process/machine
simultaneously feeds back information that aids the operators' decision
making process[19].
Generally, the goal of user interface design is to produce a user interface
which makes it easy (self explanatory), efficient, and enjoyable (user
friendly) to operate a machine in the way which produces the desired
result. This generally means that the operator needs to provide minimal
input to achieve the desired output, and also that the machine minimizes
undesired outputs to the human[19].
Even though the user interface can arguably include the total "user
experience," which may include the aesthetic appearance of the device,
response time, and the content that is presented to the user within the
context of the user interface[20], for the time being, these aspects have not
been taken into consideration. If the users will be actively participating and
will provide an increased number of feedbacks (leading to a real success of
the platform) then, in addition to all future works presented in Chapter 9,
web and mobile accessibility features can be introduced. For the moment
the platform has been mostly designed as a web application but it can also
be extended to a mobile one. The accessibility features which can be
considered for both cases refer to the following major categories of
disability:
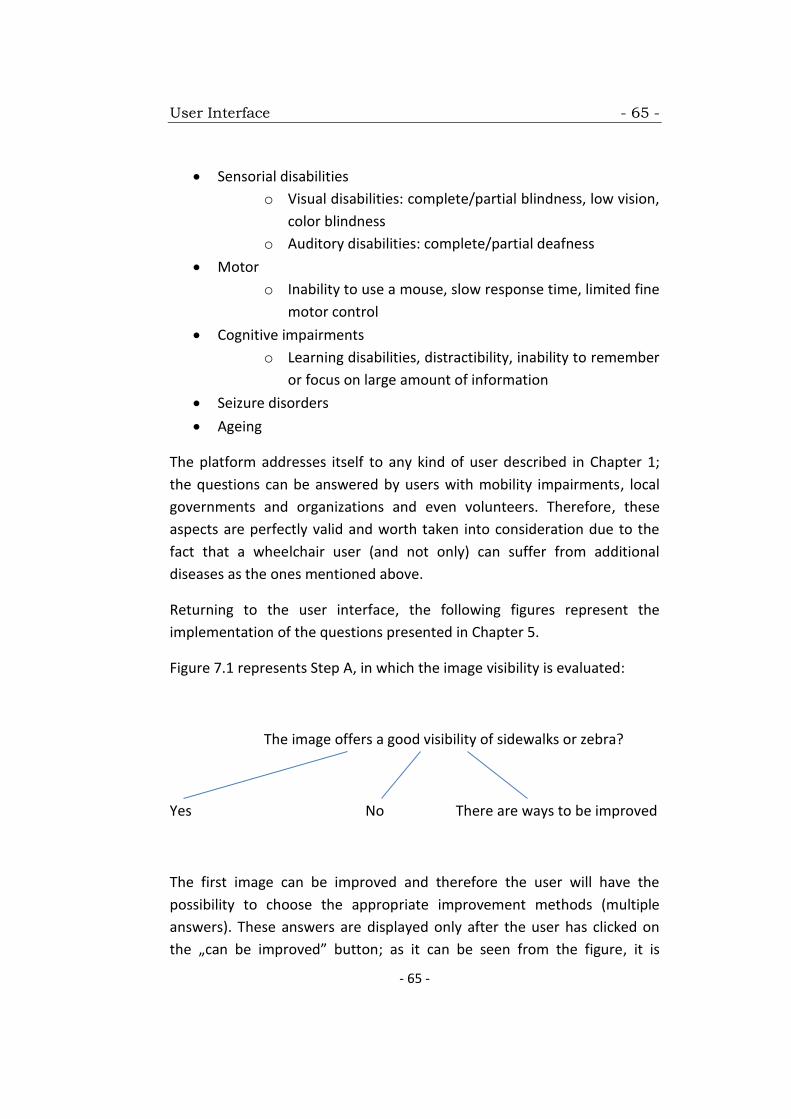
User Interface - 65 -
- 65 -
Sensorial disabilities
o Visual disabilities: complete/partial blindness, low vision,
color blindness
o Auditory disabilities: complete/partial deafness
Motor
o Inability to use a mouse, slow response time, limited fine
motor control
Cognitive impairments
o Learning disabilities, distractibility, inability to remember
or focus on large amount of information
Seizure disorders
Ageing
The platform addresses itself to any kind of user described in Chapter 1;
the questions can be answered by users with mobility impairments, local
governments and organizations and even volunteers. Therefore, these
aspects are perfectly valid and worth taken into consideration due to the
fact that a wheelchair user (and not only) can suffer from additional
diseases as the ones mentioned above.
Returning to the user interface, the following figures represent the
implementation of the questions presented in Chapter 5.
Figure 7.1 represents Step A, in which the image visibility is evaluated:
The image offers a good visibility of sidewalks or zebra?
Yes No There are ways to be improved
The first image can be improved and therefore the user will have the
possibility to choose the appropriate improvement methods (multiple
answers). These answers are displayed only after the user has clicked on
the „can be improved” button; as it can be seen from the figure, it is
User Interface - 66 -
- 66 -
highlighted in a different way from the other two buttons. The second
image does not offer any proper visibility over the sidewalks and zebras
and it will be removed; the image will not be completely deleted as it
represents a strategic point in the configuration of the accessible path.
Instead, a new image will have to be generated, from the same location
but having a different orientation (the heading, fov and pitch elements in
the Google Street View Image link will have different values). The third and
the fourth images offer a good visibility over the sidewalks and zebras and
therefore it can be proceed to steps B and C.
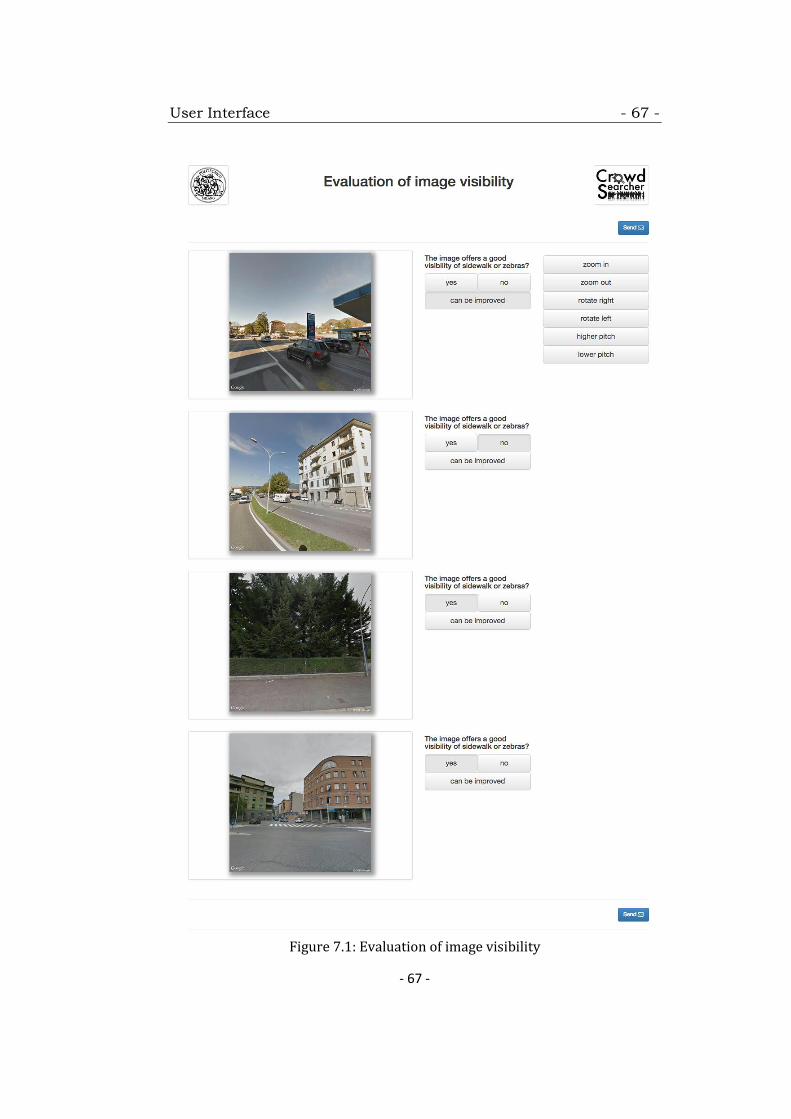
User Interface - 67 -
- 67 -
Figure 7.1: Evaluation of image visibility
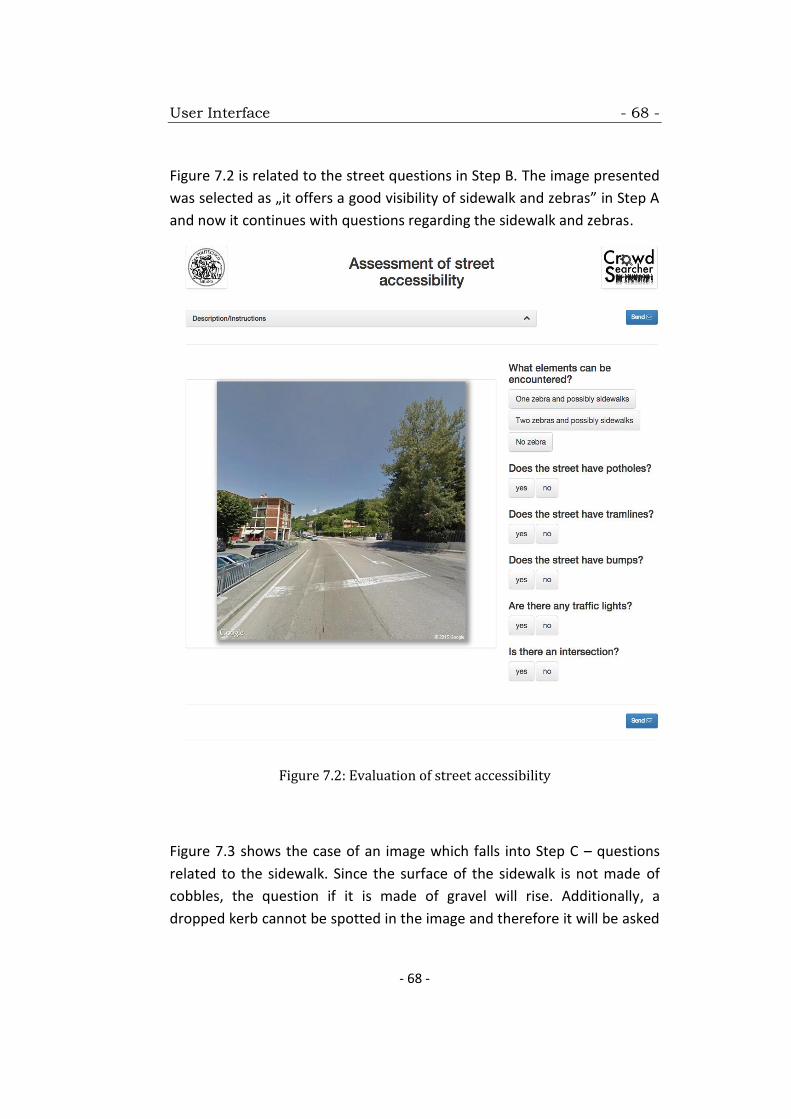
User Interface - 68 -
- 68 -
Figure 7.2 is related to the street questions in Step B. The image presented
was selected as „it offers a good visibility of sidewalk and zebras” in Step A
and now it continues with questions regarding the sidewalk and zebras.
Figure 7.2: Evaluation of street accessibility
Figure 7.3 shows the case of an image which falls into Step C – questions
related to the sidewalk. Since the surface of the sidewalk is not made of
cobbles, the question if it is made of gravel will rise. Additionally, a
dropped kerb cannot be spotted in the image and therefore it will be asked
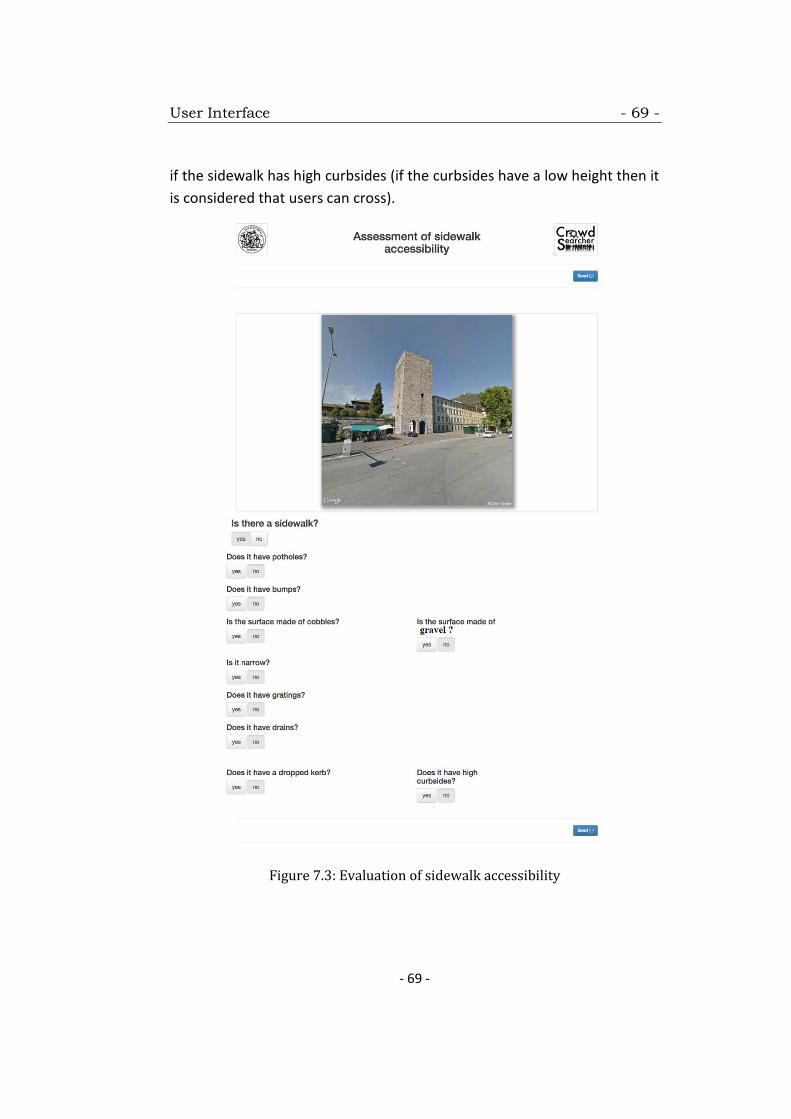
User Interface - 69 -
- 69 -
if the sidewalk has high curbsides (if the curbsides have a low height then it
is considered that users can cross).
Figure 7.3: Evaluation of sidewalk accessibility
Chapter 8 - 70 -
- 70 -
Chapter 8
Conclusion
Large cities are built and designed based on the needs of mobile people,
architectural preferences and budgets. Unfortunately, this constitutes a big
disadvantaged for those with mobility disabilities. Wheelchair users are
regularly hindered by barriers from participating in daily life on their own.
The research work presented in this thesis aims in solving this problem by
means of crowdsourcing and street view images. The process consists of
street view images which are sent to users via crowdsourcing platform and
are marked as accessible and non-accessible based on their feedback.
These images focus on specific points (crossings, traffic lights and
intersections) and precise questions are being asked in order to determine
the accessibility of these points.
I first started by analyzing the best way to collect the images; this
can be done by combining OpenStreetMap with Google Street View Image.
OpenStreetMap offers pre-defined tags for crossings and traffic lights; for
intersections, instead, special queries in Overpass Turbo were needed. The
requests for these tags give as an output an xml file containing geographic
points, more precisely the latitude and longitude of the points which are
crossings, traffic lights and intersections. By parsing these xml files in a Java
software, only the latitude and longitudes are extracted which later on are
used in constructing the Google Street View Image link, a link which
provides the images needed for the crowdsourcing (images focusing on the
three points of interest).
Conclusion - 71 -
- 71 -
In the meantime I was also focusing on the accessibility questions. By
analyzing and reviewing specialized literature, I tried to determine the
most important problems a wheelchair user can encounter by going on a
street. Even though the list is long, I focused only on aspects related to
zebras and sidewalks which can be determined by analyzing the images:
High kerbs
Position and nature of dropped kerbs
Pavements (Cobbles, Gratings and drains, Potholes, etc.)
Temporary obstacles
As it is described in Chapter 7, there are several features which can be
added to the application. If the adoption of the platform reaches a level
where accessibility issues are reported with high frequency, then all these
can lead to a big help for wheelchair users (and not only) and hopefully in
the near future to accessible cities.
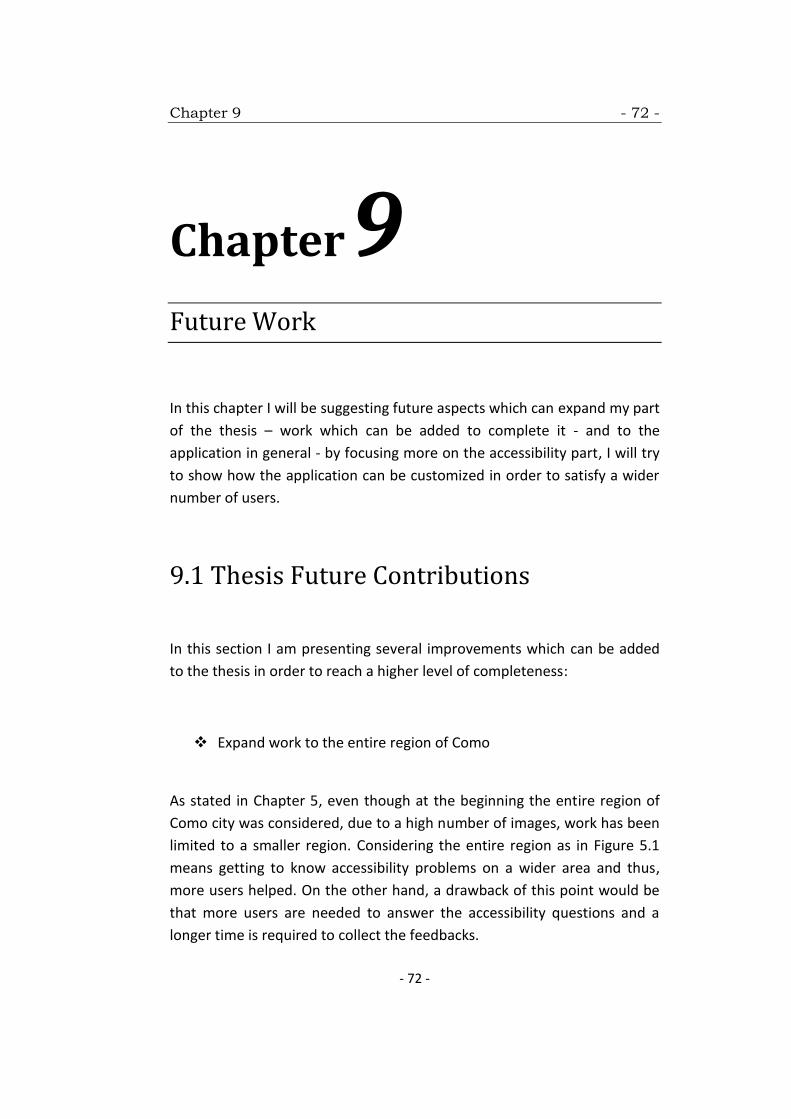
Chapter 9 - 72 -
- 72 -
Chapter 9
Future Work
In this chapter I will be suggesting future aspects which can expand my part
of the thesis – work which can be added to complete it - and to the
application in general - by focusing more on the accessibility part, I will try
to show how the application can be customized in order to satisfy a wider
number of users.
9.1 Thesis Future Contributions
In this section I am presenting several improvements which can be added
to the thesis in order to reach a higher level of completeness:
Expand work to the entire region of Como
As stated in Chapter 5, even though at the beginning the entire region of
Como city was considered, due to a high number of images, work has been
limited to a smaller region. Considering the entire region as in Figure 5.1
means getting to know accessibility problems on a wider area and thus,
more users helped. On the other hand, a drawback of this point would be
that more users are needed to answer the accessibility questions and a
longer time is required to collect the feedbacks.
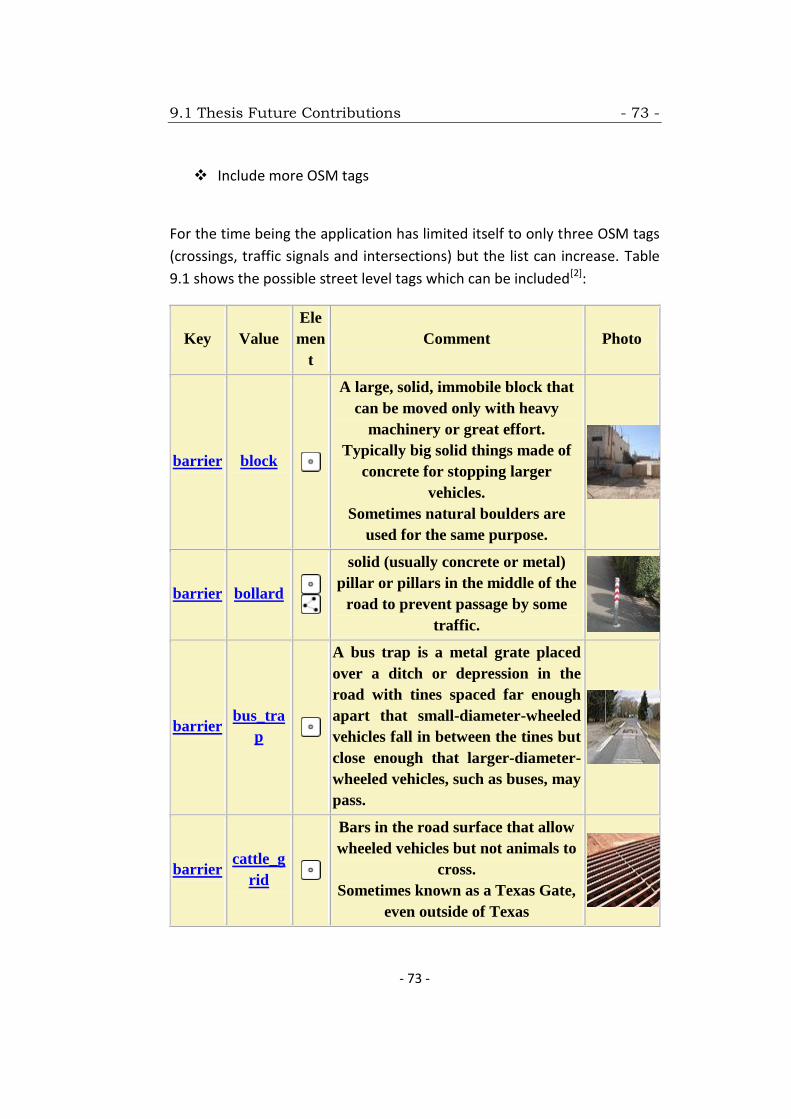
9.1 Thesis Future Contributions - 73 -
- 73 -
Include more OSM tags
For the time being the application has limited itself to only three OSM tags
(crossings, traffic signals and intersections) but the list can increase. Table
9.1 shows the possible street level tags which can be included[2]:
Key Value
Ele
men
t
Comment Photo
barrier block
A large, solid, immobile block that
can be moved only with heavy
machinery or great effort.
Typically big solid things made of
concrete for stopping larger
vehicles.
Sometimes natural boulders are
used for the same purpose.
barrier bollard
solid (usually concrete or metal)
pillar or pillars in the middle of the
road to prevent passage by some
traffic.
barrier bus_tra
p
A bus trap is a metal grate placed
over a ditch or depression in the
road with tines spaced far enough
apart that small-diameter-wheeled
vehicles fall in between the tines but
close enough that larger-diameter-
wheeled vehicles, such as buses, may
pass.
barrier cattle_g
rid
Bars in the road surface that allow
wheeled vehicles but not animals to
cross.
Sometimes known as a Texas Gate,
even outside of Texas
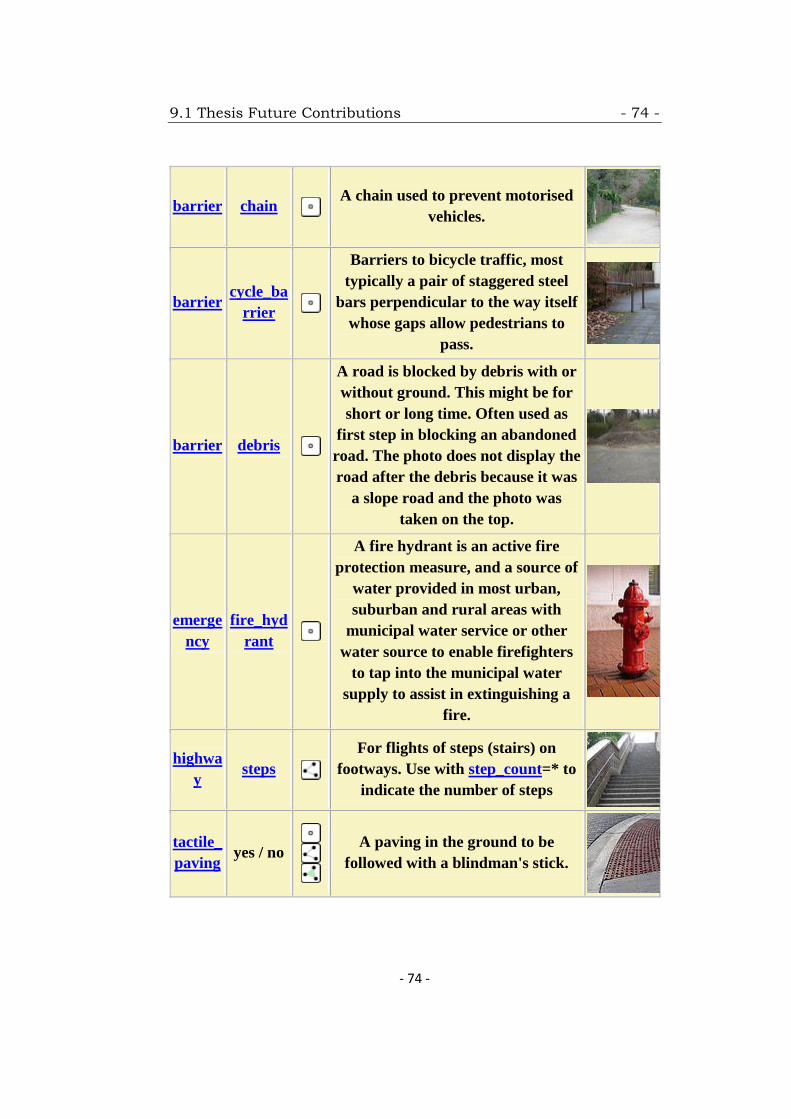
9.1 Thesis Future Contributions - 74 -
- 74 -
barrier chain
A chain used to prevent motorised
vehicles.
barrier cycle_ba
rrier
Barriers to bicycle traffic, most
typically a pair of staggered steel
bars perpendicular to the way itself
whose gaps allow pedestrians to
pass.
barrier debris
A road is blocked by debris with or
without ground. This might be for
short or long time. Often used as
first step in blocking an abandoned
road. The photo does not display the
road after the debris because it was
a slope road and the photo was
taken on the top.
emerge
ncy
fire_hyd
rant
A fire hydrant is an active fire
protection measure, and a source of
water provided in most urban,
suburban and rural areas with
municipal water service or other
water source to enable firefighters
to tap into the municipal water
supply to assist in extinguishing a
fire.
highwa
y steps
For flights of steps (stairs) on
footways. Use with step_count=* to
indicate the number of steps
tactile_
paving yes / no
A paving in the ground to be
followed with a blindman's stick.

9.1 Thesis Future Contributions - 75 -
- 75 -
trackty
pe
grade1/
grade2/
grade3/
grade4/
grade5
To describe the quality of the
surface.
traffic_
calmin
g
yes/
bump/
hump/
cushion/
table.
Traffic calming consists of
engineering and other measures put
in place on roads for slowing down
or reducing motor-vehicle traffic as
well as to improve safety for
pedestrians and cyclists.
barrier kerb
A (for example footway) kerb is a
barrier for vehicles and wheelchair
drivers. The height of the kerb is
important and with this
information, the usage by different
groups can be determined. The
height of the kerb is tagged
additionally as height=*, if
available. Right side is bottom, left
side is top.
barrier wall
a freestanding solid structure
designed to restrict or prevent
movement across a boundary.
Usually made from solid brick,
concrete or stone and almost always
built so that it is opaque to vision.
bridge yes
If the railway goes over a street,
waterway or other railway.
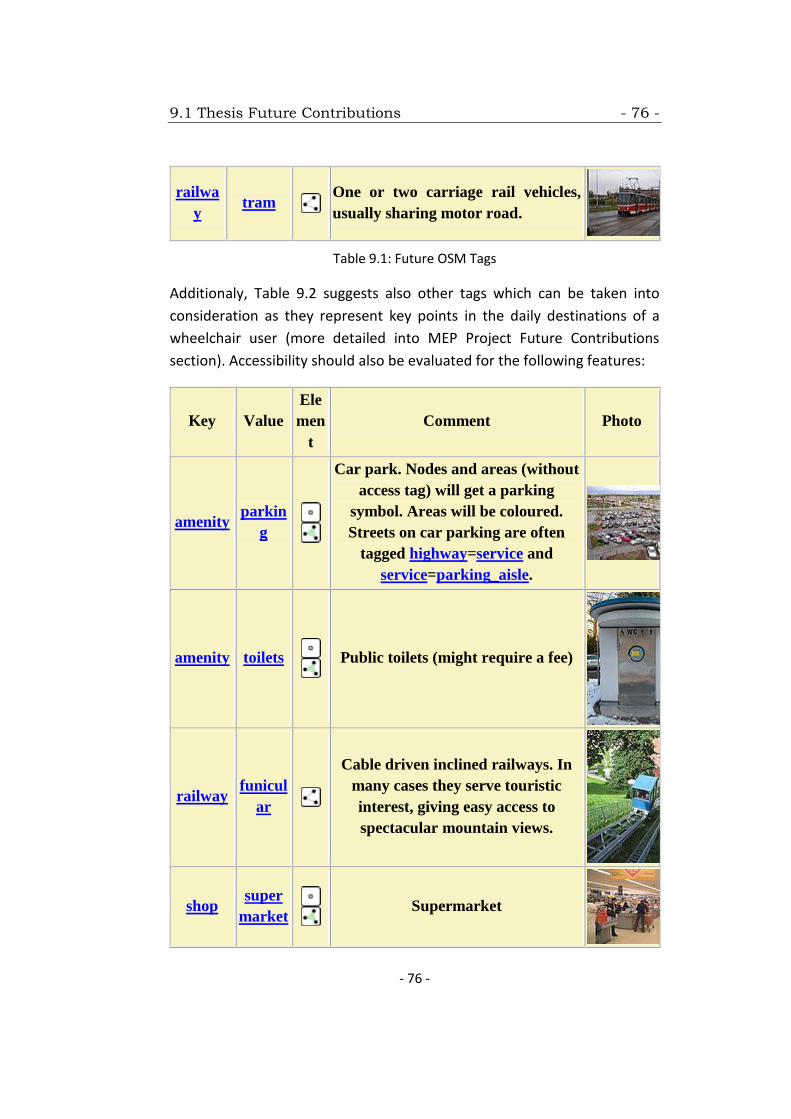
9.1 Thesis Future Contributions - 76 -
- 76 -
railwa
y tram
One or two carriage rail vehicles,
usually sharing motor road.
Table 9.1: Future OSM Tags
Additionaly, Table 9.2 suggests also other tags which can be taken into
consideration as they represent key points in the daily destinations of a
wheelchair user (more detailed into MEP Project Future Contributions
section). Accessibility should also be evaluated for the following features:
Key Value
Ele
men
t
Comment Photo
amenity parkin
g
Car park. Nodes and areas (without
access tag) will get a parking
symbol. Areas will be coloured.
Streets on car parking are often
tagged highway=service and
service=parking_aisle.
amenity toilets
Public toilets (might require a fee)
railway funicul
ar
Cable driven inclined railways. In
many cases they serve touristic
interest, giving easy access to
spectacular mountain views.
shop super
market
Supermarket
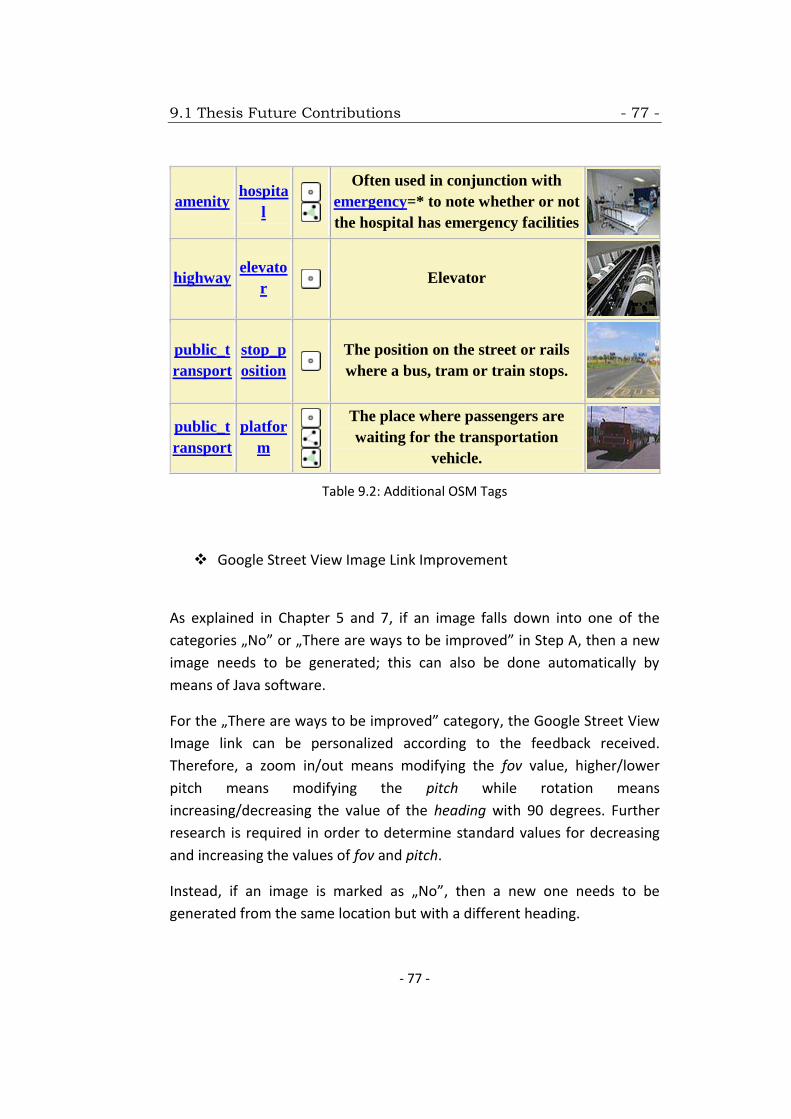
9.1 Thesis Future Contributions - 77 -
- 77 -
amenity hospita
l
Often used in conjunction with
emergency=* to note whether or not
the hospital has emergency facilities
highway elevato
r
Elevator
public_t
ransport
stop_p
osition
The position on the street or rails
where a bus, tram or train stops.
public_t
ransport
platfor
m
The place where passengers are
waiting for the transportation
vehicle.
Table 9.2: Additional OSM Tags
Google Street View Image Link Improvement
As explained in Chapter 5 and 7, if an image falls down into one of the
categories „No” or „There are ways to be improved” in Step A, then a new
image needs to be generated; this can also be done automatically by
means of Java software.
For the „There are ways to be improved” category, the Google Street View
Image link can be personalized according to the feedback received.
Therefore, a zoom in/out means modifying the fov value, higher/lower
pitch means modifying the pitch while rotation means
increasing/decreasing the value of the heading with 90 degrees. Further
research is required in order to determine standard values for decreasing
and increasing the values of fov and pitch.
Instead, if an image is marked as „No”, then a new one needs to be
generated from the same location but with a different heading.
9.2 MEP Project Future Contributions - 78 -
- 78 -
The new images will also be subject to questioning, ending up in a loop
until they get to be marked as „Yes” – they offer a good visibility over the
points of interest.
Profiling the users evaluating the images
For the time being, the application focuses on wheelchair users and
therefore, they represent the best category of users to evaluate the
images. In addition, also families and specialized volunteers suit best as
they have direct contact with the problems a wheelchair user might
encounter.
9.2 MEP Project Future Contributions
In addition to all features described in Chapter 4, the following are
suggested:
Application customization based on how severe the disability is:
According to [14], wheelchair users can be divided into three sub groups:
Active - Are very active and athletic wheelchair users that are for
example able to do certain sports, are very independent, are able to
travel long distances on their own and are able to overcome many
obstacles and barriers that wheelchair users from the following two
groups can’t. All of the active wheelchair users use manual
wheelchairs.
Partly Help Dependent - Are still active but not athletic and their
disability does not allow them to do any sports or similar. Traveling
through the city without any help is very exhausting for them, so
9.2 MEP Project Future Contributions - 79 -
- 79 -
they need help to complete certain daily tasks, to overcome
obstacles and barriers and to travel longer distances. This group
uses manual or electric wheelchairs.
Help Dependent - Their disability does not allow them to be active
or athletic and even short distances are very exhausting for them.
They use electric wheelchairs which makes it very difficult to
overcome any barriers or obstacles, so they are restricted most
when traveling through the city. In general, even for small daily
tasks like shopping they depend on help 24/7.
The group of helpers mentioned above can be divided into two sub groups:
Family, Voluntary Helpers, Friends - This group has an intrinsic
motivation to help their friends or family members in wheelchairs.
They are looking for ways to contribute to ease the wheelchair
users burden and to help them to get up to date information about
barriers and obstacles so they can avoid them.
Organizations, Associations, Social Workers – Professional
organizations to support disabled people as well as facilities like
assisted living homes or retirement homes are constantly looking
for ways to support their disabled customers as well as their own
employees better at regular tasks like for example organized guided
wheelchair excursions through the city. These organizations need
up to date data about obstacles and barriers to put more pressure
on city planners. Only so, they can motivate them to renovate parts
of the city, to remove barriers and to include these parameters and
needs into future city plans.
The street navigation and even the design of the mobile application can be
customized in order to serve the three categories presented above. In
addition to this, additional applications can be created for the group of
9.2 MEP Project Future Contributions - 80 -
- 80 -
helpers; they might contain information on how to help the user in special
cases, how to deal with accidents, reminders and to-do lists.
Sentiment Analysis
This option can show how happy users are with their experience on going
on the street; if the analysis can be done on specific streets/ access points
in the city, then even the accessible path can be generated according to
user’s sentiments.
As suggested in [15], Sentiment Analysis, which aims in identifying the
subjective state of human beings, such as emotions, through language
processing analysis, has the benefit that more information about the state
of the users can be added in an automatic way, improving the estimation
of the crucial problems to be solved in the city.
Prioritization is another aspect which can be taken into consideration;
based on the number of user reports addressing the same accessibility
issue in the city, one can have a first evaluation of how many people are
being affected by it. Nevertheless, different issues affects people in
different ways. Some issues may be a simple inconvenient, while others
may hinder people from reaching their destinations. Different techniques,
such as Sentiment Analysis, help to give relevant insights about how severe
an issue is, and what are its direct and indirect effects in people’s life.
In order to assign a priority level to an urban event, all this evaluations
must be aggregated to determine how negative the effect of an event is
over the population. Events that are preponderantly negative must be
resolved more urgently than neutral ones, thus receiving a higher priority.
An Analytic Hierarchy Process may be used in order to assign weights to
the criteria used to define priority levels.
9.2 MEP Project Future Contributions - 81 -
- 81 -
Frequency of Destinations Analysis
Based on the interviews conducted in [16], the most commonly daily
destinations by 20 (80%) or more of the 25 respondents, were food stores,
restaurants and bars, drug stores and other kinds of stores and shops.
Destinations reported with moderate frequency (>10–19 respondents, or
40–76% of the sample) included ATMs, friends’ or relatives’ homes, other
places for recreation or leisure, work places, doctors’ offices, churches,
synagogues or other religious buildings and civic buildings. Less frequently
reported destinations (11 respondents, 40% of the sample) included
school, movies, dentists’ or other health professionals’ offices, libraries,
sporting events and parks.
Taking into consideration these aspects, the application can be customized
in such a way to provide further assistance for the most important points
(e.g., remote communication); also these data can be communicated to
municipalities in order to help building more accessible cities.
Comfort
Comfort deals with the possibility of undertaking any intended activity
without more effort than the daily practice requires. It considers in this
way the characteristics present in the space that may cause some
discomfort. It also may expose one to outdoor urban conditions like noise
and air pollution and climate protection. (Cardoso,2012; Keppe Jr., 2008;
Stradling, 2007). Aspects such as air pollution, exposure to noise, degree of
accessibility to route, rest areas, shade and protection against sun and rain,
time length to reach a destination, effort and other external factors which
can cause stress can be taken into consideration when building the
accessible navigation.
9.2 MEP Project Future Contributions - 82 -
- 82 -
Keep the user engaged
The application should provide feedbacks to users whenever reported
issues were addressed in order to keep them engaged. The concept of
crowdsourcing for mapping of issues in a city stimulates citizen’s
engagement and in the same time helps improving the application. New
ideas, an increased number of feedbacks and other daily activities can be
rewarded; the only aspect that needs to be considered is the validity of the
feedbacks.
Chapter 10 - 83 -
- 83 -
Chapter 10
Bibliography
[1]OpenStreetMap, https://en.wikipedia.org/wiki/OpenStreetMap
[2] Map Features, http://wiki.openstreetmap.org/wiki/Map_Features
[3] Tags, http://wiki.openstreetmap.org/wiki/Tags
[4] Overpass API/Overpass QL,
http://wiki.openstreetmap.org/wiki/Overpass_API/Overpass_QL
[5] Google Street View Image API,
https://developers.google.com/maps/documentation/streetview/intro
*6+ Andrea Mauri, POLITECNICO DI MILANO , „METHODOLOGIES FOR THE
DEVELOPMENT OF CROWD AND SOCIAL-BASED APPLICATIONS”
[7] Java (programming language) ,
https://en.wikipedia.org/wiki/Java_%28programming_language%29
[8] Lorena de Freitas Pereira, Mariana Silva de Albuquerque, Licínio da Silva
Portugal, „Access of wheelchair users in sportive mega events: the case of
Confederation Cup” , E340XVIII Congreso Panamericano de Ingeniería de
Tránsito, Transporte y Logística (PANAM 2014)
[9] Rosemary D.F. Bromley , David L. Matthews and Colin J. Thomas, „City
centre accessibility for wheelchair users: The consumer perspective and
the planning implications”
*10+ Hugh Matthews, Linda Beale, Phil Picton and David Briggs, „Modelling
Access with GIS in Urban Systems (MAGUS): capturing the experiences of
wheelchair users”
Bibliography - 84 -
- 84 -
[11] Xapi Service Developer's Guide, http://open.mapquestapi.com/xapi/
[12] Maps for Easy Paths, http://mep5x1000.wix.com/mepapp
[13] European Day for People with Disabilities: the Swedish city of Borås
wins the Access City Award 2015 for disabled-friendly cities,
http://europa.eu/rapid/press-release_IP-14-2321_en.htm
[14] Christian Menkens, Julian Sussmann, Miriam Al-Ali, Emanuel
Breitsameter, Jelena Frtunik, Tobias Nendel, Tobias Schneiderbauer,
„EasyWheel - A Mobile Social Navigation and Support System for
Wheelchair Users”, Eighth International Conference on Information
Technology: New Generations, 2011
[15] Carlos Cardonha, Diego Gallo, Priscilla Avegliano, Ricardo Herrmann,
Fernando Koch, and Sergio Borger, „A Crowdsourcing Platform for the
Construction of Accessibility Maps”
[16] Allan R. Meyers, Jennifer J. Anderson, Donald R. Miller, Kathy Shipp,
Helen Hoenig, „Barriers, facilitators, and access for wheelchair users:
substantive and methodologic lessons from a pilot study of environmental
effects”
[17] Overpass turbo, http://wiki.openstreetmap.org/wiki/Overpass_turbo
[18] Math.Atan2 Method,
https://msdn.microsoft.com/en-
us/library/system.math.atan2%28v=vs.110%29.aspx
[19] User Interface, https://en.wikipedia.org/wiki/User_interface
[20] User interface (UI) definition,
http://searchsoa.techtarget.com/definition/user-interface
[21] Key:highway, http://wiki.openstreetmap.org/wiki/Key:highway
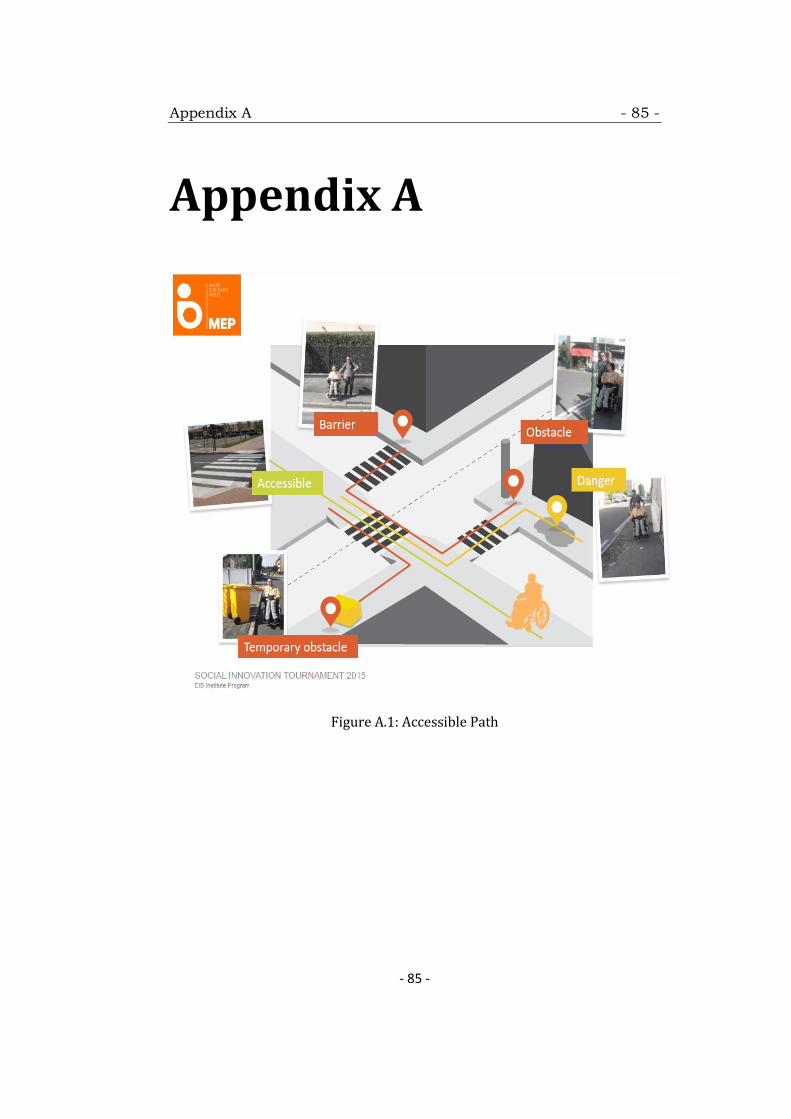
Appendix A - 85 -
- 85 -
Appendix A
Figure A.1: Accessible Path
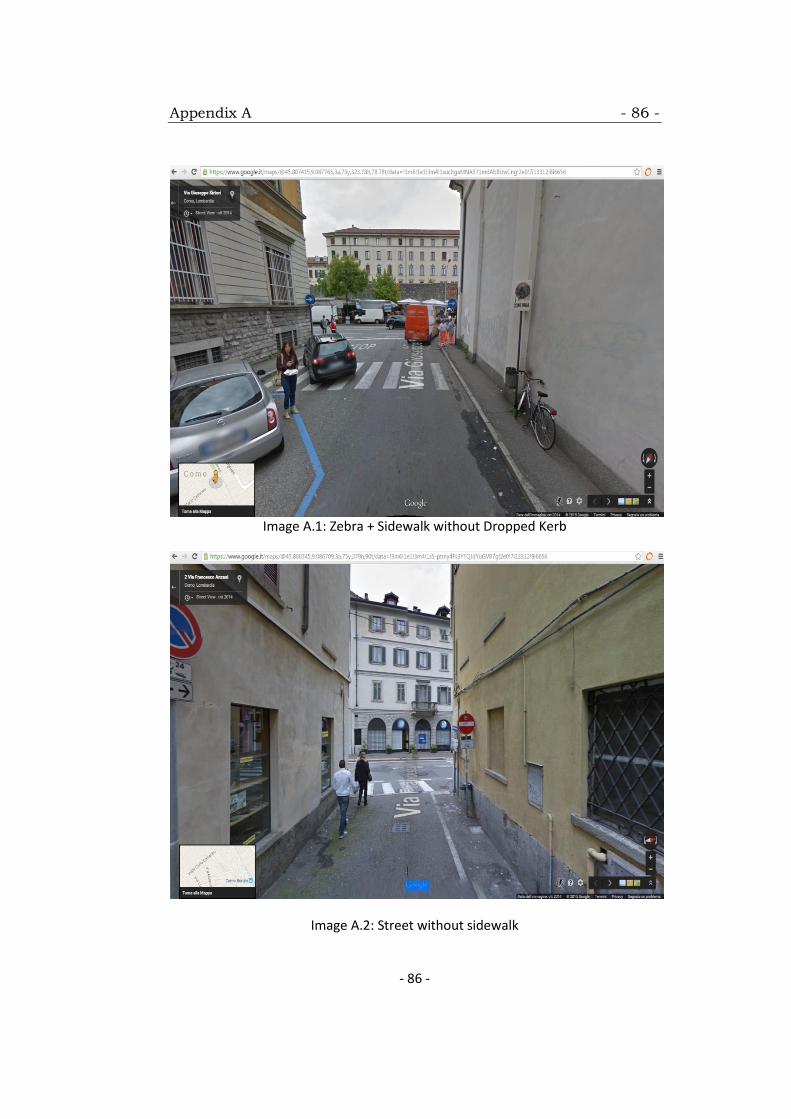
Appendix A - 86 -
- 86 -
Image A.1: Zebra + Sidewalk without Dropped Kerb
Image A.2: Street without sidewalk
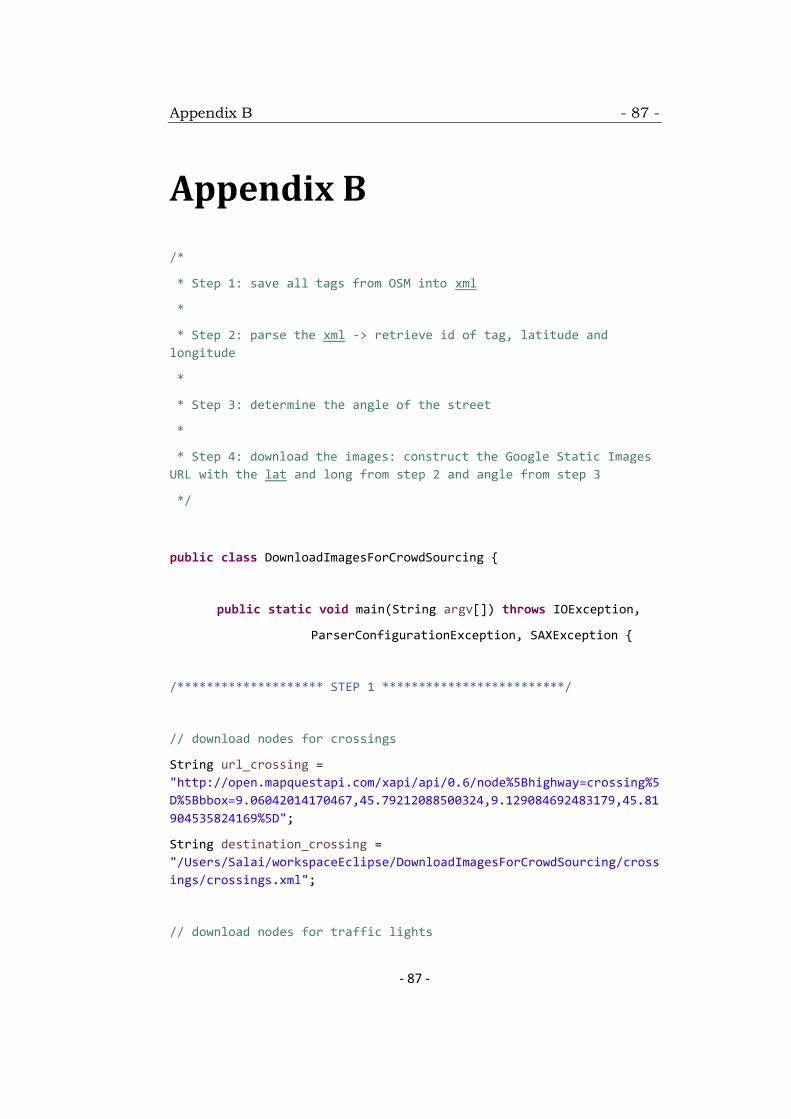
Appendix B - 87 -
- 87 -
Appendix B
/*
* Step 1: save all tags from OSM into xml
*
* Step 2: parse the xml -> retrieve id of tag, latitude and
longitude
*
* Step 3: determine the angle of the street
*
* Step 4: download the images: construct the Google Static Images
URL with the lat and long from step 2 and angle from step 3
*/
public class DownloadImagesForCrowdSourcing {
public static void main(String argv[]) throws IOException,
ParserConfigurationException, SAXException {
/******************** STEP 1 *************************/
// download nodes for crossings
String url_crossing =
"http://open.mapquestapi.com/xapi/api/0.6/node%5Bhighway=crossing%5
D%5Bbbox=9.06042014170467,45.79212088500324,9.129084692483179,45.81
904535824169%5D";
String destination_crossing =
"/Users/Salai/workspaceEclipse/DownloadImagesForCrowdSourcing/cross
ings/crossings.xml";
// download nodes for traffic lights
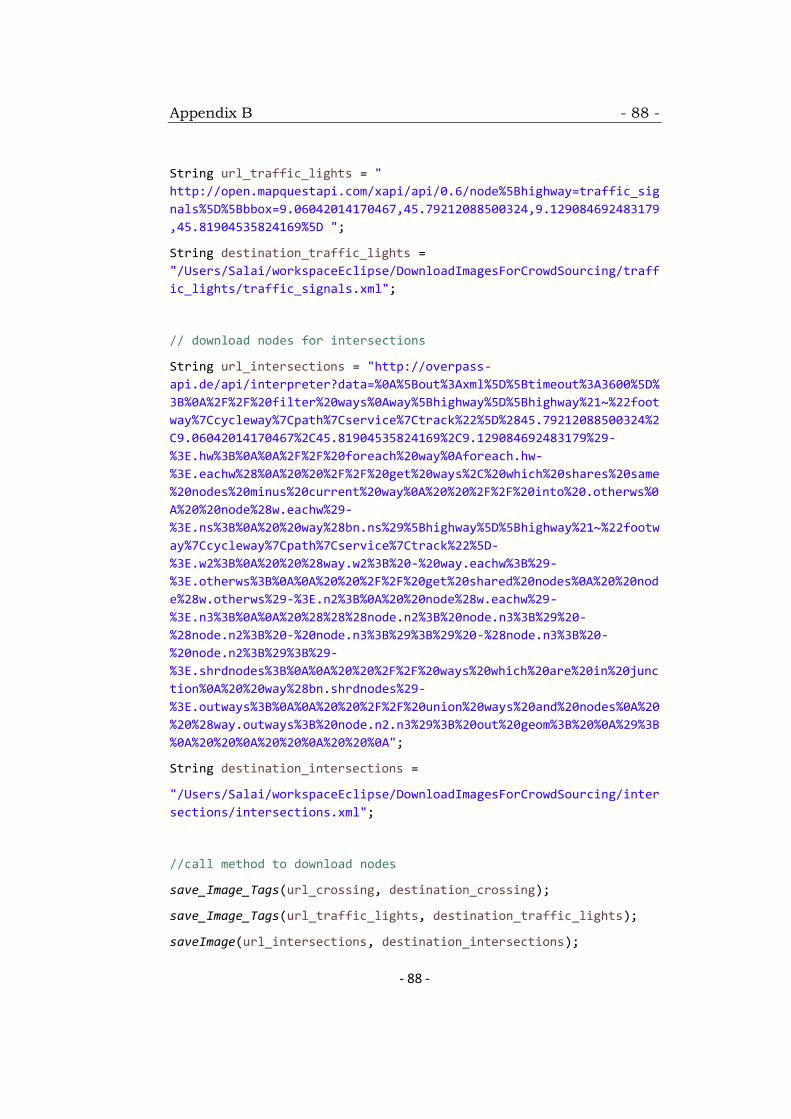
Appendix B - 88 -
- 88 -
String url_traffic_lights = "
http://open.mapquestapi.com/xapi/api/0.6/node%5Bhighway=traffic_sig
nals%5D%5Bbbox=9.06042014170467,45.79212088500324,9.129084692483179
,45.81904535824169%5D ";
String destination_traffic_lights =
"/Users/Salai/workspaceEclipse/DownloadImagesForCrowdSourcing/traff
ic_lights/traffic_signals.xml";
// download nodes for intersections
String url_intersections = "http://overpass-
api.de/api/interpreter?data=%0A%5Bout%3Axml%5D%5Btimeout%3A3600%5D%
3B%0A%2F%2F%20filter%20ways%0Away%5Bhighway%5D%5Bhighway%21~%22foot
way%7Ccycleway%7Cpath%7Cservice%7Ctrack%22%5D%2845.79212088500324%2
C9.06042014170467%2C45.81904535824169%2C9.129084692483179%29-
%3E.hw%3B%0A%0A%2F%2F%20foreach%20way%0Aforeach.hw-
%3E.eachw%28%0A%20%20%2F%2F%20get%20ways%2C%20which%20shares%20same
%20nodes%20minus%20current%20way%0A%20%20%2F%2F%20into%20.otherws%0
A%20%20node%28w.eachw%29-
%3E.ns%3B%0A%20%20way%28bn.ns%29%5Bhighway%5D%5Bhighway%21~%22footw
ay%7Ccycleway%7Cpath%7Cservice%7Ctrack%22%5D-
%3E.w2%3B%0A%20%20%28way.w2%3B%20-%20way.eachw%3B%29-
%3E.otherws%3B%0A%0A%20%20%2F%2F%20get%20shared%20nodes%0A%20%20nod
e%28w.otherws%29-%3E.n2%3B%0A%20%20node%28w.eachw%29-
%3E.n3%3B%0A%0A%20%28%28%28node.n2%3B%20node.n3%3B%29%20-
%28node.n2%3B%20-%20node.n3%3B%29%3B%29%20-%28node.n3%3B%20-
%20node.n2%3B%29%3B%29-
%3E.shrdnodes%3B%0A%0A%20%20%2F%2F%20ways%20which%20are%20in%20junc
tion%0A%20%20way%28bn.shrdnodes%29-
%3E.outways%3B%0A%0A%20%20%2F%2F%20union%20ways%20and%20nodes%0A%20
%20%28way.outways%3B%20node.n2.n3%29%3B%20out%20geom%3B%20%0A%29%3B
%0A%20%20%0A%20%20%0A%20%20%0A";
String destination_intersections =
"/Users/Salai/workspaceEclipse/DownloadImagesForCrowdSourcing/inter
sections/intersections.xml";
//call method to download nodes
save_Image_Tags(url_crossing, destination_crossing);
save_Image_Tags(url_traffic_lights, destination_traffic_lights);
saveImage(url_intersections, destination_intersections);
Appendix B - 89 -
- 89 -
/********************* STEP 2.1 Crossings **********************/
try {
File fXmlFile = new File(
"/Users/Salai/workspaceEclipse/DownloadImagesForCrowdSourcing/cross
ings/crossings.xml");
DocumentBuilderFactory dbFactory =
DocumentBuilderFactory.newInstance();
DocumentBuilder dBuilder = dbFactory.newDocumentBuilder();
Document doc = dBuilder.parse(fXmlFile);
PrintWriter writer = new PrintWriter(
"/Users/Salai/workspaceEclipse/DownloadImagesForCrowdSourcing/cross
ings/crossings_parsed.txt","UTF-8");
doc.getDocumentElement().normalize();
NodeList nList = doc.getElementsByTagName("node");
NodeList nList2 = doc.getElementsByTagName("tag");
for (int temp = 0; temp < nList.getLength(); temp++) {
Node nNode = nList.item(temp);
Node nNode2 = nList2.item(temp);
Element eElement = (Element) nNode;
Element eElement2 = (Element) nNode2;
if (nNode.getNodeType() == Node.ELEMENT_NODE) {
writer.println("Image: image" + temp + ".png");
writer.println("ID: " + eElement.getAttribute("id"));
Appendix B - 90 -
- 90 -
writer.println("Longitude: " +
eElement.getAttribute("lon"));
writer.println("Latitude: " +
eElement.getAttribute("lat"));
}
if (nNode2.getNodeType() == Node.ELEMENT_NODE) {
writer.println("Tag: " +
eElement2.getAttribute("k") + ";" +
eElement2.getAttribute("v"));
writer.println("\n");
}
String imageUrl =
"https://maps.googleapis.com/maps/api/streetview?size=600x600&locat
ion=" + eElement.getAttribute("lat") + "," +
eElement.getAttribute("lon")
+ "&fov=90&heading=0&pitch=10";
String destinationFile =
"/Users/Salai/workspaceEclipse/DownloadImagesForCrowdSourcing/cross
ings/image" + temp + ".png";
save_Image_Tags(imageUrl, destinationFile);
}
writer.close();
} catch (Exception e) {
e.printStackTrace();
}
/******************** STEP 2.2 Traffic Lights ***************/
try {
Appendix B - 91 -
- 91 -
File fXmlFile = new File(
"/Users/Salai/workspaceEclipse/DownloadImagesForCrowdSourcing/traff
ic_lights/traffic_signals.xml");
DocumentBuilderFactory dbFactory =
DocumentBuilderFactory.newInstance();
DocumentBuilder dBuilder = dbFactory.newDocumentBuilder();
Document doc = dBuilder.parse(fXmlFile);
PrintWriter writer = new PrintWriter(
"/Users/Salai/workspaceEclipse/DownloadImagesForCrowdSourcing/traff
ic_lights/traffic_signals_parsed.txt","UTF-8");
doc.getDocumentElement().normalize();
NodeList nList = doc.getElementsByTagName("node");
NodeList nList2 = doc.getElementsByTagName("tag");
System.out.println("----------------------------");
for (int temp = 0; temp < nList.getLength(); temp++) {
Node nNode = nList.item(temp);
Node nNode2 = nList2.item(temp);
Element eElement = (Element) nNode;
Element eElement2 = (Element) nNode2;
if (nNode.getNodeType() == Node.ELEMENT_NODE) {
writer.println("Image: image" + temp + ".png");
writer.println("ID: " + eElement.getAttribute("id"));

Appendix B - 92 -
- 92 -
writer.println("Longitude: " +
eElement.getAttribute("lon"));
writer.println("Latitude: " +
eElement.getAttribute("lat"));
}
if (nNode2.getNodeType() == Node.ELEMENT_NODE) {
writer.println("Tag: " +
eElement2.getAttribute("k") + ";"
+ eElement2.getAttribute("v"));
writer.println("\n");
}
String imageUrl =
"https://maps.googleapis.com/maps/api/streetview?size=600x600&locat
ion=" + eElement.getAttribute("lat") + "," +
eElement.getAttribute("lon") + "&fov=90&heading=0&pitch=10";
String destinationFile =
"/Users/Salai/workspaceEclipse/DownloadImagesForCrowdSourcing/traff
ic_lights/image" + temp + ".png";
save_Image_Tags(imageUrl, destinationFile);
}
writer.close();
} catch (Exception e) {
e.printStackTrace();
}
/******************* STEP 2.3 Intersections ****************/
try {
File fXmlFile = new File(
Appendix B - 93 -
- 93 -
"/Users/Salai/workspaceEclipse/DownloadImagesForCrowdSourcing/inter
sections/intersections.xml";
DocumentBuilderFactory dbFactory =
DocumentBuilderFactory.newInstance();
DocumentBuilder dBuilder = dbFactory.newDocumentBuilder();
Document doc = dBuilder.parse(fXmlFile);
PrintWriter writer = new PrintWriter(
"/Users/Salai/workspaceEclipse/DownloadImagesForCrowdSourcing/inter
sections/intersection_parsed.txt", "UTF-8");
doc.getDocumentElement().normalize();
NodeList nList = doc.getElementsByTagName("node");
NodeList nList2 = doc.getElementsByTagName("way");
System.out.println("----------------------------");
// determine all nodes
for (int temp = 0; temp < nList.getLength(); temp++) {
Node nNode = nList.item(temp);
Element eElement = (Element) nNode;
Element childElementFirst = null;
if (nNode.getNodeType() == Node.ELEMENT_NODE) {
writer.println("Image: image" + temp + ".png");
writer.println("ID: " + eElement.getAttribute("id"));
writer.println("Latitude: " + eElement.getAttribute("lat"));
Appendix B - 94 -
- 94 -
writer.println("Longitude: " +
eElement.getAttribute("lon"));
// determine all ways and their nds
for (int i = 0; i < nList2.getLength(); i++) {
Node nNode2 = nList2.item(i);
Element eElement2 = (Element) nNode2;
Node childNode = eElement2.getFirstChild();
if (nNode2.getNodeType() == Node.ELEMENT_NODE) {
int count = 0;
ArrayList<String[]> reflist =
mychild_refs(childNode);
while (childNode.getNextSibling() != null) {
count++;
childNode = childNode.getNextSibling();
if ((childNode.getNodeType() ==
Node.ELEMENT_NODE)) {
Element childElement = (Element)
childNode;
if (count <= 3) {
childElementFirst = (Element) childNode;}
if
(eElement.getAttribute("id").equals(childElement.getAttribute("ref"
)) &&
(!(eElement.getAttribute("id").equals(childElementFirst.getAttribut
e("ref"))))) {
Appendix B - 95 -
- 95 -
writer.println("WAY ID:
"+eElement2.getAttribute("id"));
writer.println("first position: ID: "+
childElementFirst
.getAttribute("ref") + ";Lat: " +
childElementFirst
.getAttribute("lat") + ";Lon:" +
childElementFirst
.getAttribute("lon"));
String imageUrl =
"https://maps.googleapis.com/maps/api/streetview?size=600x600&locat
ion=" + eElement.getAttribute("lat") + "," +
eElement.getAttribute("lon") + "&fov=90&heading=" +
angleFromCoordinate(
Double.parseDouble(eElement.getAttribute("lat")),Double.parseDouble
(eElement.getAttribute("lon")),Double.parseDouble(childElementFirst
.getAttribute("lat")),Double.parseDouble(childElementFirst.getAttri
bute("lon")))+ "&pitch=10";
String destinationFile =
"/Users/Salai/workspaceEclipse/SaveImageFromURL/int/image" + temp +
".png ";
saveImage(imageUrl, destinationFile);
} else if
(eElement.getAttribute("id").equals(childElement.getAttribute("ref"
)) &&
(eElement.getAttribute("id").equals(childElementFirst.getAttribute(
"ref")))){
writer.println("WAY ID:
"+eElement2.getAttribute("id"));
String[] rnd_pos =
arr_get_one(reflist,childElementFirst
.getAttribute("ref"));
Appendix B - 96 -
- 96 -
writer.println("next position: ID: " +
rnd_pos[0] + ";Lat:" + rnd_pos[1] + ";Lon:" +
rnd_pos[2]);
String imageUrl =
"https://maps.googleapis.com/maps/api/streetview?size=600x600&locat
ion="+ eElement.getAttribute("lat") + ","+
eElement.getAttribute("lon") + "&fov=90&heading=" +
angleFromCoordinate(Double.parseDouble(eElement.getAttribute("lat")
),Double.parseDouble(eElement.getAttribute("lon")),Double.parseDoub
le(rnd_pos[1]), Double.parseDouble(rnd_pos[2])) + "&pitch=10";
String destinationFile =
"/Users/Salai/workspaceEclipse/SaveImageFromURL/int/image"+ temp +
".png ";
saveImage(imageUrl, destinationFile);
}}}}}
}
writer.println("\n");
}
writer.close();
} catch (Exception e) {
e.printStackTrace();
}
}
public static String[] arr_get_one(ArrayList<String[]> str_array,
String str_remove) {
String[] tmp_array;
for (int i = 1; i < str_array.size(); i++) {
tmp_array = str_array.get(i);
Appendix B - 97 -
- 97 -
if (tmp_array[0] != str_remove) {
return tmp_array;
}
}
return null;
}
public static ArrayList<String[]> mychild_refs(Node childs) {
ArrayList<String[]> my_array = new ArrayList<String[]>();
while (childs.getNextSibling() != null) {
if ((childs.getNodeType() == Node.ELEMENT_NODE)) {
Element childElement = (Element) childs;
String[] str_myrefs = {
childElement.getAttribute("ref"),
childElement.getAttribute("lat"),
childElement.getAttribute("lon") };
my_array.add(str_myrefs);
}
childs = childs.getNextSibling();
}
my_array.removeAll(Collections.singleton(null));
return my_array;
}
public static void save_Image_Tags(String imageUrl, String
destinationFile) throws IOException {
URL url = new URL(imageUrl);
InputStream is = url.openStream();
Appendix B - 98 -
- 98 -
OutputStream os = new FileOutputStream(destinationFile);
byte[] b = new byte[2048];
int length;
while ((length = is.read(b)) != -1) {
os.write(b, 0, length);
}
is.close();
os.close();
System.out.println("end");
}
static double angleFromCoordinate(double lat1, double long1, double
lat2, double long2) {
double dLon = (long2 - long1);
double y = Math.sin(dLon) * Math.cos(lat2);
double x = Math.cos(lat1) * Math.sin(lat2) - Math.sin(lat1)
* Math.cos(lat2) * Math.cos(dLon);
double brng = Math.atan2(y, x);
brng = Math.toDegrees(brng);
brng = (brng + 360) % 360;
brng = 360 - brng;
return brng;
}
}

Appendix B - 99 -
- 99 -