Embed Size (px)
Citation preview

Forward-Looking Statements
Forward-looking statements such as earnings forecasts and other projections contained in this report are based on information available at the time of publication and assumptions that management believes to be reasonable. Actual results may differ materially from those expectations due to various factors.
Enriching lives, in harmony with nature
* We define “Yoki-Monozukuri” as “a strong commitment by all members to provide products and brands of excellent value for consumer satisfaction.” In Japanese, “Yoki” literally means “good/excellent,” “Monozukuri” means “development/manufacturing of products.”
Kao is dedicated to filling consumers’ daily lives with smiles.
The philosophy behind our product development and manufacturing
has remained unchanged over the 120 years since Kao Sekken (Kao Soap)
was introduced in 1890.
With the business environment continuing to change on a global scale,
what can Kao do as a leading manufacturer? We believe we can
provide new value to people around the world through
Yoki-Monozukuri,* pursued from an ecological perspective.
Positioning ecology at the core of management, Kao is striving for
the wholehearted satisfaction and enrichment of the lives of people
globally in the fields of cleanliness, beauty and health.
Going forward, the Kao Group will continue to enhance
Yoki-Monozukuri and pursue true, sustainable enrichment made
possible through the harmony of people and nature.

Kao Annual Report 2012 1
Financial Section 11-Year Summary 28 Management Discussion and Analysis 30 Consolidated Financial Statements 40 Notes to Consolidated Financial Statements 46 Independent Auditor’s Report 67
Principal Subsidiaries and Affiliates 68
Investor Information 69
Kao’s Management Framework Directors, Corporate Auditors and Executive Officers 22 Corporate Governance 24 Compliance 26
Financial Highlights 2
Segment Information 4
A Message from Chairman of the Board of Directors Motoki Ozaki 6
An Interview with New President and CEO Michitaka Sawada 8
Kao at a Glance 14
Contents
16 18
19 20
Beauty Care Business
Human Health Care Business
Fabric and Home Care Business
Chemical Business
Global Integrated Management
Meeting Local Consumer Needs
Offering Eco-Innovation
Rapid Progress toward an Eco-Chemical Business
Innovation That SatisfiesFeature:
2 Kao Annual Report 2012
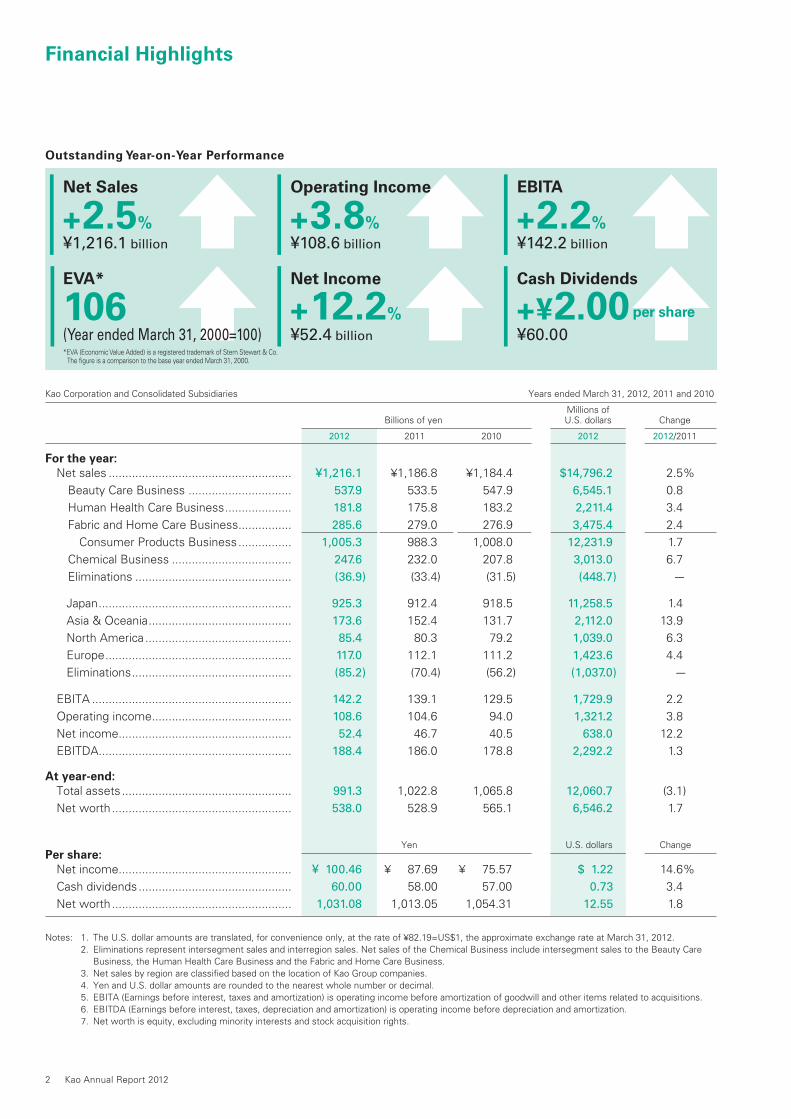
Kao Corporation and Consolidated Subsidiaries Years ended March 31, 2012, 2011 and 2010
Millions of Billions of yen U.S. dollars Change
2012 2011 2010 2012 2012/2011
For the year:
Net sales ....................................................... ¥1,216.1 ¥1,186.8 ¥1,184.4 $14,796.2 2.5% Beauty Care Business ............................... 537.9 533.5 547.9 6,545.1 0.8 Human Health Care Business .................... 181.8 175.8 183.2 2,211.4 3.4 Fabric and Home Care Business ................ 285.6 279.0 276.9 3,475.4 2.4 Consumer Products Business ................ 1,005.3 988.3 1,008.0 12,231.9 1.7 Chemical Business .................................... 247.6 232.0 207.8 3,013.0 6.7 Eliminations ............................................... (36.9) (33.4) (31.5) (448.7) .–
Japan .......................................................... 925.3 912.4 918.5 11,258.5 1.4 Asia & Oceania ........................................... 173.6 152.4 131.7 2,112.0 13.9 North America ............................................ 85.4 80.3 79.2 1,039.0 6.3 Europe ........................................................ 117.0 112.1 111.2 1,423.6 4.4 Eliminations ................................................ (85.2) (70.4) (56.2) (1,037.0) .–
EBITA ............................................................ 142.2 139.1 129.5 1,729.9 2.2 Operating income .......................................... 108.6 104.6 94.0 1,321.2 3.8 Net income .................................................... 52.4 46.7 40.5 638.0 12.2 EBITDA .......................................................... 188.4 186.0 178.8 2,292.2 1.3
At year-end:
Total assets ................................................... 991.3 1,022.8 1,065.8 12,060.7 (3.1) Net worth ...................................................... 538.0 528.9 565.1 6,546.2 1.7
Yen U.S. dollars ChangePer share:
Net income .................................................... ¥ 100.46 ¥ 87.69 ¥ 75.57 $ 1.22 14.6% Cash dividends .............................................. 60.00 58.00 57.00 0.73 3.4 Net worth ...................................................... 1,031.08 1,013.05 1,054.31 12.55 1.8
Notes: 1. The U.S. dollar amounts are translated, for convenience only, at the rate of ¥82.19=US$1, the approximate exchange rate at March 31, 2012. 2. Eliminations represent intersegment sales and interregion sales. Net sales of the Chemical Business include intersegment sales to the Beauty Care
Business, the Human Health Care Business and the Fabric and Home Care Business. 3. Net sales by region are classified based on the location of Kao Group companies. 4. Yen and U.S. dollar amounts are rounded to the nearest whole number or decimal. 5. EBITA (Earnings before interest, taxes and amortization) is operating income before amortization of goodwill and other items related to acquisitions. 6. EBITDA (Earnings before interest, taxes, depreciation and amortization) is operating income before depreciation and amortization. 7. Net worth is equity, excluding minority interests and stock acquisition rights.
Financial Highlights
+12.2%
Net Income
¥52.4 billion
Operating Income
¥108.6 billion
+3.8%
Net Sales
Outstanding Year-on-Year Performance
¥1,216.1 billion
+2.5%
106EVA*
(Year ended March 31, 2000=100)
+2.2%
EBITA
¥142.2 billion
+¥2.00per share
Cash Dividends
¥60.00*EVA (Economic Value Added) is a registered trademark of Stern Stewart & Co. The fi gure is a comparison to the base year ended March 31, 2000.

(Years ended March 31)
2009
209.7
2008
EBITDA
(Billions of yen)
2010
184.3
2011
178.8
250
200
100
0
50
150
2009
1,318.5
2008
8.8
Net Sales and
Operating Income Ratio
(Billions of yen) (%)
Net Sales (Left)Operating Income Ratio (Right)
2010
1,276.3
7.6
2011
1,184.4
7.9
1,500
1,000
500
0
25
20
15
10
0
5
(Billions of yen) (%)
2009
66.6
2008
11.7
Net Income and ROE*
Net Income (Left)ROE* (Right)
*In calculating ROE, equity excludes minority interests and stock acquisition rights.
2010
64.5
11.5
2011
40.5
7.3
80
60
40
0
20
20
15
10
0
5
*DER (Debt to Equity Ratio)=Interest-bearing debt ÷ Equity, excluding minority interests and stock acquisition rights
*Free cash flow = Net cash provided by operating activities + Net cash used in investing activities
574.0545.2
565.1
20092008
Net Worth and DER*
(Billions of yen) (Times)
Net Worth (Left)DER* (Right)
2010 2011
0.5 0.5
0.3
600
400
200
0
1.2
1.0
0.8
0
0.6
0.4
0.2
20092008
122.53
Net Income per Share
(Yen)
2010
120.25
2011
75.57
150
100
50
0
20092008
Cash Dividends and
Payout Ratio
(Yen) (%)
Cash Dividends (Left)Payout Ratio (Right)
54.00
44.1
2010
56.00
46.6
2011
57.00
75.4
60
40
20
0
100
80
60
40
0
20
20092008
Free Cash Flow*
(Billions of yen)
127.9
2010
78.4
2011
128.1
150
100
50
02009
49.0
2008
Capital Expenditures and
Depreciation and Amortization
(Billions of yen)
Capital Expenditures Depreciation and Amortization
2010
44.6
2011
44.9
93.487.5 84.8
120
0
100
80
60
40
20
2009
45.1
2008
R&D Expenses and
Percentage of Net Sales
(Billions of yen) (%)
R&D Expenses (Left)Percentage of Net Sales (Right)
2010
46.1
2011
2012
2012 2012
2012
2012
2012
2012 2012 2012
44.9
3.4 3.6 3.8
186.0 188.4
1,186.8
8.8
1,216.1
8.9
46.7
8.5
52.4
9.8
528.9
0.3
538.0
0.2
87.69
100.46
58.00
66.1
60.00
59.7
119.5
76.1
49.1
81.4
47.2
79.8
45.5
3.8
48.2
4.0
50
40
20
0
10
30
8
6
4
0
2
Kao Annual Report 2012 3

4 Kao Annual Report 2012
Segment Information
0
500
1,000
1,500
2008 2009
1,318.5 1,276.31,184.4 1,186.8 1,216.1
2010 2011 2012
Beauty Care Business Human Health Care Business
Fabric and Home Care Business Chemical Business
0
40
80
120
2008 2009
116.3
96.8 94.0
104.6108.6
2010 2011 2012
(Billions of yen) (Billions of yen)
Net Sales
Business Segment Sales
Operating Income
(Billions of yen)
¥181.8billion
15.0%
¥537.9billion
44.2%¥285.6billion
23.5%
¥210.8billion
17.3%
ConsolidatedNet Sales
¥1,216.1billion
Beauty Care BusinessPrestige cosmeticsPremium skin care productsPremium hair care products
15.0%
Human Health Care BusinessFood and beverage productsSanitary productsPersonal health products
Fabric and Home Care BusinessFabric care productsHome care products
¥
Chemical BusinessOleo chemicalsPerformance chemicalsSpecialty chemicals
Chemical Business
Breakdown by Region
210.8
Japan 125.5
Asia 89.2
North America 35.9
Europe 55.7
Eliminations
Consumer Products Business
Breakdown by Region
1,005.3
Japan 832.3
Asia & Oceania 87.4
North America 49.6
Europe 61.5
Eliminations
(Billions of yen)
(Years ended March 31)
(Year ended March 31, 2012)
(95.5) (25.5)
Figures are rounded to the nearestwhole number or decimal.Figures in the graph represent netsales to outside customers only.
•
•
Figures are rounded to the nearest whole number or decimal.Figures in the graph represent net sales to outside customers only.Net sales by region are classified based on the location of Kao Group companies.Eliminations represent interregion sales.
•
•
•
•

Kao Annual Report 2012 5
(Billions of yen) (Billions of yen) (%)
(%)(Billions of yen)
(Billions of yen)
(Billions of yen)
Operating Income / EBITA*Operating Income Ratio
2010 2011 2012 2010 2011 2012
547.9 533.5 537.9
2010 2011 2012
183.2 175.8 181.8
2010 2011 2012
276.9 279.0 285.6
2010 2011 2012
207.8232.0
247.6
(Years ended March 31)
Beauty Care Business
Human Health Care Business
Fabric and Home Care Business
Chemical Business
Operating Income (Left)
EBITA* (Left)Operating Income Ratio (Right)
(Billions of yen) (%)
2010 2011 2012
Operating Income (Left)
Operating Income Ratio (Right)
(Billions of yen) (%)
2010 2011 2012
Operating Income (Left)
Operating Income Ratio (Right)
(Billions of yen)
2010 2011 2012
Operating Income (Left)
Operating Income Ratio (Right)
EBITA (Earnings before interest, taxes and amortization) is operating income before amortization of goodwill and other items related to acquisitions.
*
Note: Net sales include intersegment sales.
Net Sales
0
200
400
600
800
0
100
200
300
0
100
200
300
400
0
100
200
300
400
0
20
40
60
80
0
10
20
30
40
0
20
40
60
80
0
5
10
15
20
0
1.0
2.0
3.0
4.0
5.0
0
4.0
8.0
12.0
16.0
20.0
0.91.0
2.9
15.4
48.9
4.7 5.5
39.940.0
0
5
10
15
20
10.49.3
23.024.1
19.7
9.5
0
10
20
30
40
59.755.5
19.421.421.9
60.7
15.3
8.0
14.6
8.7
4.9
9.0
Co
nsu
me
r P
rod
ucts
Bu
sin
ess
Ch
em
ica
l B
usin
ess
6 Kao Annual Report 2012
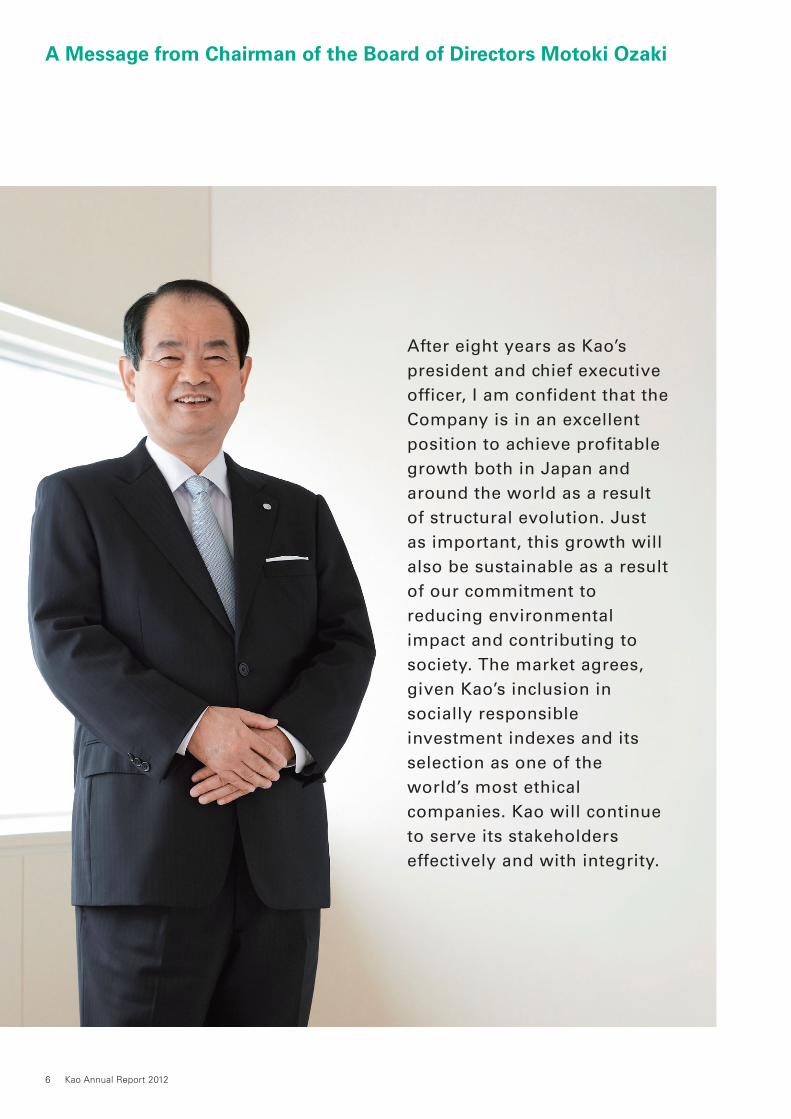
A Message from Chairman of the Board of Directors Motoki Ozaki
After eight years as Kao’s
president and chief executive
officer, I am confident that the
Company is in an excellent
position to achieve profitable
growth both in Japan and
around the world as a result
of structural evolution. Just
as important, this growth will
also be sustainable as a result
of our commitment to
reducing environmental
impact and contributing to
society. The market agrees,
given Kao’s inclusion in
socially responsible
investment indexes and its
selection as one of the
world’s most ethical
companies. Kao will continue
to serve its stakeholders
effectively and with integrity.

Kao Annual Report 2012 7
A key theme during my tenure as CEO was leveraging innovative
technology to raise Kao’s competitive advantage in global markets and
achieve profi table growth. In each of our businesses, we are using our unique
capabilities and expertise to launch high-value-added products.
We complemented product innovation with structural innovation and
implemented a matrix management system that shifted the focus of our
businesses from product categories to the consumer’s perspective. Structural
reorganization has also helped Kao strategically and efficiently allocate
resources to respond to changes in market structure and consumers.
Integration of business operations across Asia has also supported
profi table global growth. This initiative successfully enhanced communication
among Asian countries to effi ciently develop high-value-added products that
meet the needs of both particular countries and the broader market. We are
now taking a similar approach by implementing matrix management in our
North American and European operations.
Over the past eight years we have deepened our commitment to the
environment and in 2009 issued the Kao Environmental Statement. Our
“eco together” concept is a key component of our approach, guiding us as
we work together with stakeholders and consumers worldwide throughout
the product lifecycle, from materials procurement and manufacturing, to
distribution, sales, use and fi nal disposal. We have also maintained our
longstanding emphasis on corporate social responsibility issues such as
effective governance and corporate ethics.
The Kao Group clarifi ed its deployment of free cash fl ow (net cash provided
by operating activities plus net cash used in investing activities) during my
tenure. We invested in future growth, as shown by the acquisition of Kanebo
Cosmetics Inc. We also used free cash fl ow to increase cash dividends per
share at a compound annual rate of nearly 7 percent over the past eight
years. In addition, we reduced interest-bearing debt related to the
acquisition while repurchasing shares totaling ¥135 billion.
Our focus on efficiently putting our resources to work has created an
organization that is well positioned to continue generating profitable
growth and consistently strong shareholder returns. In my new role as
Chairman of the Board of Directors, I plan to support the new company
leadership and the sustainable growth of the Kao Group by focusing on
corporate governance and risk management issues.
Motoki OzakiChairman of the Board of Directors
8 Kao Annual Report 2012
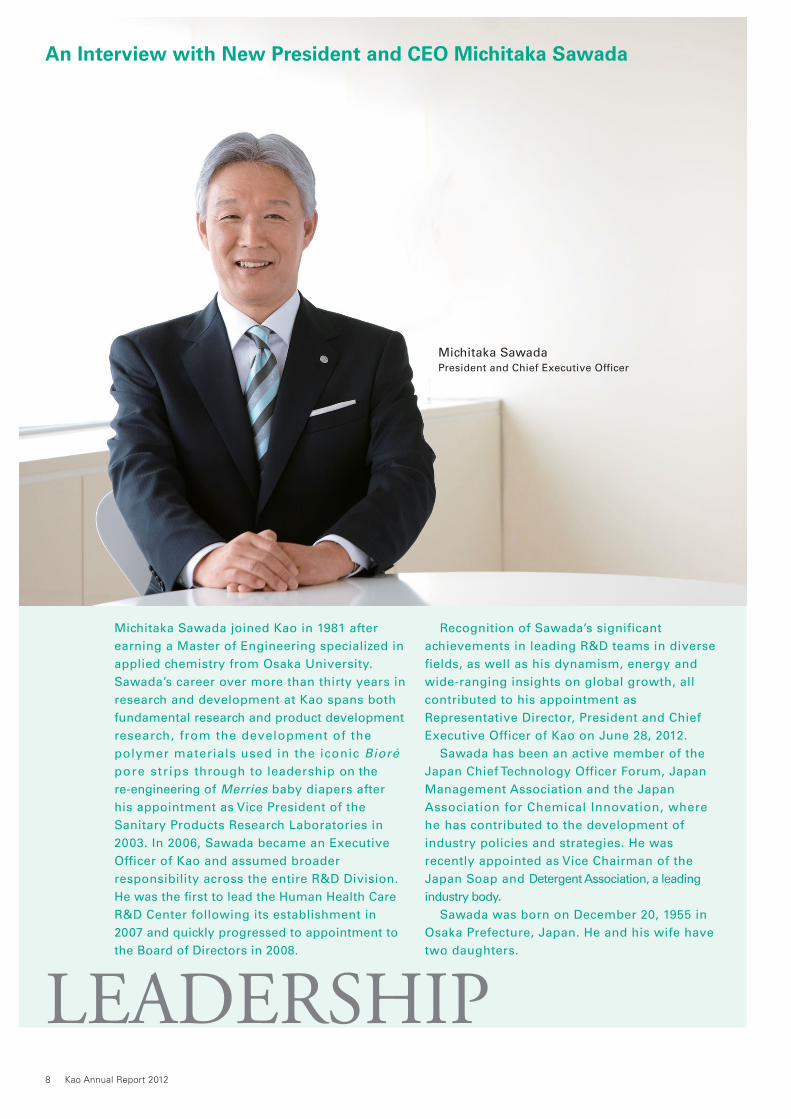
An Interview with New President and CEO Michitaka Sawada
Michitaka SawadaPresident and Chief Executive Officer
LEADERSHIP
Michitaka Sawada joined Kao in 1981 after
earning a Master of Engineering specialized in
applied chemistry from Osaka University.
Sawada’s career over more than thirty years in
research and development at Kao spans both
fundamental research and product development
research, from the development of the
polymer materials used in the iconic Bioré
pore strips through to leadership on the
re-engineering of Merries baby diapers after
his appointment as Vice President of the
Sanitary Products Research Laboratories in
2003. In 2006, Sawada became an Executive
Officer of Kao and assumed broader
responsibility across the entire R&D Division.
He was the fi rst to lead the Human Health Care
R&D Center following its establishment in
2007 and quickly progressed to appointment to
the Board of Directors in 2008.
Recognition of Sawada’s significant
achievements in leading R&D teams in diverse
fields, as well as his dynamism, energy and
wide-ranging insights on global growth, all
contributed to his appointment as
Representative Director, President and Chief
Executive Officer of Kao on June 28, 2012.
Sawada has been an active member of the
Japan Chief Technology Officer Forum, Japan
Management Association and the Japan
Association for Chemical Innovation, where
he has contributed to the development of
industry policies and strategies. He was
recently appointed as Vice Chairman of the
Japan Soap and Detergent Association, a leading
industry body.
Sawada was born on December 20, 1955 in
Osaka Prefecture, Japan. He and his wife have
two daughters.

Kao Annual Report 2012 9
“Yoki-Monozukuri” is one of the Kao Group’s core concepts. We defi ne it as
“a strong commitment by all members to provide products and brands of
excellent value for consumer satisfaction.” But this concept is not simply
about producing high quality products – it also encompasses our commitment
to enriching people’s lives, reducing environmental impact and resolving
social issues arising from changing lifestyles. That requires fresh ideas and
the will to make them realities, which is why we need innovation. But not
just innovation. We need “continuous innovation.”
The Kao Group is an exciting place because of its positive, innovative
corporate culture, and I am proud that I have helped keep this spirit
burning brightly. My career has focused on research and development,
so I have seen fi rsthand that continuous innovation drives profi table growth.
This concept of continuous innovation starts with breakthrough
innovation; we need great new ideas for products that cause creative
destruction. This kind of innovation changes the game. With its proven
innovative capabilities, the Kao Group can take the lead in the markets that
emerge. But we cannot stop there; we must follow up with step-by-step
innovation. By this I mean a series of small but significant steps that keep
What is your core theme for the Kao Group
as you lead it into the future?
The Kao Group’s Mid-Term Growth Strategies
Use the Kao Group’s innovative technology to raise its competitive advantage in the global market and achieve profitable growth
Further reinforcement of business in Japan,
the Kao Group’s profit base
Growth markets:
Invest management resources to strengthen focal strategic brands
Establish corporate identity
Mature markets:
Achieve further growth driven by high-value-added products
Consumer Products Business
Rapid progress toward an eco-chemical
business
Chemical Business
Accelerated globalization
The Key to Strategic Success
Breakthrough
innovation:
great new ideas
for products that
cause creative
destruction
Step-by-step
innovation:
a series of small but
significant steps that
keep our brands fresh
in the marketplace
Continuous innovation is the key, and has two phases:
CONTINUOUS INNOVATION

10 Kao Annual Report 2012
The Kao Group adapts. We remain open to new ideas as our markets
change. This is what sustains us as we turn challenges like market
maturity into opportunities.
We absolutely want to create value that consumers appreciate. As
markets in Japan have matured, we have expanded the spectrum of value
we offer through our products. We have always focused on functional
value, creating products that consumers love because they work really
well and make life better. Then we complemented the focus on functional
value by emphasizing emotional value, such as more appealing fragrances
and enhanced look and feel. Going forward, we also intend to strengthen
our offering in terms of social value. This involves effectively meeting
needs and wants in a social context, such as employing universal design
to enhance ease of use for seniors, or making our offerings even more
environmentally responsible.
Our concept of continuous innovation is key to leveraging the maturity
How is Kao responding to the increasing maturity of
the Japanese market?
VALUE
our brands fresh in the marketplace. This involves incremental additions to
value over time. After all, a product is not innovative if nobody uses it, and
we are not in the business of creating fads. This cycle is essential for Kao.
For example, we created the compact detergent market in Japan with
breakthrough innovation, and have been the leader in this market for 25
years using step-by-step innovation. Kao is serious about nurturing its
product concepts over the long term.
Continuous innovation adapts products and approaches to evolving
market and consumer needs, so that our innovative products remain
relevant and at the forefront of consumer consciousness. It means
constant improvement of what we make and do. And it requires
persistence – we cannot afford to become complacent. We must
continuously come up with new ideas that maintain our product leadership
as competitors will inevitably try to replicate our innovations.
I also want to make the most of our organizational strengths while making
sure that we are not doing research for its own sake, but research that is
creating value. That is how we will meet challenges successfully to keep
sales and earnings on an upward vector over the medium and long term.

Kao Annual Report 2012 11
of the market in order to sustain profitable growth in Japan. We are
innovating every day and looking for additional opportunities to evolve
beyond providing products alone to include suites of products and
services that offer functional, emotional and social value, such as a health
solution business that focuses on prevention and improvement of health
issues for an aging society. In the future, the Kao Group will consider
how to apply the know-how gained through this business in markets
outside Japan.
GLOBALJapan is a large market for the Kao Group, while
some countries outside Japan are growth drivers.
How will you build the Kao Group’s global business?
Overseas markets present many opportunities for global expansion. This is
particularly true for growth markets with large populations such as China
and Indonesia, which we see as fundamental to our future. Previously, we
targeted upper-tier consumers with premium products in these markets,
but now we are adding a strong emphasis on volume zones – categories
with sizable markets such as laundry detergents, sanitary products and
diapers targeting mid-tier consumers. We intend to make use of another
Kao Group strength: our abil ity to deliver volume zone products that
consistently connect with consumers because they are easy to
understand and meet clearly identified needs.
As in the premium products market, we need to be known as an
innovative company through continuous innovation in volume zones. We
are competing against huge global companies, and will not succeed if we
use the same approaches they do. We will use consumer insights and
continuous innovation to compete with truly differentiated products that
are compelling, while making sure they are price competitive as well.
Through this focus, we are generating meaningful results in China and
elsewhere in Asia, giving us a great base for further expansion.
Our initiative to integrate management of the Beauty Care Business in
North America and Europe demonstrates another aspect of our approach
to global expansion. Not simply an exercise in integration to raise
efficiency, this is the next stage of our strategy for ultimately creating a
strong, unified business worldwide through global integrated management
of the Consumer Products Business.

12 Kao Annual Report 2012
Sustainability is a core Kao Group management
focus. How is sustainability related to the overall
objectives of the Kao Group?
The Kao Group has embedded sustainability in its management, and we
are deploying our unique ability to innovate to address environmental
awareness. We have to be environmentally responsible in Japan and
overseas. Companies that fail to do that will not succeed. They will simply
become irrelevant. Our concept of Yoki-Monozukuri certainly includes
ecologically conscious products, and was a core rationale for founding the
Eco-Technology Research Center. It is a unique expression of what
differentiates the Kao Group, a place where we are using eco-innovation
research to link product creation and use to environmental responsibility.
Continuous innovation drives sustainability. It drove the development of
our “eco together” environmental statement, in which we work with
consumers, business partners and society to reduce environmental impact
throughout the entire product lifecycle. It drives our commitment to eco-
innovation, which has resulted in products such as the Neo fabric care
The Kao Group’s global identity is a strategic asset.
How will you build it?
I think of our global identity in terms of the word “presence.” Our
presence is our standing among consumers, communities and other
stakeholders. It means awareness of the Kao Group, its brands and its
commitment to enriching lives, in harmony with nature. Our presence is
the result of everything we do and achieve. We want markets to know and
respect the Kao Group, because that drives profitable growth and creates
a virtuous cycle in which earnings growth funds the innovation that
supports more earnings growth. We want society to know and respect the
Kao Group for its contribution as a corporate citizen, because that makes
our employees and the communities we serve proud of the Kao Group.
The key to building our presence will be to constantly renew ourselves
as we embrace a commitment to change. Employees must have the desire
to take on the challenges of innovation, and the courage to be creative.
Enhancing our presence involves thinking about markets in which we have
the best opportunities to sweep away the conventional and lead with the
new. It also means continuous innovation that incrementally strengthens
our brands and our ability to contribute to communities.
PRESENCE
Kao Annual Report 2012 13
Kao Corporation has raised dividends for 22 consecutive years and has
repurchased nearly 138 million shares since 1999, and I will maintain this
clear and consistent commitment to shareholder returns. How? The short
answer is profitable growth. The Kao Group is focusing on effective use of
free cash flow and other fundamentals that drive value and enable
shareholder satisfaction, because we contribute to society and make
ourselves an attractive investment when we grow profitably. We will
maintain our emphasis on deploying free cash flow toward reinvesting
earnings in capital expenditures, mergers and acquisitions that support
profitable global growth.
We see that as a win-win approach that benefits the Kao Group and its
stakeholders. I expect continuous innovation to ensure that Kao Corporation
generates attractive returns for shareholders while upholding the ethical
and community principles that are the basis for the Kao Group’s strong
stakeholder support.
How will the Kao Group continue to generate solid
shareholder returns?
series that conserves water, electricity and resources, as well as
innovations that help us use less water in our operations. It also supports
our drive to develop eco-chemical products for global markets.
Since 2005, we have been participating in the United Nations Global
Compact, a strategic policy initiative for businesses that are committed to
aligning their operations and strategies with ten universally accepted
principles in the areas of environment, human rights, labor and anti-
corruption. We have also demonstrated our global commitment to social
and environmental issues in ways such as participating in the Round Table
on Sustainable Palm Oil since September 2010.
Sustainability will certainly remain central to Kao Group management
worldwide.
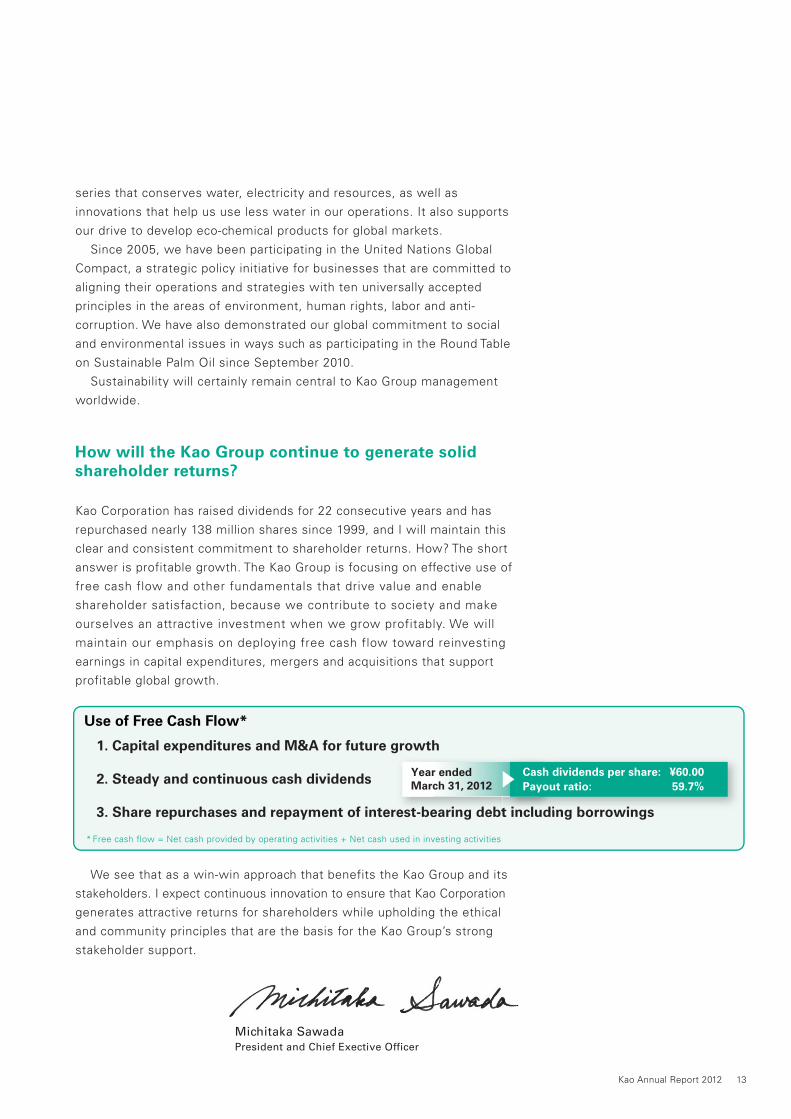
* Free cash flow = Net cash provided by operating activities + Net cash used in investing activities
Use of Free Cash Flow*
1. Capital expenditures and M&A for future growth
3. Share repurchases and repayment of interest-bearing debt including borrowings
2. Steady and continuous cash dividends
rest bearing debt
Year ended
March 31, 2012
t including borrowingst includi
Cash dividends per share: ¥60.00
Payout ratio: 59.7%
Michitaka SawadaPresident and Chief Exective Officer

14 Kao Annual Report 2012
Kao at a Glance
In order to allow all consumers to achieve their
own unique beauty with leading technologies, the
Kao Group offers a wide range of products
including prestige cosmetics, premium skin care
products such as facial and body cleansers, and
premium hair care products such as shampoos
and conditioners.
The Kao Group offers products designed for
quality, functionality, and ease of use in order to
help consumers enjoy a clean, comfortable
lifestyle, including fabric care products such as
laundry detergents and fabric treatments, as well
as dishwashing detergents, kitchen cleaners and
other home care products.
The Kao Group offers products that help
consumers live healthily and comfortably,
including sanitary products created using
proprietary technologies, functional health
beverages that offer new performance values,
and other products such as bath additives and
toothpaste.
The Kao Group’s Chemical Business offers
customers worldwide a range of chemical
products designed to meet the diverse needs of
global industry, including oleo chemicals
manufactured from natural oil and fat raw
materials, surfactants, toners and toner binders,
and fragrances and aroma chemicals.
Beauty Care Business
Fabric and Home Care Business
Human Health Care Business
Chemical Business
Co
nsu
me
r P
rod
ucts
Bu
sin
ess
Ch
em
ica
l B
usin
ess
Business Overview
Kao Annual Report 2012 15
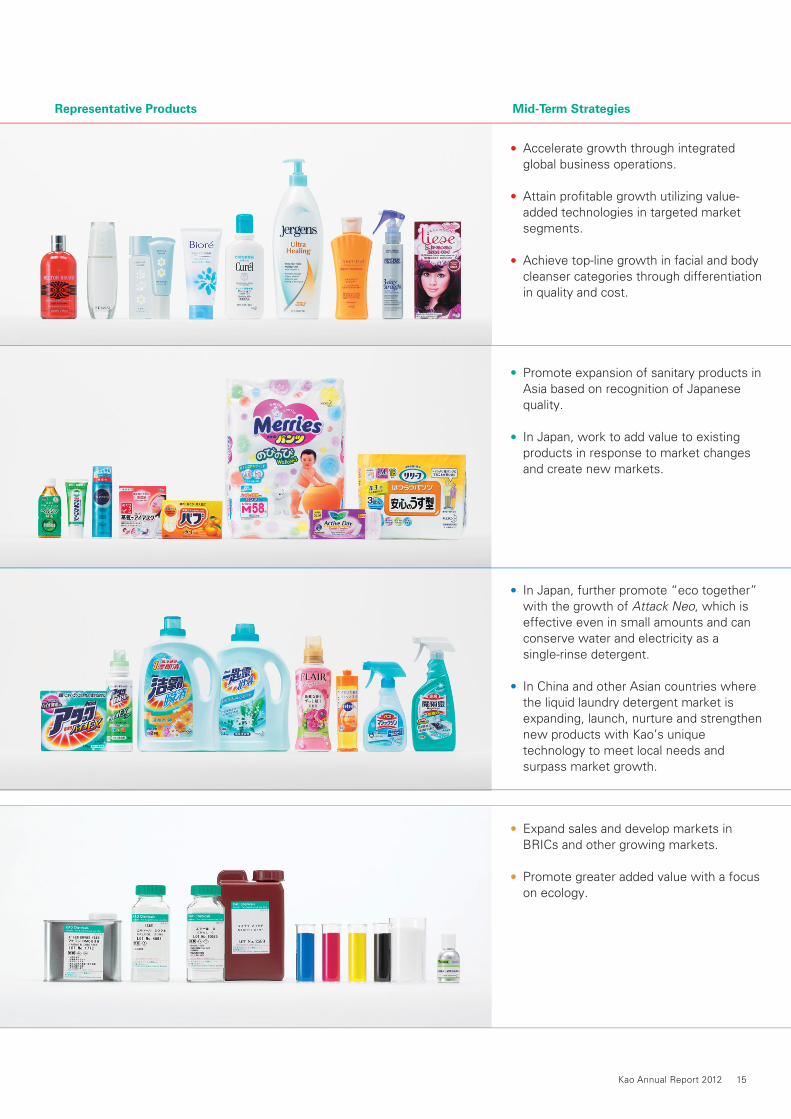
Accelerate growth through integrated global business operations.
Attain profitable growth utilizing value- added technologies in targeted market segments.
Achieve top-line growth in facial and body cleanser categories through differentiation in quality and cost.
In Japan, further promote “eco together” with the growth of Attack Neo, which is effective even in small amounts and can conserve water and electricity as a single-rinse detergent.
In China and other Asian countries where the liquid laundry detergent market is expanding, launch, nurture and strengthen new products with Kao’s unique technology to meet local needs and surpass market growth.
Promote expansion of sanitary products in Asia based on recognition of Japanese quality.
In Japan, work to add value to existing products in response to market changes and create new markets.
Expand sales and develop markets in BRICs and other growing markets.
Promote greater added value with a focus on ecology.
Representative Products Mid-Term Strategies

16 Kao Annual Report 2012
To succeed globally, it is important to pair technologies
that are applicable worldwide with local insight to
understand the different needs and characteristics of
each market and respond appropriately. Moreover, to
ensure that we fully convey the unique value of Bioré in
markets around the world, the Kao Group is conducting
strong rollouts at the local level with a thorough
understanding of the needs of the target demographics
in each country, based on the brand guidelines that
support global development.
Bioré Skin Care Facial Foam, which presented the concept of “cleansing skin care” to the market, uses the Kao Group’s Skin Purifying Technology to gently remove dirt and excess oil that can irritate the skin, leaving it feeling smooth.
The Kao Group is constantly exploring new
science and technologies to create valuable
products and offer them to consumers
around the world. We seek to enhance our
brand value with an approach that pairs a
global perspective for developing world-
class technology with local insights to
tailor products to each market. Here we
highlight some of our initiatives.
Innovation That Satisfies
Feature:
Beauty Care Business
Global Integrated Management
Originally introduced as a facial cleanser, Bioré has
established a solid position in the Japanese
market as a leading brand in the Kao Group’s
premium skin care portfolio. Since the start of our
global expansion in 1982, Bioré products have
been tailored to local markets, but the brand is
now undergoing worldwide renewal driven by the
Kao Group’s exclusive new Skin Purifying Technology.
Cleansing ingredients(aggregation)
Skin

Kao Annual Report 2012 17
Bioré is a top-ranking brand in Taiwan. A high level of
satisfaction with the facial cleanser, the core driver of
the brand’s image, can be expected to carry over to the
makeup remover and body cleanser lines as well. That
is why this is a critically important item. In restaging the
facial cleanser with the introduction of Skin Purifying
Technology in 2012, Kao (Taiwan) Corporation conducted
extensive surveys of consumers in their homes, and
used these findings to effectively spotlight Bioré’s
advanced functional value and to enhance its established
brand image.
Kao USA Inc. (formerly Kao Brands Company) launched
the Bioré Restage Project in 2010 and set out to
restructure its brand strategy. To gain an advantage
in the highly competitive U.S. facial cleanser market,
the company identified the need to rethink its target
demographic, and decided to focus on women in their
twenties because of their outstanding brand loyalty.
Based on extensive surveys of this target
demographic, the company is carrying out a
communications strategy centered on digital marketing.
United States
Global Rollout of New BioréTaiwan
The various markets around the world differ in terms of consumer needs and competitive landscapes. In order for Bioré to build a strong global presence, the Kao Group must focus on its core value of “clean, healthy beautiful skin.” We have returned to the basics to better define Bioré’s strengths around its cleansing ability, and now we plan to begin our new offerings with facial cleanser, the product that best represents these core values. Our technology is what makes this possible. Even though the facial cleanser market is maturing, I believe that by adding new value to our products, we can further increase consumer satisfaction in every market.
We intend to enhance the brand value of Bioré by returning to
the basics, centered on world-class cleansing technology.
Satoru TanakaPresident, Premium Skin Care Business Group, Beauty Care Business Unit
18 Kao Annual Report 2012
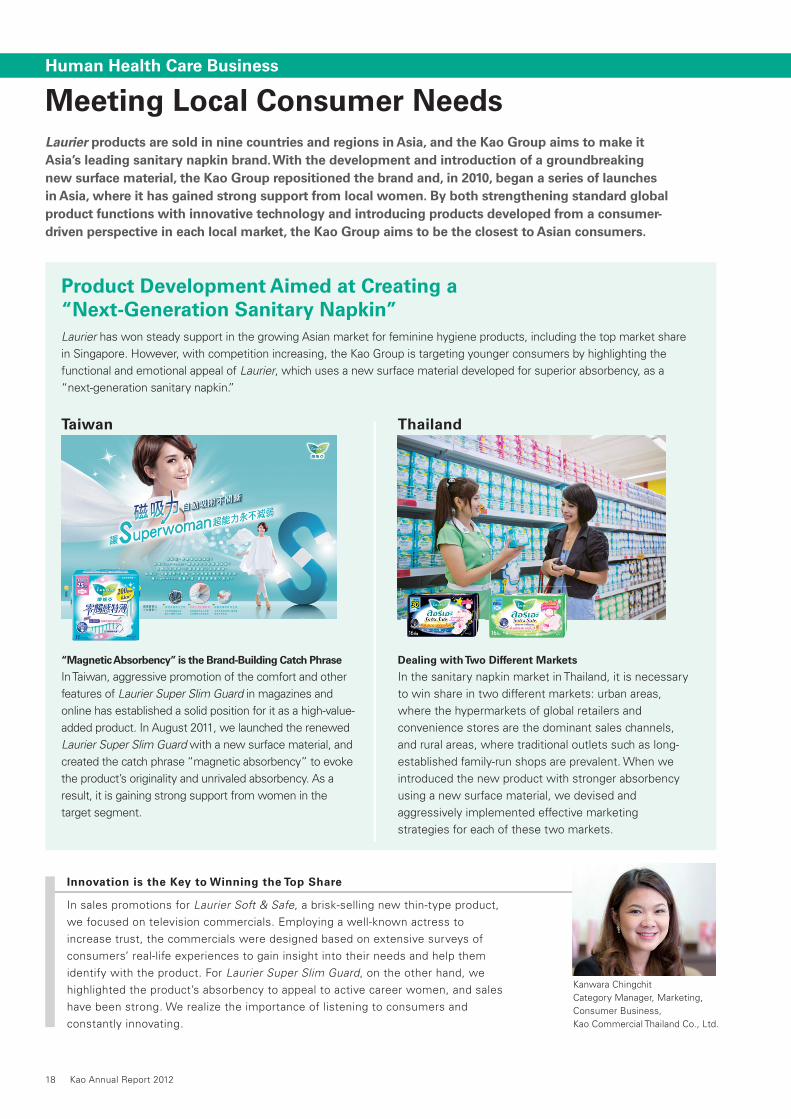
Dealing with Two Different Markets
In the sanitary napkin market in Thailand, it is necessary to win share in two different markets: urban areas, where the hypermarkets of global retailers and convenience stores are the dominant sales channels, and rural areas, where traditional outlets such as long-established family-run shops are prevalent. When we introduced the new product with stronger absorbency using a new surface material, we devised and aggressively implemented effective marketing strategies for each of these two markets.
“Magnetic Absorbency” is the Brand-Building Catch Phrase
In Taiwan, aggressive promotion of the comfort and other features of Laurier Super Slim Guard in magazines and online has established a solid position for it as a high-value-added product. In August 2011, we launched the renewed Laurier Super Slim Guard with a new surface material, and created the catch phrase “magnetic absorbency” to evoke the product’s originality and unrivaled absorbency. As a result, it is gaining strong support from women in the target segment.
Laurier products are sold in nine countries and regions in Asia, and the Kao Group aims to make it
Asia’s leading sanitary napkin brand. With the development and introduction of a groundbreaking
new surface material, the Kao Group repositioned the brand and, in 2010, began a series of launches
in Asia, where it has gained strong support from local women. By both strengthening standard global
product functions with innovative technology and introducing products developed from a consumer-
driven perspective in each local market, the Kao Group aims to be the closest to Asian consumers.
In sales promotions for Laurier Soft & Safe, a brisk-selling new thin-type product, we focused on television commercials. Employing a well-known actress to increase trust, the commercials were designed based on extensive surveys of consumers’ real-life experiences to gain insight into their needs and help them identify with the product. For Laurier Super Slim Guard, on the other hand, we highlighted the product’s absorbency to appeal to active career women, and sales have been strong. We realize the importance of listening to consumers and constantly innovating.
Human Health Care Business
Meeting Local Consumer Needs
Laurier has won steady support in the growing Asian market for feminine hygiene products, including the top market share in Singapore. However, with competition increasing, the Kao Group is targeting younger consumers by highlighting the functional and emotional appeal of Laurier, which uses a new surface material developed for superior absorbency, as a “next-generation sanitary napkin.”
Product Development Aimed at Creating a
“Next-Generation Sanitary Napkin”
Innovation is the Key to Winning the Top Share
Kanwara ChingchitCategory Manager, Marketing, Consumer Business, Kao Commercial Thailand Co., Ltd.
ThailandTaiwan
Kao Annual Report 2012 19
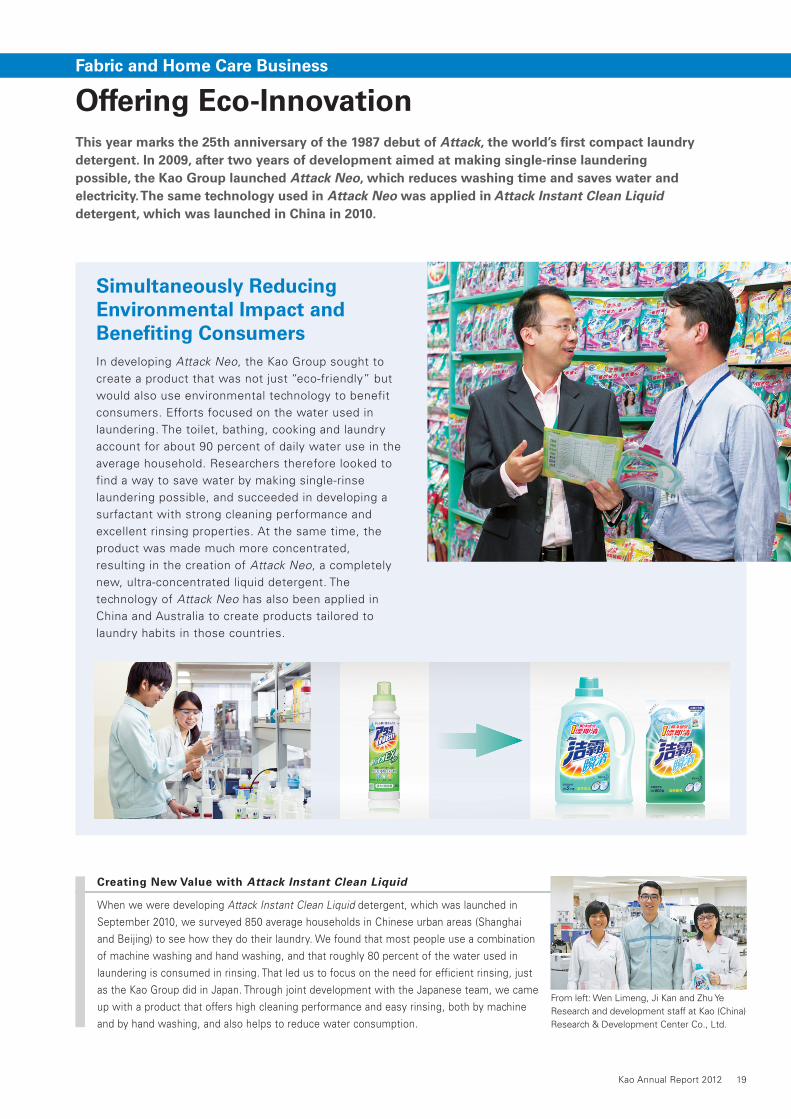
In developing Attack Neo, the Kao Group sought to create a product that was not just “eco-friendly” but would also use environmental technology to benefit consumers. Efforts focused on the water used in laundering. The toilet, bathing, cooking and laundry account for about 90 percent of daily water use in the average household. Researchers therefore looked to find a way to save water by making single-rinse laundering possible, and succeeded in developing a surfactant with strong cleaning performance and excellent rinsing properties. At the same time, the product was made much more concentrated, resulting in the creation of Attack Neo, a completely new, ultra-concentrated liquid detergent. The technology of Attack Neo has also been applied in China and Australia to create products tailored to laundry habits in those countries.
This year marks the 25th anniversary of the 1987 debut of Attack, the world’s fi rst compact laundry
detergent. In 2009, after two years of development aimed at making single-rinse laundering
possible, the Kao Group launched Attack Neo, which reduces washing time and saves water and
electricity. The same technology used in Attack Neo was applied in Attack Instant Clean Liquid
detergent, which was launched in China in 2010.
Offering Eco-Innovation
Simultaneously Reducing
Environmental Impact and
Benefiting Consumers
Fabric and Home Care Business
When we were developing Attack Instant Clean Liquid detergent, which was launched in September 2010, we surveyed 850 average households in Chinese urban areas (Shanghai and Beijing) to see how they do their laundry. We found that most people use a combination of machine washing and hand washing, and that roughly 80 percent of the water used in laundering is consumed in rinsing. That led us to focus on the need for efficient rinsing, just as the Kao Group did in Japan. Through joint development with the Japanese team, we came up with a product that offers high cleaning performance and easy rinsing, both by machine and by hand washing, and also helps to reduce water consumption.
Creating New Value with Attack Instant Clean Liquid
From left: Wen Limeng, Ji Kan and Zhu YeResearch and development staff at Kao (China) Research & Development Center Co., Ltd.
20 Kao Annual Report 2012
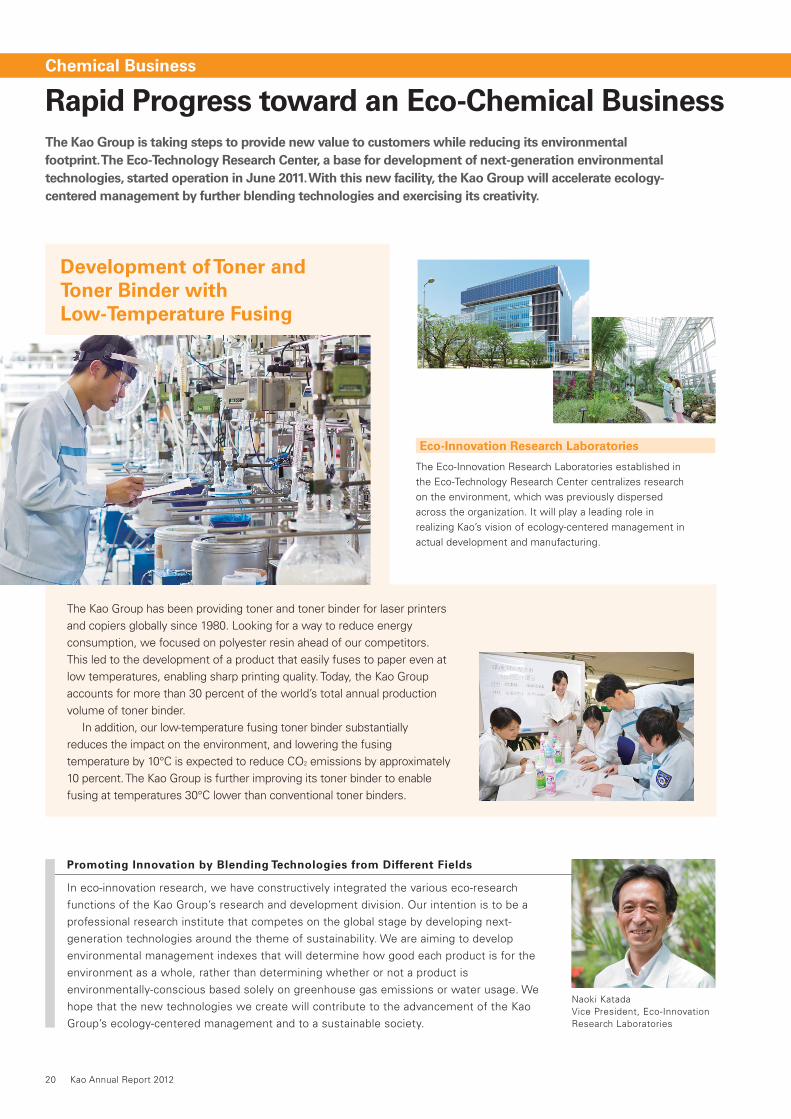
The Kao Group has been providing toner and toner binder for laser printers and copiers globally since 1980. Looking for a way to reduce energy consumption, we focused on polyester resin ahead of our competitors. This led to the development of a product that easily fuses to paper even at low temperatures, enabling sharp printing quality. Today, the Kao Group accounts for more than 30 percent of the world’s total annual production volume of toner binder. In addition, our low-temperature fusing toner binder substantially reduces the impact on the environment, and lowering the fusing temperature by 10°C is expected to reduce CO2 emissions by approximately 10 percent. The Kao Group is further improving its toner binder to enable fusing at temperatures 30°C lower than conventional toner binders.
The Eco-Innovation Research Laboratories established in the Eco-Technology Research Center centralizes research on the environment, which was previously dispersed across the organization. It will play a leading role in realizing Kao’s vision of ecology-centered management in actual development and manufacturing.
The Kao Group is taking steps to provide new value to customers while reducing its environmental
footprint. The Eco-Technology Research Center, a base for development of next-generation environmental
technologies, started operation in June 2011. With this new facility, the Kao Group will accelerate ecology-
centered management by further blending technologies and exercising its creativity.
In eco-innovation research, we have constructively integrated the various eco-research functions of the Kao Group’s research and development division. Our intention is to be a professional research institute that competes on the global stage by developing next-generation technologies around the theme of sustainability. We are aiming to develop environmental management indexes that will determine how good each product is for the environment as a whole, rather than determining whether or not a product is environmentally-conscious based solely on greenhouse gas emissions or water usage. We hope that the new technologies we create will contribute to the advancement of the Kao Group’s ecology-centered management and to a sustainable society.
Chemical Business
Rapid Progress toward an Eco-Chemical Business
Promoting Innovation by Blending Technologies from Different Fields
Development of Toner and
Toner Binder with
Low-Temperature Fusing
Eco-Innovation Research Laboratories
Naoki KatadaVice President, Eco-Innovation Research Laboratories

Kao’s
Management
Framework
Kao Annual Report 2012 21
Directors, Corporate Auditors and Executive Officers
Compliance 26
Corporate Governance 24
22

Board of Directors * Holds the post of Executive Officer concurrently ** Outside Director
Motoki OzakiChairman of the Board of Directors
President, The Kao Foundation for
Arts and Sciences
Michitaka Sawada*Representative Director
Hiroshi Kanda*Representative Director
Tatsuo Takahashi*Representative Director
Toshihide Saito* Ken Hashimoto* Hisao Mitsui* Teruhiko Ikeda**Advisor, Mizuho Trust & Banking Co., Ltd.
Takuma Otoshi**Senior Advisor, IBM Japan, Ltd.
Sonosuke Kadonaga**President, Intrinsics
22 Kao Annual Report 2012
Directors, Corporate Auditors and Executive Officers (As of June 28, 2012)

Michitaka Sawada
Hiroshi Kanda
Tatsuo Takahashi
Toshiharu Numata
Toshihide Saito
Ken Hashimoto
Hisao Mitsui
Masumi Natsusaka
Katsuhiko Yoshida
Yoshinori Takema
Masato Hirota
Shinichiro Hiramine
Shigeru Koshiba
Shoji Kobayashi
Takuji Yasukawa
Yasushi Aoki
William J. Gentner
Naohisa Kure
Akira Yoshimatsu
Hideko Aoki
Minoru Utsumi
Yoshimichi Saita
Muneki Hirao
Motohiro Morimura
Kenji Miyawaki
Kazuyoshi Aoki
Tadaaki Sugiyama
Toshiaki Takeuchi
President and Chief Executive Officer
Senior Managing Executive Officer
President, Consumer Products, Global Responsible for Corporate Communications, and Kao Professional Services Co., Ltd.
Senior Managing Executive Officer
Representative Director, President and Chief Executive Officer, Kao Customer Marketing Co., Ltd.
Senior Managing Executive Officer
President, Consumer Products and Chemical Business, ChinaChairman of the Board of Directors and Chief Executive Officer, Kao (China) Holding Co., Ltd.Chairman of the Board of Directors, Kao Commercial (Shanghai) Co., Ltd.Chairman of the Board of Directors, Kanebo Cosmetics (China) Co., Ltd.
Managing Executive Officer
Senior Vice President, Human Capital Development, GlobalSenior Vice President, Corporate Strategy, GlobalResponsible for Legal and ComplianceChairman of the Board of Directors, Kao USA Inc.President, Kao Group Corporate Pension FundPresident, Kao Health Insurance
Managing Executive Officer
Senior Vice President, Procurement, GlobalResponsible for Accounting and Finance, Information Systems and EVA Promotion
Managing Executive Officer
Senior Vice President, Production and Engineering, GlobalSenior Vice President, Environment and Safety Management, GlobalResponsible for Chemical Business Unit, Logistics, and TCR Promotion
Managing Executive Officer
Representative Director, President, Kanebo Cosmetics Inc.President, Beauty Care Business Unit, Global
Managing Executive Officer
President, Fabric and Home Care Business Unit, GlobalPresident, Consumer Products, Asia (except China)
Managing Executive Officer
Senior Vice President, Research and Development, GlobalResponsible for Product Quality Management (except Export Regulations Service)
Senior Vice President, Media Planning and Management, Global
Senior Vice President, Corporate Communications, Global
Vice President, Corporate Strategy, Global
President, Chemical Business Unit, GlobalChairman of the Board of Directors, Pilipinas Kao, IncorporatedChairman of the Board of Directors, Fatty Chemical (Malaysia) Sdn. Bhd.Chairman of the Board of Directors, Kao Chemicals Europe, S.L.
President, Human Health Care Business Unit - Food and Beverage Business, Global
Senior Vice President, Human Resources and Administration, Kanebo Cosmetics Inc.
Vice President, Corporate Strategy, GlobalPresident, Consumer Products, Americas and EMEA
Vice President, Research and Development – Beauty Care, Global
Vice President, Research and Development, GlobalVice President, Research and Development - Fabric and Home Care, GlobalVice President, Research and Development - Chemical, Global
Senior Vice President, Product Quality Management, Global
Vice President, Production and Engineering - Beauty Care Supply Chain Management, GlobalVice President, Supply Chain Management Strategy and Planning, GlobalVice President, Plant Management, Tokyo Plant
President, Human Health Care Business Unit, Global
Vice President, Production and Engineering - Chemical Supply Chain Management, GlobalVice President, Plant Management, Wakayama Plant
Vice President, Production and Engineering - Fabric and Home Care Supply Chain Management, GlobalVice President, Plant Management, Wakayama Plant
Senior Vice President, Marketing Research and Development, Global
Senior Vice President, Accounting and Finance, Global
Senior Vice President, Legal and Compliance, Global
Representative Director, Senior Managing Executive Officer, Kao Customer Marketing Co., Ltd.
Corporate Auditors *** Outside Corporate Auditor
Executive Officers
Masanori SunagaFull-time Corporate Auditor
Takayuki IshigeFull-time Corporate Auditor
Tadashi Oe***Corporate Auditor,
Attorney-at-Law
Teruo Suzuki***Corporate Auditor,
Certified Public Accountant
Kao Annual Report 2012 23

24 Kao Annual Report 2012
In February 2010, Kao established and announced the Standards for Independence of Outside Directors/Corporate Auditors of Kao Corporation. All of the current Outside Directors and Outside Corporate Auditors meet these standards, and are registered with the Tokyo Stock Exchange as independent directors/corporate auditors. Outside Directors are expected to utilize their considerable experience and expertise as managers or people of relevant knowledge and experience to fulfill a checking function from a neutral position, independent of the Company’s management, to ensure that management decisions of the Company are not disproportionately biased by the views of Company insiders. In addition, the Company believes that thorough discussion at Board of Directors meetings is vital to corporate
governance. Therefore, the Secretariat of the Board of Directors provides Outside Directors with adequate explanations of the background, purpose and content of agenda items prior to each meeting of the Board of Directors. Furthermore, administrative divisions such as Global Accounting and Finance, Global Internal Audit and Global Legal and Compliance are available to assist Outside Corporate Auditors at the Outside Corporate Auditors’ request. The average attendance rate of Outside Directors and Outside Corporate Auditors at the 14 Board of Directors meetings held in the fiscal year ended March 31, 2012 was 92.9 percent and 92.9 percent, respectively. The average attendance rate of Outside Corporate Auditors at the 7 Corporate Auditors meetings during the same period was 92.9 percent.
Kao has introduced, within the framework of the Board of Directors, including Outside Directors, and the Board of Corporate Auditors including Outside Corporate Auditors, an Executive Officer system to separate supervision from execution. Following the conclusion of the Annual General Meeting of Shareholders and the subsequent meeting of the Board of Directors in June 2012, Kao has as part of continuing corporate governance improvements increased the number of Outside Directors from two to three, reduced the number of members of the Board of Directors from fifteen to ten (including the Chairman, who does not have executive authority), and reinforced the organization of Executive Officers by increasing the number from twenty-six to twenty-eight and by establishing four new Executive Officer positions, titled Senior Managing Executive Officer or Managing Executive Officer, without concurrent positions in the Board of Directors. Furthermore, Kao has four Corporate Auditors, including two Outside Corporate Auditors. All Outside Directors and Outside Corporate Auditors maintain their neutrality and independence from the Company’s management. Kao has established the Compensation Advisory Committee and the Committee for the Examination of the Nominees for the Chairman of the Board of Directors and the President, which fulfill functions similar to the compensation committee and nominating committee of a “company with
Corporate Governance Structure
Ensuring the Independence of Outside Directors/Corporate Auditors
committees.” In June 2011, a meeting of the Compensation Advisory Committee was held with all Outside Directors in attendance. It reported to the Board of Directors meeting in the same month its evaluation that the current compensation system and level of compensation for Members of the Board and Executive Officers were appropriate. Also, prior to the appointment of the Chairman and the President following the election of Members of the Board at the Annual General Meeting of Shareholders in June 2012, a meeting of the Committee for the Examination of the Nominees for the Chairman of the Board of Directors and the President was held by all Outside Directors and Outside Corporate Auditors. The committee subsequently submitted to the Board its opinion that each candidate was qualified and appropriate. In order to improve the effectiveness of audits and strengthen auditing functions, the four Corporate Auditors, including the two Outside Corporate Auditors, exchange opinions with Representative Directors on regularly scheduled occasions, attend meetings of the Board of Directors and Management Committee as well as other important meetings, and participate in regular conferences by corporate auditors of domestic Kao Group companies. They also share auditing information with the internal auditing division and the Company’s accounting auditor, and conduct interviews of internal divisions and subsidiaries regularly or as necessary.
Kao considers corporate governance to be a key management task. The Company’s basic approach to corporate
governance is to maintain the management structure and internal control system necessary to realize highly
effi cient, sound and transparent management, with the aim of continuously increasing corporate value.
Functions of Committees
Compensation Advisory Committee This committee is composed of all Representative Directors, the Chairman of the Board of Directors and all Outside Directors. The Committee meets at least once a year during the compensation review period for Members of the Board and Executive Officers. At this meeting, the committee obtains and examines opinions on the compensation system and the level of compensation for the Members of the Board and Executive Officers. The results of that examination are reported at a meeting of the Board of Directors.
Committee for the Examination of the Nominees for the Chairman of the Board of Directors and the President
Composed of all Outside Directors and all Outside Corporate Auditors, this committee examines the nominees prior to the appointment or reappointment of the Chairman of the Board of Directors and/or the President, and submits its evaluation of the nominees’ qualifications to the Board of Directors.
Corporate Governance
Kao Annual Report 2012 25
Six Committees under the Internal Control Committee: Number of Times Convened during the Year Ended March 31, 2012
Disclosure Committee 6 timesCompliance Committee 2 timesInformation Security Committee 8 timesRisk Management Committee 12 timesCommittee for Responsible Care Promotion 2 timesQuality Assurance Committee 4 times
Objectives of Activities to Properly Manage Risk
1. Identify at the global level risks that could affect Yoki-Monozukuri and the continuation of operations, and strengthen countermeasures
2. Strengthen the emergency response system
3. Maintain and enhance the business continuity plan (BCP)
Measures to Maintain and Enhance the Business Continuity Plan
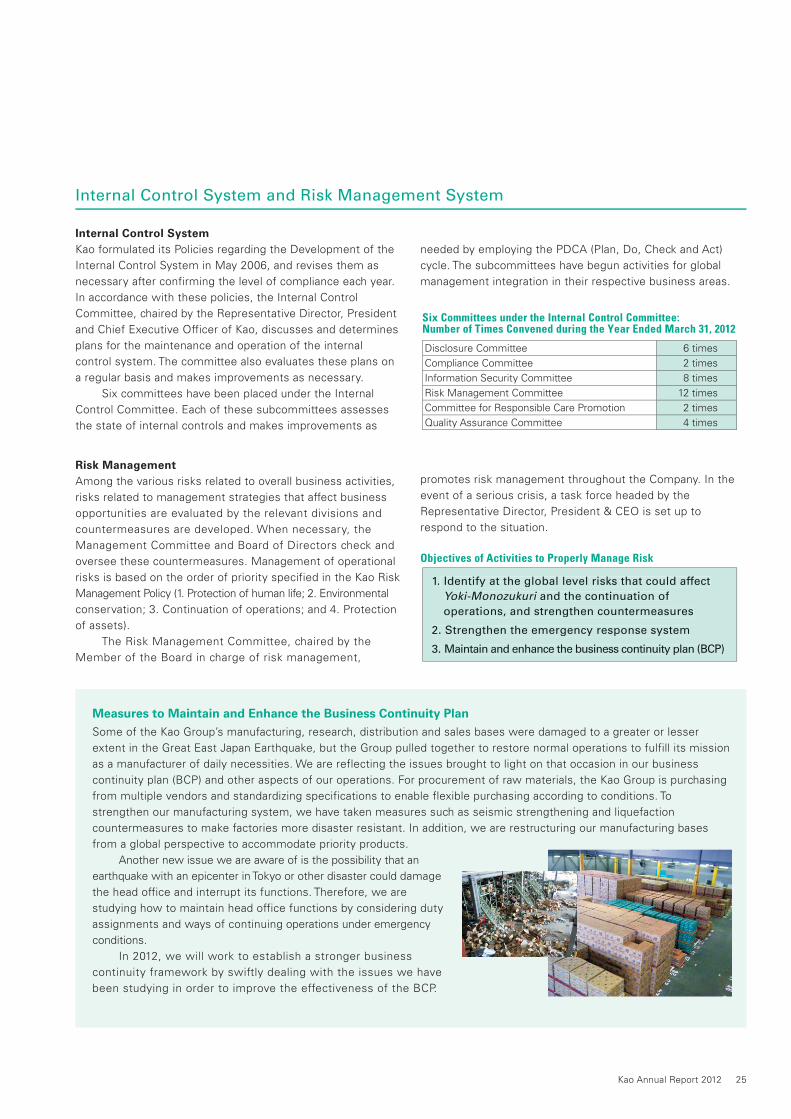
Some of the Kao Group’s manufacturing, research, distribution and sales bases were damaged to a greater or lesser extent in the Great East Japan Earthquake, but the Group pulled together to restore normal operations to fulfill its mission as a manufacturer of daily necessities. We are reflecting the issues brought to light on that occasion in our business continuity plan (BCP) and other aspects of our operations. For procurement of raw materials, the Kao Group is purchasing from multiple vendors and standardizing specifications to enable flexible purchasing according to conditions. To strengthen our manufacturing system, we have taken measures such as seismic strengthening and liquefaction countermeasures to make factories more disaster resistant. In addition, we are restructuring our manufacturing bases from a global perspective to accommodate priority products. Another new issue we are aware of is the possibility that an earthquake with an epicenter in Tokyo or other disaster could damage the head office and interrupt its functions. Therefore, we are studying how to maintain head office functions by considering duty assignments and ways of continuing operations under emergency conditions. In 2012, we will work to establish a stronger business continuity framework by swiftly dealing with the issues we have been studying in order to improve the effectiveness of the BCP.
Internal Control System and Risk Management System
Internal Control System
Kao formulated its Policies regarding the Development of the Internal Control System in May 2006, and revises them as necessary after confirming the level of compliance each year. In accordance with these policies, the Internal Control Committee, chaired by the Representative Director, President and Chief Executive Officer of Kao, discusses and determines plans for the maintenance and operation of the internal control system. The committee also evaluates these plans on a regular basis and makes improvements as necessary. Six committees have been placed under the Internal Control Committee. Each of these subcommittees assesses the state of internal controls and makes improvements as
needed by employing the PDCA (Plan, Do, Check and Act) cycle. The subcommittees have begun activities for global management integration in their respective business areas.
Risk Management
Among the various risks related to overall business activities, risks related to management strategies that affect business opportunities are evaluated by the relevant divisions and countermeasures are developed. When necessary, the Management Committee and Board of Directors check and oversee these countermeasures. Management of operational risks is based on the order of priority specified in the Kao Risk Management Policy (1. Protection of human life; 2. Environmental conservation; 3. Continuation of operations; and 4. Protection of assets). The Risk Management Committee, chaired by the Member of the Board in charge of risk management,
promotes risk management throughout the Company. In the event of a serious crisis, a task force headed by the Representative Director, President & CEO is set up to respond to the situation.
1. Identify at the global level risks that could affect Yoki-Monozukuri and the continuation of ioperations, and strengthen countermeasures
2. Strengthen the emergency response system
3. Maintain and enhance the business continuity plan (BCP)

26 Kao Annual Report 2012
and revision of Kao’s Business Conduct Guidelines (BCG),
(2) implementation of educational activities to promote each
employee’s understanding of the BCG (employees sign an
acknowledgement of their understanding), and (3)
establishment and operation of compliance hotlines to resolve
employees’ questions and give them support to take
responsible action in a timely and appropriate manner.
Compliance-related activities are conducted throughout the
entire Kao Group, primarily through the Compliance Committee.
Measures to Promote and Establish Compliance
The principle of integrity, passed down from Kao’s founder,
is a core value of the Company’s corporate philosophy, The
Kao Way. Integrity means behaving lawfully and ethically
and conducting fair and honest business activities. Kao
regards integrity as the starting point of compliance and a
guiding principle to follow so that it may continue to earn
the respect and trust of all stakeholders.
To practice integrity in our daily business activities, we
have defined three compliance priorities: (1) establishment
Kao Named One of the World’s Most Ethical Companies for Sixth Consecutive Year
In March 2011, Kao was named one of the World’s Most Ethical Companies 2012 by Ethisphere Institute, a U.S. think tank. Since the first listing in 2007, Kao is the only Japanese company, and also the only consumer products company and chemical company in the world to be included in the list for six consecutive years. This year’s record number of surveyed companies came from over 100 countries, and 145 companies from more than 36 industries made the list. Companies are evaluated in five categories: Ethics and Compliance Program; Reputation, Leadership and Innovation; Corporate Citizenship and Responsibility; Governance; and Culture of Ethics. Among these categories, Kao received particular recognition for its measures to promote ethics and compliance. These include establishing and revising the BCG, conducting Integrity Workshops to instill a commitment to integrity in all Kao Group employees, and setting up hotlines at all Kao Group companies for employees to report or consult on possible legal or ethical violations. The hotlines resolve employees’ questions and give them support to take responsible action. In addition to these measures, Kao also received praise for enhancing environmental initiatives under its policy of ecology-centered management, including the June 2011 opening of a new research facility, the Eco-Technology Research Center.
http://www.kao.com/jp/en/corp_csr/csr.htmlFurther information is available on the Kao CSR webpage at
Main Activities in the Year Ended March 31, 2012• Revised BCG and conducted e-learning in domestic Kao Group companies and annual review
• Conducted Integrity Workshops (total number of attendees from October 1, 2008 to March 31, 2012):
Japan 4 times / 110 people Asia/Oceania 192 times / 4,520 people North America and Europe 62 times / 1,262 people Total 258 times / 5,892 people
• Established and began operation of compliance hotlines for reporting and consultation
• Conducted regular monitoring: Annual departmental self- assessment, supplier satisfaction survey, and self-check during training
Note: Besides the Integrity Workshops, Kao has conducted other BCG seminars since 2003 and has secured acknowledgements of understanding from all employees of domestic Kao Group companies.
Compliance

Kao Annual Report 2012 27
11-Year Summary 28
Management Discussion and Analysis 30
Consolidated Financial Statements 40
Notes to Consolidated Financial Statements 46
Independent Auditor’s Report 67
Financial Section
28 Kao Annual Report 2012
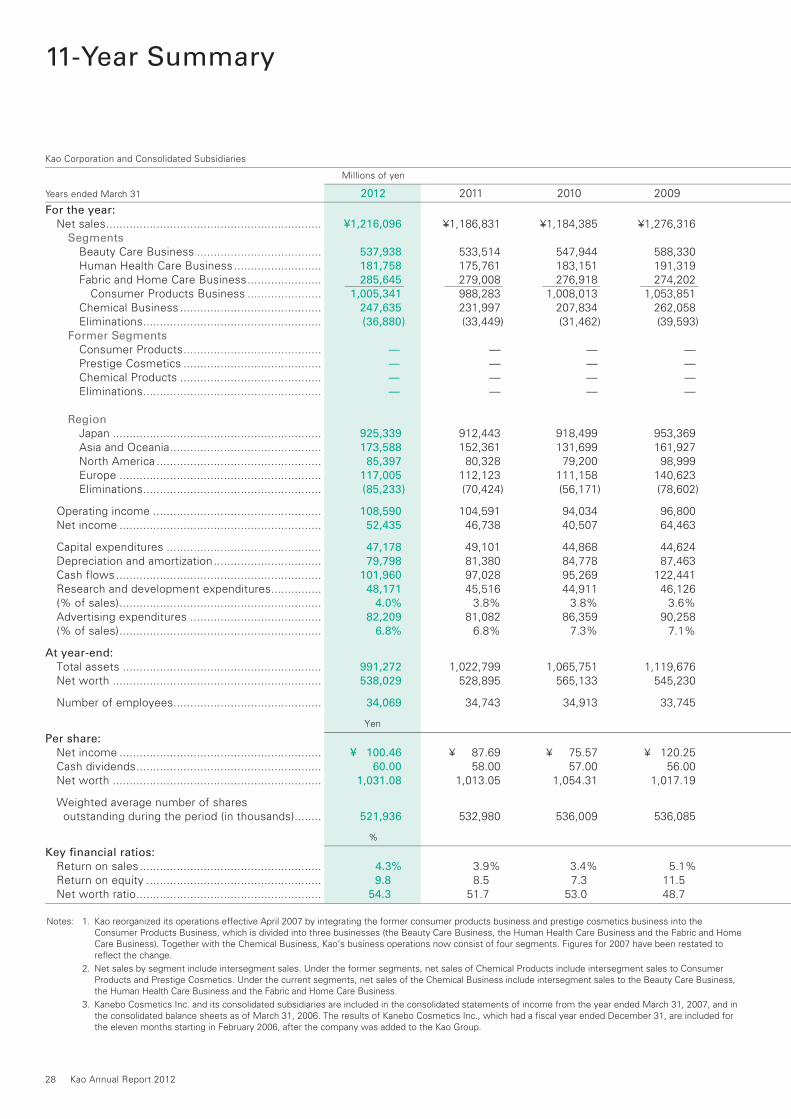
Kao Corporation and Consolidated Subsidiaries
Millions of yen
Years ended March 31 2012 2011 2010 2009 For the year:
Net sales ................................................................ Segments
Beauty Care Business ..................................... Human Health Care Business .......................... Fabric and Home Care Business ...................... Consumer Products Business ...................... Chemical Business .......................................... Eliminations ..................................................... Former Segments
Consumer Products ......................................... Prestige Cosmetics ......................................... Chemical Products .......................................... Eliminations .....................................................
Region
Japan .............................................................. Asia and Oceania ............................................. North America ................................................. Europe ............................................................ Eliminations .....................................................
Operating income .................................................. Net income ............................................................
Capital expenditures .............................................. Depreciation and amortization ................................ Cash flows ............................................................. Research and development expenditures............... (% of sales) ............................................................ Advertising expenditures ....................................... (% of sales) ............................................................
At year-end:
Total assets ........................................................... Net worth ..............................................................
Number of employees............................................
Yen
Per share:
Net income ............................................................ Cash dividends ....................................................... Net worth ..............................................................
Weighted average number of shares outstanding during the period (in thousands) ........
%
Key financial ratios:
Return on sales ...................................................... Return on equity .................................................... Net worth ratio .......................................................
¥1,216,096
537,938
181,758
285,645
1,005,341
247,635
(36,880)
—
—
—
—
925,339
173,588
85,397
117,005
(85,233)
108,590
52,435
47,178
79,798
101,960
48,171
4.0%
82,209
6.8%
991,272
538,029
34,069
¥ 100.46
60.00
1,031.08
521,936
4.3%
9.8
54.3
¥1,186,831 533,514 175,761 279,008 988,283 231,997 (33,449) — — — — 912,443 152,361 80,328 112,123 (70,424) 104,591 46,738 49,101 81,380 97,028 45,516 3.8% 81,082 6.8% 1,022,799 528,895 34,743
¥ 87.69 58.00 1,013.05 532,980
3.9% 8.5 51.7
¥1,184,385 547,944 183,151 276,918 1,008,013 207,834 (31,462) — — — — 918,499 131,699 79,200 111,158 (56,171) 94,034 40,507 44,868 84,778 95,269 44,911 3.8% 86,359 7.3% 1,065,751 565,133 34,913
¥ 75.57 57.00 1,054.31 536,009
3.4% 7.3 53.0
¥1,276,316 588,330 191,319 274,202 1,053,851 262,058 (39,593) — — — —
953,369 161,927 98,999 140,623 (78,602) 96,800 64,463 44,624 87,463 122,441 46,126 3.6% 90,258 7.1% 1,119,676 545,230 33,745
¥ 120.25 56.00 1,017.19 536,085
5.1% 11.5 48.7
Notes: 1. Kao reorganized its operations effective April 2007 by integrating the former consumer products business and prestige cosmetics business into the Consumer Products Business, which is divided into three businesses (the Beauty Care Business, the Human Health Care Business and the Fabric and Home Care Business). Together with the Chemical Business, Kao’s business operations now consist of four segments. Figures for 2007 have been restated to reflect the change.
2. Net sales by segment include intersegment sales. Under the former segments, net sales of Chemical Products include intersegment sales to Consumer Products and Prestige Cosmetics. Under the current segments, net sales of the Chemical Business include intersegment sales to the Beauty Care Business, the Human Health Care Business and the Fabric and Home Care Business.
3. Kanebo Cosmetics Inc. and its consolidated subsidiaries are included in the consolidated statements of income from the year ended March 31, 2007, and in the consolidated balance sheets as of March 31, 2006. The results of Kanebo Cosmetics Inc., which had a fiscal year ended December 31, are included for the eleven months starting in February 2006, after the company was added to the Kao Group.
11-Year Summary
Kao Annual Report 2012 29
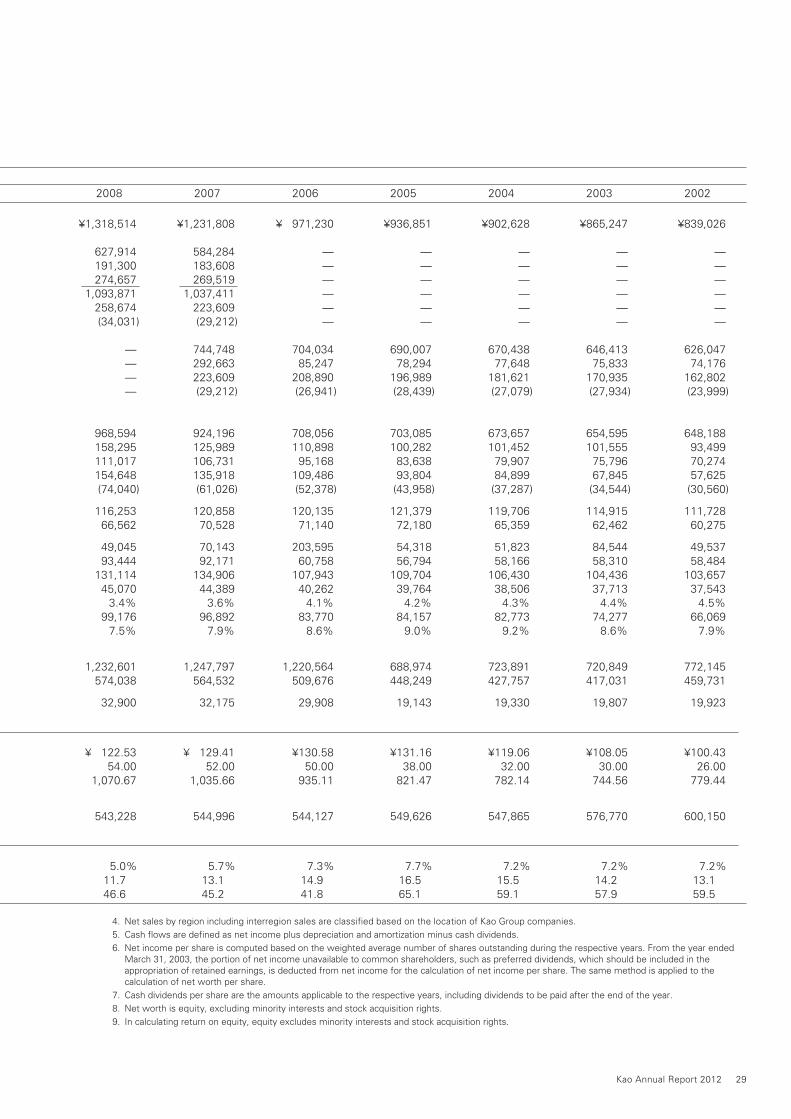
2008 2007 2006 2005 2004 2003 2002
¥1,318,514 627,914 191,300 274,657 1,093,871 258,674 (34,031) — — — —
968,594 158,295 111,017 154,648 (74,040) 116,253 66,562 49,045 93,444 131,114 45,070 3.4% 99,176 7.5% 1,232,601 574,038 32,900
¥ 122.53 54.00 1,070.67 543,228
5.0% 11.7 46.6
4. Net sales by region including interregion sales are classified based on the location of Kao Group companies. 5. Cash flows are defined as net income plus depreciation and amortization minus cash dividends. 6. Net income per share is computed based on the weighted average number of shares outstanding during the respective years. From the year ended
March 31, 2003, the portion of net income unavailable to common shareholders, such as preferred dividends, which should be included in the appropriation of retained earnings, is deducted from net income for the calculation of net income per share. The same method is applied to the calculation of net worth per share.
7. Cash dividends per share are the amounts applicable to the respective years, including dividends to be paid after the end of the year. 8. Net worth is equity, excluding minority interests and stock acquisition rights. 9. In calculating return on equity, equity excludes minority interests and stock acquisition rights.
¥1,231,808 584,284 183,608 269,519 1,037,411 223,609 (29,212) 744,748 292,663 223,609 (29,212)
924,196 125,989 106,731 135,918 (61,026) 120,858 70,528 70,143 92,171 134,906 44,389 3.6% 96,892 7.9%
1,247,797 564,532 32,175
¥ 129.41 52.00 1,035.66
544,996
5.7% 13.1 45.2
¥839,026 — — — — — — 626,047 74,176 162,802 (23,999)
648,188 93,499 70,274 57,625 (30,560) 111,728 60,275 49,537 58,484 103,657 37,543 4.5% 66,069 7.9%
772,145 459,731 19,923
¥100.43 26.00 779.44
600,150
7.2% 13.1 59.5
¥865,247 — — — — — — 646,413 75,833 170,935 (27,934)
654,595 101,555 75,796 67,845 (34,544) 114,915 62,462 84,544 58,310 104,436 37,713 4.4% 74,277 8.6%
720,849 417,031 19,807
¥108.05 30.00 744.56
576,770
7.2% 14.2 57.9
¥902,628 — — — — — — 670,438 77,648 181,621 (27,079)
673,657 101,452 79,907 84,899 (37,287) 119,706 65,359 51,823 58,166 106,430 38,506 4.3% 82,773 9.2%
723,891 427,757 19,330
¥119.06 32.00 782.14
547,865
7.2% 15.5 59.1
¥ 971,230 — — — — — — 704,034 85,247 208,890 (26,941)
708,056 110,898 95,168 109,486 (52,378) 120,135 71,140 203,595 60,758 107,943 40,262 4.1% 83,770 8.6%
1,220,564 509,676 29,908
¥130.58 50.00 935.11
544,127
7.3% 14.9 41.8
¥936,851 — — — — — — 690,007 78,294 196,989 (28,439)
703,085 100,282 83,638 93,804 (43,958) 121,379 72,180 54,318 56,794 109,704 39,764 4.2% 84,157 9.0%
688,974 448,249 19,143
¥131.16 38.00 821.47
549,626
7.7% 16.5 65.1

30 Kao Annual Report 2012
56.8
Net Sales (Left)Gross Profit Ratio (Right)
Net Sales / Gross Profit Ratio
2008 2009
1,318.5
58.0
2010
1,276.3
56.2
2011
1,184.4
58.4
(Billions of yen) (%)1,500
1,000
0
500
100
80
60
0
20
40
2012
1,186.8
58.0
(Years ended March 31)
1,216.1
8.9
Operating Income (Left)Operating Income Ratio (Right)
2008 2009
116.3
8.8
2010
96.8
7.6
2011
94.0
7.9
2012
104.6
8.8
(Billions of yen) (%)150
100
0
50
20
15
10
0
5
Operating Income /Operating Income Ratio
(Years ended March 31)
108.6
Overview of Consolidated Results
During the fiscal year ended March 31, 2012, the global
economy recovered overall, albeit weakly, despite the impact
of the European financial crisis. In Asia, economic expansion
continued, but at a slower pace. In Japan, there were signs of
a gradual recovery, although conditions remained severe due
to the effects of the Great East Japan Earthquake (the
“Earthquake”) in March 2011 as well as deflation and the
appreciation of the yen. The household and personal care
products market in Japan, a key market for the Kao Group,
contracted 1 percent on a value basis as consumer purchase
prices fell compared with the previous fiscal year with the
purchasing behavior of budget-strapped consumers. The
cosmetics market in Japan continued to contract due to a shift
in consumer preference to lower-priced products.
Under these circumstances, the Kao Group made all-out
efforts to ensure a stable supply of products after the
Earthquake as the mission of a manufacturer of daily
necessities, and worked to launch and nurture products with
high added value based on its concept of Yoki-Monozukuri.*
In addition, while aggressively investing for growth, including
the completion of the Eco-Technology Research Center, which
centralizes environmental research functions to accelerate
eco-innovation research, the Kao Group also worked to rebuild
its prestige cosmetics business in Japan and promote cost
reduction measures.
As a result, net sales increased 2.5 percent compared with
the previous fiscal year to ¥1,216.1 billion (US$14,796.2
million). Excluding the effect of currency translation, net sales
would have increased 4.0 percent. In the Beauty Care
Business, sales of prestige cosmetics grew in Japan, and
premium hair care products performed well outside Japan.
Sales increased in the Human Health Care Business and the
Fabric and Home Care Business. In the Chemical Business,
sales outside Japan increased as the Kao Group adjusted its
selling prices in response to fluctuations in raw material prices.
Operating income increased 3.8 percent compared with the
previous fiscal year to ¥108.6 billion (US$1,321.2 million) and net
income increased 12.2 percent to ¥52.4 billion (US$638.0 million).
* The Kao Group defines “Yoki-Monozukuri” as a strong commitment by all members to provide products and brands of excellent value for consumer satisfaction. In Japanese, “Yoki” literally means “good/excellent,” and “Monozukuri” means “development/manufacturing of products.”
Analysis of Income Statements
Net Sales and Operating Income
Net sales increased 2.5 percent compared with the previous
fiscal year to ¥1,216.1 billion (US$14,796.2 million). Excluding
the effect of currency translation, net sales would have
increased 4.0 percent. In the Beauty Care Business, sales of
prestige cosmetics expanded in Japan, while sales of
premium hair care products were strong overseas. Sales also
increased in the Human Health Care Business and the Fabric
and Home Care Business. In the Chemical Business, the Kao
Management Discussion and Analysis
Kao Annual Report 2012 31
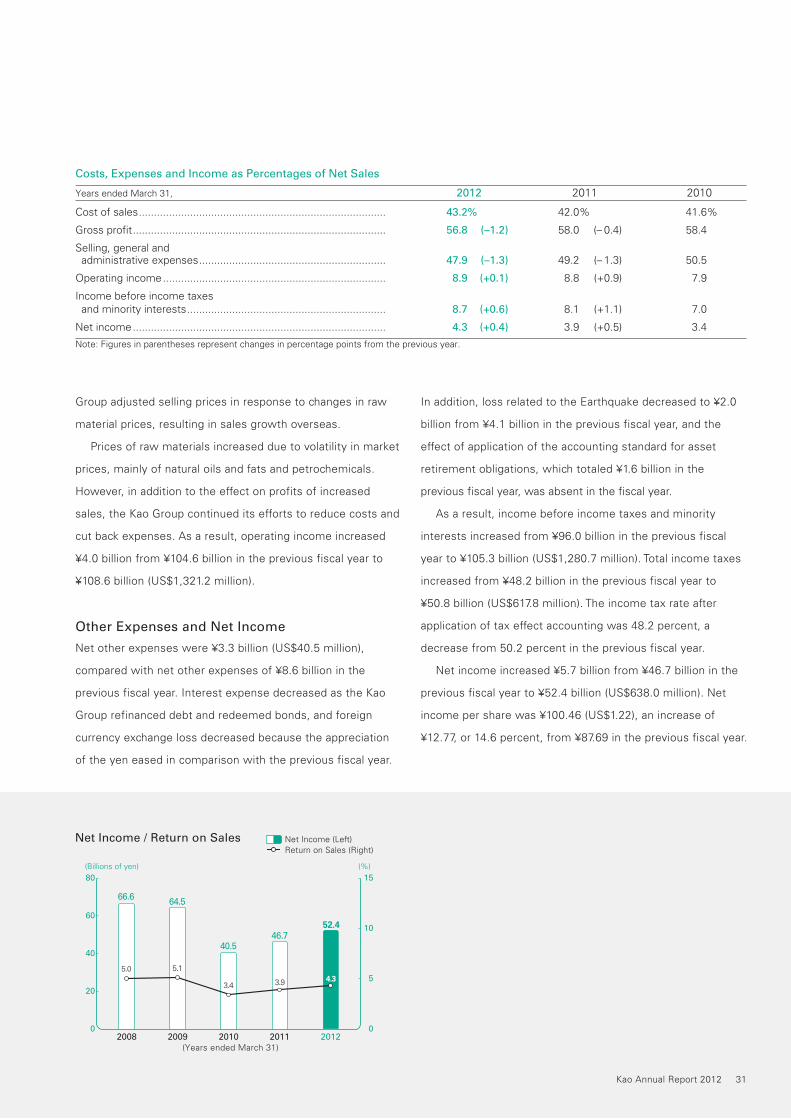
Net Income (Left)Return on Sales (Right)
2008 2009
66.6
5.0
2010
64.5
5.1
2011
40.5
3.4
(Billions of yen) (%)80
60
0
40
20
15
10
5
02012
46.752.4
3.9 4.3
Net Income / Return on Sales
(Years ended March 31)
Group adjusted selling prices in response to changes in raw
material prices, resulting in sales growth overseas.
Prices of raw materials increased due to volatility in market
prices, mainly of natural oils and fats and petrochemicals.
However, in addition to the effect on profits of increased
sales, the Kao Group continued its efforts to reduce costs and
cut back expenses. As a result, operating income increased
¥4.0 billion from ¥104.6 billion in the previous fiscal year to
¥108.6 billion (US$1,321.2 million).
Other Expenses and Net Income
Net other expenses were ¥3.3 billion (US$40.5 million),
compared with net other expenses of ¥8.6 billion in the
previous fiscal year. Interest expense decreased as the Kao
Group refinanced debt and redeemed bonds, and foreign
currency exchange loss decreased because the appreciation
of the yen eased in comparison with the previous fiscal year.
In addition, loss related to the Earthquake decreased to ¥2.0
billion from ¥4.1 billion in the previous fiscal year, and the
effect of application of the accounting standard for asset
retirement obligations, which totaled ¥1.6 billion in the
previous fiscal year, was absent in the fiscal year.
As a result, income before income taxes and minority
interests increased from ¥96.0 billion in the previous fiscal
year to ¥105.3 billion (US$1,280.7 million). Total income taxes
increased from ¥48.2 billion in the previous fiscal year to
¥50.8 billion (US$617.8 million). The income tax rate after
application of tax effect accounting was 48.2 percent, a
decrease from 50.2 percent in the previous fiscal year.
Net income increased ¥5.7 billion from ¥46.7 billion in the
previous fiscal year to ¥52.4 billion (US$638.0 million). Net
income per share was ¥100.46 (US$1.22), an increase of
¥12.77, or 14.6 percent, from ¥87.69 in the previous fiscal year.
Costs, Expenses and Income as Percentages of Net Sales
Years ended March 31, 2012 2011 2010
Cost of sales .................................................................................. 43.2% 42.0% 41.6%
Gross profit .................................................................................... 56.8 (–1.2) 58.0 (– 0.4) 58.4
Selling, general and administrative expenses .............................................................. 47.9 (–1.3) 49.2 (– 1.3) 50.5
Operating income .......................................................................... 8.9 (+0.1) 8.8 (+0.9) 7.9
Income before income taxes and minority interests .................................................................. 8.7 (+0.6) 8.1 (+1.1) 7.0
Net income .................................................................................... 4.3 (+0.4) 3.9 (+0.5) 3.4
Note: Figures in parentheses represent changes in percentage points from the previous year.

32 Kao Annual Report 2012
Information by Segment
Consumer Products Business
Sales increased 1.7 percent compared with the previous fiscal
year to ¥1,005.3 billion (US$12,231.9 million). Excluding the effect
of currency translation, sales would have increased 2.8 percent.
In Japan, sales increased 1.8 percent to ¥832.3 billion
(US$10,126.2 million). Although sales were impacted by the
Earthquake, intensified market competition and deflation, the
Kao Group took measures including proposing environmentally
conscious products, launching new products in response to
changing consumer lifestyles and enhancing proposal-based
sales and in-store merchandising activities.
In Asia and Oceania, sales increased 6.6 percent to ¥87.4
billion (US$1,063.8 million). Excluding the effect of currency
translation, sales would have increased 11.8 percent. Although
market competition intensified, the Kao Group carried out
aggressive measures including collaborations with retailers and
introduction of new products amid continued market growth.
In North America, sales decreased 2.7 percent to ¥49.6
billion (US$603.9 million). Excluding the effect of currency
translation, sales would have increased 6.6 percent. The
market was firm, and new products contributed to sales, but
the appreciation of the yen exerted an impact on results.
In Europe, sales increased 1.3 percent to ¥61.5 billion
(US$748.4 million). Excluding the effect of currency
translation, sales would have increased 5.1 percent. The
market recovered, albeit gradually, and new products launched
in 2010 performed well.
Operating income increased ¥5.1 billion to ¥85.6 billion
(US$1,041.3 million). Although there was an impact from
higher raw material prices, the Kao Group curtailed expenses
and took steps to reduce costs.
Beauty Care Business
Sales increased 0.8 percent compared with the previous fiscal
year to ¥537.9 billion (US$6,545.1 million). Excluding the effect of
currency translation, sales would have increased 2.4 percent.
Sales of prestige cosmetics, which consist of self-selection
and counseling cosmetics, increased 2.2 percent to ¥260.0
billion (US$3,163.2 million) with the launch of new products,
although the downtrend continued in Japan’s cosmetics market
with the impact of the Earthquake in addition to the shift in
consumer preference toward lower-priced products. In Japan,
the Kao Group launched new products and enhanced in-store
merchandising for self-selection brands such as KATE makeup
and EVITA total cosmetics. In counseling cosmetics, the Kao
Group nurtured and strengthened its megabrands with annual
sales of more than ¥10 billion, including making improvements to
the BLANCHIR SUPERIOR whitening skin care and SOFINA
beauté skin care brands, and adding a new product line for
SOFINA Primavista base makeup. In addition, the Kao Group
carried out reform of sales methods including optimization of
marketing activities and counseling in response to changes in
consumer needs and increased its share in a contracting market.
Sales outside Japan expanded steadily.
0
250
500
750
0
10
20
30
40
50
2009 2010 2011
(Billions of yen) (Billions of yen)
2008 2012(Years ended March 31)
537.9
15.4
Net Sales (Left)Operating Income (Right)
Net Sales / Operating Income
Beauty Care Business
627.9
27.3
588.3
17.6
547.9
4.7
533.5
5.5
0
200
400
600
800
1,000
1,200
0
50
100
150
2009 2010 2011
(Billions of yen) (Billions of yen)
2008 2012(Years ended March 31)
1,093.9
96.5
1,053.9
79.6
1,008.0
74.4
988.3
80.5
1,005.3
85.6
Net Sales (Left)Operating Income (Right)
Net Sales / Operating Income
Consumer Products Business
32 Kao Annual Report 2012

Kao Annual Report 2012 33
Sales of premium skin care products grew in Japan as the Kao
Group launched products from the Bioré facial cleanser and Bioré U
body cleanser brands that use new cleansing technology (Skin
Purifying Technology) to wash away dirt with the least possible
damage to the skin, and continued to make proposals for dry and
sensitive skin with the Curél brand. Sales in Asia increased, with
product improvements contributing to strong performance by
Bioré in Hong Kong, Taiwan and Indonesia. In North America,
Jergens performed well in the hand and body lotion category.
Sales of premium hair care products decreased in Japan.
Sales of Merit shampoo and conditioner were steady, but sales
of hair coloring products were weak due to market contraction
and intensifying competition. Sales in Asia increased, with
strong performance by Liese foam hair color in Hong Kong,
Taiwan and Thailand. In North America and Europe, strong sales
of foam hair color, hair styling products and other new John Frieda
products drove substantial sales growth.
Operating income increased ¥9.9 billion to ¥15.4 billion
(US$187.5 million) due to ongoing efforts to rebuild the prestige
cosmetics business in Japan and other factors, even though the
Kao Group invested aggressively in advertising expenses for new
products in North America and Europe. Operating income before
amortization of goodwill and other items related to acquisitions
(EBITA) increased ¥9.0 billion to ¥48.9 billion (US$594.9 million),
which is equivalent to 9.1 percent of sales.
Human Health Care Business
Sales increased 3.4 percent compared with the previous fiscal
year to ¥181.8 billion (US$2,211.4 million). Excluding the effect of
currency translation, sales would have increased 4.0 percent.
In food and beverage products, the Healthya brand of
functional drinks that promote body fat utilization gained support
from consumers and sales were firm.
Sales of sanitary products were essentially flat compared
with the previous fiscal year. Sales of sanitary napkins grew
steadily in Japan, aided by the launch of improved Laurier F, and
also increased in Asian countries. Sales of baby diapers were
impacted by market contraction and competition in Japan,
although market share grew. In Taiwan, China and Russia, baby
diapers performed strongly.
Sales of personal health products increased, as toothpastes
and Bub bath additives performed well.
Operating income decreased ¥0.7 billion to ¥14.6 billion
(US$178.0 million) with the impact of increased raw material
prices and market competition, despite the Kao Group’s cost
reduction activities in addition to the impact of increased sales.
Fabric and Home Care Business
Sales increased 2.4 percent compared with the previous fiscal
year to ¥285.6 billion (US$3,475.4 million). Excluding the effect
of currency translation, sales would have increased 2.9 percent.
Sales of fabric care products increased. In Japan, the Kao
Group worked to highlight the reduced laundry time and
0
50
100
150
200
0
4
8
12
16
20
2009 2010 2011
(Billions of yen) (Billions of yen)
2008 2012(Years ended March 31)
191.3
13.2
191.3
13.0
183.2
9.0
175.8
15.3
181.8
14.6
Net Sales (Left)Operating Income (Right)
Net Sales / Operating Income
Human Health Care Business
0
100
200
300
0
20
40
60
80
2009 2010 2011
(Billions of yen) (Billions of yen)
2008 2012(Years ended March 31)
274.7
56.1
274.2
49.1
276.9
60.7
279.0
59.7
285.6
55.5
Net Sales (Left)Operating Income (Right)
Net Sales / Operating Income
Fabric and Home Care Business
Kao Annual Report 2012 33
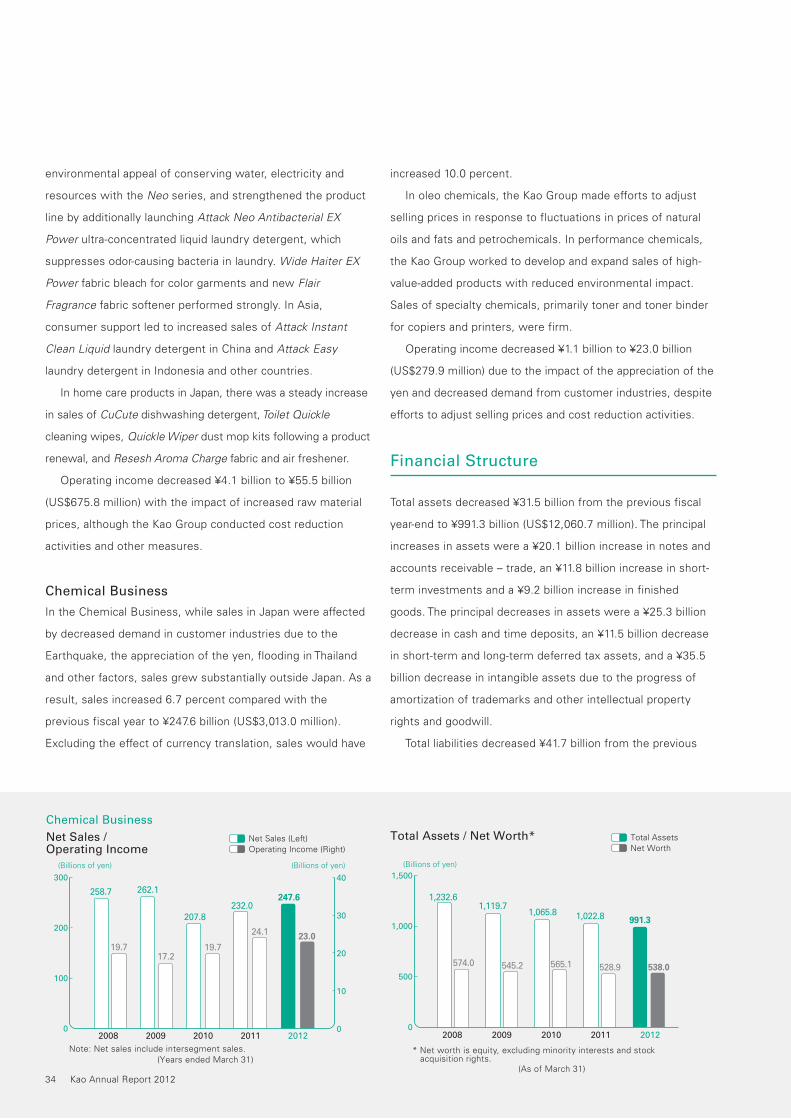
34 Kao Annual Report 2012
environmental appeal of conserving water, electricity and
resources with the Neo series, and strengthened the product
line by additionally launching Attack Neo Antibacterial EX
Power ultra-concentrated liquid laundry detergent, which
suppresses odor-causing bacteria in laundry. Wide Haiter EX
Power fabric bleach for color garments and new Flair
Fragrance fabric softener performed strongly. In Asia,
consumer support led to increased sales of Attack Instant
Clean Liquid laundry detergent in China and Attack Easy
laundry detergent in Indonesia and other countries.
In home care products in Japan, there was a steady increase
in sales of CuCute dishwashing detergent, Toilet Quickle
cleaning wipes, Quickle Wiper dust mop kits following a product
renewal, and Resesh Aroma Charge fabric and air freshener.
Operating income decreased ¥4.1 billion to ¥55.5 billion
(US$675.8 million) with the impact of increased raw material
prices, although the Kao Group conducted cost reduction
activities and other measures.
Chemical Business
In the Chemical Business, while sales in Japan were affected
by decreased demand in customer industries due to the
Earthquake, the appreciation of the yen, flooding in Thailand
and other factors, sales grew substantially outside Japan. As a
result, sales increased 6.7 percent compared with the
previous fiscal year to ¥247.6 billion (US$3,013.0 million).
Excluding the effect of currency translation, sales would have
increased 10.0 percent.
In oleo chemicals, the Kao Group made efforts to adjust
selling prices in response to fluctuations in prices of natural
oils and fats and petrochemicals. In performance chemicals,
the Kao Group worked to develop and expand sales of high-
value-added products with reduced environmental impact.
Sales of specialty chemicals, primarily toner and toner binder
for copiers and printers, were firm.
Operating income decreased ¥1.1 billion to ¥23.0 billion
(US$279.9 million) due to the impact of the appreciation of the
yen and decreased demand from customer industries, despite
efforts to adjust selling prices and cost reduction activities.
Financial Structure
Total assets decreased ¥31.5 billion from the previous fiscal
year-end to ¥991.3 billion (US$12,060.7 million). The principal
increases in assets were a ¥20.1 billion increase in notes and
accounts receivable – trade, an ¥11.8 billion increase in short-
term investments and a ¥9.2 billion increase in finished
goods. The principal decreases in assets were a ¥25.3 billion
decrease in cash and time deposits, an ¥11.5 billion decrease
in short-term and long-term deferred tax assets, and a ¥35.5
billion decrease in intangible assets due to the progress of
amortization of trademarks and other intellectual property
rights and goodwill.
Total liabilities decreased ¥41.7 billion from the previous
0
100
200
300
0
10
20
30
40
2009 2010 2011
(Billions of yen) (Billions of yen)
2008 2012
(Years ended March 31)
258.7
19.7
262.1
17.2
207.8
19.7
232.0
24.1
247.6
23.0
Note: Net sales include intersegment sales.
Net Sales (Left)Operating Income (Right)
Net Sales / Operating Income
Chemical Business
0
500
1,000
1,500
2008 2009 2010 2011 2012
* Net worth is equity, excluding minority interests and stock acquisition rights.
(As of March 31)
1,232.6
574.0
1,119.7
545.2
1,065.8
565.1
1,022.8
528.9
991.3
538.0
(Billions of yen)
Total AssetsNet Worth
Total Assets / Net Worth*
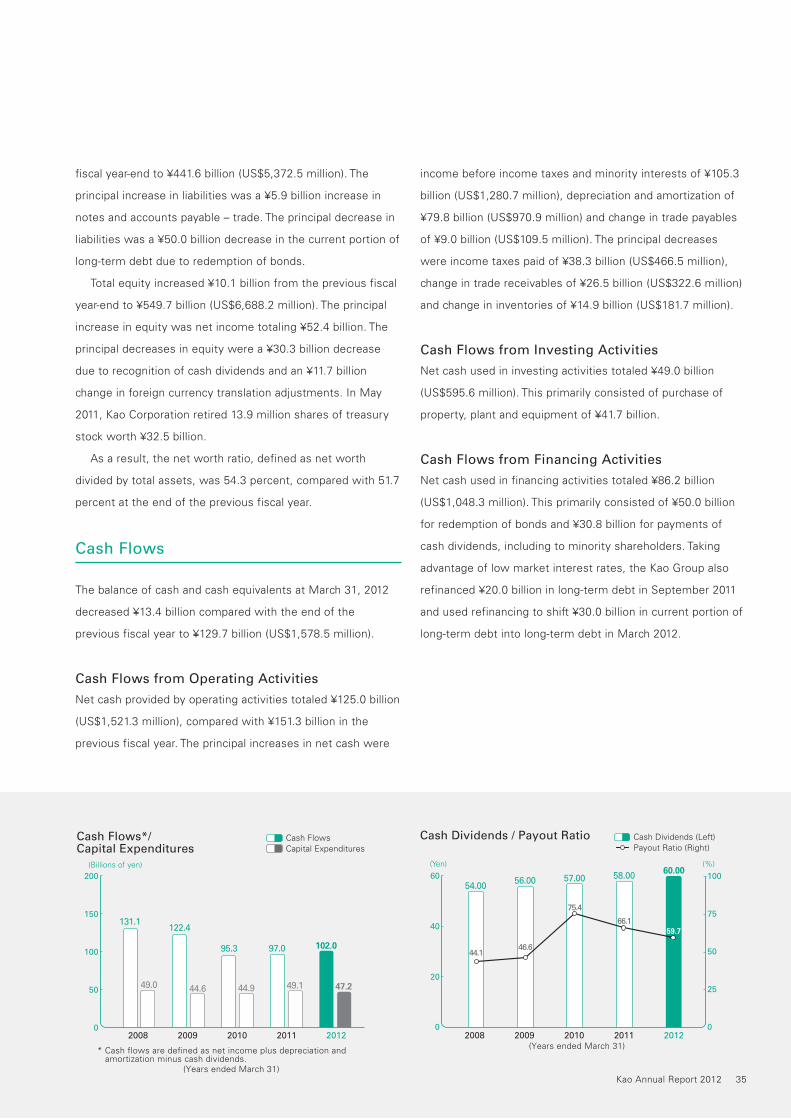
Kao Annual Report 2012 35
fiscal year-end to ¥441.6 billion (US$5,372.5 million). The
principal increase in liabilities was a ¥5.9 billion increase in
notes and accounts payable – trade. The principal decrease in
liabilities was a ¥50.0 billion decrease in the current portion of
long-term debt due to redemption of bonds.
Total equity increased ¥10.1 billion from the previous fiscal
year-end to ¥549.7 billion (US$6,688.2 million). The principal
increase in equity was net income totaling ¥52.4 billion. The
principal decreases in equity were a ¥30.3 billion decrease
due to recognition of cash dividends and an ¥11.7 billion
change in foreign currency translation adjustments. In May
2011, Kao Corporation retired 13.9 million shares of treasury
stock worth ¥32.5 billion.
As a result, the net worth ratio, defined as net worth
divided by total assets, was 54.3 percent, compared with 51.7
percent at the end of the previous fiscal year.
Cash Flows
The balance of cash and cash equivalents at March 31, 2012
decreased ¥13.4 billion compared with the end of the
previous fiscal year to ¥129.7 billion (US$1,578.5 million).
Cash Flows from Operating Activities
Net cash provided by operating activities totaled ¥125.0 billion
(US$1,521.3 million), compared with ¥151.3 billion in the
previous fiscal year. The principal increases in net cash were
income before income taxes and minority interests of ¥105.3
billion (US$1,280.7 million), depreciation and amortization of
¥79.8 billion (US$970.9 million) and change in trade payables
of ¥9.0 billion (US$109.5 million). The principal decreases
were income taxes paid of ¥38.3 billion (US$466.5 million),
change in trade receivables of ¥26.5 billion (US$322.6 million)
and change in inventories of ¥14.9 billion (US$181.7 million).
Cash Flows from Investing Activities
Net cash used in investing activities totaled ¥49.0 billion
(US$595.6 million). This primarily consisted of purchase of
property, plant and equipment of ¥41.7 billion.
Cash Flows from Financing Activities
Net cash used in financing activities totaled ¥86.2 billion
(US$1,048.3 million). This primarily consisted of ¥50.0 billion
for redemption of bonds and ¥30.8 billion for payments of
cash dividends, including to minority shareholders. Taking
advantage of low market interest rates, the Kao Group also
refinanced ¥20.0 billion in long-term debt in September 2011
and used refinancing to shift ¥30.0 billion in current portion of
long-term debt into long-term debt in March 2012.
0
50
100
150
200
2008 2009 2010 2011 2012
102.0
47.2
(Billions of yen)
Cash FlowsCapital Expenditures
Cash Flows*/Capital Expenditures
* Cash flows are defined as net income plus depreciation and amortization minus cash dividends.
(Years ended March 31)
131.1
49.0
122.4
44.6
95.3
44.9
97.0
49.1
(Years ended March 31)
0
20
40
60
2008 2009 2010 2011 2012
60.00
0
25
50
75
100
44.146.6
75.4
66.159.7
54.00 56.00 57.00 58.00(Yen) (%)
Cash Dividends (Left)Payout Ratio (Right)
Cash Dividends / Payout Ratio

36 Kao Annual Report 2012
Planned Change in Fiscal Year End
Due to a planned change in the fiscal year end from March 31
to December 31, the fiscal year ending December 31, 2012
will be the nine-month period from April through December
for Kao Corporation and its subsidiaries with a fiscal year end
in March, and the twelve-month period from January through
December for subsidiaries with a fiscal year end in December.
Basic Policies Regarding Distribution of
Profits and Dividends for the Period
In order to achieve profitable growth, Kao Corporation secures
an internal reserve for capital investment and acquisitions
from a medium-to-long-term management perspective and
places priority on providing shareholders with steady and
continuous dividends. In addition, the Company flexibly
considers the repurchase and retirement of shares from the
standpoint of improving capital efficiency.
In accordance with these policies, and in light of the
increase in net income compared with the previous fiscal
year, Kao Corporation announced a year-end dividend for the
fiscal year ended March 31, 2012 of ¥31.00 (US$0.38) per
share, an increase of ¥2.00 per share from the previous
fiscal year. Consequently, cash dividends for the fiscal year
increased ¥2.00 per share compared with the previous fiscal
year, resulting in a total of ¥60.00 (US$0.73) per share and a
consolidated payout ratio of 59.7 percent.
For the fiscal year ending December 31, 2012, Kao
Corporation plans to pay total cash dividends of ¥62.00 per
share, an increase of ¥2.00 per share compared with the
previous fiscal year. Although consolidated group companies
with a fiscal year end in March will only report a nine-month
period due to the change in the fiscal year end, this plan is in
accordance with the Company’s basic policies regarding
distribution of profits, and free cash flow and other factors
have also been taken into consideration. As a result, the
projected consolidated payout ratio will be 53.9 percent.
EVA
Economic Value Added (EVA®) is the Kao Group’s main
management metric, defined as net operating profit after tax
(NOPAT) less a charge for the cost of invested capital in the
business. We believe EVA indicates “true” profit. Continuously
increasing EVA raises corporate value, which is consistent
with the long-term interest of not only shareholders but other
stakeholders as well. The Kao Group aims to conduct
business activities that expand the scale of its business while
also increasing EVA, and uses EVA for business performance
evaluation, performance-based compensation and strategic
decision-making. During the fiscal year ended March 31, 2012,
due to an increase in NOPAT and a decrease in invested
capital, EVA increased to 106 from 95 for the previous fiscal
year, expressed as an index with the year ended March 31,
2000 as 100. The Kao Group conducted the following EVA-
related activities during the fiscal year.
EVA*(EVA for the the year ended March 31, 2000 = 100)
0
50
100
150
200(Billions of yen)
2000 2001 2002 2003 2004 2005 2006 2007 2008 2009 2010 2011 2012
100113 120
132142
154163
134125
91
67
95106
*EVA (Economic Value Added) is a registered trademark of Stewart & Co.

Kao Annual Report 2012 37
Investing for Growth: During the fiscal year ended March 31,
2012, the Kao Group invested aggressively for future growth. In
the growth market of China, a new factory is under construction
and is scheduled to begin production of baby diapers at the end
of December 2012. To raise its competitiveness in global
markets and achieve profitable growth, the Kao Group built the
Eco-Technology Research Center in Wakayama, Japan, which
started operation in June 2011. This centralizes and combines
the Kao Group’s environmental research functions and
accelerates the development of next-generation environmental
technologies, particularly eco-innovation research and
technologies, in order to embody ecology-centered
management in the development and manufacture of products.
Research and development expenditures, which increased ¥2.7
billion compared with the previous fiscal year to ¥48.2 billion
(US$586.1 million), were the equivalent of 4.0 percent of net
sales, compared with 3.8 percent in the previous fiscal year.
Increasing Profit: During the fiscal year ended March 31,
2012, NOPAT increased due to an increase in sales volume
from strong performance by the Chemical Business outside
Japan and steady results from rebuilding the prestige
cosmetics business in Japan. Moreover, ongoing total cost
reduction activities cut costs by ¥9.0 billion year on year.
Financial Improvement: Free cash flow* totaled ¥76.1 billion
(US$925.7 million) for the year ended March 31, 2011, a
decrease of ¥43.4 billion compared with the previous fiscal
year due to an increase in capital expenditures and an
increase in notes and accounts receivable because the fiscal
year end was on a weekend. The Kao Group has set priorities
for how it will deploy this free cash flow. Investments for
mergers and acquisitions and additional capital expenditures
for future growth are the top priorities in deploying free cash
flow, followed by stable and continuous dividends. Kao
Corporation increased cash dividends per share for the fiscal
year by ¥2.00 to ¥60.00 (US$0.73) for the 22nd consecutive
year of growth in cash dividends. Moreover, the Kao Group
uses the remaining free cash flow for the repurchase of
shares as a payout measure and for repayment of interest-
bearing debt, considering its investment plans and financial
market conditions. During the fiscal year, the Kao Group
redeemed bonds totaling ¥50.0 billion (US$608.3 million). The
Kao Group also took advantage of low market interest rates to
refinance ¥50.0 billion (US$608.3 million) in debt.
* Free cash flow: Net cash provided by operating activities + Net cash used in investing activities
Business Risks and Other Risks
Various risks arise in the course of a company’s business. The
Kao Group takes reasonable measures to mitigate risks by
preventing the occurrence of, diversifying and hedging them.
However, unanticipated situations may occur that exert a
significant impact on the Kao Group’s business results and
financial condition. The risks described below are not a
comprehensive list of risks the Kao Group faces. Other risks
exist and may have an impact on investment decisions.
Any statements below concerning the future are judgments
made by Kao Corporation as of the submission of its securities
report to the Ministry of Finance on June 28, 2012.
(1) Market and Consumer Demand
The Japanese consumer products market, the foundation of
the Kao Group’s operations, has been sluggish in recent years,
due to economic stagnation as well as changes in the Kao
Group’s customer base as a consequence of the declining birth
rate and aging society. Utilizing the changes in the values of its
customer base, the Kao Group aims to respond to consumers’
needs by applying its comprehensive Yoki-Monozukuri (see
note on page 30) capabilities and working to develop value-
added products to maintain and improve its brand values.
However, a number of factors could cause uncertainties in the
Kao Group’s business activities, delaying an adequate response
to these changes. This could have a gradual impact on the Kao
Group’s business results and financial condition.
(2) Prestige Cosmetics Business
The Kao Group operates the prestige cosmetics business,
where it is difficult to attain significant results using the
business model it has developed to date, due to intensifying
competition in Japan and overseas from competitors in the

38 Kao Annual Report 2012
same industries and the entrance of new companies from
other industries, as well as changes in consumer purchasing
attitudes accompanied by substantial changes in retail
channels. The Kao Group is rebuilding its prestige cosmetics
business in Japan through initiatives including brand and
marketing reform. However, a delay in appropriate response
could have an impact on the Kao Group’s business results and
financial condition.
(3) Distributors and Retailers
The Kao Group is highly dependent on the Japanese market.
Particularly in the consumer products business in Japan, the
progress of new groups of retailers due to merger and
integration, changes in sales channels and the appearance of
new distributors in response to changes in consumer activity
could affect the Kao Group’s sales activities. The Kao Group is
offering proposals and conducting activities that correspond to
these changes in the retail environment. Nevertheless, a delay
in appropriate response could have an impact on the Kao
Group’s business results and financial condition.
(4) Overseas Operations
As one of its growth strategies, the Kao Group is conducting
operations in markets in Asia, North America and Europe, with
a particular emphasis on strengthening its operations in
countries where higher economic growth rates and market
expansion are forecast. However, in the course of business,
factors such as competition, pricing, cost management,
distribution, and relationships with vendors may not go as
planned. This could have an impact on the Kao Group’s
business results and financial condition.
(5) Environmental Activities
The Kao Group works for both business growth and “eco-
innovation” by developing products with high environmental
value that conserve water and other resources, as well as
focusing on using raw materials that are low in greenhouse
gas emission volumes or recyclable, conserving energy in
production and distribution, and employing renewable energy,
in addition to their original product quality and performance.
However, results may not meet the initial intentions due to
reasons including a lack of consumer acceptance of new
products’ environmental technologies or a lack of distinct
advantage over other companies’ products. This could have an
impact on the Kao Group’s business results and financial
condition.
(6) Raw Material Prices
Market prices for fats and oils used as raw materials for
products of the Kao Group and petroleum-related raw
materials may change for various reasons including
geopolitical risks, the balance between supply and demand,
abnormal weather and exchange rate fluctuations. The Kao
Group has moved to reduce the effect of increases in raw
material prices through measures including cost reductions
and passing on increases in raw material costs into product
prices. However, unexpectedly radical changes in market
conditions and pricing could have an impact on the Kao
Group’s business results and financial condition.
(7) Product Quality
The Kao Group designs and manufactures products from the
viewpoint of consumers, in compliance with related laws and
regulations and voluntary standards. In the development
stage prior to market launch, the Kao Group conducts
thorough safety testing and survey research to confirm the
safety of products. After market launch, the Kao Group works
to further improve quality by incorporating the opinions and
desires of consumers through its consumer communication
centers. However, the unanticipated occurrence of a serious
quality problem or concerns about product safety or reliability
resulting from new scientific knowledge would not only cause
difficulties for the relevant brand, but would also have a major
impact on the reputation of all of the Kao Group’s products.
This could cause a decrease in sales, which could impact the
Kao Group’s business results and financial condition.
(8) Earthquakes and Other Incidents
The Kao Group has implemented earthquake resistance
diagnoses, seismic retrofitting, emergency drills simulating

Kao Annual Report 2012 39
crisis situations, and systems to confirm employee safety at
all of its production facilities and primary offices in Japan, and
has promoted the formulation of a business continuity plan
(BCP). The Kao Group is currently planning to strengthen its
disaster countermeasures, including reviewing its measures
to respond to risks and reinforcing its BCP. In spite of these
measures, however, in the event of an earthquake on a scale
beyond our assumptions and the consequent damage, the
Kao Group’s ability to secure raw materials, maintain
production, or supply products to the market may be
disrupted, or demand trends could change significantly due to
a worsening economic environment, which could have a
serious impact on the Kao Group’s business results and
financial condition. Furthermore, impediments to continuing
production, securing raw materials, or supplying products to
markets due to factors including a fire or explosion at
production facilities, information system malfunction,
problems at a supplier of raw materials, dysfunction of social
infrastructures such as electric power and water,
environmental pollution from radioactive materials or other
harmful substances, terrorism, political change, riots and
other incidents could have a serious impact on the Kao
Group’s business results and financial condition.
(9) Currency Exchange Rate Fluctuations
Foreign currency-denominated transactions are affected by
changes in currency exchange rates. The Kao Group hedges
foreign exchange risk through various measures such as
settlement of transactions through foreign currency accounts,
foreign exchange contracts, and currency swaps to mitigate
the effect on business results. The Kao Group does not
engage in derivative transactions for the purpose of
speculation. However, items denominated in local currencies,
including the sales, expenses and assets of overseas
consolidated subsidiaries, are translated into Japanese yen for
preparation of the consolidated financial statements. If the
exchange rate at the time of conversion differs substantially
from the expected rate, the value after translation into yen will
change significantly, which will have an impact on the Kao
Group’s business results and financial condition.
(10) Impairment
The Kao Group records various tangible and intangible fixed
assets and deferred tax assets including assets used in the
course of business and goodwill incurred in corporate
acquisitions. Impairment of or increase in valuation allowance
for these assets may be required if cash flow does not meet
expectations due to trends in future business results, decline
in market value or other factors. This accounting treatment
could have an impact on the Kao Group’s business results and
financial condition.
(11) Human Resources
Securing capable human resources is indispensable to achieve
the Kao Group’s business goals. Hiring, developing and
retaining human resources with advanced expertise to
implement R&D, production of technologies, market planning
and sales activities are necessary to the Yoki-Monozukuri (see
note on page 30) that consumers consistently support.
However, an inability to secure superior human resources due
to changes in employment conditions or other factors could
have an impact on the Kao Group’s business results and
financial condition.
(12) Legal and Regulatory Issues
In the course of its business activities, the Kao Group must
comply with a variety of laws and regulations concerning
areas such as standards for product quality and safety, the
environment and chemical substances, as well as accounting
standards, tax law and regulations related to labor and
transactions. The Kao Group has constructed a compliance
system and strives to comply with all related laws and
regulations. However, a serious legal violation, change in
current laws and regulations, or new laws and regulations
could restrict the Kao Group’s business activities, require
investment for compliance, or otherwise affect the Kao
Group. This could have an impact on the Kao Group’s business
results and financial condition.

40 Kao Annual Report 2012
Consolidated Balance Sheets
Kao Corporation and Consolidated SubsidiariesMarch 31, 2012 and 2011 Thousands of Millions of yen U.S. dollars (Note 2)
Assets 2012 2011 2012
Current assets:
Cash and time deposits (Notes 3 and 16) .................................................. ¥ 110,762 Short-term investments (Notes 3, 4 and 16) .............................................. 37,028 Notes and accounts receivable (Note 16): Trade (Note 5) ........................................................................................ 120,297 1 Nonconsolidated subsidiaries and affiliates ............................................ 1,610 2,912 Other ...................................................................................................... 3,066 6,101 Inventories: Finished goods ....................................................................................... 73,190 82,581 Work in process and raw materials ........................................................ 36,148 42,4,170 Deferred tax assets (Note 6) ...................................................................... 21,854 22,3,222 Other current assets .................................................................................. 13,959 15,905 Allowance for doubtful receivables (Note 16) ............................................. (1,081) (2,36) Total current assets ............................................................................ 416,833 4351,025
Property, plant and equipment (Note 5): Land........................................................................................................... 62,873 6887 Buildings and structures ............................................................................ 321,040 330 Machinery, equipment and other ............................................................... 694,261 775 Lease assets .............................................................................................. 12,147 —18 Construction in progress ............................................................................ 8,321 9,,880 Total .................................................................................................... 1,098,642 1,190 Accumulated depreciation ......................................................................... (853,918) (83) Net property, plant and equipment ..................................................... 244,724 234
Intangible assets:
Goodwill .................................................................................................... 179,225 2387 Trademarks ................................................................................................ 71,176 1255 Other intangible assets .............................................................................. 22,557 375 Total intangible assets ........................................................................ 272,958 4047
Investments and other assets:
Investment securities (Notes 4 and 16) ..................................................... 7,023 04 Investments in and advances to nonconsolidated subsidiaries and affiliates ....................................................................... 5,590 287 Deferred tax assets (Note 6) ...................................................................... 49,966 4,029 Other assets (Note 8) ................................................................................ 25,705 438 Total investments and other assets .................................................... 88,284 ,108 ¥ 1,022,799 x8,514
See Notes to Consolidated Financial Statements.
¥ 85,483
48,798
140,352
3,349
2,670
82,393
38,313
17,736
14,970
(1,115)
432,949
64,796
323,137
693,758
11,934
10,109
1,103,734
(863,156)
240,578
165,614
53,583
18,266
237,463
7,516
6,927
42,554
23,285
80,282
¥ 991,272
$ 1,040,066
593,722
1,707,653
40,747
32,486
1,002,470
466,151
215,793
182,138
(13,566)
5,267,660
788,369
3,931,585
8,440,905
145,200
122,996
13,429,055
(10,501,959)
2,927,096
2,015,014
651,941
222,241
2,889,196
91,447
84,280
517,752
283,306
976,785
$12,060,737
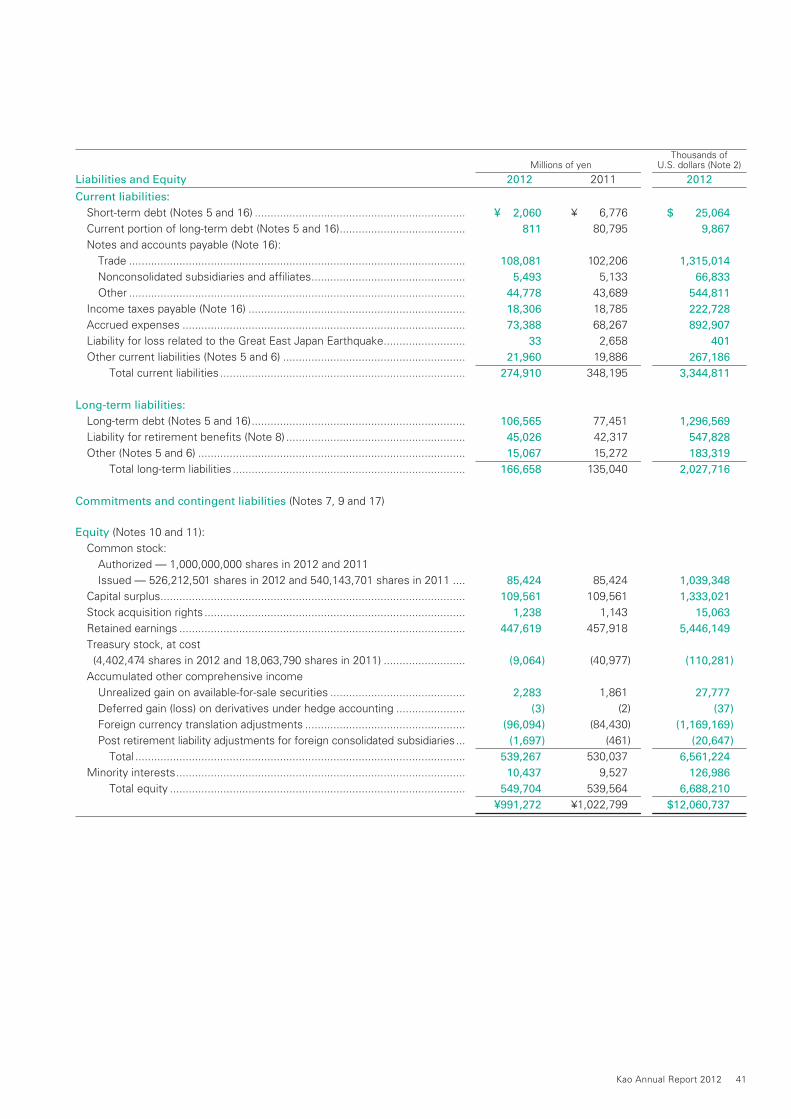
Kao Annual Report 2012 41
Thousands of Millions of yen U.S. dollars (Note 2)
Liabilities and Equity 2012 2011 2012
Current liabilities:
Short-term debt (Notes 5 and 16) ................................................................... ¥ 6,776 986 Current portion of long-term debt (Notes 5 and 16) ........................................ 80,795 28 Notes and accounts payable (Note 16): Trade ........................................................................................................... 102,206 668 Nonconsolidated subsidiaries and affiliates ................................................. 5,133 33 Other ........................................................................................................... 43,689 ,251 Income taxes payable (Note 16) ..................................................................... 18,785 74 Accrued expenses .......................................................................................... 68,267 8546 Liability for loss related to the Great East Japan Earthquake .......................... 2,658 Other current liabilities (Notes 5 and 6) .......................................................... 19,886 79 Total current liabilities .............................................................................. 348,195 95
Long-term liabilities:
Long-term debt (Notes 5 and 16) .................................................................... 77,451 04 Liability for retirement benefits (Note 8) ......................................................... 42,317 ,497 Other (Notes 5 and 6) ..................................................................................... 15,272 218 Total long-term liabilities .......................................................................... 135,040 3,519
Commitments and contingent liabilities (Notes 7, 9 and 17)
Equity (Notes 10 and 11): Common stock: Authorized — 1,000,000,000 shares in 2012 and 2011 Issued — 526,212,501 shares in 2012 and 540,143,701 shares in 2011 .... 85,424 632 Capital surplus ................................................................................................. 109,561 52 Stock acquisition rights ................................................................................... 1,143 41 Retained earnings ........................................................................................... 457,918 426795 Treasury stock, at cost (4,402,474 shares in 2012 and 18,063,790 shares in 2011) .......................... (40,977) 379) Accumulated other comprehensive income Unrealized gain on available-for-sale securities ........................................... 1,861 387 Deferred gain (loss) on derivatives under hedge accounting ...................... (2) 22) Foreign currency translation adjustments ................................................... (84,430) (77) Post retirement liability adjustments for foreign consolidated subsidiaries ... (461) 43) Total ......................................................................................................... 530,037 86 Minority interests ............................................................................................ 9,527 ,714 Total equity .............................................................................................. 539,564 500 ¥1,022,799 ,514
See notes to consolidated financial statements.
¥ 2,060
811
108,081
5,493
44,778
18,306
73,388
33
21,960
274,910
106,565
45,026
15,067
166,658
85,424
109,561
1,238
447,619
(9,064)
2,283
(3)
(96,094)
(1,697)
539,267
10,437
549,704
¥991,272
$ 25,064
9,867
1,315,014
66,833
544,811
222,728
892,907
401
267,186
3,344,811
1,296,569
547,828
183,319
2,027,716
1,039,348
1,333,021
15,063
5,446,149
(110,281)
27,777
(37)
(1,169,169)
(20,647)
6,561,224
126,986
6,688,210
$12,060,737
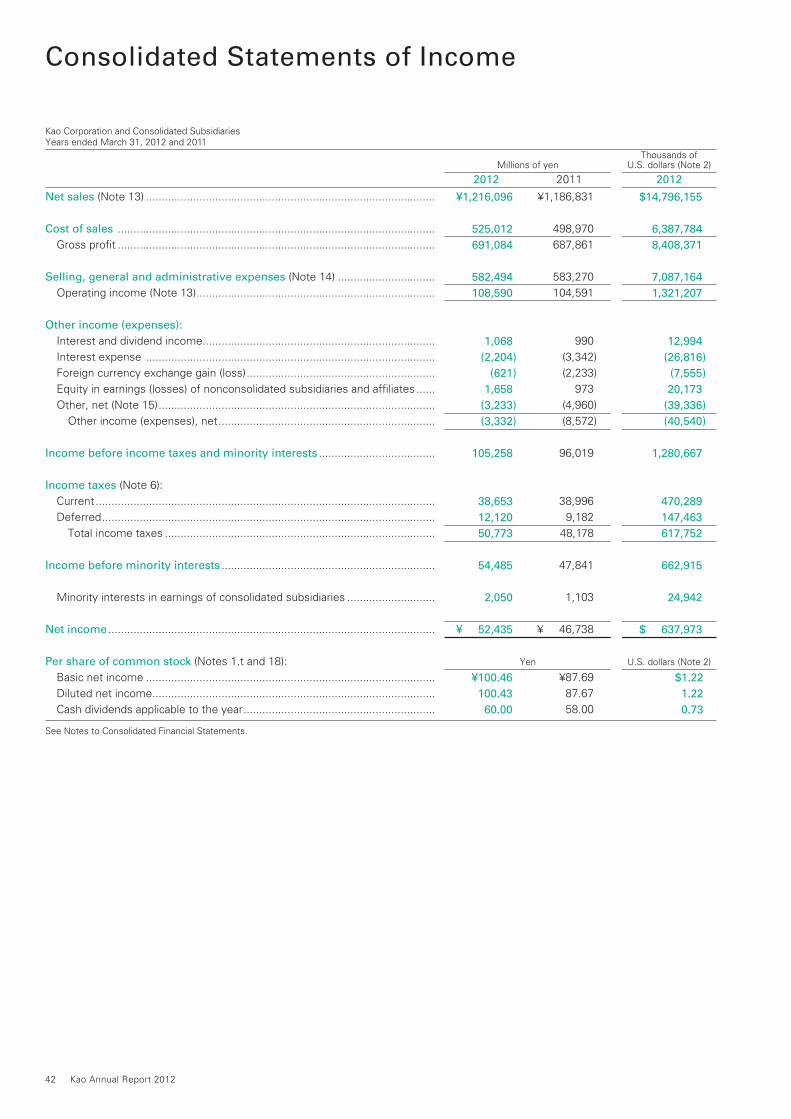
42 Kao Annual Report 2012
Consolidated Statements of Income
Kao Corporation and Consolidated SubsidiariesYears ended March 31, 2012 and 2011 Thousands of Millions of yen U.S. dollars (Note 2)
2012 2011 2012
Net sales (Note 13) ............................................................................................ ¥1,186,831 139
Cost of sales ..................................................................................................... 498,970 04 Gross profit ..................................................................................................... 687,861 35
Selling, general and administrative expenses (Note 14) ............................... 583,270 093 Operating income (Note 13) ............................................................................ 104,591
Other income (expenses):
Interest and dividend income .......................................................................... 990 Interest expense ............................................................................................ (3,342) 2) Foreign currency exchange gain (loss) ............................................................ (2,233) ) Equity in earnings (losses) of nonconsolidated subsidiaries and affiliates ...... 973 86 Other, net (Note 15) ........................................................................................ (4,960) ) Other income (expenses), net ..................................................................... (8,572) Income before income taxes and minority interests ..................................... 96,019 6,710
Income taxes (Note 6): Current ............................................................................................................ 38,996 Deferred .......................................................................................................... 9,182 Total income taxes ...................................................................................... 48,178 26,570
Income before minority interests .................................................................... 47,841
Minority interests in earnings of consolidated subsidiaries ............................ 1,103
Net income ........................................................................................................ ¥ 46,738
Per share of common stock (Notes 1.t and 18): Yen U.S. dollars (Note 2)
Basic net income ............................................................................................ ¥87.69 Diluted net income .......................................................................................... 87.67 Cash dividends applicable to the year ............................................................. 58.00
See Notes to Consolidated Financial Statements.
¥1,216,096
525,012
691,084
582,494
108,590
1,068
(2,204)
(621)
1,658
(3,233)
(3,332)
105,258
38,653
12,120
50,773
54,485
2,050
¥ 52,435
¥100.46
100.43
60.00
$14,796,155
6,387,784
8,408,371
7,087,164
1,321,207
12,994
(26,816)
(7,555)
20,173
(39,336)
(40,540)
1,280,667
470,289
147,463
617,752
662,915
24,942
$ 637,973
$1.22
1.22
0.73

Kao Annual Report 2012 43
Consolidated Statements of Comprehensive Income
Kao Corporation and Consolidated SubsidiariesYears ended March 31, 2012 and 2011 Thousands of Millions of yen U.S. dollars (Note 2)
2012 2011 2012
Income before minority interests .......................................................................
Other comprehensive income (Note 12) Unrealized gain (loss) on available-for-sale securities ......................................... Foreign currency translation adjustments .......................................................... Share of other comprehensive income in affiliates ............................................ Post retirement liability adjustments for foreign consolidated subsidiaries ....... Total other comprehensive income ................................................................ Comprehensive income ......................................................................................
Comprehensive income attributable to:
Shareholders of Kao Corporation ....................................................................... Minority interests ...............................................................................................
See Notes to Consolidated Financial Statements.
¥ 47,841
(480) (21,865) 77 (15) (22,283)
¥ 25,558
¥24,853 705
¥ 54,485
487
(12,169)
(172)
(1,236)
(13,090)
¥ 41,395
¥39,956
1,439
$ 662,915
5,925
(148,059)
(2,093)
(15,038)
(159,265)
$ 503,650
$486,142
17,508

44 Kao Annual Report 2012
Consolidated Statements of Changes in Equity
Kao Corporation and Consolidated SubsidiariesYears ended March 31, 2012 and 2011
Thousands of U.S. dollars Millions of yen (Note 2)
2012 2011 2012
Common stock
Balance at beginning of year ....... Balance at end of year ................
Capital surplus
Balance at beginning of year ....... Balance at end of year ................
Stock acquisition rights
Balance at beginning of year ....... Net change in the year ............ Balance at end of year ................
Retained earnings
Balance at beginning of year ....... Net income .............................. Cash dividends ........................ Disposal of treasury stock ....... Retirement of treasury stock ... Balance at end of year ................
Treasury stock, at cost
Balance at beginning of year ....... Purchase of treasury stock ...... Disposal of treasury stock ....... Retirement of treasury stock ... Balance at end of year ................
Accumulated other
comprehensive income
Unrealized gain on
available-for-sale securities
Balance at beginning of year ....... Net change in the year ............ Balance at end of year ................
Deferred gain (loss) on
derivatives under hedge accounting
Balance at beginning of year ....... Net change in the year ............ Balance at end of year ................
Foreign currency translation
adjustments
Balance at beginning of year ....... Net change in the year ............ Balance at end of year ................
Post retirement liability adjustments
for foreign consolidated subsidiaries
Balance at beginning of year ....... Net change in the year ............ Balance at end of year ................
Thousands of U.S. dollars Millions of yen (Note 2)
2012 2011 2012
Total
Balance at beginning of year ....... Net income .............................. Cash dividends ........................ Purchase of treasury stock ...... Disposal of treasury stock ....... Retirement of treasury stock ... Net change in the year ............ Balance at end of year .................
Minority interests
Balance at beginning of year ....... Net change in the year ............ Balance at end of year ................. Total equity
Balance at beginning of year ....... Net income .............................. Cash dividends ........................ Purchase of treasury stock ...... Disposal of treasury stock ....... Retirement of treasury stock ... Net change in the year ............ Balance at end of year ................
U.S. dollars Yen (Note 2)
2012 2011 2012
Cash dividends per share ..............
Thousands
2012 2011 2011
Outstanding number of shares of common stock
Balance at beginning of year ....... Purchase of treasury stock ...... Disposal of treasury stock ....... Balance at end of year .................
See Notes to Consolidated Financial Statements.
¥ 85,424
85,424
109,561
109,561
1,143
95
1,238
457,918
52,435
(30,273)
(1)
(32,460)
447,619
(40,977)
(628)
81
32,460
(9,064)
1,861
422
2,283
(2)
(1)
(3)
(84,430)
(11,664)
(96,094)
(461)
(1,236)
¥ (1,697)
¥ 85,424 85,424
109,561 109,561
1,022 121 1,143
442,273 46,738 (31,090) (3) —
457,918
(10,978) (30,093) 94 —
(40,977)
2,292 (431) 1,861
(0) (2) (2)
(62,993) (21,437) (84,430)
(446) (15) ¥ (461)
$ 1,039,348
1,039,348
1,333,021
1,333,021
13,907
1,156
15,063
5,571,456
637,973
(368,329)
(12)
(394,939)
5,446,149
(498,564)
(7,641)
985
394,939
(110,281)
22,643
5,134
27,777
(25)
(12)
(37)
(1,027,254)
(141,915)
(1,169,169)
(5,609)
(15,038)
$ (20,647)
¥530,037
52,435
(30,273)
(628)
80
—
(12,384)
539,267
9,527
910
10,437
539,564
52,435
(30,273)
(628)
80
—
(11,474)
¥549,704
¥566,155 46,738 (31,090) (30,093) 91 —
(21,764) 530,037
9,139 388 9,527
575,294 46,738 (31,090) (30,093) 91 —
(21,376) ¥539,564
$6,448,923
637,973
(368,329)
(7,641)
973
—
(150,675)
6,561,224
115,914
11,072
126,986
6,564,837
637,973
(368,329)
(7,641)
973
—
(139,603)
$6,688,210
¥58.00 ¥58.00 $0.71
522,080
(305)
35
521,810
536,021 (13,974) 33 522,080

Kao Annual Report 2012 45
Consolidated Statements of Cash Flows
Kao Corporation and Consolidated SubsidiariesYears ended March 31, 2012 and 2011 Thousands of Millions of yen U.S. dollars (Note 2)
2012 2011 2012
Operating activities:
Income before income taxes and minority interests ...................................... ¥ 96,019 Adjustments for: Income taxes paid ....................................................................................... (40,888) Depreciation and amortization ..................................................................... 81,380 Loss on sales or disposals of property, plant and equipment, net .............. 1,334 Equity in (earnings) losses of nonconsolidated subsidiaries and affiliates .. (973) Unrealized foreign currency exchange (gain) loss ....................................... 455 Change in trade receivables ........................................................................ (642) Change in inventories .................................................................................. (7,566) Change in prepaid pension cost .................................................................. (73) Change in trade payables ............................................................................ 7,794 Change in liability for retirement benefits ................................................... 4,596 Other, net .................................................................................................... 9,863 Net cash provided by operating activities ................................................ 151,299
Investing activities:
Purchase of property, plant and equipment .................................................... (27,725) Proceeds from sales of property, plant and equipment .................................. 2,410 Purchase of intangible assets ......................................................................... (4,001) Proceeds from the redemption and sales of investment securities ............... 594 Increase in investments in and advances to nonconsolidated subsidiaries and affiliates .............................................................................. (153) Proceeds from cancellation of derivatives ...................................................... 4,297 Other, net ........................................................................................................ (7,200) Net cash used in investing activities ........................................................ (31,778)
Financing activities:
Increase (decrease) in short-term debt ........................................................... 12 Proceeds from long-term loans ....................................................................... 17 Repayments of long-term loans ..................................................................... (24,960) Redemption of bonds .................................................................................... —
Purchase of treasury stock ............................................................................. (30,093) Payments of cash dividends ........................................................................... (31,427) Other, net ........................................................................................................ (872) Net cash used in financing activities ........................................................ (87,323)
Translation adjustments on cash and cash equivalents ............................... (6,401)Net increase (decrease) in cash and cash equivalents .................................. 25,797Cash and cash equivalents, beginning of year (Note 3) ................................. 117,180Cash and cash equivalents of newly consolidated subsidiaries, increase .. 166Cash and cash equivalents, end of year (Note 3) ........................................... ¥143,143
See Notes to Consolidated Financial Statements.
¥105,258
(38,339)
79,798
2,202
(1,658)
159
(26,513)
(14,937)
906
8,997
3,056
6,103
125,032
(41,684)
746
(3,375)
1
(1,221)
—
(3,419)
(48,952)
(4,610)
50,013
(50,012)
(50,000)
(10)
(30,776)
(768)
(86,163)
(3,323)
(13,406)
143,143
—
¥129,737
$ 1,280,667
(466,468)
970,897
26,792
(20,173)
1,935
(322,582)
(181,737)
11,023
109,466
37,182
74,254
1,521,256
(507,166)
9,076
(41,063)
12
(14,856)
—
(41,599)
(595,596)
(56,089)
608,505
(608,493)
(608,347)
(122)
(374,449)
(9,344)
(1,048,339)
(40,431)
(163,110)
1,741,611
—
$ 1,578,501

46 Kao Annual Report 2012
Kao Corporation and Consolidated Subsidiaries Years ended March 31, 2012 and 2011
Notes to Consolidated Financial Statements
a) Basis of presenting consolidated financial statements
The accompanying consolidated financial statements have been prepared in accordance with the provisions set forth in the Japanese Financial Instruments and Exchange Law and its related accounting regulations, and in conformity with accounting principles generally accepted in Japan (“Japanese GAAP”), which are different in certain respects as to application and disclosure requirements of International Financial Reporting Standards. In preparing the consolidated financial statements, certain reclassifications and rearrangements have been made to the consolidated financial statements issued in Japan in order to present them in a form that is more familiar to readers outside Japan. Certain 2011 financial statement items were reclassified to conform to the presentation for 2012. The preparation of financial statements in conformity with generally accepted accounting principles requires management to make estimates and assumptions that affect the reported amounts of assets, liabilities and disclosure of contingent assets and liabilities at the date of the financial statements and the reported amounts of revenues and expenses during the reporting period. Actual results could differ from these estimates.
b) Consolidation and accounting for investments in
nonconsolidated subsidiaries and affiliates
The accompanying consolidated financial statements include the accounts of Kao Corporation (the “Company”) and its significant subsidiaries (collectively, the “Companies”). Investments in most of the nonconsolidated subsidiaries and affiliates over which the Companies have the ability to exercise significant influence (mainly 20-50 percent owned companies) are accounted for using the equity method. Under the control or influence concept, companies in which the parent company and/or its consolidated subsidiaries, directly or indirectly, are able to exercise control over operations are fully consolidated, and other companies over which the Company and/or its consolidated subsidiaries have the ability to exercise significant influence are accounted for using the equity method. Investments in the remaining subsidiaries and affiliates are stated at cost except for write-downs recorded for the value of investments that have been permanently impaired. If the equity method of accounting had been applied to these investments, the effect on the accompanying consolidated financial statements would not be material. All significant intercompany balances and transactions have been eliminated in consolidation. All material unrealized profit included in assets resulting from transactions within the Companies is eliminated. The excess of cost of investments in the subsidiaries and affiliates over the fair value of the net assets of the acquired subsidiary and affiliate at the dates of acquisition, consolidation goodwill, is being amortized over an estimated period not exceeding 20 years, or 5 years in situations in which the useful lives cannot be estimated.
c) Unification of accounting policies applied to foreign
subsidiaries for the consolidated financial statements
The accounting standard for unification of accounting policies applied to foreign subsidiaries for the consolidated financial statements requires: (1) the accounting policies and procedures applied to a parent company and its subsidiaries for similar transactions and events under similar circumstances should in principle be unified for the preparation of the consolidated financial statements, (2) financial statements prepared by foreign subsidiaries in accordance with either International Financial Reporting Standards or the generally accepted
accounting principles in the United States of America tentatively may be used for the consolidation process, (3) however, the following items should be adjusted in the consolidation process so that net income is accounted for in accordance with Japanese GAAP unless they are not material: 1) Amortization of goodwill 2) Scheduled amortization of actuarial gain or loss of pensions that
has been directly recorded in equity 3) Expensing capitalized development costs of R&D 4) Cancellation of the fair value model accounting for property, plant,
and equipment and investment properties and incorporation of the cost model accounting
5) Exclusion of minority interests from net income, if contained
d) Unification of accounting policies applied to foreign affiliated
companies for the equity method
The accounting standard requires adjustments to be made to conform the affiliate’s accounting policies for similar transactions and events under similar circumstances to those of the parent company when the affiliate’s financial statements are used in applying the equity method unless it is impracticable to determine adjustments. In addition, financial statements prepared by foreign affiliated companies in accordance with either International Financial Reporting Standards or the generally accepted accounting principles in the United States tentatively may be used in applying the equity method if the following items are adjusted so that net income is accounted for in accordance with Japanese GAAP unless they are not material: 1) Amortization of goodwill 2) Scheduled amortization of actuarial gain or loss on pensions that
has been directly recorded in equity 3) Expensing capitalized development costs of R&D 4) Cancellation of the fair value model accounting for property, plant,
and equipment and investment properties and incorporation of the cost model accounting
5) Exclusion of minority interests from net income, if contained
e) Business combinations
The accounting standard for business combinations requires companies to account for in accordance with following policies: 1) Business combinations should be accounted for by the purchase
method except combinations of entities under common control and joint ventures.
2) In-process research and development (IPR&D) acquired in the business combination should be capitalized as an intangible asset.
3) The acquirer should recognize the bargain purchase gain in profit or loss immediately on the acquisition date after reassessing and confirming that all of the assets acquired and all of the liabilities assumed have been identified after a review of the procedures used in the purchase allocation.
Under the accounting standard for business separations, in a business separation where the interests of the investor no longer continue and the investment is settled, the difference between the fair value of the consideration received for the transferred business and the book value of net assets transferred to the separated business is recognized as a gain or loss on business separation in the statement of income. In a business separation where the interests of the investor continue and the investment is not settled, no such gain or loss on business separation is recognized.
1 Summary of Significant Accounting Policies
Kao Annual Report 2012 47
f) Cash equivalents
For purposes of the statements of cash flows, cash equivalents are short-term investments that are readily convertible into cash and that are exposed to insignificant risk of changes in value. Cash equivalents include time deposits, commercial paper, investment trusts in bonds and receivables that are represented as short-term investments, all of which mature or become due within three months of the date of acquisition. g) Inventories
The accounting standard for measurement of inventories requires that inventories held for sale in the ordinary course of business be measured at the lower of cost or net selling value, which is defined as the selling price less additional estimated manufacturing costs and estimated direct selling expenses. The replacement cost may be used in place of the net selling value, if appropriate. Cost of inventories is determined principally by the average method. The cost of inventories held by certain foreign consolidated subsidiaries is determined by the first-in, first-out method.
h) Short-term investments and investment securities
Short-term investments and investment securities are classified and accounted for, depending on management’s intent, as follows: i) held-to-maturity debt securities, which are expected to be held to maturity with the positive intent and ability to hold to maturity, are reported at amortized cost and ii) available-for-sale securities, which are not classified as the aforementioned securities, are reported at fair value, with unrealized gains and losses, net of applicable taxes, reported in a separate component of equity. Non-marketable available-for-sale securities are stated at cost determined by the moving-average method. For other than temporary declines in fair value, investment securities are reduced to net realizable value by a charge to income.
i) Property, plant and equipment
Property, plant and equipment are stated at cost. Depreciation of property, plant and equipment is computed under the declining-balance method for the assets located in Japan and principally under the straight-line method for the assets located outside Japan, using rates based upon the estimated useful lives, principally ranging from 21 to 35 years for buildings and structures and 7 or 9 years for machinery and equipment.
j) Intangible assets
Goodwill and trademarks are amortized on a straight-line basis over 15 or 20 years, and 10 years, respectively.
k) Long-lived assets
The Companies review their long-lived assets for impairment whenever events or changes in circumstances indicate the carrying amount of an asset or asset group may not be recoverable. An impairment loss would be recognized if the carrying amount of an asset or asset group exceeds the sum of the undiscounted future cash flows expected to result from the continued use and eventual disposition of the asset or asset group. The impairment loss would be measured as the amount by which the carrying amount of the asset exceeds its recoverable amount, which is the higher of the discounted cash flows from the continued use and eventual disposition of the asset or the net selling price at disposition.
l) Retirement and pension plans
The Company and most domestic consolidated subsidiaries have a cash balance plan and a defined contribution pension plan covering
substantially all of their employees. The cash balance plan is linked to market interest rates and treated as a defined benefit plan. The pension plan also covers employees of certain nonconsolidated subsidiaries and affiliates in Japan. In addition, these companies may pay an early retirement allowance to early retired employees. Certain domestic consolidated subsidiaries have a defined benefit plan that provides for a lump-sum payment to terminated employees. The subsidiaries may pay an additional lump-sum payment that is not subject to actuarial calculations under the accounting standard for retirement benefits. Certain foreign subsidiaries have a defined contribution plan and/or a defined benefit plan. Some of these foreign subsidiaries apply the “corridor approach” in calculating actuarial gain or loss. Certain foreign subsidiaries also have local employees’ retirement benefit plans and provide for the amount to recognize the liability for these employees’ retirement benefits, primarily determined on an actuarial basis. The unrecognized transitional obligation, the unrecognized net actuarial gain or loss and the unrecognized prior service cost are being amortized over 15, 10 and 15 years, respectively. These amortizations are recognized in cost of sales and selling, general and administrative expenses in the consolidated statements of income.
m) Asset retirement obligations
The accounting standard for asset retirement obligations defines an asset retirement obligation as a legal obligation imposed either by law or contract that results from the acquisition, construction, development and the normal operation of a tangible fixed asset and is associated with the retirement of such tangible fixed asset. The asset retirement obligation is recognized as the sum of the discounted cash flows required for the future asset retirement and is recorded in the period in which the obligation is incurred if a reasonable estimate can be made. If a reasonable estimate of the asset retirement obligation cannot be made in the period the asset retirement obligation is incurred, the liability should be recognized when a reasonable estimate of asset retirement obligation can be made. Upon initial recognition of a liability for an asset retirement obligation, an asset retirement cost is capitalized by increasing the carrying amount of the related fixed asset by the amount of the liability. The asset retirement cost is subsequently allocated to expense through depreciation over the remaining useful life of the asset. Over time, the liability is accreted to its present value each period. Any subsequent revisions to the timing or the amount of the original estimate of undiscounted cash flows are reflected as an increase or a decrease in the carrying amount of the liability and the capitalized amount of the related asset retirement cost.
n) Stock options
The accounting standard for stock options requires companies to recognize compensation expense for employee stock options based on the fair value at the date of grant and over the vesting period as consideration for receiving goods or services. The standard also requires companies to account for stock options granted to non-employees based on the fair value of either the stock option or the goods or services received. In the balance sheet, the stock option is presented as a stock acquisition right as a separate component of equity until exercised. The standard covers equity-settled, share-based payment transactions, but does not cover cash-settled, share-based payment transactions. In addition, the standard allows unlisted companies to measure options at their intrinsic value if they cannot reliably estimate fair value.

48 Kao Annual Report 2012
The Companies’ accounts are maintained in or translated into Japanese yen. The United States dollar (US$) amounts included herein represent translations using the approximate exchange rate at March 31, 2012 of ¥82.19=US$1, solely for convenience.
The translations should not be construed as representations that Japanese yen have been, could have been, or could in the future be, converted into United States dollars at that or any other rate.
o) Leases
The accounting standard for lease transactions requires that all finance lease transactions should be capitalized to recognize lease assets and lease obligations in the balance sheet. In addition, the accounting standard permits leases which do not transfer ownership of the leased property to the lessee to be measured at the obligations under finance leases less interest expense and recorded as acquisition cost of lease assets. All other leases are accounted for as operating leases.
p) Income taxes
The Companies provide for income taxes applicable to all items included in the consolidated statements of income regardless of when such taxes are payable. Income taxes based on temporary differences between tax and financial reporting purposes are reflected as deferred income taxes in the consolidated financial statements using the asset and liability method.
q) Foreign currency transactions
All short-term and long-term monetary receivables and payables denominated in foreign currencies are translated into Japanese yen at the exchange rates at the balance sheet date. The foreign exchange gains and losses from translation are recognized in the consolidated statements of income to the extent that they are not hedged by foreign exchange derivatives.
r) Foreign currency financial statements
The balance sheet accounts of the consolidated foreign subsidiaries are translated into Japanese yen at the current exchange rate as of the balance sheet date except for equity, which is translated at the historical rate. Differences arising from such translation are shown as “Foreign currency translation adjustments” in a separate component of equity. Revenue and expense accounts of the consolidated foreign subsidiaries are translated into Japanese yen at the average exchange rate.
s) Derivatives and hedging activities
The Companies use derivative financial instruments to manage their exposures to fluctuations in foreign exchange and interest rates. Foreign exchange forward contracts, foreign currency swaps and interest rate swaps are utilized by the Companies to reduce foreign currency exchange and interest rate risks. The Companies do not enter into derivatives for trading purposes or speculative purposes. Derivative financial instruments and foreign currency transactions are classified and accounted for as follows: a) all derivatives are recognized as either assets or liabilities and measured at fair value, and gains or losses on derivative transactions are recognized in the consolidated statements of income, and b) for derivatives used for hedging purposes, if derivatives qualify for hedge accounting because of high correlation and effectiveness between the hedging instruments and the hedged items, gains or losses on derivatives are
deferred until maturity of the hedged transactions. Short-term and long-term loan receivables denominated in foreign currencies, for which foreign exchange forward contracts or foreign currency swaps are used to hedge the foreign currency fluctuations, are translated at the contracted rate if the forward contracts or the swap contracts qualify for specific hedge accounting. The interest rate swaps which qualify for hedge accounting and meet specific matching criteria are not remeasured at market value but the differential paid or received under the swap agreements are recognized and included in interest expense or income as incurred.
t) Per share information
Basic net income per share is computed by dividing net income available to common shareholders by the weighted-average number of common shares outstanding for the period, retroactively adjusted for stock splits. Diluted net income per share of common stock reflects the potential dilution that could occur if securities or other contracts to issue common stock were converted or exercised into common stock or resulted in the issuance of common stock. Cash dividends per share presented in the accompanying consolidated statements of income are dividends applicable to the respective years including dividends to be paid after the end of the year.
u) Accounting changes and error corrections
The accounting standard for accounting changes and error corrections requires the following; 1) Changes in Accounting Policies:
When a new accounting policy is applied with revision of accounting standards, the new policy is applied retrospectively unless revised accounting standards include specific transitional provisions. When revised accounting standards include specific transitional provisions, an entity shall comply with the specific transitional provisions.
2) Changes in Presentations:When the presentation of financial statements is changed, prior period financial statements are reclassified in accordance with the new presentation.
3) Changes in Accounting Estimates:A change in an accounting estimate is accounted for in the period of the change if the change affects that period only, and is accounted for prospectively if the change affects both the period of the change and future periods.
4) Corrections of Prior Period Errors:When an error in prior period financial statements is discovered, those statements are restated.
This accounting standard is applicable to accounting changes and corrections of prior period errors which are made from the beginning of the fiscal year that begins on or after April 1, 2011.
2 Translation into United States Dollars
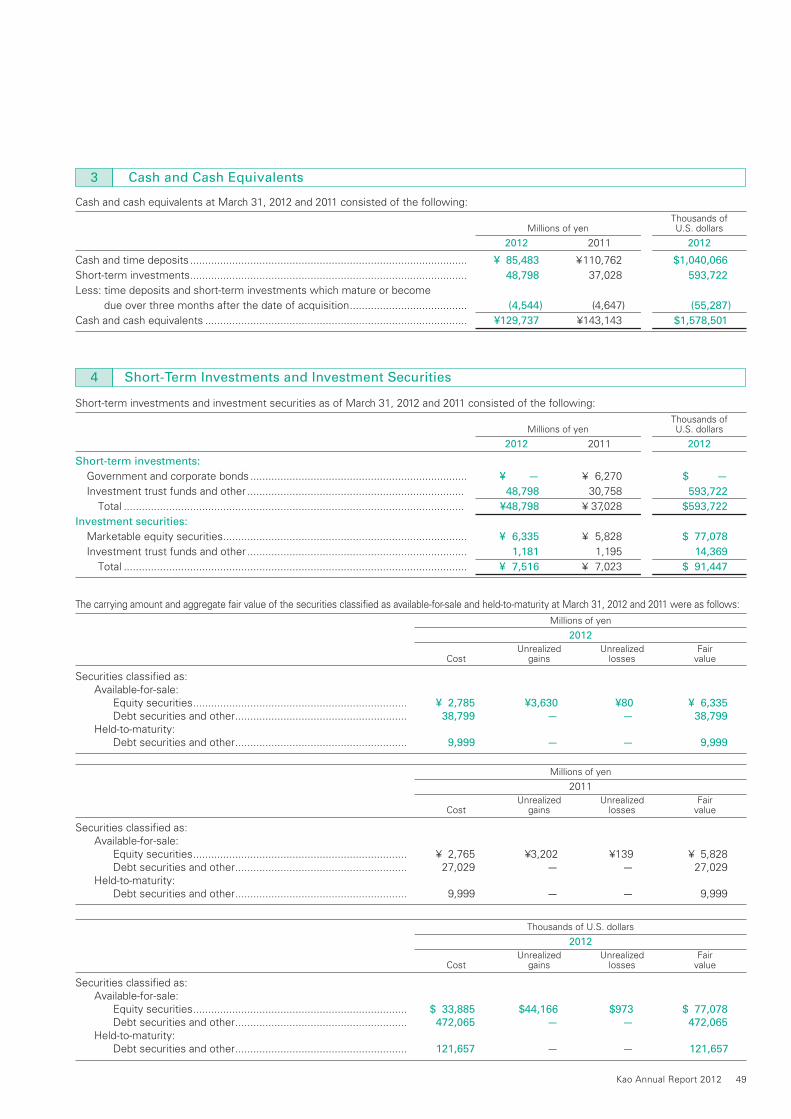
Kao Annual Report 2012 49
Short-term investments and investment securities as of March 31, 2012 and 2011 consisted of the following: Thousands of Millions of yen U.S. dollars
2012 2011 2012
Short-term investments:
Government and corporate bonds ........................................................................ ¥ — ¥ 6,270 $ —
Investment trust funds and other ........................................................................ 48,798 30,758 593,722
Total ................................................................................................................. ¥48,798 ¥ 37,028 $593,722
Investment securities:
Marketable equity securities ................................................................................. ¥ 6,335 ¥ 5,828 $ 77,078
Investment trust funds and other ......................................................................... 1,181 1,195 14,369
Total .................................................................................................................. ¥ 7,516 ¥ 7,023 $ 91,447
The carrying amount and aggregate fair value of the securities classified as available-for-sale and held-to-maturity at March 31, 2012 and 2011 were as follows: Millions of yen
2012
Unrealized Unrealized Fair Cost gains losses value
Securities classified as: Available-for-sale: Equity securities ....................................................................... ¥ 2,785 ¥3,630 ¥80 ¥ 6,335
Debt securities and other ......................................................... 38,799 — — 38,799
Held-to-maturity: Debt securities and other ......................................................... 9,999 — — 9,999
Millions of yen
2011 Unrealized Unrealized Fair Cost gains losses value
Securities classified as: Available-for-sale: Equity securities ....................................................................... ¥ 2,765 ¥3,202 ¥139 ¥ 5,828 Debt securities and other ......................................................... 27,029 — — 27,029 Held-to-maturity: Debt securities and other ......................................................... 9,999 — — 9,999
Thousands of U.S. dollars
2012
Unrealized Unrealized Fair Cost gains losses value
Securities classified as: Available-for-sale: Equity securities ....................................................................... $ 33,885 $44,166 $973 $ 77,078
Debt securities and other ......................................................... 472,065 — — 472,065
Held-to-maturity: Debt securities and other ......................................................... 121,657 — — 121,657
Cash and cash equivalents at March 31, 2012 and 2011 consisted of the following: Thousands of Millions of yen U.S. dollars
2012 2011 2012
Cash and time deposits ............................................................................................ ¥ 85,483 ¥ 110,762 $1,040,066
Short-term investments ............................................................................................ 48,798 37,028 593,722
Less: time deposits and short-term investments which mature or become due over three months after the date of acquisition ....................................... (4,544) (4,647) (55,287)
Cash and cash equivalents ....................................................................................... ¥129,737 ¥143,143 $1,578,501
3 Cash and Cash Equivalents
4 Short-Term Investments and Investment Securities

50 Kao Annual Report 2012
Short-term debt at March 31, 2012 and 2011 was comprised of the following: Thousands of Millions of yen U.S. dollars
2012 2011 2012
Secured loans principally from financial institutions ................................................. ¥ 99 ¥ 69 $ 1,205
Unsecured loans principally from financial institutions ............................................. 1,961 6,707 23,859
Total .................................................................................................................. ¥2,060 ¥6,776 $25,064
The weighted average interest rates applicable to the above loans were 2.00% and 3.90% at March 31, 2012 and 2011, respectively.In addition to the above short-term debt, deposits payable to affiliates, included in other current liabilities, were ¥6,527 million (US$79,414 thousand) and ¥5,058 million at March 31, 2012 and
2011, respectively, and the applicable interest rates were 0.44% and 0.44% at March 31, 2012 and 2011, respectively. The secured loans are collateralized by trade accounts receivable of ¥189 million (US$2,300 thousand) at March 31, 2012.
The aggregate annual maturities of long-term debt as of March 31, 2012 were as follows: Thousands ofYears ending March 31 Millions of yen U.S. dollars
2013 ................................................................................................................................................. ¥ 811 $ 9,867 2014 ................................................................................................................................................. 50,793 617,995 2015 ................................................................................................................................................. 41,118 500,280 2016 ................................................................................................................................................. 784 9,539 2017 ................................................................................................................................................. 10,724 130,478 2018 and thereafter ......................................................................................................................... 3,146 38,277 Total ............................................................................................................................................. ¥107,376 $1,306,436
Long-term debt at March 31, 2012 and 2011 consisted of the following: Thousands of Millions of yen U.S. dollars
2012 2011 2012
Unsecured bonds due 2011, 1.60% and due 2013, 1.91% .................................. ¥ 49,999 ¥ 99,998 $ 608,334
Unsecured loans principally from financial institutions, weighted average rate 0.57% in 2012, 1.75% in 2011 ......................................... 50,055 50,056 609,016
Lease obligations ...................................................................................................... 7,322 8,192 89,086
¥107,376 ¥158,246 $1,306,436
Less current portion .............................................................................................. (811) (80,795) (9,867)
Total .................................................................................................................. ¥106,565 ¥ 77,451 $1,296,569
The current portion of long-term debt refinanced into long-term debt during the year ended March 31, 2012 was ¥30,000 million (US$365,008 thousand). The unsecured bonds redeemed during the year ended March 31, 2012 was ¥50,000 million (US$608,347 thousand). In addition to the above long-term debt, deposits payable
to customers, included in other long-term liabilities, were ¥6,008 million (US$73,099 thousand) and ¥6,060 million at March 31, 2012 and 2011, respectively, and the applicable interest rates were 0.13% and 0.15% at March 31, 2012 and 2011, respectively.
Available-for-sale securities whose fair values are not readily determinable as of March 31, 2012 and 2011 were as follows: Carrying amount Thousands of Millions of yen U.S. dollars
2012 2011 2012
Available-for-sale: Equity securities ........................................................................................... ¥1,181 ¥1,195 $14,369
Total .......................................................................................................... ¥1,181 ¥1,195 $14,369
Proceeds from sales of available-for-sale securities for the years ended March 31, 2012 and 2011 were ¥1 million (US$12 thousand) and ¥594 million, respectively. Gross realized gains and losses on these sales, computed on the moving-average cost basis, for the year ended March 31, 2012 were not recognized, and for the year
ended March 31, 2011 were ¥186 million and ¥4 million, respectively. The carrying values of debt securities by contractual maturities for securities classified as held-to-maturity at March 31, 2012 are included in Note 16.
5 Short-Term and Long-Term Debt

Kao Annual Report 2012 51
Tax effects of significant temporary differences and tax loss carryforwards that resulted in deferred tax assets or liabilities at March 31, 2012 and 2011 were as follows: Thousands of Millions of yen U.S. dollars
2012 2011 2012
Deferred tax assets: Depreciation and amortization .............................................................................. ¥ 18,221 ¥ 21,552 $ 221,694
Pension and severance costs ............................................................................... 16,323 16,362 198,601
Accrued expenses ................................................................................................ 10,791 11,720 131,293
Enterprise taxes .................................................................................................... 1,327 1,487 16,146
Tax loss carryforwards .......................................................................................... 46,854 63,157 570,069
Other ..................................................................................................................... 13,283 15,981 161,613
Less valuation allowance ...................................................................................... (29,189) (40,270) (355,141)
Deferred tax assets .................................................................................................. ¥ 77,610 ¥ 89,989 $ 944,275
Deferred tax liabilities: Unrealized gain on available-for-sale securities .................................................... ¥ (1,289) ¥ (1,310) $ (15,683)
Undistributed foreign earnings ............................................................................. (6,007) (5,893) (73,087)
Deferred gains on sales of property ..................................................................... (3,884) (4,531) (47,256)
Prepaid pension cost ............................................................................................ (1,218) (1,042) (14,819)
Other ..................................................................................................................... (6,421) (7,161) (78,124)
Deferred tax liabilities ............................................................................................... ¥(18,819) ¥(19,937) $(228,969)
Net deferred tax assets ............................................................................................ ¥ 58,791 ¥ 70,052 $ 715,306
The Company and its domestic subsidiaries are subject to Japanese national and local taxes based on income, which in the aggregate resulted in a normal statutory tax rate of approximately 41% for
both 2012 and 2011. Foreign subsidiaries are subject to income taxes of the countries in which they operate.
A reconciliation between the normal effective statutory tax rates and the actual effective tax rates reflected in the accompanying consolidated statements of income for the years ended March 31, 2012 and 2011 were as follows:
2012 2011
Normal effective statutory tax rate ........................................................................... 40.5% 40.5% Tax credit for research and development costs and other .................................... (2.6) (2.7) Valuation allowance ............................................................................................... (6.4) 9.5 Expiration of tax loss carryforwards ..................................................................... 9.0 0.9 Amortization expenses not deductible for income tax purposes .......................... 4.6 4.9 Effect of tax rate reduction ................................................................................... 5.4 —
Other – net ............................................................................................................ (2.3) (2.9)Actual effective tax rate ............................................................................................ 48.2% 50.2%
6 Income Taxes
On December 2, 2011, new tax reform laws were enacted in Japan, which will reduce the corporation tax rate and will impose special corporation tax for reconstruction of the Great East Japan Earthquake for fiscal years beginning on or after April 1, 2012. Consequently, the effective statutory tax rate used to measure deferred tax assets and liabilities changed from 40.54% to 38.01% for expected reversal of temporary differences during fiscal years beginning on or after April 1, 2012 until March 31, 2015. The rate will be changed to 35.64% for expected reversal of temporary differences during fiscal years beginning on or after April 1, 2015. As a result of these tax rate changes, net deferred tax assets after deducting deferred tax liabilities as of March 31, 2012 decreased ¥5,500 million (US$66,918 thousand), while deferred income taxes
and unrealized gain on available-for-sale securities increased ¥5,676 million (US$69,059 thousand) and ¥176 million (US$2,141 thousand), respectively. Moreover, effective fiscal years beginning on or after April 1, 2012 the deferral period for tax loss carryforwards will be extended to nine years from seven years and the deduction will be limited to 80% of earnings prior to adjustment for tax loss carryforwards. Deferred tax assets increased ¥3,215 million (US$39,117 thousand) as a result. Deferred income taxes increased ¥2,461 million (US$29,943 thousand) because of the combined effect of the corporate tax rate changes, the deferral period extension and the limit on the deduction of tax loss carryforwards.
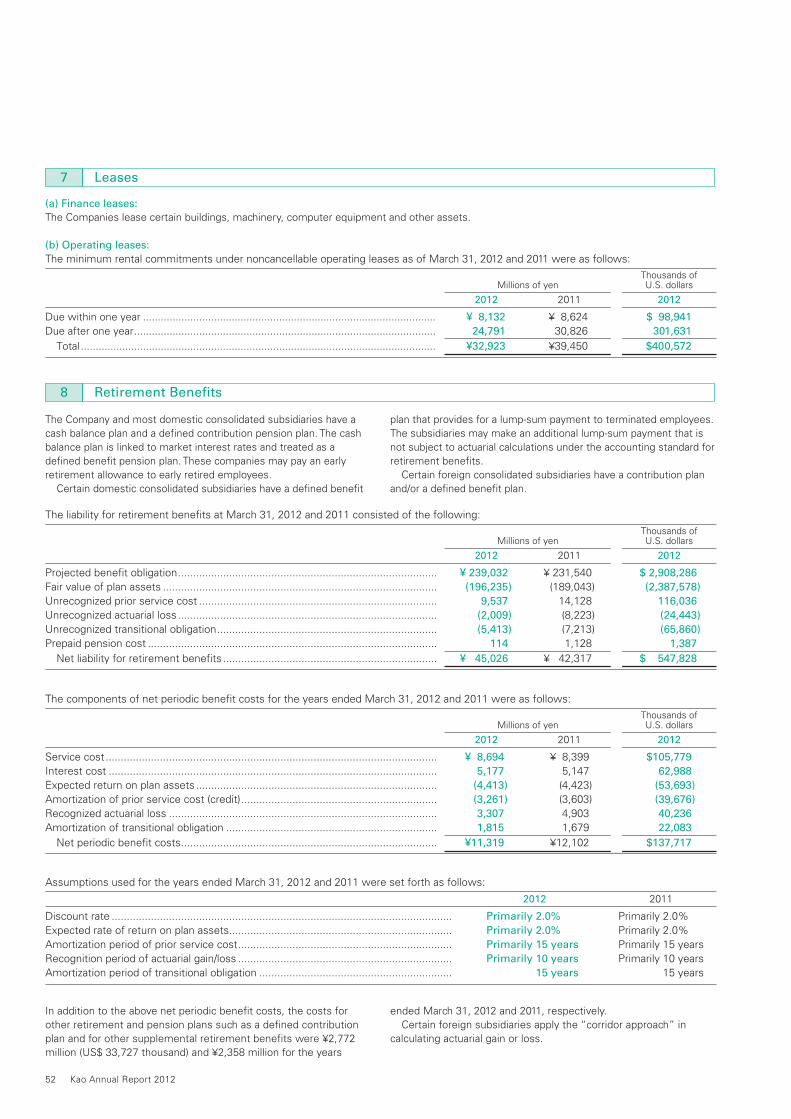
52 Kao Annual Report 2012
The liability for retirement benefits at March 31, 2012 and 2011 consisted of the following: Thousands of Millions of yen U.S. dollars
2012 2011 2012
Projected benefit obligation ...................................................................................... ¥ 239,032 ¥ 231,540 $ 2,908,286
Fair value of plan assets ........................................................................................... (196,235) (189,043) (2,387,578)
Unrecognized prior service cost ............................................................................... 9,537 14,128 116,036
Unrecognized actuarial loss ...................................................................................... (2,009) (8,223) (24,443)
Unrecognized transitional obligation ......................................................................... (5,413) (7,213) (65,860)
Prepaid pension cost ................................................................................................ 114 1,128 1,387
Net liability for retirement benefits ....................................................................... ¥ 45,026 ¥ 42,317 $ 547,828
The components of net periodic benefit costs for the years ended March 31, 2012 and 2011 were as follows: Thousands of Millions of yen U.S. dollars
2012 2011 2012
Service cost .............................................................................................................. ¥ 8,694 ¥ 8,399 $105,779
Interest cost ............................................................................................................. 5,177 5,147 62,988
Expected return on plan assets ................................................................................ (4,413) (4,423) (53,693)
Amortization of prior service cost (credit) ................................................................. (3,261) (3,603) (39,676)
Recognized actuarial loss ......................................................................................... 3,307 4,903 40,236
Amortization of transitional obligation ...................................................................... 1,815 1,679 22,083
Net periodic benefit costs ..................................................................................... ¥11,319 ¥12,102 $137,717
Assumptions used for the years ended March 31, 2012 and 2011 were set forth as follows:
2012 2011
Discount rate ................................................................................................................. Primarily 2.0% Primarily 2.0%Expected rate of return on plan assets .......................................................................... Primarily 2.0% Primarily 2.0%Amortization period of prior service cost ....................................................................... Primarily 15 years Primarily 15 yearsRecognition period of actuarial gain/loss ....................................................................... Primarily 10 years Primarily 10 yearsAmortization period of transitional obligation ................................................................ Primarily 15 years Primarily 15 years
The Company and most domestic consolidated subsidiaries have a cash balance plan and a defined contribution pension plan. The cash balance plan is linked to market interest rates and treated as a defined benefit pension plan. These companies may pay an early retirement allowance to early retired employees. Certain domestic consolidated subsidiaries have a defined benefit
plan that provides for a lump-sum payment to terminated employees. The subsidiaries may make an additional lump-sum payment that is not subject to actuarial calculations under the accounting standard for retirement benefits. Certain foreign consolidated subsidiaries have a contribution plan and/or a defined benefit plan.
In addition to the above net periodic benefit costs, the costs for other retirement and pension plans such as a defined contribution plan and for other supplemental retirement benefits were ¥2,772 million (US$ 33,727 thousand) and ¥2,358 million for the years
ended March 31, 2012 and 2011, respectively. Certain foreign subsidiaries apply the “corridor approach” in calculating actuarial gain or loss.
(a) Finance leases:
The Companies lease certain buildings, machinery, computer equipment and other assets.
(b) Operating leases:
The minimum rental commitments under noncancellable operating leases as of March 31, 2012 and 2011 were as follows: Thousands of Millions of yen U.S. dollars
2012 2011 2012
Due within one year ................................................................................................... ¥ 8,132 ¥ 8,624 $ 98,941
Due after one year ...................................................................................................... 24,791 30,826 301,631
Total ........................................................................................................................ ¥32,923 ¥39,450 $400,572
7 Leases
8 Retirement Benefits

Kao Annual Report 2012 53
At March 31, 2012, the Companies had the following contingent liabilities: Thousands of Millions of yen U.S. dollars
Trade notes discounted ....................................................................................................................... ¥128 $ 1,557
Guarantees of borrowings, principally of affiliates and employees ...................................................... 819 9,965
The Companies are parties to pending litigation arising in the normal course of business. While it is not possible to predict the outcome of pending litigation, the Company believes, after consultation with counsel, that the results of such proceedings will
not have a material adverse effect upon the Company's consolidated financial position and the results of its operations and its cash flows.
9 Contingent Liabilities
10 Equity
Significant provisions in the Corporation Law of Japan (the “Corporation Law”) that affect financial and accounting matters are summarized below:
(a) Dividends
Under the Corporation Law, companies can pay dividends at any time during the fiscal year in addition to the year-end dividend upon resolution at the shareholders’ meeting. For companies that meet certain criteria such as having: (1) a board of directors, (2) independent auditors, (3) a board of corporate auditors, and (4) terms of service of directors prescribed as one year under the articles of incorporation rather than the normal term of two years, the boards of directors of such companies may declare dividends (except for dividends in kind) at any time during the fiscal year if the companies have prescribed so in their articles of incorporation. The Company's governance system on March 31, 2012 meets the first three criteria but the two-year service period of the members of the Board of Directors does not meet the fourth criterion. The Company pays the dividends semi-annually as a year-end dividend and an interim dividend. Semiannual interim dividends may also be paid once a year upon resolution by the board of directors if the articles of incorporation of the company so stipulate. The Company pays semiannual interim dividends upon the resolution by the Board of Directors because the articles of incorporation of the Company so stipulate. The Corporation Law permits companies to distribute dividends-in-kind (non-cash assets) to shareholders subject to a certain limitation and additional requirements. The Corporation Law provides certain limitations on the amounts available for dividends or the purchase of treasury stock. The limitation is defined as the amount available for distribution to the shareholders, but the amount of net assets after dividends must be maintained at no less than ¥3 million.
(b) Increases / decreases and transfer of common stock, reserve
and surplus
The Corporation Law requires that an amount equal to 10% of dividends must be appropriated as a legal reserve (a component of retained earnings) or as additional paid-in capital (a component of capital surplus) depending on the equity account charged upon the
payment of such dividends until the total of aggregate amount of legal reserve and additional paid-in capital equals 25% of the common stock. Under the Corporation Law, the total amount of additional paid-in capital and legal reserve may be reversed without limitation. The Corporation Law also provides that common stock, legal reserve, additional paid-in capital, other capital surplus and retained earnings can be transferred among the accounts under certain conditions upon resolution at the shareholders’ meeting. The Company’s legal reserve amount, which is included in retained earnings, totals ¥14,117 million (US$171,761 thousand) at both March 31, 2012 and 2011. The Company’s additional paid-in capital amount, which is included in capital surplus, totals ¥108,889 million (US$1,324,845 thousand) at both March 31, 2012 and 2011. The accompanying consolidated financial statements do not include any provision for the year-end dividend of ¥31.0 (US$0.38) per share, aggregating ¥16,193 million (US$197,019 thousand) which the Company will subsequently propose at the 106th Annual General Meeting of Shareholders to be held on June 28, 2012 as an appropriation of retained earnings in respect of the year ended March 31, 2012.
(c) Treasury stock and treasury stock acquisition rights
The Corporation Law also provides for companies to purchase own stock and retire treasury stock by resolution of the board of directors. The amount of own stock purchased cannot exceed the amount available for distribution to the shareholders which is determined by a specific formula. Under the Corporation Law, stock acquisition rights are presented as a separate component of equity. The Corporation Law also provides that companies can purchase both own stock and stock acquisition rights in their own companies. Such treasury stock is presented as a separate component of equity. Such stock acquisition rights are presented as a separate component of equity or deducted directly from stock acquisition rights. On May 20, 2011, the Company retired 13.9 million shares of treasury stock by the resolution of the Board of Directors at the meeting held on April 26, 2011. The Company purchased 0.3 million shares of its common stock from untraceable shareholders on September 21, at an aggregate cost of ¥619 million (US$7,531 thousand).
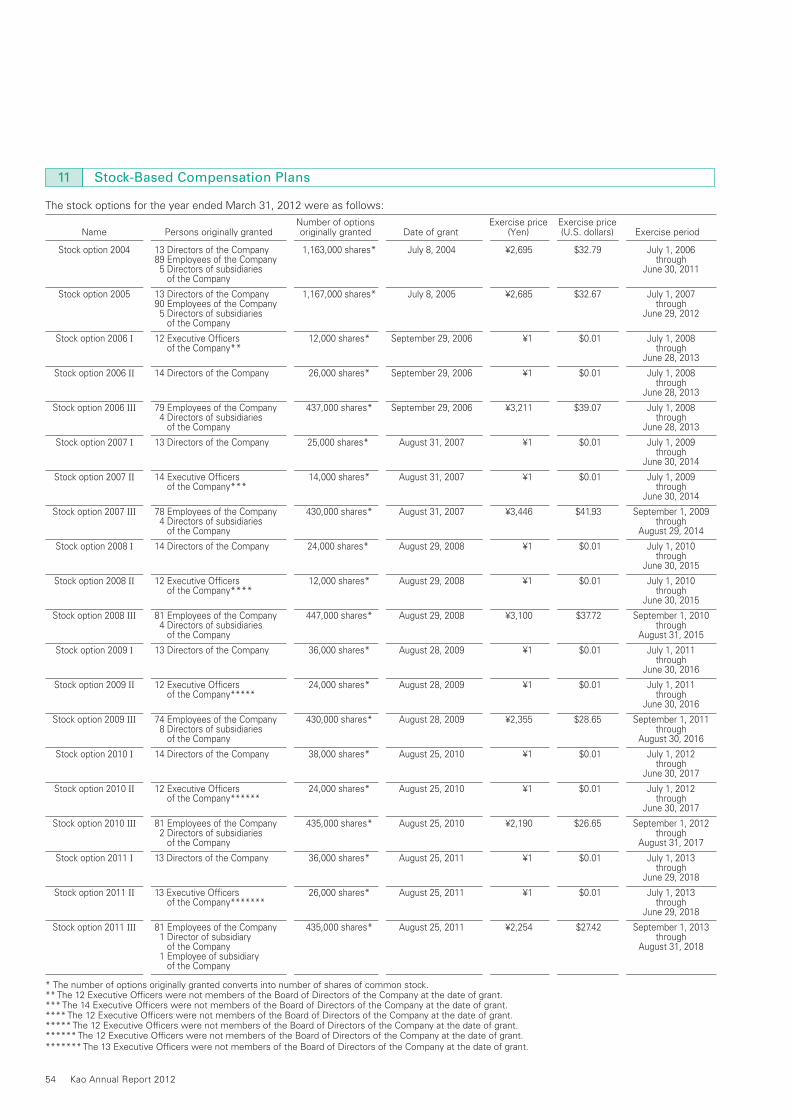
54 Kao Annual Report 2012
11 Stock-Based Compensation Plans
The stock options for the year ended March 31, 2012 were as follows:
Number of options Exercise price Exercise price Name Persons originally granted originally granted Date of grant (Yen) (U.S. dollars) Exercise period
Stock option 2004 13 Directors of the Company 1,163,000 shares* July 8, 2004 ¥2,695 $32.79 July 1, 2006 89 Employees of the Company through 5 Directors of subsidiaries June 30, 2011 of the Company
Stock option 2005 13 Directors of the Company 1,167,000 shares* July 8, 2005 ¥2,685 $32.67 July 1, 2007 90 Employees of the Company through 5 Directors of subsidiaries June 29, 2012 of the Company
Stock option 2006 I 12 Executive Officers 12,000 shares* September 29, 2006 ¥1 $0.01 July 1, 2008 of the Company** through June 28, 2013
Stock option 2006 II 14 Directors of the Company 26,000 shares* September 29, 2006 ¥1 $0.01 July 1, 2008 through June 28, 2013
Stock option 2006 III 79 Employees of the Company 437,000 shares* September 29, 2006 ¥3,211 $39.07 July 1, 2008 4 Directors of subsidiaries through of the Company June 28, 2013
Stock option 2007 I 13 Directors of the Company 25,000 shares* August 31, 2007 ¥1 $0.01 July 1, 2009 through June 30, 2014
Stock option 2007 II 14 Executive Officers 14,000 shares* August 31, 2007 ¥1 $0.01 July 1, 2009 of the Company*** through June 30, 2014
Stock option 2007 III 78 Employees of the Company 430,000 shares* August 31, 2007 ¥3,446 $41.93 September 1, 2009 4 Directors of subsidiaries through of the Company August 29, 2014
Stock option 2008 I 14 Directors of the Company 24,000 shares* August 29, 2008 ¥1 $0.01 July 1, 2010 through June 30, 2015
Stock option 2008 II 12 Executive Officers 12,000 shares* August 29, 2008 ¥1 $0.01 July 1, 2010 of the Company**** through June 30, 2015
Stock option 2008 III 81 Employees of the Company 447,000 shares* August 29, 2008 ¥3,100 $37.72 September 1, 2010 4 Directors of subsidiaries through of the Company August 31, 2015
Stock option 2009 I 13 Directors of the Company 36,000 shares* August 28, 2009 ¥1 $0.01 July 1, 2011 through June 30, 2016
Stock option 2009 II 12 Executive Officers 24,000 shares* August 28, 2009 ¥1 $0.01 July 1, 2011 of the Company***** through June 30, 2016
Stock option 2009 III 74 Employees of the Company 430,000 shares* August 28, 2009 ¥2,355 $28.65 September 1, 2011 8 Directors of subsidiaries through of the Company August 30, 2016
Stock option 2010 I 14 Directors of the Company 38,000 shares* August 25, 2010 ¥1 $0.01 July 1, 2012 through June 30, 2017
Stock option 2010 II 12 Executive Officers 24,000 shares* August 25, 2010 ¥1 $0.01 July 1, 2012 of the Company****** through June 30, 2017
Stock option 2010 III 81 Employees of the Company 435,000 shares* August 25, 2010 ¥2,190 $26.65 September 1, 2012 2 Directors of subsidiaries through of the Company August 31, 2017
Stock option 2011 I 13 Directors of the Company 36,000 shares* August 25, 2011 ¥1 $0.01 July 1, 2013 through June 29, 2018
Stock option 2011 II 13 Executive Officers 26,000 shares* August 25, 2011 ¥1 $0.01 July 1, 2013 of the Company******* through June 29, 2018
Stock option 2011 III 81 Employees of the Company 435,000 shares* August 25, 2011 ¥2,254 $27.42 September 1, 2013 1 Director of subsidiary through of the Company August 31, 2018 1 Employee of subsidiary of the Company
* The number of options originally granted converts into number of shares of common stock.** The 12 Executive Officers were not members of the Board of Directors of the Company at the date of grant.*** The 14 Executive Officers were not members of the Board of Directors of the Company at the date of grant.**** The 12 Executive Officers were not members of the Board of Directors of the Company at the date of grant.***** The 12 Executive Officers were not members of the Board of Directors of the Company at the date of grant.****** The 12 Executive Officers were not members of the Board of Directors of the Company at the date of grant.******* The 13 Executive Officers were not members of the Board of Directors of the Company at the date of grant.

Kao Annual Report 2012 55
The activity of stock options was as follows:
Stock option Stock option Stock option Stock option Stock option Stock option Stock option Stock option Stock option Stock option Stock option 2004 2005 2006 I 2006 II 2006 III 2007 I 2007 II 2007 III 2008 I 2008 II 2008 III
For the year ended March 31, 2012
Non-vested
Outstanding at March 31, 2011 ............................ Granted ...................................... Expired ....................................... Vested ........................................ Outstanding at March 31, 2012 .............................Vested
Outstanding at March 31, 2011 .............................. Vested ........................................ Exercised .................................... Expired ....................................... Outstanding at March 31, 2012 .............................. Exercise price Yen ................................................. U.S. dollars ..................................... Average stock price at exercise Yen ................................................. U.S. dollars ..................................... Fair value price at grant date .............. Yen ................................................. U.S. dollars .....................................
(Number of shares)
— — — —
—
624,000 — — 624,000
—
¥2,695 $32.79
— —
— —
— — — —
—
807,000 — — 69,000
738,000
¥2,685 $32.67
— —
— —
— — — —
—
6,000 — 1,000 —
5,000
¥1 $0.01
¥2,070 $25.19
¥3,063 $37.27
— — — —
—
4,000 — 1,000 —
3,000
¥1 $0.01
¥2,166 $26.35
¥2,932 $35.67
— — — —
—
391,000 — — 30,000
361,000
¥3,446 $41.93
— —
¥420 $5.11
— — — —
—
4,000 — — —
4,000
¥1 $0.01
— —
¥2,932 $35.67
— — — —
—
13,000 — 5,000 —
8,000
¥1 $0.01
¥2,039 $24.81
¥2,865 $34.86
— — — —
—
372,000 — — 35,000
337,000
¥3,211 $39.07
— —
¥435 $5.29
— — — —
—
7,000 — 1,000 —
6,000
¥1 $0.01
¥2,075 $25.25
¥2,865 $34.86
— — — —
—
6,000 — — —
6,000
¥1 $0.01
— —
¥3,063 $37.27
— — — —
—
442,000 — — —
442,000
¥3,100 $37.72
— —
¥426 $5.18
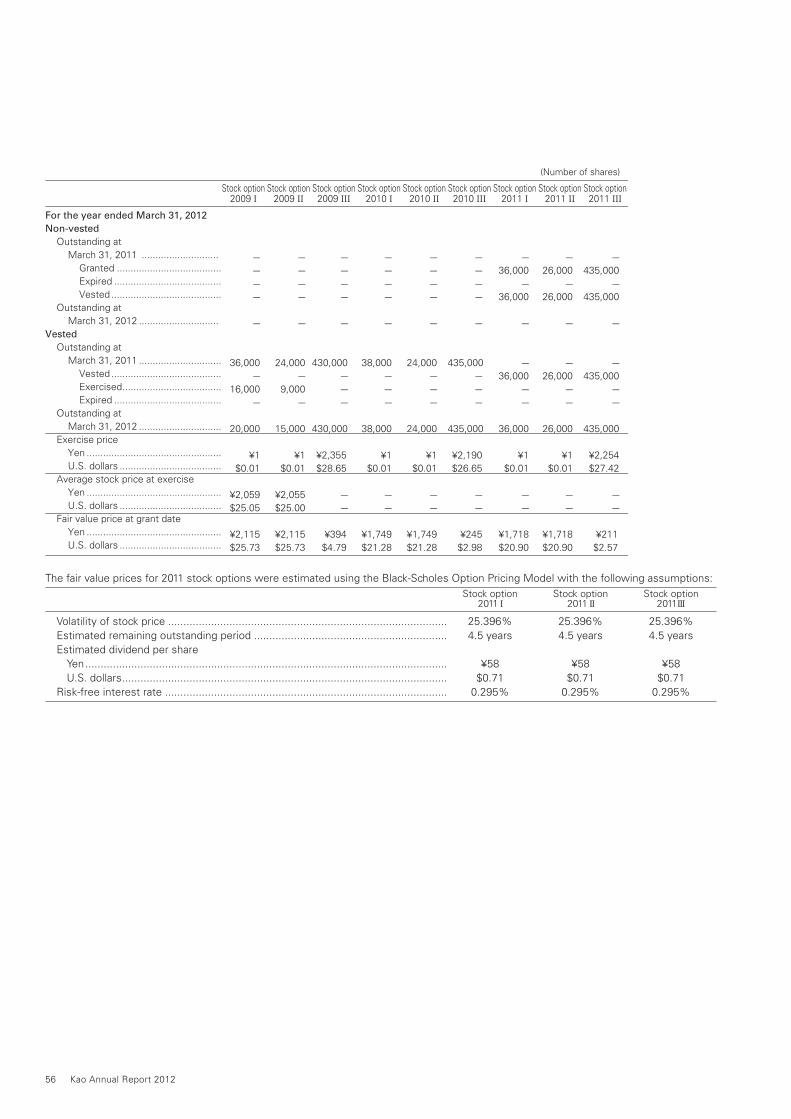
56 Kao Annual Report 2012
The fair value prices for 2011 stock options were estimated using the Black-Scholes Option Pricing Model with the following assumptions: Stock option Stock option Stock option 2011 I 2011 II 2011III
Volatility of stock price ........................................................................................... 25.396% 25.396% 25.396% Estimated remaining outstanding period ............................................................... 4.5 years 4.5 years 4.5 years Estimated dividend per share Yen ...................................................................................................................... ¥58 ¥58 ¥58 U.S. dollars .......................................................................................................... $0.71 $0.71 $0.71 Risk-free interest rate ............................................................................................ 0.295% 0.295% 0.295%
Stock option Stock option Stock option Stock option Stock option Stock option Stock option Stock option Stock option 2009 I 2009 II 2009 III 2010 I 2010 II 2010 III 2011 I 2011 II 2011 III
For the year ended March 31, 2012
Non-vested
Outstanding at March 31, 2011 ............................ Granted ...................................... Expired ....................................... Vested ........................................ Outstanding at March 31, 2012 .............................Vested
Outstanding at March 31, 2011 .............................. Vested ........................................ Exercised .................................... Expired ....................................... Outstanding at March 31, 2012 .............................. Exercise price Yen ................................................. U.S. dollars ..................................... Average stock price at exercise Yen ................................................. U.S. dollars ..................................... Fair value price at grant date .............. Yen ................................................. U.S. dollars .....................................
(Number of shares)
— — — —
—
36,000 — 16,000 —
20,000
¥1 $0.01
¥2,059 $25.05
¥2,115 $25.73
— — — —
—
24,000 — 9,000 —
15,000
¥1 $0.01
¥2,055 $25.00
¥2,115 $25.73
— 36,000 — 36,000
—
— 36,000 — —
36,000
¥1 $0.01
— —
¥1,718 $20.90
— — — —
—
430,000 — — —
430,000
¥2,355 $28.65
— —
¥394 $4.79
— 26,000 — 26,000
—
— 26,000 — —
26,000
¥1 $0.01
— —
¥1,718 $20.90
— — — —
—
38,000 — — —
38,000
¥1 $0.01
— —
¥1,749 $21.28
— 435,000 —435,000
—
—435,000 — —
435,000
¥2,254 $27.42
— —
¥211 $2.57
— — — —
—
24,000 — — —
24,000
¥1 $0.01
— —
¥1,749 $21.28
— — — —
—
435,000 — — —
435,000
¥2,190 $26.65
— —
¥245 $2.98

Kao Annual Report 2012 57
(1) Description of reportable segments
The Companies’ reportable segments are components for which separate financial information is available, and whose operating results are reviewed regularly by the chief operating decision maker in order to determine allocation of resources and assess segment performance. The Companies are organized into four business operating units, the Beauty Care Business, the Human Health Care Business and the Fabric and Home Care Business (collectively, the Consumer Products Business) and the Chemical Business. Each business operating unit plans comprehensive strategies for business in Japan and other countries, and conducts its own business activities. Therefore, the Companies have four reportable segments: the Beauty Care Business, the Human Health Care Business, the Fabric and Home Care Business and the Chemical Business. The Beauty
Care Business segment manufactures and sells prestige cosmetics, premium skin care and premium hair care products. The Human Health Care Business segment manufactures and sells food and beverage, sanitary and personal health products. The Fabric and Home Care Business segment manufactures and sells fabric care and home care products. The Chemical Business segment manufactures and sells oleo chemicals, performance chemicals and specialty chemicals.
(2) Methods of measurement for sales, profit (loss), assets, and
other items for reportable segments
The amount of segment profit corresponds to that of operating income. Intersegment sales and transfer prices are calculated mainly based on market value or manufacturing cost.
12 Comprehensive Income
13 Segment Information
Each component of other comprehensive income for the year ended March 31, 2012 was the following: Thousands of Millions of yen U.S. dollars
2012 2012
Unrealized gain (loss) on available-for-sale securities: Gains arising during the year ........................................................................................................... ¥ 517 $ 6,290
Reclassification adjustments to profit or loss .................................................................................. 12 146
Amount before income tax effect .................................................................................................... 529 6,436
Income tax effect ............................................................................................................................. (42) (511)
Total ................................................................................................................................................. ¥ 487 $ 5,925
Foreign currency translation adjustments Adjustments arising during the year ................................................................................................ ¥(12,169) $(148,059)
Reclassification adjustments to profit or loss .................................................................................. — —
Amount before income tax effect .................................................................................................... (12,169) (148,059)
Income tax effect ............................................................................................................................. — —
Total ................................................................................................................................................. ¥(12,169) $(148,059)
Share of other comprehensive income in affiliates Gains arising during the year .......................................................................................................... ¥ (172) $ (2,093)
Total ................................................................................................................................................. ¥ (172) $ (2,093)
Post retirement liability adjustments for foreign consolidated subsidiaries Adjustments arising during the year ................................................................................................ ¥ (2,049) $ (24,930)
Reclassification adjustments to profit or loss .................................................................................. 87 1,059
Amount before income tax effect .................................................................................................... (1,962) (23,871)
Income tax effect ............................................................................................................................. 726 8,833
Total ................................................................................................................................................. ¥ (1,236) $ (15,038)
Total other comprehensive income .............................................................................................. ¥(13,090) $(159,265)
The corresponding information for the year ended March 31, 2011 was not required under the accounting standard for presentation of
comprehensive income as an exemption for the first year of adopting that standard and not disclosed herein.

58 Kao Annual Report 2012
Information by reportable segment of the Companies for the years ended March 31, 2012 and 2011 was as follows:: Millions of yen
2012
Reportable segment Consumer Products Business Beauty Care Human Health Fabric and Home Chemical Business Care Business Care Business Total Business Reconciliations* Consolidated
Sales to customers ........................... ¥537,938 ¥181,758 ¥285,645 ¥1,005,341 ¥210,755 ¥ — ¥1,216,096
Intersegment sales ........................... — — — — 36,880 (36,880) —
Total sales ......................................... 537,938 181,758 285,645 1,005,341 247,635 (36,880) 1,216,096
Segment profit (Operating income) ... ¥ 15,412 ¥ 14,630 ¥ 55,544 ¥ 85,586 ¥ 23,001 ¥ 3 ¥ 108,590
Segment assets ................................ ¥496,177 ¥ 99,535 ¥128,858 ¥ 724,570 ¥194,582 ¥ 72,120 ¥ 991,272
Other Depreciation and amortization** .... ¥ 37,766 ¥ 7,926 ¥ 9,794 ¥ 55,486 ¥ 11,648 ¥ — ¥ 67,134
Investments in equity method affiliates ......................... 1,780 1,083 1,239 4,102 1,661 — 5,763
Increase in property, plant and equipment and intangible assets .. 13,106 11,520 12,219 36,845 10,333 — 47,178
* Reconciliation of segment profit includes elimination of intersegment transactions of inventory.Reconciliation of assets includes ¥78,742 million of the Company’s financial assets and negative ¥6,622 million elimination of receivables among reportable segments.
**Depreciation and amortization excludes amortization of goodwill.
Millions of yen
2011 Reportable segment Consumer Products Business Beauty Care Human Health Fabric and Home Chemical Business Care Business Care Business Total Business Reconciliations* Consolidated
Sales to customers ........................... ¥533,514 ¥175,761 ¥279,008 ¥988,283 ¥198,548 ¥ — ¥1,186,831Intersegment sales ........................... — — — — 33,449 (33,449) —
Total sales ......................................... 533,514 175,761 279,008 988,283 231,997 (33,449) 1,186,831Segment profit (Operating income) ... ¥ 5,536 ¥ 15,284 ¥ 59,659 ¥ 80,479 ¥ 24,100 ¥ 12 ¥ 104,591Segment assets ................................ ¥547,092 ¥ 87,127 ¥124,561 ¥758,780 ¥186,704 ¥ 77,315 ¥1,022,799
Other Depreciation and amortization** .... ¥ 39,186 ¥ 7,902 ¥ 9,438 ¥ 56,526 ¥ 12,347 ¥ — ¥ 68,873 Investments in equity method affiliates ......................... 1,603 936 1,019 3,558 1,483 — 5,041 Increase in property, plant and equipment and intangible assets .. 16,276 8,871 12,223 37,370 11,731 — 49,101
* Reconciliation of segment profit includes elimination of intersegment transactions of inventory.Reconciliation of assets includes ¥81,193 million of the Company’s financial assets and negative ¥3,878 million elimination of receivables among reportable segments.
**Depreciation and amortization excludes amortization of goodwill.

Kao Annual Report 2012 59
Thousands of U.S. dollars
2012
Reportable segment Consumer Products Business Beauty Care Human Health Fabric and Home Chemical Business Care Business Care Business Total Business Reconciliations* Consolidated
Sales to customers ........................... $6,545,054 $2,211,437 $3,475,423 $12,231,914 $2,564,241 $ — $14,796,155
Intersegment sales ........................... — — — — 448,716 (448,716) —
Total sales ......................................... 6,545,054 2,211,437 3,475,423 12,231,914 3,012,957 (448,716) 14,796,155
Segment profit (Operating income) ... $ 187,517 $ 178,002 $ 675,800 $ 1,041,319 $ 279,851 $ 37 $ 1,321,207
Segment assets ................................ $6,036,952 $1,211,035 $1,567,806 $ 8,815,793 $2,367,466 $ 877,478 $12,060,737
Other Depreciation and amortization** .... $ 459,496 $ 96,435 $ 119,163 $ 675,094 $ 141,721 $ — $ 816,815
Investments in equity method affiliates ......................... 21,657 13,177 15,075 49,909 20,209 — 70,118
Increase in property, plant and equipment and intangible assets .. 159,460 140,163 148,668 448,291 125,720 — 574,011
* Reconciliation of segment profit includes elimination of intersegment transactions of inventory. Reconciliation of assets includes $958,048 thousand of the Company’s financial assets and negative $80,570 thousand elimination of receivables among reportable segments.
**Depreciation and amortization excludes amortization of goodwill.
(b) Information related to reportable segments
Sales by geographic area for the years ended March 31, 2012 and 2011 were as follows: Millions of yen
2012
Japan Asia/Oceania* America** Europe*** Consolidated
Sales to customers ...................................................... ¥887,100 ¥138,821 ¥87,289 ¥102,886 ¥1,216,096
Millions of yen
2011 Japan Asia/Oceania* America** Europe*** Consolidated
Sales to customers ...................................................... ¥874,771 ¥131,473 ¥83,082 ¥97,505 ¥1,186,831
Thousands of U.S. dollars
2012
Japan Asia/Oceania* America** Europe*** Consolidated
Sales to customers ...................................................... $10,793,284 $1,689,025 $1,062,039 $1,251,807 $14,796,155
Note: Sales are classified in countries or regions based on location of customers
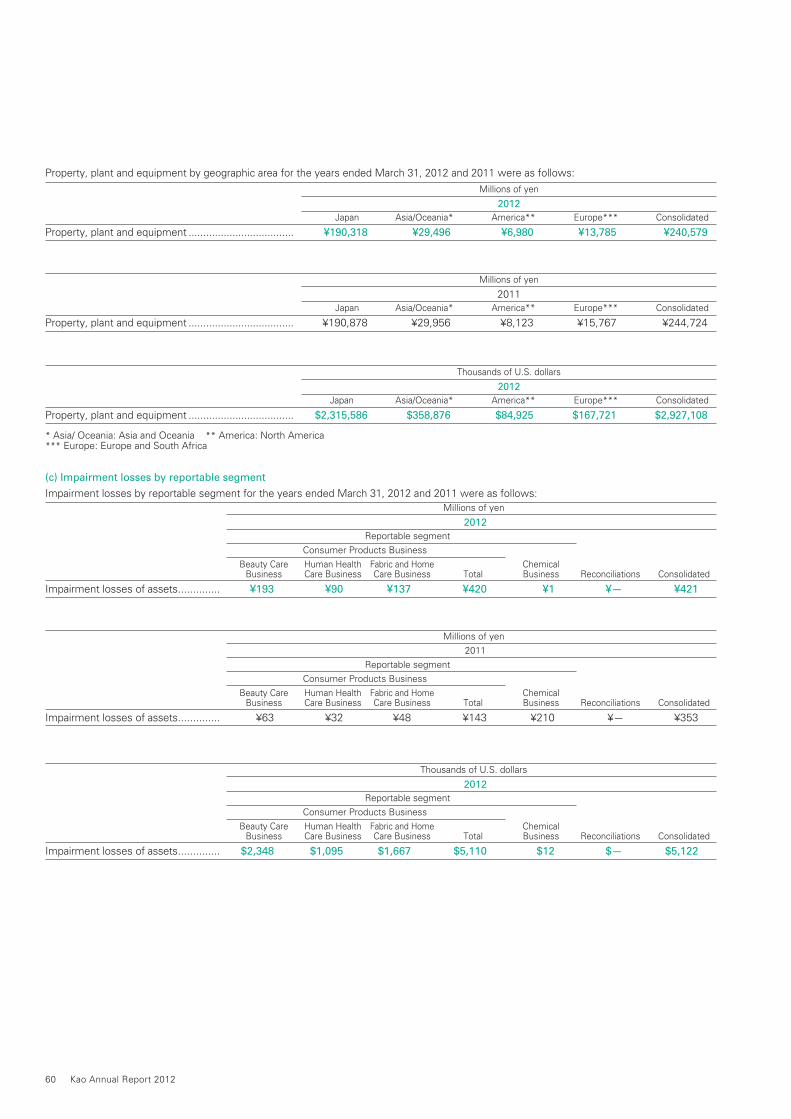
60 Kao Annual Report 2012
Property, plant and equipment by geographic area for the years ended March 31, 2012 and 2011 were as follows: Millions of yen
2012
Japan Asia/Oceania* America** Europe*** Consolidated
Property, plant and equipment .................................... ¥190,318 ¥29,496 ¥6,980 ¥13,785 ¥240,579
Millions of yen
2011 Japan Asia/Oceania* America** Europe*** Consolidated
Property, plant and equipment .................................... ¥190,878 ¥29,956 ¥8,123 ¥15,767 ¥244,724
Thousands of U.S. dollars
2012
Japan Asia/Oceania* America** Europe*** Consolidated
Property, plant and equipment .................................... $2,315,586 $358,876 $84,925 $167,721 $2,927,108
* Asia/ Oceania: Asia and Oceania ** America: North America*** Europe: Europe and South Africa
(c) Impairment losses by reportable segment
Impairment losses by reportable segment for the years ended March 31, 2012 and 2011 were as follows: Millions of yen
2012
Reportable segment Consumer Products Business Beauty Care Human Health Fabric and Home Chemical Business Care Business Care Business Total Business Reconciliations Consolidated
Impairment losses of assets .............. ¥193 ¥90 ¥137 ¥420 ¥1 ¥— ¥421
Millions of yen 2011 Reportable segment Consumer Products Business Beauty Care Human Health Fabric and Home Chemical Business Care Business Care Business Total Business Reconciliations Consolidated
Impairment losses of assets .............. ¥63 ¥32 ¥48 ¥143 ¥210 ¥ — ¥353
Thousands of U.S. dollars
2012
Reportable segment Consumer Products Business Beauty Care Human Health Fabric and Home Chemical Business Care Business Care Business Total Business Reconciliations Consolidated
Impairment losses of assets .............. $2,348 $1,095 $1,667 $5,110 $12 $— $5,122

Kao Annual Report 2012 61
(d) Amortization and balance of goodwill by reportable segment
Amortization and balance of goodwill by reportable segment for the years ended March 31, 2012 and 2011 were as follows: Millions of yen
2012
Reportable segment Consumer Products Business Beauty Care Human Health Fabric and Home Chemical Business Care Business Care Business Total Business Reconciliations Consolidated
Amortization of goodwill .................... ¥ 12,664 ¥— ¥— ¥ 12,664 ¥— ¥— ¥ 12,664
Goodwill at March 31, 2012 .............. 165,614 — — 165,614 — — 165,614
Millions of yen
2011 Reportable segment Consumer Products Business Beauty Care Human Health Fabric and Home Chemical Business Care Business Care Business Total Business Reconciliations Consolidated
Amortization of goodwill .................... ¥ 12,507 ¥ — ¥ — ¥ 12,507 ¥ — ¥ — ¥ 12,507
Goodwill at March 31, 2011 .............. 179,225 — — 179,225 — — 179,225
Thousands of U.S. dollars
2012
Reportable segment Consumer Products Business Beauty Care Human Health Fabric and Home Chemical Business Care Business Care Business Total Business Reconciliations Consolidated
Amortization of goodwill .................... $ 154,082 $— $— $ 154,082 $— $— $ 154,082
Goodwill at March 31, 2012 .............. 2,015,014 — — 2,015,014 — — 2,015,014
Selling, general and administrative expenses principally consisted of the following: Thousands of Millions of yen U.S. dollars
2012 2011 2012
Advertising ................................................................................................................ ¥ 82,209 ¥ 81,082 $1,000,231
Promotion ................................................................................................................. 62,980 64,655 766,273
Research and development ...................................................................................... 48,171 45,516 586,093
Salaries and bonuses ................................................................................................ 121,787 124,348 1,481,774
Packing and delivery expenses ................................................................................. 68,388 66,924 832,072
“Other, net” consisted of the following: Thousands of Millions of yen U.S. dollars
2012 2011 2012
Gain on sales of investment securities ..................................................................... ¥ — ¥ 186 $ —
Loss related to the Great East Japan Earthquake .................................................... (2,028) (4,129) (24,675)
Effect of application of Accounting Standard for Asset Retirement Obligations ...... — (1,634) —
Loss on sales or disposals of property, plant and equipment, net ........................... (2,202) (1,334) (26,792)
Insurance .................................................................................................................. 39 — 475
Other, net ................................................................................................................. 958 1,951 11,656
Total ...................................................................................................................... ¥(3,233) ¥(4,960) $(39,336)
14 Selling, General and Administrative Expenses
15 Other Income (Expenses)

62 Kao Annual Report 2012
16 Financial Instruments
(1) Group policy for financial instruments
The Companies position excess cash as standby funds until investing them in business activities, and manage them by investment only in short-term, low-risk financial instruments. The Companies have a policy to finance by debt from financial institutions and issuance of corporate bonds and other instruments in capital markets. The Companies use derivatives to hedge risk and do not use derivatives for the purposes of speculation.
(2) Nature and extent of risks arising from financial
instruments and risk management
Receivables such as trade notes and trade accounts are exposed to customer credit risk. The Companies manage this risk by ensuring their internal deliberations and approval processes of reviewing customers’ credit standing before entering into transactions with new customers. In addition, the Companies secure guarantee deposits or collaterals as necessary. Furthermore, the Companies monitor due dates and manage balances of receivables by customer and periodically check the credit risk of key customers. Marketable securities, which consist of commercial papers of highly-rated companies and bond investment trusts including MMF and others, are highly safe and liquid financial instruments. Investment securities, which consist mainly of stock of business partners, are exposed to stock price volatility risk. The Companies periodically check the validity of their stockholdings. Payment terms of payables, such as trade notes and trade accounts, are mostly less than one year. Loans, principally from financial institutions, in short-term debt
are mainly for financing related to operating activities. Bonds and loans principally from financial institutions in long-term debt are for financing related to M&A and investment in property, plant and equipment. Certain loans with floating interest rates are exposed to interest rate volatility risk. The Companies use interest rate swaps for the purpose of hedging the interest rate volatility risk by converting the floating rates into fixed rates. Derivative transactions entered into and managed by the Companies are made in accordance with internal policies that regulate objectives, credit limit amount, scope, organization and others. The Companies do not use derivatives for the purpose of speculation. All derivative transactions are entered into to meet requirements for hedging risk incorporated in the Companies’ business. The Companies limit the counterparties to these derivative transactions to major international financial institutions to reduce their credit risk. With regard to payables, such as trade notes, trade accounts and loans, the Companies monitor and manage liquidity risk by preparing monthly forecast statements of cash flows of each company. (3) Fair values of financial instruments
Fair values of financial instruments are based on the quoted price in active markets. If a quoted price is not available, other rational valuation techniques are used. Also see Note 17 for details of the fair values of derivatives. The contract amounts of derivatives which are shown in Note 17 do not represent the amounts exchanged by the parties and do not measure the Companies’ exposure to credit or market risk.
The carrying amount, fair value and unrealized gain or loss of financial instruments as of March 31, 2012 and 2011 consisted of the following: Millions of yen
2012
Carrying Fair Unrealized amount value gain/(loss)
Cash and time deposits ........................................................................................ ¥ 85,483 ¥ 85,483 ¥ —
Short-term investments ....................................................................................... 48,798 48,798 —
Notes and accounts receivable ............................................................................. 146,371
Allowance for doubtful receivables ................................................................... (1,020)
Notes and accounts receivable, net .................................................................. 145,351 145,351 —
Investment securities ........................................................................................... 6,335 6,335 —
Total ................................................................................................................... ¥285,967 ¥285,967 ¥ —
Short-term debt .................................................................................................... ¥ 2,060 ¥ 2,060 ¥ —
Current portion of long-term debt ......................................................................... 811 773 38
Notes and accounts payable ................................................................................. 158,352 158,352 —
Income taxes payable ........................................................................................... 18,306 18,306 —
Long-term debt ..................................................................................................... 106,565 107,441 (876)
Total ................................................................................................................... ¥286,094 ¥286,932 ¥ (838)
Derivatives ............................................................................................................ ¥ (340) ¥ (340) ¥ —

Kao Annual Report 2012 63
Thousands of U.S. dollars
2012
Carrying Fair Unrealized amount value gain/(loss)
Cash and time deposits ........................................................................................ $1,040,066 $1,040,066 $ —
Short-term investments ....................................................................................... 593,722 593,722 —
Notes and accounts receivable ............................................................................. 1,780,886
Allowance for doubtful receivables ................................................................... (12,411)
Notes and accounts receivable, net .................................................................. 1,768,475 1,768,475 —
Investment securities ........................................................................................... 77,078 77,078 —
Total ................................................................................................................... $3,479,341 $3,479,341 $ —
Short-term debt .................................................................................................... $ 25,064 $ 25,064 $ —
Current portion of long-term debt ......................................................................... 9,867 9,405 462
Notes and accounts payable ................................................................................. 1,926,658 1,926,658 —
Income taxes payable ........................................................................................... 222,728 222,728 —
Long-term debt ..................................................................................................... 1,296,569 1,307,227 (10,658)
Total ................................................................................................................... $3,480,886 $3,491,082 $(10,196)
Derivatives ............................................................................................................ $ (4,137) $ (4,137) $ —
Cash and time deposits
The carrying values of cash and time deposits approximate fair value because of their short maturities.
Short-term investments and investment securities
The fair value of marketable equity securities is measured at the quoted market price of the stock exchange. The fair value of marketable debt securities is measured at the quoted market price of the stock exchange or at the quoted price obtained from the financial institutions if there is no quoted market price. The carrying value of other marketable securities, such as commercial papers, investment trust funds and other which consist of MMF and others, approximate fair value because of their short maturities. See Note 4 for information of the fair value of short-term investments and investment securities by classification.
Notes and accounts receivables
The carrying values of notes and accounts receivable approximate fair value because of their short maturities.
Short-term debt
The carrying values of short-term debt approximate fair value because of their short maturities.
Current portion of long-term debt
The fair value of fixed interest loans is measured at the present value by discounting expected repayments of principal and interest in the remaining period using an assumed interest rate on an equivalent new loan.
Millions of yen
2011 Carrying Fair Unrealized amount value gain/(loss)
Cash and time deposits ........................................................................................ ¥110,762 ¥110,762 ¥ — Short-term investments ....................................................................................... 37,028 37,028 — Notes and accounts receivable ............................................................................. 124,973
Allowance for doubtful receivables ................................................................... (1,002)
Notes and accounts receivable, net .................................................................. 123,971 123,971 — Investment securities ........................................................................................... 5,828 5,828 — Total ................................................................................................................... ¥277,589 ¥277,589 ¥ — Short-term debt .................................................................................................... ¥ 6,776 ¥ 6,776 ¥ — Current portion of long-term debt ......................................................................... 80,795 81,261 (466) Notes and accounts payable ................................................................................. 151,028 151,028 — Income taxes payable ........................................................................................... 18,785 18,785 — Long-term debt ..................................................................................................... 77,451 79,340 (1,889) Total ................................................................................................................... ¥334,835 ¥337,190 ¥(2,355) Derivatives ............................................................................................................ ¥ 80 ¥ 80 ¥ —

64 Kao Annual Report 2012
The carrying amount of financial instruments whose fair value cannot be reliably determined as of March 31, 2012 and 2011 consisted of the following: Thousands of Millions of yen U.S. dollars
2012 2011 2012
Investment securities that do not have a quoted market price in an active market ............................................................................ ¥1,181 ¥1,195 $14,369
Notes and accounts payable
The carrying values of notes and accounts payable approximate fair value because of their short maturities.
Long-term debt
The fair value of bonds issued by the Company is measured at the quoted market price. The fair value of fixed interest loans is measured at the present value by discounting expected repayments of principal and interest in the remaining period using an assumed interest rate on an equivalent new loan. The fair value of long-term loans subject to a special accounting method for interest rate swaps which qualify for hedge accounting
and meet specific matching criteria is measured at the present value by discounting expected repayments of principal and interest together with the interest rate swaps in the remaining period using an assumed interest rate on an equivalent new loan. The fair value of lease obligations is measured at the present value by discounting expected repayments of lease obligations including interest in the remaining period using an assumed interest rate on equivalent new lease obligations. Derivatives
Information on fair value of derivatives is included in Note 17.
Please see Note 5 for annual maturities of long-term debt.
(4) Maturity analysis for financial assets and securities with contractual maturities
The maturity analysis for financial assets and securities with contractual maturities as of March 31, 2012 was as follows: Millions of yen
Due after Due after Due within one year five years Due after one year through five through ten ten years years years
Cash and time deposits ............................................................................................ ¥ 85,483 ¥— ¥— ¥—
Short-term investments and investment securities Held-to-maturity debt securities ........................................................................... 10,000 — — —
Available-for-sale other securities with contractual maturities ............................. 147 — — —
Notes and accounts receivable ................................................................................. 146,371 — — —
Total ...................................................................................................................... ¥242,001 ¥— ¥— ¥—
Thousands of U.S. dollars
Due after Due after Due within one year five years Due after one year through five through ten ten years years years
Cash and time deposits ............................................................................................ $1,040,066 $— $— $—
Short-term investments and investment securities Held-to-maturity debt securities ........................................................................... 121,668 — — —
Available-for-sale other securities with contractual maturities ............................. 1,789 — — —
Notes and accounts receivable ................................................................................. 1,780,886 — — —
Total ...................................................................................................................... $2,944,409 $— $— $—

Kao Annual Report 2012 65
(a) Derivative transactions to which hedge accounting is not applied
The Companies had the following derivative contracts outstanding to which hedge accounting was not applied at March 31, 2012 and 2011: Millions of yen
2012 2011
Contract Contract Contract amount Fair Unrealized Contract amount Fair Unrealized amount due after value gain/(loss) amount due after value gain/(loss) one year one year
Foreign exchange forward contracts: Buying U.S. Dollar ............................................... ¥ 1,087 ¥ — ¥ 9 ¥ 9 ¥1,010 ¥ 331 ¥ (42) ¥ (42) Buying Japanese Yen ......................................... 81 — 2 2 49 — 1 1 Buying British Pound .......................................... 774 — 28 28 806 — 36 36 Buying other currencies ...................................... 3 — 0 0 233 — 27 27 Selling U.S. Dollar ............................................... 11,082 714 (284) (284) 7,301 1,569 (52) (52) Selling other currencies ...................................... 2,733 — (96) (96) 3,863 — 110 110
Foreign currency swaps: Selling put option British Pound ......................... ¥ 464 ¥ — ¥ (14) ¥ (14) ¥ — ¥ — ¥ — ¥ — Option premium .......................................... — — — — — — — —
Buying call option U.S. Dollar ............................. 334 — 12 12 — — — —
Option premium .......................................... — — — — — — — —
Buying call option Euro ...................................... 302 — 3 3 — — — —
Option premium ........................................... — — — — — — — —
Thousands of U.S. dollars
2012
Contract Contract amount Fair Unrealized amount due after value gain/(loss) one year
Foreign exchange forward contracts: Buying U.S. Dollar ............................................... $ 13,225 $ — $ 110 $ 110
Buying Japanese Yen ......................................... 986 — 24 24
Buying British Pound .......................................... 9,417 — 341 341
Buying other currencies ...................................... 37 — 0 0
Selling U.S. Dollar ............................................... 134,834 8,687 (3,456) (3,456)
Selling other currencies ...................................... 33,252 — (1,169) (1,169)
Foreign currency swaps: Selling put option British Pound ......................... $ 5,645 $ — $ (170) $ (170)
Option premium .......................................... — — — —
Buying call option U.S. Dollar ............................. 4,064 — 146 146
Option premium .......................................... — — — —
Buying call option Euro ...................................... 3,674 — 37 37
Option premium ........................................... — — — —
(b) Derivative transactions to which hedge accounting is applied
The Companies had the following derivative contracts outstanding to which hedge accounting was applied at March 31, 2012: Millions of yen Thousands of U.S. dollars
2012 2012
Contract Contract Contract amount Fair Contract amount Fair amount due after value amount due after value one year one year
Interest rate swaps: (Fixed rate payment, Floating rate receipt) .......... ¥40,000 ¥40,000 — $486,677 $486,677 —
17 Derivatives
The interest rate swaps which qualify for hedge accounting and meet specific matching criteria are not remeasured at market value but the differentials paid or received under the swap agreements
are recognized and included in interest expense or income. In addition, the fair value of the interest rate swaps is included in that of the hedged item, long-term debt, in Note 16.
Hedgeditem
Long-term debt
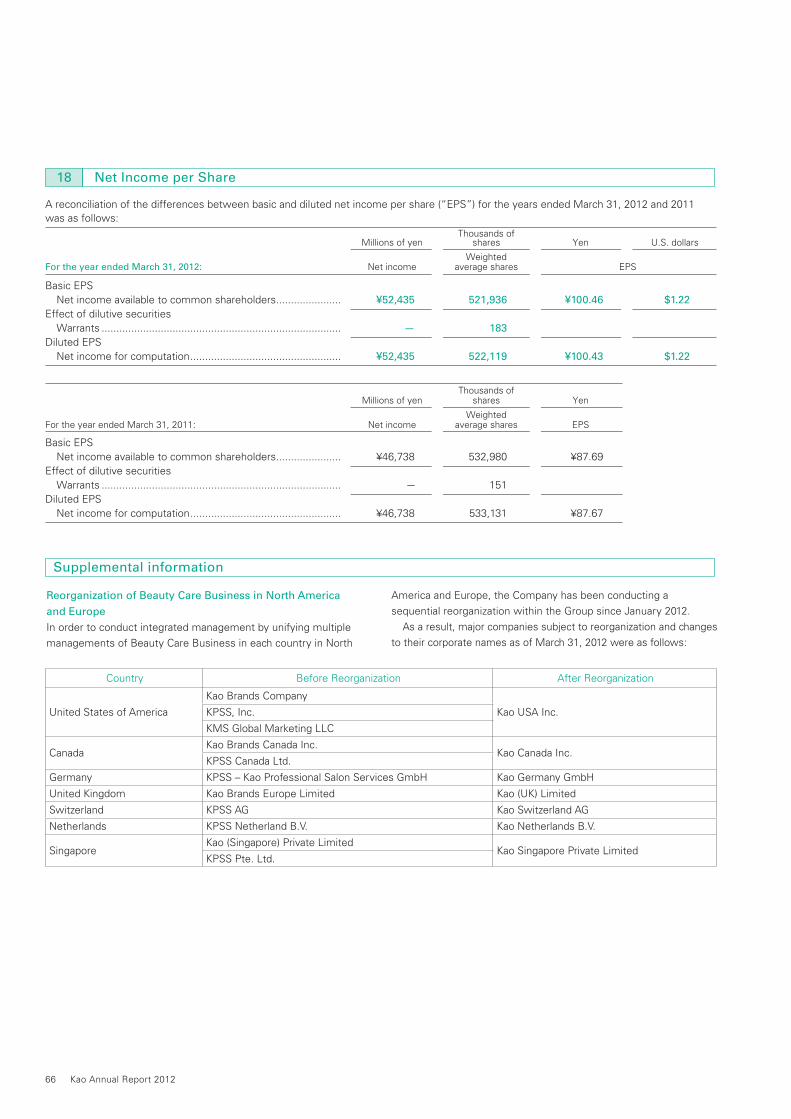
66 Kao Annual Report 2012
A reconciliation of the differences between basic and diluted net income per share (“EPS”) for the years ended March 31, 2012 and 2011 was as follows: Thousands of Millions of yen shares Yen U.S. dollars
WeightedFor the year ended March 31, 2012: Net income average shares EPS
Basic EPS Net income available to common shareholders ...................... ¥52,435 521,936 ¥100.46 $1.22
Effect of dilutive securities Warrants ................................................................................. — 183
Diluted EPS Net income for computation ................................................... ¥52,435 522,119 ¥100.43 $1.22
Thousands of Millions of yen shares Yen
WeightedFor the year ended March 31, 2011: Net income average shares EPS
Basic EPS Net income available to common shareholders ...................... ¥46,738 532,980 ¥87.69Effect of dilutive securities Warrants ................................................................................. — 151Diluted EPS Net income for computation ................................................... ¥46,738 533,131 ¥87.67
Reorganization of Beauty Care Business in North America
and Europe
In order to conduct integrated management by unifying multiple managements of Beauty Care Business in each country in North
America and Europe, the Company has been conducting a sequential reorganization within the Group since January 2012. As a result, major companies subject to reorganization and changes to their corporate names as of March 31, 2012 were as follows:
18 Net Income per Share
Supplemental information
Country Before Reorganization After Reorganization
United States of America
Kao Brands Company
Kao USA Inc.KPSS, Inc.
KMS Global Marketing LLC
CanadaKao Brands Canada Inc.
Kao Canada Inc.KPSS Canada Ltd.
Germany KPSS – Kao Professional Salon Services GmbH Kao Germany GmbH
United Kingdom Kao Brands Europe Limited Kao (UK) Limited
Switzerland KPSS AG Kao Switzerland AG
Netherlands KPSS Netherland B.V. Kao Netherlands B.V.
SingaporeKao (Singapore) Private Limited
Kao Singapore Private LimitedKPSS Pte. Ltd.

Kao Annual Report 2012 67
Independent Auditor’s Report
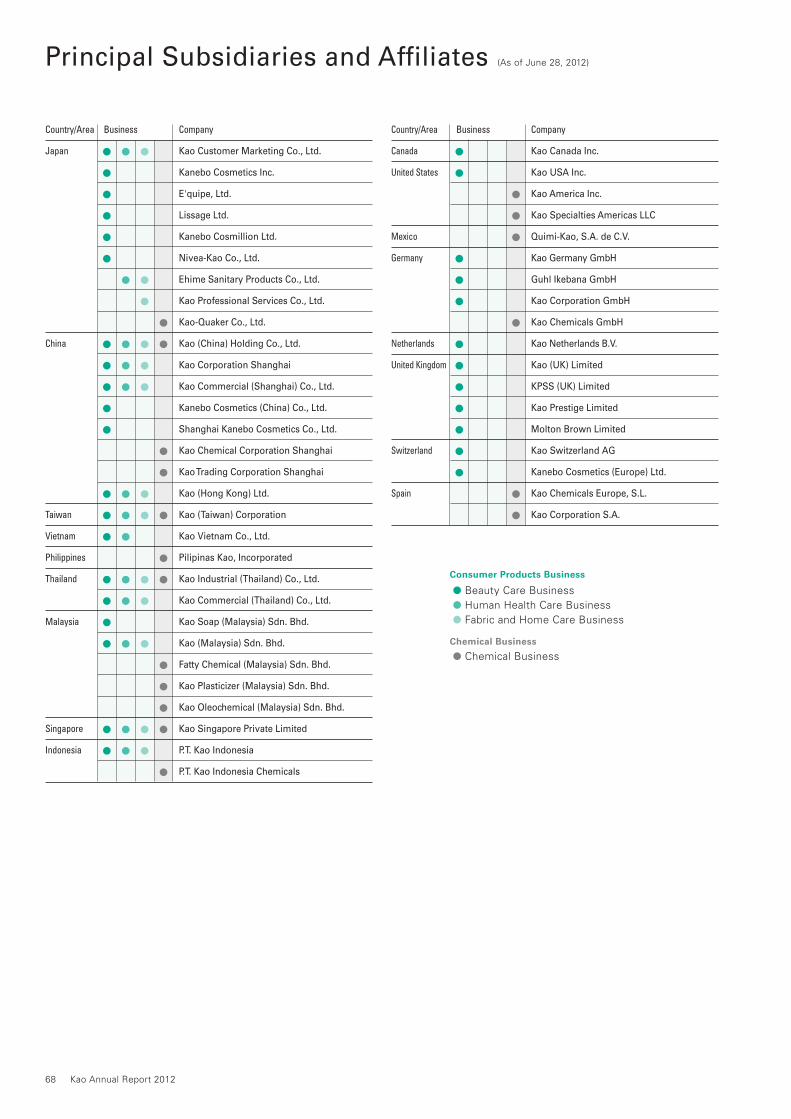
68 Kao Annual Report 2012
Principal Subsidiaries and Affiliates (As of June 28, 2012)
Country/Area
Japan
China
Taiwan
Vietnam
Philippines
Thailand
Malaysia
Singapore
Indonesia
Country/Area
Canada
United States
Mexico
Germany
Netherlands
United Kingdom
Switzerland
Spain
Company
Kao Customer Marketing Co., Ltd.
Kanebo Cosmetics Inc.
E'quipe, Ltd.
Lissage Ltd.
Kanebo Cosmillion Ltd.
Nivea-Kao Co., Ltd.
Ehime Sanitary Products Co., Ltd.
Kao Professional Services Co., Ltd.
Kao-Quaker Co., Ltd.
Kao (China) Holding Co., Ltd.
Kao Corporation Shanghai
Kao Commercial (Shanghai) Co., Ltd.
Kanebo Cosmetics (China) Co., Ltd.
Shanghai Kanebo Cosmetics Co., Ltd.
Kao Chemical Corporation Shanghai
Kao Trading Corporation Shanghai
Kao (Hong Kong) Ltd.
Kao (Taiwan) Corporation
Kao Vietnam Co., Ltd.
Pilipinas Kao, Incorporated
Kao Industrial (Thailand) Co., Ltd.
Kao Commercial (Thailand) Co., Ltd.
Kao Soap (Malaysia) Sdn. Bhd.
Kao (Malaysia) Sdn. Bhd.
Fatty Chemical (Malaysia) Sdn. Bhd.
Kao Plasticizer (Malaysia) Sdn. Bhd.
Kao Oleochemical (Malaysia) Sdn. Bhd.
Kao Singapore Private Limited
P.T. Kao Indonesia
P.T. Kao Indonesia Chemicals
●
●
●
●
●
●
●
●
●
●
●
●
●
●
●
●
●
●
●
●
●
●
●
●
●
●
●
●
●
●
●
●
●
●
●
●
●
●
●
●
●
●
●
●
●
●
●
●
●
●
●
●
●
●
●
●
●
●
●
●
●
●
●
●
●
●
●
●
●
●
●
●
●
●
●
●
Consumer Products Business
● Beauty Care Business ● Human Health Care Business ● Fabric and Home Care Business
Chemical Business
● Chemical Business
Business Business Company
Kao Canada Inc.
Kao USA Inc.
Kao America Inc.
Kao Specialties Americas LLC
Quimi-Kao, S.A. de C.V.
Kao Germany GmbH
Guhl Ikebana GmbH
Kao Corporation GmbH
Kao Chemicals GmbH
Kao Netherlands B.V.
Kao (UK) Limited
KPSS (UK) Limited
Kao Prestige Limited
Molton Brown Limited
Kao Switzerland AG
Kanebo Cosmetics (Europe) Ltd.
Kao Chemicals Europe, S.L.
Kao Corporation S.A.

Kao Annual Report 2012 69
Companies and Individualsin Foreign Countries 47.75%
Financial Institutions 29.32%
Other Japanese Companies 4.04%
Treasury Stock 0.73%Securities Companies 3.59%
Individuals and Others 14.57%
Investor Information (As of March 31, 2012)
Top Ten Shareholders
Number of Ratio of Name of Shareholders Shares Shareholding* (thousand shares) (percentage)
Japan Trustee Services Bank, Ltd. (Trust Account) 32,332 6.14 Northern Trust Co. (AVFC) Sub A/C American Clients 23,076 4.38 The Master Trust Bank of Japan, Ltd. (Trust Account) 21,492 4.08 State Street Bank and Trust Company 18,844 3.58 Mellon Bank, N.A. as Agent for its Client Mellon Omnibus US Pension 13,585 2.58 Northern Trust Co. AVFC Re U.S. Tax Exempted Pension Funds 12,346 2.34 SSBT OD05 Omnibus Account – Treaty Clients 12,021 2.28 Tokio Marine & Nichido Fire Insurance Co., Ltd. 10,442 1.98 Kao Group Employee Shareholding Association 8,815 1.67 State Street Bank and Trust Company 505225 8,618 1.63* Ratio of shareholding is calculated based on the issued shares.
Composition of Shareholders
2007 2008 2009 2010 2011
Monthly Trading Volume (Million Shares)
Stock Price Range (Yen)
Common Stock Price Range
Tokyo Price Index Close
0
500
1,000
1,500
2,000
2,500
3,000
3,500
4,000
0
20
40
60
80
100
120
Stock Price Range and Trading Volume (Tokyo Stock Exchange)
Note: Fiscal years beginning April and ending March the following calendar year
Investor Relations
Telephone: 81-3-3660-7101 Facsimile: 81-3-3660-8978 e-mail: [email protected] Web site: http://www.kao.com/jp/en/corp_ir/investors.html
For the Kao Sustainability Report and Kao Group Profile, please refer to the Kao Group website athttp://www.kao.com/group/en/group/reports.html
Kao Corporation Head Office
14-10, Nihonbashi Kayabacho 1-chomeChuo-ku, Tokyo 103-8210, JapanTelephone: 81-3-3660-7111
Founded
June 19, 1887
Common Stock
Authorized: 1,000,000,000 sharesIssued: 526,212,501 sharesOutstanding (excluding treasury stock): 522,366,519 sharesNumber of Shareholders: 54,622
Stock Listing
Tokyo Stock Exchange
Ticker Symbol Number
4452
Administrator of Shareholder Register
Sumitomo Mitsui Trust Bank, Limited 8-4, Izumi 2-chome, Suginami-ku, Tokyo 168-0063, Japan
Depositary and Registration for American Depositary
Receipts (ADR Ticker Symbol: KCRPY)
JPMorgan Chase Bank, N.A.1 Chase Manhattan Plaza, Floor 58, New York, NY 10005, U.S.A.