Embed Size (px)
Citation preview

Asia-Pacific Economic Statistics Week
Enormous Success of
Monthly Manufacturing Online Survey
Through National Enterprise-Wide
Statistical Systems (NEWSS) Framework
Sabri Bin Omar and Nurul Effa Ahmad
Department of Statistics Malaysia

Asia-Pacific Economic Statistics Week
Research Question And Scope Of Study
• Research Question:
How NEWSS Framework support the
implementation of Monthly Manufacturing (MM)
Online Survey
• Scope of Study
i. NEWSS architecture, functions and features
ii. The trend of online e-Survey for years 2013 -2016
2

Asia-Pacific Economic Statistics Week
Methodology
1. Generic Statistical Business Process Model
(GSBPM)
2. Cut Off Sampling Method
3. Probability Sampling Method
4. System Development Life Cycle (SDLC)
3
Asia-Pacific Economic Statistics Week 4
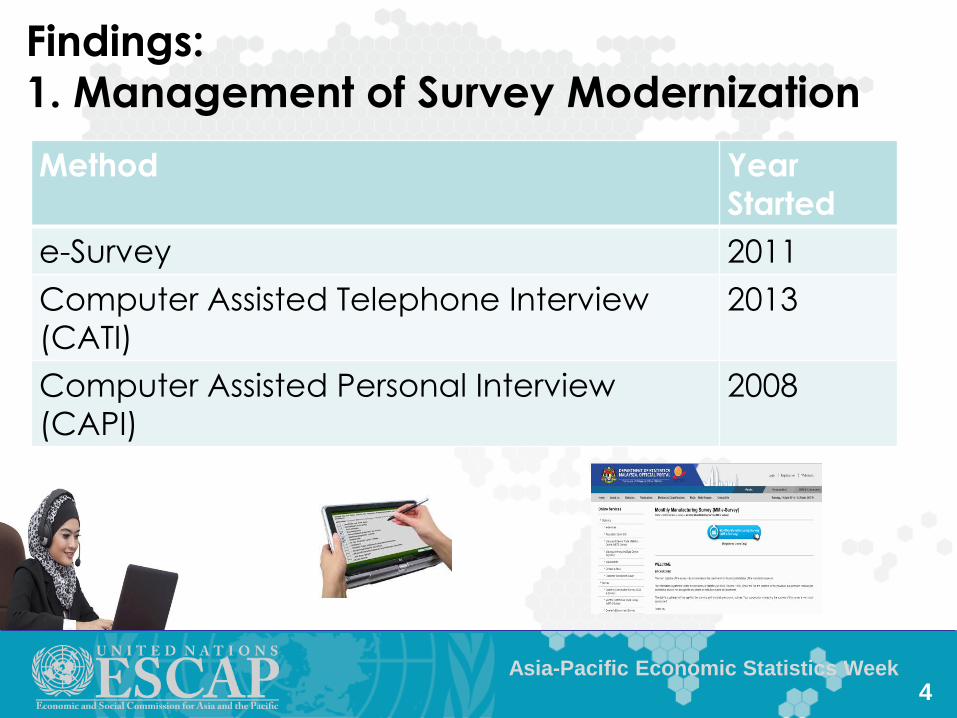
Findings:
1. Management of Survey Modernization
Method Year
Started
e-Survey 2011
Computer Assisted Telephone Interview
(CATI)
2013
Computer Assisted Personal Interview
(CAPI)
2008

Asia-Pacific Economic Statistics Week 5
Findings:
2. List of e-Survey Systems Implemented in
DOSM 2011 - current
1. Monthly Manufacturing Survey (MM)
2. Monthly Distributive Trade Survey (MDT)
3. Quarterly Construction Survey (QCS)
4. Quarterly Employment Survey (eJobCreation)
5. Survey of International Trade in Services (ITS)
6. Quarterly Survey of Services (QSS)

Asia-Pacific Economic Statistics Week
STAKEHOLDER PUBLIC INTERNATIONAL
GIS
1GOV*NET
DISSEMINATE 7 DOSM
Visualization StatsDW StatsBDA
Portal Multimedia Email mySMS
HEAD QUARTER DC MYLOCA DC ILSM DC STATES SERVER ROOMS NETWORK ROOMS & ICT OPERATION OFFICE
• Feasibility studies
• Edit Spec
SPECIFY NEEDS
1
• Design tools eg Ms Office
DESIGN
2
•Freehand
BUILD
3
COLLECT
4
•e-Survey •Online Data – ICR – CAPI – CATI
PROCESS
5
• NEWSS • Office Automation
• Mobile App • Economic Sector
• Social Sector
•SAS •SPSS •eView •Stata •MS Excel •StatsBDA
ANALYSE
6
• Manual
EVALUATE
8
GATEWAY
APPLICATION - GSBPM
DATA CENTER (DC)
INFRA & SECURITY
USER
ARCHIVE- StatsDW
6
Findings:
3. DOSM ICT Framework

Asia-Pacific Economic Statistics Week 7
Findings:
3. DOSM ICT Framework
1. guideline to the system development in DOSM.
2. to ensure conformance to applications
development standards and
methodologies especially the selection of
programming language and ICT tools.
3. to minimise the adoption of various type of
software in order to produce highly skill,
competent and knowledgeable ICT personnel in
specialised software.

8
Findings:
4. NEWSS Framework
e-Services

Asia-Pacific Economic Statistics Week
NO. ELEMENT DESCRIPTION METHOD
1 Confidentiality Data can not be disclosed
or accessed without
authorization.
Encryption, password
2 Validation Data and information is
authentic.
fullfil the edit specification
requirement
3 Integrity Data and information is
accurate, complete and
current
fullfil the edit specification
requirement
4 Availability Data and information can
be accessed around the
clock (24x7).
Server and network
environment meet the
system requirements
9
Findings:
5. Security Element and Pre-requisite of
e-Survey

Asia-Pacific Economic Statistics Week 10
NO. ELEMEN KETERANGAN KAEDAH
5 Security Data is protected from
the invasion
• Using Secured Socket Layer
(SSL) - https: //
• Security scan using
Acunetix
6 Questionaire A short and simple
questions
User-friendly and there is a
pop-up guide.
7 Access and
Transactions
System that is stable
and transactions is
secured.
Installation of load-balancer
server and ICT security
appliance.
8 Respondents'
readiness
Awareness and
acceptance of the use
of ICT by the
respondent.
Online user manual when
filling the questionnaire e-
Survey.
Findings:
5. Security Element and Pre-requisite of
e-Survey
Asia-Pacific Economic Statistics Week
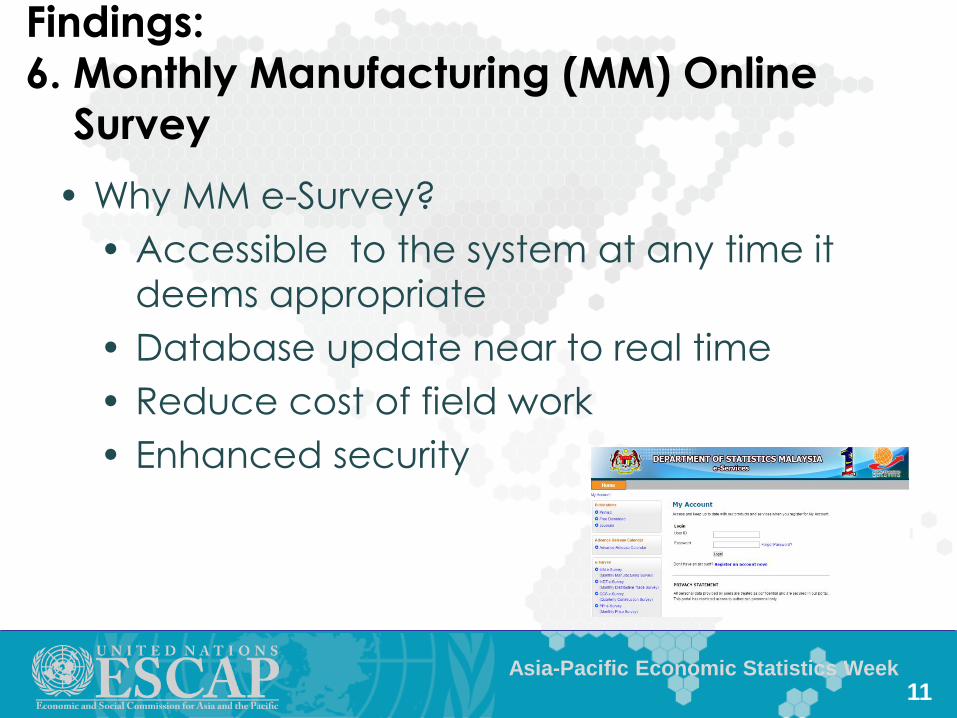
Findings:
6. Monthly Manufacturing (MM) Online
Survey
• Why MM e-Survey?
• Accessible to the system at any time it
deems appropriate
• Database update near to real time
• Reduce cost of field work
• Enhanced security
11

Asia-Pacific Economic Statistics Week 12
Findings:
7. Number of e-Survey and Electronic
Media Respondents
Years Total Samples
Registered e-Survey
Respondent
New Registered e-Survey
Respondent
Total Registered
Electronic Medium
(Email , Fax &
Telephone)
Total e-Survey & Electronic
s
%
2013 4,388 1,752 378 2,130 1,737 3,867 88.1 2014 5,217 1,570 241 2,371 1,742 4,113 78.8 2015 5,097 1,124 129 2,500 1,761 4,261 83.6 2016 5,044 1,599 113 2,613 2,330 4,943 98.0
Total respondents for e-Survey and electronic media
increase every year. However, new registered have
decreased

Asia-Pacific Economic Statistics Week 13
Findings:
8. Growth Year on Year for Registered e-
Survey Respondents 48.5
34.7
24.6
33.9
0
10
20
30
40
50
60
2013 2014 2015 2016 G
row
th Y
oY
(%
)
Year
Years Total
Samples
Total Registered e-
Survey Respondent
Growth YoY
(%)
2013 4,388 2,130 48.5
2014 5,217 2,371 34.7
2015 5,097 2,500 24.6
2016 5,044 2,613 33.9
Registered e-Survey
respondent decreased
in 2015 due to the
changes of sample
selection method

Asia-Pacific Economic Statistics Week 14
Findings:
9. Growth Year on Year for Electronic Media
Respondents
39.6 33.4 34.5
46.2
0
10
20
30
40
50
2013 2014 2015 2016 G
row
th Y
oY
(%
) Year
Years Total Samples Electronic Medium
(Email , Fax & Telephone)
Growth YoY (%)
2013 4,388 1,737 39.6
2014 5,217 1,742 33.4
2015 5,097 1,761 34.5
2016 5,044 2,330 46.2

Asia-Pacific Economic Statistics Week 15
Findings:
10. MM e-Survey Features in NEWSS
Framework
1. Verification on respondent registration
2. Notification Email
3. Validation of Responses
4. System Sync and Update Near Real Time
5. Export Function
6. Security Features

16
Findings:
11. NEWSS to DOSM Data Warehouse…
Micro Data
Aggregated
Data
Historical
Data (Micro &
Aggregate)
Data Governance,
Data Integration
(ETL)
Data Profiling
& Data
Quality
Data Migration,
Data Integration
(ETL)
Enterprise Data
Warehouse (EDW)
Operational Data
Store
Data Warehouse
Appliance
Visualization
Location
Intelligence
Analytics
Time
Series
Lab
eDataBank
Mobile
Data Sources
(NEWSS & Others)
Commercial
Student
Public
Stakeholders
DOSM
Researcher
Modules Users
Historical
Publication

17
Commercial
Student
DOSM
Researcher
Existing DW
Appliance
(Netezza)
Enterprise
Data
Warehouse
(EDW)
Existing ODS
(IBM DB2 Blu)
Applications
Internal &
External Portal
Data Management &
Data Integration Data Sources
MSBR
External Trade
Proposed Big Data
Appliance
(Server, Software)
Exploration, Analysis
& Location Analytics
Visualizati
ons &
Predictive
Analytics
Navigation,
Discovery &
Pre Selection
Table
Historical
Media/Files/Image
Data
Standardization
& Text Matching
Data Integration
End
Users
StatsBDA
Appliance
Pro
po
se
d D
ata
Sta
nd
ard
iza
tio
n &
Te
xt
Ma
tch
ing
To
ols
Ex
isti
ng
SA
S V
A &
VS
,SA
S/E
TS
, S
AS
/EG
,
Mic
roS
trate
gy, T
ab
leau
Pro
po
se
d A
dva
nce
d A
naly
tics
To
ols
Customs
Data Origin
Other
National
Statistics
Stake-
holders
Public
Findings:
12. NEWSS to DOSM Big Data Analytics…

Asia-Pacific Economic Statistics Week
Remaining issues/further research
1. Framework Scalability - Mobile Access
According to IDC, Nov 2015 – The top technology prediction for
2016 is mainly on Digital Transformation (DX) using technologies
such as mobile, cloud, big data analytics, IoT, AI and robotics. By
2020, almost 50% of IT budgets will be tied into DX initiatives and by
2017, over 50% of IT spending will be for new technologies (mobile,
cloud, big data, etc.).
2. Improve Visual Design - easier for respondents to complete the
survey
3. Awareness to electronic media respondent to use e-Survey
18

Asia-Pacific Economic Statistics Week 19


![The enormous turnip[1]](https://img.pdfslide.us/doc/110x75/5583959cd8b42a1f098b4752/the-enormous-turnip1.jpg)