Embed Size (px)
Citation preview
Durham E-Theses
Enols as intermediates in nitrosation and halogenation
of malonamide and malonic acid
Xia, Ling
How to cite:
Xia, Ling (1993) Enols as intermediates in nitrosation and halogenation of malonamide and malonic acid,Durham theses, Durham University. Available at Durham E-Theses Online: http://etheses.dur.ac.uk/5496/
Use policy
The full-text may be used and/or reproduced, and given to third parties in any format or medium, without prior permission orcharge, for personal research or study, educational, or not-for-pro�t purposes provided that:
• a full bibliographic reference is made to the original source
• a link is made to the metadata record in Durham E-Theses
• the full-text is not changed in any way
The full-text must not be sold in any format or medium without the formal permission of the copyright holders.
Please consult the full Durham E-Theses policy for further details.
Academic Support O�ce, Durham University, University O�ce, Old Elvet, Durham DH1 3HPe-mail: [email protected] Tel: +44 0191 334 6107
http://etheses.dur.ac.uk
ENOLS AS INTERMEDIATES IN NTTROSATION AND HALOGENATION OF MALONAMIDE AND MALONIC ACID
by
Ling Xia, B .Sc , M.Sc. (China)
The copyright of this thesis rests with the author.
No quotation from it should be published without
his prior written consent and information derived
from it should be acknowledged.
A thesis submitted for the degree of Master
of Science of the University of Durham
January, 1993
6 APR W93

m ^

To my husband, mum and dad
MEMORANDUM
The work for this thesis has been carried out in the Department of
Chemistry at the University of Durham between May 1991 and December
1992. It is the original work of the author unless otherwise stated. None of
the work has been submitted for any other degree.
A C K N O W L E D G E M E N T S
To my supervisor, Professor D.L.H.Williams, I am deeply indebted not
only for providing me with financial support, but also for all of his instruction,
encouragement and kindheartedness.
I sincerely express my gratitude to my husband for all of his help and
support.
I would also like to thank Dr. R.S. Matthews for carrying out NMR
determination and J. McAninly, A. Graham, T. Bowen, J. Bamett, J. Hamid
for their friendship and helpful discussion. Thanks are also due to Mr. C.
Greenhalgh for all his invaluable technical assistance.
ENOLS AS INTERMEDIATES IN NITROSATION AND
HALOGENATION OF MALONAMIDE AND MALONIC ACID
LING XIA
ABSTRACT
Catalysed nitrosation of malonamide(MA) was carried out in aqueous acidic
solution at 25°C. In the presence of bromide ion as a catalyst, the reaction was
always first order in [HNO2] despite the changes in acidity. However, the kinetic
behaviour of SCN" catalysed reaction varied from fu-st order to zero order with
[SCN'J, suggesting that the reaction occurs via an enol intermediate and the rate
limiting step can move from enolisation to nitrosation under certain conditions.
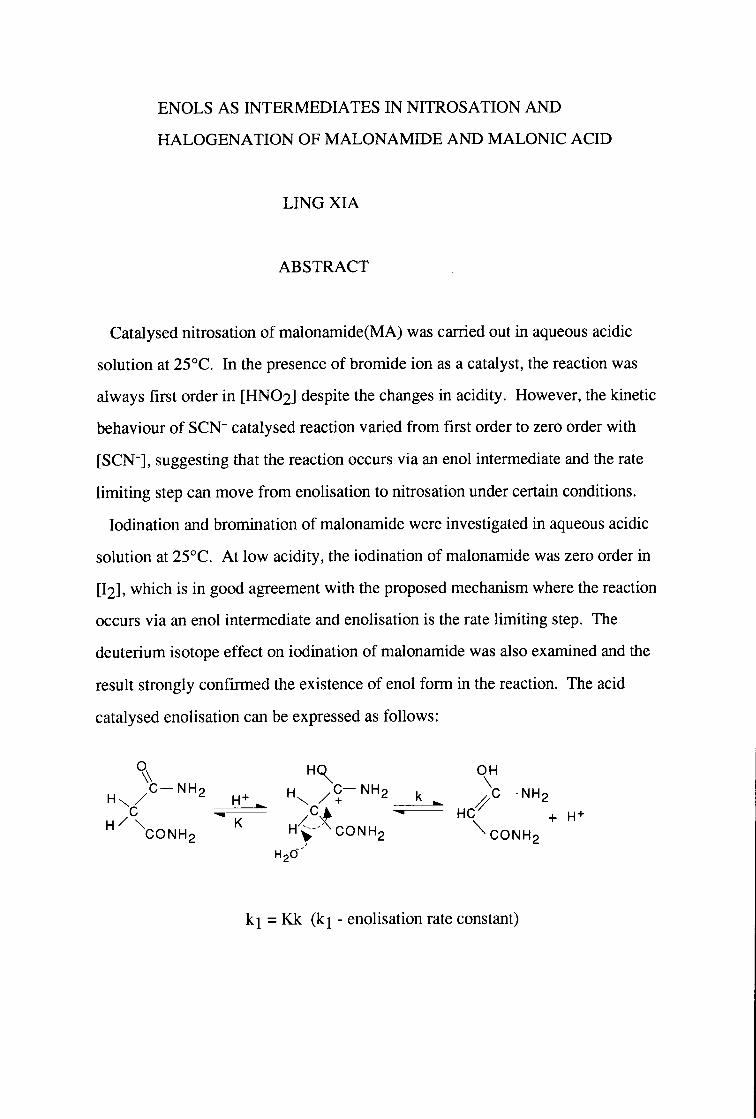
lodination and bromination of malonamide were investigated in aqueous acidic
solution at 25°C. At low acidity, the iodination of malonamide was zero order in
[I2], which is in good agreement with the proposed mechanism where the reaction
occurs via an enol intermediate and enolisation is the rate limiting step. The
deuterium isotope effect on iodination of malonamide was also examined and the
result strongly confirmed the existence of enol form in the reaction. The acid
catalysed enolisation can be expressed as follows:
^ \ HQ^ OH
^ \ 0 N H 2 H^- '^C0NH2 \ c O N H 2
kj = Kk (kj - enolisation rate constant)
At higher acidity and lower [I2] reaction was first order in [I2], when now
iodination of the end is rate limiting. When enolisation is rate limiting the rate
equation was established as:
Rate=kobs=kl[H+][MA]
The values of enolisation rate constant kj (3.72(±0.4)xlO"3 l.mol"l.s"l) is
significantly larger than that measured for simple ketones such as acetone
(3.8xlO"5 1-mol" -s'l), reflecting the greater acidity of the central hydrogen atom
in malonamide structure brought about by the second -CONH2 group or possibly
the greater concentration of the O-protonated intermediate. Bromination was
perfectly first-order in [Br2] at all acidities. Attempts to achieve rate-limiting
enolisation by increasing [Br2] were only partially successful. Perfect zero order
behaviour could not be obtained. A possible explanation is that dibromination
occurs in the reaction.
By combination of the above three reactions, Kg the equilibrium constant of
enolisation of malonamide was estimated as 4(±2)xl0"10, with an assumption that
the rate limiting step of electrophilic addition occurs at the encounter limit.
The bromination of malonic acid (MAL) was studied under pH 1.0-4.65 at 25°C.
The reaction was zero order in [Br2] and the plots of kQ/[MAL]T vs [MALJx were
linear, implying that the enolisation reaction is via the malonate ion catalysed
pathway.
CONTENTS
Page
Chapter 1. Introduction 1
1.1. Enolisation 2
1.2. Methods for the determination of keto-enol equilibrium
constants or enol contents 3
1.3. The mechanism of enolisation 8
1.4. Halogenation of enols 10
1.5. C-nitrosation involving enol 15
1.5.1. Nitrosating species 15
1.5.2. Nitrosation of ketones, acids and esters 16
1.6. Unstable and relatively stable simple enols 18
1.7. The enols from dicarbonyl compounds 22
References 25
Chapter 2. Nitrosation and halogenation of malonamide 31
2.1. Introduction 32
2.2. The catalysed nitrosation of malonamide 32
2.2.1. Results 32
2.2.2. Discussion 40
2.3. lodination of malonamide 44
2.3.1. Results 44
2.3.2. Discussion 51
2.4. Bromination of malonamide 53
2.4.1. Results 53
Page
2.4.2. Discussion 56
2.5. Isotope effects 57
2.5.1. Results 57
2.5.2. Discussion 65
References 67
Chapter 3. Bromination of malonic acid 69
3.1. Introduction 70
3.2. Results 71
3.3. Discussion 77
References 79
Chapter 4. Experimental details 80
4.1. Chemical reagents 81
4.2. pH measurements 82
4.3. Experimental methods 82
4.3.1. UV/Visible spectrophotometry 82
4.3.2. Stopped-flow spectrophotometry 83
4.4. Determination of rate constants 85
4.4.1. First order observed rate constants 85
4.4.2. Zero order observed rate constants 87
4.5. Kinetic measurement 89
Appendix 92
CHAPTER 1
INTRODUCTION
1.1. Enolisation
Enols as the isomers of aldehydes and ketones are essential intermediates in
many carbonyl compound reactions such as halogenation, alkylation, nitrosation
and condensation. A number of biological reactions also involve enol
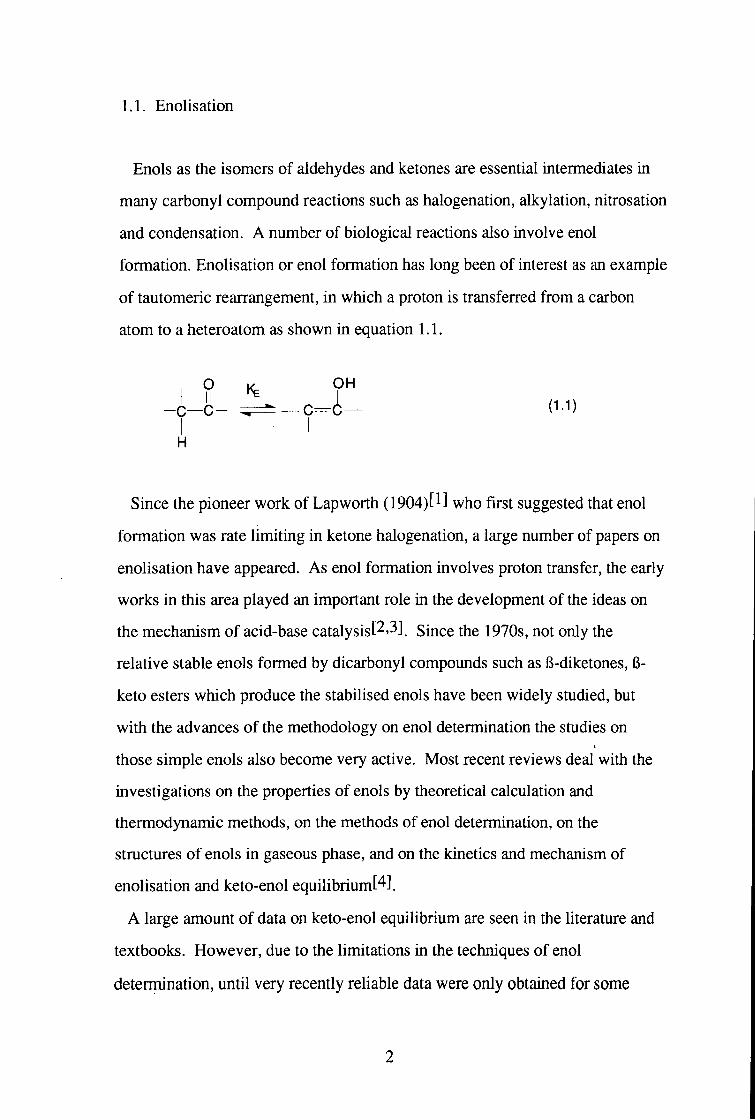
formation. Enolisation or enol formation has long been of interest as an example
of tautomeric rearrangement, in which a proton is transferred from a carbon
atom to a heteroatom as shown in equation 1.1.
\ ^ ^
-c—c- c=c— (I-"")
H
Since the pioneer work of Lap worth (1904)[1] who first suggested that enol
formation was rate limiting in ketone halogenation, a large number of papers on
enolisation have appeared. As enol formation involves proton transfer, the early
works in this area played an important role in the development of the ideas on
the mechanism of acid-base catalysis[2,3] Since the 1970s, not only the
relative stable enols formed by dicarbonyl compounds such as B-diketones, 6-
keto esters which produce the stabilised enols have been widely studied, but
with the advances of the methodology on enol determination the studies on
those simple enols also become very active. Most recent reviews deal with the
investigations on the properties of enols by theoretical calculation and
thermodynamic methods, on the methods of enol determination, on the
structures of enols in gaseous phase, and on the kinetics and mechanism of
enolisation and keto-enol equihbriumW.
A large amount of data on keto-enol equilibrium are seen in the literature and
textbooks. However, due to the limitations in the techniques of enol
determination, until very recently reliable data were only obtained for some
dicarbonyls or other compounds which contain relatively high proportions of
the enol form.
Recently, there has been much interest in chemistry of enols derived from
carbonyl group-containing compounds other than ketones, including carboxyhc
acids and estersf^'^'^l. However, there is only a very limited information on
the enols derived from amides. In this work, the enolisation of malonamide has
been investigated by means of kinetic study of its nitrosation, halogenation and
of isotopic exchange. This is the first work involving the search, by kinetic
technique, for the enol form of malonamide.
1.2. Methods for the determination of keto-enol equilibrium constants or enol
contents
The determination of enol content and keto-enol equihbrium constants has
been at the centre of the study on the chemistry of enols. It is generally based
either on titration by halogen or on spectroscopic analysis by various techniques
such as NMR, UV, IR and MS. These techniques have been studied for a long
time and greatly advanced by the development of modem instrumentation.
Some other techniques such as HPLC, GC and photochemical methods have
also been developed for enol determination. Indirect determination through
kinetic studies also becomes an efficient way to obtain keto-enol equilibrium
constant in some cases.
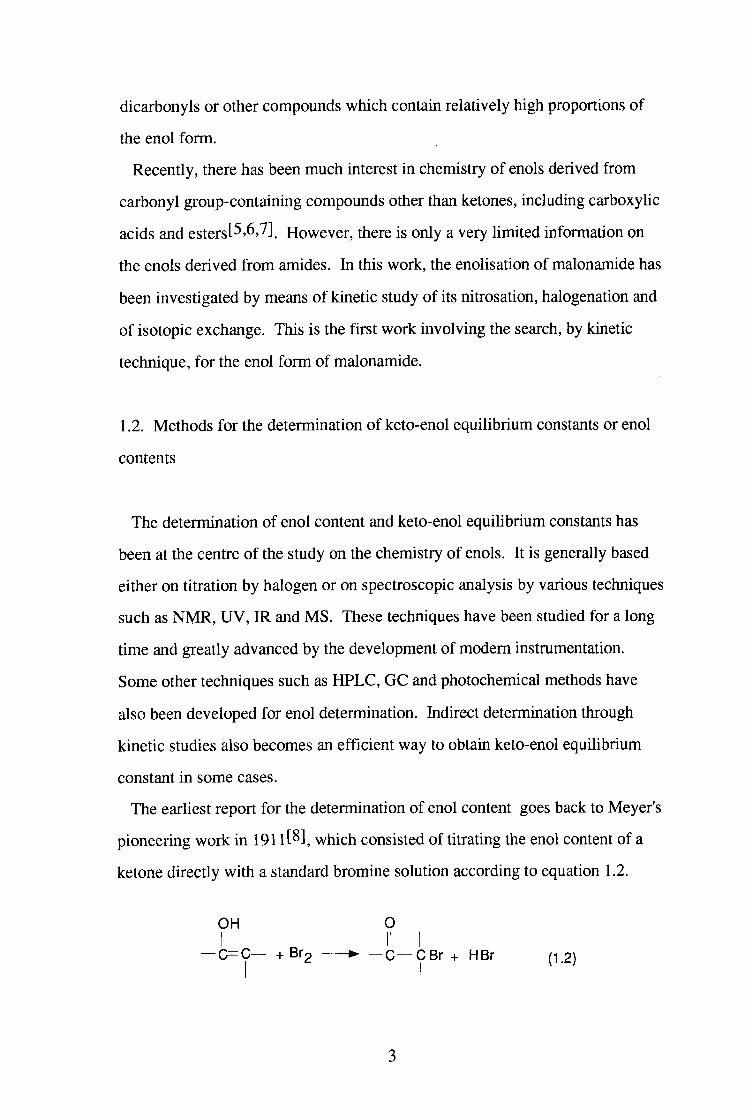
The earliest report for the determination of enol content goes back to Meyer's
pioneering work in 191 it^l, which consisted of titrating the enol content of a
ketone directly with a standard bromine solution according to equation 1.2.
OH O
— C = C — + Brg • — C — C B r + HBr (1.2)
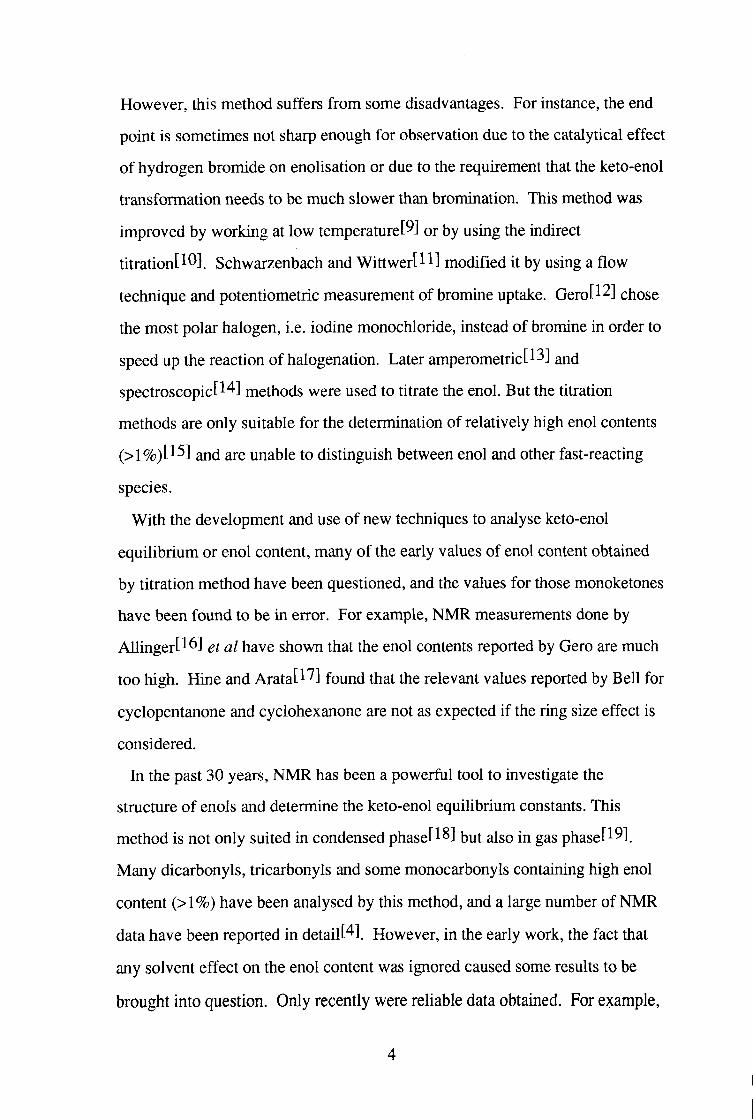
However, this method suffers from some disadvantages. For instance, the end
point is sometimes not sharp enough for observation due to the catalytical effect
of hydrogen bromide on enolisation or due to the requirement that the keto-enol
transformation needs to be much slower than bromination. This method was
improved by working at low temperature[ ] or by using the indirect
titration[10]. Schwarzenbach and Wittwer[ll] modified it by using a flow
technique and potentiometric measurement of bromine uptake. Gerotl^] chose
the most polar halogen, i.e. iodine monochloride, instead of bromine in order to
speed up the reaction of halogenation. Later amperometrictl^] and
spectroscopicJ methods were used to titrate the enol. But the titration
methods are only suitable for the determination of relatively high enol contents
(>1%)[15] and are unable to distinguish between enol and other fast-reacting
species.
With the development and use of new techniques to analyse keto-enol
equilibrium or enol content, many of the early values of enol content obtained
by titration method have been questioned, and the values for those monoketones
have been found to be in error. For example, NMR measurements done by
Allinger[16] gt al have shown that the enol contents reported by Gero are much
too high. Hine and Arata[17] found that the relevant values reported by Bell for
cyclopentanone and cyclohexanone are not as expected if the ring size effect is
considered.
In the past 30 years, NMR has been a powerful tool to investigate the
structure of enols and determine the keto-enol equilibrium constants. This
method is not only suited in condensed phasefl^j but also in gas phasen9].
Many dicarbonyls, tricarbonyls and some monocarbonyls containing high enol
content (>1%) have been analysed by this method, and a large number of NMR
data have been reported in detail t ] However, in the early work, the fact that
any solvent effect on the enol content was ignored caused some results to be
brought into question. Only recently were reliable data obtained. For example.
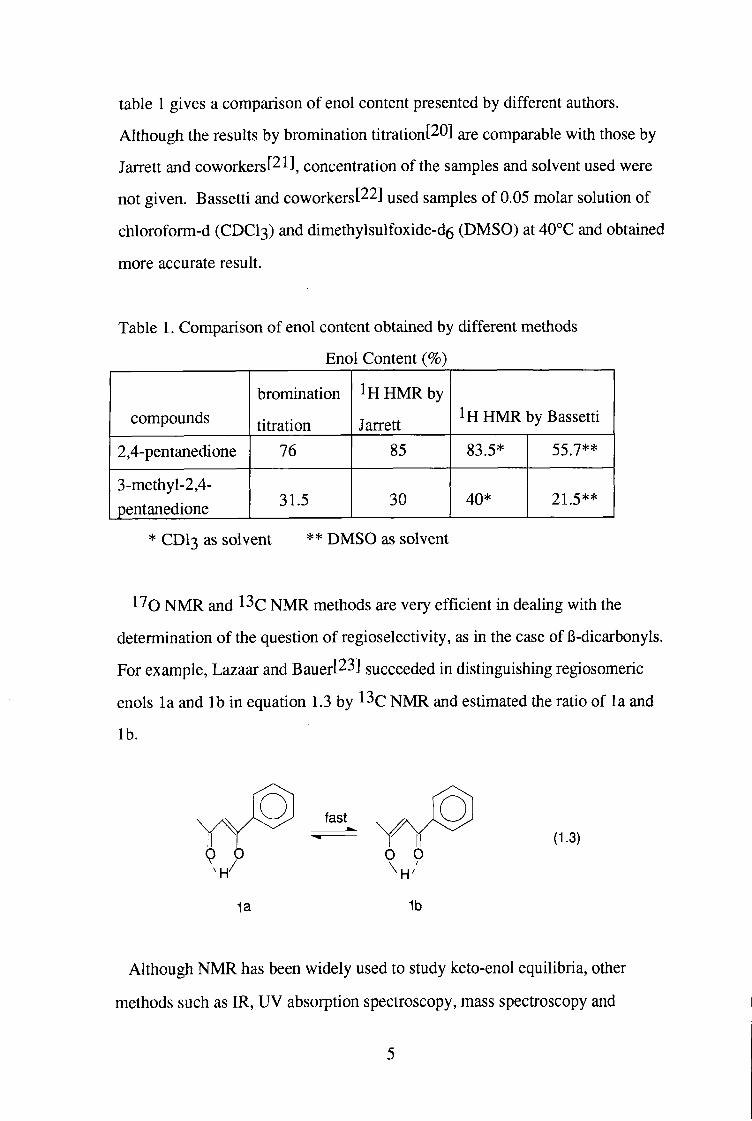
table 1 gives a comparison of enol content presented by different authors.
Although the results by bromination titration[20] are comparable with those by
Jarrett and coworkerst^l]^ concentration of the samples and solvent used were
not given. Bassetti and coworkers[22] used samples of 0.05 molar solution of
chloroform-d ( C D C I 3 ) and dimethylsulfoxide-d^ ( D M S O ) at 40°C and obtained
more accurate result.
Table 1. Comparison of enol content obtained by different methods
Enol Content (%)
compounds bromination
titration
1H H M R by
Jarrett 1H H M R by Bassetti
2,4-pentanedione 76 85 83.5* 55.7**
3-methyl-2,4-pentanedione 31.5 30 40* 21.5**
* C D I 3 as solvent ** D M S O as solvent
1^0 N M R and ^^c N M R methods are very efficient in dealing with the
determination of the question of regioselectivity, as in the case of 6-dicarbonyls.
For example, Lazaar and Bauer[23] succeeded in distinguishing regiosomeric
enols la and lb in equation 1.3 by N M R and estimated the ratio of la and
lb.
fast
la 1b
(1.3)
Although NMR has been widely used to study keto-enol equilibria, other
methods such as IR, UV absorption spectroscopy, mass spectroscopy and
photochemical method show their own advantages. UV spectrophotornetry
enables the measurement of a small quantity of enol because of the higher UV
absorption by the enol than by the keto tautomer at X m x- Many 6-
diketones[24] B-ketoesters[25], B-ketoamidest ] and a-diketones[2'7] have
been measured by the UV method. Recently, Moriyasut^S] attempted to use
HPLC to study keto-enol tautomerism of aliphatic and alicyclic 6-dicarbonyl
compound at low temperature (-20 to 50°C) and obtained satisfactory results.
Hence this method seems worth development.
Kinetic data for simple enols are not always available from direct
measurement due to experimental difficulties. Indirect kinetic determinations
have provided an efficient way of estimating keto-enol equilibrium constant Kg.
Dubois and Toullect^^] used an approach based on the kinetic study of the acid-
catalysed halogenation of acetone, diethylketone and di-isopropylketone under
low halogen concentrations. At the conditions where the rate limiting step is
halogen addition, the apparent rate coefficients Kn (Kij=KEk2, where Kg is the
keto-enol equilibrium and k2 is the rate constant for halogen addition) for
iodination, bromination and chlorination are approximately equal. Therefore
the K E values were calculated on an assumption of encounter-controlled
addition of halogen to the enol. The enol content of simple carbonyl
compounds in water have also been estimated by Guthrie through this approach.
Another indirect method to estimate Kg is based on determining the rate
constants of enolisation and of ketonisation (KE=kenol/kketo)- The rate
constants of enolisation can be obtained by direct method or the kinetic study of
halogenation and nitrosation. However, estimating the rate constants of
ketonisation depended on some assumptions in the early years. Guthrie and
coworkerst O] proposed an assumption that the rate constant for acid-catalysed
ketonisation of enol is the same as that for acid-catalysed hydrolysis of the
corresponding enol ether. The equilibrium constant for enolisation can be
calculated as the ratio of the rate constant of enolisation to that of hydrolysis. In
the same year, they reported a thermochemical method based on thermodynamic
determination of the Gibbs free energy change for enol ether formationt^l].
Although these two independent methods of estimation have led to concordant
results which usually corresponded to a much lower enol content than those
obtained by halogen titration, a number of problems were not solved, especially
the doubt on the assumption that the enol ketonisation rate constants are equal
to those of enol ether hydrolysis.
In the last 10 years, modem flash photolytic methods[32] have been
developed to determine keto-enol equilibrium constant. These methods are
based completely on experimentally determined quantities and so the results are
believed to be more reliable.
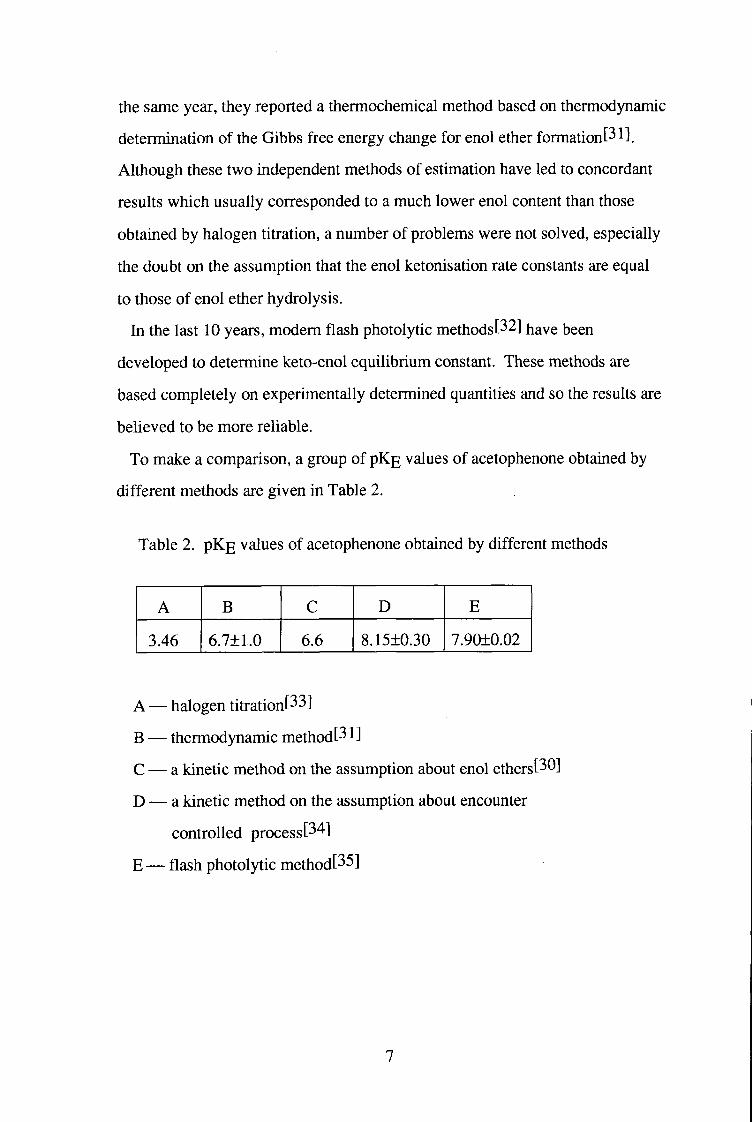
To make a comparison, a group of pK^ values of acetophenone obtained by
different methods are given in Table 2.
Table 2. pKg values of acetophenone obtained by different methods
A B C D E
3.46 6.7±1.0 6.6 8.15±0.30 7.90±0.02
A — halogen titration[33]
B — thermodynamic methodt 1]
C — a kinetic method on the assumption about enol etherst O]
D — a kinetic method on the assumption about encounter
controUed process[34]
E — flash photolytic method[35]
1.3. The mechanism of enolisation
End and enolate ions are essential intermediates in many important carbonyl
compound reactions. Studies of enolisation have played a fundamental role in
the development of the ideas on acid base catalysis. Until now, catalysis of
enolisation has been one of the most thoroughly studied of all organic catalytic
processes.
Investigation of the mechanism of enolisation for carbonyl compounds often
involves rate studies. Most kinetic studies have made use of the property that
the enolisation is the rate limiting step of some stepwise reactions under certain
conditions. The process of interconversion between keto and enol form have
been known to involve acid and base catalysis since the pioneering work of
Lapworth[l] who reported that the acid catalysed halogenation of acetone is
zero order with respect to halogen and suggested that enol formation of acetone
was rate limiting and was followed by fast reaction of the halogen with the enol.
Dawson and coworkers P 6] examined the effect of weak acids and bases and
realised that the enolisation is catalysed not only by the hydronium and
hydroxide ions but also by general acids (carboxylic acids) and general bases
(carboxylate ions). Later, Bell and coworkerst^'^^l developed the ideas in the
examination of the mechanism of acid-base catalysis. So far, many papers
concerning general acid and base catalysis for enolisation have been
documented. For instance, in the early work, Bell and Lidwell[37] only studied
the catalysis by four aliphatic carboxylate bases in the enolisation of acetone.
Recently, Venimadhavan and coworkerst^S] have re-examined the results of
Bell and Lidwell and greatly extended their series of acids and bases which
included a considerable number of dicarboxylic acid dianions. Shelly and
coworkerst^^l studied arylphosphonic acid, arylphosphonate dianions and more
than 60 other acids as catalysts for enolisation of acetone.
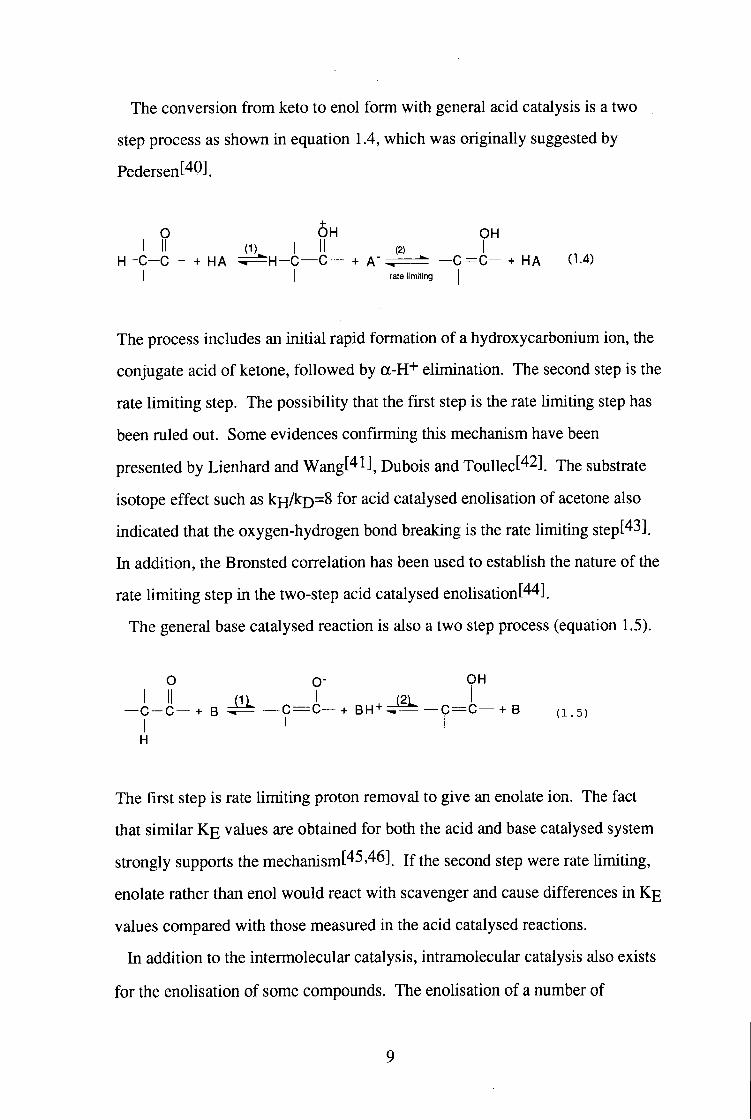
The conversion from keto to enol form with general acid catalysis is a two
step process as shown in equation 1.4, which was originally suggested by
Pedersen[40],
O 6H O H I I I (1) I I I (2)
H - C - C — + H A ^ ; = ^ H - C — C — + A ' ^ " — C = C - + H A (14 ) I I rate limiting |
The process includes an initial rapid formation of a hydroxycarbonium ion, the
conjugate acid of ketone, followed by a-H+ elimination. The second step is the
rate limiting step. The possibility that the first step is the rate hmiting step has
been ruled out. Some evidences confirming this mechanism have been
presented by Lienhard and Wang[41], Dubois and Toullect^^] 'phe substrate
isotope effect such as ki{/kQ=S for acid catalysed enolisation of acetone also
indicated that the oxygen-hydrogen bond breaking is the rate limiting step['*3]_
In addition, the Bronsted correlation has been used to establish the nature of the
rate limiting step in the two-step acid catalysed enoUsation[44].
The general base catalysed reaction is also a two step process (equation 1.5).
O O- O H
— C - C — + B ^ J = ^ — C = C — + B H + ^ ^ — C = C — + B (1.5)
The first step is rate limiting proton removal to give an enolate ion. The fact
that similar K g values are obtained for both the acid and base catalysed system
strongly supports the mechanism[45'^6] j f second step were rate Umiting,
enolate rather than enol would react with scavenger and cause differences in Kg
values compared with those measured in the acid catalysed reactions.
hi addition to the intermolecular catalysis, intramolecular catalysis also exists
for the enolisation of some compounds. The enolisation of a number of
aliphatic ketones such as levulinic acid[44]^ aminoketones and their N-
methylated derivativest'^^J, and 0-acylbenzoic acidt^S] have been investigated.
Sufficient data indicate that their enolisation was through intramolecular
catalysis. This intramolecular catalysis usually happens within compounds
which contain acidic and basic groups at certain positions to the carbonyl group
in the same molecule. These acidic or basic groups may function as catalysts as
the extemal acids and bases do in the intermolecular catalysis.
1.4. Halogenation of enols
When the keto form is converted to the enol or enolate, the latter become the
reactive forms in which electrophilic addition can occur.
Halogenation is one of the best known examples of electrophilic addition
reaction on enol or enolate. Halogenation can be carried out directly by the
halogen molecule X2 and the trihalide species X3" in acid or by X2, Xy, OX'
in base due to hydrolysis of halogen. Halogen molecules are the most widely
used reagents.
Halogenation of ketones in acid and base solution is well known to proceed
by the pathway shown in equations 1.6 and 1.7. In addition, the electrophilic
addition of halogen to the enol or enolate has also been known to be a two step
process, as in the example of equation 1.8.
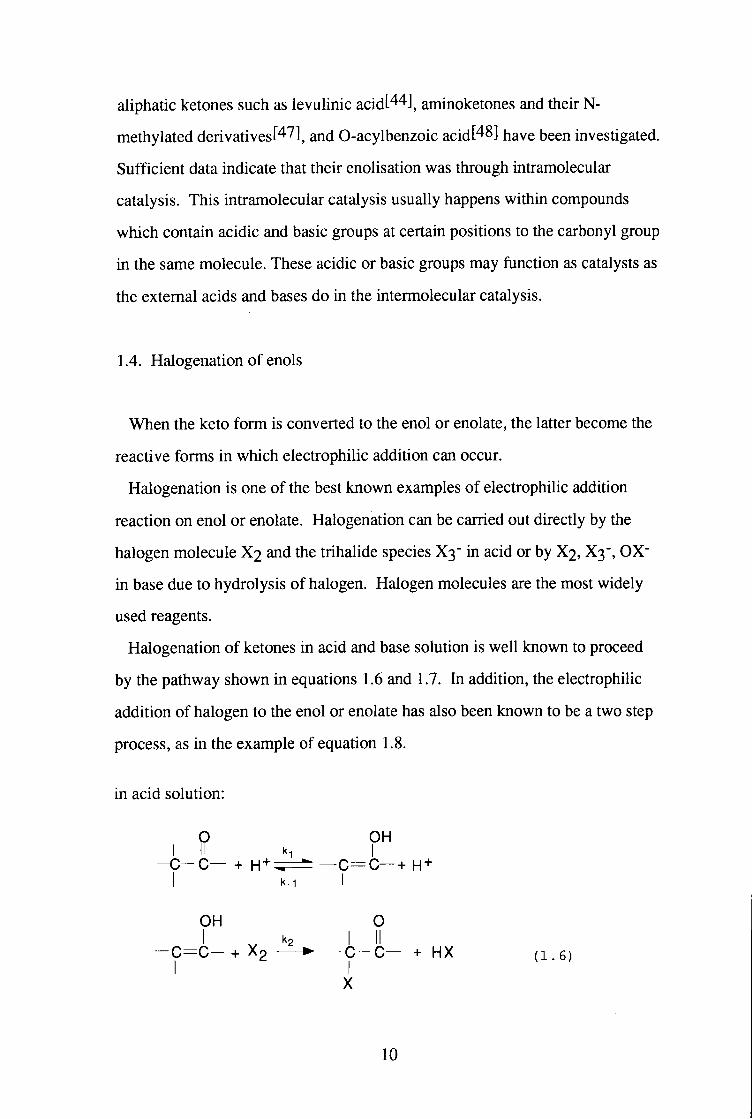
in acid solution:
p OH I H ki I
- C - C — + H + ^ ^ — C = C — + H + I k-1 I
OH 0 I ^ k2 I II
- C = C " + X 2 • - C - C — + HX (1 6)
10
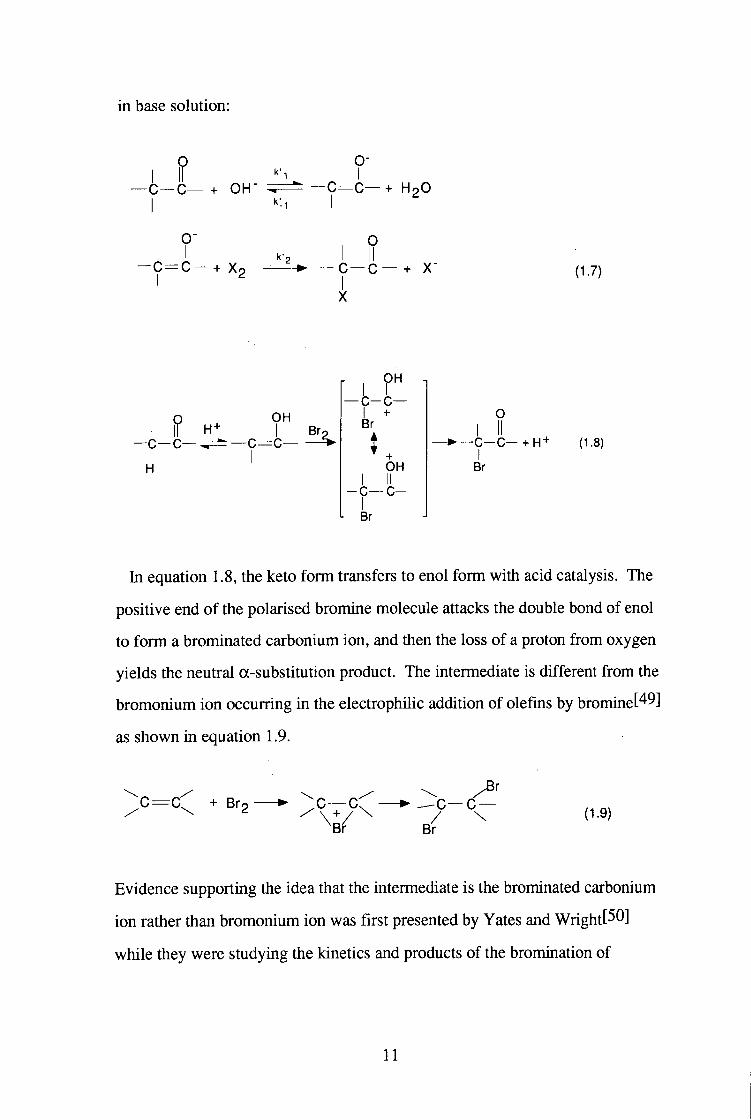
in base solution:
— C — C — + OH- ^
o-i
- C = C — + HgO
—C = C— + X. c — c — + X-
X
(1.7)
- c — c -I
H
O H
— C = C — Br.
• 1 ?" — c - c —
+ Br
t OH
C -I Br
O
- C - C - + H + I
Br
(1.8)
In equation 1.8, the keto form transfers to enol form with acid catalysis. The
positive end of the polarised bromine molecule attacks the double bond of enol
to form a brominated carbonium ion, and then the loss of a proton from oxygen
yields the neutral ot-substitution product. The intermediate is different from the
bromonium ion occurring in the electrophilic addition of olefins by brominet'^9]
as shown in equation 1.9.
+ Br-: (1.9)
Evidence supporting the idea that the intermediate is the brominated carbonium
ion rather than bromonium ion was first presented by Yates and Wright[50]
while they were studying the kinetics and products of the bromination of
11
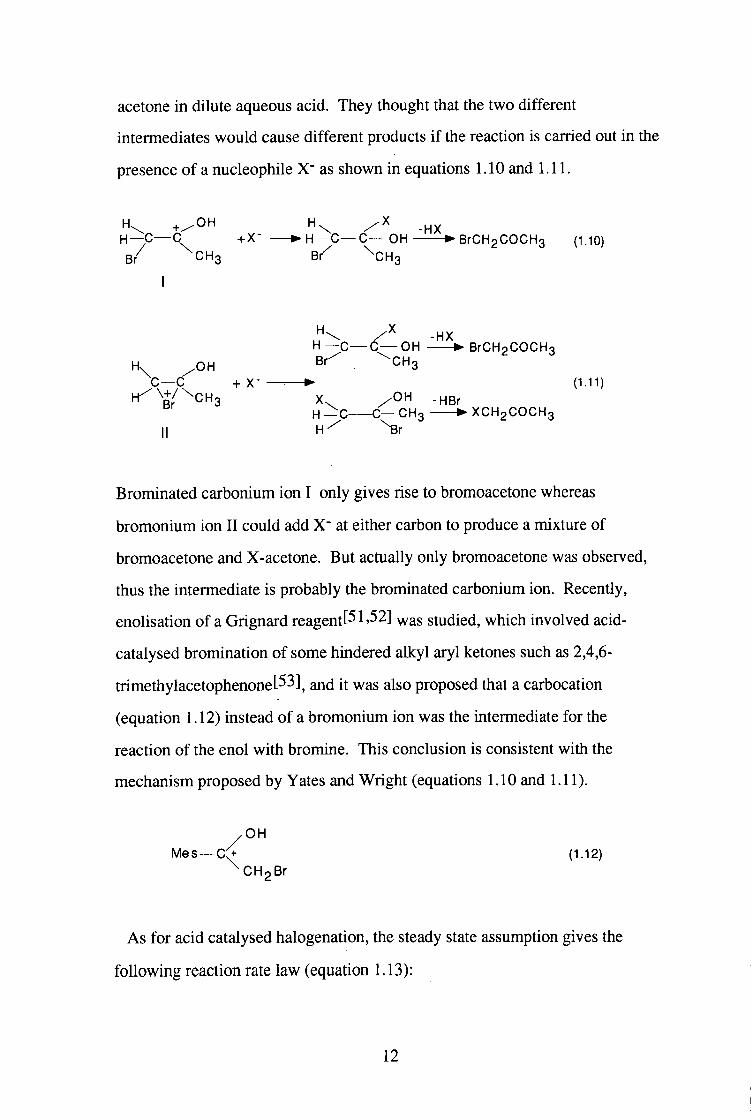
acetone in dilute aqueous acid. They thought that the two different
intermediates would cause different products if the reaction is carried out in the
presence of a nucleophile as shown in equations 1.10 and 1.11.
H \ + / 0 H H — C — C +X- • H — C — C — O H • B r C H g C O C H s (l.lO)
B / ^ C H g Br^ ^CHg
I
-HX H — C — C — O H • BrCH2COCH3
Hx .OH ^"^3 C — C + X- • (1.11)
H ^ \ + / ^ C H 3 X . / O H .HBr H - C C - C H 3 • X C H 2 C O C H 3
M H-^ ^ r
Brominated carbonium ion I only gives rise to bromoacetone whereas
bromonium ion I I could add X" at either carbon to produce a mixture of
bromoacetone and X-acetone. But actually only bromoacetone was observed,
thus the intermediate is probably the brominated carbonium ion. Recently,
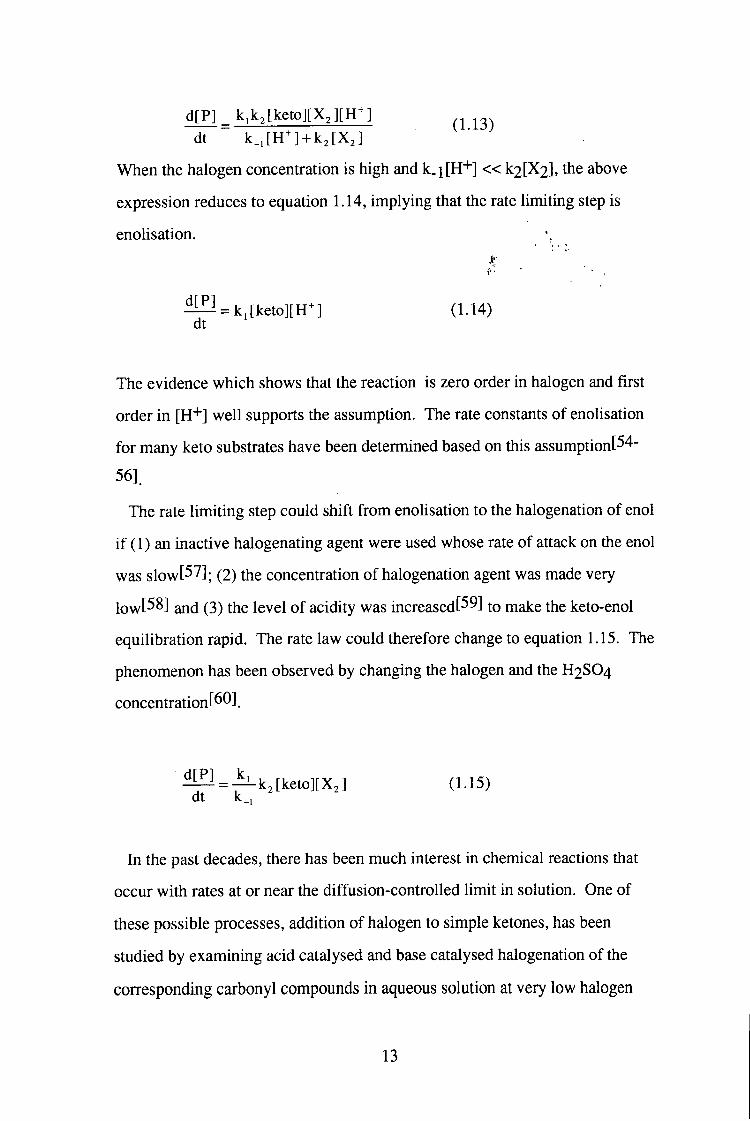
enolisation of a Grignard reagentt^l'^2] was studied, which involved acid-
catalysed bromination of some hindered alkyl aryl ketones such as 2,4,6-
trimethylacetophenone[53]^ and it was also proposed that a carbocation
(equation 1.12) instead of a bromonium ion was the intermediate for the
reaction of the enol with bromine. This conclusion is consistent with the
mechanism proposed by Yates and Wright (equations 1.10 and 1.11).
. O H M e s — 0 + (1.12)
^ C H g B r
As for acid catalysed halogenation, the steady state assumption gives the
following reaction rate law (equation 1.13):
12
d[P] ^ k,k Jketo][X J[Hn dt k_,[Hn + k , [ X J
When the halogen concentration is high and k.i[H"'"] « k2[X2], the above
expression reduces to equation 1.14, implying that the rate limiting step is
enolisation.
^ = k,[keto][Hn (1.14) dt
The evidence which shows that the reaction is zero order in halogen and fu-st
order in [H+J well supports the assumption. The rate constants of enolisation
for many keto substrates have been determined based on this assumption[54-
56].
The rate limiting step could shift from enolisation to the halogenation of enol
i f (1) an inactive halogenating agent were used whose rate of attack on the enol
was slow[57]; (2) the concentration of halogenation agent was made very
low[58] and (3) the level of acidity was increased[59] to make the keto-enol
equilibration rapid. The rate law could therefore change to equation 1.15. The
phenomenon has been observed by changing the halogen and the H2SO4
concentration[60].
^ = - ^ k J k e t o ] [ X J (1.15) dt k_i
In the past decades, there has been much interest in chemical reactions that
occur with rates at or near the diffusion-controlled limit in solution. One of
these possible processes, addition of halogen to simple ketones, has been
studied by examining acid catalysed and base catalysed halogenation of the
corresponding carbonyl compounds in aqueous solution at very low halogen
13
concentration where the halogenation step is rate limiting. Dubois and
TouUect^l] studied the kinetics of the bromination, chlorination and iodination
of acetone at low halogen concentration (lO^^ to lO'^M) and found that the enol
halogenation rate constants kQbs (kobs=KEk2) were approximately equal. This
result was attributed to diffusion controlled kinetics and led to the new values of
K g of acetone in solution (1.5xlO"8), which was based on the diffusion
controlled value (10^ M'^S ' l ) of the enol halogenation rate constant. The Kg
values is much smaller than that ( 2.5x10⁻⁶) obtained by Schwarzenbach[ll] by
the flow method, but is likely to be more reliable. Later, Dubois and Toullec
applied this method to the determination of Kg values of other simple
ketonest^^]^ cycloalkanones[63]^ and ring-substituted acetophenones.
More accurate values of K g were determined by using flash photolytic
method. The new values of rate constants for enol halogenation calculated on
the new Kg values were slightly lower than the diffusional limitt^^] ^^is
implies that the substrate structure has some effect on the rate constant of
halogenation. Nevertheless, the Dubois-Toullec approach can be considered
qualitatively correct.
Base catalysed halogenation of ketone in buffered alkaline solution has been
studied despite the instability and complexity of the halogenating species in
alkaline solution[65]. Bartlett[66] has determined the rate constants of the
chlorination of ketones at pH 11, and the reaction of hypobromite with acetone
has also been examined in alkaline solution[67]. Guthrie and coworkerst^^]
determined the rate constants for hypobromite and hypochlorite reaction with
acetone in alkali and estimated the Kg of acetone. Tapuli and Jencks[69] have
examined the kinetics of iodtnation and bromination of acetone in basic aqueous
solution buffered with trifluoroethanol under conditions at which halogenation
of the enolate ion is the rate limiting step. With the assumption of diffusion
controlled halogenation of the enolate ion by I2 and HOBr with k= 5x10^ M"!
S'^, rate constants for other halogenating agents such as BrO', 10", lOH and I3'
14
were calculated. Their results are similar to those obtained by Guthrie and
coworkers.
1.5. C-nitrosation involving enol
Nitrosation is a reaction introducing -NO bound to nitrogen, oxygen, carbon
or sulphur atom in some molecules. This process involves electrophilic attack
hke halogenation. The reaction of nitrosation has been studied for more than
one century. Piria in 1846[^0] and Hofman in 18501^1] nitrosated ahphatic
primary amines and aromatic amines, respectively. In 1873[^2]^ Victor Meyer
paid first attention to nitrosation at carbon, and produced nitrolic acids from
aliphatic nitrocompounds. Since then nitrosation chemistry including synthesis
of nitrosation products and mechanisms of these reactions has been well
examined. Now many nitrosation reactions have become standard procedures
both in the laboratory and on the industrial scale. For instance, e-caprolactam is
produced by the nitrosation of cyclohexane derivativest^^] and alkyl nitrites,
and metal nitrosyl complexes are used as vasodilators in medicinet^^]
In the early work, main interest lay m N-nitrosation. Later, the area extended
to O-nitrosation and S-nitrosation. More recently, much interest has focused on
the kinetic study of C-nitrosation.
1.5.1. Nitrosating species
Nitrous acid is the most widely used reagent in nitrosation. Solution of
nitrous acid can be routinely made from the combination of sodium nitrite (or
any other nitrite salt) and aqueous mineral acids. Nitrous acid is a weak acid
with a pK^ of 3.148 at 25°C[^5]. in the presence of acid, aqueous nitrous acid
decomposes quite readily (equation 1.16). This is the reason why the solutions
need to be used immediately.
15
3HN02 ^ . = ^ 2 N 0 + HNO3 + HgO (.,^5)
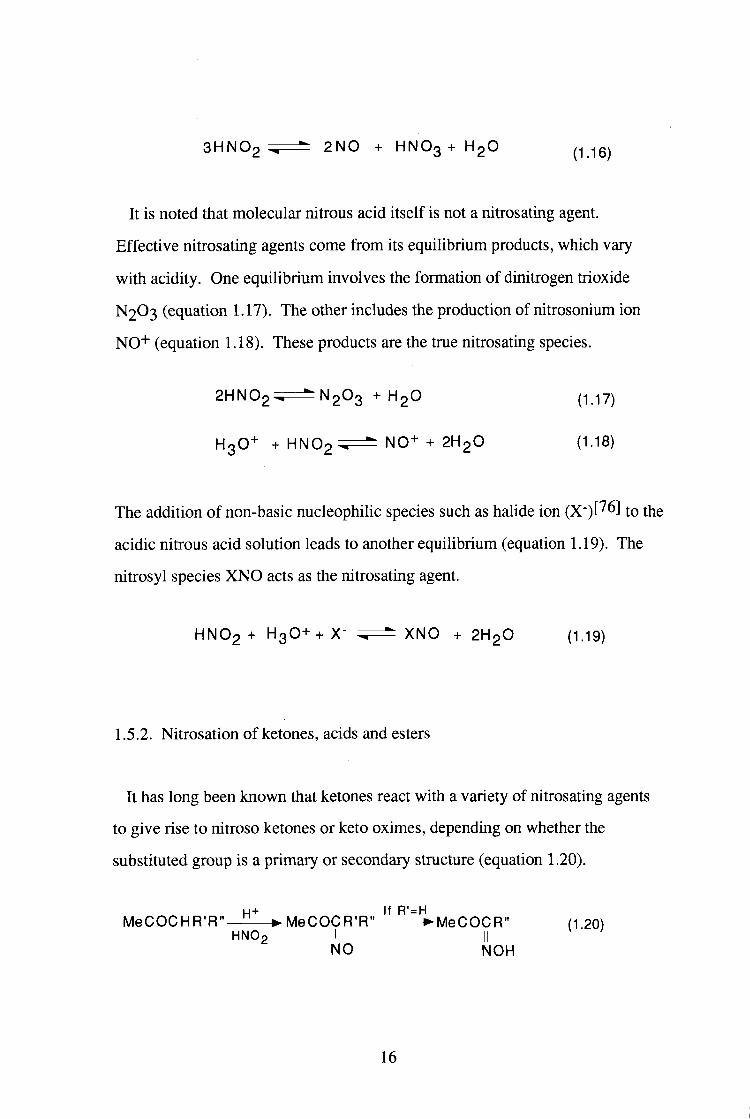
It is noted that molecular nitrous acid itself is not a nitrosating agent.
Effective nitrosating agents come from its equilibrium products, which vary
with acidity. One equilibrium involves the formation of dinitrogen trioxide
N2O3 (equation 1.17). The other includes the production of nitrosonium ion
NO"*" (equation 1.18). These products are the true nitrosating species.
2HN02=.^=^N203 + H2O (1.17)
H3O+ + H N O g ^ F ^ N0+ + 2H2O (1.18)
The addition of non-basic nucleophilic species such as hahde ion (X")[^6] to the
acidic nitrous acid solution leads to another equihbrium (equation 1.19). The
nitrosyl species XNO acts as the nitrosating agent.
HNO2 + H3O++ X- XNO + 2H2O (1.19)
1.5.2. Nitrosation of ketones, acids and esters
It has long been known that ketones react with a variety of nitrosating agents
to give rise to nitroso ketones or keto oximes, depending on whether the
substituted group is a primary or secondary structure (equation 1.20).
MeCOCHR'R"—f^MeCOCR'R" " •MeCOCR" (1 20) HNOp I il
NO NOH
16
The reaction is quite general and occurs very readily at room temperature when
using nitrous acid, alkyl nitrites, nitrosyl halides or dinitrogen trioxide.
Although the nitrosation of ketone has been widely used for synthesis process,
the studies on the reaction mechanisms started only in the past decade.
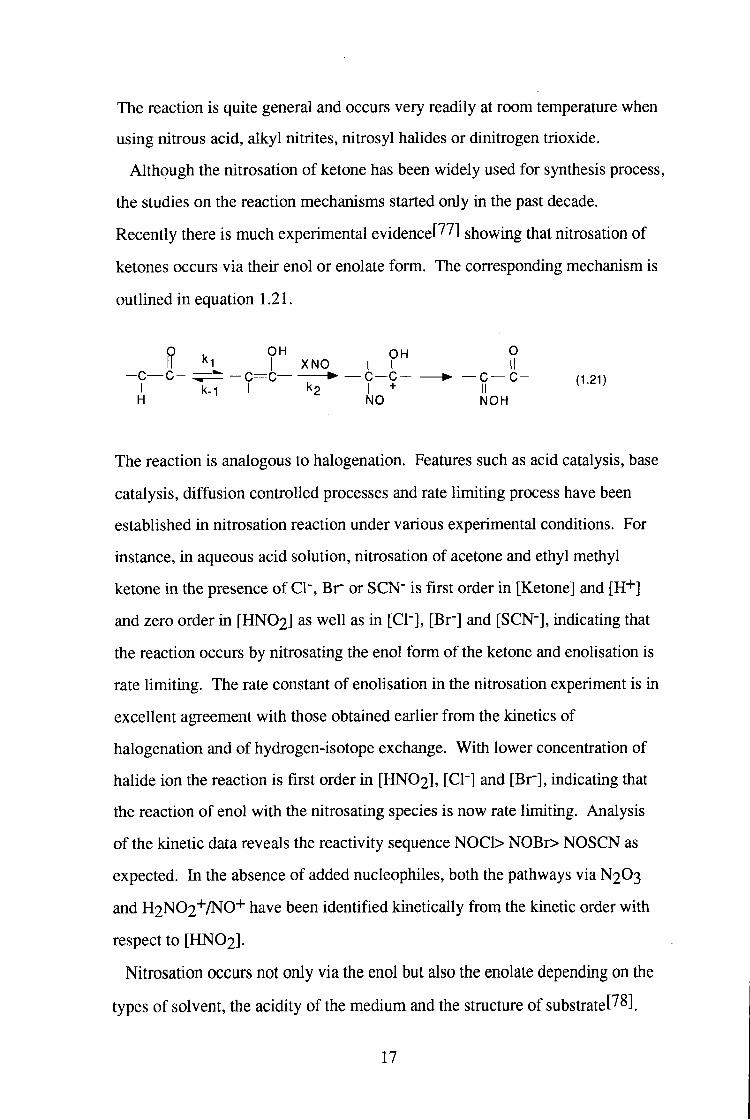
Recently there is much experimental evidencet^^] showing that nitrosation of
ketones occurs via their enol or enolate form. The corresponding mechanism is
outiined in equation 1.21.
Q u O H O H O H I x N o I r I I
- C — C - — C — C C — C • — C — C - (121) I k-1 I k2 I + II ^'•'''>
H NO N O H
The reaction is analogous to halogenation. Features such as acid catalysis, base
catalysis, diffusion controlled processes and rate limiting process have been
established in nitrosation reaction under various experimental conditions. For
instance, in aqueous acid solution, nitrosation of acetone and ethyl methyl
ketone in the presence of CI", Br" or SCN" is first order in [Ketone] and [H+]
and zero order in [ H N O 2 ] as well as in [CI"], [Br"] and [SCN"], indicating that
the reaction occurs by nitrosating the enol form of the ketone and enolisation is
rate limiting. The rate constant of enohsation in the nitrosation experiment is in
excellent agreement with those obtained earlier from the kinetics of
halogenation and of hydrogen-isotope exchange. With lower concenti-ation of
halide ion the reaction is first order in [ H N O 2 ] , [CL] and [Br"], indicating that
the reaction of enol with the nitrosating species is now rate limiting. Analysis
of the kinetic data reveals the reactivity sequence N 0 C 1 > NOBr> NOSCN as
expected. In the absence of added nucleophiles, both the pathways via N 2 O 3
and H2N02"^/NO+ have been identified kinetically from the kinetic order with
respect to [ H N O 2 ] .
Nitrosation occurs not only via the enol but also the enolate depending on the
types of solvent, the acidity of the medium and the structure of substi-atet^^].
17
Dimedonet^^] as a cycUc diketone was studied. The kinetic data confirmed the
existence of enol and enolate as intermediates, and their ratio varied with the
acidity of the medium. At 0.0IM H"*", 60% of the reaction occurs via the
enolate whereas at O.IM H+, this drops to caA3%. In this case, the enolate is
much more reactive than enol, and the former reacts in an encounter controlled
process when CINO and BrNO were used as nitrosating species. Similar results
were obtained for the reaction of the enolate ion derived from 1,1,1-
trifluoropentane-2,4-dione.
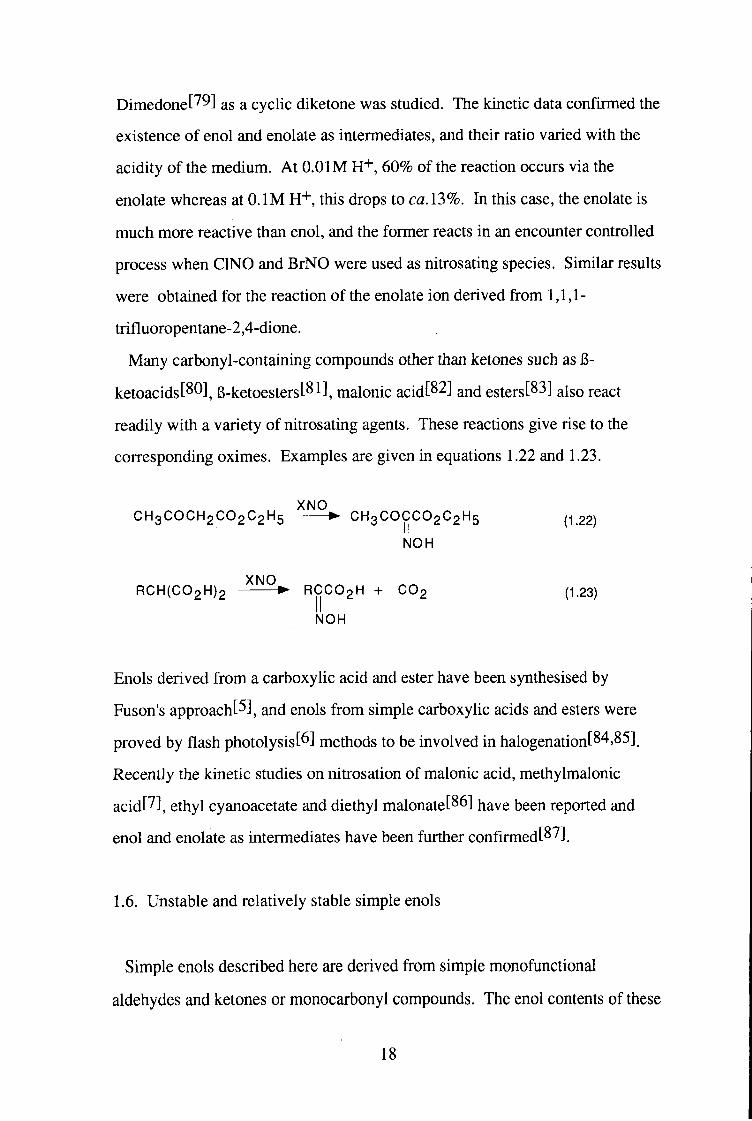
Many carbonyl-containing compounds other than ketones such as 6-
ketoacidst^O], B-ketoesterst^^J, malonic acidf^^jl and esterst^^] also react
readily with a variety of nitrosating agents. These reactions give rise to the
corresponding oximes. Examples are given in equations 1.22 and 1.23.
C H 3 C O C H 2 C O 2 C 2 H 5 ^ ^ ^ p , C H 3 C O C C O 2 C 2 H 5 (1.22)
NOH
R C H ( C 0 2 H ) 2 R C C O 2 H + C O 2 (1.23)
NOH
Enols derived from a carboxylic acid and ester have been synthesised by
Fuson's approach[5], and enols from simple carboxyhc acids and esters were
proved by flash photolysist^] niethods to be involved in halogenation[84,85]
Recently the kinetic studies on nitrosation of malonic acid, methylmalonic
acid[7], ethyl cyanoacetate and diethyl malonate[86] ^ave been reported and
enol and enolate as intermediates have been further confirmedt^^].
1.6. Unstable and relatively stable simple enols
Simple enols described here are derived from simple monofunctional
aldehydes and ketones or monocarbonyl compounds. The enol contents of these
18
compounds are quite low and on the order of ppm or even ppb. This is because
most simple enols are unstable thermodynamically with respect to their keto
tautomers and tend to convert to their keto form immediately. Therefore, such
enols usually can not be observed directly in an equilibrium mixture even by
sensitive spectroscopic methods.
The kinetics of the enolisation of monocarbonyl compounds have been
extensively studied[^^'^9]_ Three methods have been most widely used: (1)
trapping the enol with halogen and measuring the disappearance of the latter, (2)
measuring the exchange of the a-hydrogen with a deuterium or tritium label,
and (3) measuring the racemisation of a carbonyl compound with an asymmetric
a-carbon. However, the reverse reaction, the ketonisation of enols, has been
less extensively studied owing to the difficulty in obtaining simple enols, so the
accurate data on the equilibrium constants Kg for simple enols were relatively
scarce in the early works.
In the past decade, the progress in the preparation of simple enois makes it
possible to use a direct method to study the rates of enohsation and
ketonisation. Combination of the ketonisation rate constant with the enolisation
rate constant of the ketone yields accurate Kg values. A number of simple
enols have been formed under different conditions and characterised[90-92] hy
NMR, IR, and CIDNP. The generation of simple enols are based on some
methods which retard or prevent the enol from transferring to keto. One of the
methods is to stabilise enol by the introduction of bulkyl groups like mesityl
onto the a-carbon to the carbonyl group to generate kinetically and
thermodynamically stable tautomer. The best example of aryl-substituted stable
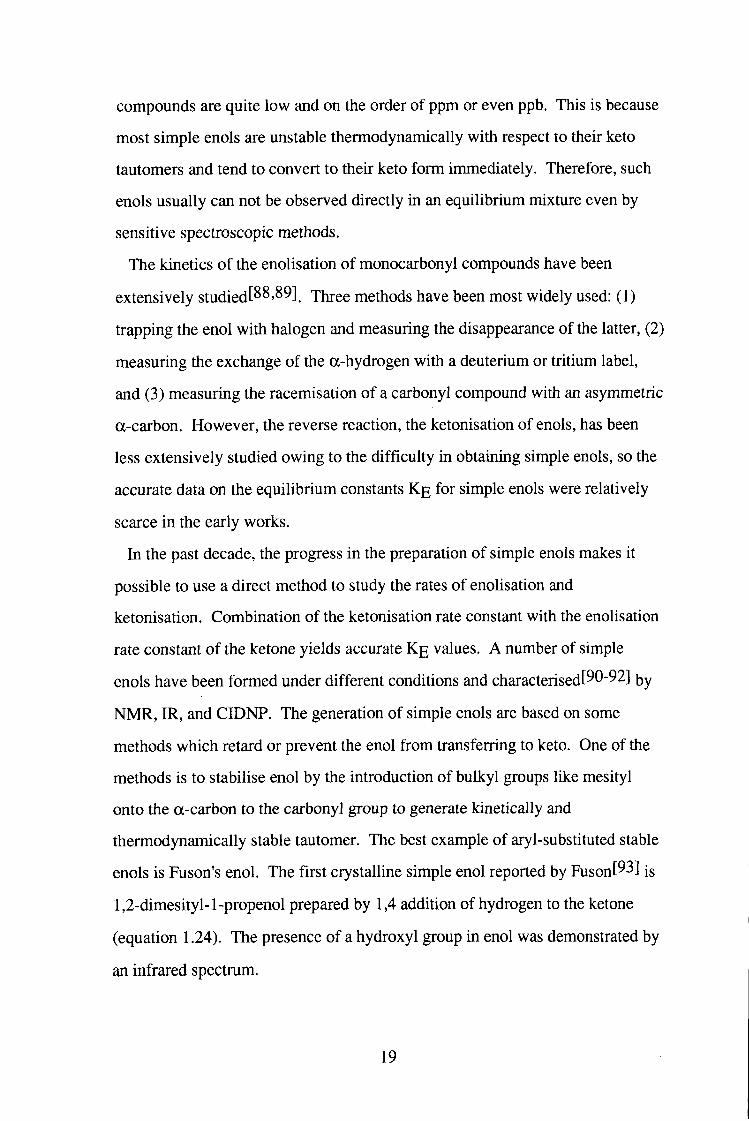
enols is Fuson's enol. The first crystalline simple enol reported by Fusonf^^]
1,2-dimesityl-l-propenol prepared by 1,4 addition of hydrogen to the ketone
(equation 1.24). The presence of a hydroxyl group in enol was demonstrated by
an infrared spectrum.
19
H2 Mes^ / O H CHp — C ( M e s ) C O M e s • (124)
2 Pt/EtOH Me-^ "-Mes ^ '
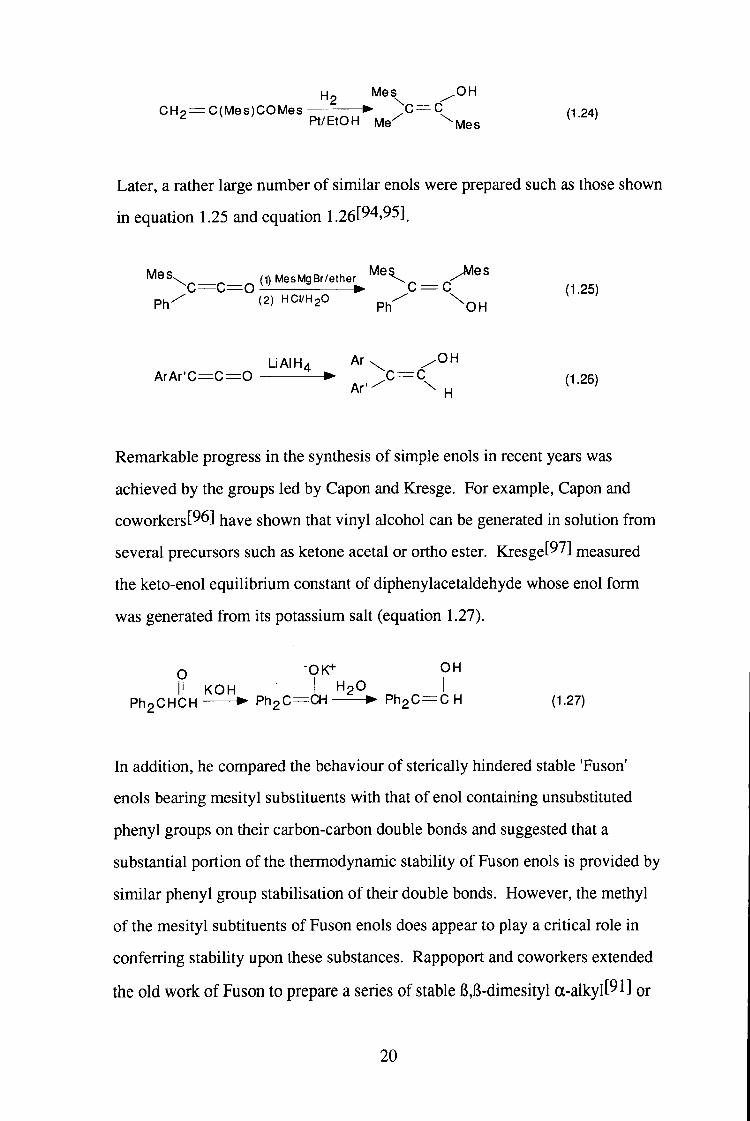
Later, a rather large number of similar enols were prepared such as those shown
in equation 1.25 and equation 1. 26[94,95].
M e S \ ^ ^ (DMesMgBr /e ther ^ ^ ^ V ^ ^ ^ ^ ^ ^ C = C = 0 ~ = • C = C (1.25)
p h / ( 2 ) H C , / H 2 0
LiAIH4 Ar - . ^ O H A r A r ' C = C = 0 ^—^ / C = C (1.26)
Remarkable progress in the synthesis of simple enols in recent years was
achieved by the groups led by Capon and Kresge. For example, Capon and
coworkers [96] have shown that vinyl alcohol can be generated in solution from
several precursors such as ketone acetal or ortho ester. Kresge[97] nieasured
the keto-enol equilibrium constant of diphenylacetaldehyde whose enol form
was generated from its potassium salt (equation 1.27).
O •0K+ OH II K O H I HgO I
P h g C H C H • P h 2 G = C H • P h g C ^ C H (1.27)
In addition, he compared the behaviour of sterically hindered stable 'Fuson'
enols bearing mesityl substituents with that of enol containing unsubstituted
phenyl groups on their carbon-carbon double bonds and suggested that a
substantial portion of the thermodynamic stability of Fuson enols is provided by
similar phenyl group stabilisation of their double bonds. However, the methyl
of the mesityl subtituents of Fuson enols does appear to play a critical role in
conferring stability upon these substances. Rappoport and coworkers extended
the old work of Fuson to prepare a series of stable B,6-dimesityl a-alkylt^l] QI-
20
a-aryl enols t ^ ^ i and measured their keto-enol equilibrium constants Kg in
hexane. They found that in the aliphatic substituted series. Kg decreased along
the series H> Me>Et>i-Pr >t-Bu. In contrast, in the aromatic series Kg
increased on increasing the bulk of the a-aryl group. This is because the
combined steric and polar effects of aliphatic and aromatic substituents on Kg
values are opposite. The electron withdrawal on the a-aryl group increases Kg
value due mainly to the destabilisation of the ketone. The main effect of a-
alkyl group on the change in Kg values is steric. The polar effects are either
small or constant along the series.
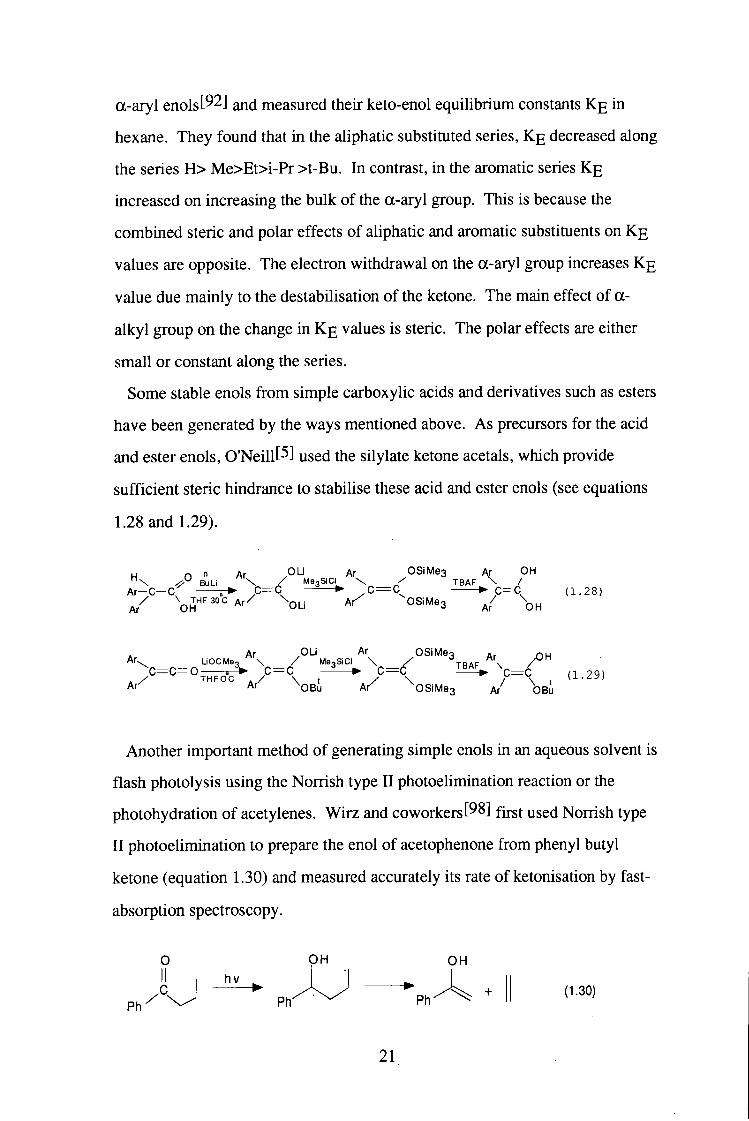
Some stable enols from simple carboxylic acids and derivatives such as esters
have been generated by the ways mentioned above. As precursors for the acid
and ester enols, O'Neillt^J used the silylate ketone acetals, which provide
sufficient steric hindrance to stabilise these acid and ester enols (see equations
1.28 and 1.29).
n n Ar Ol-i Ar OSiMea Ar OH
A r - C - C ; ^ .C=^C • / C = C ^ C = C . ( 1 . 2 8 ) A / ^ o r ^ ^ ' A r / ^ O L i A r ^ OSiMeg / \ ^
Ar .OLi Ar OSiMe-a o n
Ar'^ Ar' ^Osi AK ^OSiMeg Ar Osi
Another important method of generating simple enols in an aqueous solvent is
flash photolysis using the Norrish type II photoelimination reaction or the
photohydration of acetylenes. Wirz and coworkers[^8] fy-st used Norrish type
I I photoelimination to prepare the enol of acetophenone from phenyl butyl
ketone (equation 1.30) and measured accurately its rate of ketonisation by fast-
absorption spectroscopy.
0 OH OH
21
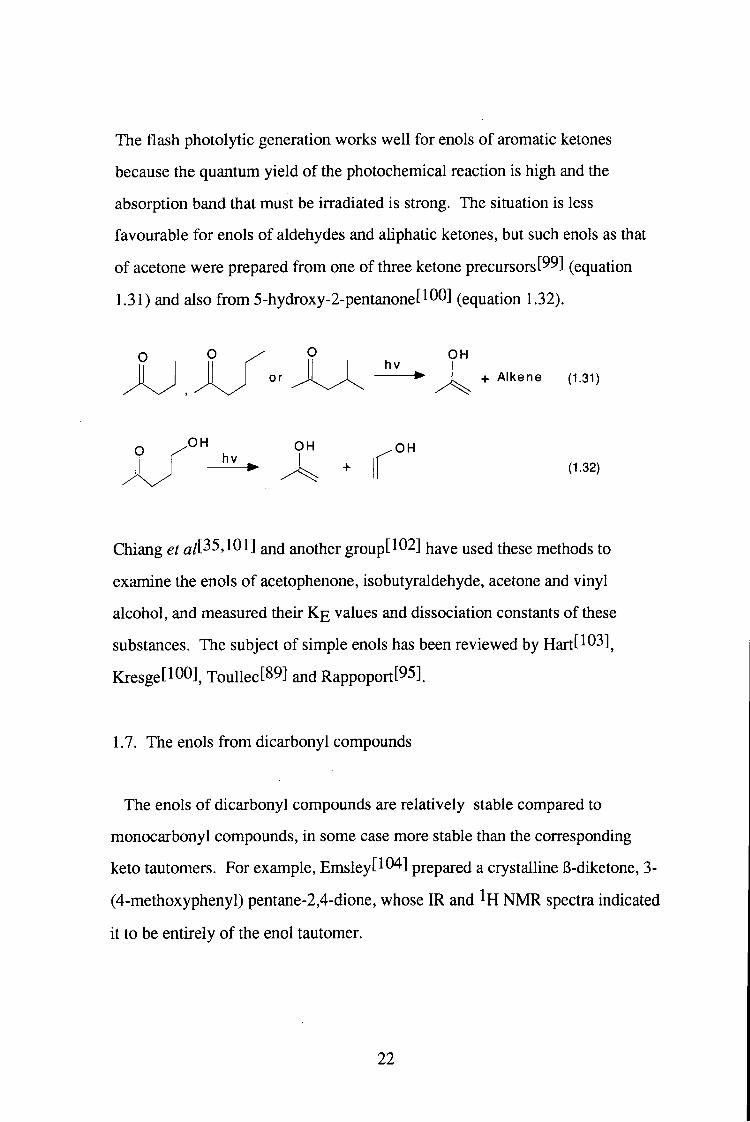
The flash photolytic generation works well for enols of aromatic ketones
because the quantum yield of the photochemical reaction is high and the
absorption band that must be irradiated is strong. The situation is less
favourable for enols of aldehydes and ahphatic ketones, but such enols as that
of acetone were prepared from one of three ketone precursors[99] (equation
1.31) and also from 5-hydroxy-2-pentanone[100] (equation 1.32).
OH
+ Alkene (1.31)
OH OH
+ f (1.32)
Chiang et a/[35,101] and another group[102] have used these methods to
examine the enols of acetophenone, isobutyraldehyde, acetone and vinyl
alcohol, and measured their Kg values and dissociation constants of these
substances. The subject of simple enols has been reviewed by Hart[103]^
Kresge[100], Toullec[89] and Rappoport[95].
1.7. The enols from dicarbonyl compounds
The enols of dicarbonyl compounds are relatively stable compared to
monocarbonyl compounds, in some case more stable than the corresponding
keto tautomers. For example, Emsley[104] prepared a crystalline 6-diketone, 3-
(4-methoxyphenyl) pentane-2,4-dione, whose IR and ^H NMR spectra indicated
it to be entirely of the enol tautomer.
22
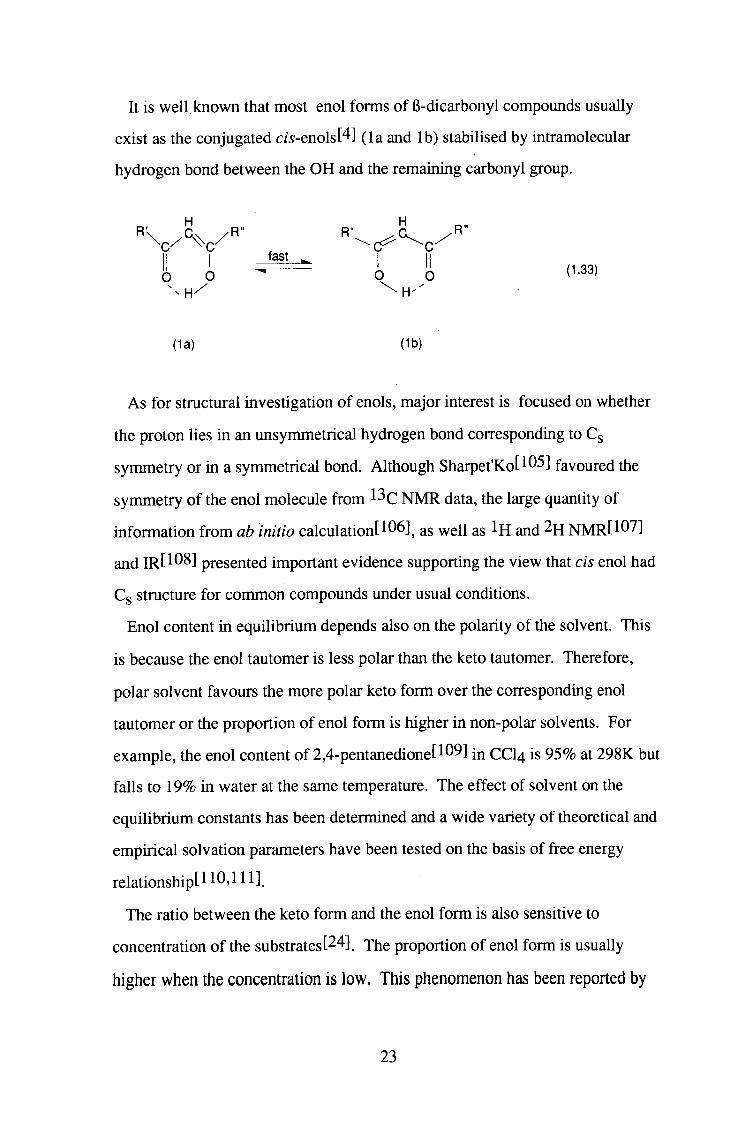
It is well known that most enol forms of 6-dicarbonyl compounds usually
exist as the conjugated cw-enols[4] (la and lb) stabilised by intramolecular
hydrogen bond between the OH and the remaining carbonyl group.
fast ^ '6 0 6 b ( -33)
(la) (lb)
As for structural investigation of enols, major interest is focused on whether
the proton lies in an unsymmetrical hydrogen bond corresponding to Cg
symmetry or in a symmetrical bond. Although Sharpet'Ko[105] favoured the
symmetry of the enol molecule from l^c N M R data, the large quantity of
information from ab initio calculation[106]^ as well as ^H and ^H NMR[107]
and IR[108] presented important evidence supporting the view that cis enol had
Cg structure for common compounds under usual conditions.
Enol content in equilibrium depends also on the polarity of the solvent. This
is because the enol tautomer is less polar than the keto tautomer. Therefore,
polar solvent favours the more polar keto form over the corresponding enol
tautomer or the proportion of enol form is higher in non-polar solvents. For
example, the enol content of 2,4-pentanedione[109] in CCI4 is 95% at 298K but
falls to 19% in water at the same temperature. The effect of solvent on the
equilibrium constants has been determined and a wide variety of theoretical and
empirical solvation parameters have been tested on the basis of free energy
relationship[110'lll].
The ratio between the keto form and the enol form is also sensitive to
concentration of the substrates[^4]. The proportion of enol form is usually
higher when the concentration is low. This phenomenon has been reported by
23
another groupt^^^l. In addition, the enol content generally decreases as the
temperature increases due to the disruption of hydrogen bonds[l 14,115] .
The effect of substituent on B-dicarbonyls of the typical formula
R 1 C O C H R 2 C O R 3 is more comphcated than that of solvent effects due to
competition between factors stabilising and destabihsing the keto and enol
groups. K g values depend on interaction between R 2 and R1 or R 3 , and the a-
substituent effect is usually higher than 7-substituent effect. It is known that a-
alkyl substituent (R2=Me, Pr, Bu, Et) dramatically reduces the enol
contenttl 16-118] and the enol content decreases as R ^ bulk expands although
intramolecular hydrogen bond proved to be slightly stronger in the substituted
product (R^^H) than m the unsubstituted one ( R 2 = H ) [ 1 19]. This result may be
explained on a combination of the steric effects and inductive effects. The
electron density in the vicinity of the a-proton should be enhanced by the
substitution of alkyl groups at the a-position. For both B-diketonesH^O] and 6-
ketoesters[121], substitution of electron-withdrawing group such as chlorine at
the position ( R 2 = C 1 ) results in the increase of the enol tautomer. However,
bromine causes a marked decrease in enolisation. This is because the latter has
a predominant steric effect. a-Aryl substituent[122] increases the enol content
probably due to resonance stabilisation of the enol tautomer. 7-
Substituents[121] usually have only a little effect. It is knovra that the
equilibrium moves in favour of the enol tautomer as the electron-withdrawing
group is substituted at the 7-position.
2 4
References
1. A.Lapworth, / . Chem. Soc, 85, 30 (1904).
2. R.P.Bell, Acid-Base Catalysis, Oxford University Press, London, pp. 69-91,
135-143 (1941).
3. R.P.Bell, The Proton in Chemistry, Cornell University Press, Ithaca, New
York, pp. 149-154 (1973).
4. Z.Rappoport, The Chemistry of Ends, John Wiley & Sons, New York,
pp. 1-75, 323-398, 399-481 (1990).
5. P.O'Neill and A.F.Hegarty, / . Chem. Soc, Chem. Commun., 744 (1987).
6. Y.Chiang, A.J.Kresge, P.Pruszynski, N.R.Schepp and J.Wirz, Angew.
Chem., Int. Ed. Engl, 29, 792 (1990).
7. A.Graham and D.L.H.Williams, / . Chem. Soc, Chem. Commun., 407
(1991).
8. K.H.Meyer, Ann. Chem., 380, 212 (1911).
9. J.B.Conant and A.F.Thompson, / . Am. Chem. Soc, 54, 4039 (1932).
10. K.H.Meyer, Chem. Ber., 45, 2843 (1912); 47, 826 (1914).
11. G.Schwarzenbach and C.Wittwer, Helv. Chim. Acta, 30, 656 (1947).
12. A.Gero, / . Org. Chem., 26, 3156 (1961).
13. R.Brouillard and J-E.Dubois,/. Org. Chem., 39, 1137 (1974).
14. M.Dreyfus and F.Gamier, Tetrahedron, 30, 133 (1974).
15. Y.Chiang, A.J.Kresge and P.Pruszynski, / . Am. Chem. Soc, 114,
3103 (1992).
16. N.L.Allinger, L.W.Chow and R.A.Ford, / . Org. Chem., 32, 1994 (1967).
17. J.Hine and K.Arata, Bull. Chem. Soc. Jpn., 49, 3085 (1976).
18. R.K.Harris and R.C.Rao, Org. Magn. Reson., 21, 580 (1983).
19. M.M.Folkendt, B.E.Weiss-Lopez, J.P.Chauvel,Jr., and N.S.True,/. Phys.
Chem., 89, 3347 (1985).
20. J.B.Conant and A.F.Thompson, Jr., J. Am. Chem. Soc, 54, 4039 (1932).
25
21. H.S.Jarrett, M.S.Sadler and J.N.Shoolery, / . Chem. Phys.,21, 2092 (1953).
22. M.Bassetti, G.Cerichelli and B.Floris, Tetrahedron 44, 2997 (1988).
23. K.I.Lazaar and S.H.Bauer, / . Phys. Chem., 87, 2411 (1983).
24. S.G.Mills and P.Beak,/. Org. Chem., 50, 1216 (1985).
25. S.J.Rhoads and C.Pryde, J. Org. Chem., 30, 3212 (1965).
26. M.M.Naoum and G.R.Saad, Indian J. Chem., 26A, 510 (1987).
27. G.Hesse and G.Krehbiel, Ann. Chem., 35, 593 (1955).
28. M.Moriyasu, A.Kato and Y.Hashimoto, Bull. Chem. Soc. Jpn., 61,
2955 (1988).
29. J.TouUec and J.E.Dubois, Tetrahedron, 29, 2851 (1973).
30. J.P.Guthrie, Can. J. Chem., 57, 797 (1979).
31. J.P.Guthrie and P.A.CuUimore, Can. J. Chem., 57, 240 (1979).
32. J.R.Keeffe, A.J.Kresge and N.P.Schepp, / . Am. Chem. Soc, 110,
1995 (1988).
33. A.Gero, / . Org. Chem., 19, 1960 (1954).
34. J-E.Dubois, M.EI-Alaoui and J.Toullec, / . Am. Chem. Soc, 103,
5393 (1981).
35. Y.Chiang, A.J.Kresge and J.Wirz, / . Am. Chem. Soc, 106, 6392 (1984).
36. H.M.Dawson, C.R.Hoskins and J.E.Smith, / . Chem. Soc, 1884, (1929)
and earlier papers.
37. R.P.Bell and O.M.Lidwell, Proc. R. Soc. London, SerA, 176, 88 (1940).
38. S.Venimadhavan, K.P.Shelly and R.Stewart,/. Org. Chem., 54,
2483 (1989).
39. K.P.Shelly, K.Nagarajan and R.Stewart, Can. J. Chem., 65, 1734 (1987).
40. K.J.Pedersen,/. Phys. Chem., 38, 581 (1934).
41 . G.E.Lienhard and T.C.Wang,/. Am. Chem. Soc, 91, 1146 (1969).
42. J.E.Dubois and J.Toullec, / . Chem. Commun., 478 (1969).
43. O.Reitz,Z. Phys. Chem., 179, 119 (1937).
44. R.P.Bell and A.D. Covington, / . Chem. Soc, Perkin 2, 1343 (1975).
26
45. J.R.Keeffe, A.J.Kresge and J.Toullec, Can. J. Chem., 64, 1224 (1984).
46. Y.Chiang, A.J.Kresge and N.P.Schepp, / . Am. Chem. Soc, 111, 3977
(1989).
47. B.G.Cox and P.D.Maria and L.Guerzoni, / . Chem. Soc, Perkin 2,
163 (1988).
48. E.T.Harper and M.L.Bender,/. Am. Chem. Soc, 87, 5625 (1965).
49. J.McMurry, Organic Chemistry, Brooks/Cole Publishing Company,
Monterey, Cahfomia, pp. 159 (1984).
50. K.Yates and W.V.Wright, Can. J. Chem., 41, 2882 (1963).
51. A.G.Pinkus and W.C.Servoss, / . Chem. Soc, Perkin 2, 1600 (1979).
52. A.G.Pinkus and R.Gopalan, Tetrahedron, 42, 3411 (1986).
53. A.G.Pinkus and R.Gopalan, / . Am. Chem. Soc, 106, 2630 (1984).
54. Y.Chiang, M.Hojatti, J.R.Keeffe, A.J.Kresge, N.P.Schepp and J.Wirz,
J. Am. Chem. Soc, 109, 4000 (1987).
55. K.S.Vasudevan and N.Venkatabramanian, Indian J. Chem., SerA, 24A,
304 (1985).
56. M.Huillcas and P.Eudes, Bol. Soc. Quim. Peru, 54, 73 (1988).
57. N.Satyanarayana and E.V.Sundaram, Z. Phys. Chem., 268, 747 (1987).
58. R.P.Bell and K.Yates, Ibid, 1927 (1962).
59. L.Zucker and L.P.Hammett, / . Am. Chem. Soc, 61, 2791 (1939).
60. N.C.Deno and R.Fishbein, / . Am. Chem. Soc, 95, 7445 (1973).
61. J-E.Dubois and J.Toullec, Tetrahedron, 29, 2859 (1973).
62. J.Toullec, Tetrahedron Letters, 25, 4401 (1984).
63. J.E.Dubois, M.E.Alaoui and J.Toullec, J. Am. Chem. Soc, 103, 5393
(1981).
64. R.Hochstrasser, A.J.Kresge, N.P.Schepp and J.Wirz, / . Am. Chem. Soc,
110, 7875 (1988).
65. J.K.Coward and T.C.Bruice, J. Am. Chem. Soc, 91, 5339 (1969).
66. P.D.Bartlett,y. Am. Chem. Soc, 56, 967 (1934).
27
67. R.R.Lii and S.I.Miller, / . Chem. Soc, B, 2269 (1971).
68. J.P.Guthrie, J.Cossar and A.Klym, / . Am. Chem. Soc, 104, 895 (1982).
69. E.Tapuhi and W.P.Jencks, / . Am. Chem. Soc, 104, 5758 (1982).
70. R.Viria, Annalen, 68, 343 (1848).
71. A.W.Hofman, Annalen, 75, 356 (1850).
72. V.Meyer, Ber. Dtsch., Chem. Ges., 6, 1492 (1873).
73. Y.Ogata, Y.Furuya and M . I t o , / . Am. Chem. Soc, 85, 3649 (1963).
74. T.Brunton, Lancet, 2, 97 (1867).
75. J.Tummavuori and P.Lumme, Acta Chem. Scand., 22, 2003 (1968).
76. D.L.H.WilUams, Nitrosation, Cambridge university Press, Chi . ,
pp. 10(1988).
77. J.R.Leis, M.E.Pena, D.L.H.WiUiams and S.D.Mawson,/. Chem. Soc,
Perkin 2, 157 (1988).
78. M.J.Crookes, P.Roy and D.L.H.Williams, / . Chem. Soc, Perkin 2,
1015 (1989).
79. P.Roy and D.L.H.Wil l iams, / . Chem. Res., 122 (1988).
80. L.Bouveault and R.Locquin, Bull. Soc. Chim. Fr., 31, 1159 (1904).
81. V.Meyer, Ber., 10, 2075 (1877).
82. A.S.Onishenko,/. Gen. Chem. (U.S.S.R.), 11, 197 (1941).
83. C.E.Redeman and M.S.Dunn, / . Biol. Chem., 130, 341 (1939).
84. K.R.Leopold and A.Haim, Int. J. Chem. Kinet., 9, 83 (1977).
85. S.D.Furrow, Int. J. Chem. Kinet., 11, 131 (1979).
86. A.Graham and D.L.H.Williams, J. Chem. Soc, Perkin 2, 747 (1992).
87. P.H.Beloso, P.Roy and D.L.H.Williams, J. Chem. Soc, Perkin 2, 17
(1991).
88. S.Forsen and M . Nilsson, The Chemistry of the Carbonyl Group, Vol 2.
Ed. J.Zabicky, Wiley, London, pp. 157-240 (1970).
89. J.Toullec, Adv. Phys. Org. Chem., 18, 1 (1982).
90. S.E.Biali and Z.Rappoport, / . Am. Chem. Soc, 107,1007 (1985).
28
91. D.A.Nugiel and Z.Rappoport, / . Am. Chem. Soc, 107, 3669 (1985).
92. E.B.Nadler and Z.Rappoport, / . Am. Chem. Soc, 109, 2112 (1987).
93. R.C.Fuson, J.Corse and C.H.McKeever, / . Am. Chem. Soc, 62, 3250
(1940).
94. R.C.Fuson, L.J.Armstrong, J.W. Kneisley and W.J. Shenk, Jr., / . Am.
Chem. Soc, 66, 1464 (1944).
95. Z.Rappoport and S.E.Biali, Acc. Chem. Res., 21,442 (1988).
96. B.Capon, B.-Z.Guo, F.C.Kwok, A.K.Siddhanta and C.Zuao, Acc.
Chem. Res., 21,135 (1988).
97. Y.Chiang, A.J.Kresge and E.T.Krogh, / . Am. Chem. Soc, 110, 2600
(1988).
98. P.Haspra, A.Sutter and J.Wirz, Angew. Chem. Int. Ed. Engl., 18,
617 (1979).
99. Y.Chiang, A.J.Kresge, Y.S.Tang and J.Wirz, / . Am. Chem. Soc, 106,
460(1984).
100. A.J.Kresge, Chemtech., 250 (1986).
101. Y.Chiang, A.J.Kresge and P.A.Walsh,/. Am. Chem. Soc, 108, 6314
(1986).
102. P.J.Wagner, Acc. Chem. Res. 4, 168 (1971).
103. H.Hart, Chem. Rev., 79, 515 (1979).
104. J.Emsley, N.J.Freeman, P.A.Batesand, M.B.Hursthouse,/. Chem. Soc,
Perkin 1, 297 {19S8).
105. N.N.Shapet'Ko, S.S.Berestova, G.M.Lukovkin and Y.S.Bogachev, Org.
Magn. Reson., 7, 237 (1975).
106. J.Emsley, N.J.Freeman, R.J.Parker and R.E.Overill, / . Chem. Soc, Perkin
2, 1479(1986).
107. J.Emsley, Struct. Bonding (Berlin), 57, 147 (1984).
108. J.S.Binkley, M.J.Frisch and H.F.Schaefer I I I , Chem. Phys. Lett., 126,
1 (1986).
29
109. J.N.Spencer, E.S.Holmboe, M.R.Kirshenbaum, D.W.Firth and P.B.Pinto,
Can. J. Chem., 60, 1178 (1982).
110. G.R.Saad, M.M.Naoum and H.A.Rizk, Can. J. Chem.,61, 284 (1989).
111. M.M.Folkendt, B.E.Weiss-Lopez, J.P. Chauvel, Jr., and N.S.True,/. Phys.
Chem., 89, 3347 (1985).
112. L.W.Reeves, Can. J. Chem., 35, 1351 (1957).
113. M.Moriyasu, A.Kato and Y.Hashimoto,/. Chem. Soc, Perkin 2, 515
(1986).
114. A.Kettrup and H.Marsman, Z. Anal. Chem., 260, 243 (1972).
115. J.L.Burdett and M.T.Rogers,/. Phys. Chem., 70, 939 (1966).
116. K.B.Wiberg and K.E.Laidig, / . Am. Chem. Soc, 109, 5935 (1987).
117. Y . L i and K.N.Houk, / . Am. Chem. Soc, 111, 4505 (1989).
118. L.R.Fedor and W.R.Glave,/. Am. Chem. Soc, 93, 985 (1971).
119. P.Alcais and R.Brouillard, / . Chem. Soc, Perkin 2, 1214 (1972).
120. B.G.Cox, P.De Maria, A.Fini and A.F.Hassan, / . Chem. Soc, Perkin 2,
1351 (1981).
121. Z.Yoshida, H.Ogoshi and T.Tokumitsu, Tetrahedron, 26, 5691 (1970).
122. A.R.E.Carey, G.Fukata, R.A.More O'Ferrall and M.G.Murphy, / . Chem.
Soc., Perkin 2, 1711 (1985).
30
CHAPTER 2
NITROSATION AND HALOGENATION OF JVIALONAIVIIDE
31
2.1. Introduction
There has been extensive study in the chemistry of enols in the past decade,
focusing on the synthesis of stable enolstl '2], the measurement of rate constants
of ketonisation and keto-enol equilibrium constants for simple ketones[3,4].
Recently, a particular interest in this field has been the recognition of enols
derived from carbonyl-containing compounds including carboxylic acids and
esters [^'6]. The involvement of enol forms of malonic acid and its derivatives
has been reportedf^'^]. Most recently, Chiang and Kresge[9] measured keto-
enol equilibrium constants for the pyruvic acid system in aqueous solution by
Meyer halogen titration and by another kinetic method which determines these
constants f rom the ratios of enolisation to ketonisation rate constants.
Amides should in principle show similar kinetic behaviour i.e. capable of
enolisation and subsequent electrophilic addition. However, no adequate
evidence has been presented experimentally in the literature. Some reports on
malonamide only involved its synthesis and kinetics and mechanism of alkaline-
hydrolysis[10>l 1]. Therefore, in this work, enolisation of malonamide was
investigated through the kinetic study of its nitrosation, iodination and
bromination in acidic aqueous solution.
2.2. The catalysed nitrosation of malonamide
2.2.1. Results
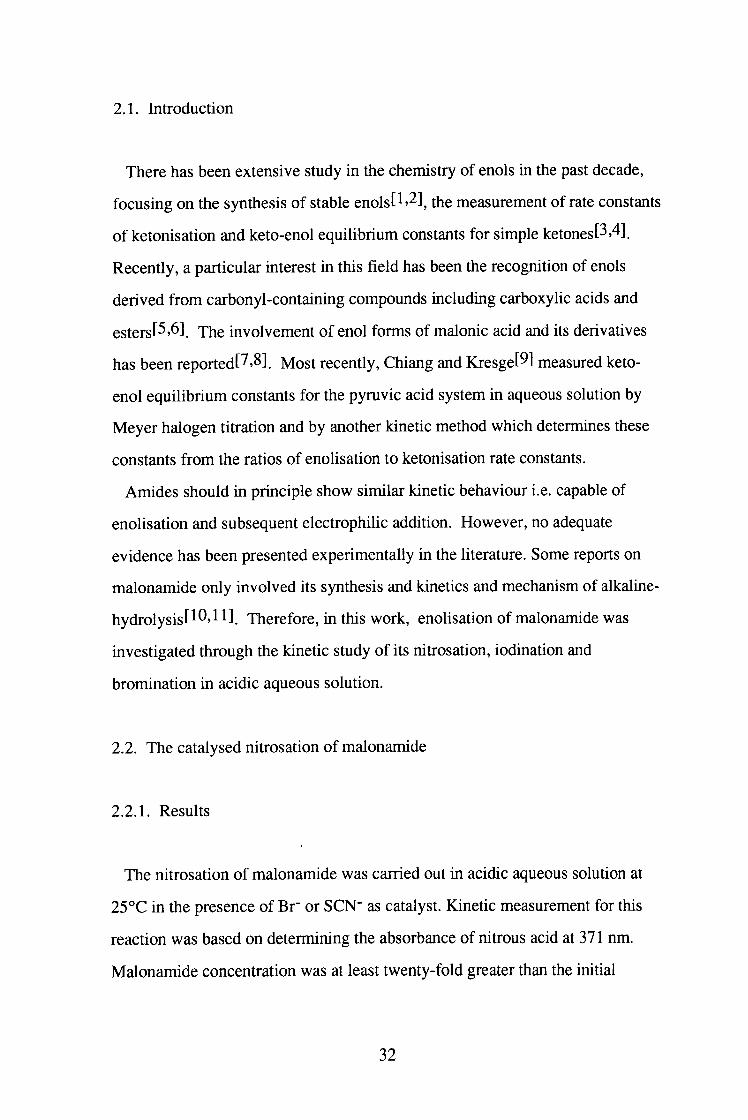
The nitrosation of malonamide was carried out in acidic aqueous solution at
25°C in the presence of Br" or SCN" as catalyst. Kinetic measurement for this
reaction was based on determining the absorbance of nitrous acid at 371 nm.
Malonamide concentration was at least twenty-fold greater than the initial
32
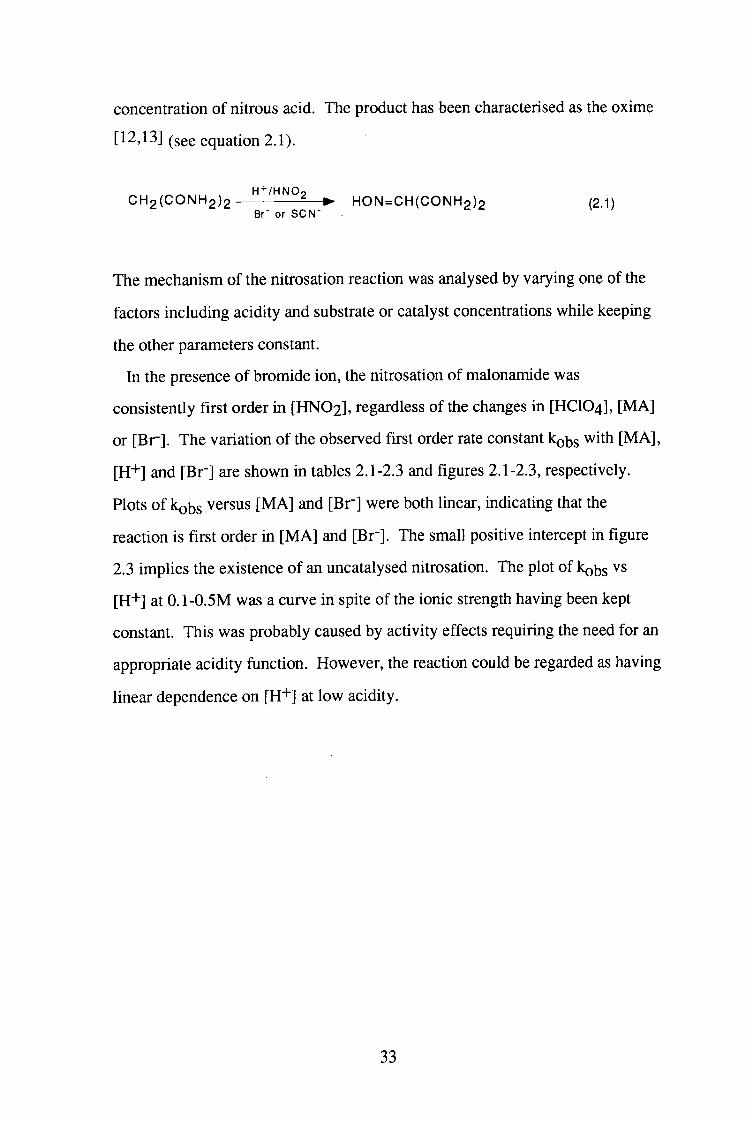
concentration of nitrous acid. The product has been characterised as the oxime
[12,13] (see equation 2.1).
C H 2 ( C O N H 2 ) 2 ^ HON = C H ( C O N H 2 ) 2 (2 1) Br- or SCN-
The mechanism of the nitrosation reaction was analysed by varying one of the
factors including acidity and substrate or catalyst concentrations while keeping
the other parameters constant.
In the presence of bromide ion, the nitrosation of malonamide was
consistently first order in [ H N O 2 ] , regardless of the changes in [ H C I O 4 ] , [ M A ]
or [Br-] . The variation of the observed first order rate constant kQ^g with [ M A ] ,
[H+] and [Br"] are shown in tables 2.1-2.3 and figures 2.1-2.3, respectively.
Plots of kobs versus [ M A ] and [Br"] were both linear, indicating that the
reaction is first order in [ M A ] and [Br"]. The small positive intercept in figure
2.3 implies the existence of an uncatalysed nitrosation. The plot of kQ^s vs
[H"*"] at 0.1-0.5M was a curve in spite of the ionic strength having been kept
constant. This was probably caused by activity effects requiring the need for an
appropriate acidity function. However, the reaction could be regarded as having
linear dependence on [H"*"] at low acidity.
33
Table 2.1. Dependence of k^bs upo" [MA] for the
nitrosation of malonamide with B r as catalyst.
[HNO2]=0.0071M [Br-]=0.598M
[H+]=0.072M
[ M A ] / M 103kohs/s-l
0.072 0.497
0.108 0.740
0.162 1.16
0.216 1.52
0.252 1.90
0.288 2.20
0.324 2.50
0.361 2.79
0.405 3.12
34
Table 2.2 Variation of kobs with [H+] for the
nitrosation of M A with Br ' as catalyst
[HNO2]=0.0099M [MA]=0.201M
[Br-]=0.600M ionic strength= 1.20M (NaC104)
[ H + l / M 102kohs/s-l
0.10 0.322
0.20 0.826
0.25 1.14
0.30 1.47
0.35 1.94
0.40 2.26
0.50 3.06
35
Table 2.3 Variation of kobs upon [Br"] for the
nitrosation of malonamide with Br" as catalyst
[HNO2]=0.0072M [H+]=0.072M
[MA]=0.2026M
[Br"] /M 103 kohsys-1
0.14 0.408
0.21 0.590
0.28 0.734
0.35 0.902
0.42 1.05
0.49 1.21
0.56 1.38
36
U) \
o
5.0 -
4,0 -
^ 3,0
Is 2,0
1,0 -
0,0 0 "! S 03 S as [MA]/M
Figure 2.1 Dependence of kQbs upon [ M A ] for the nitrosation of M A
with Br" as catalyst.
37
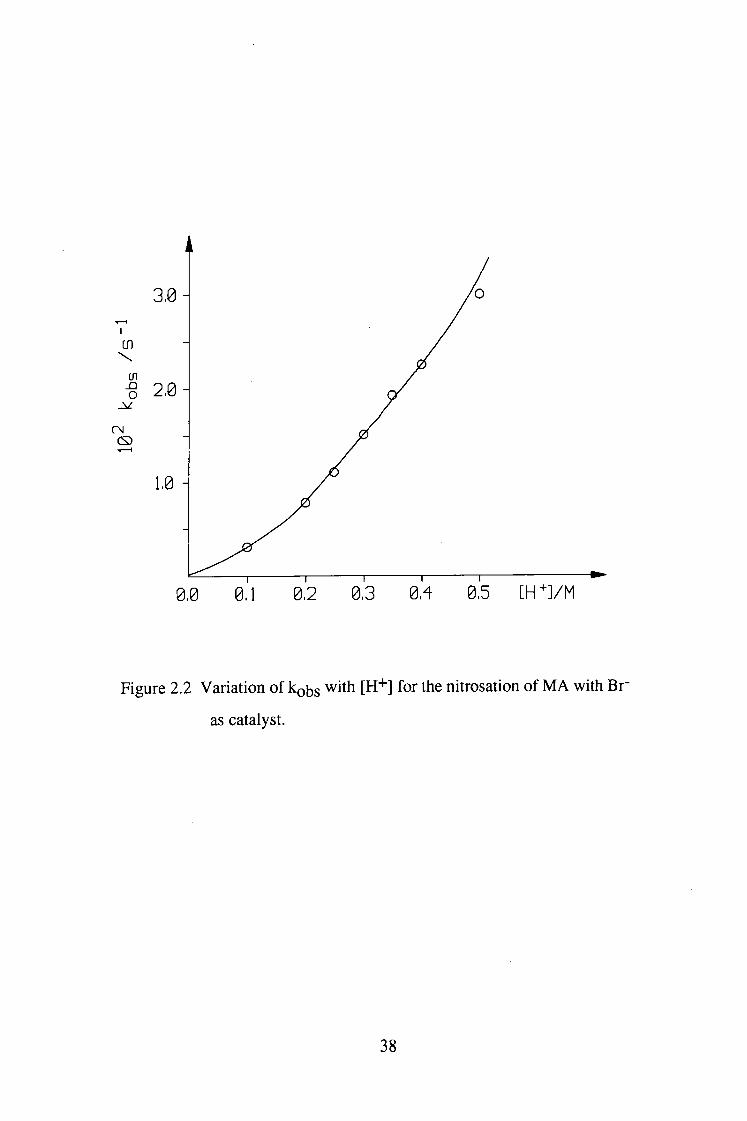
3,0-
O ^ 2,0 H
1,0
0,0 0,1 0,2 0,3 0,1 0,5 [H^]/M
Figure 2.2 Variation of kobs with [H"*"] for the nitrosation of M A with Br"
as catalyst.
38
0,5 [Br- ]/M
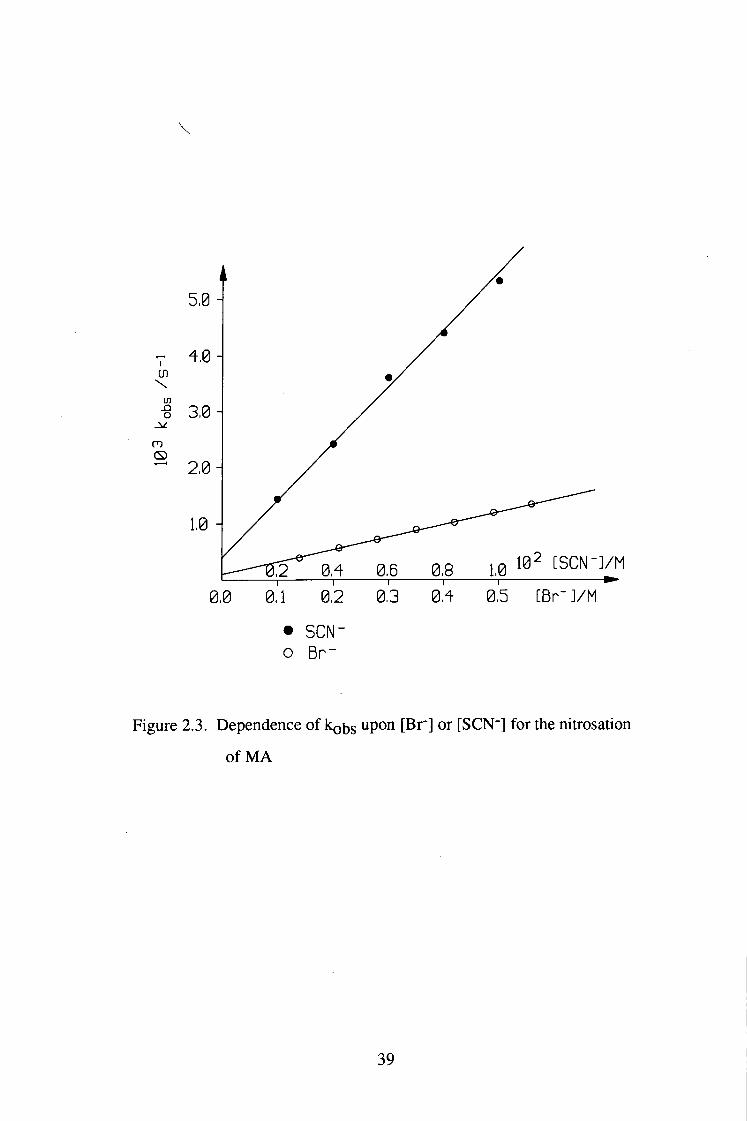
• SCN-o B r -
Figure 2.3. Dependence of koijs upon [Br"] or [SCN"] for the nitrosation
of M A
39
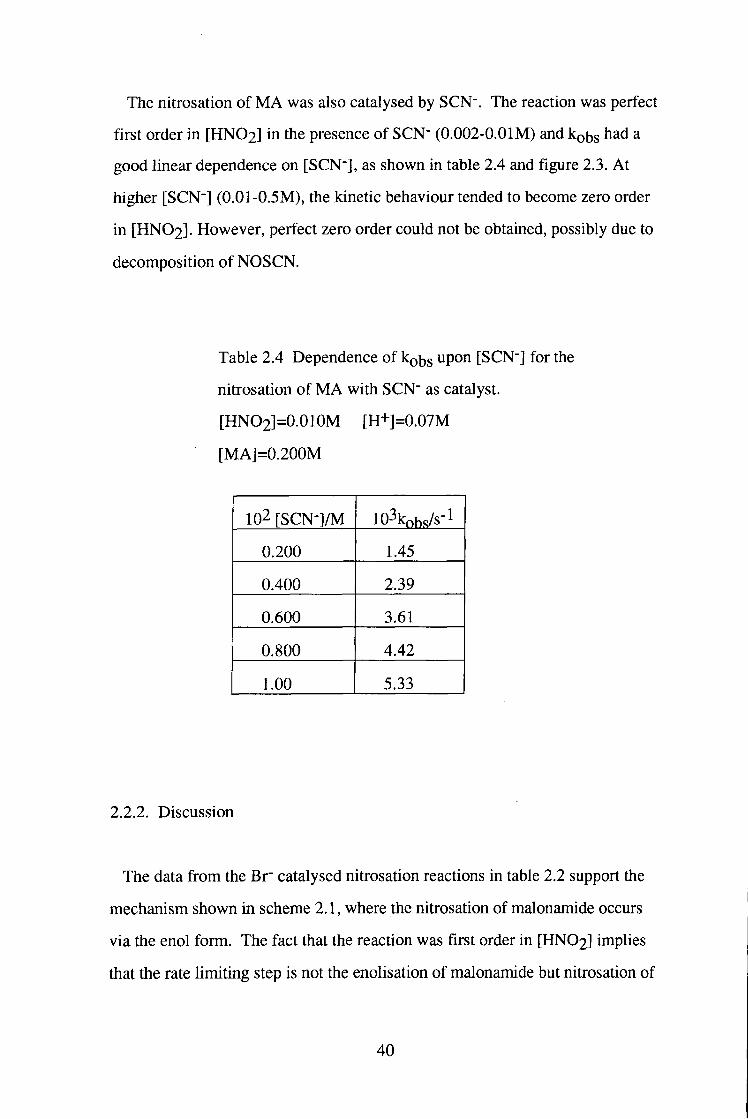
The nitrosation of MA was also catalysed by SCN'. The reaction was perfect
first order in [HNO2] in the presence of SCN' (0.002-O.OlM) and kobs had a
good linear dependence on [SCN^], as shown in table 2.4 and figure 2.3. At
higher [SCN"] (0.01-0.5M), the kinetic behaviour tended to become zero order
in [HNO2]. However, perfect zero order could not be obtained, possibly due to
decomposition of NOSCN.
Table 2.4 Dependence of kobs "P^" [SCN"] for the
nitrosation of MA with SCN" as catalyst.
[HNO2]=0.010M [H+]=0.07M
[MA]=0.200M
102 [SCN-]/M 103kohs/s-l
0.200 1.45
0.400 2.39
0.600 3.61
0.800 4.42
1.00 5.33
2.2.2. Discussion
The data from the Br" catalysed nitrosation reactions in table 2.2 support the
mechanism shown in scheme 2.1, where the nitrosation of malonamide occurs
via the enol form. The fact that the reaction was first order in [HNO2] implies
that the rate limiting step is not the enolisation of malonamide but nitrosation of
40
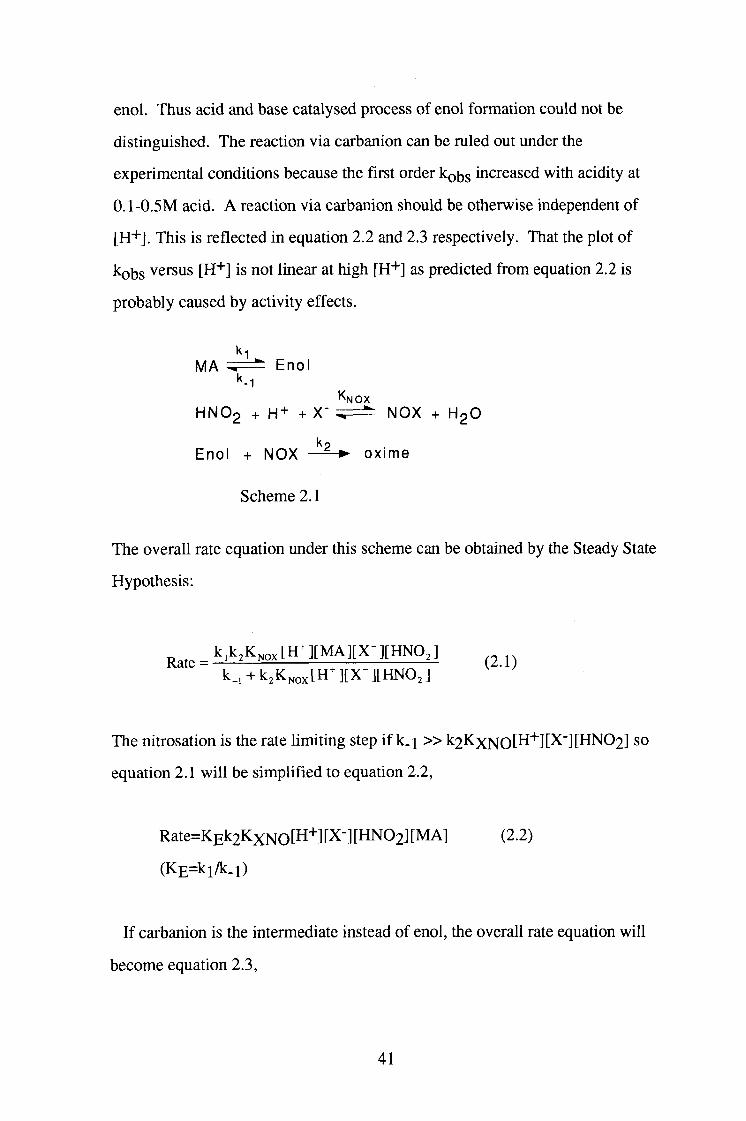
enol. Thus acid and base catalysed process of enol formation could not be
distinguished. The reaction via carbanion can be ruled out under the
experimental conditions because the first order kg^s increased with acidity at
0.1-0.5M acid. A reaction via carbanion should be otherwise independent of
[H+]. This is reflected in equation 2.2 and 2.3 respectively. That the plot of
kobs versus [H+] is not linear at high [H+] as predicted from equation 2.2 is
probably caused by activity effects.
MA ^ i = ^ Eno l
KNOX
H N O 2 + H+ + X- ^ ; = ^ NOX + H 2 O
kp
Enol + NOX • oxime
Scheme 2.1
The overall rate equation under this scheme can be obtained by the Steady State
Hypothesis:
^^^^ ^ k,k,K^,,[Hn[MA][X-][HNOJ k_, + k2Kf,ox[Hn[X-][HNOJ
The nitrosation is the rate limiting step if k . i » k2KxNO[H''"][X-][HN02] so
equation 2.1 will be simplified to equation 2.2,
Rate=KEk2KxNO[H+][X-][HN02][MA] (2.2)
(KE=ki/k.i)
If carbanion is the intermediate instead of enol, the overall rate equation will
become equation 2.3,
41
^ k,k,K^,,[MA][X-][HNO,] k_,+k,K^ox[X-][HNOJ
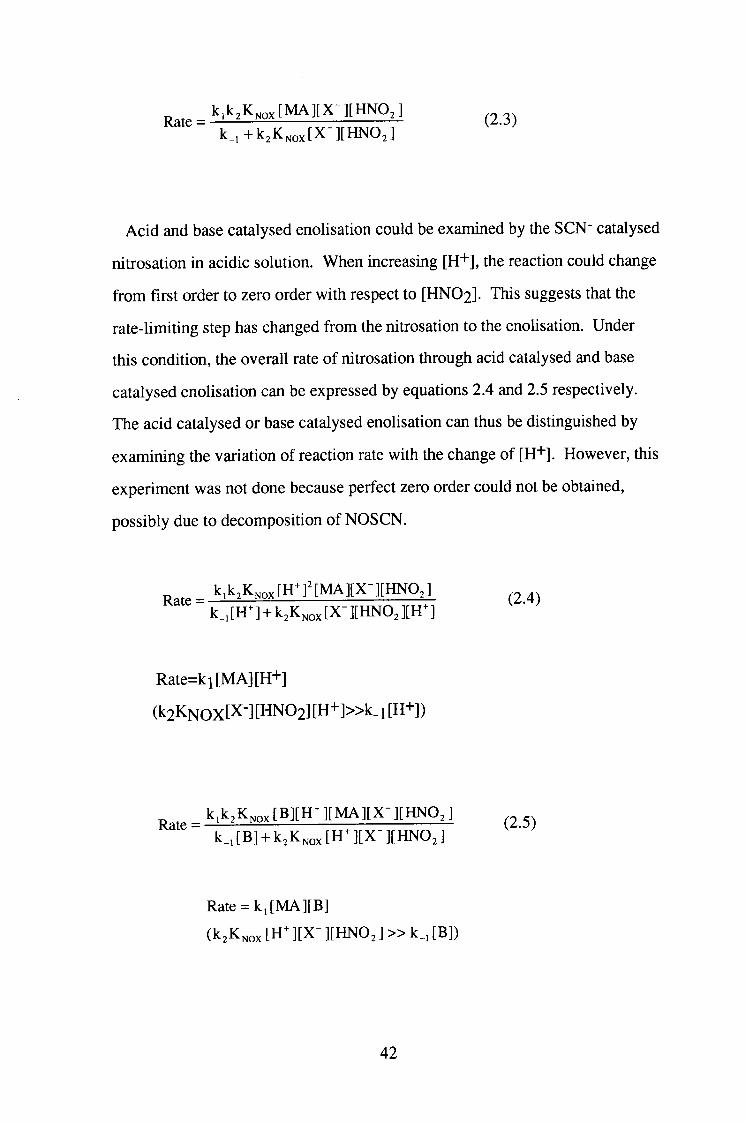
Acid and base catalysed enolisation could be examined by the SCN" catalysed
nitrosation in acidic solution. When increasing [H"*"], the reaction could change
from first order to zero order with respect to [HNO2]. This suggests that the
rate-limiting step has changed from the nitrosation to the enolisation. Under
this condition, the overall rate of nitrosation through acid catalysed and base
catalysed enolisation can be expressed by equations 2.4 and 2.5 respectively.
The acid catalysed or base catalysed enolisation can thus be distinguished by
examining the variation of reaction rate with the change of [H+J. However, this
experiment was not done because perfect zero order could not be obtained,
possibly due to decomposition of NOSCN.
_ k,k,K,oJHn^[MA][X-][HNO,] k_JHn + k,K^ox[X-][HNOJ[Hn
Rate=ki[MA][H+]
(k2KNOX[X-][HN02][H+]»k.i[H+])
_ k,k,K^ox[B][Hn[MA][X-][HNOJ k_,[B] + k,K^ox[Hn[X-][HNOJ
Rate = ki[MA][B] (k^K^ox [H ' ][X- ][UNO, ] » k_, [B])
42
The values of k2Kg obtained from the variation of kobs ^ith [Br] and
[SCN-] (Figure 2.3) are 3.33 and 1.16 (1 mol"! s'l), respectively ( The literature
values of KNOBr and K N O S C N . 5.1X10⁻²[14] and 30[15] (\2 niol-2)
respectively, were used for the calculation). Since Kg is constant, then k2 with
Br" as catalyst is a little greater than k2 with SCN" as catalyst. Normally, for
example with reactions of amines and other substrates, NOBr is much more
reactive than NOSCN. This implies that here in reaction with the enol from
malonamide, both reactions are close to the diffusion controlled limit. If the
assumption is valid, and we use a value for k2 of 7x10^ 1 mol"^ s'l, then we can
estimate a minimum value of Kg of ca. 1.6-5.6 xlO"^^. Recently, Kg value of
diethyl malonate has been estimated by this way as 2x10"! U16] suggesting that
the enolisation constants for the two compounds are similar.
As mentioned earher, there was no evidence that carbanion is an altemative
intermediate to enol in the nitrosation of malonamide. A pathway through
carbanion (or enolate anion) has been identified for several compounds with
high acidity of the hydrogen at a-carbon, such as Meldrum's acid (pKa=4.83) at
low acidity[17], trifluoroacetylacetone (pKa=6.7)[18] and dimedone (pKa of
enol 5.2)[19]. For some compounds, the concentration of the carbanion is not
sufficiently high for reaction to occur, as in the case of ethyl acetoacetate (pKa
10.7) [^9] and acetylacetone (pKa 8.8)[20]. The pKa of malonamide is not
available. Its structure compares with acetylacetone, but the acidity at the a-
carbon of malonamide may be lower due to conjugation of NH2 to C=0. If this
is the case, there would be httle possibiUty that nitrosation of malonamide
occurs via carbanion at the above experimental conditions.
43
2.3. lodination of malonamide
2.3.1. Results
Kinetic measurement for iodination of malonamide was carried out on the
conventional UVA^isible spectrophotometer. The reaction was followed
through the disappearance of absorption by the iodine molecule in the aqueous
acidic solution at 460 nm, where the molar extinction coefficient e is 697 mol"l
1 cm"l. The reaction mechanism was investigated by varying the concentration
of either HCIO4 or MA. In all the experiments, malonamide was in a large
excess over iodine.
At low acidity (lower than O.IM), the kinetic runs showed a zero order
behaviour with respect to iodine. But perfect zero order was obtained only at
around 0.01 M acidity. The variation of the observed rate constant kobs ^^^^
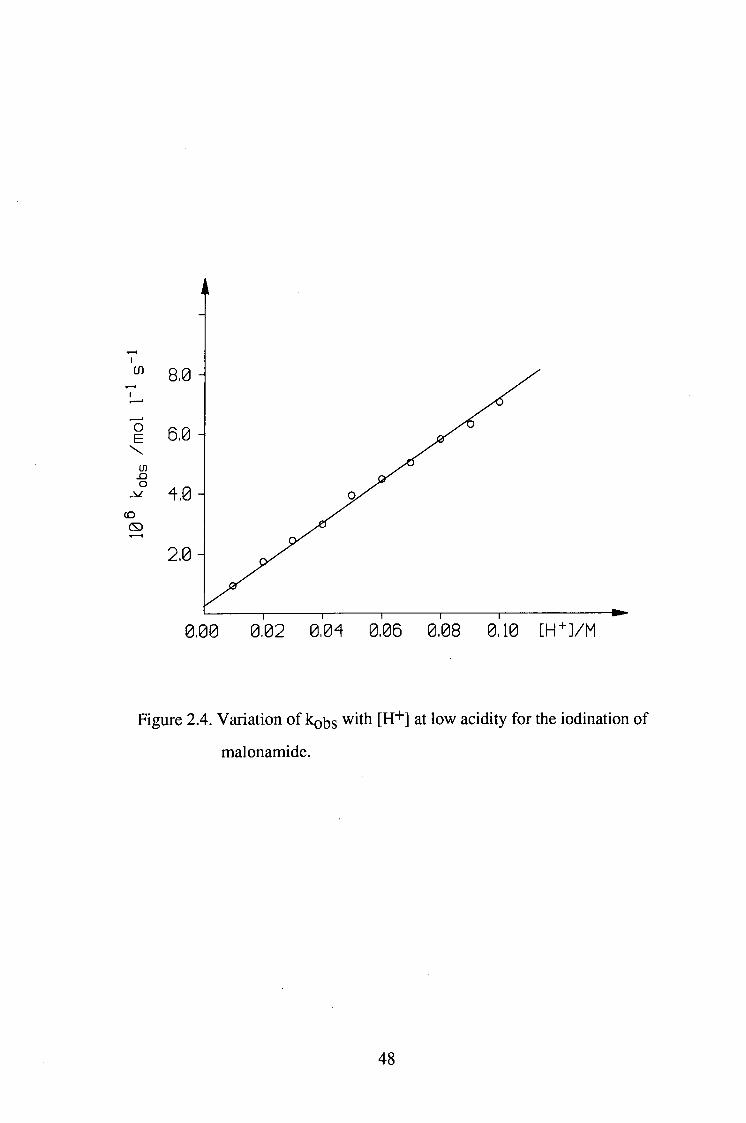
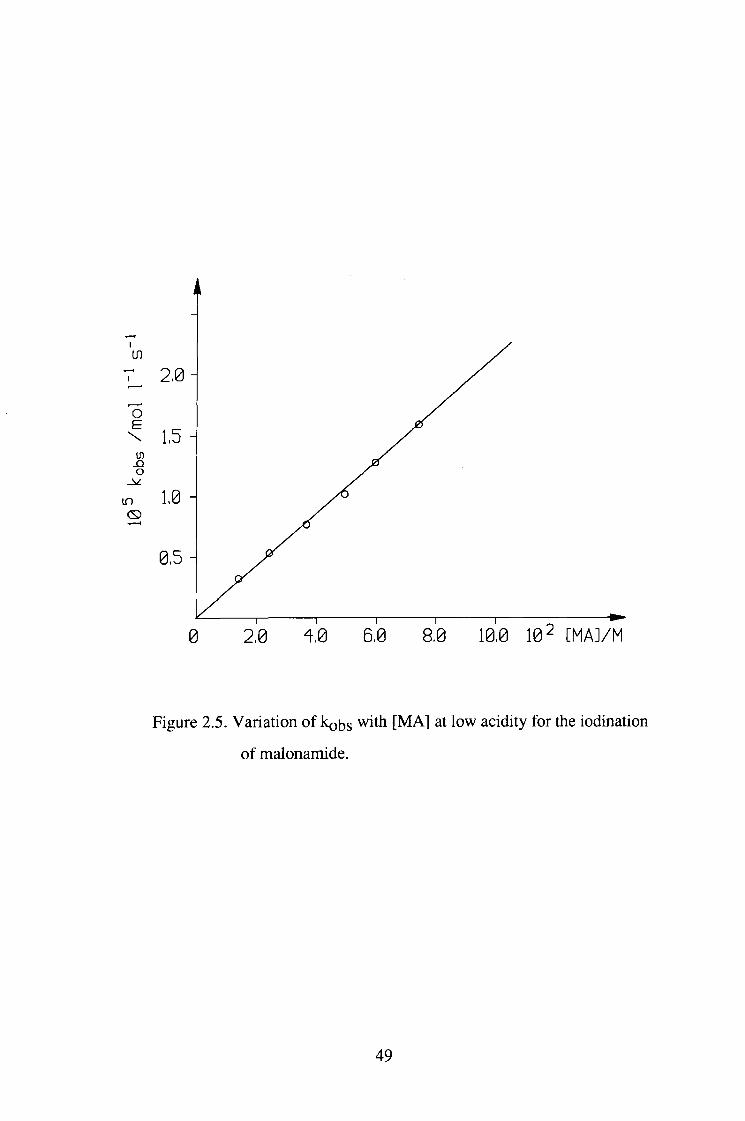
[H"*"] or [MA] at low acidity is shown in tables 2.5 and 2.6 as well as figures 2.4
and 2.5. The plots of kobs versus [H+] and [MA] are both linear. But there was
a small intercept in the plot of kobs versus [H+], possibly due to the presence of
uncatalysed enolisation. These results suggest that iodination of MA proceeds
via enol through the acid catalysed pathway and the enol formation is the rate
hmiting step. At high acidity ([H"'']>0.4M), the reaction rate constant had a
good first order dependence on [ I 2 ] and the kobs ' ' ^ ot vary with acid
concentration (as shown in table 2.7). This indicates that the rate limiting step
has changed from enolisation to iodination as the acidity increased up to 0.4M.
The first order kobs had good linear dependence on [MA] as shown in table 2.8
and figure 2.6 .
44
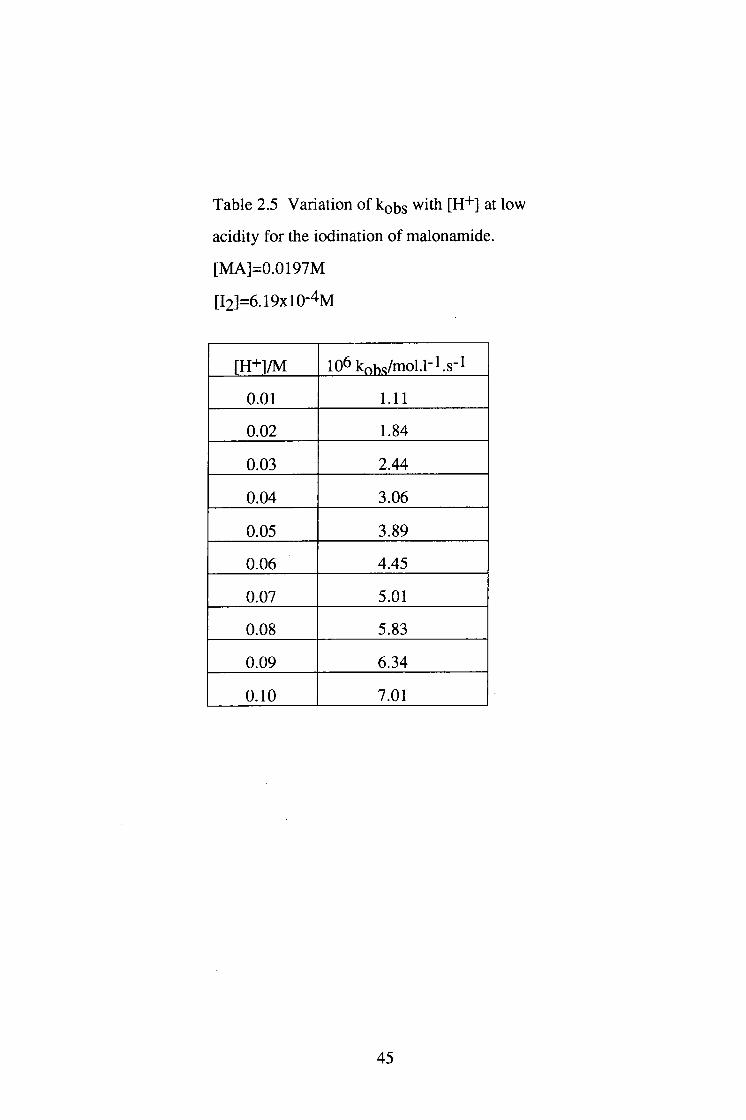
Table 2.5 Variation of kobs with [H+] at low
acidity for the iodination of malonamide.
[MA]=0.0197M
[I2]=6.19xl0-'^M
[H+]/M 106 kohs/mol.l-l.s-1
0.01 1.11
0.02 1.84
0.03 2.44
0.04 3.06
0.05 3.89
0.06 4.45
0.07 5.01
0.08 5.83
0.09 6.34
0.10 7.01
45
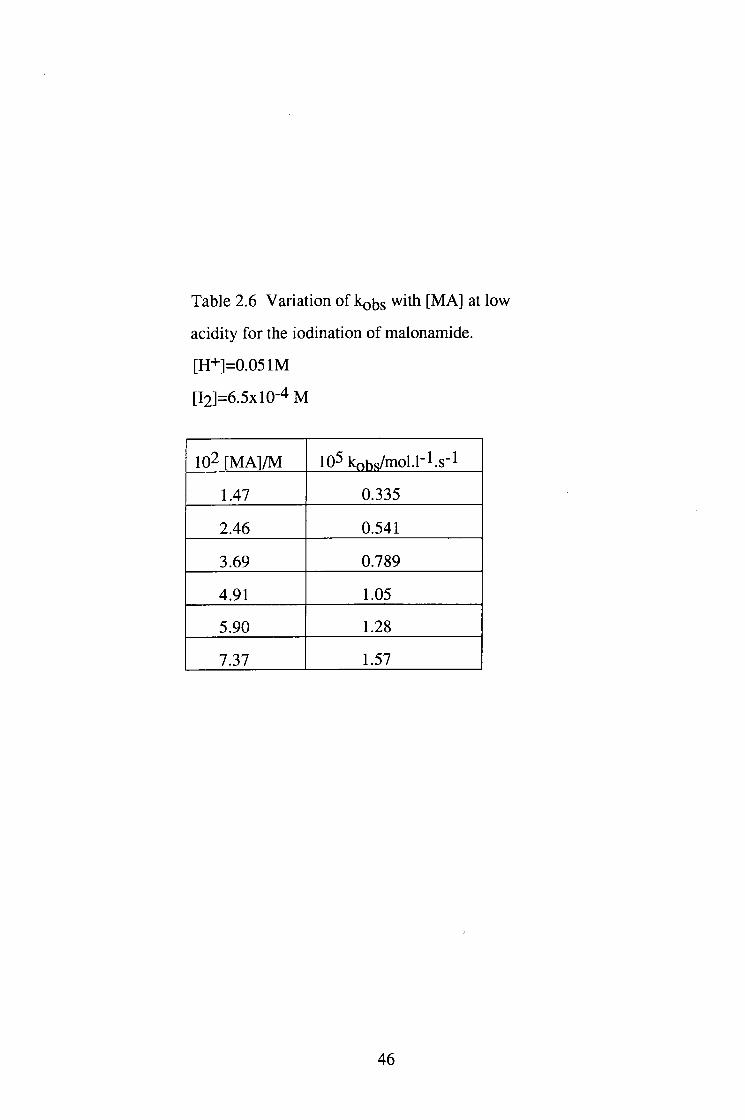
Table 2.6 Variation of kobs with [MA] at low
acidity for the iodination of malonamide.
[H+]=0.051M
[l2]=6.5xl0-4 M
102 [MA]/M 105 kohs/mol.l"l.s"l
1.47 0.335
2.46 0.541
3.69 0.789
4.91 1.05
5.90 1.28
7.37 1.57
46
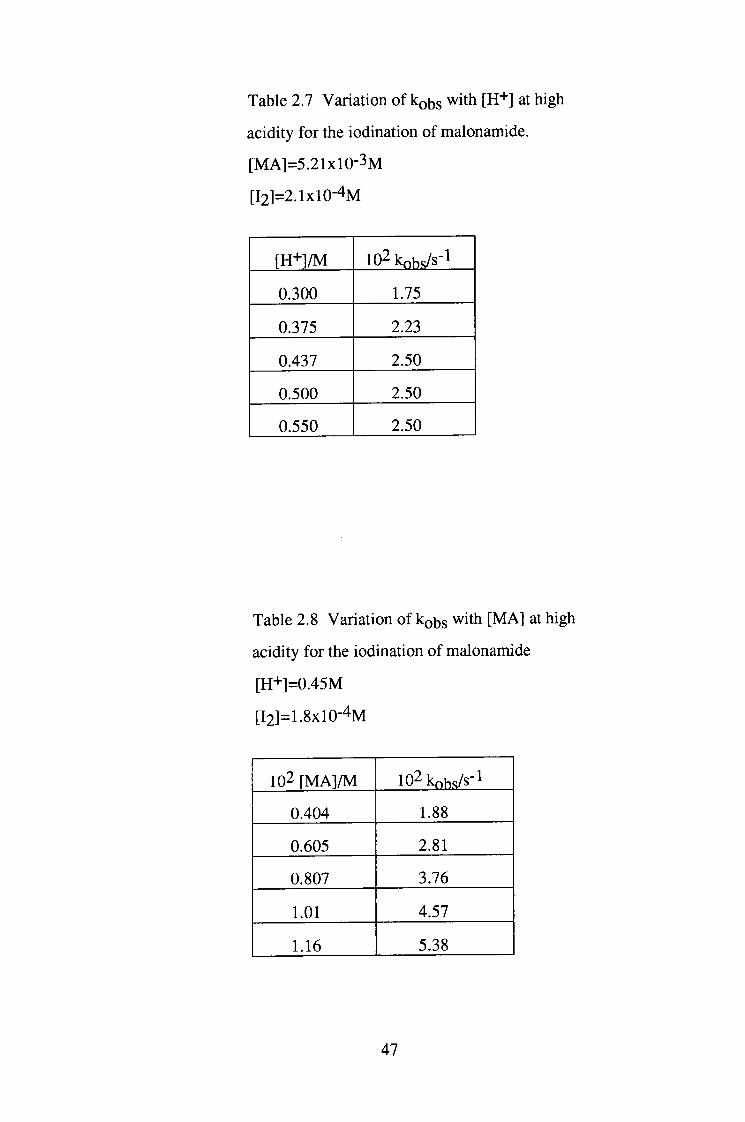
Table 2.7 Variation of kobs with [ H + ] at high
acidity for the iodination of malonamide.
[ M A ] = 5 . 2 1 X 1 0 - 3 M
[ I 2 ] = 2 . 1 X 1 0 - 4 M
[ H + ] / M 102knhs/s-l
0.300 1.75
0.375 2.23
0.437 2.50
0.500 2.50
0.550 2.50
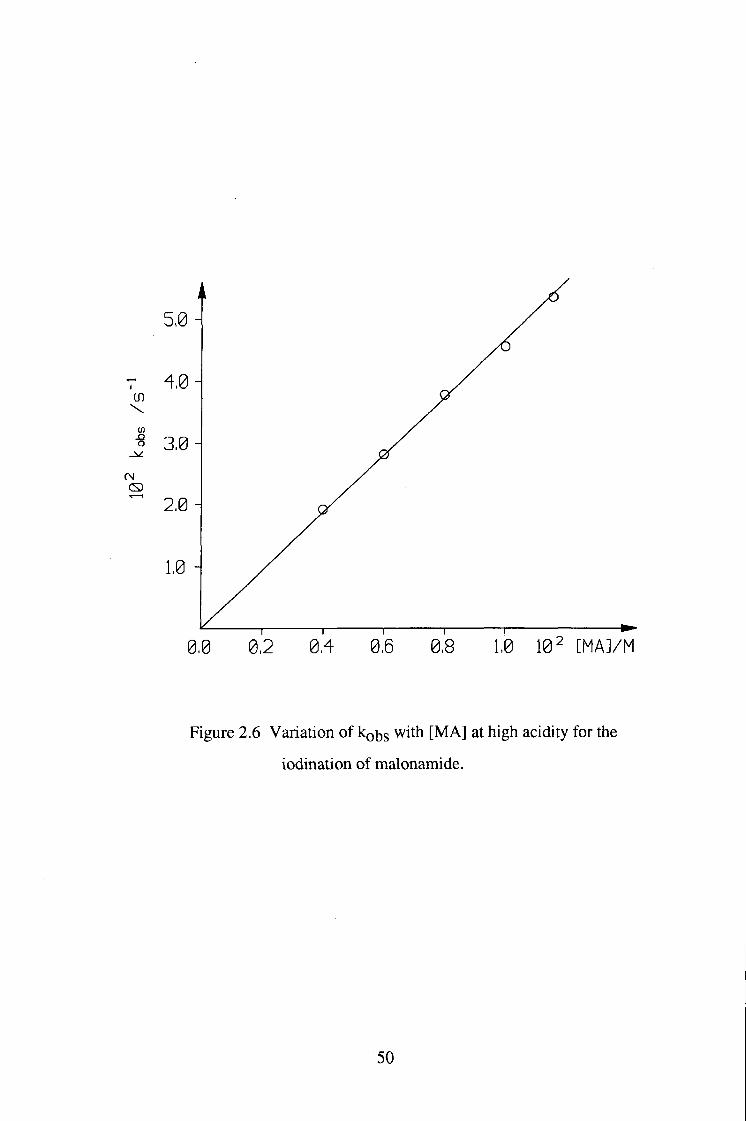
Table 2.8 Variation of kobs with [ M A ] at high
acidity for the iodination of malonamide
[ H + ] = 0 . 4 5 M
[ I 2 ] = 1 . 8 X 1 0 - 4 M
102 [ M A ] / M 102kohs/s-l
0.404 1.88
0.605 2.81
0.807 3.76
1.01 4.57
1.16 5.38
47
IS)
o E
\ O
CD
0,00 0^02 a04 a06 a08 0^10 L H + V M
Figure 2.4. Variation of kobs with [H"*"] at low acidity for the iodination of
malonamide.
48
0 2,0 4,0 6,0 8,0 10,0 10 2 [MAJ/M
Figure 2.5. Variation of kobs with [MA] at low acidity for the iodination
of malonamide.
49
o 3,0 H
0,0 0,2 0,4 0,6 0,8 1,0 102 [MA]/M
Figure 2.6 Variation of kobs with [MA] at high acidity for the
iodination of malonamide.
50
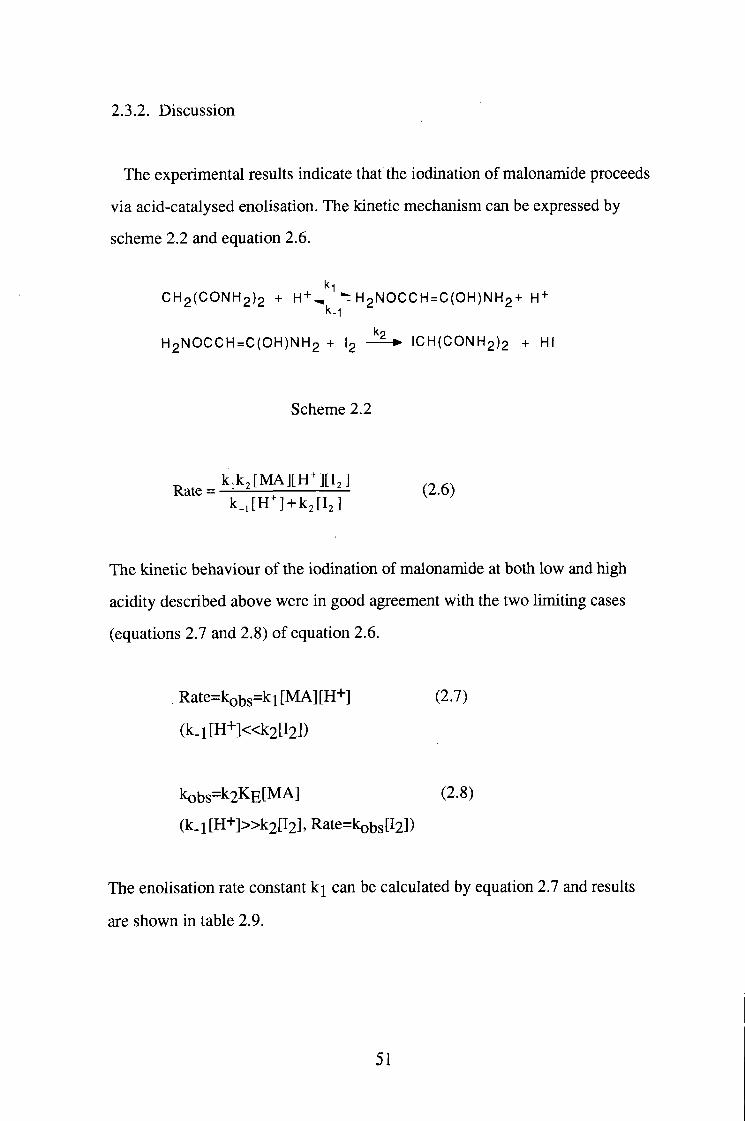
2.3.2. Discussion
The experimental results indicate that the iodination of malonamide proceeds
via acid-catalysed enolisation. The kinetic mechanism can be expressed by
scheme 2.2 and equation 2.6.
CH2(CONH2)2 + H + , ^ H2NOCCH = C(OH)NH2 + H + k.-|
H2NOCCH=C(OH)NH2 + I2 ICH(CONH2)2 + HI
Scheme 2.2
R a t e = ™ ^ M : i ^ (2.6) k . j n n + k j i j
The kinetic behaviour of the iodination of malonamide at both low and high
acidity described above were in good agreement with the two limiting cases
(equations 2.7 and 2.8) of equation 2.6.
Rate=kobs=kl[MA][H+] (2.7)
(k.i[H-^]«k2[l2])
kobs=k2KE[MA] (2.8)
(k.i[H+]»k2[l2], Rate=kobs[l2])
The enolisation rate constant k^ can be calculated by equation 2.7 and results
are shown in table 2.9.
51
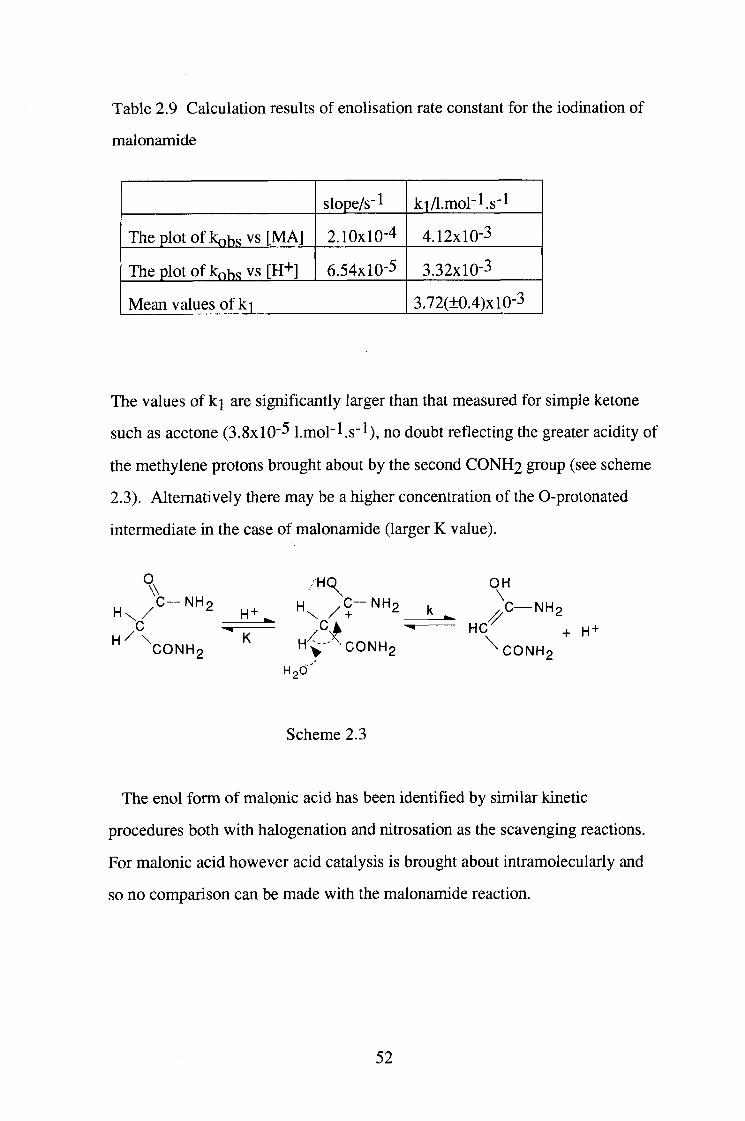
Table 2.9 Calculation results of enolisation rate constant for the iodination of
malonamide
slope/s"l kiA.mol'l.s'l
The plot of kobs vs [MA] 2.10x10⁻⁴ 4.12x10⁻³
The plotof kohs vs [H+] 6.54x10⁻⁵ 3.32x10⁻³
Mean values of ki 3.72(±O.4)xl0-3
The values of k j are significantly larger than that measured for simple ketone
such as acetone (3.8x10⁻⁵ l.mol-l.s-1), no doubt reflecting the greater acidity of
the methylene protons brought about by the second CONH2 group (see scheme
2.3). Altematively there may be a higher concentration of the 0-protonated
intermediate in the case of malonamide (larger K value).
NH2
CONHo K
/ C — N H p
CONH2
OH
} c — N H 2 H C ^ +
^ C 0 N H 2 HgO
Scheme 2.3
The enol form of malonic acid has been identified by similar kinetic
procedures both with halogenation and nitrosation as the scavenging reactions.
For malonic acid however acid catalysis is brought about intramolecularly and
so no comparison can be made with the malonamide reaction.
52
2.4. Bromination of malonamide
2.4.1. Results
The reaction was followed by the stopped-flow spectrophotometer at 393 nm
at 25°C in aqueous acidic solution.
The absorbance-time curve showed that the bromination of malonamide was
perfectly first order in [Br2] when the ratio of [MA] to [Br2] was greater than
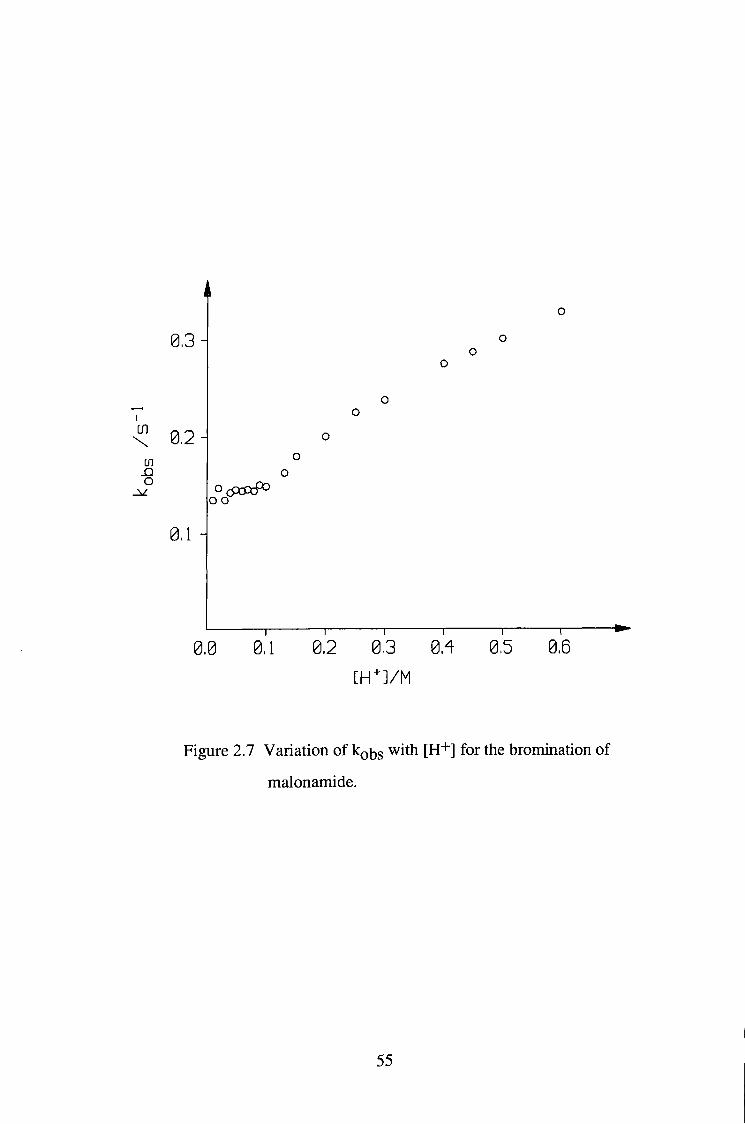
27. The observed first order rate constant kobs remained basically constant
when acid concentration varied between 0.01-O.IM. However, the kobs
increased unlinearly with [H+] as acidity was higher than O.IM, as shown in
table 2.10 and figure 2.7.
53
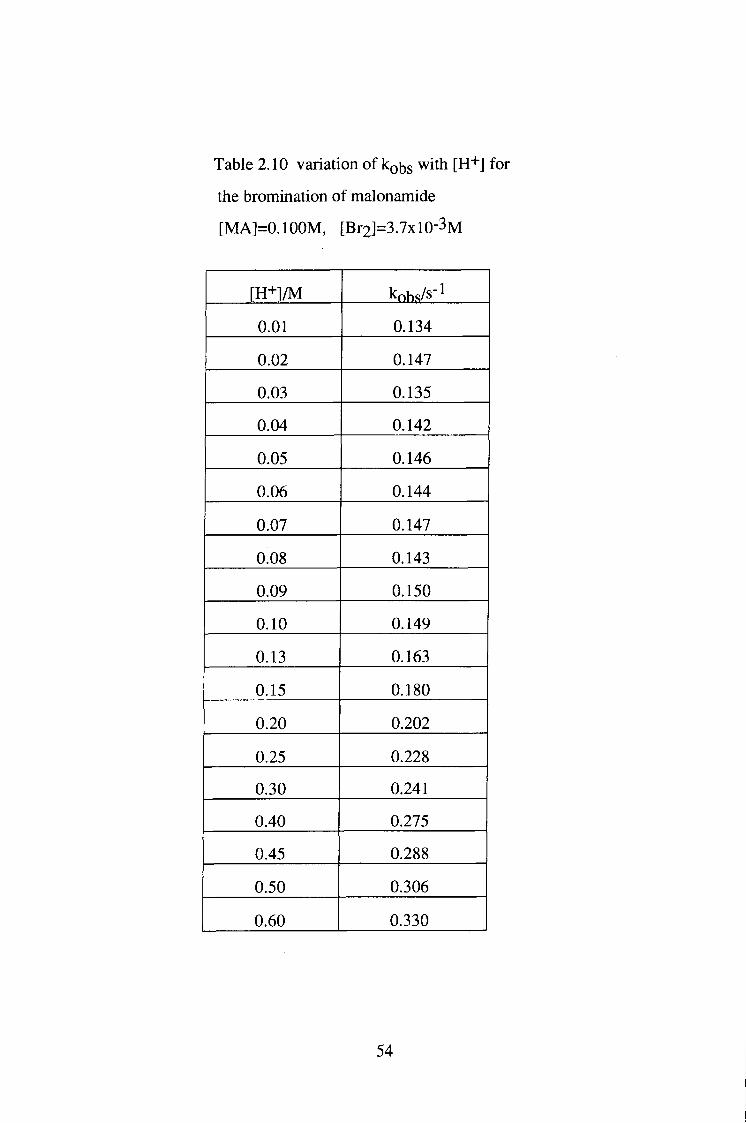
Table 2.10 variation of kobs with [H+] for
the bromination of malonamide
[MA]=0.100M, [Br2]=3.7xl0-3M
[E+]/M kobs/s-1
0.01 0.134
0.02 0.147
0.03 0.135
0.04 0.142
0.05 0.146
0.06 0.144
0.07 0.147
0.08 0.143
0.09 0.150
0.10 0.149
0.13 0.163
0.15 0.180
0.20 0.202
0.25 0.228
0.30 0.241
0.40 0.275
0.45 0.288
0.50 0.306
0.60 0.330
54
0,3
\ 0,2 U)
O
0,1 -
0,0 a i a2 03 S S ae" [ H ' - J / M
Figure 2.7 Variation of kobs with [H" '] for the bromination of
malonamide.
55
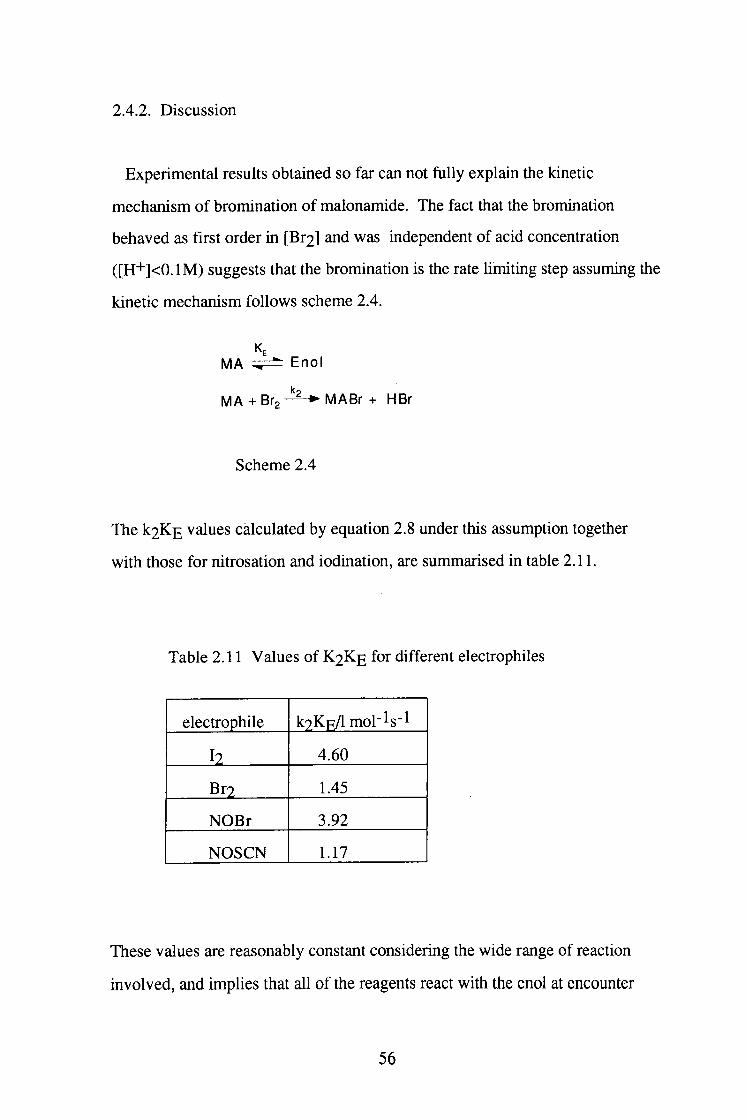
2.4.2. Discussion
Experimental results obtained so far can not fully explain the kinetic
mechanism of bromination of malonamide. The fact that the bromination
behaved as first order in [Br2] and was independent of acid concentration
([H''']<0.1M) suggests that the bromination is the rate limiting step assuming the
kinetic mechanism follows scheme 2.4.
MA E n o l
MA + B f g - ^ ^ ^ MABr + HBr
Scheme 2.4
The k2KE values calculated by equation 2.8 under this assumption together
with those for nitrosation and iodination, are summarised in table 2.11.
Table 2.11 Values of K 2 K E for different electrophiles
electrophile k9KFyimol-ls-l
l2 4.60
Br2 1.45
NOBr 3.92
NOSCN 1.17
These values are reasonably constant considering the wide range of reaction
involved, and implies that all of the reagents react with the enol at encounter
56
limit. This is not an unreasonable suggestion as the enol of malonamide would
be predicted to be a very reactive species due to the presence of both OH and
N H 2 groups conjugated with the double bond. If we assume that the limiting
value for k2 is -7x10^ l.mol"! .s'l for reaction in water at 25°C, then we obtain
a value for K E of 4(±2)xl0'10 which is comparable with the measured value for
acetone of 6.0x10"^ and estimated value of diethyl malonate ~2xl0"ll.
It was not possible to achieve perfect zero order behaviour with bromine,
probably because dibromination occurs and at the necessary high [Br2] it is a
serious complication.
The acid catalysis found above about 0.1 M H"'" could arise from a
contribution due to bromination of the protonated form of the enol, or from an
acidity function effect, or possibly a salt effect.
2.5. Isotope effects
2.5.1. Results
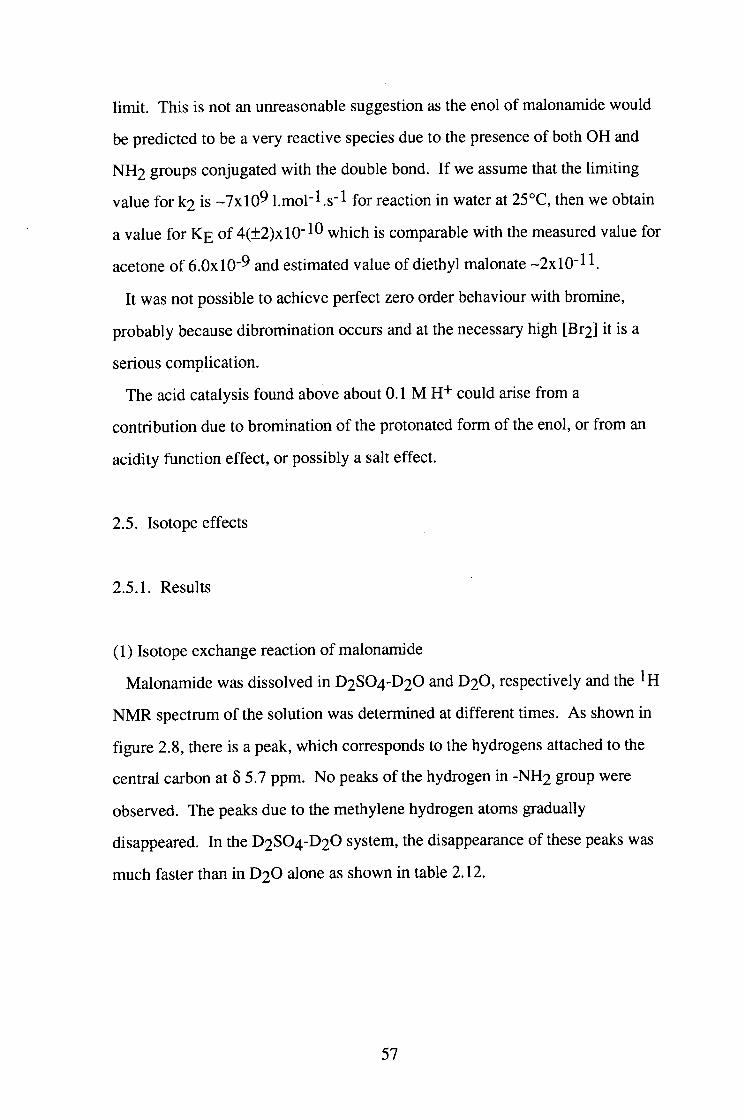
(1) Isotope exchange reaction of malonamide
Malonamide was dissolved in D2SO4-D2O and D2O, respectively and the
NMR spectrum of the solution was determined at different times. As shown in
figure 2.8, there is a peak, which corresponds to the hydrogens attached to the
central carbon at 5 5.7 ppm. No peaks of the hydrogen in - N H 2 group were
observed. The peaks due to the methylene hydrogen atoms gradually
disappeared. In the D2SO4-D2O system, the disappearance of these peaks was
much faster than in D 2 O alone as shown in table 2.12.
57
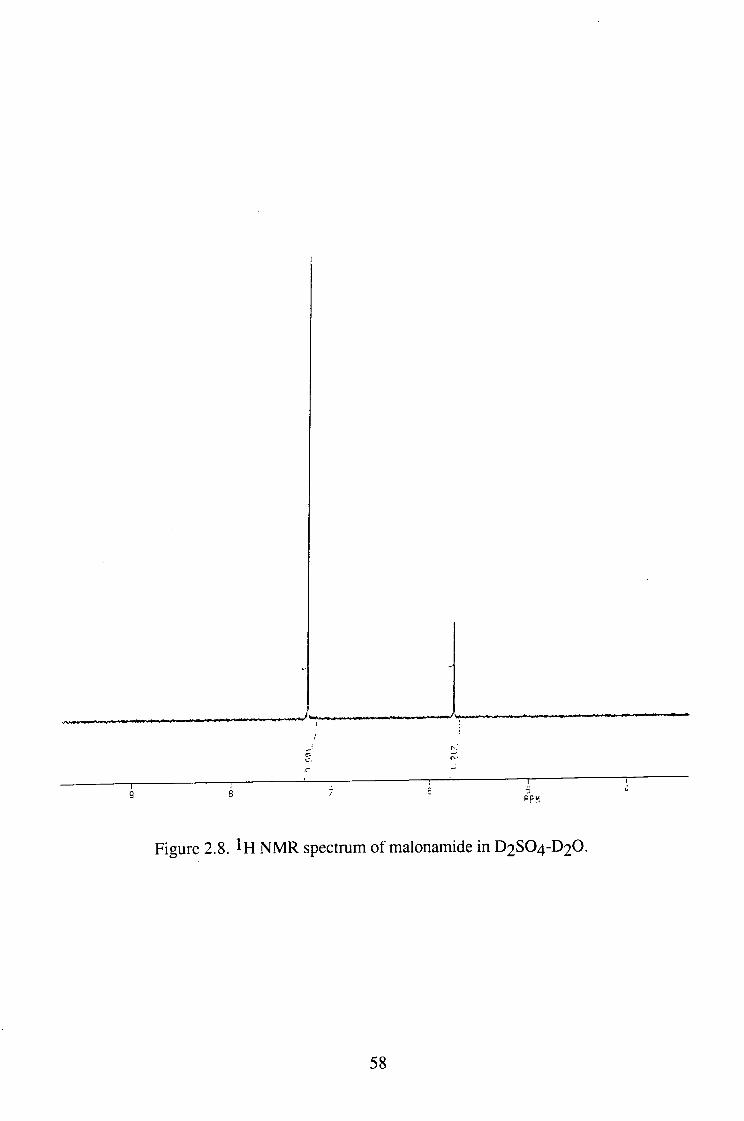
S PPM
Figure 2.8. NMR spectrum of malonamide in D2SO4-D2O.
58
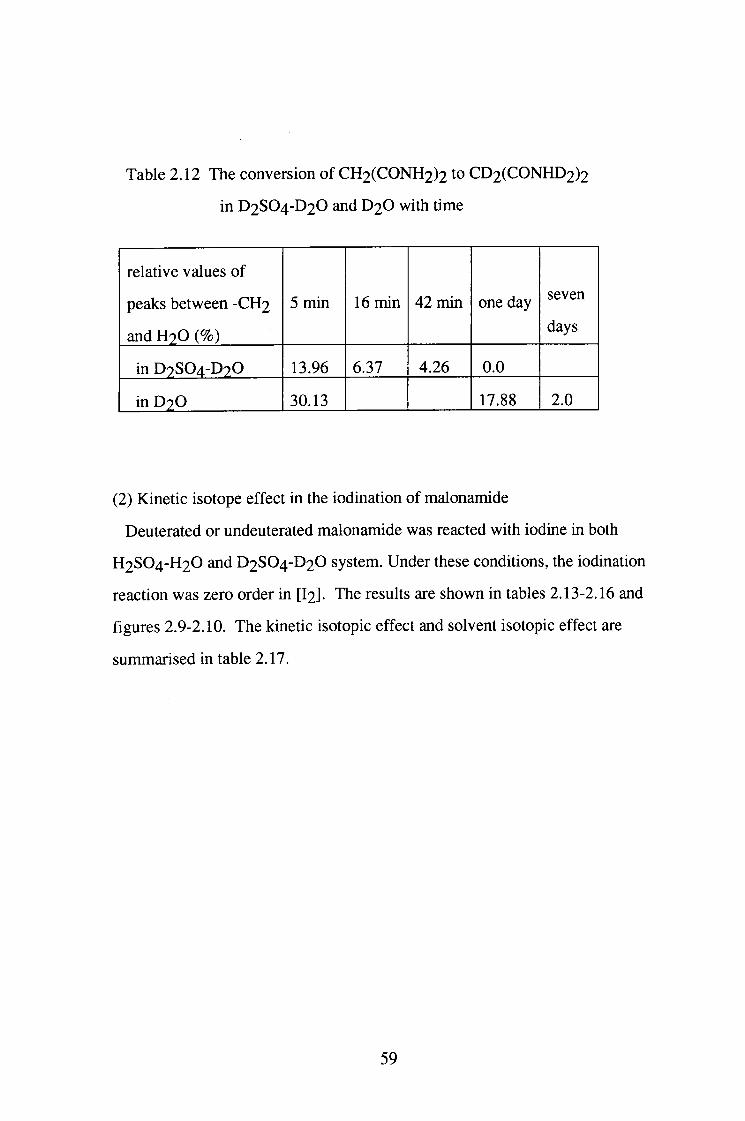
Table 2.12 The conversion of CH2(CONH2)2 to CD2(CONHD2)2
in D2SO4-D2O and D 2 O with time
relative values of
peaks between -CH2
and H2O (%)
5 min 16 min 42 min one day seven
days
in D2SO4-D2O 13.96 6.37 4.26 0.0
in D 2 O 30.13 17.88 2.0
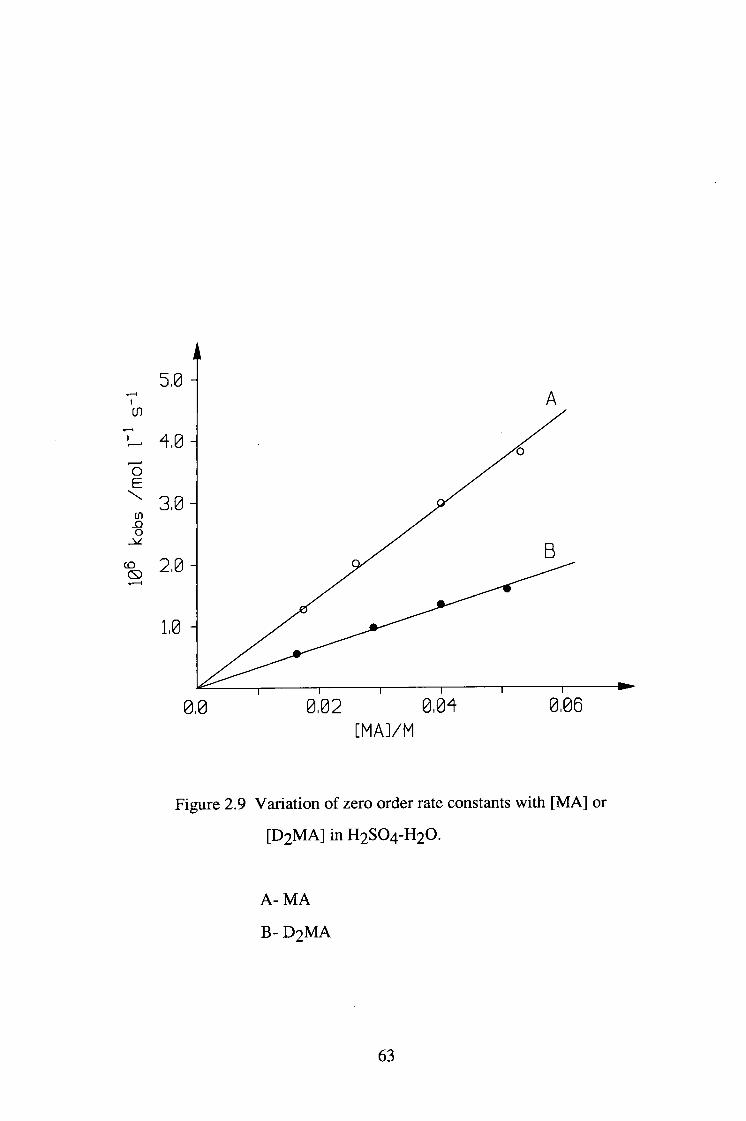
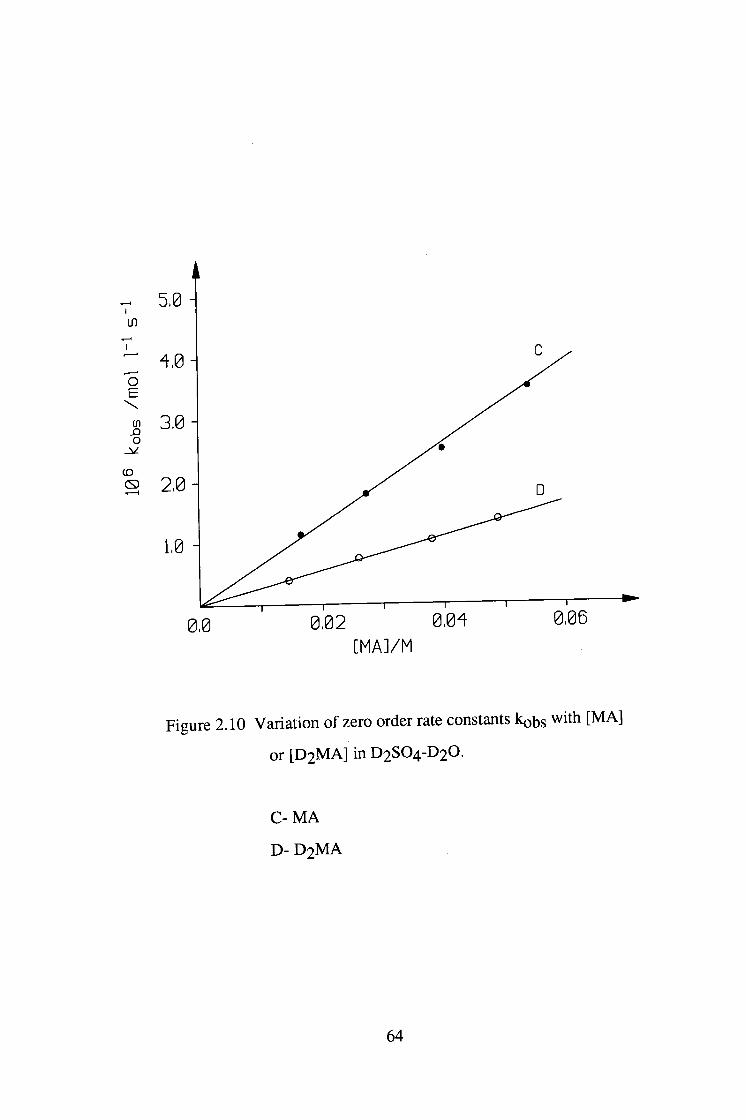
(2) Kinetic isotope effect in the iodination of malonamide
Deuterated or undeuterated malonamide was reacted with iodine in both
H2SO4-H2O and D2SO4-D2O system. Under these conditions, the iodination
reaction was zero order in [ I2 ] . The results are shown in tables 2.13-2.16 and
figures 2.9-2.10. The kinetic isotopic effect and solvent isotopic effect are
summarised in table 2.17.
59
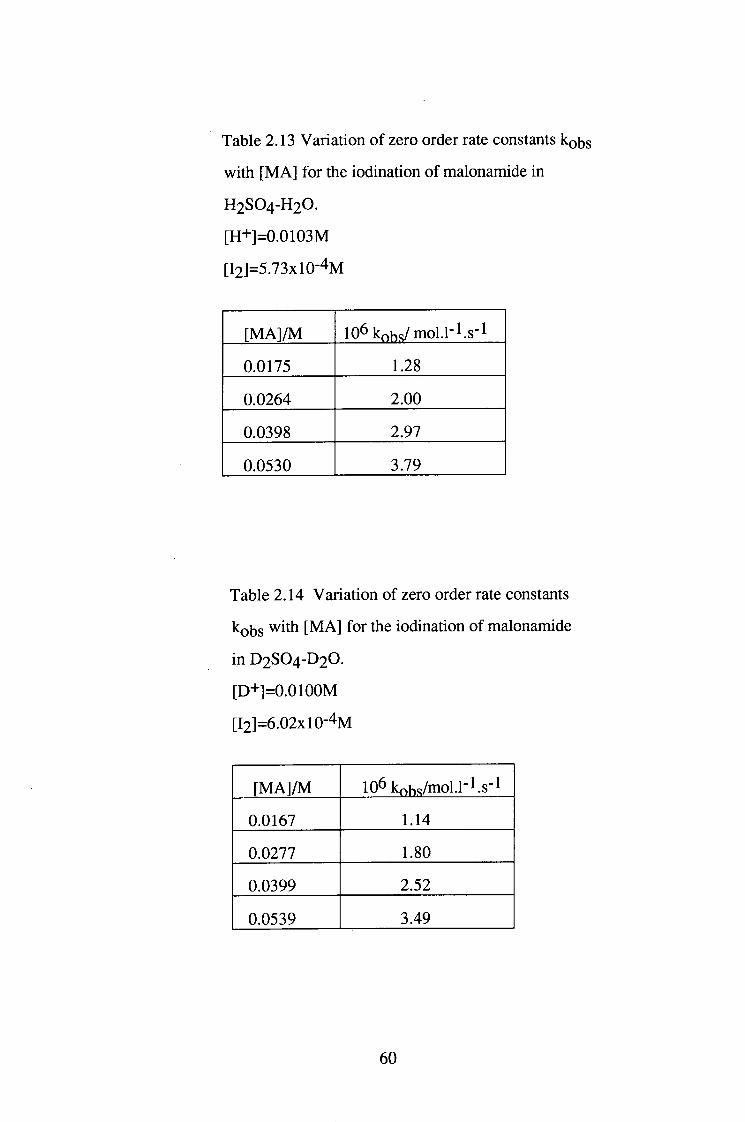
Table 2.13 Variation of zero order rate constants kobs
with [ M A ] for the iodination of malonamide in
H2SO4-H2O.
[H+]=0.0103M
[ I2]=5 .73X10-4M
[ M A ] / M lO^kohs/ mol.l-l.s-1
0.0175 1.28
0.0264 2.00
0.0398 2.97
0.0530 3.79
Table 2 .14 Variation of zero order rate constants
kQ5s with [ M A ] for the iodination of malonamide
in D2SO4-D2O.
[D+]=0.0100M
[ I2]=6 .02X10-4M
[ M A ] / M 106 kohs/mol.l-l.s-1
0.0167 1.14
0.0277 1.80
0.0399 2.52
0.0539 3.49
60
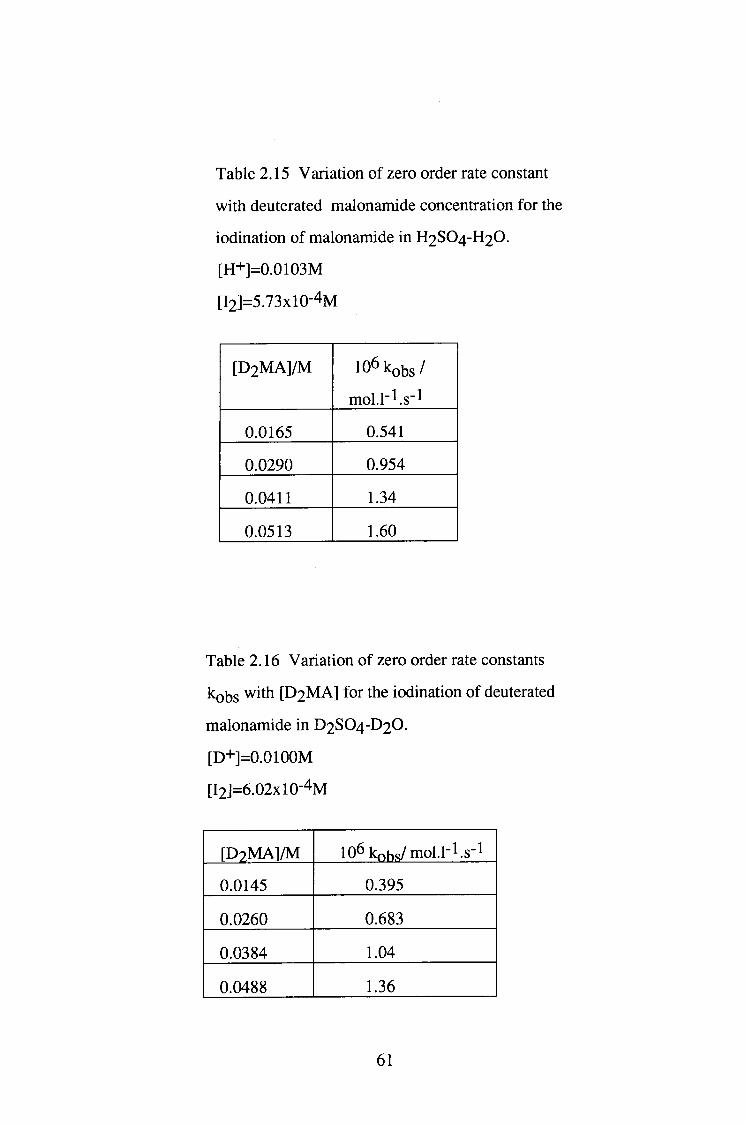
Table 2.15 Variation of zero order rate constant
with deuterated malonamide concentration for the
iodination of malonamide in H2SO4-H2O.
[H+]=0.0103M
[I2]=5.73X10⁻⁴M
[ D 2 M A ] / M 106kobs/
mol.l'l.s'l
0.0165 0.541
0.0290 0.954
0.0411 1.34
0.0513 1.60
Table 2.16 Variation of zero order rate constants
kobs with [ D 2 M A ] for the iodination of deuterated
malonamide in D2SO4-D2O.
[D+]=0.0100M
[I2]=6.02X10⁻⁴M
[ D 2 M A ] / M 106 kohs/ mol.l-l.s-1
0.0145 0.395
0.0260 0.683
0.0384 1.04
0.0488 1.36
61
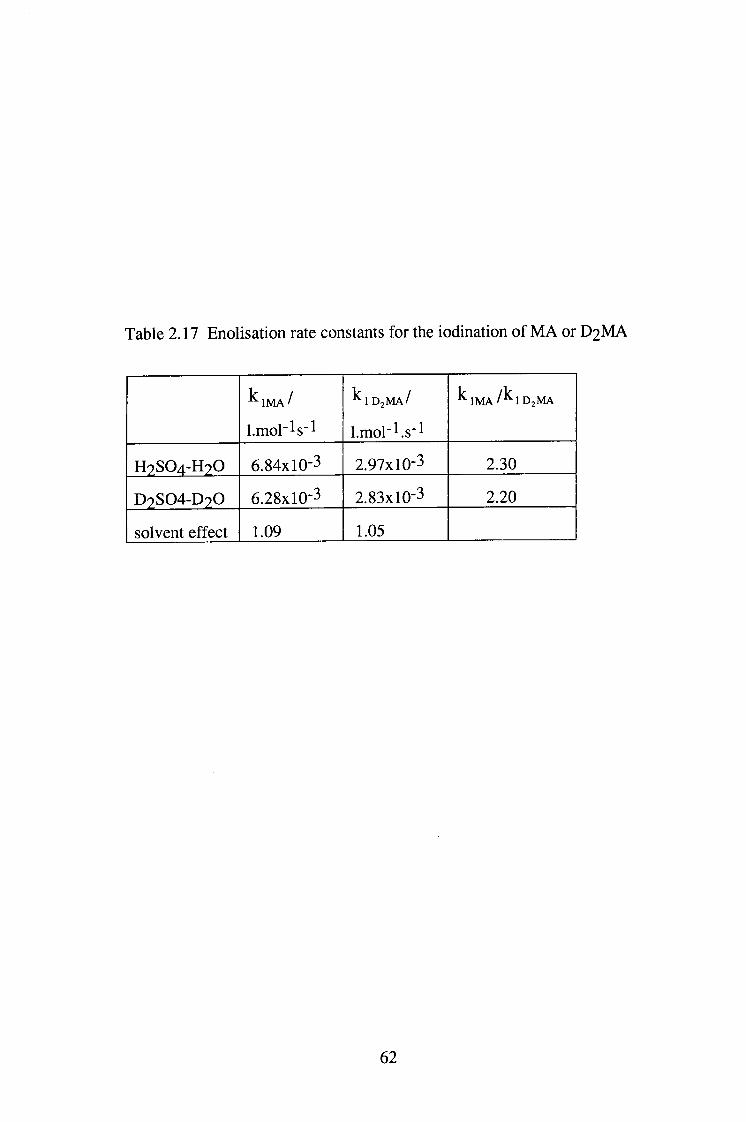
Table 2.17 Enolisation rate constants for the iodination of MA or D 2 M A
^ I M A /
l.mol'ls"!
^ 1 D 2 M A /
Lmol'^.s-l
^ I M A / ^ I D J M A
H 9 S 0 4 - H 2 0 6.84x10⁻³ 2.97x10⁻³ 2.30
D 9 S 0 4 - D 2 0 6.28x10⁻³ 2.83x10⁻³ 2.20
solvent effect 1.09 1.05
62
- 2,0
[MAJ/M
Figure 2.9 Variation of zero order rate constants with [MA] or
[ D 2 M A ] in H2SO4-H2O.
A- MA
B- D 2 M A
63
^ 5,0
<f 3,0
2,0
0,0 0,02 0.0" [MAl/M
0,06
Figure 2.10 Variation of zero order rate constants kobs with [MA]
or [ D 2 M A ] in D2SO4-D2O.
C- MA
D- D 2 M A
64
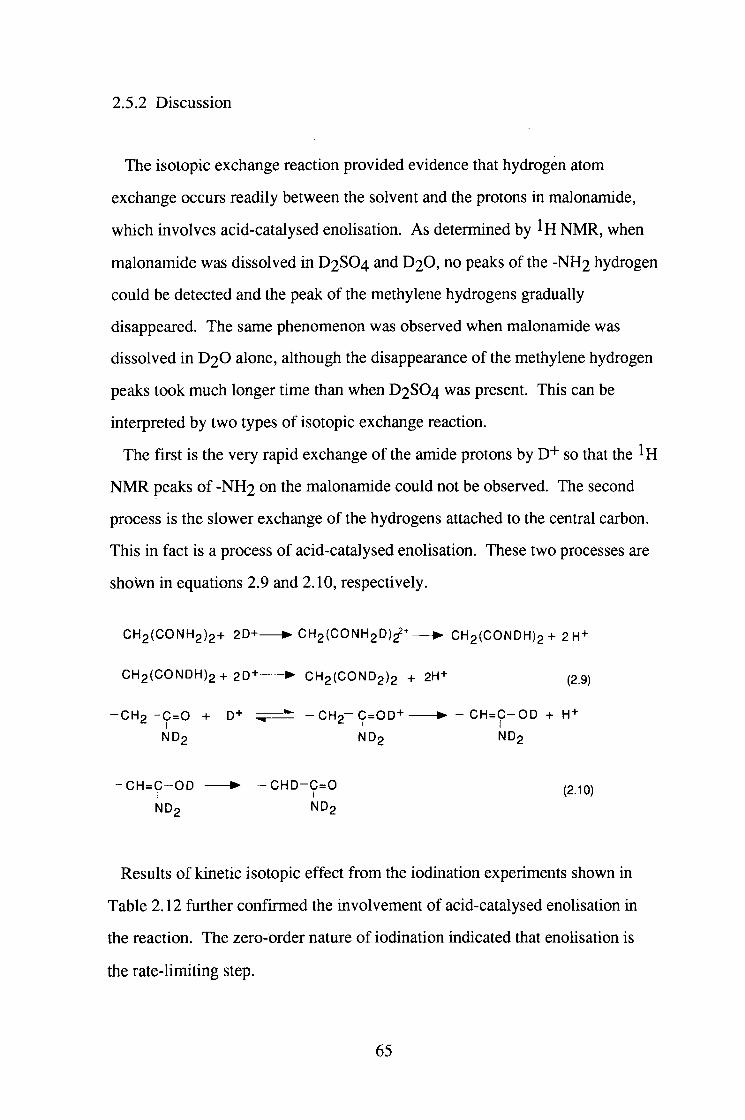
2.5.2 Discussion
The isotopic exchange reaction provided evidence that hydrogen atom
exchange occurs readily between the solvent and the protons in malonamide,
which involves acid-catalysed enolisation. As determined by NMR, when
malonamide was dissolved in D2SO4 and D2O, no peaks of the -NH2 hydrogen
could be detected and the peak of the methylene hydrogens gradually
disappeared. The same phenomenon was observed when malonamide was
dissolved in D 2 O alone, although the disappearance of the methylene hydrogen
peaks took much longer time than when D2SO4 was present. This can be
interpreted by two types of isotopic exchange reaction.
The first is the very rapid exchange of the amide protons by D+ so that the
NMR peaks of - N H 2 on the malonamide could not be observed. The second
process is the slower exchange of the hydrogens attached to the central carbon.
This in fact is a process of acid-catalysed enolisation. These two processes are
shown in equations 2.9 and 2.10, respectively.
CH2{CONH2)2+ 2D+ • CH2(CONH2D)^+ • CH2(CONDH)2 + 2 H +
CH2(CONDH)2+ 2D+ • CH2(COND2)2 + 2H+ (2.9)
- C H o - C = 0 + D+ ^ - C H 2 - C = 0 D + • - CH = C - O D + H +
NDo NDo NDp
CH = C - O D • - C H D - C = 0 (2.10)
ND2 NDg
Results of kinetic isotopic effect from the iodination experiments shown in
Table 2.12 further confirmed the involvement of acid-catalysed enohsation in
the reaction. The zero-order nature of iodination indicated that enolisation is
the rate-limiting step.
65
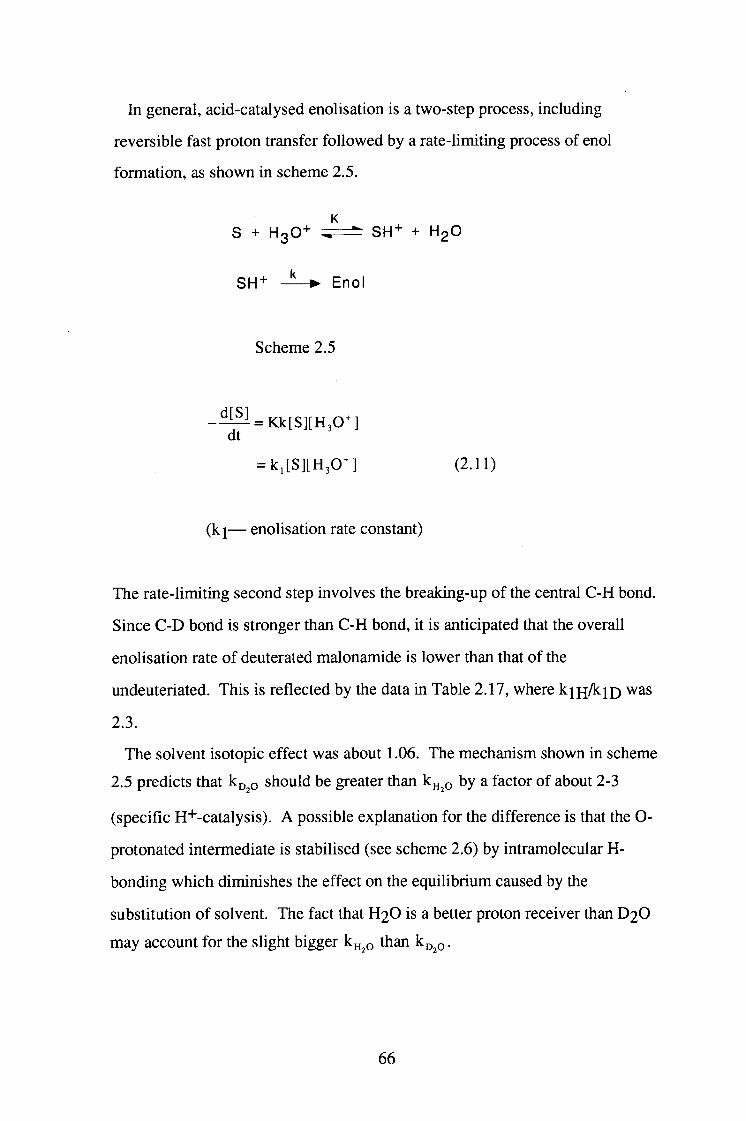
In general, acid-catalysed enolisation is a two-step process, including
reversible fast proton transfer followed by a rate-limiting process of enol
formation, as shown in scheme 2.5.
K S + H 3 O + — ^ S H + + H 2 O
S H + E n o l
Scheme 2.5
_ ^ = Kk[S][H30n dt
= k,[S][H30n (2.11)
( k j — enoHsation rate constant)
The rate-limiting second step involves the breaking-up of the central C-H bond.
Since C-D bond is stronger than C-H bond, it is anticipated that the overall
enolisation rate of deuterated malonamide is lower than that of the
undeuteriated. This is reflected by the data in Table 2.17, where kjH/ki j ) was
2.3.
The solvent isotopic effect was about 1.06. The mechanism shown in scheme 2.5 predicts that k o should be greater than k o by a factor of about 2-3
(specific H+-catalysis). A possible explanation for the difference is that the O-
protonated intermediate is stabilised (see scheme 2.6) by intramolecular H-
bonding which diminishes the effect on the equilibrium caused by the
substitution of solvent. The fact that H2O is a better proton receiver than D2O
may account for the sUght bigger k^ Q than k^ g •
66
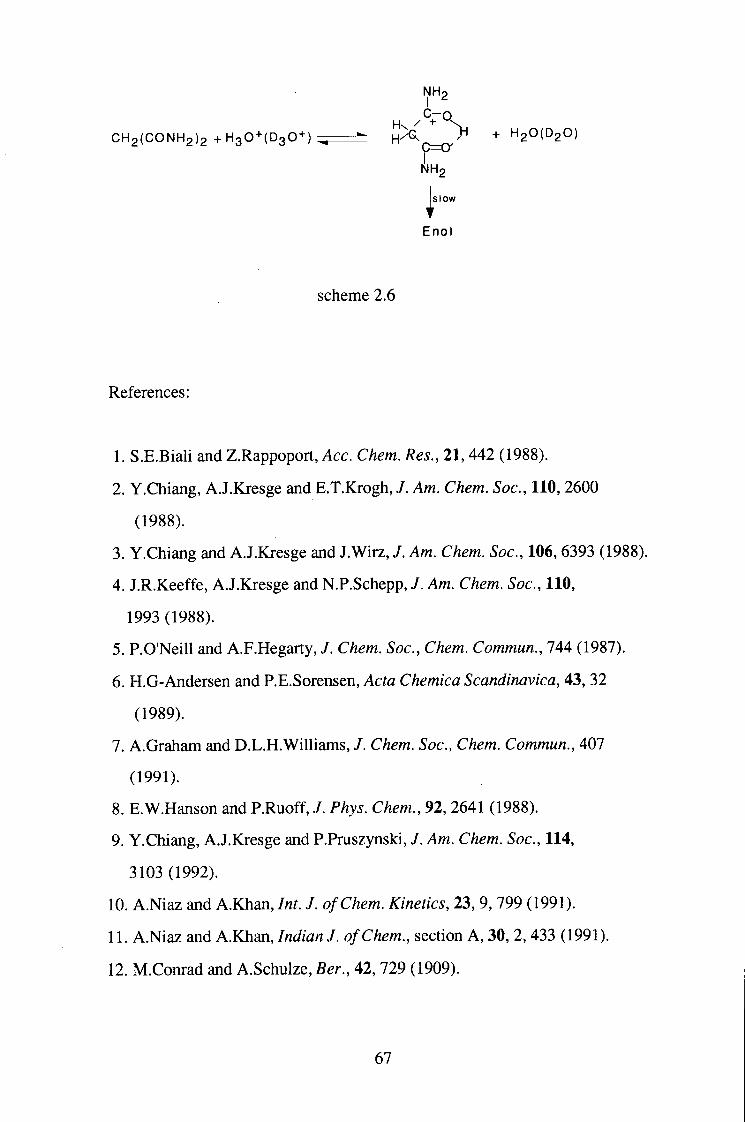
NH2
CH2(CONH2)2 + H 3 0 + ( D 3 0 + ) ^ i=^ H ^ . ^ ' + H 2 0 ( D 2 0 )
NH2
s •
slow
Enol
scheme 2.6
References:
1. S.E.BiaU and Z.Rappoport, Acc. Chem. Res., 21,442 (1988).
2. Y.Chiang, A.J.Kresge and E.T.Krogh, J. Am. Chem. Soc, 110, 2600
(1988) .
3. Y.Chiang and A.J.Kresge and J.Wirz, J. Am. Chem. Soc, 106, 6393 (1988).
4. J.R.Keeffe, A.J.Kresge and N.P.Schepp, J. Am. Chem. Soc, 110,
1993 (1988).
5. P.O'Neill and A.F.Hegarty, / . Chem. Soc, Chem. Commun., 744 (1987).
6. H.G-Andersen and P.E.Sorensen, Acta Chemica Scandinavica, 43, 32
(1989) .
7. A.Graham and D.L.H.Williams, / . Chem. Soc, Chem. Commun., 407
(1991).
8. E.W.Hanson and P.Ruoff, J. Phys. Chem., 92, 2641 (1988).
9. Y.Chiang, A.J.Kresge and P.Pruszynski, / . Am. Chem. Soc, 114,
3103 (1992).
10. A.Niaz and A.Khan, Int. J. of Chem. Kinetics, 23, 9, 799 (1991).
11. A.Niaz and A.Khan, Indian J. of Chem.., section A, 30, 2, 433 (1991).
12. M.Conrad and A.Schulze, Ber., 42, 729 (1909).
67
13. M.Botta, F.D.AngeUs and R.Nicoletti,/. Heterocyclic Chem., 16, 193
(1979). 14. G.Stedman and P.A.E.Whincup, / . Chem. Soc, 5796 (1963).
15. H.Schmid and M.G.Fouad, Ibid., 88, 631 (1957).
16. A.Graham and D.L.H.Williams, J. Chem. Soc, Perkin Trans. 2,
747 (1992). 17. P.H.Beloso, P.Roy and D.L.H.Williams,/. Chem. Soc, Perkinl, 17 (1991).
18. M.Crookes, P.Roy and D.L.H.Williams, J. Chem. Soc, Perkin 2, 1015
(1989).
19. R.G.Pearson and R.L.Dillon, / . Am. Chem. Soc, 75, 439 (1953).
20. J.R.Leis, M.E.Pena, D.L.H.Williams and S.D.Mawson,/. Chem. Soc,
Perkin 2, 157 (1988).
21. Y.Chiang, A.J.Kresge and Y.S.Tang,/. Am. Chem. Soc, 106, 460 (1984).
68
C H A P T E R 3
BROIVIINATION O F M A L O N I C A C I D
69
3.1. Introduction
The bromination and iodination of malonic acid(MAL) has been studied for a
long time [1-3]. The involvement of the enol tautomer as an intermediate for
these reactions has been reported in the early workt^]. Under certain
experimental conditions, the reaction was foimd to be zero order in [halogen],
indicating that the rate limiting enolisation is followed by halogenation of the
enol, enolate ion, enol carboxylate anion or protonated enol forms depending on
the pH of the medium.
Recently, the rate constant for enolisation of malonic acid has been measured
through an isotopic-exchange reaction using ^H NMR spectroscopy[5] and by
the kinetic studies of halogenation and nitrosationt^]. The values are all in
reasonable agreement.
There can be both acid and base catalysed enolisation for the 6-dicarbonyl
compounds, whose enol tautomer can be stabilised by the formation of
intramolecular hydrogen bonded ring structure. For malonic acid, Leopold and
Haim[^] have proposed a mechanism involving intramolecular acid-catalysis via
a six-membered ring transition state at high acidity. The process involves the
transfer of a proton from one of the two carboxylic acid groups to the carbonyl
oxygen of the other acid group. Williams and Graham's work has also
confirmed this mechanism through bromination and iodination of malonic acid.
However, base catalysed reaction of malonic acid has not been fully
investigated. Bhalet^] noted that the rate equation for enolisation of malonic
acid consisted of two kinetic terms (see equation 3.1).
Rate=k[MAL] + k'[MAL]2 (3.1)
The term [MAL]2 seems to be related to base catalysed process brought about
by the malonate ion, but no mechanistic explanation was given in the paper.
70
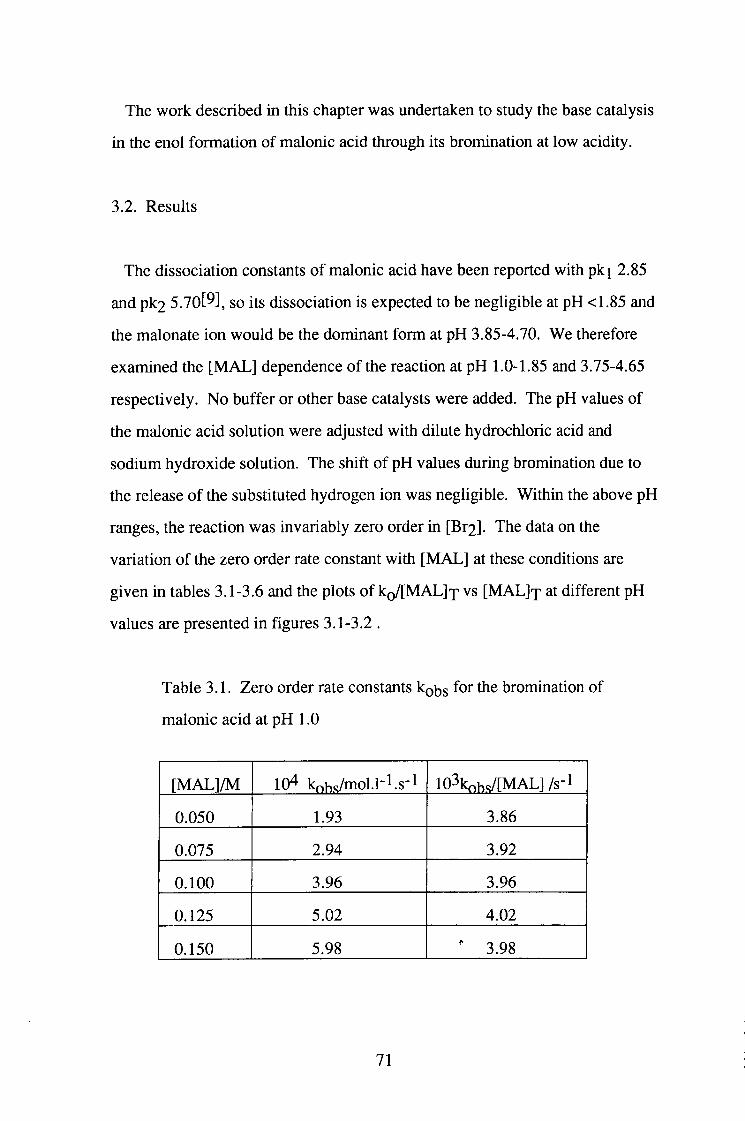
The work described in this chapter was undertaken to study the base catalysis
in the enol formation of malonic acid through its bromination at low acidity.
3.2. Results
The dissociation constants of malonic acid have been reported with pkj 2.85
and pk2 5.70[9], so its dissociation is expected to be negligible at pH <1.85 and
the malonate ion would be the dominant form at pH 3.85-4.70. We therefore
examined the [MAL] dependence of the reaction at pH 1.0-1.85 and 3.75-4.65
respectively. No buffer or other base catalysts were added. The pH values of
the malonic acid solution were adjusted with dilute hydrochloric acid and
sodium hydroxide solution. The shift of pH values during bromination due to
the release of the substituted hydrogen ion was negUgible. Within the above pH
ranges, the reaction was invariably zero order in [Br2]. The data on the
variation of the zero order rate constant with [MAL] at these conditions are
given in tables 3.1-3.6 and the plots of ko/[MAL]x vs [MAL]x at different pH
values are presented in figures 3.1-3.2 .
Table 3.1. Zero order rate constants kgbs for the bromination of
malonic acid at pH 1.0
[MAL]/M 104 kohs/mol.l-l.s-1 103kohs/[MAL] /s-1
0.050 1.93 3.86
0.075 2.94 3.92
0.100 3.96 3.96
0.125 5.02 4.02
0.150 5.98 ' 3.98
71
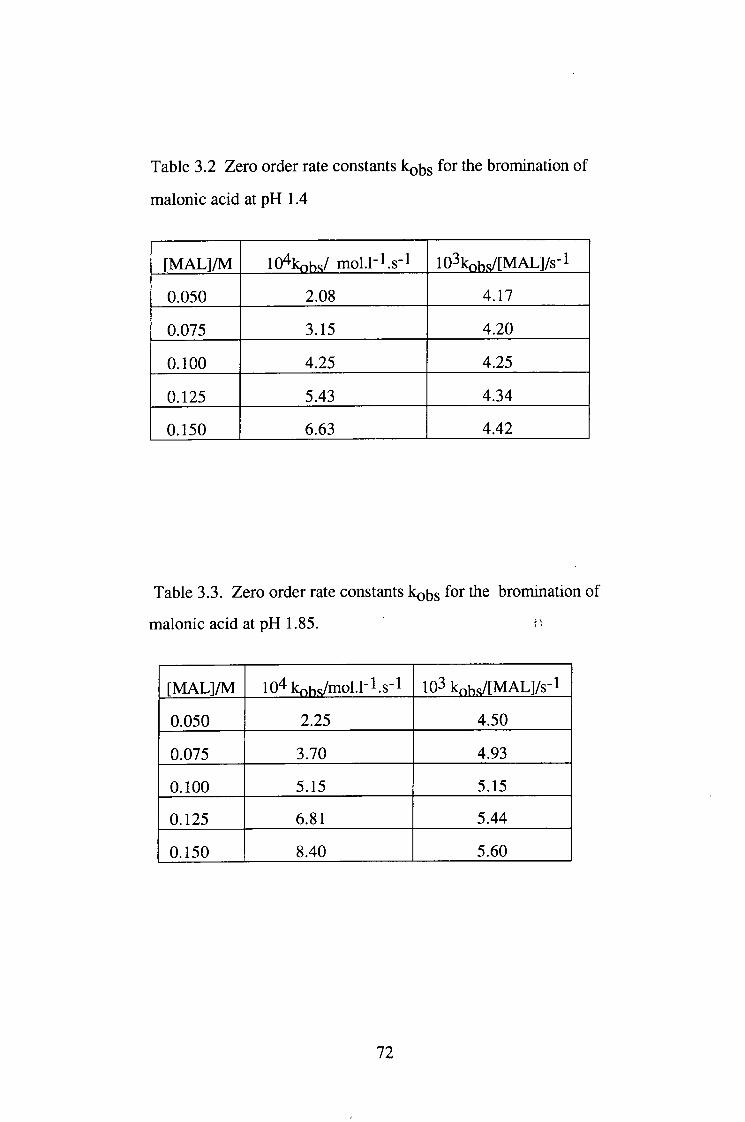
Table 3.2 Zero order rate constants JCQ S for the bromination of
malonic acid at pH 1.4
[MAL]/M lO^kohs/ mol.l-l.s-1 103koh.s/[MAL]/s-l
0.050 2.08 4.17
0.075 3.15 4.20
0.100 4.25 4.25
0.125 5.43 4.34
0.150 6.63 4.42
Table 3.3. Zero order rate constants ko^s for the bromination of
malonic acid at pH 1.85.
[MAL]/M lO^kohs/mol.l-l.s-l 103 kohs/[MAL]/s-l
0.050 2.25 4.50
0.075 3.70 4.93
0.100 5.15 5.15
0.125 6.81 5.44
0.150 8.40 5.60
72
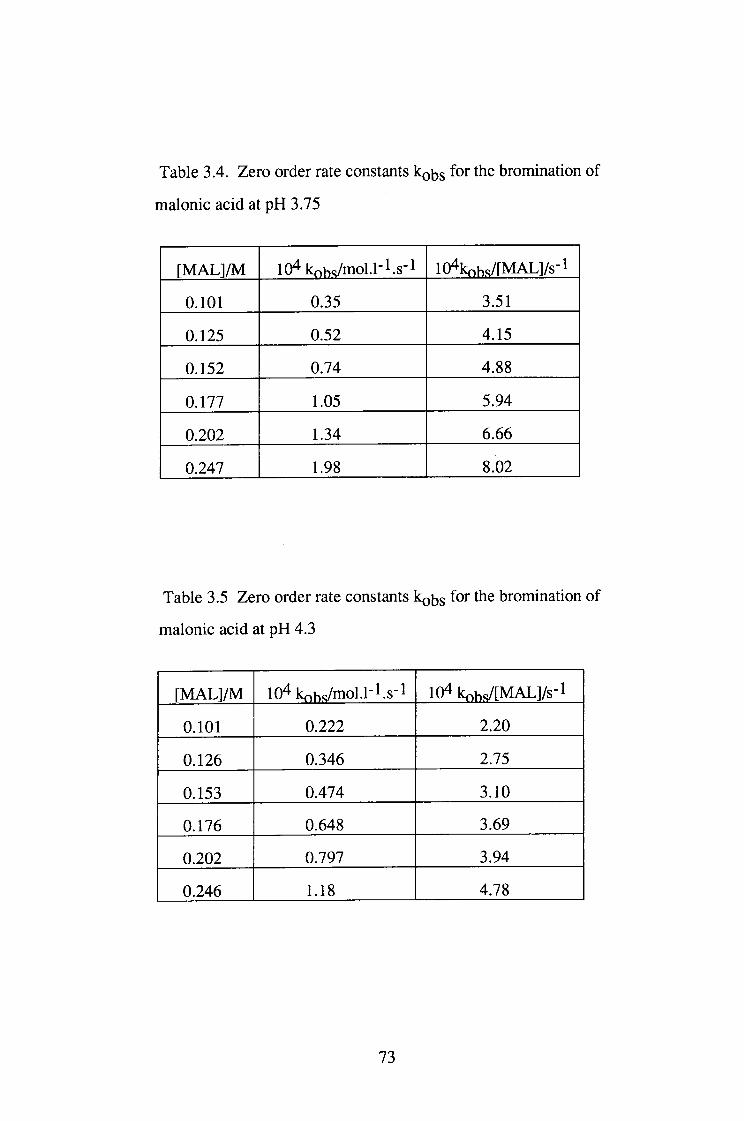
Table 3.4. Zero order rate constants kobs ^^r the bromination of
malonic acid at pH 3.75
[MAL]/M lO^kohs/mol.l-l.s-l 104kohs/[MAL]/s-l
0.101 0.35 3.51
0.125 0.52 4.15
0.152 0.74 4.88
0.177 1.05 5.94
0.202 1.34 6.66
0.247 1.98 8.02
Table 3.5 Zero order rate constants JCQ S for the bromination
malonic acid at pH 4.3
[MAL]/M lO^kohs/mol.l-l.s-l 104 kohs/[MAL]/s-l
0.101 0.222 2.20
0.126 0.346 2.75
0.153 0.474 3.10
0.176 0.648 3.69
0.202 0.797 3.94
0.246 1.18 4.78
73
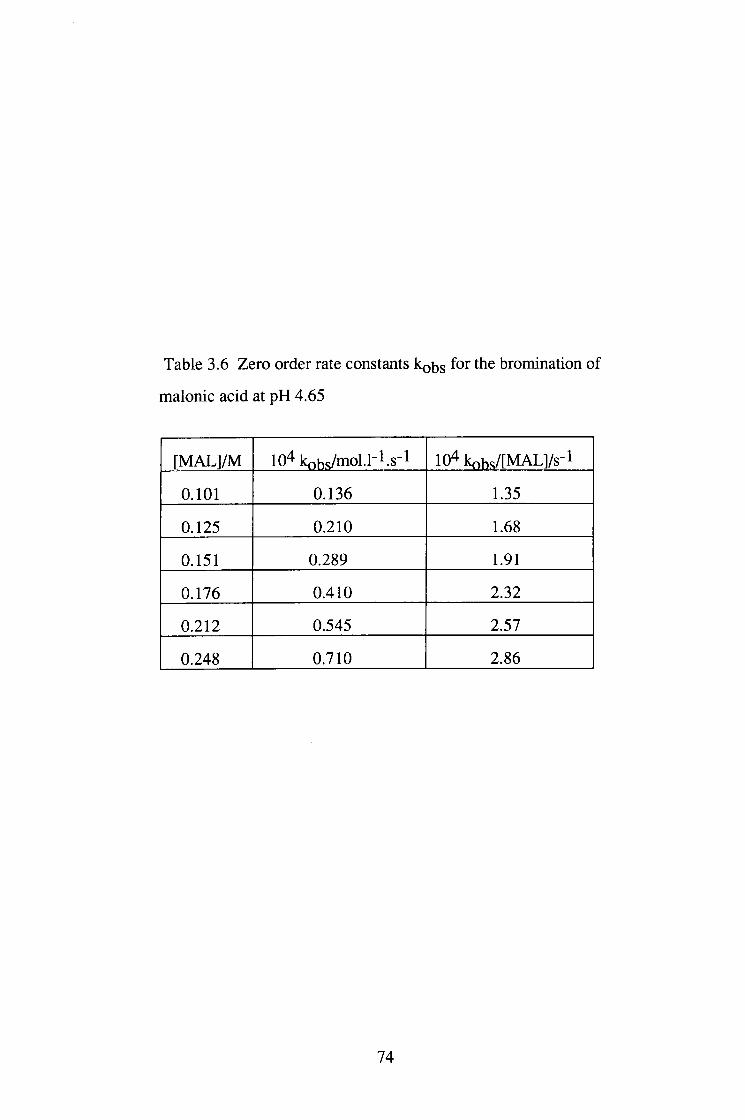
Table 3.6 Zero order rate constants kobs for the bromination of
malonic acid at pH 4.65
[MAL]/M 104 kohs/mol.l-l.s-1 104kohs/[MAL]/s-l
0.101 0.136 1.35
0.125 0.210 1.68
0.151 0.289 1.91
0.176 0.410 2.32
0.212 0.545 2.57
0.248 0.710 2.86
74
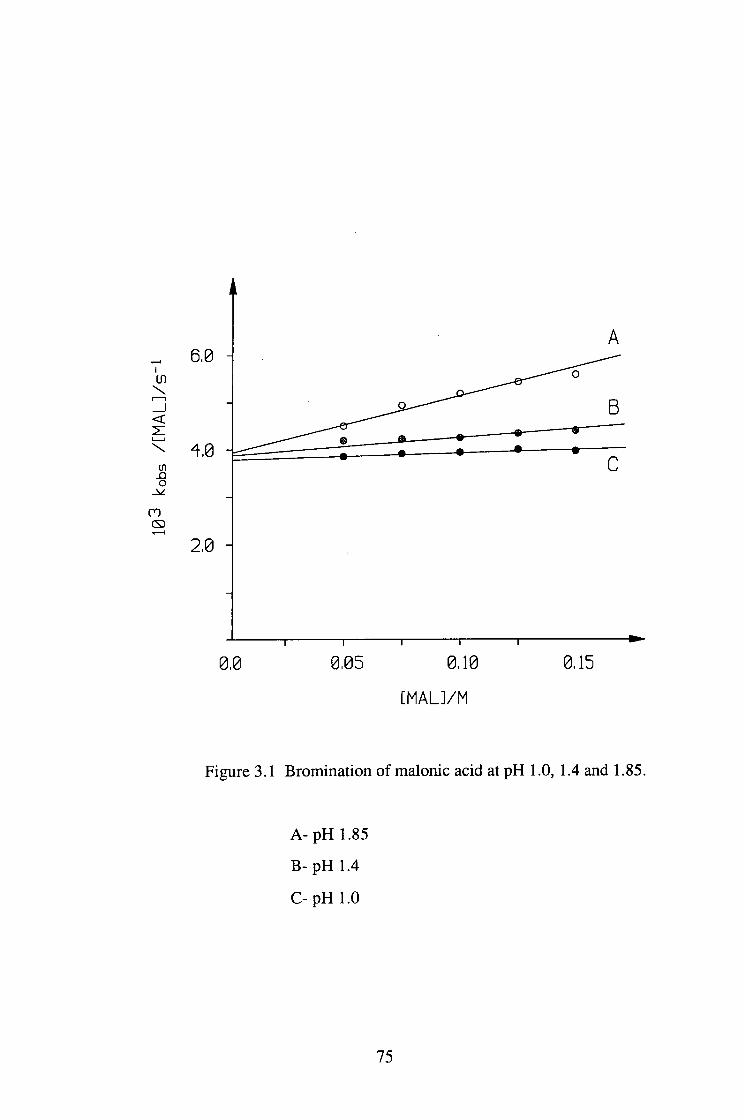
6,0 m
in o
CO
2,0
1 1 1 1 1
0,0 0,05 0,10 0,15
[ M A L l / M
Figure 3.1 Bromination of malonic acid at pH 1.0, 1.4 and 1.85.
A- pH 1.85
B-pH 1.4
C- pH 1.0
75
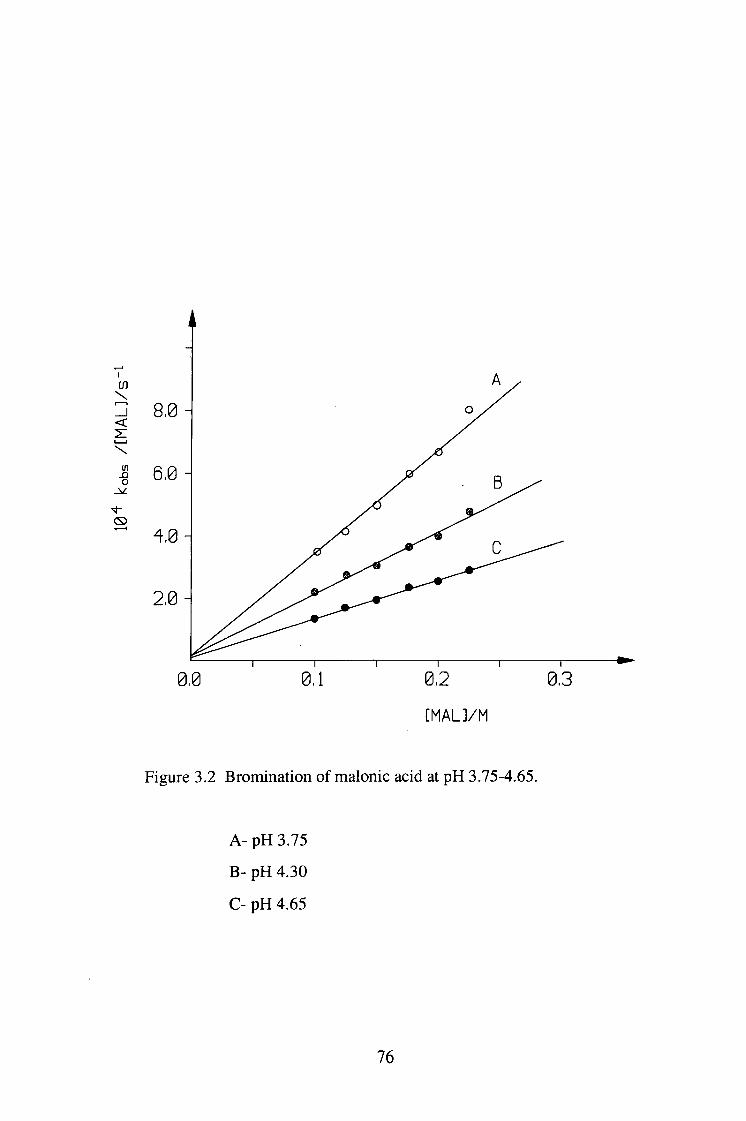
I
\
m X) o
[ M A L l / M
Figure 3.2 Bromination of malonic acid at pH 3.75-4.65.
A- pH 3.75
B- pH 4.30
C- pH 4.65
76
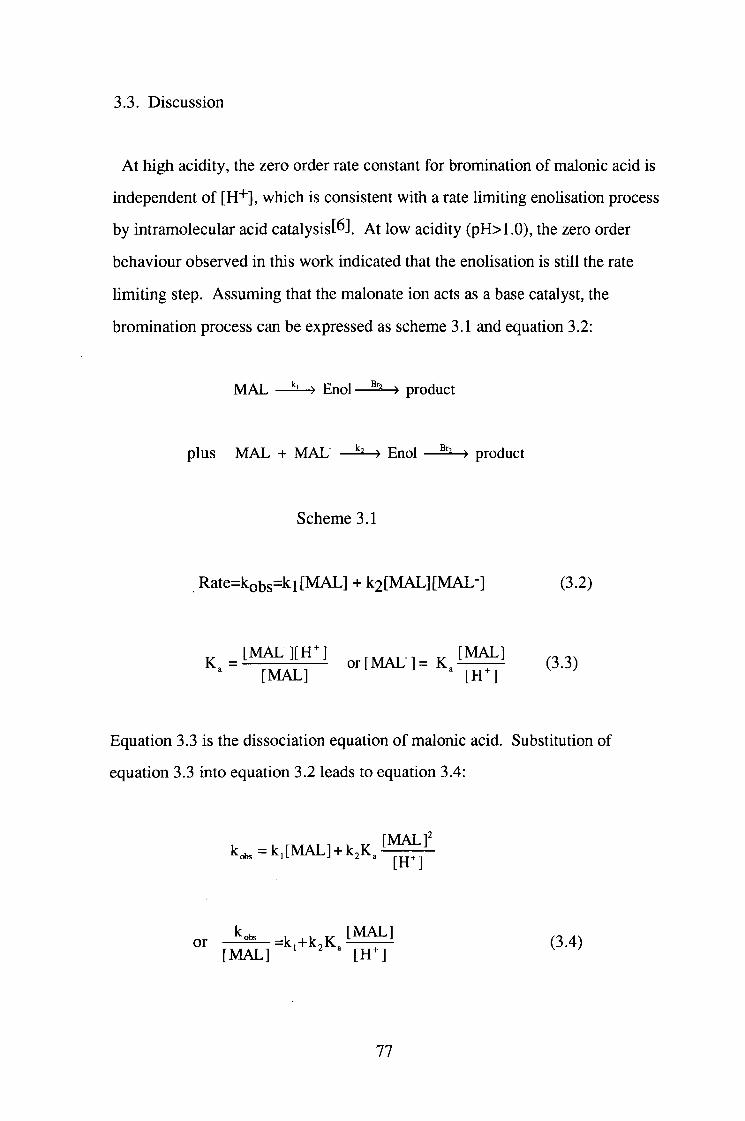
3.3. Discussion
At high acidity, the zero order rate constant for bromination of malonic acid is
independent of [H+], which is consistent with a rate limiting enolisation process
by intramolecular acid catalysist^]. At low acidity (pH>1.0), the zero order
behaviour observed in this work indicated that the enolisation is still the rate
limiting step. Assuming that the malonate ion acts as a base catalyst, the
bromination process can be expressed as scheme 3.1 and equation 3.2:
MAL — ^ E n d — ^ product
plus MAL + MAL" End — ^ product
Scheme 3.1
Rate=kobs=kl [MAL] + k2[MAL][MAL-] (3.2)
[ M A U p n , , [ M A L 1 = K . I ^ (3.3) [MAL] ' [H^]
Equation 3.3 is the dissociation equation of malonic acid. Substitution of
equation 3.3 into equation 3.2 leads to equation 3.4:
k^ ,=k , [MAL] + k , K , ^ ^ ^ ^
or J ^ = k , + k , K . I ^ (3.4) [MAL] [H^]
77
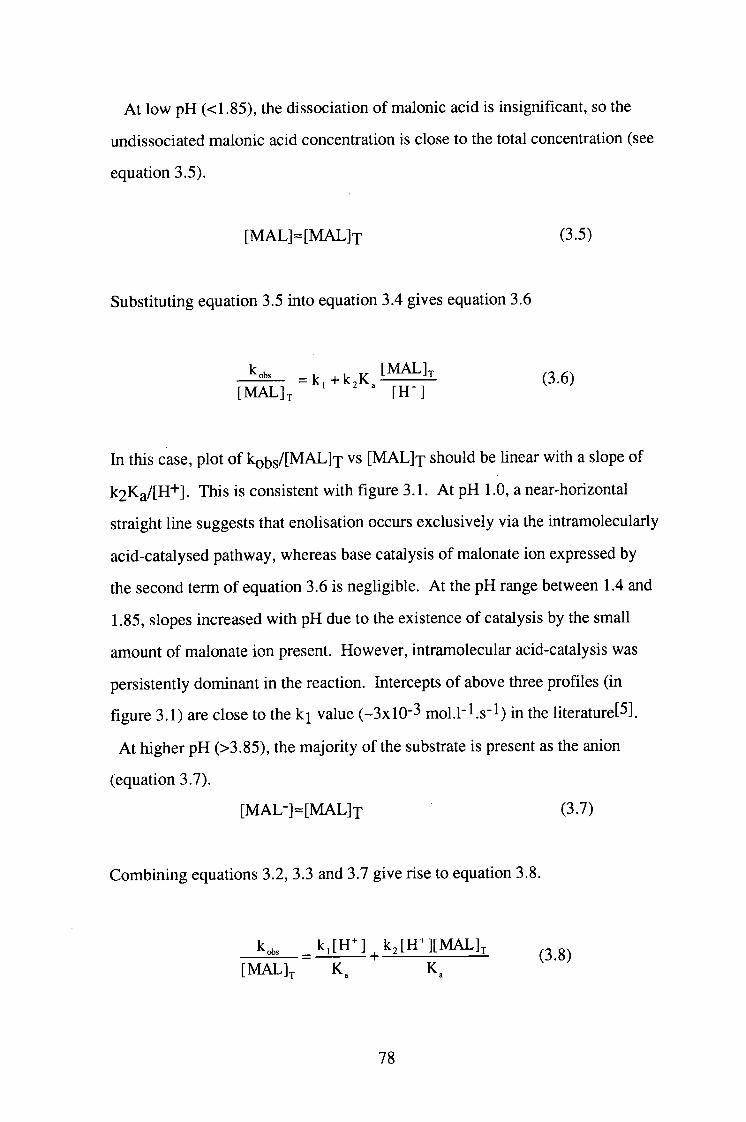
At low pH (<1.85), the dissociation of malonic acid is insignificant, so the
imdissociated malonic acid concentration is close to the total concentration (see
equation 3.5).
[ M A L ] = [ M A L ] T (3.5)
Substituting equation 3.5 into equation 3.4 gives equation 3.6
[ m a l ] , ' [un = v + k , K i ^ ^ (3.6)
In this case, plot of kQ5s/[MAL]7 vs [ M A L j j should be hnear with a slope of
k2Ka/[H+]. This is consistent with figure 3.1. At pH 1.0, a near-horizontal
straight line suggests that enolisation occurs exclusively via the intramolecularly
acid-catalysed pathway, whereas base catalysis of malonate ion expressed by
the second term of equation 3.6 is neghgible. At the pH range between 1.4 and
1.85, slopes increased with pH due to the existence of catalysis by the small
amount of malonate ion present. However, intramolecular acid-catalysis was
persistently dominant in the reaction. Intercepts of above three profiles (in
figure 3.1) are close to the k j value (~3xlO-3 mol.l'l.s"!) in the literature[5].
At higher pH (>3.85), the majority of the substrate is present as the anion
(equation 3.7).
[ M A L - ] « [ M A L ] T (3.7)
Combining equations 3.2, 3.3 and 3.7 give rise to equation 3.8.
k^, _ k , [ H n , k J H - ] [ M A L ] , [MAL] ,
78
The slopes (k2[H+]/Ka) of plots kobs/[MAL]x vs [ M A L ] ^ increased with [H+]
or decreased with pH as shown in figure 3.2. Now the enolisation reaction is
mainly via the malonate ion catalysed pathway. An average value of k2 is (5.03
±1.8)xl0-2 l.mol-l.s-1.
References:
1. K.H.Meyer, Ber., 45, 2864 (1912).
2. R.W.West,/. Chem. Soc, 125, 1280 (1924).
3. S.D.Furrow, Int. J. Chem. Kinet., 11, 131 (1979).
4. V.M.Bhale, K.V.N.Rao and S.L.Bafna, J. Sci. Ind. Res.(]ndia), 20B,
128(1961)
5. E.W.Hansen, P.Ruoff,/. Phys. Chem., 92, 2641 (1988).
6. D.L.H.Williams and A.Graham, Tetrahedron, 48, 7973 (1992).
7. K.R.Leopold and A.Haim, Int. J. Chem. Kinet., 9, 83 (1977).
8. V.M.Bhale, S.L.Bafna and W.V.Z.Bhagwat, Z. Phys. Chem., 12, 298 (1957).
9. D.J.G.Ives and D.Prasad,/. Chem. 5oc.(B),1649 (1970).
79
C H A P T E R 4
E X P E R I M E N T A L D E T A I L S
80
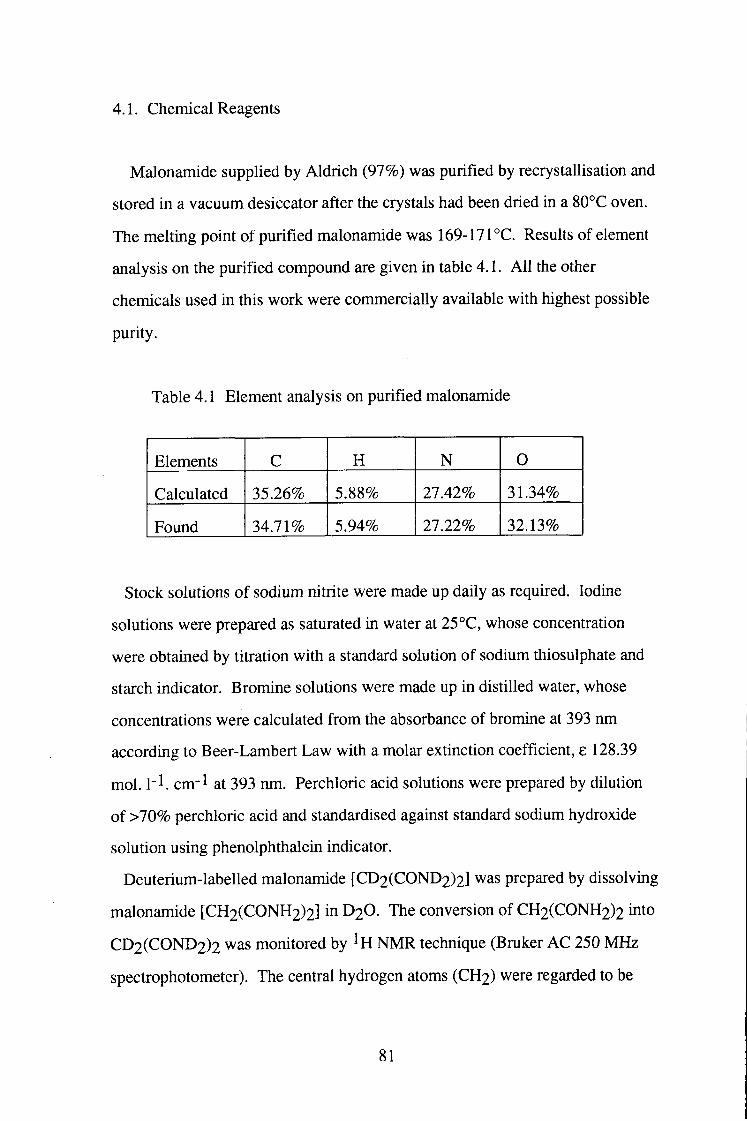
4.1. Chemical Reagents
Malonamide supphed by Aldrich (97%) was purified by recrystalhsation and
stored in a vacuum desiccator after the crystals had been dried in a 80°C oven.
The melting point of purified malonamide was 169-171°C. Results of element
analysis on the purified compound are given in table 4.1. Al l the other
chemicals used in this work were commercially available with highest possible
purity.
Table 4.1 Element analysis on purified malonamide
Elements C H N 0
Calculated 35.26% 5.88% 27.42% 31.34%
Found 34.71% 5.94% 27.22% 32.13%
Stock solutions of sodium nitrite were made up daily as required. Iodine
solutions were prepared as saturated in water at 25°C, whose concentration
were obtained by titration with a standard solution of sodium thiosulphate and
starch indicator. Bromine solutions were made up in distilled water, whose
concentrations were calculated from the absorbance of bromine at 393 nm
according to Beer-Lambert Law with a molar extinction coefficient, e 128.39
mol. 1"1. cm"l at 393 nm. Perchloric acid solutions were prepared by dilution
of >70% perchloric acid and standardised against standard sodium hydroxide
solution using phenolphthalein indicator.
Deuterium-labelled malonamide [CD2(COND2)2] was prepared by dissolving
malonamide [CH2(CONH2)2] in D2O. The conversion of CH2(CONH2)2 into
CD2(COND2)2 was monitored by NMR technique (Bruker AC 250 MHz
spectrophotometer). The central hydrogen atoms (CH2) were regarded to be
81
completely replaced by deuterium as the ^H NMR peaks of them (5 5.7 ppm)
disappeared. Then the solution was concentrated and vacuum dried.
4.2. pH measurements
A PTI-6 universal digital pH meter was used for all pH measurements, whose
accuracy is ±0.02 pH units. Al l standard buffer solutions used were made from
BDH buffer powders.
4.3. Experimental methods
4.3.1. UVA^isible spectrophotometry
Kinetic measurement for the nitrosation and iodination of malonamide were
carried out by UV/Visible spectrophotometry. A Perkin Elmer Lambda 2
instrument was connected to an Epson PC AX2. The experiment was basically
carried out as follows: (l)Two types of solutions were prepared. One was a
mixed solution containing required concentrations of the substrate compound
(MA), acid and/or catalysts. The other solution contained one of those which
reacted with the former including sodium nitrite and iodine; (2)The two
solutions were mixed according to desired proportion and a portion of the
mixture was transferred immediately with a pipette into 1cm quartz cell. The
cell was placed in the thermostatted cell holder of the spectrophotometer, and an
identical quartz cell containing distilled water was used as a reference; (3)The
reaction was measured by the change in absorbance at a fixed wavelength as a
function of time.
82
4.3.2. Stopped-flow spectrophotometry
For fast reactions of bromination of malonamide and malonic acid, rate
measurements were performed on a HI-TECH scientific SF-3 series stopped-
flow spectrophotometer (shown in figure 4.1) connected to an Apple He
microcomputer.
The typical experimental process is to prepare two solutions, typically
bromine solution and that of substrate such as malonamide. The two solutions
were stored in the two reservoirs (R) respectively. As the two syringes (Sj, S2)
were driven forward from a single position (P), equal volumes of the two
solutions were mixed at the mixing point (MP). The reaction mixture then
flowed into a third syringe (S3). Upon filling, this syringe was forced against
the stop trigger to stop the flow. At the same time, the reaction began to be
monitored.
At the observation point (OP), the beam of monochromatic light passed
through the cell containing the reaction mixture and its intensity is converted
into an electiical signal and amplified by the photomultiplier. The output
voltage across the photomultipher with no absorbing species in the cell is
approximately -6v, known as standing voltage. When the reaction starts, the
changing absorbance in solution causes a small voltage change which
superimposed on the standing voltage. In order to allow this small change to be
amplified by the recording equipment, an equal but opposite voltage is applied
to the standing voltage. The observed rate constants were calculated by
observing the voltage variation with time. A kinetic analysis run by the Apple
He microcomputer supplied by HI-TECH was used in the case of first order
observed rate constants. Zero order rate constants were calculated manually by
the voltage change with time.
83
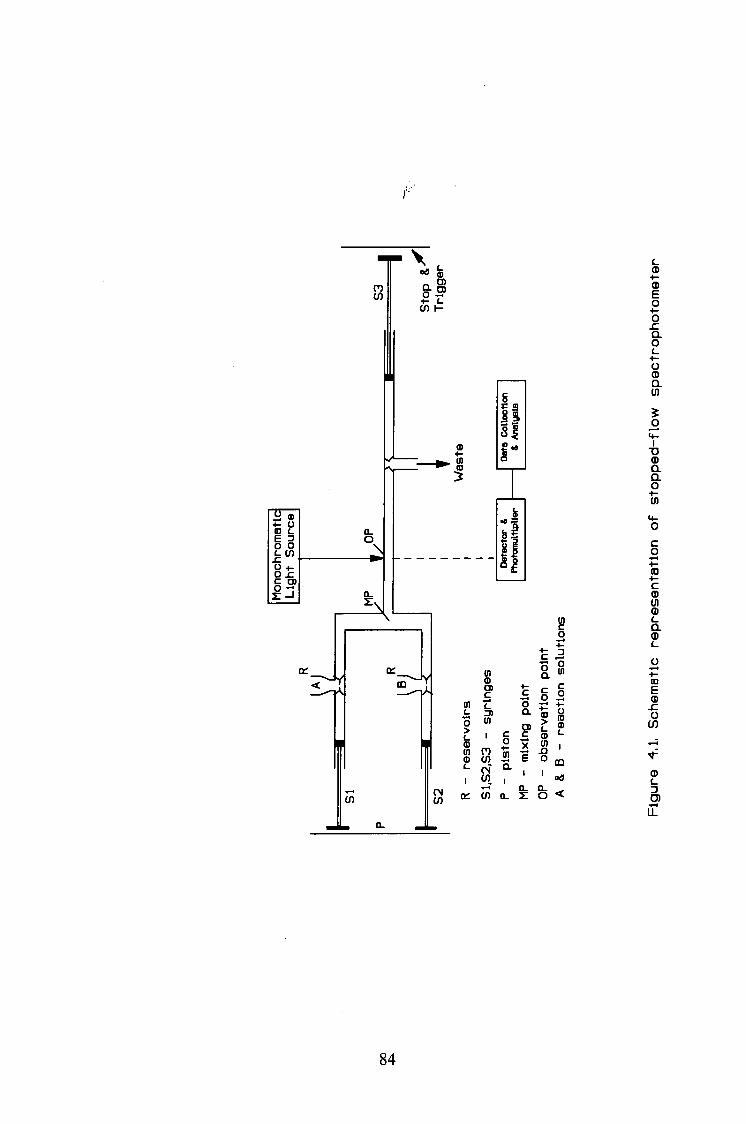
nr V c <D •t-(D E o ••-o .c a o £-o (D a in
o
c
Ul 2 O > I
in
I CN CO OC W Q.
O a
X B
1
o in c o
o c I
CD
oO
<
I TJ (D Q. a o
• I -
c o •(-ID 4-c (D U) (D £-a (D £_
ID
E (D
O
0) c D O)
u.
84
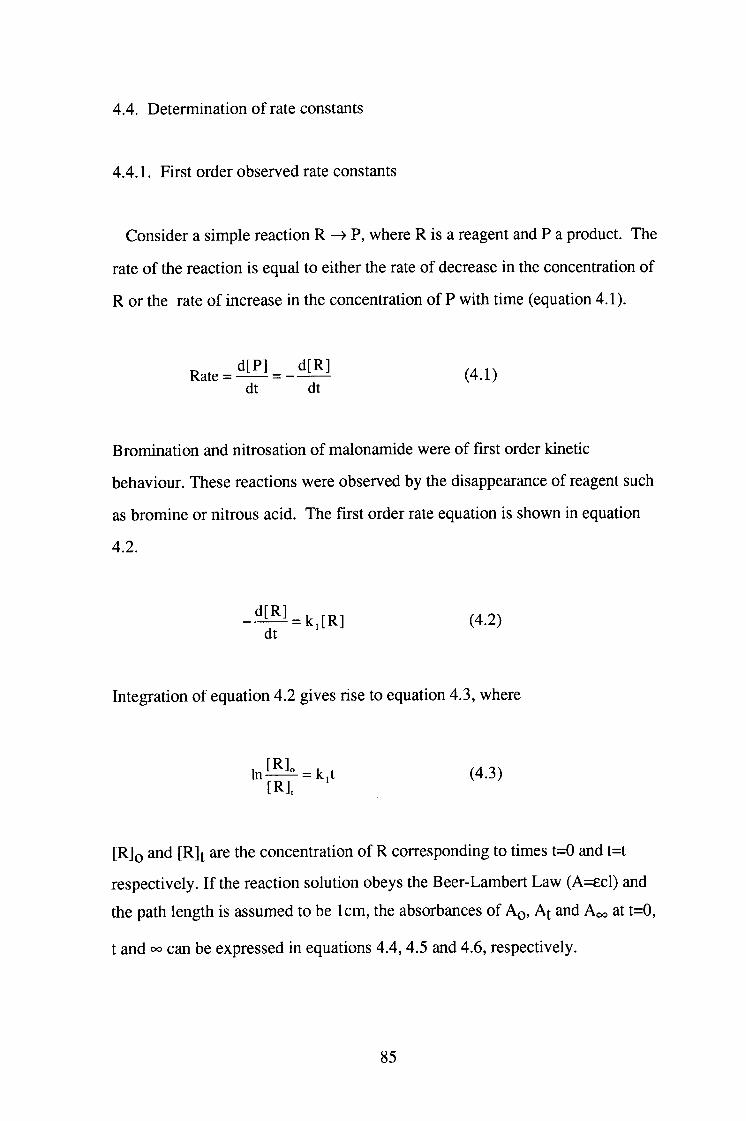
4.4. Determination of rate constants
4.4.1. First order observed rate constants
Consider a simple reaction R ^ P, where R is a reagent and P a product. The
rate of the reaction is equal to either the rate of decrease in the concentration of
R or the rate of increase in the concentration of P with time (equation 4.1).
Race = ^ t ^ l = - ™ (4.1) dt dt
Bromination and nitrosation of malonamide were of first order kinetic
behaviour. These reactions were observed by the disappearance of reagent such
as bromine or nitrous acid. The first order rate equation is shown in equation
4.2.
^ = k,[R] (4.2) dt
Integration of equation 4.2 gives rise to equation 4.3, where
l n l ^ = k,t (4.3) [R],
[R]o and [R]t are the concentration of R corresponding to times t=0 and t=t
respectively. I f the reaction solution obeys the Beer-Lambert Law (A=ecl) and
the path length is assumed to be 1cm, the absorbances of AQ, A^ and Aoo at t=0,
t and cxD can be expressed in equations 4.4, 4.5 and 4.6, respectively.
85
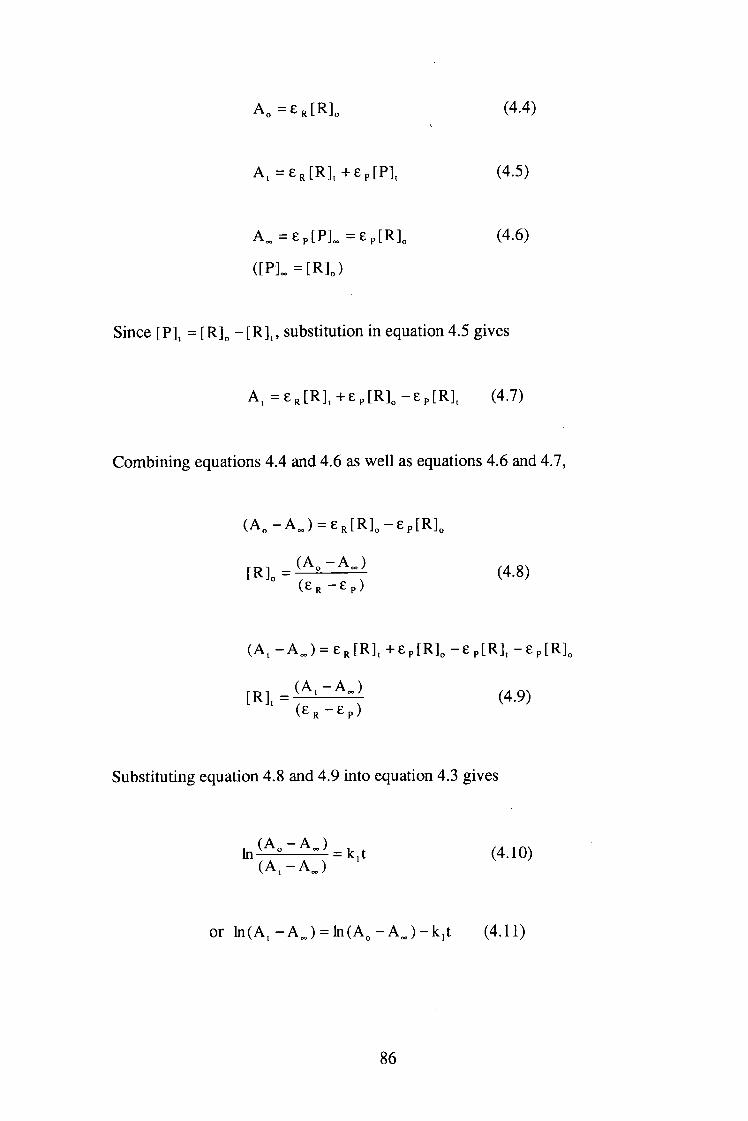
A o = e K [ R ] o (4.4)
A, = e J R ] , - H e p [ P ] , (4.5)
A „ = e p [ P L = e p [ R ] „ (4.6)
( [ P L = [ R L )
Since [PJ = [R]„ - [ R ] , , substitution in equation 4.5 gives
A, = e J R ] , - H e p [ R ] „ - e p [ R ] , (4.7)
Combining equations 4.4 and 4.6 as well as equations 4.6 and 4.7,
( A „ - A „ ) = e J R ] „ - e p [ R L
[ R ] o = - 7 ^ ^ ^ (4.8) ( E R - E p )
(A, - A „ ) = e J R ] , +ep[R]„ -ep[R] , -ep[R]„
^ ^ V i A ^ (4.9) ( E R - E P )
Substituting equation 4.8 and 4.9 into equation 4.3 gives
( A „ A ^ ) ^ ^
or l n ( A , - A „ ) = l n ( A „ - A „ ) - k , t (4.11)
86
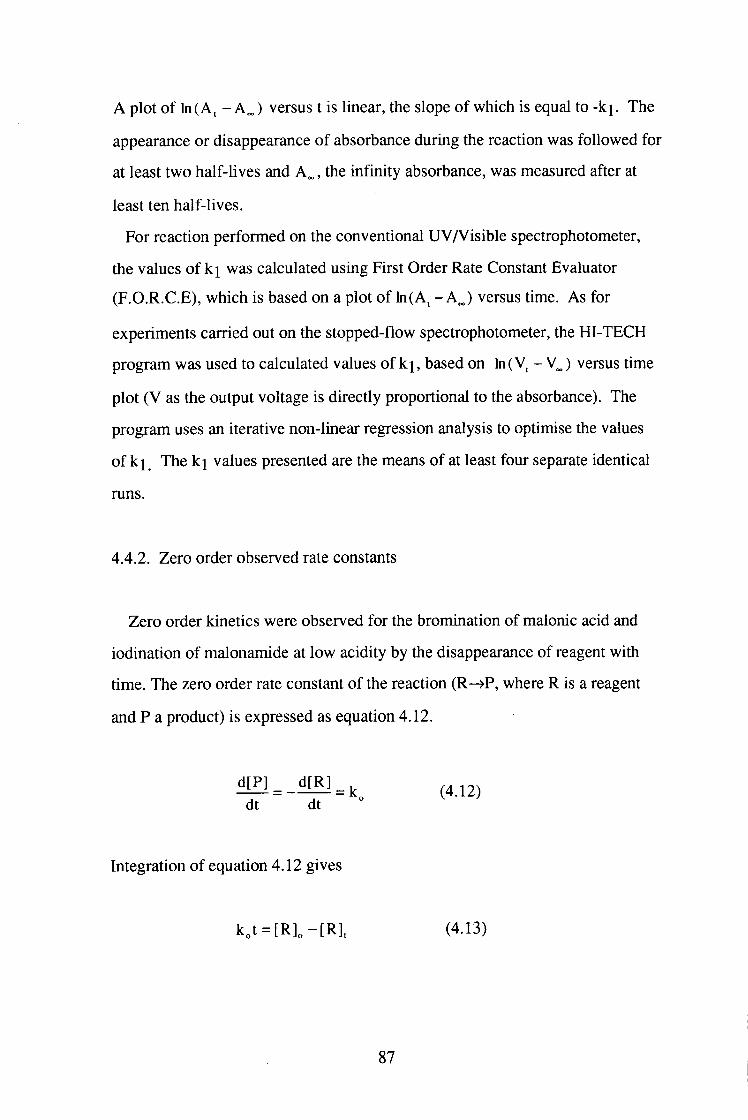
A plot of ln(A, - A„) versus t is linear, the slope of which is equal to - k j . The
appearance or disappearance of absorbance during the reaction was followed for
at least two half-lives and A„, the infinity absorbance, was measured after at
least ten half-lives.
For reaction performed on the conventional UVA'^isible spectrophotometer,
the values of k i was calculated using First Order Rate Constant Evaluator
(F.O.R.C.E), which is based on a plot of ln(A^ - A„) versus time. As for
experiments carried out on the stopped-flow spectrophotometer, the HI-TECH
program was used to calculated values of k j , based on ln( V, - V„) versus time
plot (V as the output voltage is directly proportional to the absorbance). The
program uses an iterative non-linear regression analysis to optimise the values
of k j The k] values presented are the means of at least four separate identical
runs.
4.4.2. Zero order observed rate constants
Zero order kinetics were observed for the bromination of malonic acid and
iodination of malonamide at low acidity by the disappearance of reagent with
time. The zero order rate constant of the reaction (R->P, where R is a reagent
and P a product) is expressed as equation 4.12.
m _ d [ R ] ^ , (4 12) dt dt °
Integration of equation 4.12 gives
k„t = [R]„-[R] , (4.13)
87
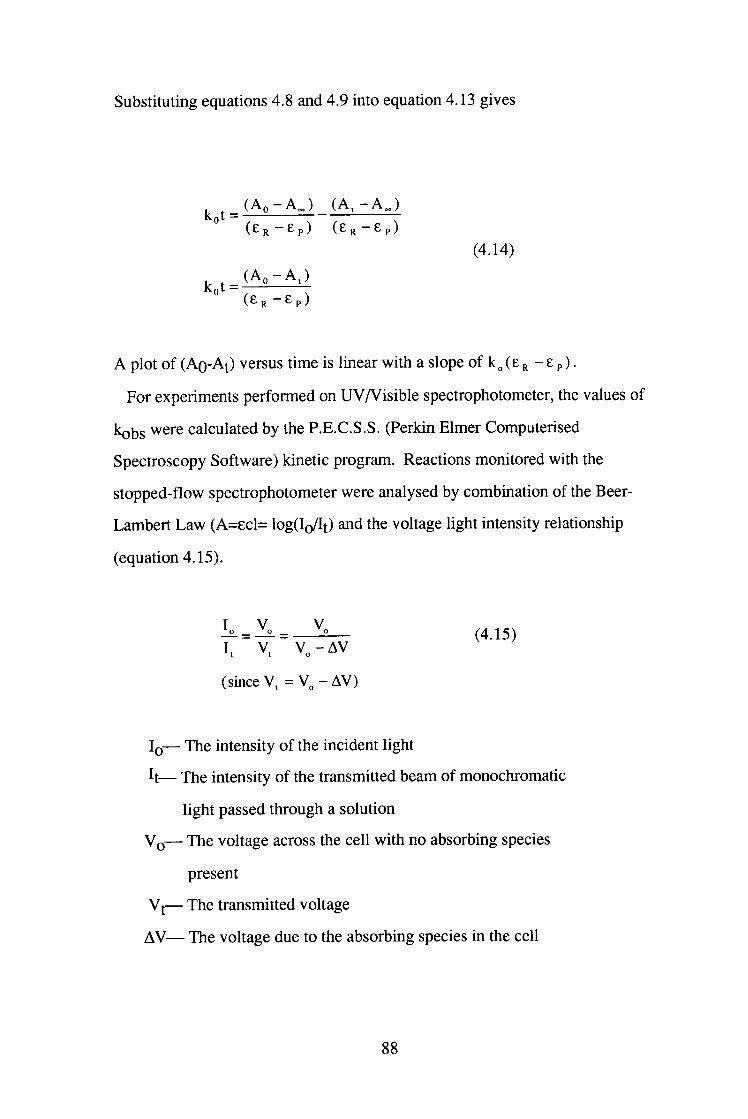
Substituting equations 4.8 and 4.9 into equation 4.13 gives
kot =
kot =
( A p - A e . ) ( A . - A ^ )
( E R - E P ) ( E R - E P )
(4.14)
( A Q - A J
( E „ - E p )
A plot of (AQ-At) versus time is linear with a slope of ( E ^ - £ p ) .
For experiments performed on UVA^isible spectrophotometer, the values of
kobs were calculated by the P.E.C.S.S. (Perkin Elmer Computerised
Spectroscopy Software) kinetic program. Reactions monitored with the
stopped-flow spectrophotometer were analysed by combination of the Beer-
Lambert Law (A=ecl= log(Io/It) and the voltage light intensity relationship
(equation 4.15).
I V V ^ = - ^ = — — (4.15) I . V , V < , - A V
(since V , = V , - A V )
I Q — The intensity of the incident light
I t — The intensity of the transmitted beam of monochromatic
light passed through a solution
V Q — The voltage across the cell with no absorbing species
present
— The transmitted voltage
A V — The voltage due to the absorbing species in the cell
88
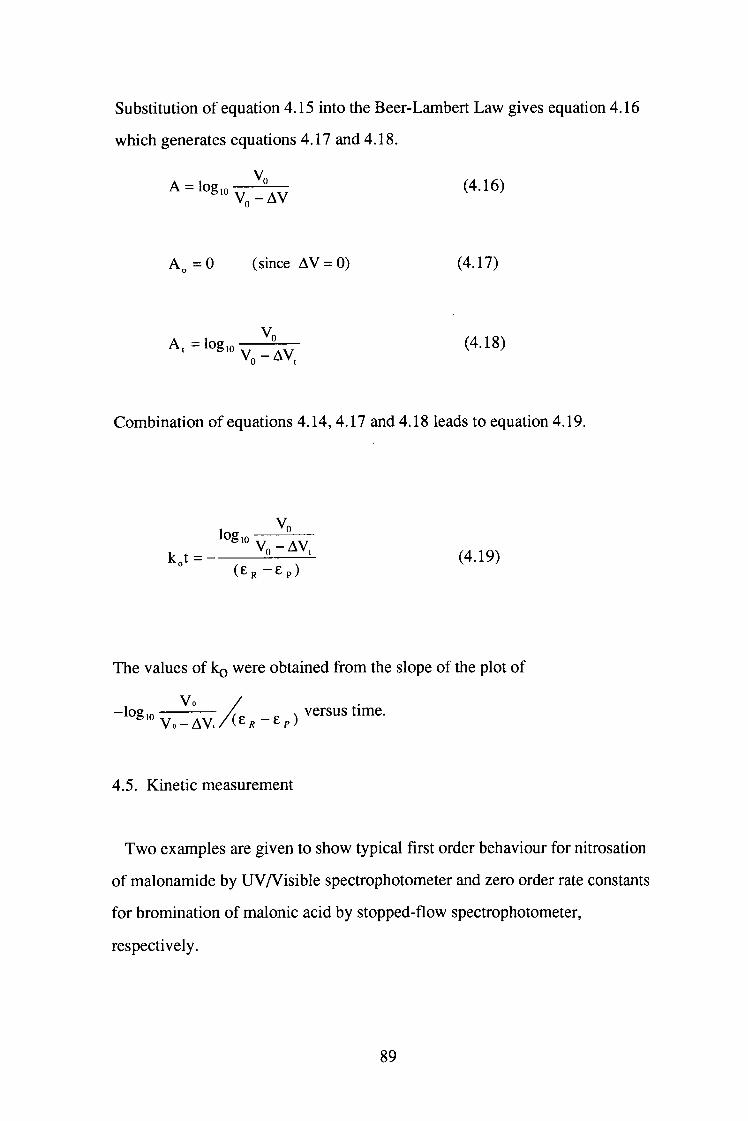
Substitution of equation 4.15 into the Beer-Lambert Law gives equation 4.16
which generates equations 4.17 and 4.18.
A = log 1 0 — ^ ^ 2 — (4.16)
A = 0 (since AV = 0) (4.17)
Combination of equations 4.14, 4.17 and 4.18 leads to equation 4.19.
1 0 g , c — ^
The values of RQ were obtained from the slope of the plot of
Vo / - loe ,n ^ s versus time.
4.5. Kinetic measurement
Two examples are given to show typical first order behaviour for nitrosation
of malonamide by UVA^isible spectrophotometer and zero order rate constants
for bromination of malonic acid by stopped-flow spectrophotometer,
respectively.
89
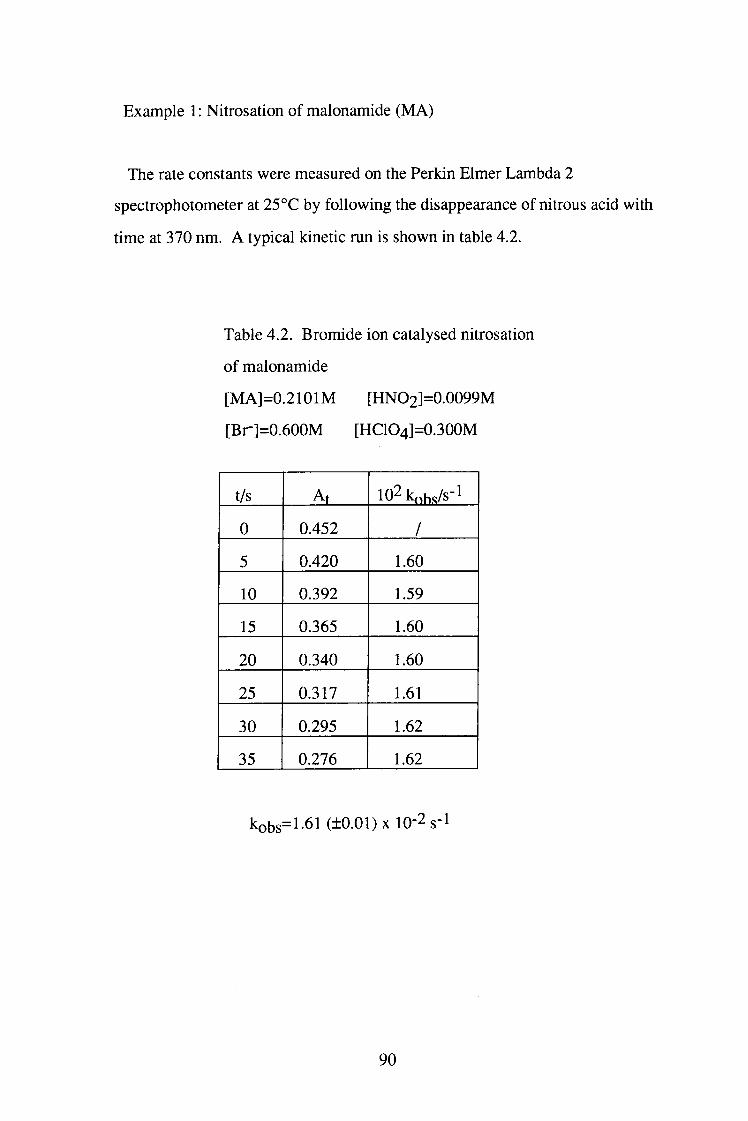
Example 1: Nitrosation of malonamide (MA)
The rate constants were measured on the Perkin Elmer Lambda 2
spectrophotometer at 25 °C by following the disappearance of nitrous acid with
time at 370 nm. A typical kinetic run is shown in table 4.2.
Table 4.2. Bromide ion catalysed nitrosation
of malonamide
[MA]=0.2101M [HNO2]=0.0099M
[Br-]=0.600M [HClO4]=0.300M
t/s At 102koh«/s-l
0 0.452 /
5 0.420 1.60
10 0.392 1.59
15 0.365 1.60
20 0.340 1.60
25 0.317 1.61
30 0.295 1.62
35 0.276 1.62
kobs=l-61 (±0.01) X 10-2 s-1
90
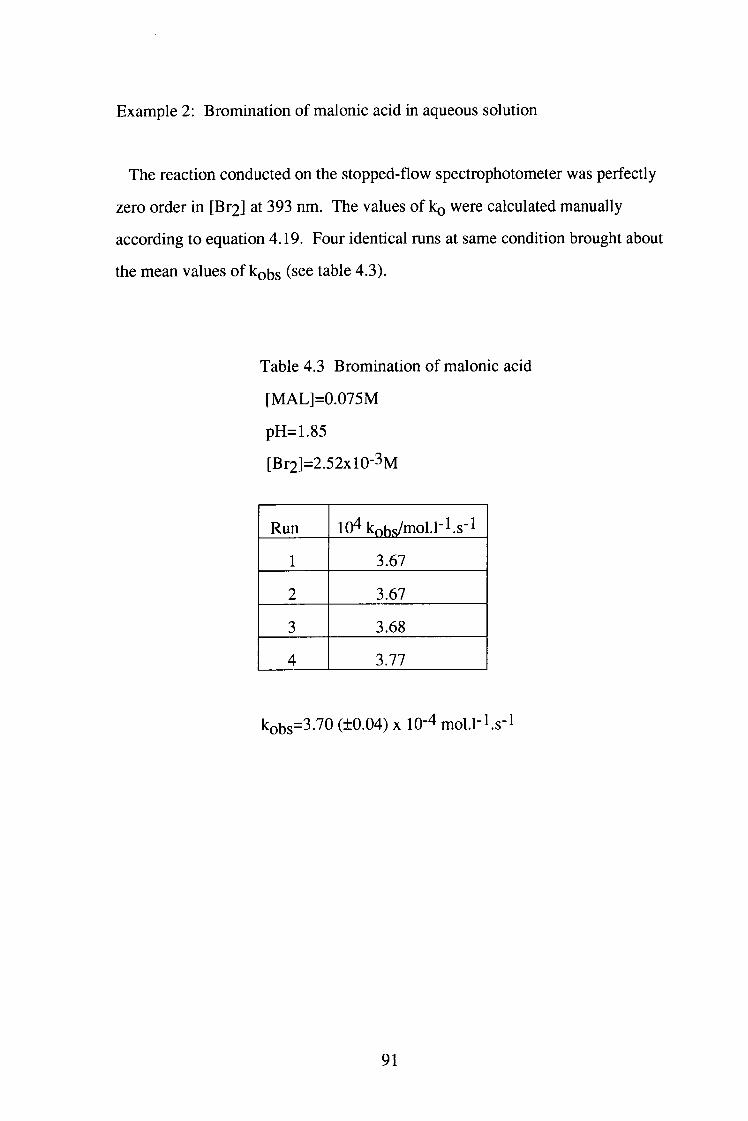
Example 2: Bromination of malonic acid in aqueous solution
The reaction conducted on the stopped-flow spectrophotometer was perfectly
zero order in [Br2] at 393 nm. The values of ko were calculated manually
according to equation 4.19. Four identical runs at same condition brought about
the mean values of kobs (see table 4.3).
Table 4.3 Bromination of malonic acid
[ M A L ] = 0 . 0 7 5 M
pH=1.85
[Br2]=2.52xlO-3M
Run lO^kohs/mol.l-l.s-l
1 3.67
2 3.67
3 3.68
4 3.77
kobs=3.70 (±0.04) X 10-4 mol . l - l . s ' l
91
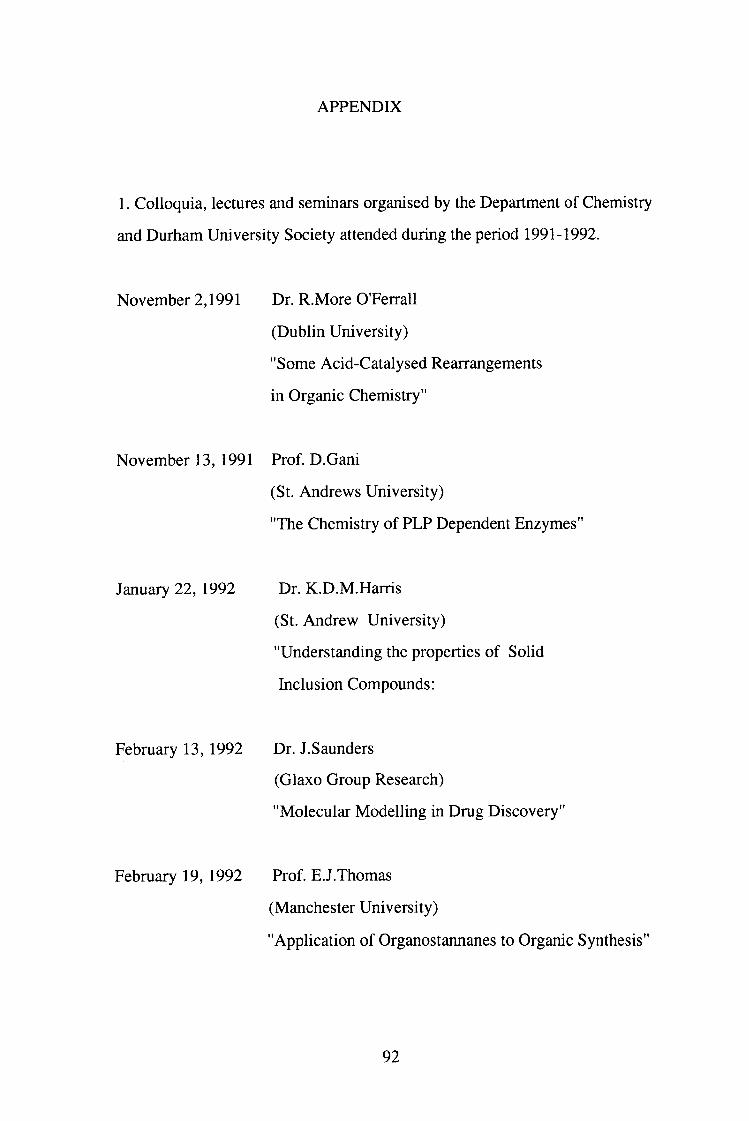
APPENDIX
1. Colloquia, lectures and seminars organised by the Department of Chemistry
and Durham University Society attended during the period 1991-1992.
November 2,1991 Dr. R.More O'Ferrall
(Dublin University)
"Some Acid-Catalysed Rearrangements
in Organic Chemistry"
November 13, 1991 Prof. D.Gani
(St. Andrews University)
"The Chemistry of PLP Dependent Enzymes"
January 22, 1992 Dr. K.D.M.Harris
(St. Andrew University)
"Understanding the properties of Solid
Inclusion Compounds:
February 13, 1992 Dr. J.Saunders
(Glaxo Group Research)
"Molecular Modelling in Drug Discovery"
February 19, 1992 Prof. E.J.Thomas
(Manchester University)
"Application of Organostannanes to Organic Synthesis"
92
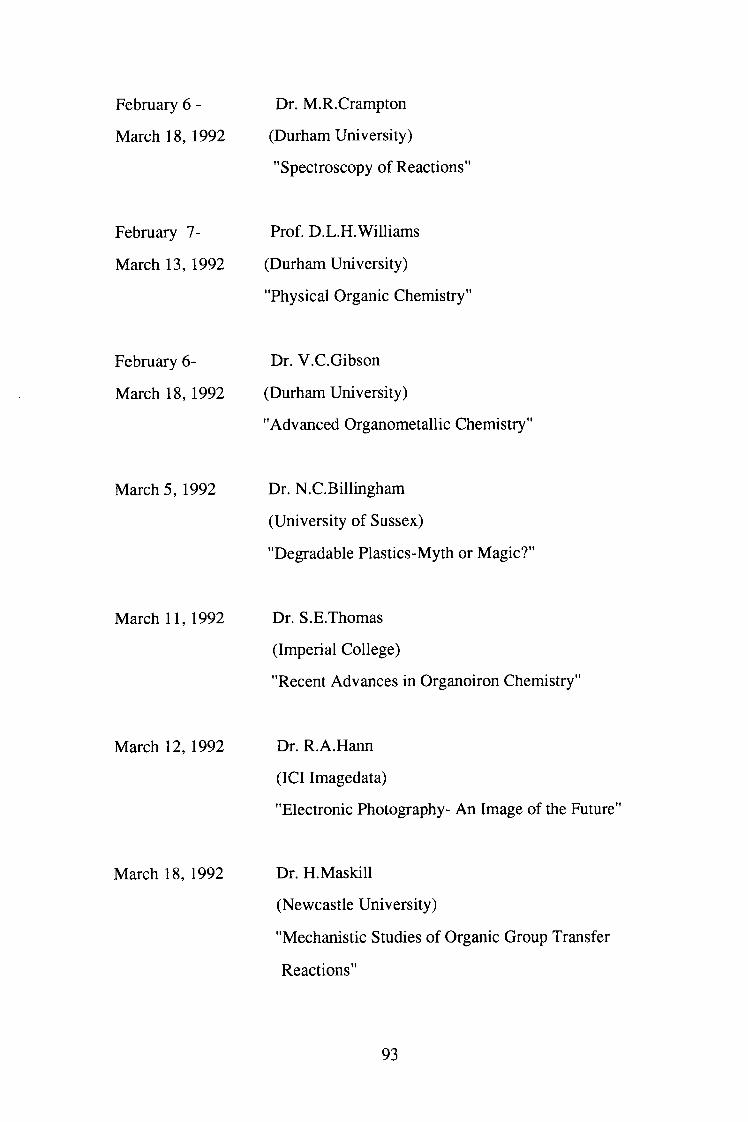
February 6 - Dr. M.R.Crampton
March 18, 1992 (Durham University)
"Spectroscopy of Reactions"
February 7- Prof. D.L.H.Williams
March 13, 1992 (Durham University)
"Physical Organic Chemistry"
February 6- Dr. V.C.Gibson
March 18, 1992 (Durham University)
"Advanced Organometallic Chemistry"
March 5, 1992 Dr. N.C.Billingham
(University of Sussex)
"Degradable Plastics-Myth or Magic?"
March 11, 1992 Dr. S.E.Thomas
(Imperial College)
"Recent Advances in Organoiron Chemistry"
March 12, 1992 Dr. R.A.Hann
(ICI Imagedata)
"Electronic Photography- An Image of the Future"
March 18, 1992 Dr. H.Maskill
(Newcastle University)
"Mechanistic Studies of Organic Group Transfer
Reactions"
93
October 22, 1992 Prof. A.G.Davies
(University College, London)
"The Behaviour of Hydrogen as a Pseudometal"
November 18, 1992 Dr. R.Nix
(Queen Mary College, London)
" Characterisation of Heterogeneous Catalysts"
December 2, 1992 Prof. A.F.Hegarty
(University College Dublin)
"Highly Reactive Enols Stabilised by Steric Protection"
2. First year postgraduate induction course, October 1991.
The course consisted of a series of one-hour presentations on the services
available within the department.
A. Departmental organisation
B. Safety matters
C. Electrical appliances and infrared spectroscopy
D. Chromatography and microanalysis
E. Library facilities
F. Mass spectroscopy
G. Nuclear magnetic resonance spectroscopy
H. Glassblowing techniques
94