Embed Size (px)
Citation preview

eni.com
upstream seminar
London - June 7, 2010

2
agenda
Overview Claudio Descalzi
Operations Antonio Vella – EVP Operations
Development Antonio Panza – SVP Development
Exploration Luca Bertelli – SVP Exploration and Unconventional
• Focus on key projects Guido Michelotti – EVP North Africa and Middle East
Roberto Casula – EVP Sub-Saharan Africa
Marco Alverà – EVP Russia, Northern Europe and Americas
Massimo Mondazzi – EVP Central Asia and Pacific
Focus on Iraq Claudio Descalzi
Closing remarks Claudio Descalzi
3
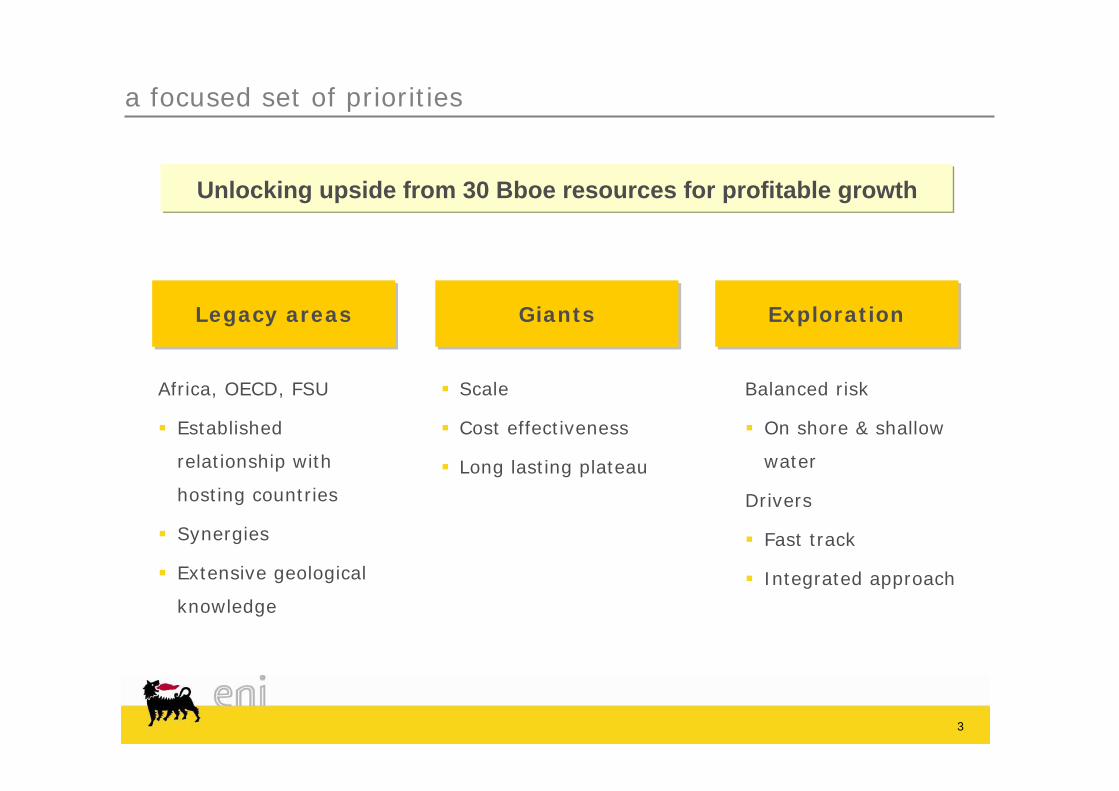
a focused set of priorities
Africa, OECD, FSU
Established
relationship with
hosting countries
Synergies
Extensive geological
knowledge
Unlocking upside from 30 Bboe resources for profitable growth
Scale
Cost effectiveness
Long lasting plateau
ExplorationExplorationGiantsGiantsLegacy areasLegacy areas
Balanced risk
On shore & shallow
water
Drivers
Fast track
Integrated approach
4
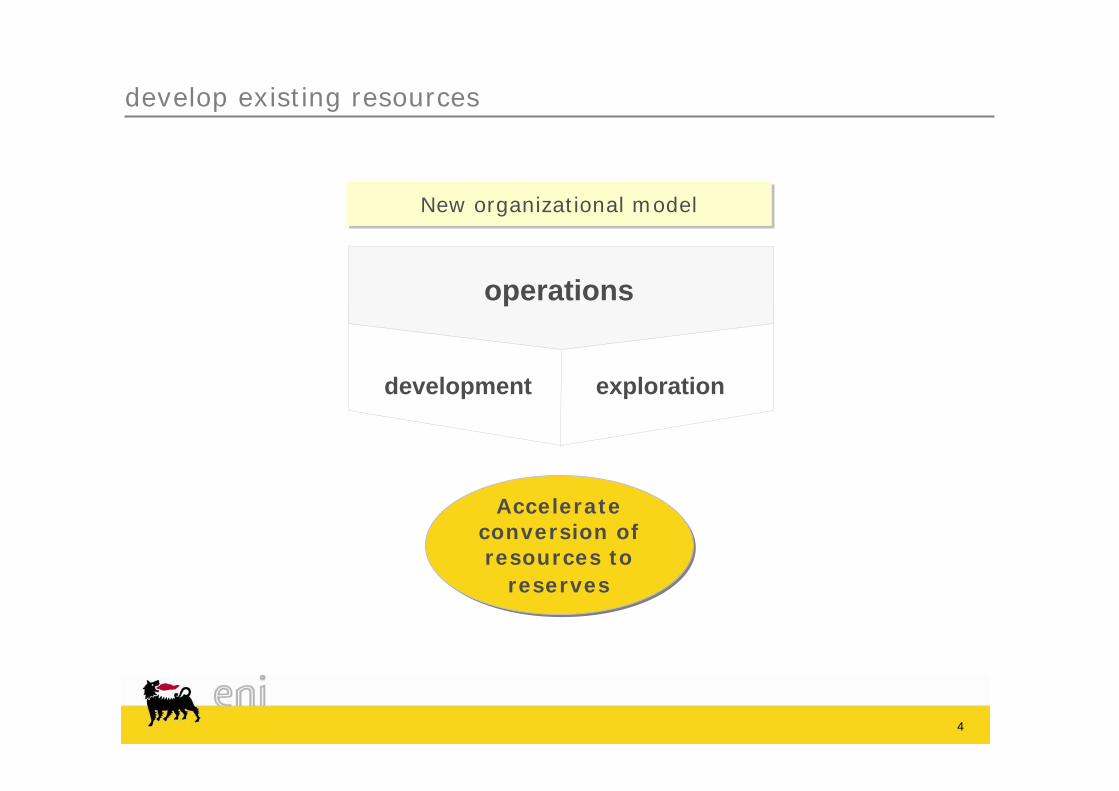
develop existing resources
Accelerateconversion of resources to
reserves
operations
development exploration
New organizational modelNew organizational model

5
Gas with price cap
Fuel gas
2009 production
Gas (oil linked)
Spot gas
Liquids
balanced portfolio leveraged to oil price
2009 2P reserves
57%
25%
7%
8%
3%
OtherFSU
OECDAfrica
OtherOffshore conventional
Deep OffshoreOnshore

6
low cost per barrel
2009 opex/boe
$/boe
Leading production costs in the industry
Exposure to Africa, Italy and FSU
Continuing focus on cost efficiency
0
5
10
ItalyItaly
OECDOECD
Production (kboed)
OtherOther
AfricaAfrica FSUFSU
0 500 1,000 1,500
7
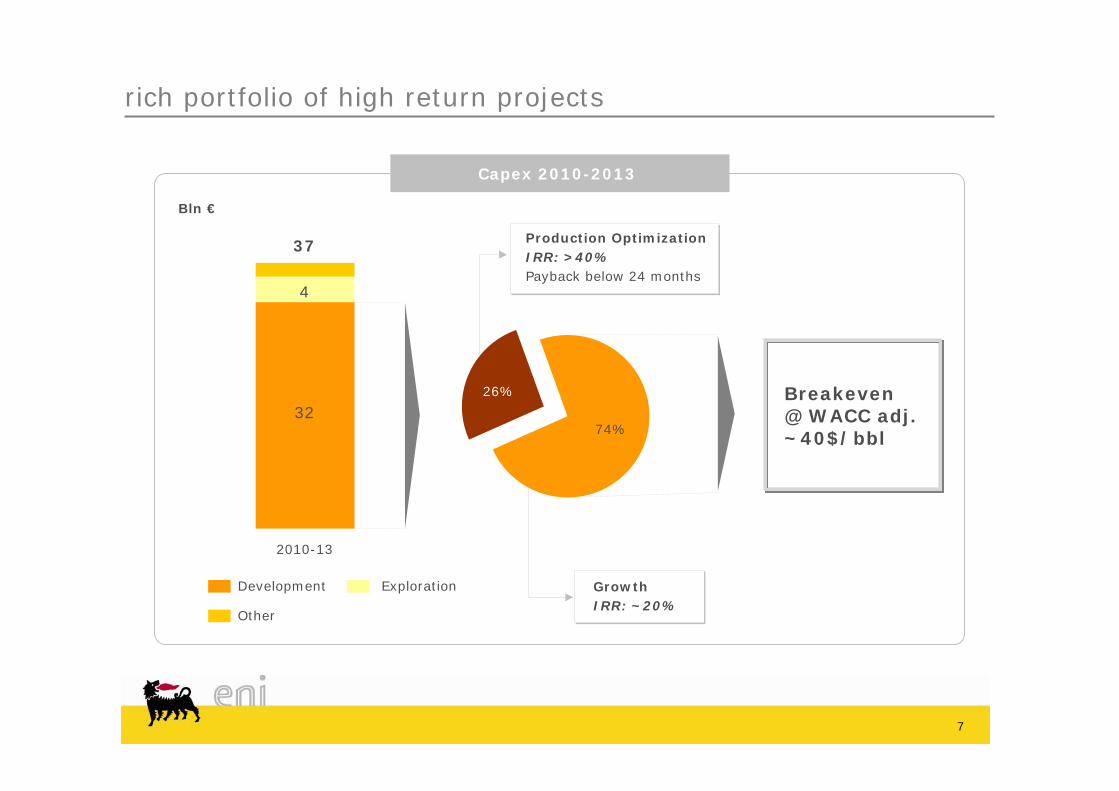
rich portfolio of high return projects
Bln €
Capex 2010-2013
GrowthIRR: ~20%
Development Exploration
Other
2010-13
37
32
4
Production OptimizationIRR: >40%Payback below 24 months
Breakeven @ WACC adj. ~40$/bbl74%
26%
8
150
2009 2013 Contingency 2013
high visibility on organic growth
Contribution from newstart-ups(560 kboed)
Contribution from newstart-ups(560 kboed)
Other (near field exploration)
Other (near field exploration)
61 65 65 Brent $/boe
Production profile to 2013 (kboed)
65$ 80-90$ 90-100$
CAGR at other scenarios
Low decline rate
Visible and strong pipeline of projects
Large contingencies applied
>2.5% CAGR
Decline~3%
25% of new start-ups contribution
25% of new start-ups contribution
>2.5%
2.0%
1.5%
9
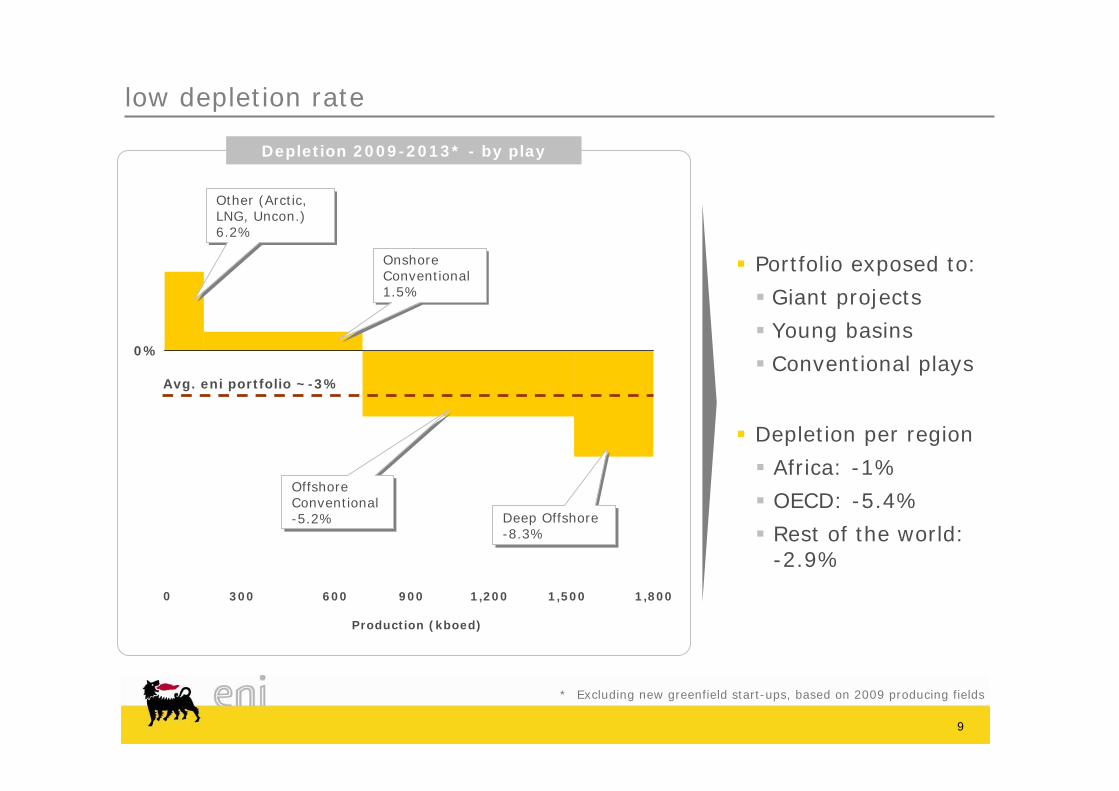
low depletion rate
* Excluding new greenfield start-ups, based on 2009 producing fields
0%
900 1,5003000
Production (kboed)
1,800600 1,200
Depletion 2009-2013* - by play
Portfolio exposed to:
Giant projects
Young basins
Conventional plays
Other (Arctic, LNG, Uncon.)6.2%
Other (Arctic, LNG, Uncon.)6.2%
Onshore Conventional 1.5%
Onshore Conventional 1.5%
Offshore Conventional -5.2%
Offshore Conventional -5.2%
Avg. eni portfolio ~-3%
Deep Offshore -8.3%Deep Offshore -8.3%
Depletion per region
Africa: -1%
OECD: -5.4%
Rest of the world: -2.9%

10
solid pipeline of projects
Iraq and Venezuela(FID 2010)
FID 2010
Sanctioned
FID 2011
560
>500 kboed or 90% of new equity production @ 2013 sanctioned by 2010
kboed
9%
24%
21%
46%
16 major projects for growth
Project Country Op. Status Start-upPeak Production
100% (kboed)
Zubair Iraq FID 2010 2010 1,200
Perla and Junin 5 Venezuela FID 2010-11 2013 375
Val D'Agri Ph. 2 Italy FID 2010 2010 42
Samburgskoye Russia FID 2010 2011 145
Jasmine UK FID 2010 2012 86
Block 15/06 Angola FID 2010 2012 90
M'Boundi Gas Congo Sanctioned 2010 22
CAFC Algeria Sanctioned 2011 67
Kitan Australia Sanctioned 2011 40
Mavacola / Clochas Angola Sanctioned 2011 120
MLE Algeria Sanctioned 2011 55
Nikaitchuq USA Sanctioned 2011 26
Kashagan EP Kazakhstan Sanctioned 2012 450
Angola LNG Angola Sanctioned 2012 176
El Merk Algeria Sanctioned 2012 146
Goliat Norway Sanctioned 2013 94

11
leading value per barrel
PV10 of P1 reserves*
Eni
Chev
ron BP
Exxo
nMob
il
Tota
lCo
noco
Philli
ps
Shell
$/boe
0
5
10
North Africa West Africa OECD Other
Avg @ 85$ 9.1$/boe
$/boe
eni 2P NPV/boe by region
Avg. @ 65$ 6.4 $/boe
* 2009 SEC @ 59.9$/bbl scenario
7.16.9
5.0 5.04.7
4.1 4.0

12
unlocking upside
short time-to-market
cost effective
low risk
Focus on fast-track conversion of resources to reserves
2010-2013 replacement ratio
> 120%
1313
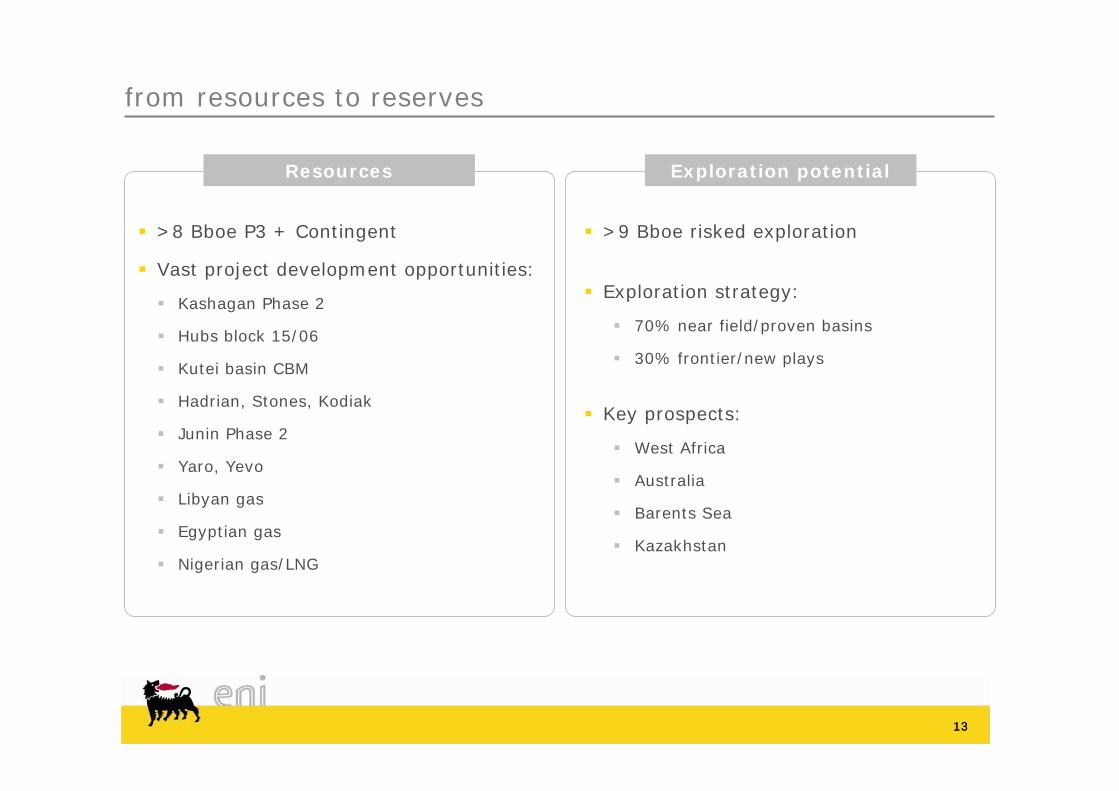
from resources to reserves
Resources
>8 Bboe P3 + Contingent
Vast project development opportunities:
Kashagan Phase 2
Hubs block 15/06
Kutei basin CBM
Hadrian, Stones, Kodiak
Junin Phase 2
Yaro, Yevo
Libyan gas
Egyptian gas
Nigerian gas/LNG
Exploration potential
>9 Bboe risked exploration
Exploration strategy:
70% near field/proven basins
30% frontier/new plays
Key prospects:
West Africa
Australia
Barents Sea
Kazakhstan

1414
G. Michelotti R. Casula M. Alverà G. Tannoia
organized to maximise value, growth and upsideV
alu
eG
row
thU
psi
de
Development
A. Panza
Exploration
L. Bertelli
Operations
A. Vella
M. Mondazzi
North Africa and Middle
East
Sub-Saharan Africa
Americas Russia and Northern Europe
Southern Europe
Central Asia and Far East

1515
2006 2007 2008 2009 Q1 2010
Lost time injury frequency rate
2006 2007 2008 2009 Q1 2010
Prevention and preparedness
Strong focus on the human factor
Control on contractors
Severity index
1.2
0.8
0.4
0.0
0.04
0.02
0.0
HSE performance

1616
0
4
8
2007 2008 2009
Kbbl/y
0
5
10
2007 2008 2009 20100%
2%
4%
6%
flared gas flared gas / total production
BScm/y
0
10
20
30
40
2007 2008 2009 20100%
20%
40%
60%
Mmc % of process water re-injected
HSE performance
0
10
20
30
40
2007 2008 2009 2010
from flaring and venting other sources
Mton CO2 eq.
Co2 emissionsGas flaring
Oil spillsProcess water re-injection

eni.com
Operations
Antonio Vella, EVP Operations
18
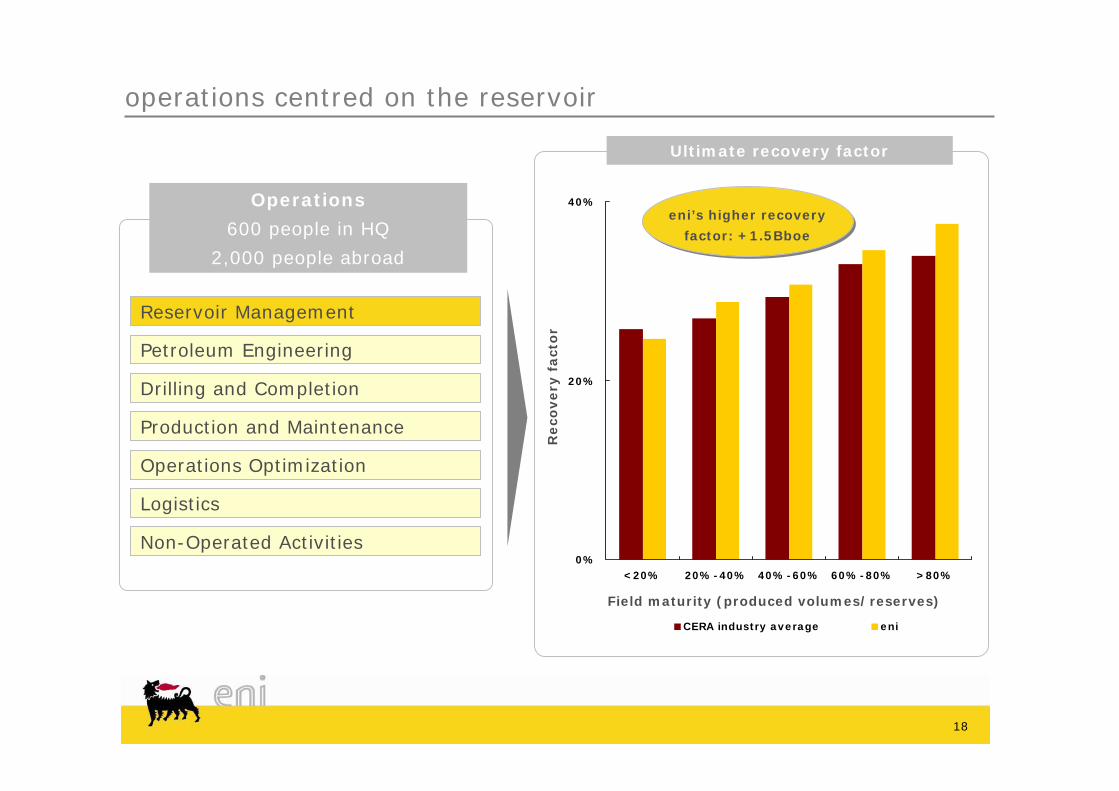
operations centred on the reservoir
Operations
600 people in HQ
2,000 people abroad
Reservoir Management
Petroleum Engineering
Production and Maintenance
Non-Operated Activities
Operations Optimization
Logistics
Drilling and Completion
0%
20%
40%
<20% 20%-40% 40%-60% 60%-80% >80%
CERA industry average eni
Field maturity (produced volumes/reserves)
Reco
very
fact
or
Ultimate recovery factor
eni’s higher recovery
factor: +1.5Bboe
19
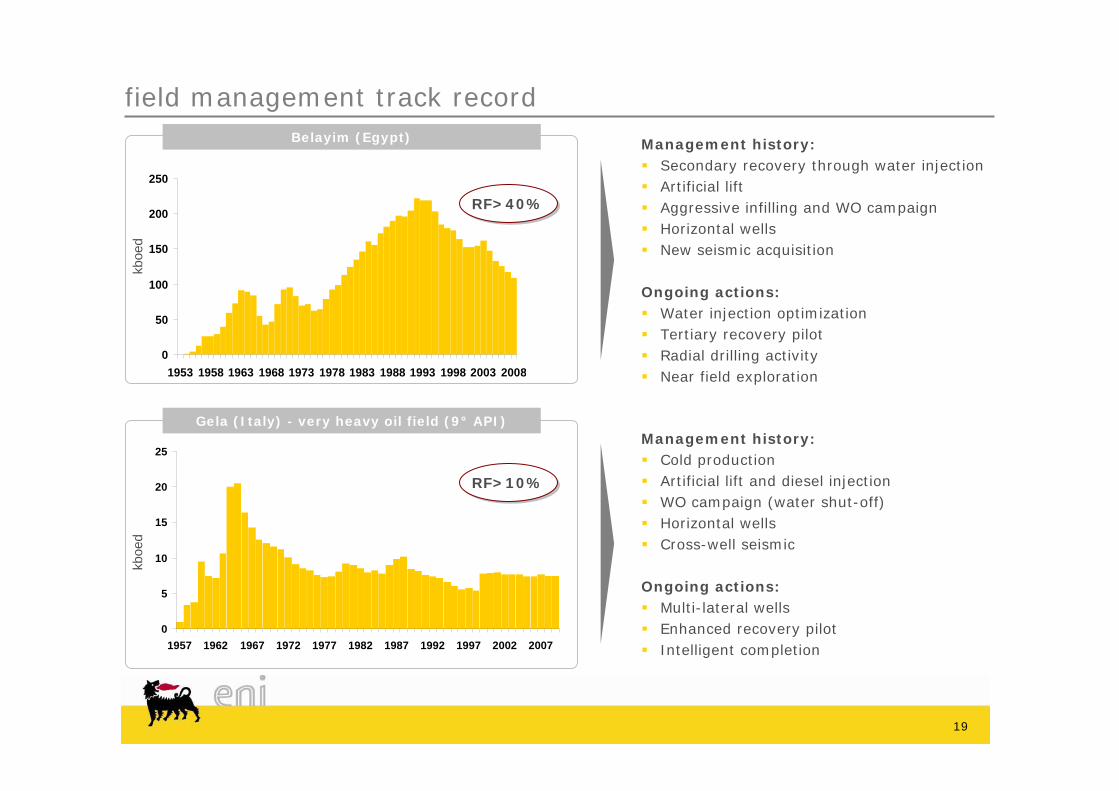
field management track record
Management history:Secondary recovery through water injection Artificial lift Aggressive infilling and WO campaignHorizontal wellsNew seismic acquisition
Ongoing actions:Water injection optimizationTertiary recovery pilotRadial drilling activityNear field exploration
0
50
100
150
200
250
1953 1958 1963 1968 1973 1978 1983 1988 1993 1998 2003 2008
kboe
dkb
oed
0
5
10
15
20
25
1957 1962 1967 1972 1977 1982 1987 1992 1997 2002 2007
RF>10%RF>10%
RF>40%RF>40%
Management history:Cold productionArtificial lift and diesel injectionWO campaign (water shut-off)Horizontal wellsCross-well seismic
Ongoing actions:Multi-lateral wellsEnhanced recovery pilotIntelligent completion
Gela (Italy) - very heavy oil field (9° API)
Belayim (Egypt)

2020
asset integrity
Design oriented towards operating efficiency
Plant shut-down optimization
New technologies
Innovative solutions
Plant & facilities
Flow assurance
Pipeline inspection
Drag reducer
Debottlenecking
Transportation

2121
leadership in drilling technologies
1994 2000 2001 2005 2009
Pioneered with international contractors the concept ofAutomatic Drilling
43 patented drilling technologies to increase safety and efficiency
8 ½’’ Hole 7’’ Liner
36’’ Hole
32’’ Csg
22’’ Hole
18 5/8’’ Csg
8 ½’’ Hole 7’’ Liner
36’’ Hole
32’’ Csg
22’’ Hole
18 5/8’’ Csg
Inner string DP 5”
Casing 13-3/8”
Conductor pipe 30”
Casing 20”
17-1/2” Hole
36” Hole
Housing 30”
Housing 18” 3/4
GRA
CART 18” 3/4
22
value of operatorship
Opex/boe
$/boe
4
5
6
7
2007 2008 2009
eni
non operated
operated
Stricter cost control
Shorter time-to-market
Synergies
Organisational unit dedicated to non-operated assets
23
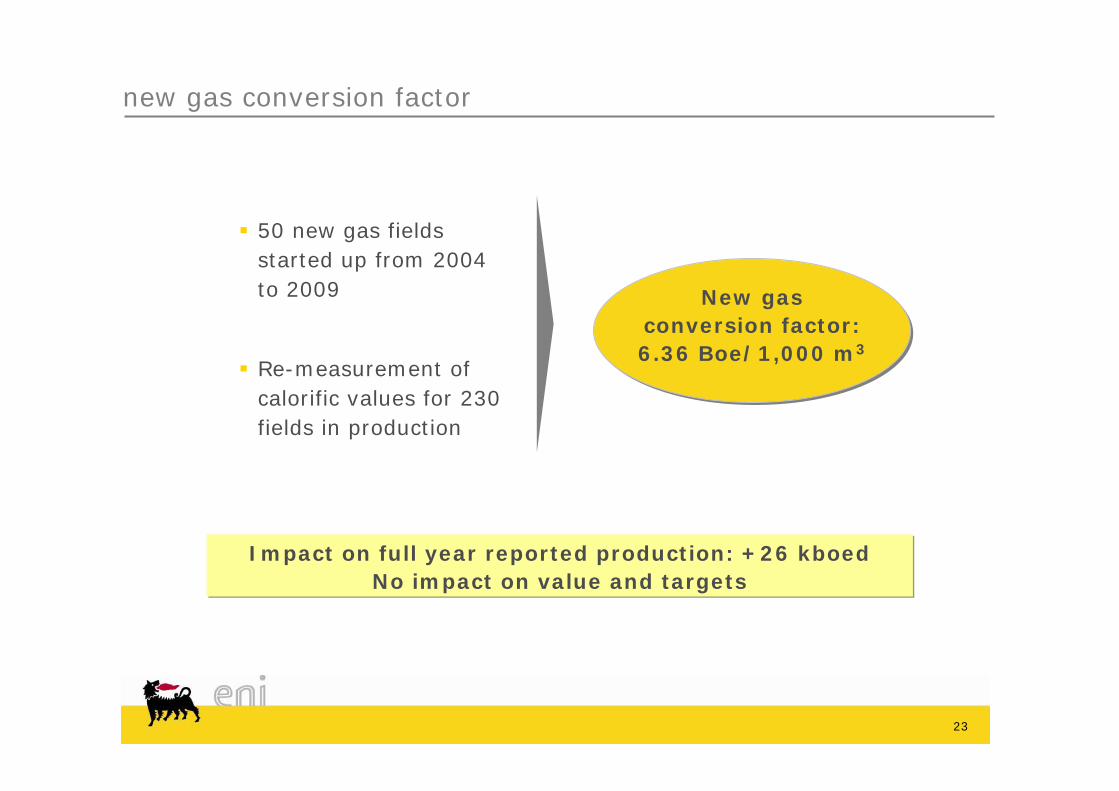
new gas conversion factor
New gasconversion factor:6.36 Boe/1,000 m3
50 new gas fields started up from 2004 to 2009
Re-measurement of calorific values for 230 fields in production
Impact on full year reported production: +26 kboedNo impact on value and targets

eni.com
Development
Antonio Panza, SVP Development

25
0
100
200
300
400
500
600
2010 2011 2012 2013
Operated Non operated
growth fuelled by development projects
kboed
41 start-ups
planned by 2013
31 operated
ZubairCerro FalconeM’Boundi Gas
NikaitchuqMLE/CAFC
Mavacola/ClochasSamburgskoye
Kitan
Kashagan EPBlock 15/06Angola LNG
El MerkJasmine
GoliatPerla
Junin 5
560 kboedof new equity
production by 2013
560 kboedof new equity
production by 2013
26
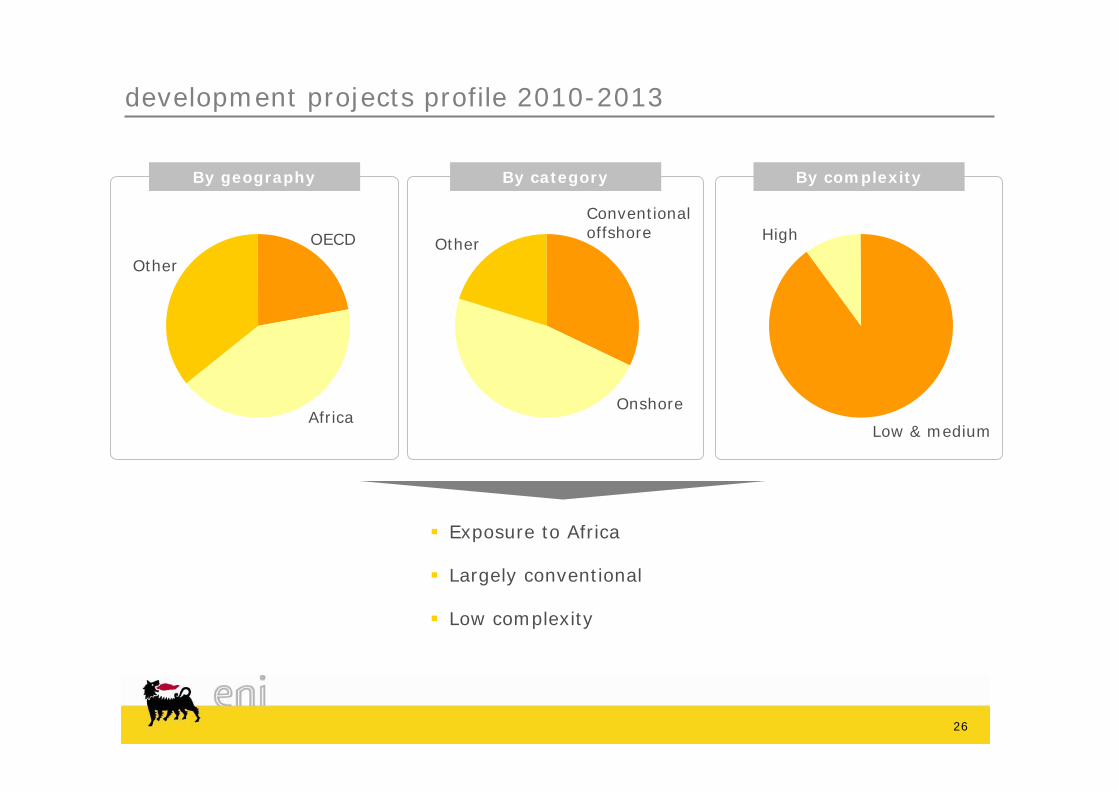
development projects profile 2010-2013
Exposure to Africa
Largely conventional
Low complexity
OECD
Africa
Other
Conventional offshore
Onshore
OtherHigh
Low & medium
By geography By complexityBy category

27
strong track-record of project delivery
2004-2009 start-ups
kboed
0
100
200
300
400
500
600
2004 2005 2006 2007 2008 2009
Operated Non operated
54 projects started in
6 years
26 operated
29 further projects
sanctioned
543 kboed of equity
production in 2009
543 kboed of equity
production in 2009
RodSouth Pars
El FeelWafa
BaltimBhar Essalam
Bonga
N-LNG gas supply
Ika/IdaBBLT
MarimbaIkalou
Tea/Arnica/Lavanda
Saxi/BatuqueMondoDeniseTaurt
Corocoro
AboLonghornMboundiBlacktip
28
further improving project delivery
Integrated organization
Execution control
Flexibility
Development approach
Multiple EPC contracts
Drilling contracts
Framework Agreements
Procurement strategy
HSEHSE
TimeTime
CostCost
QualityQuality
Design concept & equipment
replication
Sharing of facilities, infrastructure
and resources
Standardization & synergies

29
standardization
Block 15/06Design concept replicationCombining drilling and installation campaignsMarket leverage
PerlaDesign concept replicationEquipment standardizationFramework Agreements
1000
m
600
m
1 500
m
WHP
CHOCALHORECO-RECO
DIKANZA
MONDO
SAXI
BAVUCA
KAKOCHA
HUNGO
KISSANJE
CLOCHAS
MARIMBA S
TCHIHUMBA
VICANGO
Kizomba A
Kizomba B
Nzanza-1(2009)
CABACA 1
N’Goma-1(2008)
Sangos-1(2008)
NW-HubNWNW--HubHub
SAXI-BATUQUE FPSO
Kizomba C
FPSO
FPSO
FPSO
WHP
FPSO
MAVACOLA S
MAVACOLA N
BATUQUE
MBULUMBUMBA
Xikomba
Kizomba C
MARIMBA N.
NE-HubNENE--HubHub
Mpungi-1(2010)
Cabaca SE-1(2010)
Cabaca North-1(2009)
Cinguvu-1(2009) 10
00 m
600
m
1 500
m
WHP
CHOCALHORECO-RECO
DIKANZA
MONDO
SAXI
BAVUCA
KAKOCHA
HUNGO
KISSANJE
CLOCHAS
MARIMBA S
TCHIHUMBA
VICANGO
Kizomba A
Kizomba B
Nzanza-1(2009)
CABACA 1
N’Goma-1(2008)
Sangos-1(2008)
NW-HubNWNW--HubHub
SAXI-BATUQUE FPSO
Kizomba C
FPSO
FPSO
FPSO
WHP
FPSO
MAVACOLA S
MAVACOLA N
BATUQUE
MBULUMBUMBA
Xikomba
Kizomba C
MARIMBA N.
NE-HubNENE--HubHub
Mpungi-1(2010)
Cabaca SE-1(2010)
Cabaca North-1(2009)
Cinguvu-1(2009)

30
synergies
MLE/CAFCGas train sharingCommon infrastructure and utilitiesCommon export system
KitanFPSO redeploymentOperating cost optimization
3-off 6” flex prod3-off 2” flex gas lift
Control umbilical
Kitan 5 Kitan 3 Kitan 2-ST
31
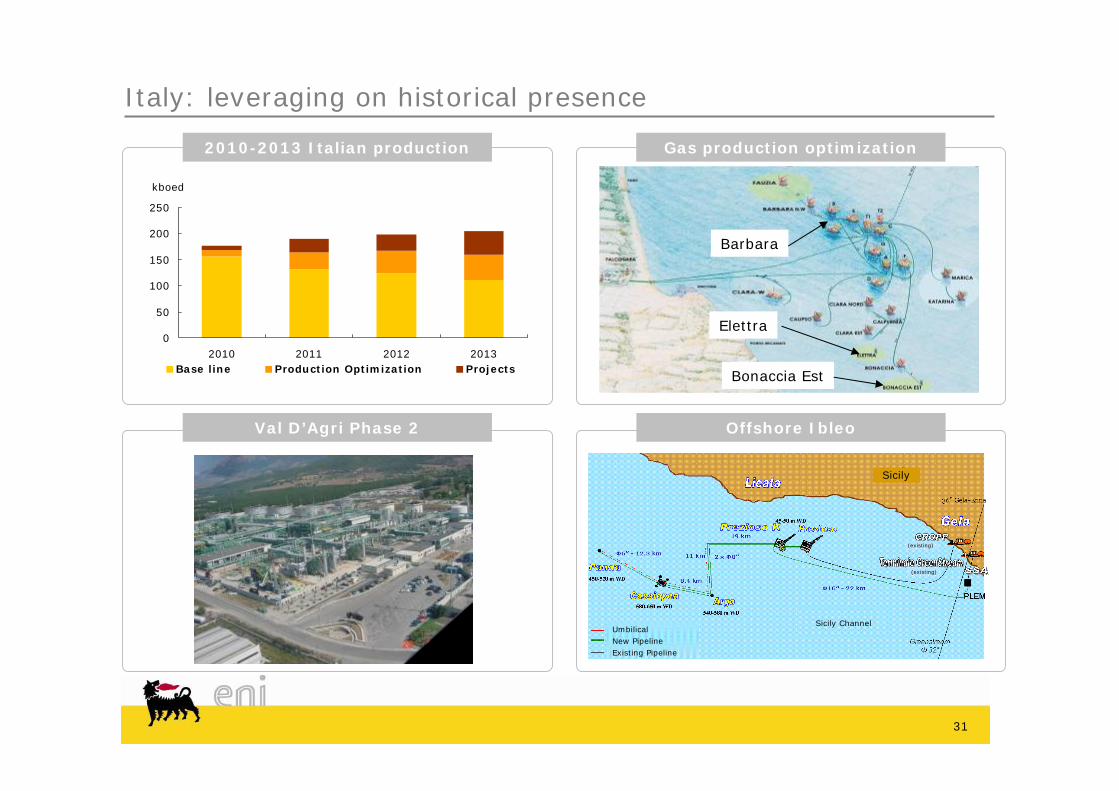
Italy: leveraging on historical presence
0
50
100
150
200
250
2010 2011 2012 2013Base line Production Optimization Projects
kboed
2010-2013 Italian production Gas production optimization
Val D’Agri Phase 2 Offshore Ibleo
Elettra
Barbara
Bonaccia Est
Sicily
(existing)
(existing)
Sicily ChannelUmbilicalNew PipelineExisting Pipeline
eni.com
Exploration and Unconventional
Luca Bertelli, SVP Exploration and Unconventional
3333
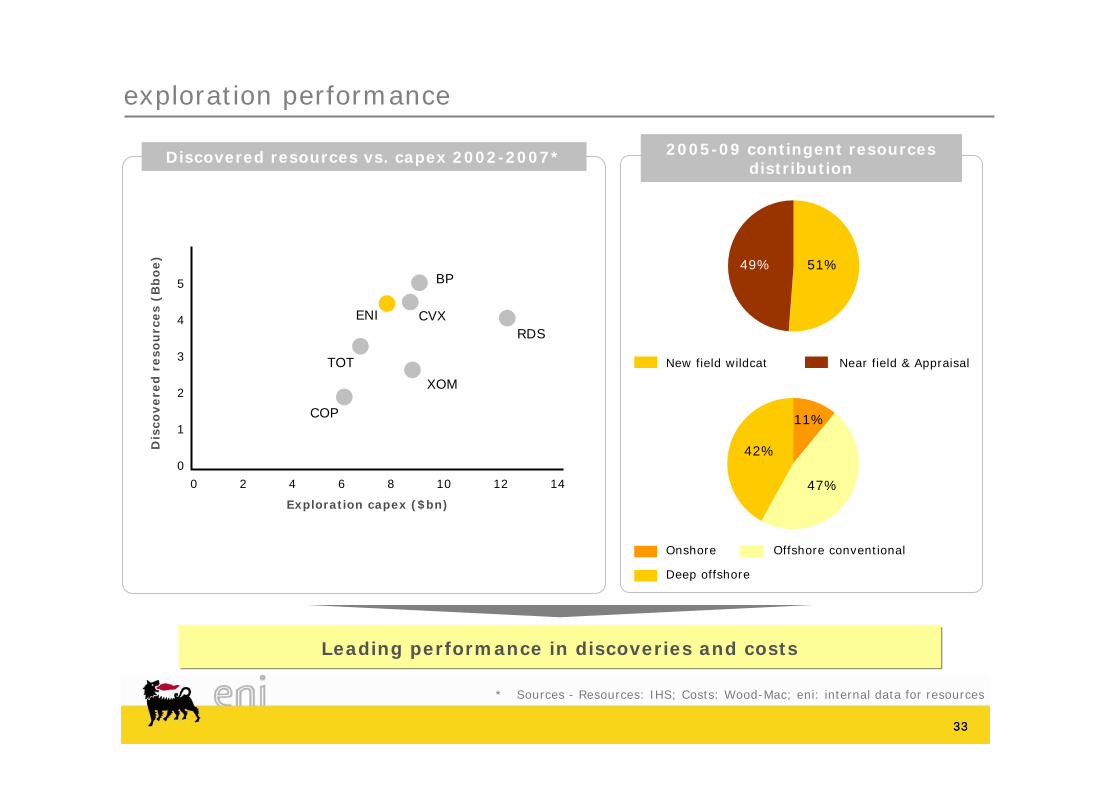
exploration performance
CVXENI
BP
RDS
XOM
TOT
COP
5
4
3
2
1
0
0 2 4 6 8 10 12 14
Exploration capex ($bn)
Dis
covere
d r
eso
urc
es
(Bb
oe)
Discovered resources vs. capex 2002-2007* 2005-09 contingent resources distribution
* Sources - Resources: IHS; Costs: Wood-Mac; eni: internal data for resources
Leading performance in discoveries and costs
51%49%
47%
42%
11%
Near field & AppraisalNew field wildcat
Onshore Offshore conventional
Deep offshore
3434
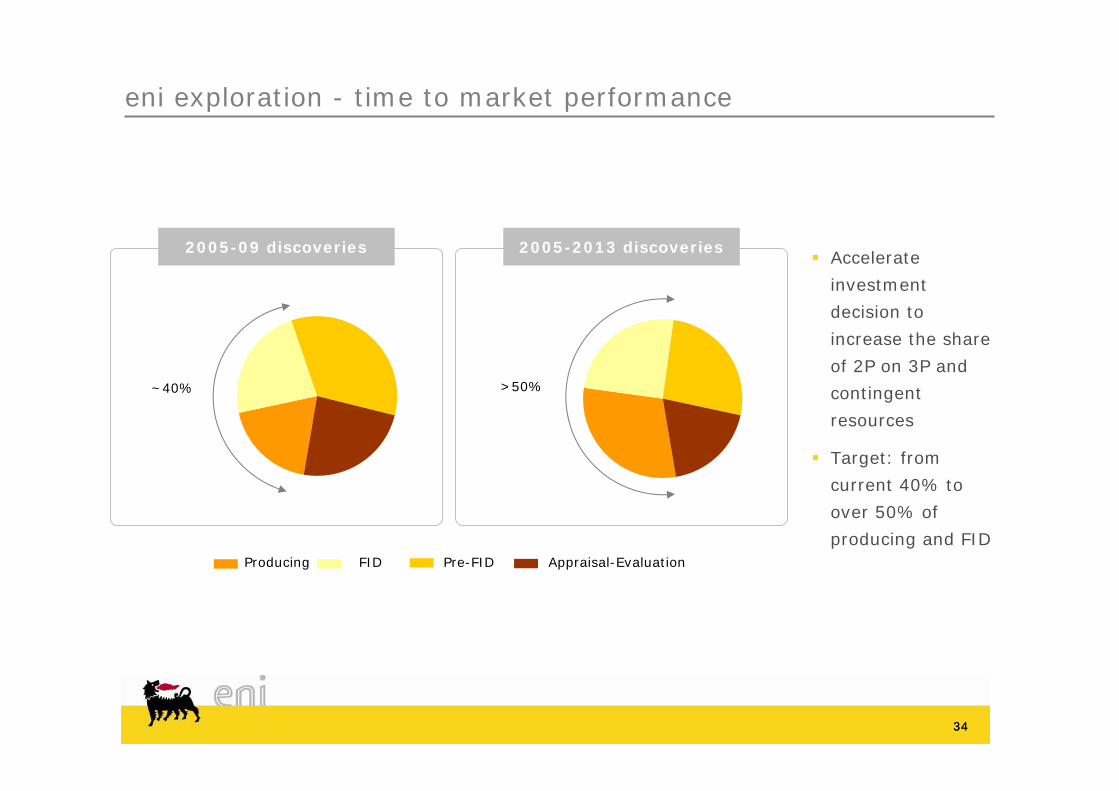
eni exploration - time to market performance
Accelerate
investment
decision to
increase the share
of 2P on 3P and
contingent
resources
Target: from
current 40% to
over 50% of
producing and FIDAppraisal-EvaluationProducing FID Pre-FID
>50%~40%
2005-2013 discoveries2005-09 discoveries
3535
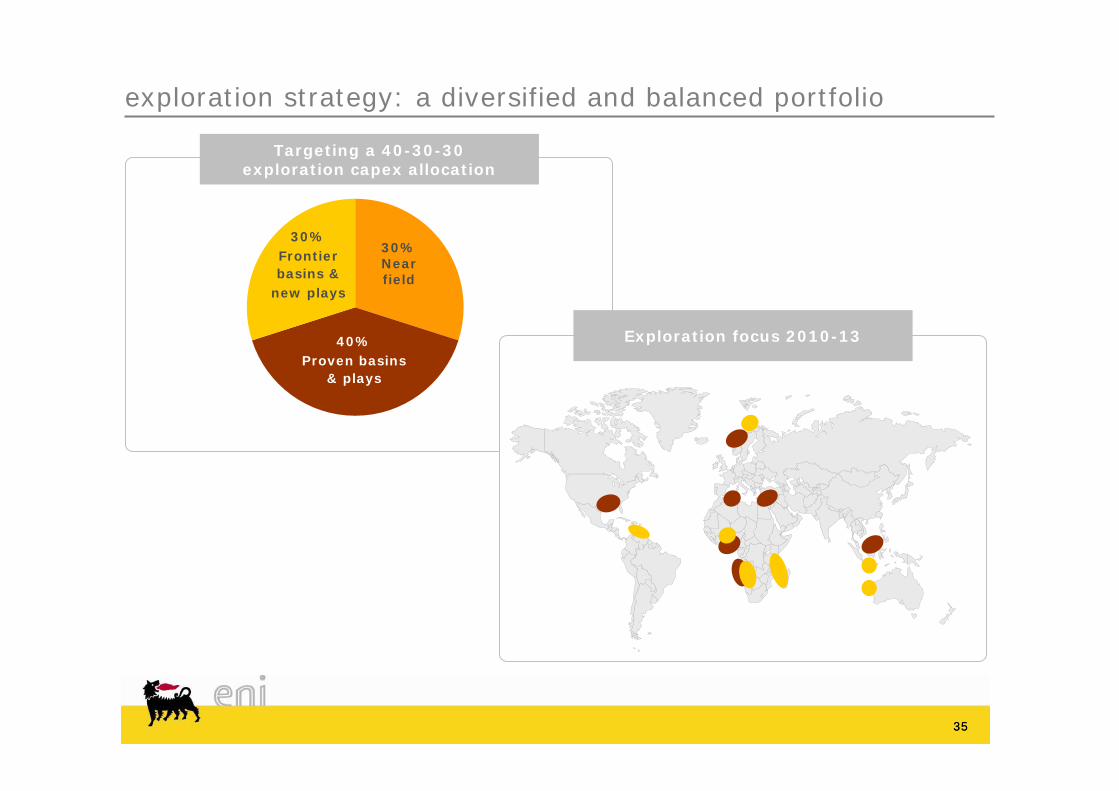
exploration strategy: a diversified and balanced portfolio
Exploration focus 2010-13
Targeting a 40-30-30exploration capex allocation
40%Proven basins
& plays
30%Frontier basins &
new plays
30%Nearfield

3636
frontier basins & new plays
Tano basin (Ghana) Tano basin (Ghana)
Australia DW Carnarvon basin Timor Leste & Timor W basins
Australia DW Carnarvon basin Timor Leste & Timor W basins
Pre-salt potentialin Gabon onshoreand offshore basins
Pre-salt potentialin Gabon onshoreand offshore basins
Barents Sea basinBarents Sea basin
Rovuma basin (Mozambique) Rovuma basin (Mozambique)
VenezuelaMaracaibo offshoregas basin
VenezuelaMaracaibo offshoregas basin

3737
Onshore US: gas shalealliance with Quicksilver Barnett shale (TX)
Onshore US: gas shalealliance with Quicksilver Barnett shale (TX)
Indonesia: CBMSanga Sanga PSC pilot project ongoing
Indonesia: CBMSanga Sanga PSC pilot project ongoing
Pakistan: tight gas Pakistan: tight gas
2010-13 unconventional focus
Congo: Tar sands Ongoing exploration and pilot project feasibility
Congo: Tar sands Ongoing exploration and pilot project feasibility

3838
Improve geological model De-risk frontier exploration
Improve geological model De-risk frontier exploration
Unlock material resources in complex geological settings and
revitalize proven basins
Unlock material resources in complex geological settings and
revitalize proven basins
leading edge proprietary technologies
3D PSM models Eni RTM PSDM
Probability
0% 100%50%
ProbabilityProbability
0% 100%50%
Probabilistic ranking of prospects
0
5
10
15
20
25
1990
1992
1994
1996
1998
2000
2002
2004
2006
2008
N° o
f App
licat
ions
eni petroleum system modelling eni depth imaging toolkit

eni.com
North Africa
Guido Michelotti, EVP North Africa and Middle East

4040
Key challenges (2010-2013)
Mitigating the decline of giant, but mature fields through:
Production optimization
Greenfield projects
Exploration
Exploration & Production
Mali
Libya#1
Algeria#1
Egypt#1
Tunisia#1
North Africa overview
0
300
600
2009 2010 2013
kboe/d
Stable production
North African equity production
kboe/d
New projects

4141
Block 405b (Eni 75%, Sonatrach 25%)
MLE: 13 new and 10 re-entry wells; gas gathering system; gas plant for 350 MM Scfd
CAFC: 56 new wells; gas and water injection; gas, oil and water gathering system, oil treatment plant
Common facilities
Central Processing Facilities (CPF), infrastructure and utilities
Export pipelines for gas, LPG and condensates from CPF to Gassi Touil. Oil pipeline to Hassi Berkine central storage
New Base de Vie & Industrial base
Algeria: MLE/CAFC development project
Project (100%) MLE CAFC
Contract type PSA PSA
Capex 1.5 $bn 2.0 $bn
Reserves 240 Mboe 340 Mboe
Peak Prod. 55 kboed 64 kboed
Start-up Nov. 2011Nov. 2011(Gas), Dec. 2012 (Oil)
Progress 32% FEED contract signed in April 2010
MLE project
B208
B403c/e
B404
El BormaTUNISIA
B212Eni
Eni OperatorEni Asset
B405bFCP
TU
NIS
IA
ALG
ER
IA

4242
Egypt strategic guidelines
Manage decline through new technologies and EOR
Develop gas discoveries in the Mediterranean by 2012
352 Mboe of reserves*
production plateau of 123 kboed*
Exploration
re-focus on Western Desert
new themes in Mediterranean offshore
Oil leasesin Gulf of Suez
extended till 2030
* Data at 100%
Improved displacement
efficiency
Radial drilling

4343
Libyan further gas potential
Long term growth fueled by
around 1.5 billion boe of
undeveloped gas reserves
Gas sales to increase from 10
to 16 BCM per year from 2015
Minor investments required to
upgrade export facilities
Timing and sequencing of
developments to be confirmed
upon evolution of gas market
EPSA
Area D
eni.com
Sub-Saharan Africa
Roberto Casula, EVP Sub-Saharan Africa

45
Sub-Saharan Africa overview
0
300
600
2009 2010 2013
>15%>15%
~10%~10%
Focus on growth (+5.4% 2000-09)
New start-ups
Flaring down and domestic gas utilization
Cooperation and sustainability projects
kboe/d
Equity production 2009-2013Pillars/drivers
Exploration
Exploration & Production
Angola
Nigeria
Mozambique
Gabon Congo
Ghana
+9% CAGR in gross operated production 2009-2013
+9% CAGR in gross operated production 2009-2013
CAGR

4646
update on Nigeria
2nd operator in Nigeria
onshore (land and swamp)
Leader in flaring reduction
and gas monetization
Shifting focus towards new
opportunities in offshore oil
Continuing to monitor the
developing situation on the
Petroleum Industry Bill
Managing security
challenges
Abo FPSO
Kwale Okpai IPP

47
Oil production enhancement: 110 producers and 86 injectors
Sea water intake system and 24” pipeline to M’boundifor (up to) 240 kbwpd water injection
Compression of 2 Mcm/d gas to supply 300 MW power plant in Djeno and re-injection of up to 2 Mcm/dassociated gas. Separation of condensates
Rehabilitation of the high voltage electrical grid Pointe Noire – Brazzaville
M’BOUNDI WATER, OIL, GAS
FACILITIES
DJENO WATER INTAKE PLANT
* Full life
M’BOUNDI FIELDEni share 83% (operated)
Contract type PSA
Capex (100%)* 3.8 $bn
Reserves (100%) 360 Mboe
Peak Production (100%) 85 kboed
Start-up Gas 2010 – Water 2010
Progress 70%
M’Boundi project

48
Angola block 15/06 – west hub
Eni share 35% (operated)
Contract type PSA
Capex (100%)* 3.1 $bn
Reserves (100%) 160 Mboe
Peak Production (100%) 90 kboed
Start-up 2012
Progress Pre-FID phase
Potential development of 4 offshore deepwater fields (Sangos, Ngoma, Cinguvu & Nzanza) with a total of 18 wells (12 producers and 6 water/gas injectors wells)
Oil exported through turret moored FPSO - 100 kbopdtreatment capacity and 1.7 Mbbls liquid storage
FID expected to be finalized and approved by YE2010
Planned time to market: 4 years
* Full life – full development case
WI
DC
Sangos
N’Goma
WAG3
WAG1 & 2
S-1
Xikomba FPSO
DC
Cinguvu
N’Zanza
WI
DC
WI
DC
WI
DC
Sangos
N’Goma
WAG3
WAG1 & 2
S-1
Xikomba FPSO
DC
Cinguvu
N’Zanza
WI
DC
WI
DC

eni.com
Focus on Venezuela and Arctic projects
Marco Alverà, EVP Russia, North Europe and Americas

50
Junin 5: a conventional development
Producing fields in Orinoco oil belt
PDVSA-eni: 60%/40%; concession-like
structure (royalties at 33%)
Reserves: >2.5 billion bbl
Early production 75 kbbld, start up 2013
Long-term plateau 240 kbbld, start up 2018
1,500 wells at 1.6 M$ each
New refinery built on the coast at Jose
Competitive unit capex cost ~$7/bbl (including
refinery)
Products sold on international markets
Final approval expected in June
Tax: upstream 50%; downstream 34%

51
Joint operatorship PDVSA (35%), Eni (32.5%) and
Repsol (32.5%)*
Water depth 60 m; 50 km from coast
Concession structure (royalties at 20%)
>9 tcf reserves with further upside potential
Discovered in 2009
Early production targeted in 2H 2013 at 300 Mscf/d
Full field potential >1 bcf/d
Perla 3 & 4 appraisal wells planned for 2H 2010
Perla: a giant discovery
* post PDVSA back-in

52
Venezuelan gas market: large domestic potential
Early production to feed the CRP complex (50 km south-east of Perla) which includes 3 currently oil-
fuelled refineries
Domestic market can absorb all of Perla gas. Options to be analysed:
Gas feed for EOR projects (steam injection) and/or petrochemical in the Lake Maracaibo area
Use for heavy oil upgraders in Faja projects (synergies with Junín 5)
Power generation plants (4x1000 MW plants planned to be built in the country by 2016)
Export markets via pipeline or CNG (to the Caribbean) or LNG
Perla
CIGMALNG
CRP

53
Arctic projects
Arctic challenges
Harsh weather conditions
Limited infrastructure
Environmental vulnerability
Specific technologies needed:
Bundled/insulated pipelines
Seismic on ice and under ice
Nikaitchuq eni 100%
Exploration activity
Ooogurukeni 30%
Goliateni 65%
Severenergiaeni 29%

54
Goliat
Offshore subsea arctic project
22 wells to be drilled, 8 subsea templates,
circular design FPSO
Power supply from shore to reduce CO2
emissions
Associated gas strategy: re-injection vs export
ConcessionContract type
94 kboedPeak Production (100%)
November 2013Start-up
4.3 %Progress
175 MboeReserves (100%)
5.2 $bnCapex (100%)*
65% (operated)Eni share
* Full life

55
Severenergia: Samburgskoye development
4 Severenergialicences:
Samburgskoye, Yaro, Yevo and
Severo
4 Severenergialicences:
Samburgskoye, Yaro, Yevo and
Severo
Land arctic project
146 wells to be drilled and 3
gas/condensate production trains
Gas and condensate offtake commercial
agreements
Complex JV and local legislation constraints
ConcessionContract type
145 kboedPeak Production (100%)
2011Start-up
80% (facilities)Progress
851 MboeReserves (100%)
2.4 $bnCapex (100%)*
29.4%Eni share
* Full life

56
Nikaitchuq
ConcessionContract type
26 kboedPeak Production (100%)
2011Start-up
77% (onshore)Progress
187 MboeReserves (100%)
1.9 $bnCapex (100%)*
100% (operated)Eni share
MAPPANikaitchuq
Offshore/Onshore arctic project
30 horizontal wells to be drilled from an island
22 horizontal wells from onshore pads
Buried pipeline bundle including pipe-in-pipe
Independent processing facility (40 kbbls/d) with
spare capacity
State-of-the-art oil spill prevention and HSE programs
* Full life

eni.com
Kazakhstan and Far East
Massimo Mondazzi EVP Central Asia and Pacific Region

58
Kashagan
Eskene WestAtyrau
KashaganKashagan4Q 2012Start-up EP
370 kboedEP production @ 2013
PSAContract type
1.5 Mbbl/dPeak Production (100%)
ca. 14 Bboe3P Reserves (100%)
32 B$Capex EP* (100%)
16.81%Eni share
Challenges: high pressured reservoir, H2S,
shallow water and harsh conditions
Details of progress (T1&2) @ April 2010:
Offshore 78%
Onshore 90%
* Experimental Program

59
Far East potential
New phase of
transformational growth
through exploration
Near term activity in 3 main
basins
10 wells within 2011
> 1bn boe of net equity
risked potential
Unconventional in Indonesia
2010 >2015 >2020
existing discoveries
Exploration success
medium
high
Production growth in case of success
Carnarvon
Kutei
JPDZ/Timor

60
Kitan
Short time to market: start-up 3 years from the
declaration of commerciality
Technical and operational synergies connected to
possible new developments from prospects in the
area
KitanKitan
PSAContract type
40 kboedPeak Production (100%)
3Q 2011Start-up
30 MboeReserves (100%)
475 M$Capex (100%)
40% (operated)Eni share

61
Indonesia CBM
World’s first CBM to LNG project
Synergies from existing production and
treatment facilities in Sanga Sanga and
Bontang LNG plant
PSAContract type
Up to 90 kboed in 2016Peak Production (100%)
2011Pilot production start-up
~5 TCFResources (100%)
37.8% (joint operatorship)Eni share

eni.com
Iraq
Claudio Descalzi, COO E&P Division

63
Zubair asset description
20 km South-West of Basra; field area
is approx. 65 km long and 18 km wide
First discovered in 1949 with
production start-up in 1951; Recovery
factor to November 2009: ~7%
Current production: ~180 kbbld
5 degassing stations with a total
design capacity of 520 kbbld
182 wells drilled and existing surface
facilities
Oil delivered to FAO and then to Khor
al-Amaya terminals (ca. 1.6 M bopd)
The AREA is ~ 1 100 sq Km

64
Zubair work programme highlights for 2010
SOC Operator for
the whole of 2010
eni will provide
maximum support to
SOC during
operations…
…in order to increase
production by 10%
vs. IPR*
Tie-in 9 already drilled wells
Drill 12 new producers
Workovers on 5 wells to install
ESP pumps for artificial lift
Rigless activities
De-bottlenecking of existing
facilities and production
enhancement through
implementation of new
technologies
* Initial Production Rate

65
Zubair development project
Rehabilitation plan (2011-2013)46 new wells and 100 workovers
reservoir surveillance
upgrades to increase production to c. 700 kboed
Enhanced redevelopment plan (2013-2020)215 new producers and 124 new injectors,
installation of permanent facilities to support the entire proposed production plateau
20$ billionCapex (100%)
Eni share 32.8%
Contract type Technical Service Contract
Duration 20 years
Reserves (100%) 6.5 Bboe
Peak Production (100%) 1,200 kboed
Project description
18/02/10 18/02/10 20/03/10 15/04/10
Initial Production 182,778 STB/D
Rehabili-tation Plan submitted
Contract Effective Date
Interim Work Program and Budget
Key contracts to be awarded in 2010Key milestones reached
Security services
3D seismic
Drilling
Lines, pipes, PG, PP
Demining
Oil Tanks

eni.com
Closing Remarks
Claudio Descalzi, COO E&P Division

6767
looking ahead
New plays: pre-salt Africa onshore and offshore
Domestic gas valorization
Tar sands in West Africa
Shale gas in North Africa/East Europe
CBM in the Pacific area
Synergic unconventional
Synergic unconventional
Focus on conventional
Focus on conventional

6868
closing remarks
Organic production growthOrganic production growth
Focus on resource conversionFocus on resource conversion
Effective exploration strategyEffective exploration strategy

eni.com
appendix

70
TOT
XOM
BP
RDS
CVX
COP
-1
0
1
2
3
4
-2 -1 0 1 2 3 4 5 6
continuous growth
Production CAGR 2000-2009
Org
an
ic P
rod
uct
ion
CA
GR
20
09
-20
13
Excl. XTOExcl. XTO
Excl. Devon assetsExcl. Devon assets
Excl. disposalsExcl. disposals
Continuous Growth

71
11040 60 140
24328
2004 Price effect2004-2009
Nigeria Venezuela(Dacion)
Portfolioactivity
Organicgrowth
OPEC 2009 2009
kboed
growth in recent years
2009 vs. 2004
eni: +1.7% CAGRpeers avg.: -0.4% CAGR
1,6241,769

72
selective portfolio activity
100
150
200
2010 2011 2012 2013
Expected Production Additional Volumes
kboed
Dominion (2007) GoM 2 new discoveries (Kodiak and Stones)
M&P (2007) Congo M’Boundi recovery factor from 21% to >30%; new gas project
Burren (2008) Turkmenistanand Congo
MoU in Turkmenistan
Arcticgaz (2007) Russia 2 PDO approvals
First Calgary (2008)
Algeria FIDs of MLE and CAFC 2009-2010
Main acquisitions
Pro
du
cin
g
ass
ets
Reso
urc
e
pla
ys
Production from acquisitions
Assets Area Upside after acquisition
eni’s share of reserves/resources:
~4bn boe (+50%)