Embed Size (px)
Citation preview
1© 2011 The MathWorks, Inc.
Enhancing your Risk Modeling
Architecture
Steve Wilcockson
Industry Marketing – Financial Services
2
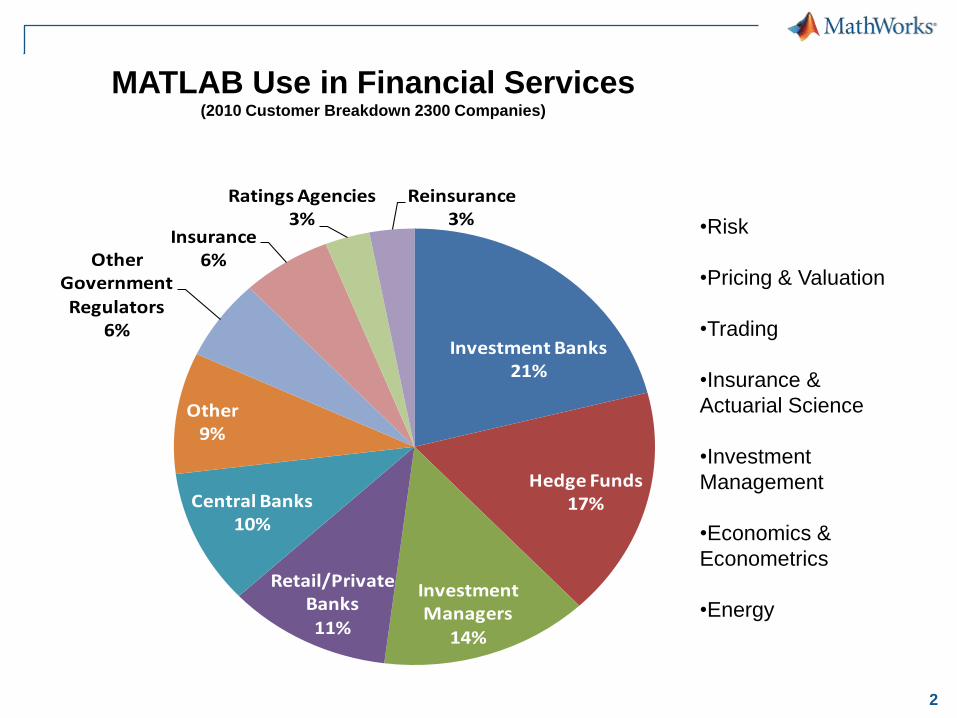
Investment Banks21%
Hedge Funds17%
Investment Managers
14%
Retail/Private Banks11%
Central Banks10%
Other9%
Other Government Regulators
6%
Insurance6%
Ratings Agencies3%
Reinsurance3%
MATLAB Use in Financial Services(2010 Customer Breakdown 2300 Companies)
•Risk
•Pricing & Valuation
•Trading
•Insurance &
Actuarial Science
•Investment
Management
•Economics &
Econometrics
•Energy
3
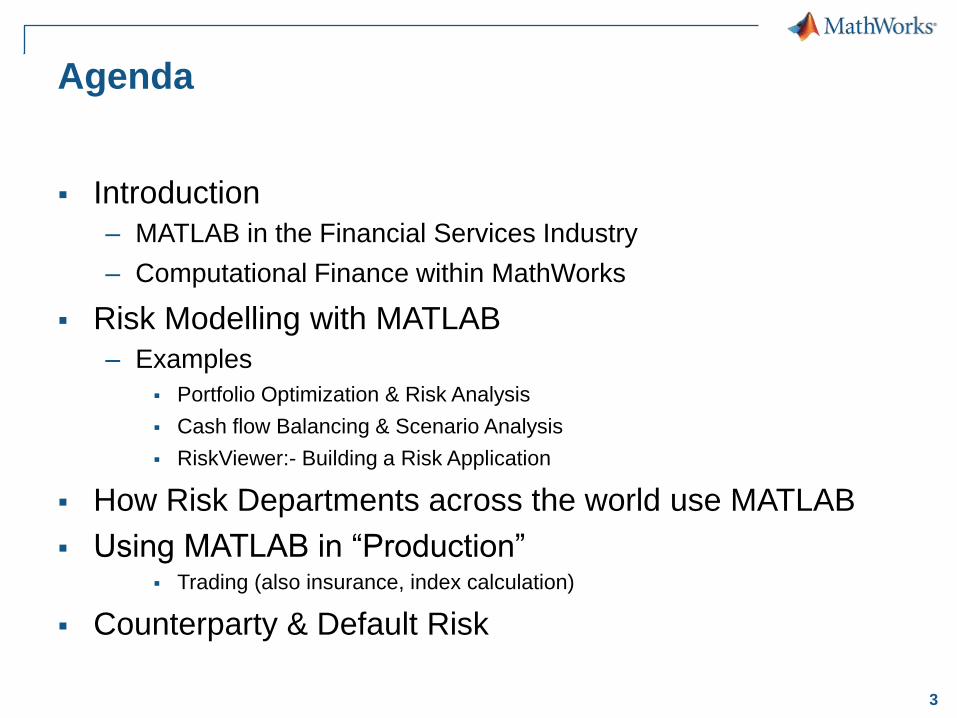
Agenda
Introduction
– MATLAB in the Financial Services Industry
– Computational Finance within MathWorks
Risk Modelling with MATLAB
– Examples
Portfolio Optimization & Risk Analysis
Cash flow Balancing & Scenario Analysis
RiskViewer:- Building a Risk Application
How Risk Departments across the world use MATLAB
Using MATLAB in ―Production‖ Trading (also insurance, index calculation)
Counterparty & Default Risk
4
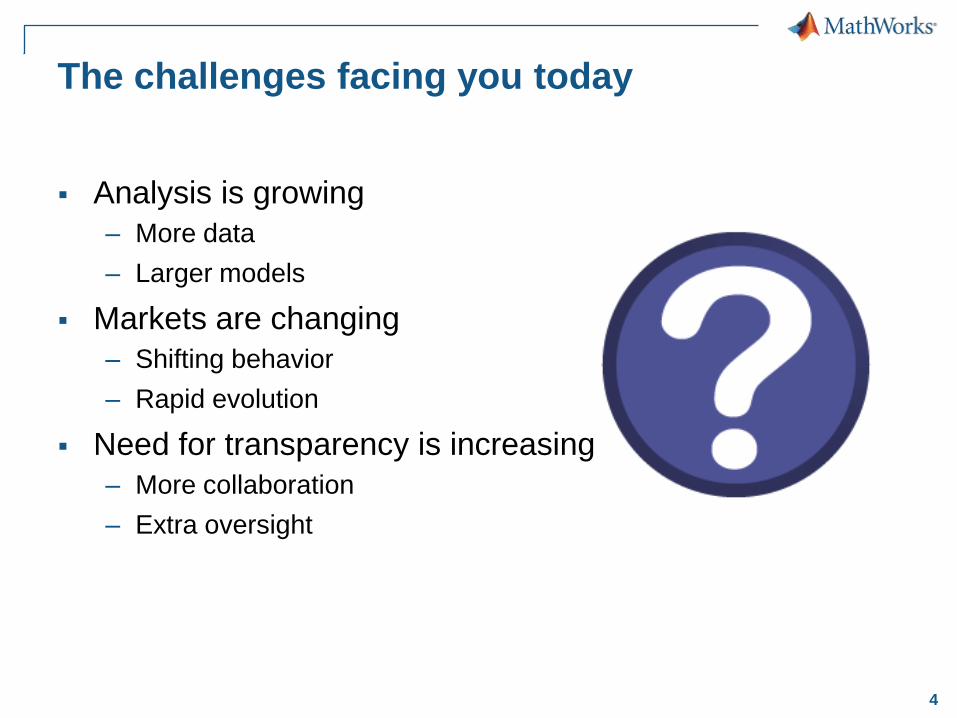
The challenges facing you today
Analysis is growing
– More data
– Larger models
Markets are changing
– Shifting behavior
– Rapid evolution
Need for transparency is increasing
– More collaboration
– Extra oversight
5
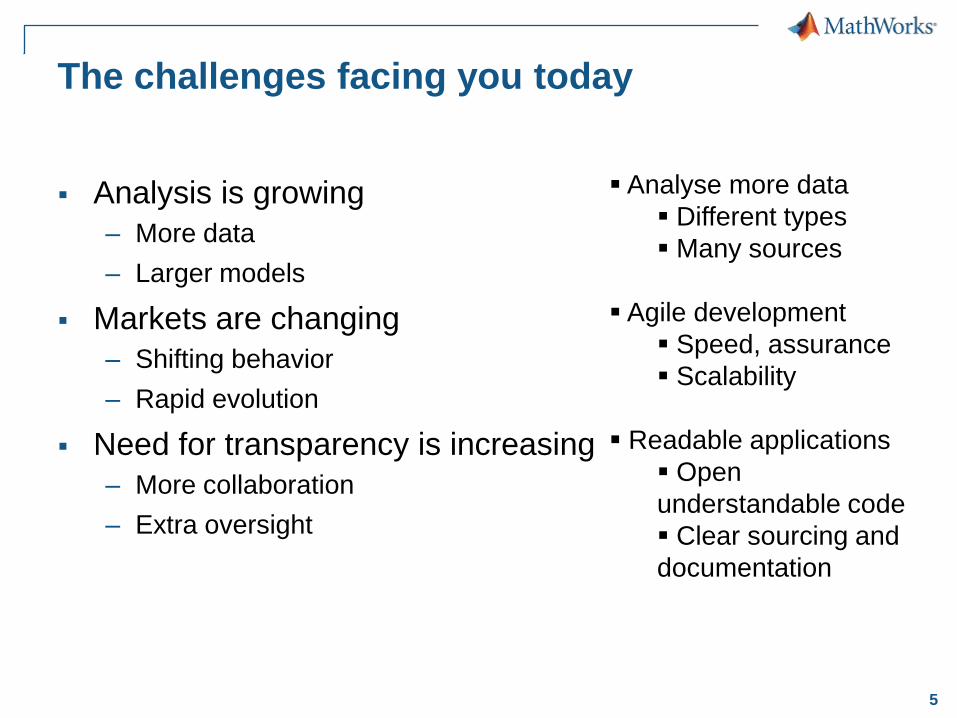
The challenges facing you today
Analysis is growing
– More data
– Larger models
Markets are changing
– Shifting behavior
– Rapid evolution
Need for transparency is increasing
– More collaboration
– Extra oversight
Analyse more data
Different types
Many sources
Agile development
Speed, assurance
Scalability
Readable applications
Open
understandable code
Clear sourcing and
documentation
6
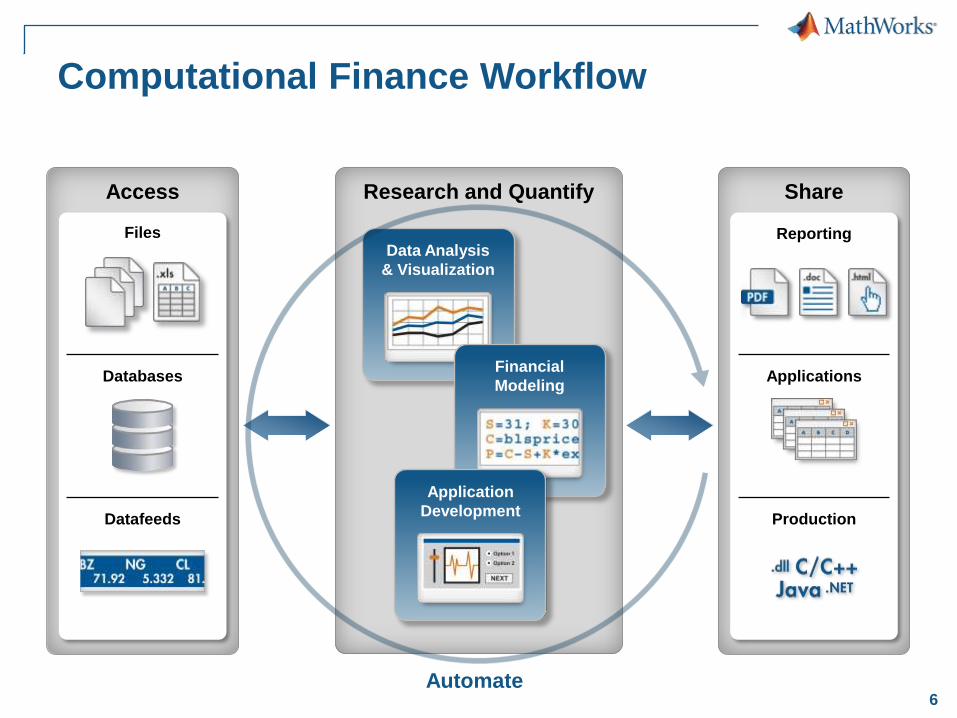
Computational Finance Workflow
Research and Quantify
Data Analysis
& Visualization
Financial
Modeling
Application
Development
Reporting
Applications
Production
Share
Automate
Files
Databases
Datafeeds
Access
7
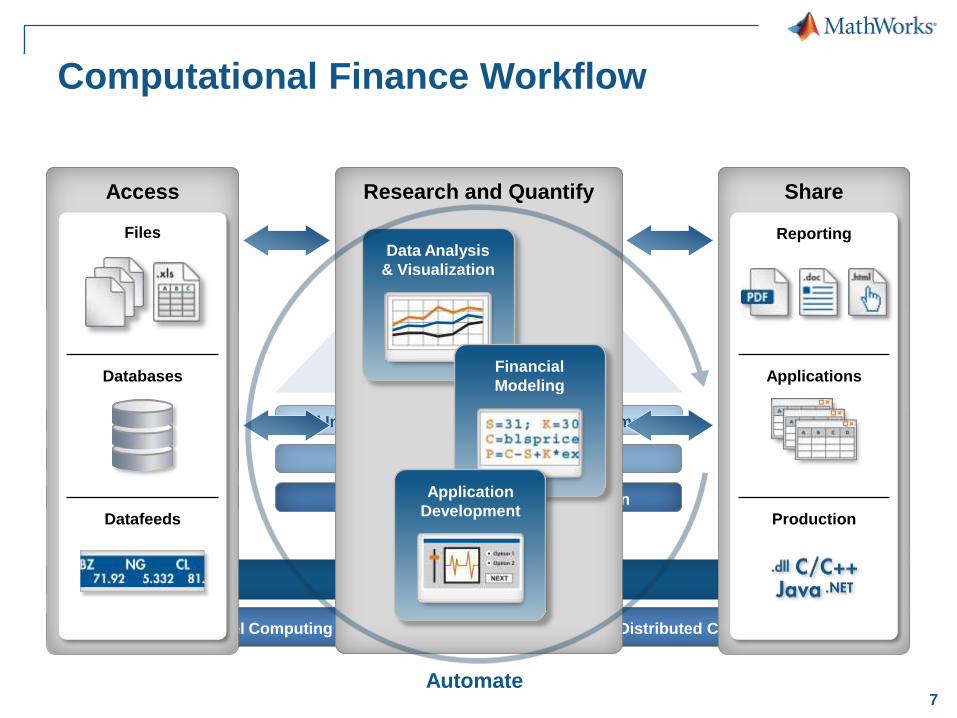
Computational Finance Workflow
Financial
Statistics Optimization
Fixed Income Financial Derivatives Econometrics
MATLAB
Parallel Computing MATLAB Distributed Computing Server
Files
Databases
Datafeeds
Access
Reporting
Applications
Production
Share
Data Analysis and Visualization
Financial Modeling
Application Development
Research and Quantify
Datafeed
Database
Spreadsheet Link EX
Builder NE
Builder EX
Builder JA
MATLAB Compiler
Rep
ort G
en
era
tor
Research and Quantify
Data Analysis
& Visualization
Financial
Modeling
Application
Development
Reporting
Applications
Production
Share
Automate
Files
Databases
Datafeeds
Access
8
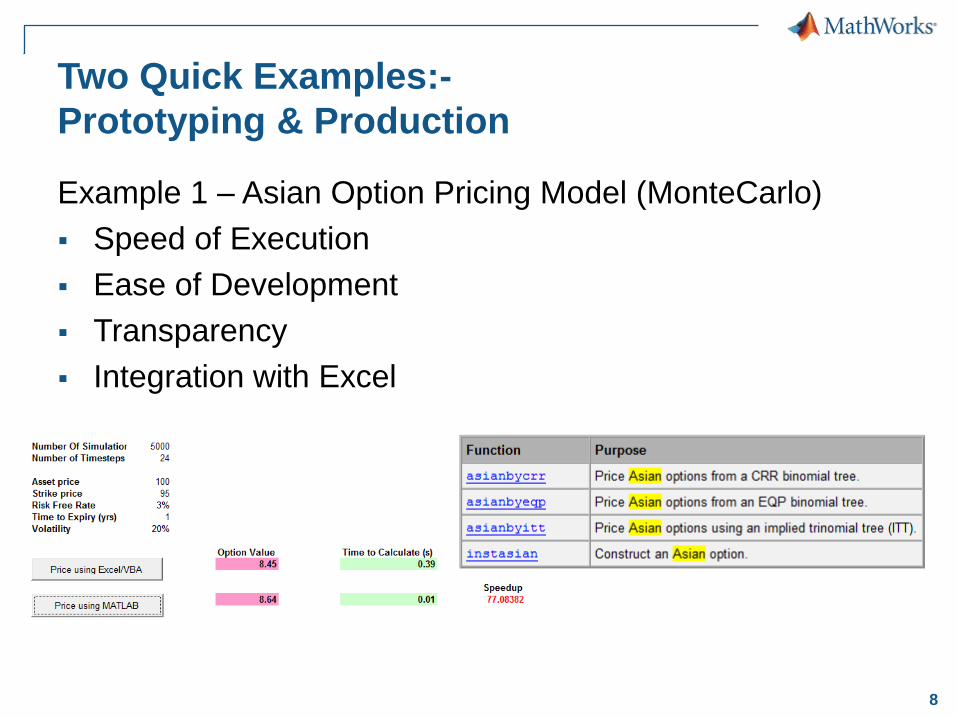
Two Quick Examples:-
Prototyping & Production
Example 1 – Asian Option Pricing Model (MonteCarlo)
Speed of Execution
Ease of Development
Transparency
Integration with Excel
9
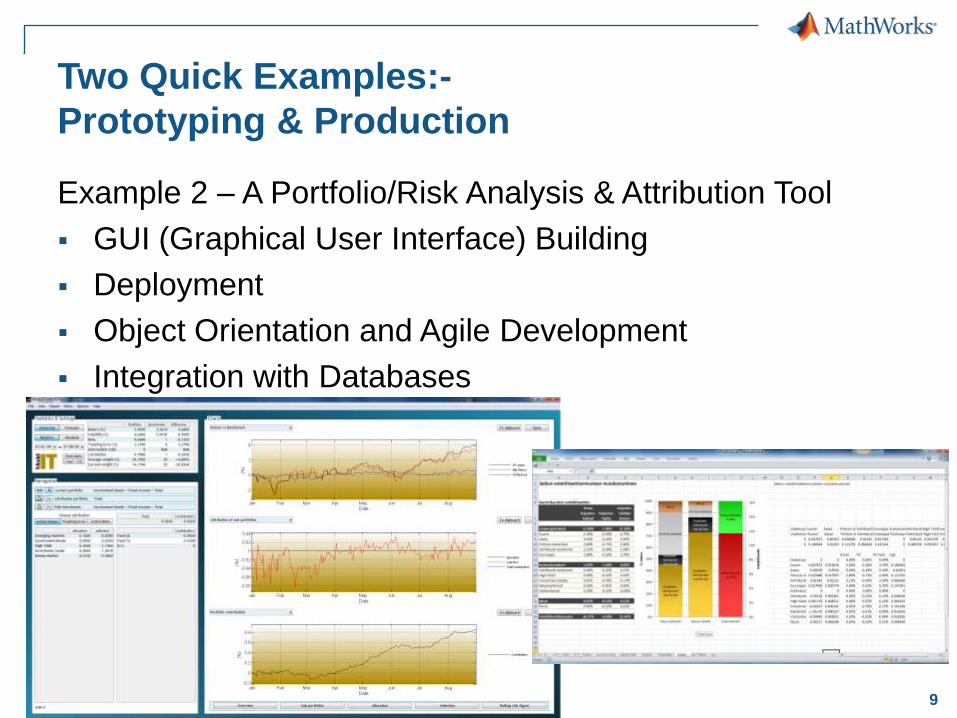
Two Quick Examples:-
Prototyping & Production
Example 2 – A Portfolio/Risk Analysis & Attribution Tool
GUI (Graphical User Interface) Building
Deployment
Object Orientation and Agile Development
Integration with Databases
10
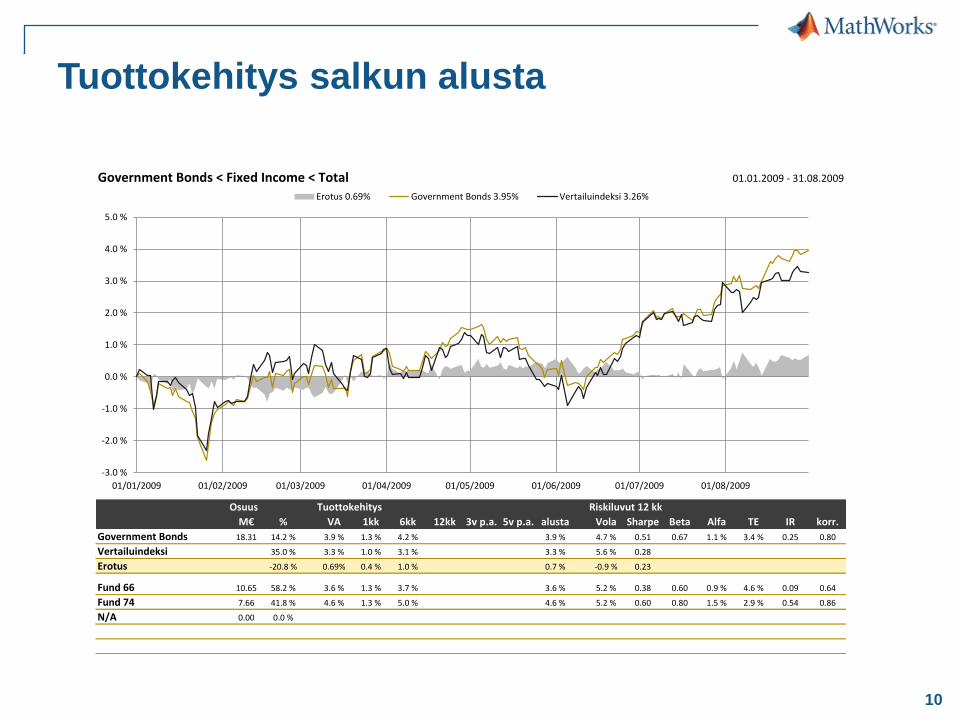
Tuottokehitys salkun alusta
Government Bonds < Fixed Income < Total 01.01.2009 - 31.08.2009
Osuus Tuottokehitys Riskiluvut 12 kk
M€ % VA 1kk 6kk 12kk 3v p.a. 5v p.a. alusta Vola Sharpe Beta Alfa TE IR korr.
Government Bonds 18.31 14.2 % 3.9 % 1.3 % 4.2 % 3.9 % 4.7 % 0.51 0.67 1.1 % 3.4 % 0.25 0.80
Vertailuindeksi 35.0 % 3.3 % 1.0 % 3.1 % 3.3 % 5.6 % 0.28
Erotus -20.8 % 0.69% 0.4 % 1.0 % 0.7 % -0.9 % 0.23
Fund 66 10.65 58.2 % 3.6 % 1.3 % 3.7 % 3.6 % 5.2 % 0.38 0.60 0.9 % 4.6 % 0.09 0.64
Fund 74 7.66 41.8 % 4.6 % 1.3 % 5.0 % 4.6 % 5.2 % 0.60 0.80 1.5 % 2.9 % 0.54 0.86
N/A 0.00 0.0 %
-3.0 %
-2.0 %
-1.0 %
0.0 %
1.0 %
2.0 %
3.0 %
4.0 %
5.0 %
01/01/2009 01/02/2009 01/03/2009 01/04/2009 01/05/2009 01/06/2009 01/07/2009 01/08/2009
Erotus 0.69% Government Bonds 3.95% Vertailuindeksi 3.26%
11
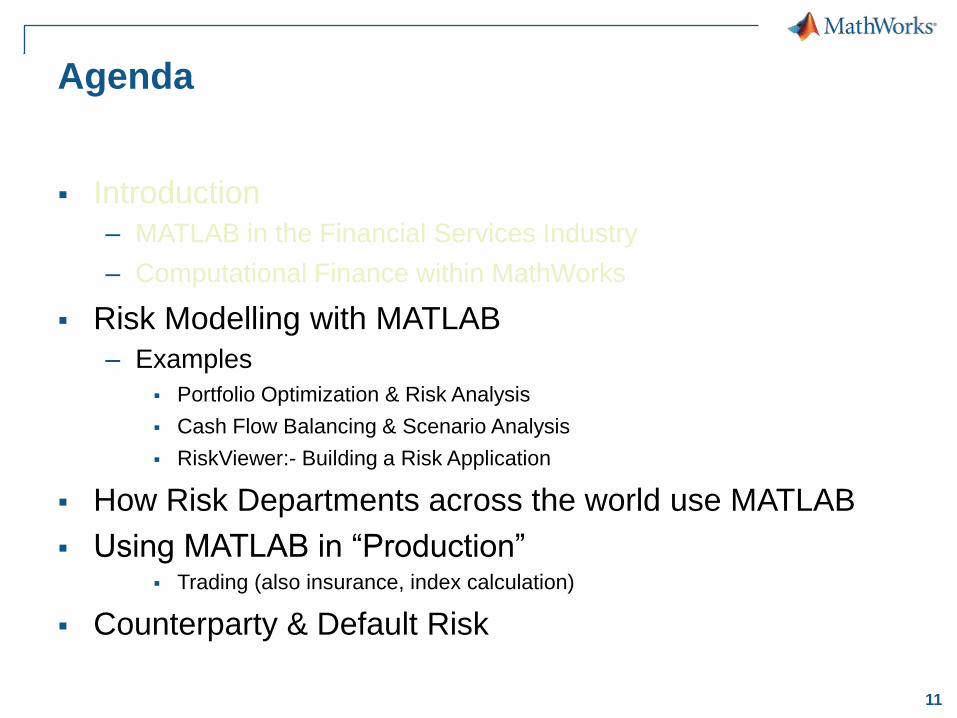
Agenda
Introduction
– MATLAB in the Financial Services Industry
– Computational Finance within MathWorks
Risk Modelling with MATLAB
– Examples
Portfolio Optimization & Risk Analysis
Cash Flow Balancing & Scenario Analysis
RiskViewer:- Building a Risk Application
How Risk Departments across the world use MATLAB
Using MATLAB in ―Production‖ Trading (also insurance, index calculation)
Counterparty & Default Risk
12
13
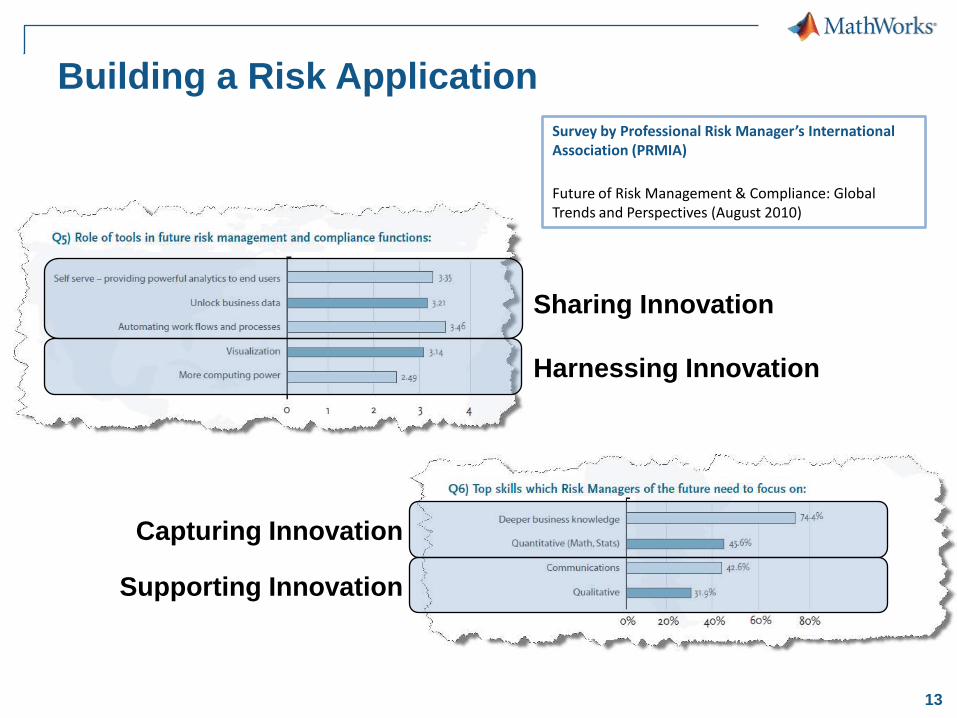
Sharing Innovation
Harnessing Innovation
Capturing Innovation
Supporting Innovation
Survey by Professional Risk Manager’s International Association (PRMIA)
Future of Risk Management & Compliance: Global Trends and Perspectives (August 2010)
Building a Risk Application
14
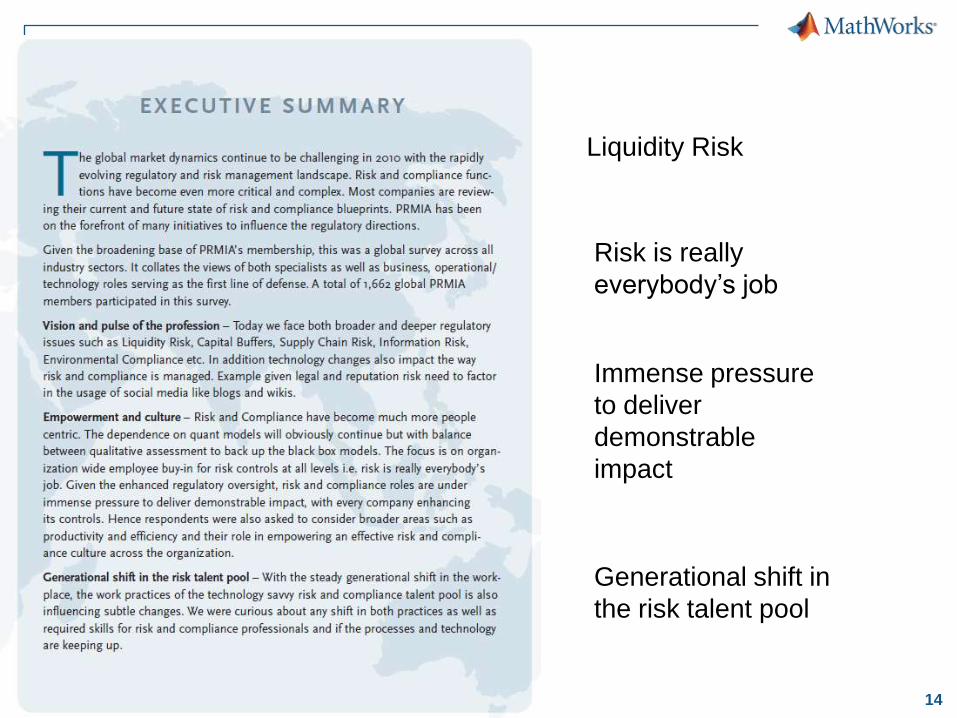
Liquidity Risk
Risk is really
everybody’s job
Immense pressure
to deliver
demonstrable
impact
Generational shift in
the risk talent pool
15
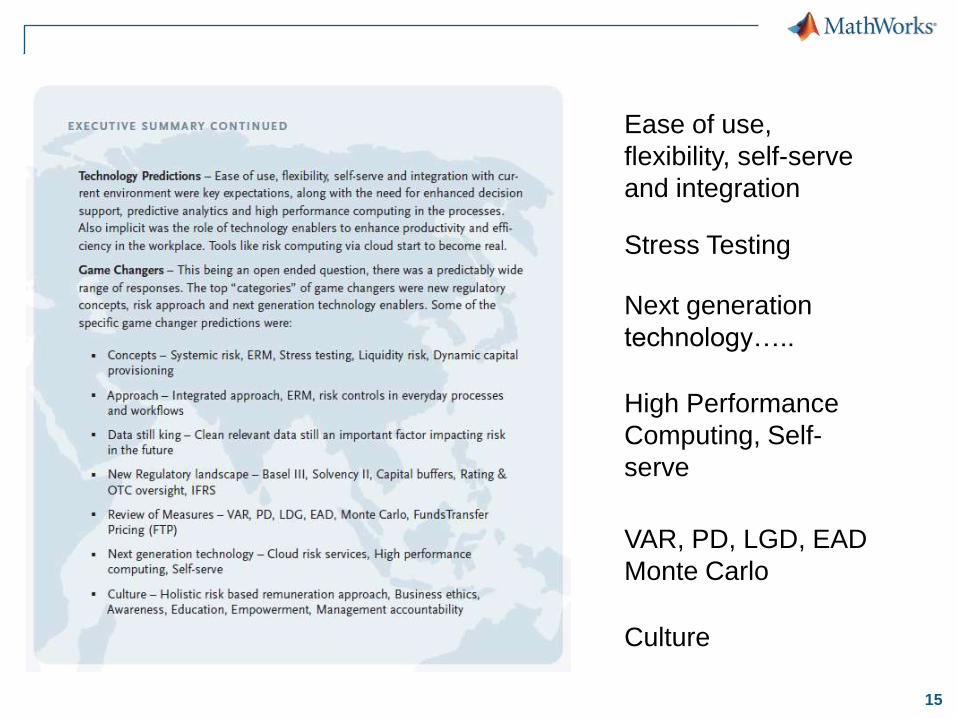
Ease of use,
flexibility, self-serve
and integration
Next generation
technology…..
VAR, PD, LGD, EAD
Monte Carlo
Culture
High Performance
Computing, Self-
serve
Stress Testing
16
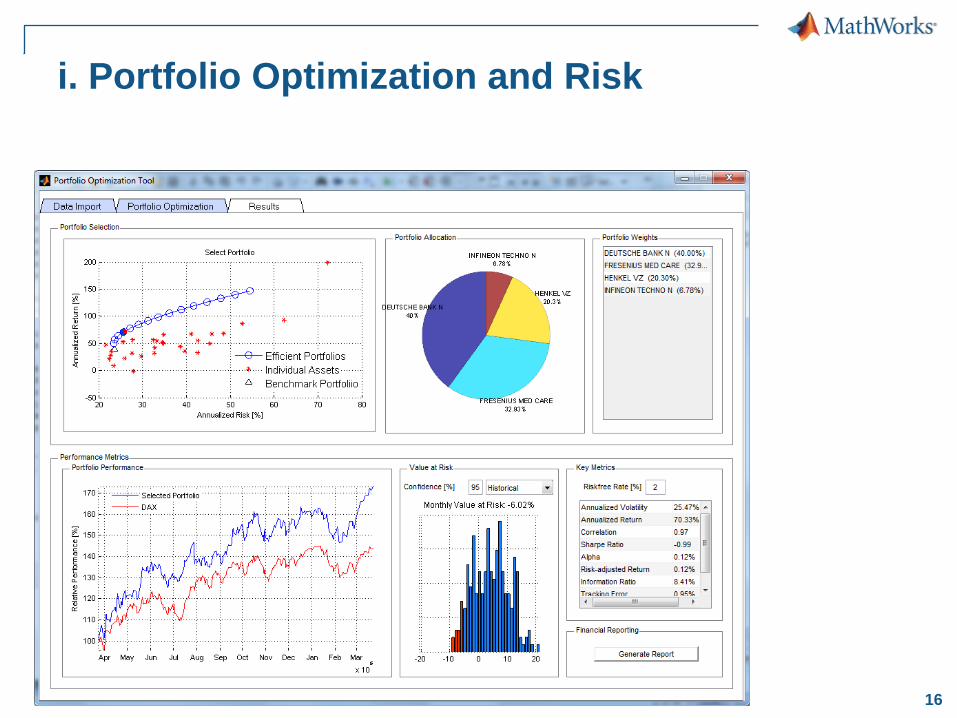
i. Portfolio Optimization and Risk
17
18
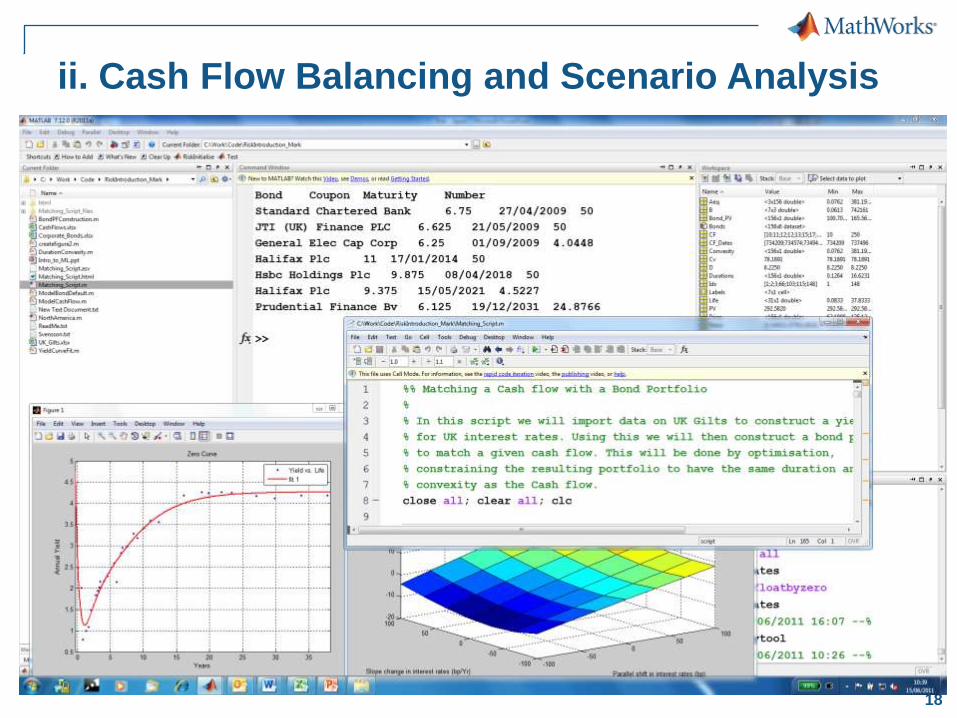
ii. Cash Flow Balancing and Scenario Analysis
19
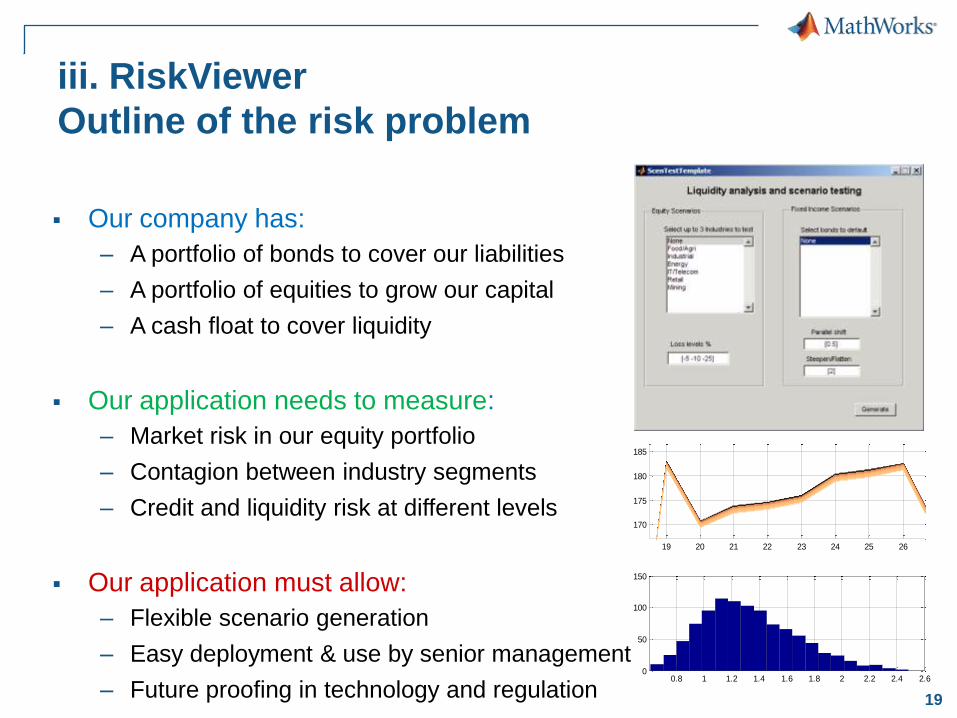
iii. RiskViewer
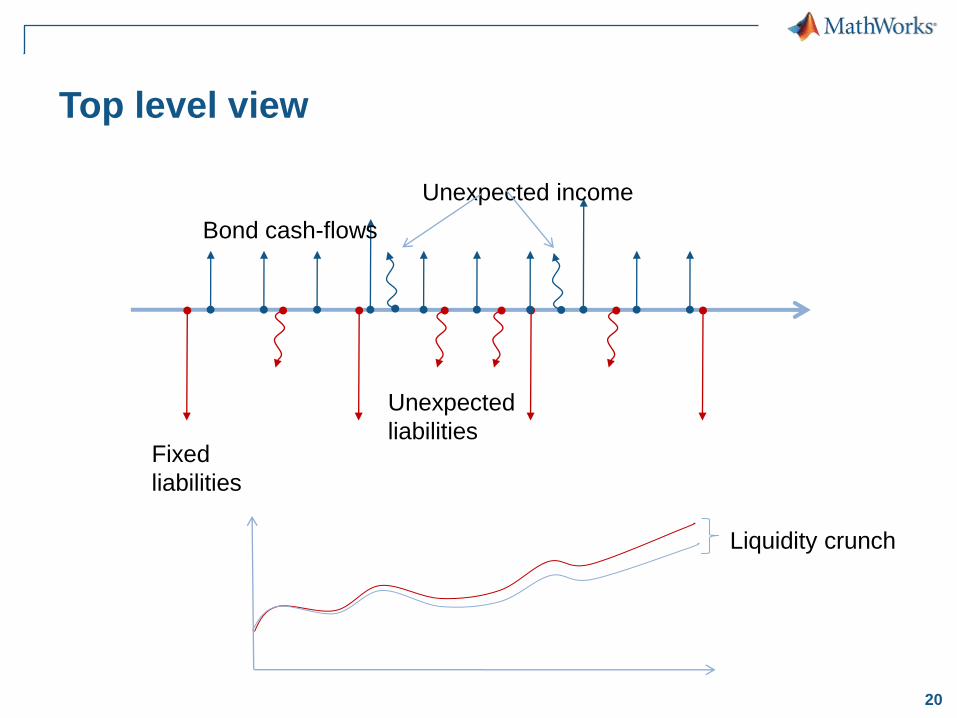
Outline of the risk problem
Our company has:
– A portfolio of bonds to cover our liabilities
– A portfolio of equities to grow our capital
– A cash float to cover liquidity
Our application needs to measure:
– Market risk in our equity portfolio
– Contagion between industry segments
– Credit and liquidity risk at different levels
Our application must allow:
– Flexible scenario generation
– Easy deployment & use by senior management
– Future proofing in technology and regulation
19 20 21 22 23 24 25 26
170
175
180
185
0.8 1 1.2 1.4 1.6 1.8 2 2.2 2.4 2.60
50
100
150
20
Top level view
Bond cash-flows
Fixed
liabilities
Unexpected
liabilities
Unexpected income
Liquidity crunch
21
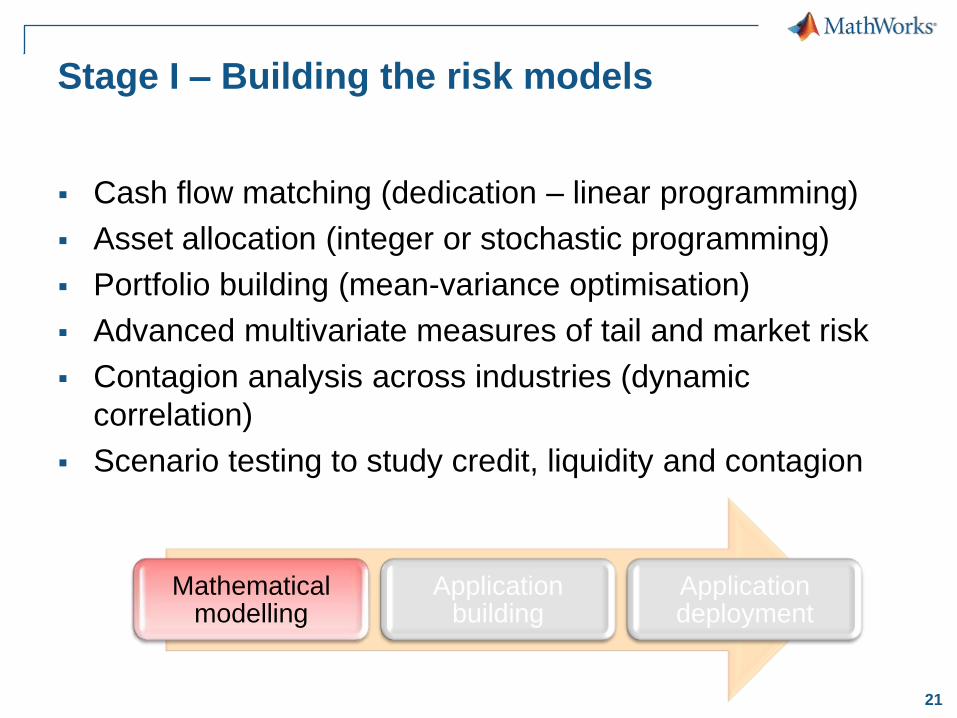
Stage I – Building the risk models
Cash flow matching (dedication – linear programming)
Asset allocation (integer or stochastic programming)
Portfolio building (mean-variance optimisation)
Advanced multivariate measures of tail and market risk
Contagion analysis across industries (dynamic
correlation)
Scenario testing to study credit, liquidity and contagion
Mathematical modelling
Application building
Application deployment
22
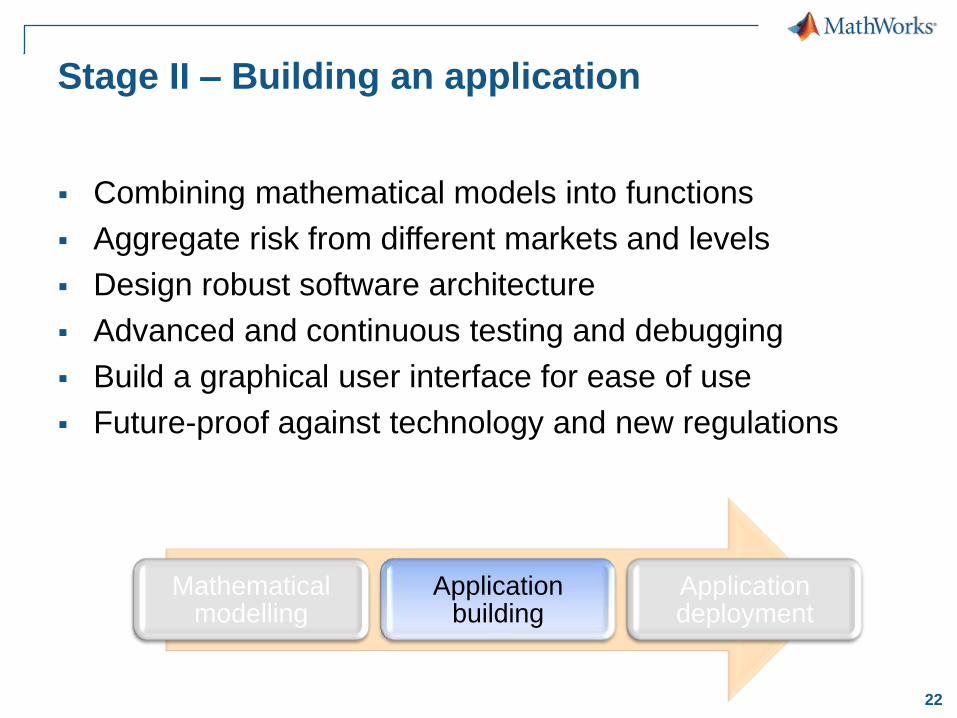
Stage II – Building an application
Combining mathematical models into functions
Aggregate risk from different markets and levels
Design robust software architecture
Advanced and continuous testing and debugging
Build a graphical user interface for ease of use
Future-proof against technology and new regulations
Mathematical modelling
Application building
Application deployment
23
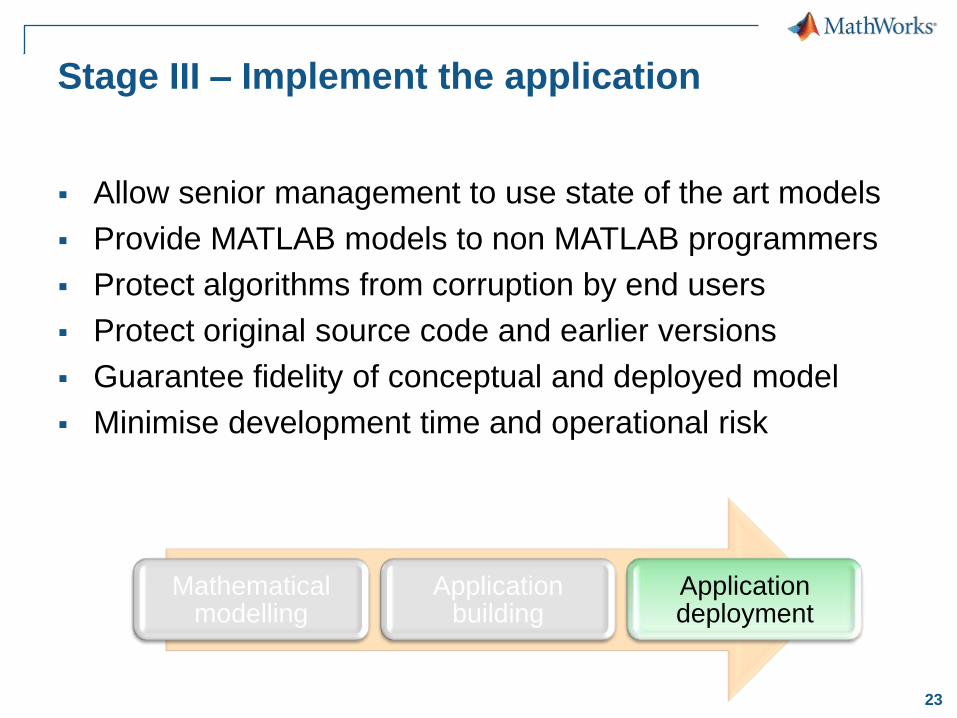
Stage III – Implement the application
Allow senior management to use state of the art models
Provide MATLAB models to non MATLAB programmers
Protect algorithms from corruption by end users
Protect original source code and earlier versions
Guarantee fidelity of conceptual and deployed model
Minimise development time and operational risk
Mathematical modelling
Application building
Application deployment
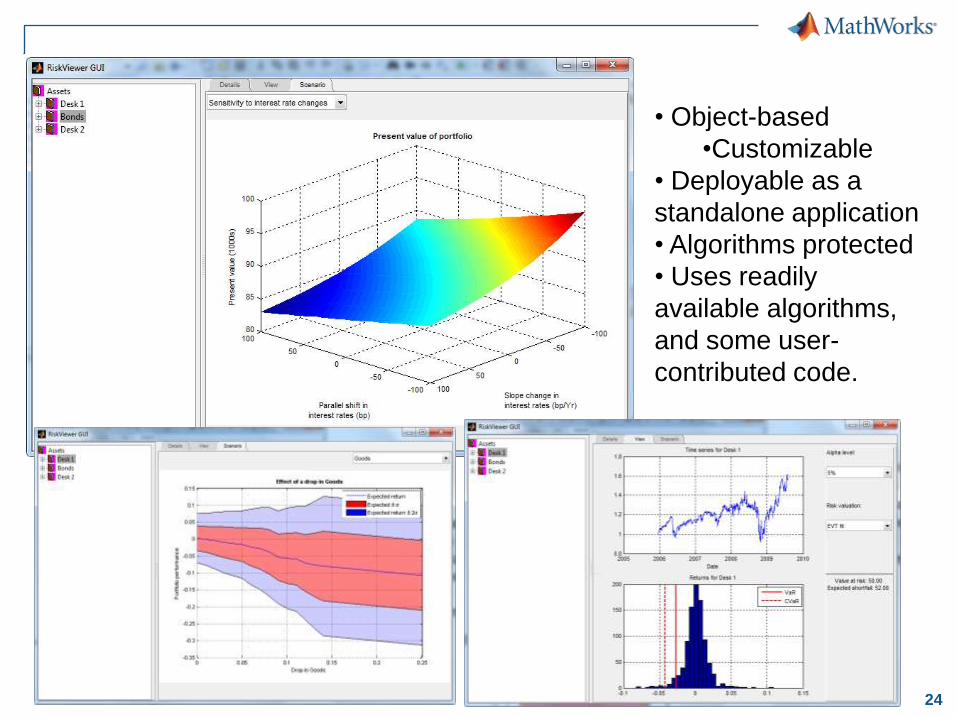
24
• Object-based
•Customizable
• Deployable as a
standalone application
• Algorithms protected
• Uses readily
available algorithms,
and some user-
contributed code.
25
Agenda
Introduction
– MATLAB in the Financial Services Industry
– Computational Finance within MathWorks
Risk Modelling with MATLAB
– Examples
Portfolio Optimization & Risk Analysis
Cash flow Balancing & Scenario Analysis
RiskViewer:- Building a Risk Application
How Risk Departments across the world use MATLAB
Using MATLAB in ―Production‖ Trading (also insurance, index calculation)
Counterparty & Default Risk
26
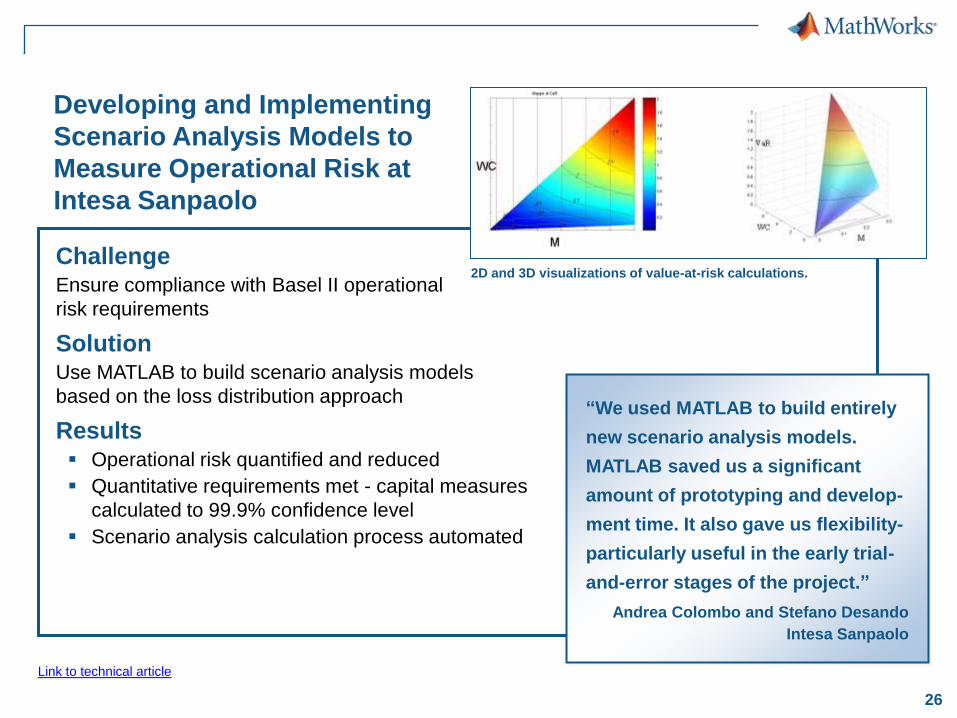
Developing and Implementing
Scenario Analysis Models to
Measure Operational Risk at
Intesa Sanpaolo
ChallengeEnsure compliance with Basel II operational
risk requirements
SolutionUse MATLAB to build scenario analysis models
based on the loss distribution approach
Results Operational risk quantified and reduced
Quantitative requirements met - capital measures
calculated to 99.9% confidence level
Scenario analysis calculation process automated
“We used MATLAB to build entirely
new scenario analysis models.
MATLAB saved us a significant
amount of prototyping and develop-
ment time. It also gave us flexibility-
particularly useful in the early trial-
and-error stages of the project.”
Andrea Colombo and Stefano Desando
Intesa Sanpaolo
Link to technical article
2D and 3D visualizations of value-at-risk calculations.
27
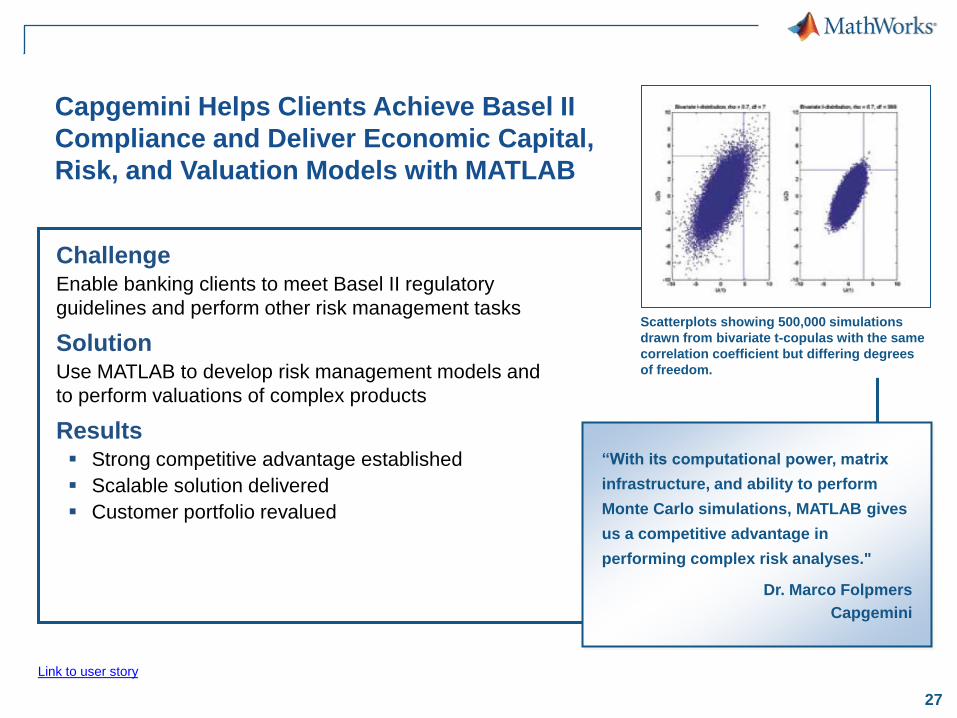
Capgemini Helps Clients Achieve Basel II
Compliance and Deliver Economic Capital,
Risk, and Valuation Models with MATLAB
ChallengeEnable banking clients to meet Basel II regulatory
guidelines and perform other risk management tasks
SolutionUse MATLAB to develop risk management models and
to perform valuations of complex products
Results Strong competitive advantage established
Scalable solution delivered
Customer portfolio revalued
“With its computational power, matrix
infrastructure, and ability to perform
Monte Carlo simulations, MATLAB gives
us a competitive advantage in
performing complex risk analyses."
Dr. Marco Folpmers
Capgemini
Link to user story
Scatterplots showing 500,000 simulations
drawn from bivariate t-copulas with the same
correlation coefficient but differing degrees
of freedom.
28
29
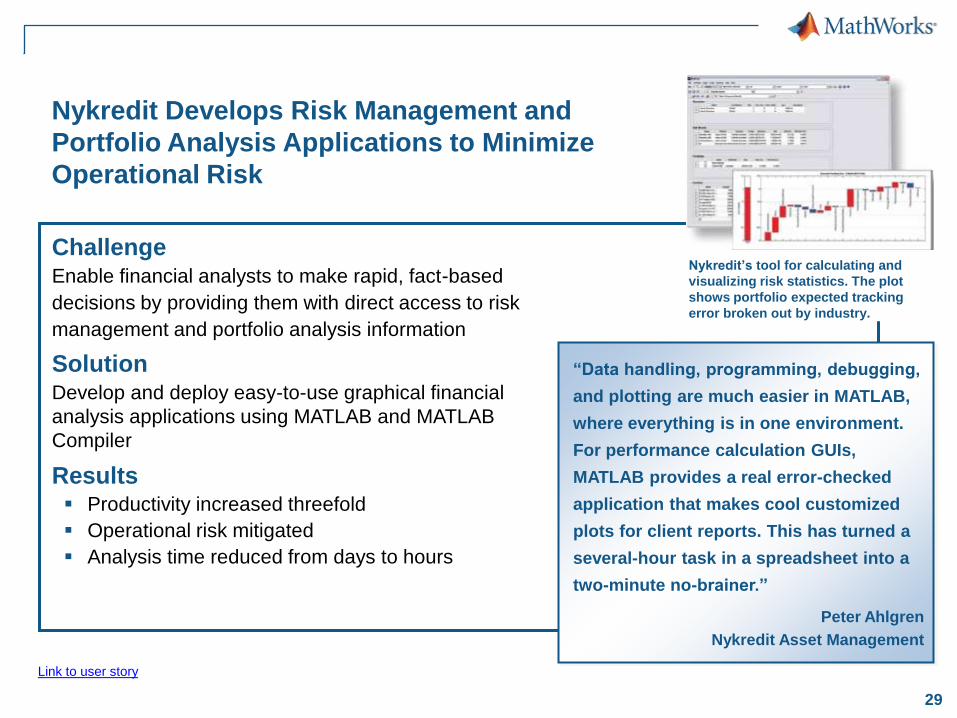
Nykredit Develops Risk Management and
Portfolio Analysis Applications to Minimize
Operational Risk
ChallengeEnable financial analysts to make rapid, fact-based
decisions by providing them with direct access to risk
management and portfolio analysis information
SolutionDevelop and deploy easy-to-use graphical financial
analysis applications using MATLAB and MATLAB
Compiler
Results Productivity increased threefold
Operational risk mitigated
Analysis time reduced from days to hours
Link to user story
Nykredit’s tool for calculating and
visualizing risk statistics. The plot
shows portfolio expected tracking
error broken out by industry.
“Data handling, programming, debugging,
and plotting are much easier in MATLAB,
where everything is in one environment.
For performance calculation GUIs,
MATLAB provides a real error-checked
application that makes cool customized
plots for client reports. This has turned a
several-hour task in a spreadsheet into a
two-minute no-brainer.”
Peter Ahlgren
Nykredit Asset Management
30
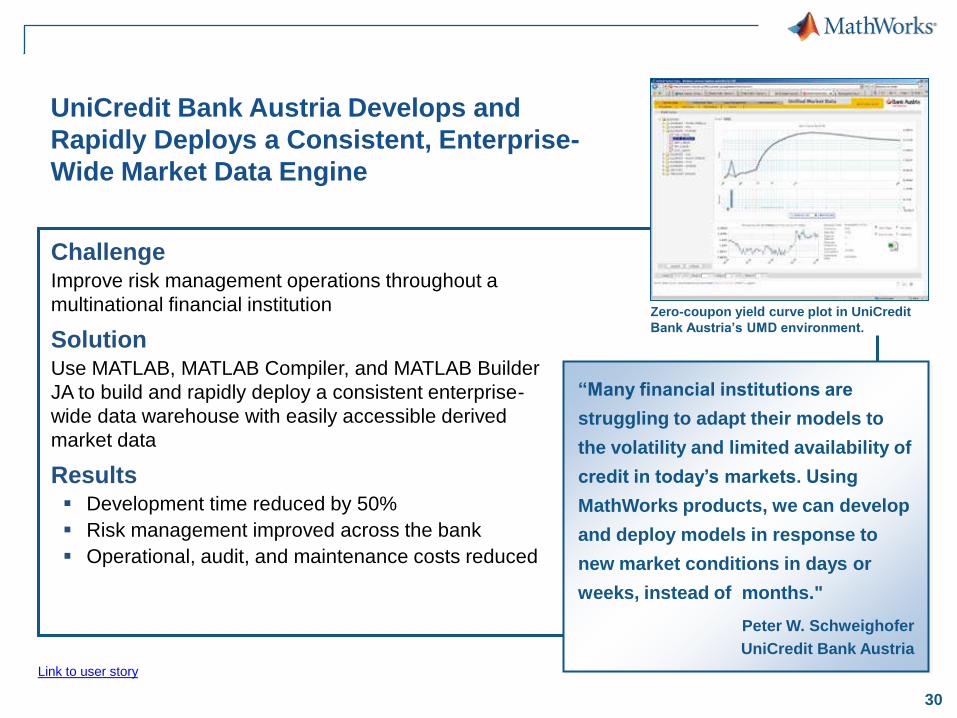
UniCredit Bank Austria Develops and
Rapidly Deploys a Consistent, Enterprise-
Wide Market Data Engine
ChallengeImprove risk management operations throughout a
multinational financial institution
SolutionUse MATLAB, MATLAB Compiler, and MATLAB Builder
JA to build and rapidly deploy a consistent enterprise-
wide data warehouse with easily accessible derived
market data
Results Development time reduced by 50%
Risk management improved across the bank
Operational, audit, and maintenance costs reduced
“Many financial institutions are
struggling to adapt their models to
the volatility and limited availability of
credit in today’s markets. Using
MathWorks products, we can develop
and deploy models in response to
new market conditions in days or
weeks, instead of months."
Peter W. Schweighofer
UniCredit Bank Austria
Link to user story
Zero-coupon yield curve plot in UniCredit
Bank Austria’s UMD environment.
31
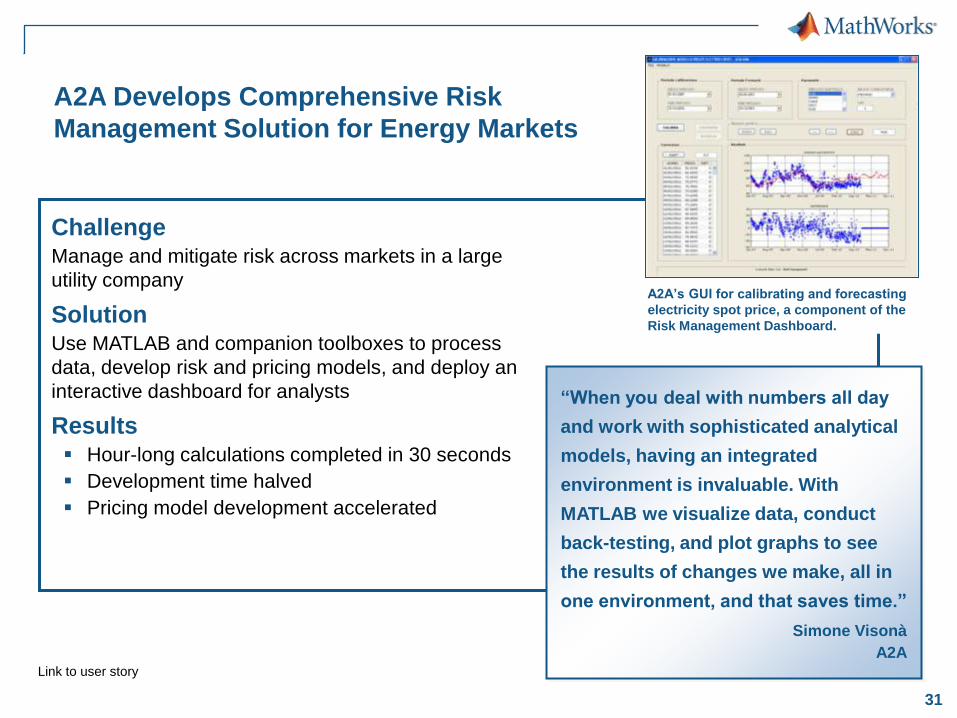
A2A Develops Comprehensive Risk
Management Solution for Energy Markets
ChallengeManage and mitigate risk across markets in a large
utility company
SolutionUse MATLAB and companion toolboxes to process
data, develop risk and pricing models, and deploy an
interactive dashboard for analysts
Results Hour-long calculations completed in 30 seconds
Development time halved
Pricing model development accelerated
“When you deal with numbers all day
and work with sophisticated analytical
models, having an integrated
environment is invaluable. With
MATLAB we visualize data, conduct
back-testing, and plot graphs to see
the results of changes we make, all in
one environment, and that saves time.”
Simone Visonà
A2ALink to user story
A2A’s GUI for calibrating and forecasting
electricity spot price, a component of the
Risk Management Dashboard.
32
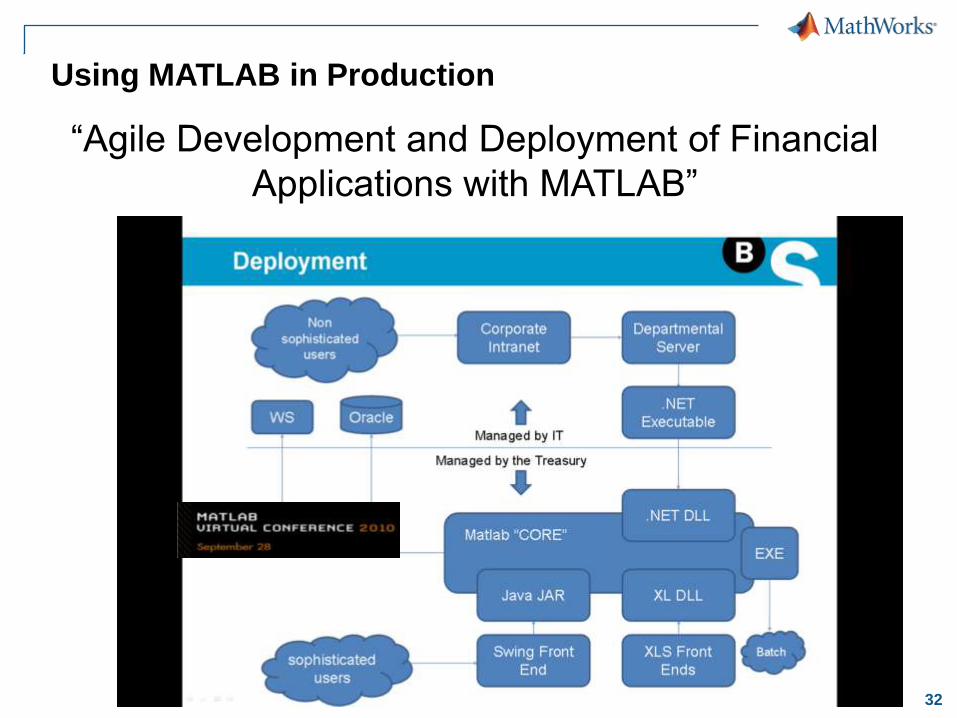
Using MATLAB in Production
―Agile Development and Deployment of Financial
Applications with MATLAB‖
33
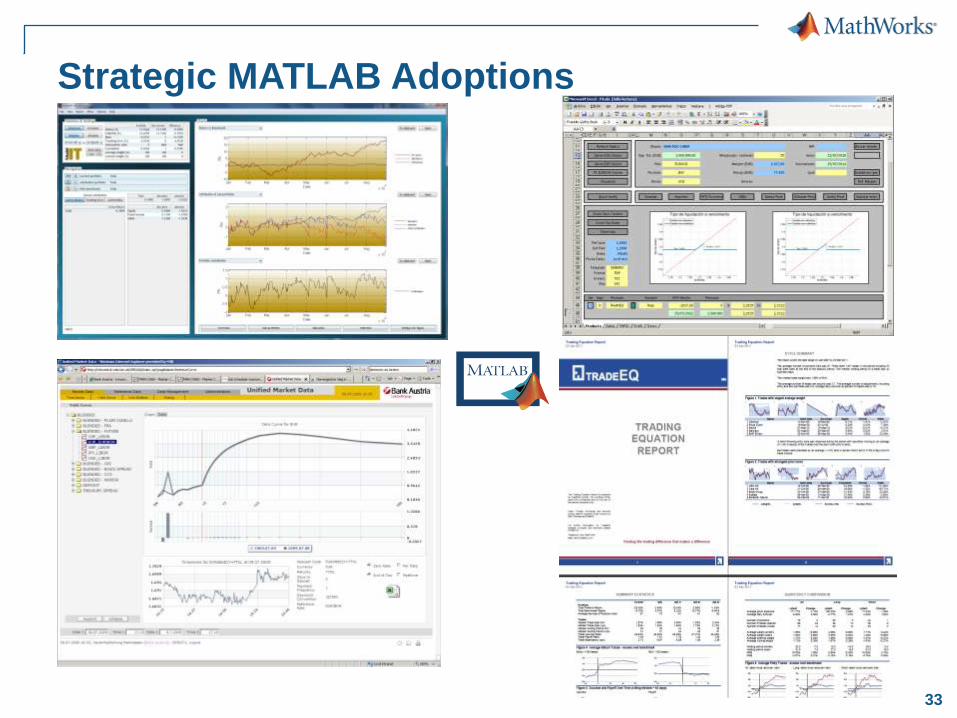
Strategic MATLAB Adoptions
34
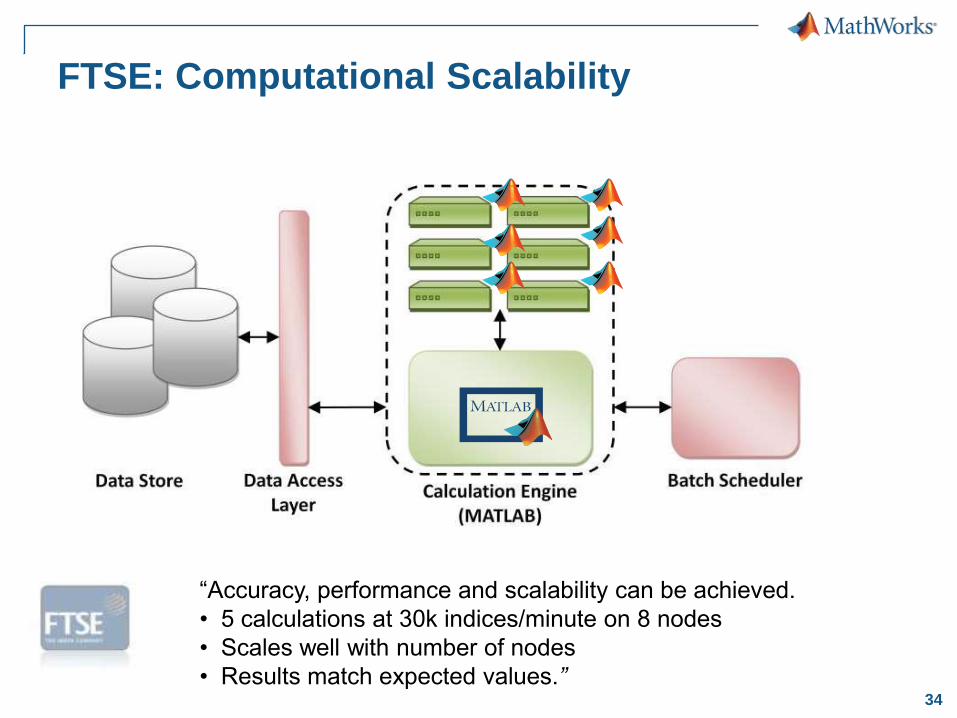
―Accuracy, performance and scalability can be achieved.
• 5 calculations at 30k indices/minute on 8 nodes
• Scales well with number of nodes
• Results match expected values.”
FTSE: Computational Scalability
35
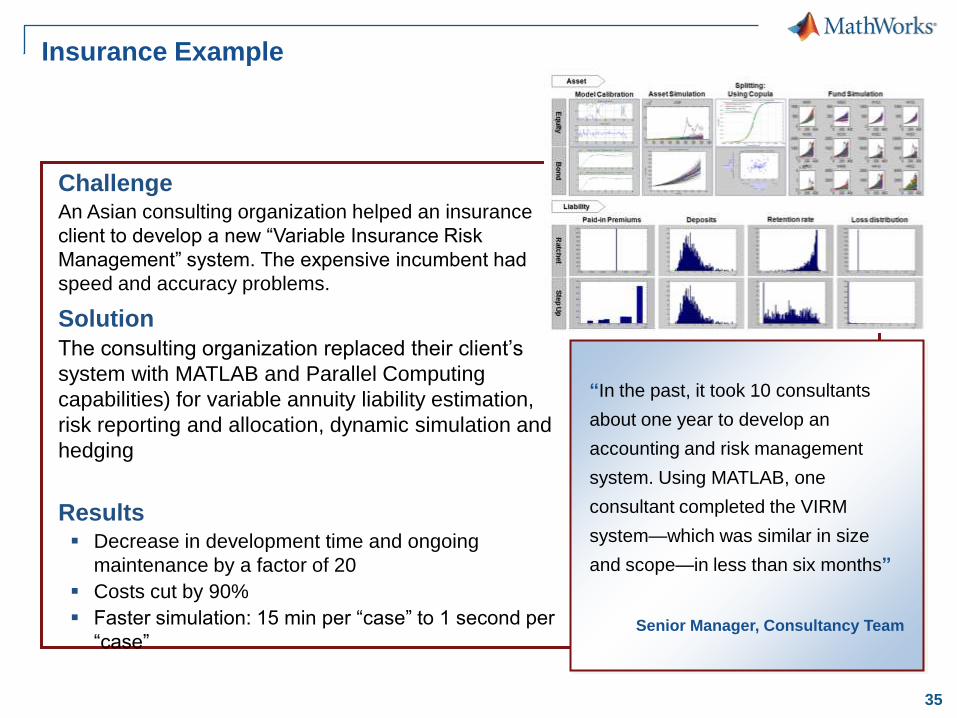
Insurance Example
ChallengeAn Asian consulting organization helped an insurance
client to develop a new ―Variable Insurance Risk
Management‖ system. The expensive incumbent had
speed and accuracy problems.
Solution
The consulting organization replaced their client’s
system with MATLAB and Parallel Computing
capabilities) for variable annuity liability estimation,
risk reporting and allocation, dynamic simulation and
hedging
Results Decrease in development time and ongoing
maintenance by a factor of 20
Costs cut by 90%
Faster simulation: 15 min per ―case‖ to 1 second per
―case‖
“In the past, it took 10 consultants
about one year to develop an
accounting and risk management
system. Using MATLAB, one
consultant completed the VIRM
system—which was similar in size
and scope—in less than six months”
Senior Manager, Consultancy Team
36
Agenda
Introduction
– MATLAB in the Financial Services Industry
– Computational Finance within MathWorks
Risk Modelling with MATLAB
– Examples
Portfolio Optimization & Risk Analysis
Cash flow Balancing & Scenario Analysis
RiskViewer:- Building a Risk Application
How Risk Departments across the world use MATLAB
Using MATLAB in ―Production‖ Trading (also insurance, index calculation)
Counterparty & Default Risk
37
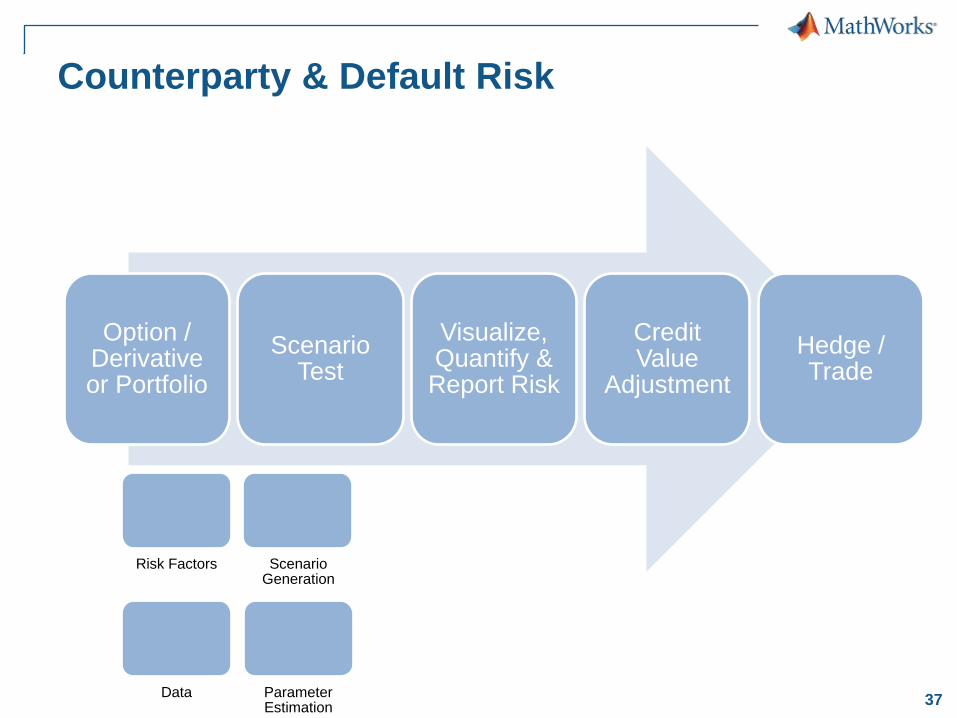
Option / Derivative or Portfolio
Scenario Test
Visualize, Quantify & Report Risk
Credit Value
Adjustment
Hedge / Trade
Counterparty & Default Risk
Risk Factors Scenario Generation
Data Parameter Estimation
38
Counterparty & Default Risk
We have already demonstrated some key capabilities:-
– VaR Calculation
– Forecasting & Stress Testing
– Rudimentary default estimation
– Object-based application building & integration
Some Disparate Examples
– Calculate PFE (Potential Future Exposure) of an FX Forward
– Credit Default Swap Modelling – Counterparty Analysis
– Hedging & Trading – A Black Karasinski Example
.
39
Counterparty & Default Risk
Calculate Potential Future Exposure (PFE) of an FX
Forward
– Determine current value of the derivative contract
Use the latest 6 month exchange rates
– Key Risk Driver is interest rate
Spot rate uses GBM, with a Term Structure of Volatility Model
Parallel shifts driven by changes in spot exchange
– Calculate PFE
Simulate for x time steps values for spot exchange rate
Volatility and drift of parameters estimated using a history of spot
exchange rates
Calculate MTM
Take 95th percentile of y simulations to yield the 95% contract-level PFE
40
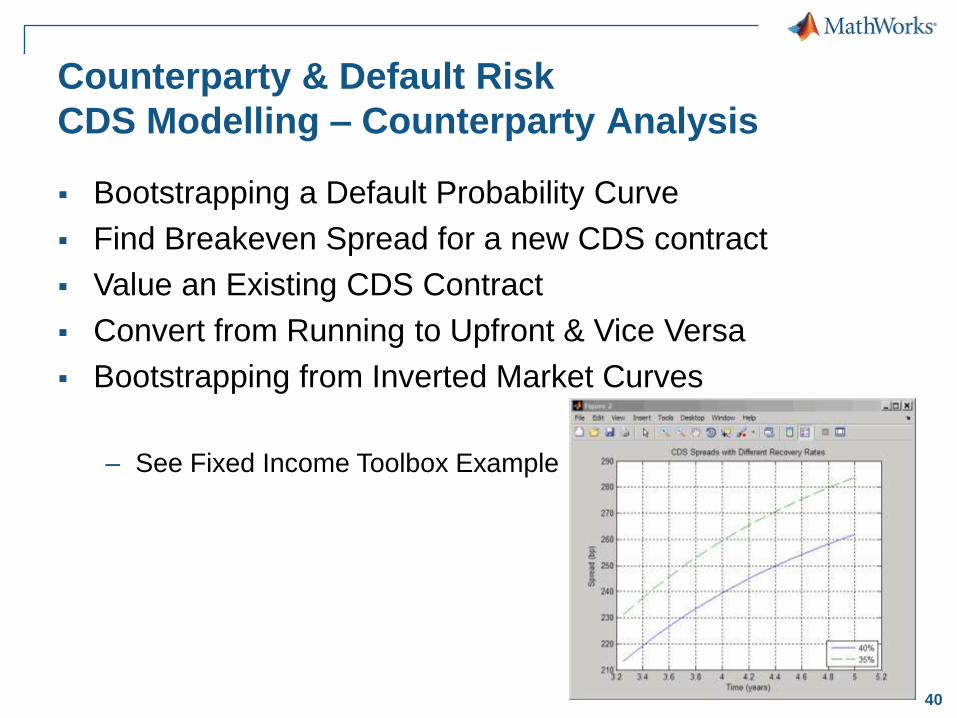
Counterparty & Default Risk
CDS Modelling – Counterparty Analysis
Bootstrapping a Default Probability Curve
Find Breakeven Spread for a new CDS contract
Value an Existing CDS Contract
Convert from Running to Upfront & Vice Versa
Bootstrapping from Inverted Market Curves
– See Fixed Income Toolbox Example
41
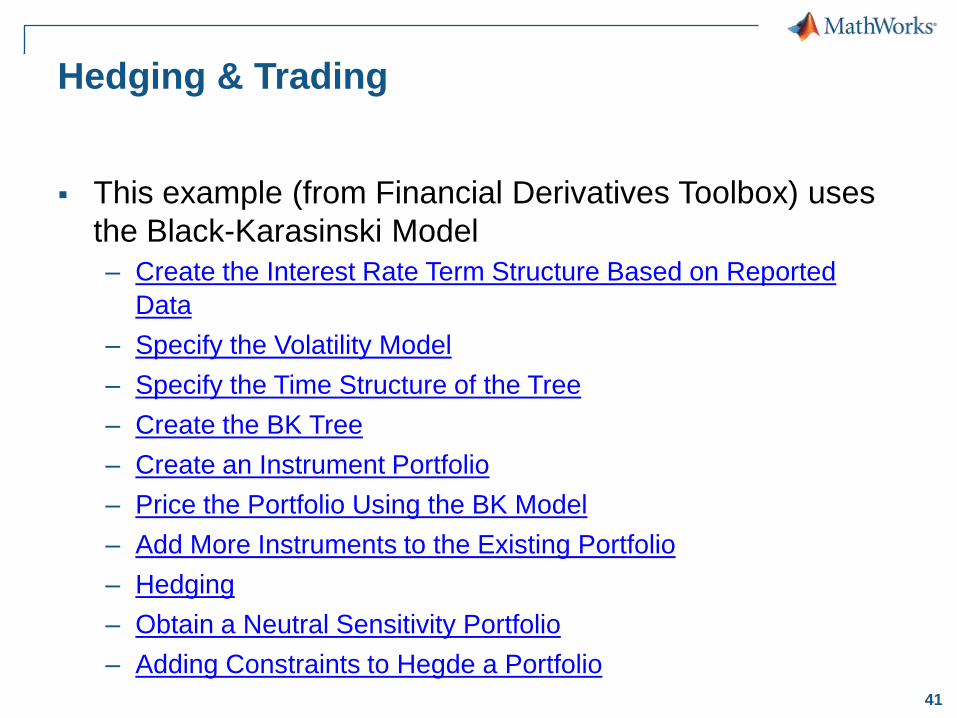
Hedging & Trading
This example (from Financial Derivatives Toolbox) uses
the Black-Karasinski Model
– Create the Interest Rate Term Structure Based on Reported
Data
– Specify the Volatility Model
– Specify the Time Structure of the Tree
– Create the BK Tree
– Create an Instrument Portfolio
– Price the Portfolio Using the BK Model
– Add More Instruments to the Existing Portfolio
– Hedging
– Obtain a Neutral Sensitivity Portfolio
– Adding Constraints to Hegde a Portfolio
42
43


![Enhancing the Dynamic Meta Modeling Formalism and its ... · namic Meta Modeling (DMM) [4], can be used. Dynamic Meta Modeling is a technique used to formally describe the dynamic](https://img.pdfslide.us/doc/110x75/5f6bb147a8ce9004a869923c/enhancing-the-dynamic-meta-modeling-formalism-and-its-namic-meta-modeling-dmm.jpg)