Embed Size (px)
Citation preview
Enhancing water quality in agricultural
drains
in Middle Delta region
Prepared by
Eng. Emad Mahmoud
Under supervision
Prof. Dr. Ahmed Wagdy Dr. Yasmin Nassar
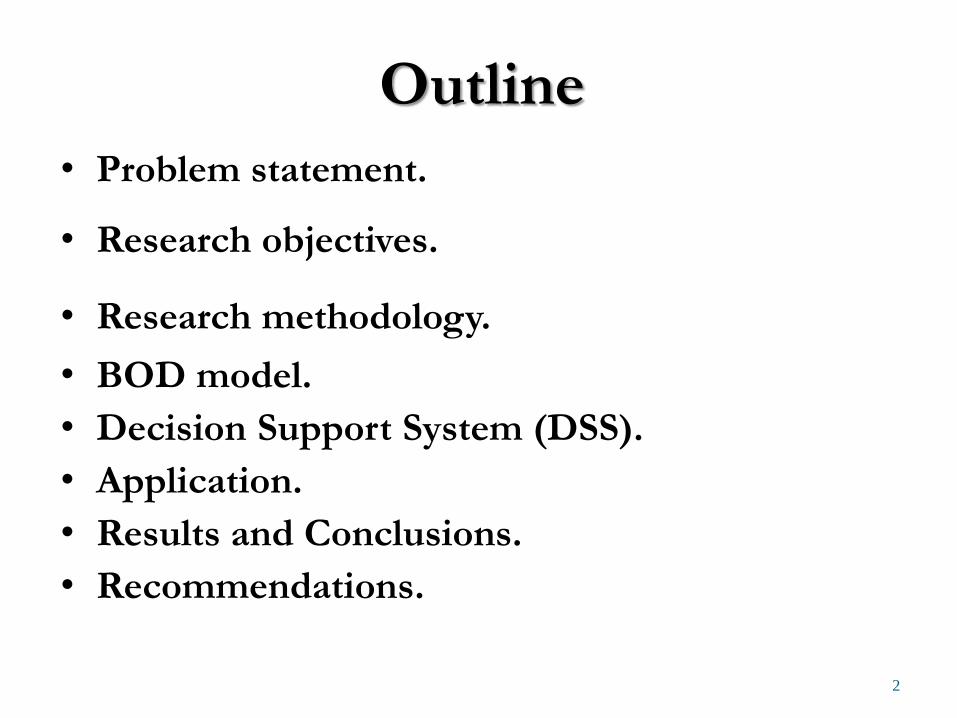
• Problem statement.
• Research objectives.
• Research methodology.
• BOD model.
• Decision Support System (DSS).
• Application.
• Results and Conclusions.
• Recommendations.
2
Outline
Problem statement
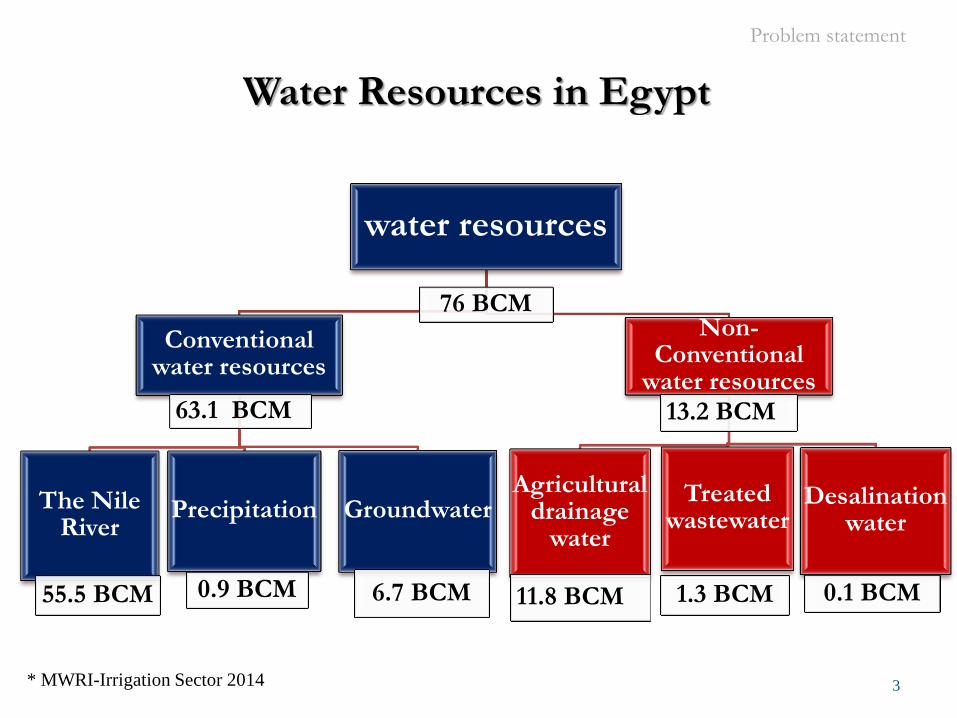
Water Resources in Egypt
3
water resources
76 BCM
Conventional water resources
63.1 BCM
The Nile River
55.5 BCM
Precipitation
0.9 BCM
Groundwater
6.7 BCM
Non-Conventional
water resources 13.2 BCM
Agricultural drainage
water
11.8 BCM
Treated wastewater
1.3 BCM
Desalination water
0.1 BCM
* MWRI-Irrigation Sector 2014
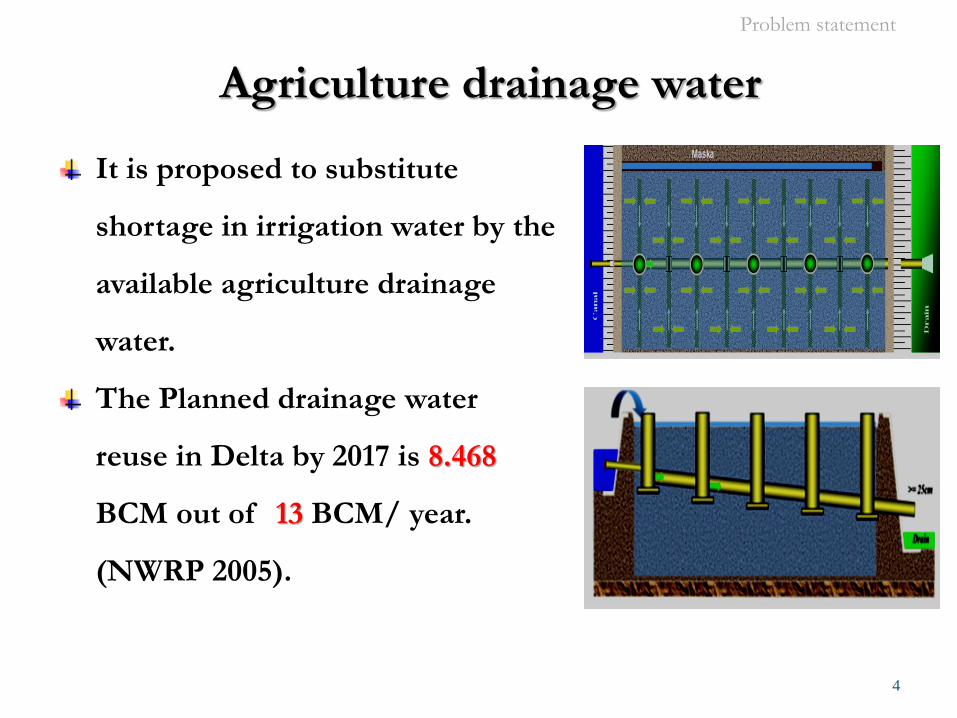
Agriculture drainage water
It is proposed to substitute
shortage in irrigation water by the
available agriculture drainage
water.
The Planned drainage water
reuse in Delta by 2017 is 8.468
BCM out of 13 BCM/ year.
(NWRP 2005).
4
Problem statement
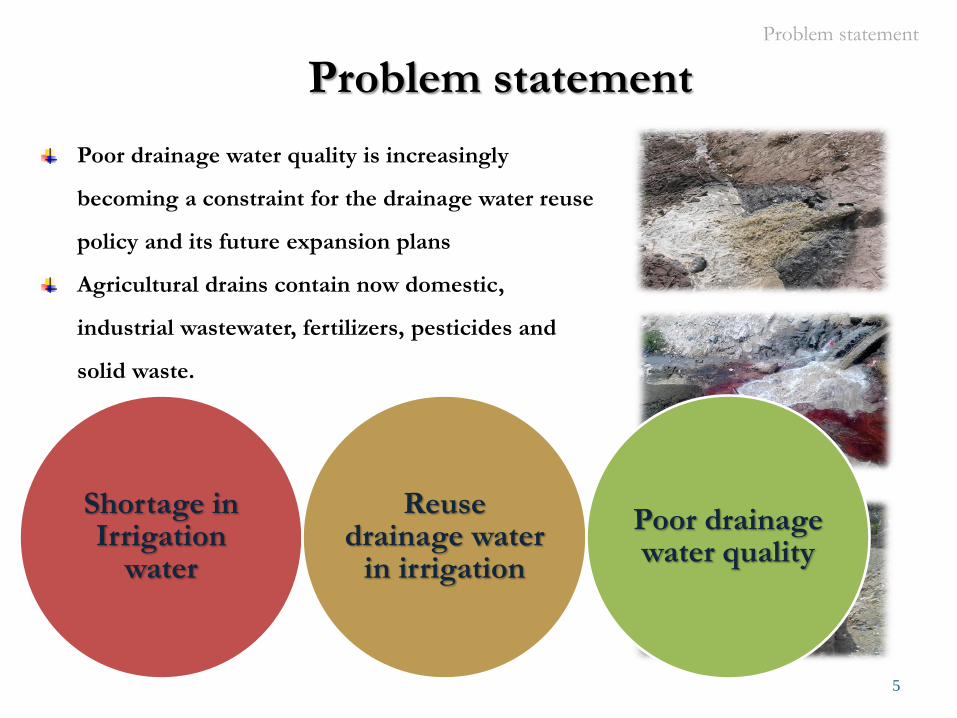
Poor drainage water quality is increasingly
becoming a constraint for the drainage water reuse
policy and its future expansion plans
Agricultural drains contain now domestic,
industrial wastewater, fertilizers, pesticides and
solid waste.
5
Shortage in Irrigation
water
Reuse drainage water
in irrigation
Poor drainage water quality
Problem statement Problem statement
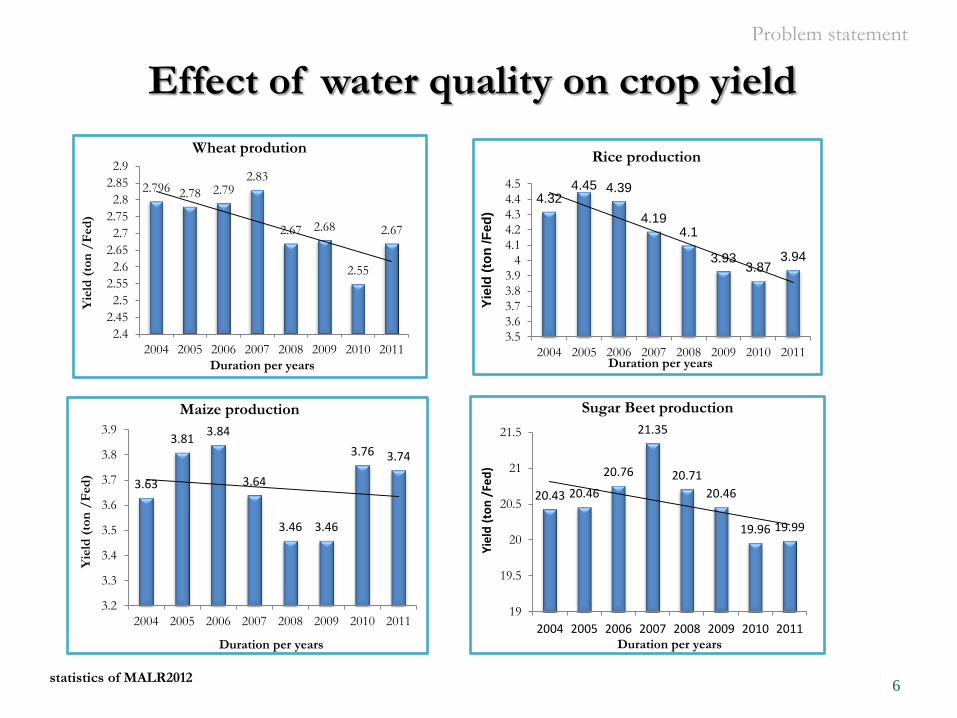
Effect of water quality on crop yield
6
2.796 2.78 2.79 2.83
2.67 2.68
2.55
2.67
2.4
2.45
2.5
2.55
2.6
2.65
2.7
2.75
2.8
2.85
2.9
2004 2005 2006 2007 2008 2009 2010 2011
Yie
ld (
ton
/F
ed
)
Duration per years
Wheat prodution
4.32 4.45 4.39
4.19 4.1
3.93 3.87
3.94
3.5
3.6
3.7
3.8
3.9
4
4.1
4.2
4.3
4.4
4.5
2004 2005 2006 2007 2008 2009 2010 2011
Yie
ld (
ton
/F
ed
)
Duration per years
Rice production
statistics of MALR2012
3.63
3.81 3.84
3.64
3.46 3.46
3.76 3.74
3.2
3.3
3.4
3.5
3.6
3.7
3.8
3.9
2004 2005 2006 2007 2008 2009 2010 2011
Yie
ld (
ton
/F
ed
)
Duration per years
Maize production
20.43 20.46
20.76
21.35
20.71
20.46
19.96 19.99
19
19.5
20
20.5
21
21.5
2004 2005 2006 2007 2008 2009 2010 2011
Yie
ld (
ton
/Fe
d)
Duration per years
Sugar Beet production
Problem statement
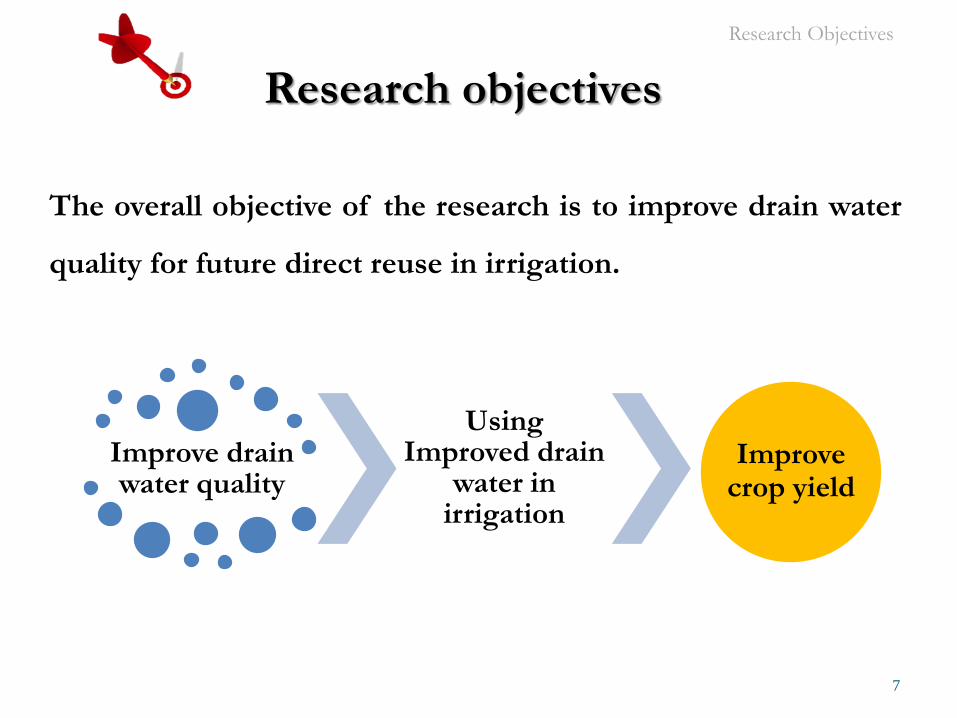
Research objectives
The overall objective of the research is to improve drain water
quality for future direct reuse in irrigation.
7
Improve drain water quality
Using Improved drain
water in irrigation
Improve crop yield
Research Objectives
Develop BOD model
Input Data Output Data
8
• (BOD) Conc.
•drain discharge
•drains cross
section
•water velocity
•Villages
population
•BOD
concentration
along the
drain
Develop DSS
Input Data Output
Data
•available space
•Drain discharge
•Water table
•capital cost
•O&M cost
•the removal
efficiency
•Selection of
the suitable
method to
reduce BOD
values
Research methodology
Application
Original DSS
Modified DSS
• Different
Temp.
•Different
cross –section
• Different
discharge
Research Methodology
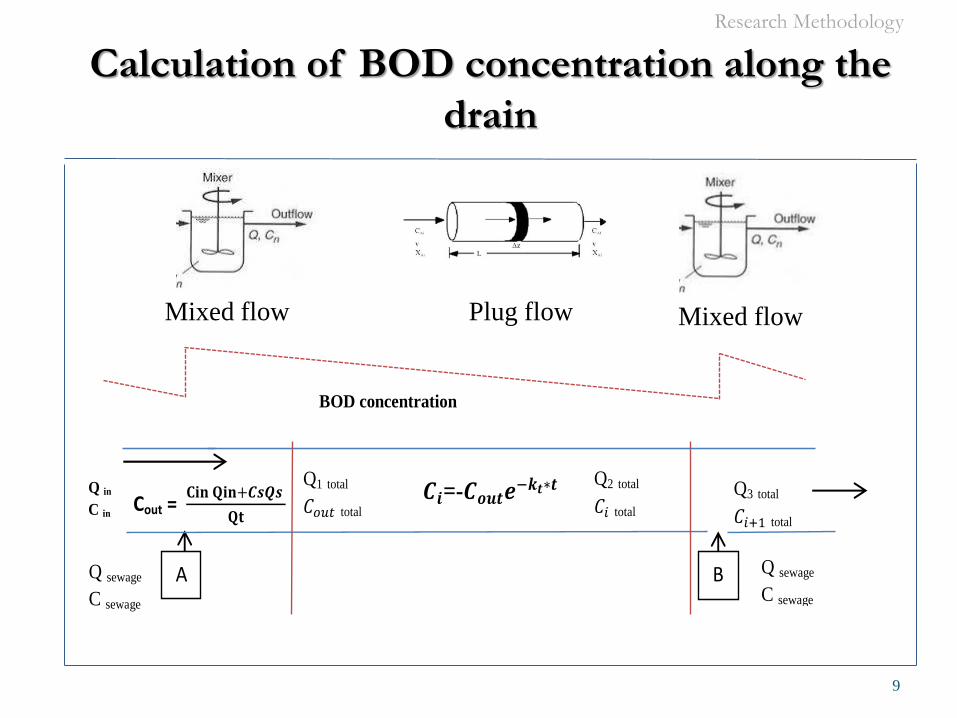
9
Mixed flow Plug flow Mixed flow
Calculation of BOD concentration along the
drain
Cout = 𝐂𝐢𝐧 𝐐𝐢𝐧+𝑪𝒔𝑸𝒔
𝐐𝐭
BOD concentration
A Q sewage
C sewage
Q in
C in
Q1 total
total
Q sewage
C sewage
Q2 total
total =-
Q3 total
total
B
Research Methodology
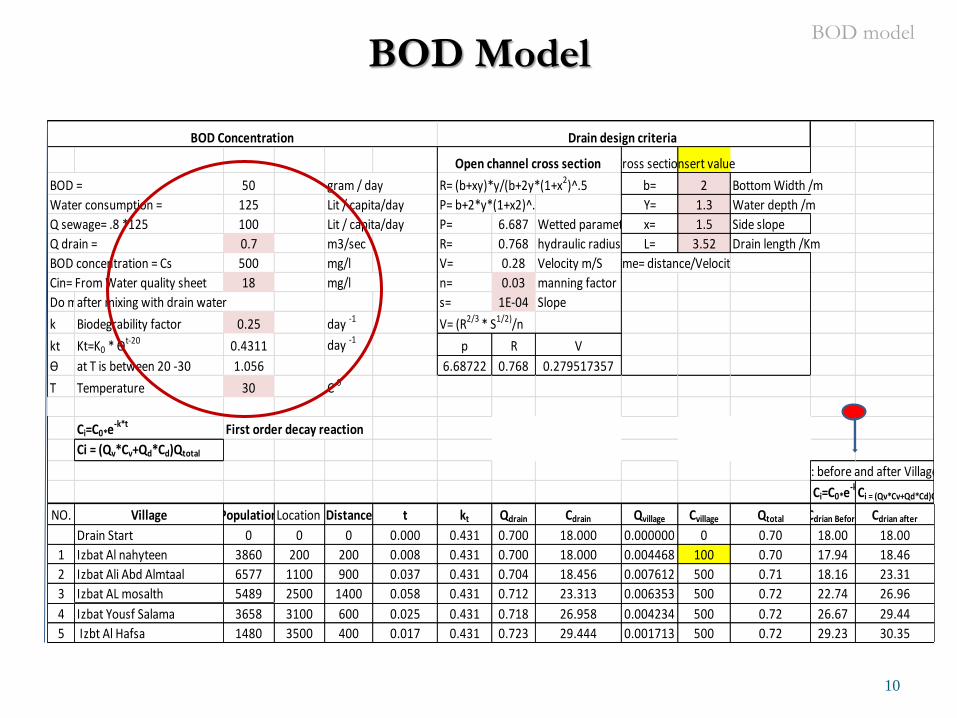
10
BOD Model BOD model
Cross sectionInsert value
50 gram / day b= 2 Bottom Width /m
125 Lit / capita/day Y= 1.3 Water depth /m
100 Lit / capita/day P= 6.687 Wetted parameter x= 1.5 Side slope
0.7 m3/sec R= 0.768 hydraulic radius L= 3.52 Drain length /Km
500 mg/l V= 0.28 Velocity m/S
18 n= 0.03 manning factor
Do mafter mixing with drain water s= 1E-04 Slope
k Biodegrability factor 0.25 day -1
kt Kt=K0 * ϴt-20 0.4311 day -1 p R V
ϴ at T is between 20 -30 1.056 6.68722 0.768 0.279517357
T Temperature 30 C 0
Ci=C0*e-k*t First order decay reaction
Ci = (Qv*Cv+Qd*Cd)Qtotal
Ci=C0*e-k*tCi = (Qv*Cv+Qd*Cd)Qtotal
NO. Village PopulationLocation Distance t kt Qdrain Cdrain Qvillage Cvillage Qtotal Cdrian Before Cdrian after
Drain Start 0 0 0 0.000 0.431 0.700 18.000 0.000000 0 0.70 18.00 18.00
1 Izbat Al nahyteen 3860 200 200 0.008 0.431 0.700 18.000 0.004468 100 0.70 17.94 18.46
2 Izbat Ali Abd Almtaal 6577 1100 900 0.037 0.431 0.704 18.456 0.007612 500 0.71 18.16 23.31
3 Izbat AL mosalth 5489 2500 1400 0.058 0.431 0.712 23.313 0.006353 500 0.72 22.74 26.96
4 Izbat Yousf Salama 3658 3100 600 0.025 0.431 0.718 26.958 0.004234 500 0.72 26.67 29.44
5 Izbt Al Hafsa 1480 3500 400 0.017 0.431 0.723 29.444 0.001713 500 0.72 29.23 30.35
BOD Concentration Drain design criteria
Open channel cross section
BOD = R= (b+xy)*y/(b+2y*(1+x2)^.5
Water consumption = P= b+2*y*(1+x2)^.5
Q sewage= .8 *125
Q drain =
BOD concentration = Cs
C : before and after Villages
Cin= From Water quality sheet mg/l
V= (R2/3 * S1/2)/n
time= distance/Velocity
11
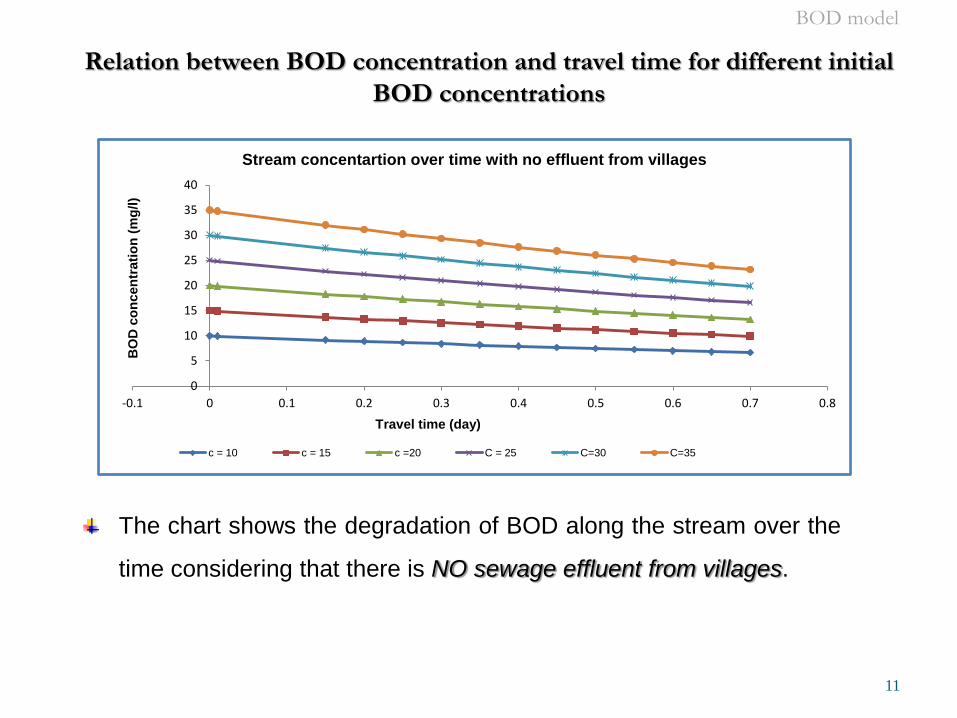
Relation between BOD concentration and travel time for different initial
BOD concentrations
The chart shows the degradation of BOD along the stream over the
time considering that there is NO sewage effluent from villages.
0
5
10
15
20
25
30
35
40
-0.1 0 0.1 0.2 0.3 0.4 0.5 0.6 0.7 0.8
BO
D c
on
cen
trati
on
(m
g/l)
Travel time (day)
Stream concentartion over time with no effluent from villages
c = 10 c = 15 c =20 C = 25 C=30 C=35
BOD model
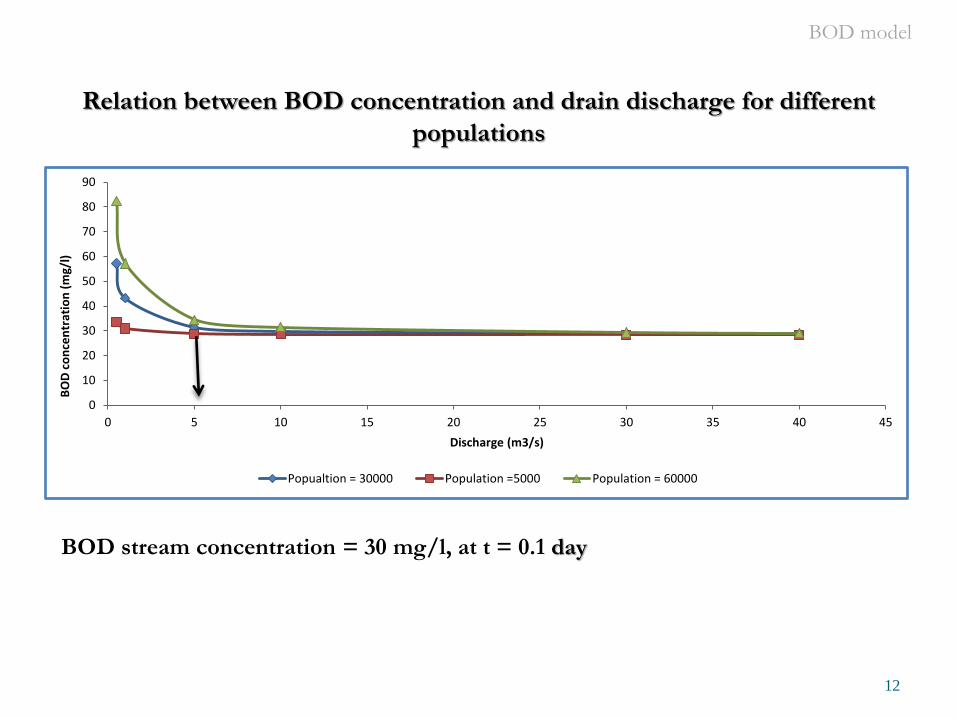
BOD stream concentration = 30 mg/l, at t = 0.1 day
12
0
10
20
30
40
50
60
70
80
90
0 5 10 15 20 25 30 35 40 45
BO
D c
on
cen
trat
ion
(m
g/l)
Discharge (m3/s)
Popualtion = 30000 Population =5000 Population = 60000
Relation between BOD concentration and drain discharge for different
populations
BOD model
Decision support system
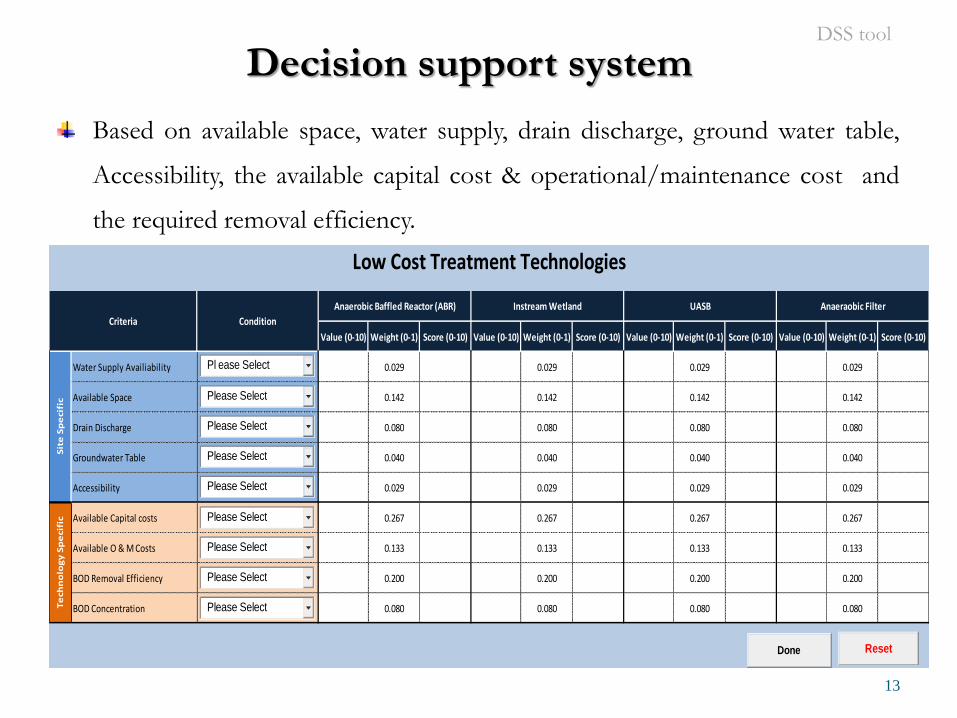
Based on available space, water supply, drain discharge, ground water table,
Accessibility, the available capital cost & operational/maintenance cost and
the required removal efficiency.
13
DSS tool
Value (0-10) Weight (0-1) Score (0-10) Value (0-10) Weight (0-1) Score (0-10) Value (0-10) Weight (0-1) Score (0-10) Value (0-10) Weight (0-1) Score (0-10)
Water Supply Availiability 0.029 0.029 0.029 0.029
Available Space 0.142 0.142 0.142 0.142
Drain Discharge 0.080 0.080 0.080 0.080
Groundwater Table 0.040 0.040 0.040 0.040
Accessibility 0.029 0.029 0.029 0.029
Available Capital costs 0.267 0.267 0.267 0.267
Available O & M Costs 0.133 0.133 0.133 0.133
BOD Removal Efficiency 0.200 0.200 0.200 0.200
BOD Concentration 0.080 0.080 0.080 0.080
Low Cost Treatment Technologies
Anaeraobic FilterUASB
Te
chn
olo
gy
Sp
eci
fic
Instream WetlandAnaerobic Baffled Reactor (ABR)
ConditionCriteria
Sit
e S
pe
cifi
c
Pl ease Select
Please Select
Please Select
Please Select
Please Select
Please Select
Please Select
Please Select
Please Select
ResetDone
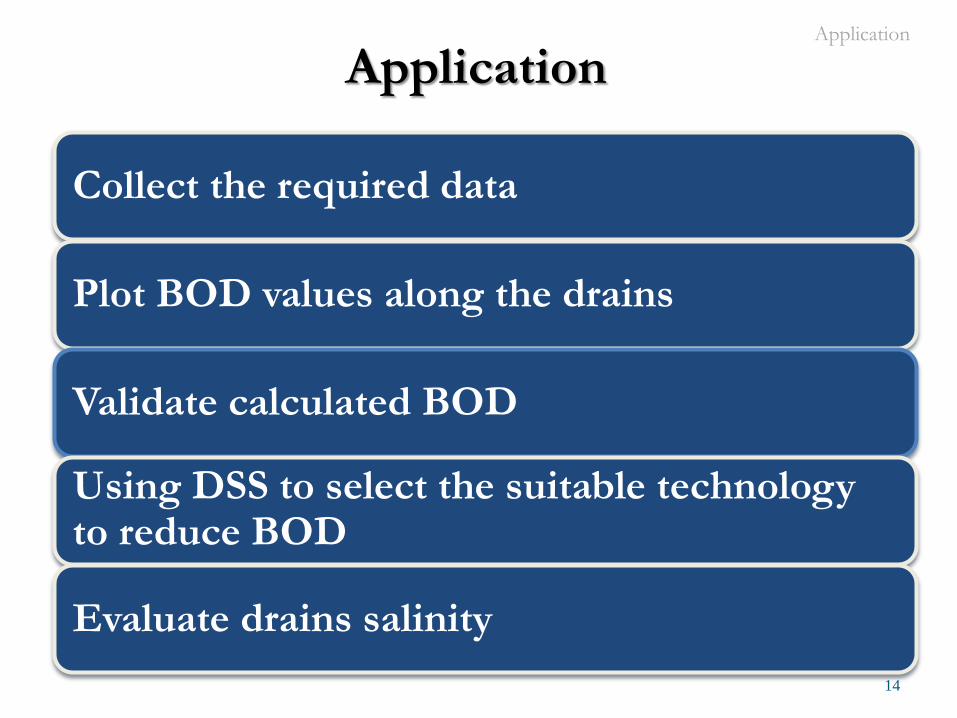
Collect the required data
Plot BOD values along the drains
Validate calculated BOD
Using DSS to select the suitable technology to reduce BOD
Evaluate drains salinity
14
Application Application
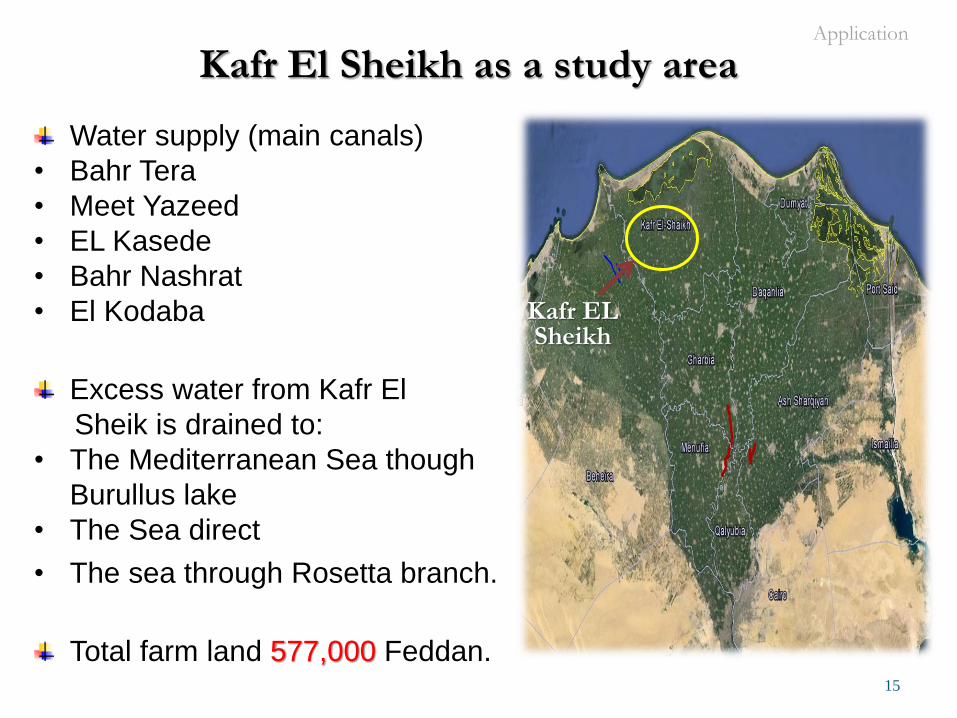
Water supply (main canals)
• Bahr Tera
• Meet Yazeed
• EL Kasede
• Bahr Nashrat
• El Kodaba
Excess water from Kafr El
Sheik is drained to:
• The Mediterranean Sea though
Burullus lake
• The Sea direct
• The sea through Rosetta branch.
Total farm land 577,000 Feddan. 15
Kafr EL Sheikh
Kafr El Sheikh as a study area Application
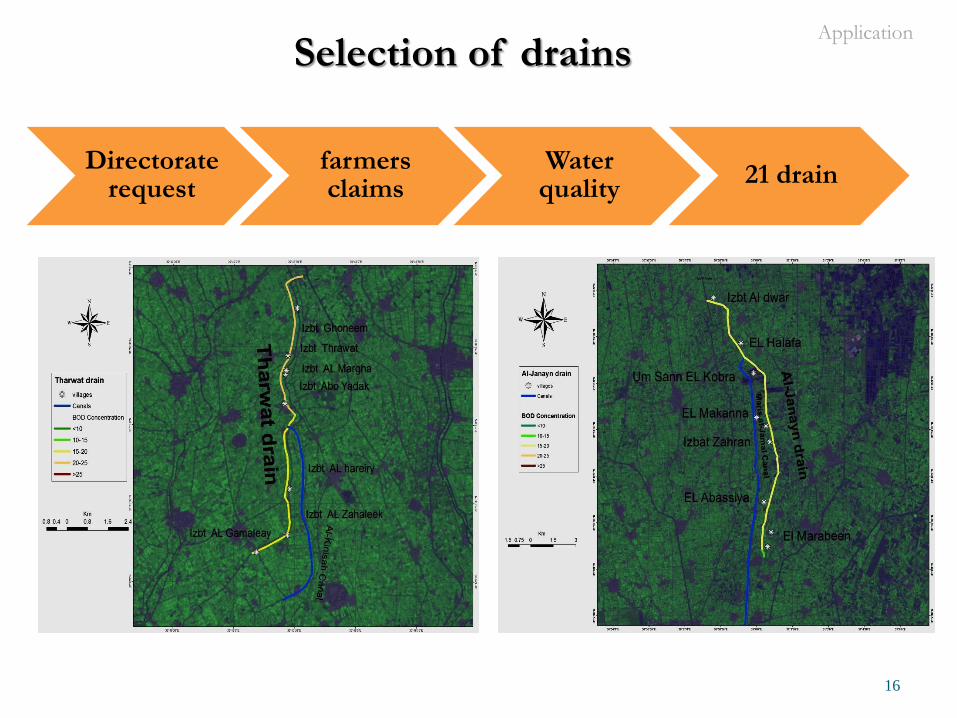
Selection of drains
16
Directorate request
farmers claims
Water quality
21 drain
Application
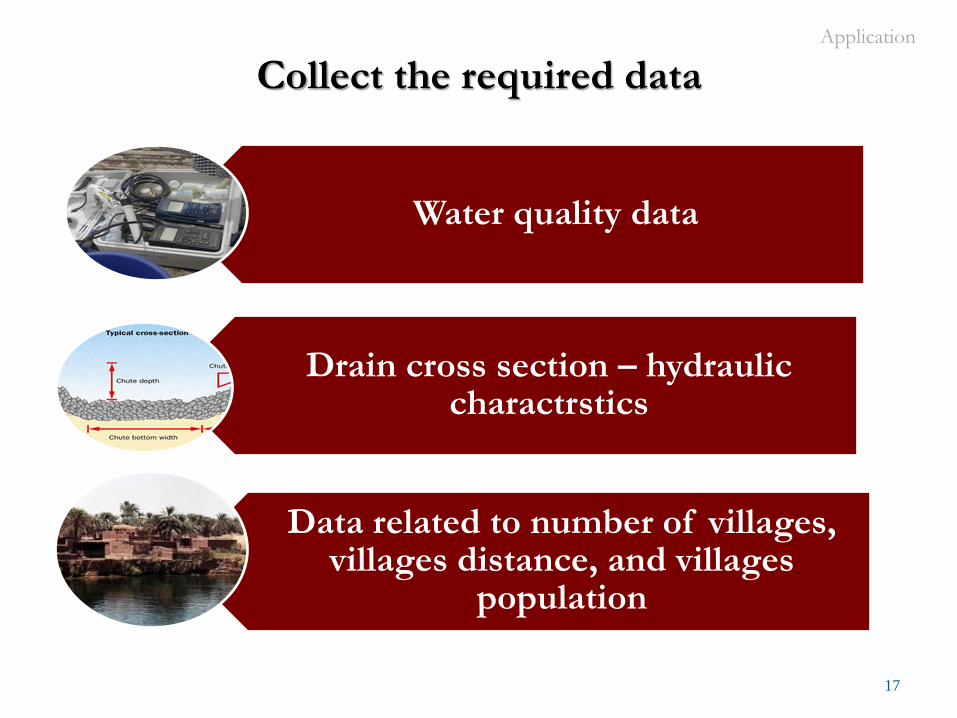
Collect the required data
17
Water quality data
Drain cross section – hydraulic charactrstics
Data related to number of villages, villages distance, and villages
population
Application
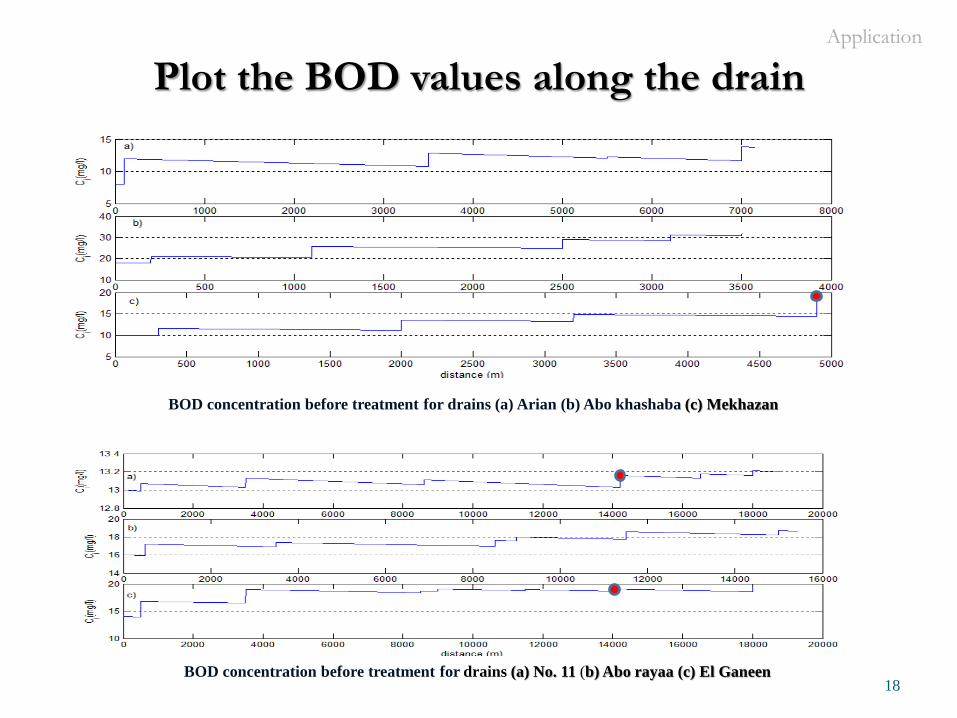
18
BOD concentration before treatment for drains (a) Arian (b) Abo khashaba (c) Mekhazan
Plot the BOD values along the drain
BOD concentration before treatment for drains (a) No. 11 (b) Abo rayaa (c) El Ganeen
Application
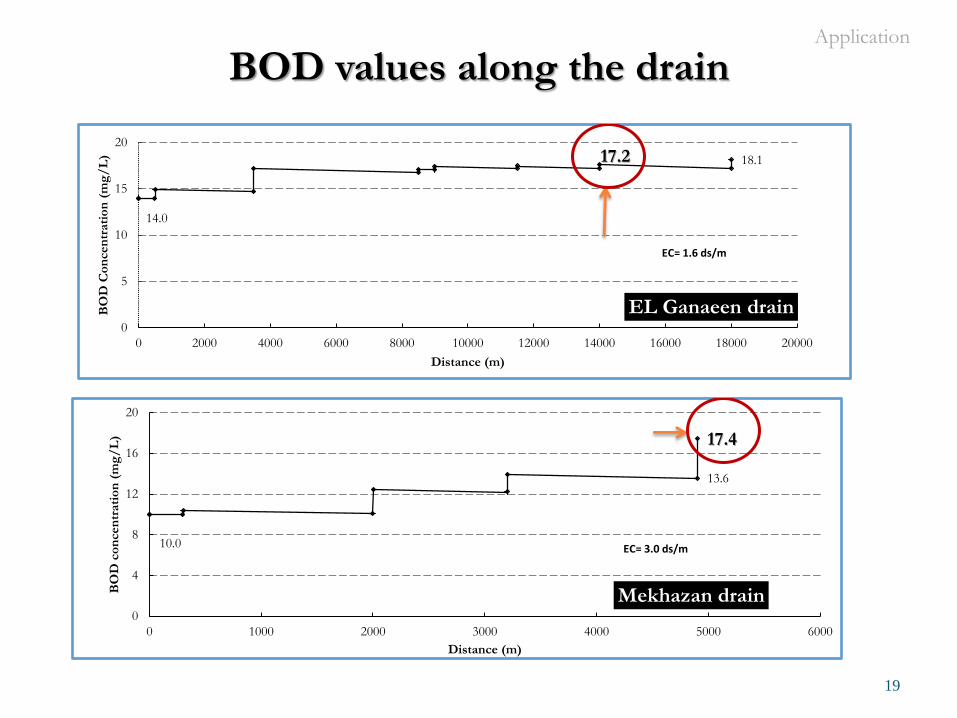
19
BOD values along the drain
14.0
17.2 18.1
0
5
10
15
20
0 2000 4000 6000 8000 10000 12000 14000 16000 18000 20000
BO
D C
on
cen
trati
on
(m
g/
L)
Distance (m)
EL Ganaeen drain
EC= 1.6 ds/m
10.0
13.6
17.4
0
4
8
12
16
20
0 1000 2000 3000 4000 5000 6000
BO
D c
on
cen
trati
on
(m
g/
L)
Distance (m)
Mekhazan drain
EC= 3.0 ds/m
Application
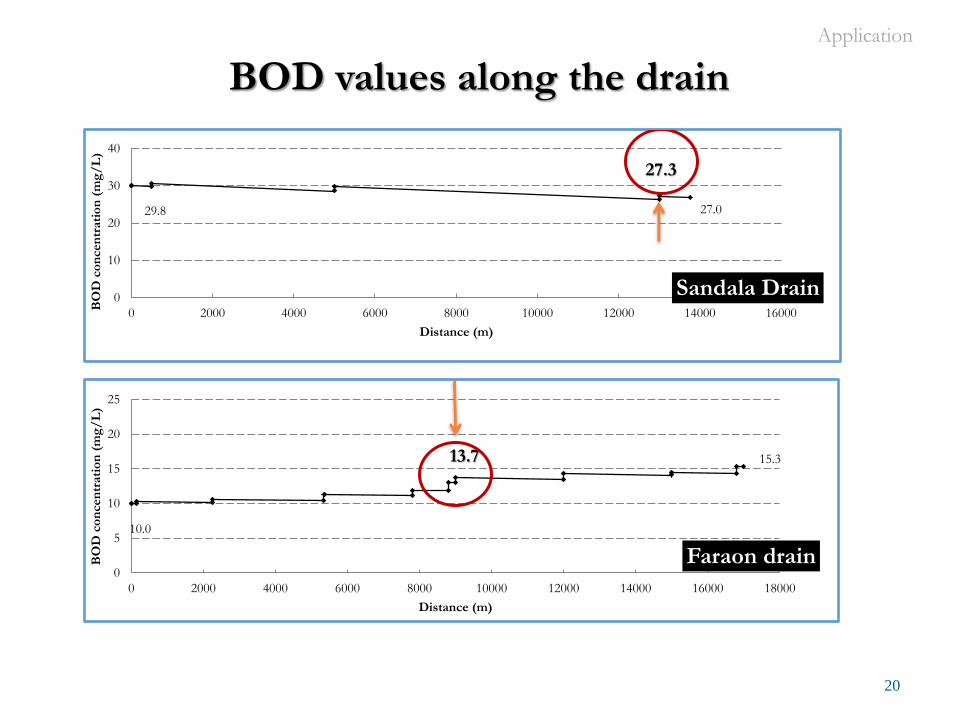
20
BOD values along the drain
29.8
27.3
27.0
0
10
20
30
40
0 2000 4000 6000 8000 10000 12000 14000 16000
BO
D c
on
cen
trati
on
(m
g/
L)
Distance (m)
Sandala Drain
10.0
13.7 15.3
0
5
10
15
20
25
0 2000 4000 6000 8000 10000 12000 14000 16000 18000
BO
D c
on
cen
trati
on
(m
g/
L)
Distance (m)
Faraon drain
Application
21
17.2 17.4
13.6 13.72
27.3
20 19 18 19
30
18
13
12 11
25
0
5
10
15
20
25
30
35
AL Ganeen Mekhazan NO. 11 Faraon Sandala
BO
D C
on
cen
trat
ion
(m
g/l)
Calculated BOD Maximum point Minum point
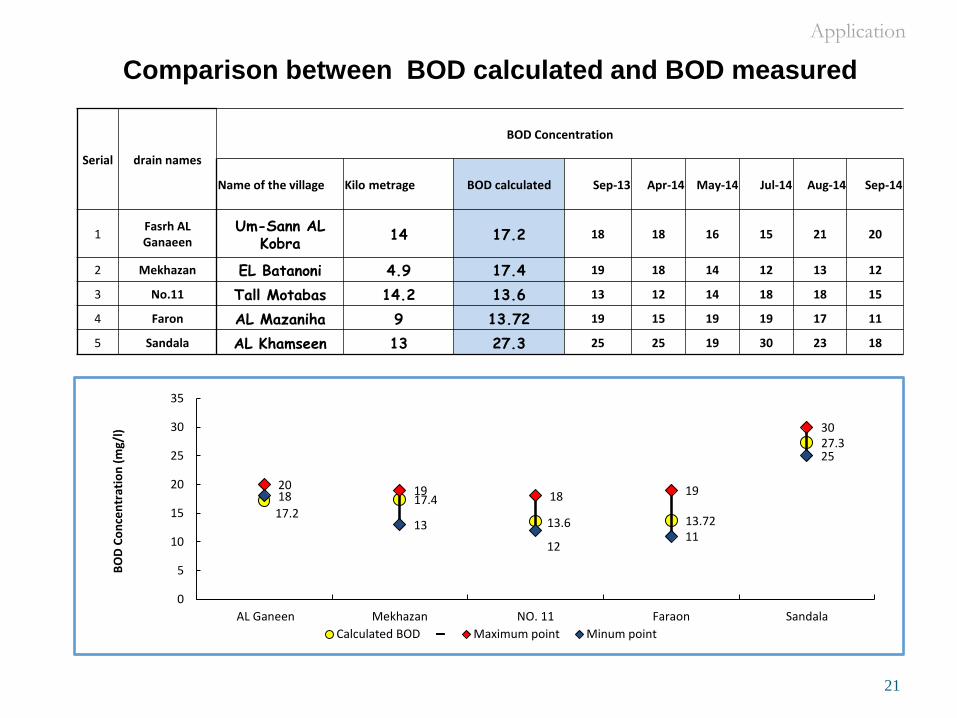
Comparison between BOD calculated and BOD measured
Serial drain names
BOD Concentration
Name of the village Kilo metrage BOD calculated Sep-13 Apr-14 May-14 Jul-14 Aug-14 Sep-14
1 Fasrh AL Ganaeen
Um-Sann AL Kobra
14 17.2 18 18 16 15 21 20
2 Mekhazan EL Batanoni 4.9 17.4 19 18 14 12 13 12
3 No.11 Tall Motabas 14.2 13.6 13 12 14 18 18 15
4 Faron AL Mazaniha 9 13.72 19 15 19 19 17 11
5 Sandala AL Khamseen 13 27.3 25 25 19 30 23 18
Application
22
Application
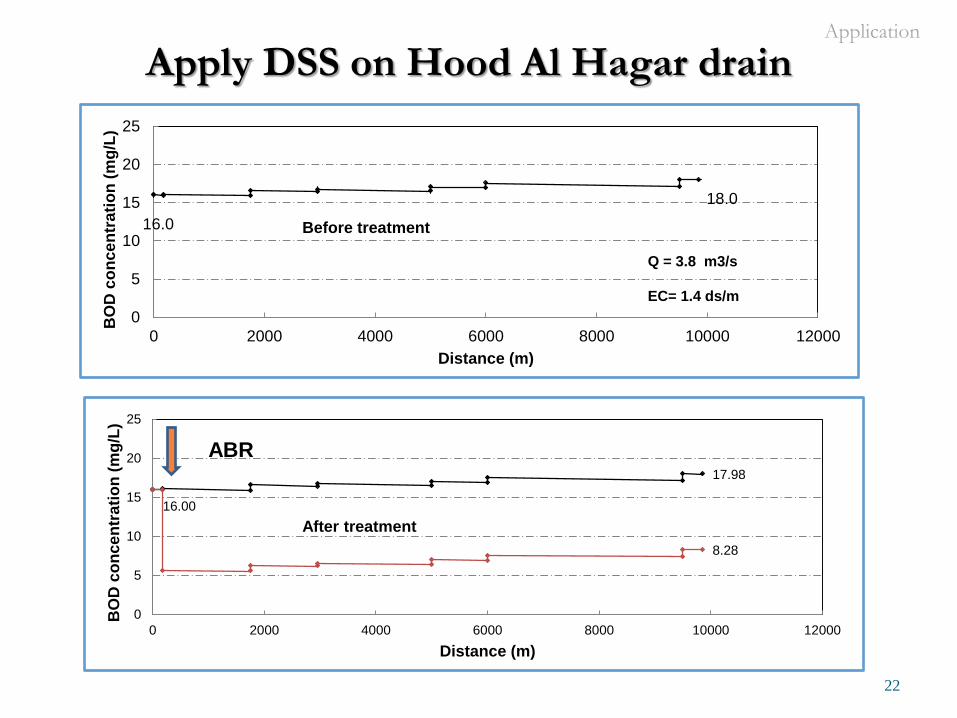
Apply DSS on Hood Al Hagar drain
16.0
18.0
0
5
10
15
20
25
0 2000 4000 6000 8000 10000 12000
BO
D c
on
ce
ntr
ati
on
(m
g/L
)
Distance (m)
EC= 1.4 ds/m
Before treatment
Q = 3.8 m3/s
17.98
16.00
8.28
0
5
10
15
20
25
0 2000 4000 6000 8000 10000 12000
BO
D c
on
ce
ntr
ati
on
(m
g/L
)
Distance (m)
After treatment
ABR
23
Application
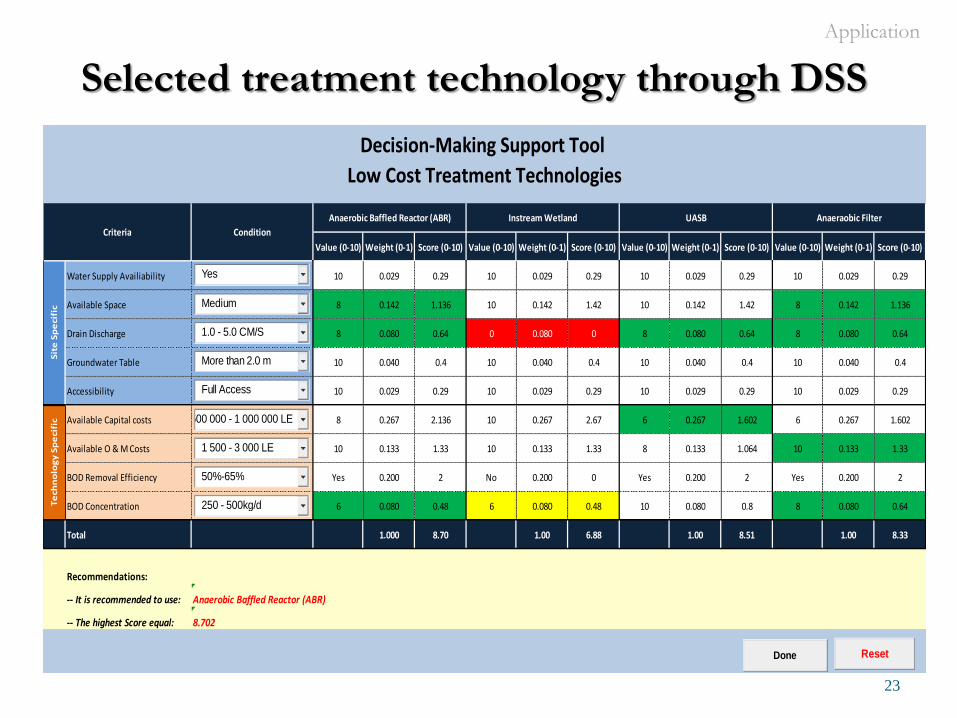
Value (0-10) Weight (0-1) Score (0-10) Value (0-10) Weight (0-1) Score (0-10) Value (0-10) Weight (0-1) Score (0-10) Value (0-10) Weight (0-1) Score (0-10)
Water Supply Availiability 10 0.029 0.29 10 0.029 0.29 10 0.029 0.29 10 0.029 0.29
Available Space 8 0.142 1.136 10 0.142 1.42 10 0.142 1.42 8 0.142 1.136
Drain Discharge 8 0.080 0.64 0 0.080 0 8 0.080 0.64 8 0.080 0.64
Groundwater Table 10 0.040 0.4 10 0.040 0.4 10 0.040 0.4 10 0.040 0.4
Accessibility 10 0.029 0.29 10 0.029 0.29 10 0.029 0.29 10 0.029 0.29
Available Capital costs 8 0.267 2.136 10 0.267 2.67 6 0.267 1.602 6 0.267 1.602
Available O & M Costs 10 0.133 1.33 10 0.133 1.33 8 0.133 1.064 10 0.133 1.33
BOD Removal Efficiency Yes 0.200 2 No 0.200 0 Yes 0.200 2 Yes 0.200 2
BOD Concentration 6 0.080 0.48 6 0.080 0.48 10 0.080 0.8 8 0.080 0.64
Total 1.000 8.70 1.00 6.88 1.00 8.51 1.00 8.33
Recommendations:
-- It is recommended to use: Anaerobic Baffled Reactor (ABR)
-- The highest Score equal: 8.702
Decision-Making Support Tool
Low Cost Treatment Technologies
Anaeraobic FilterUASB
Te
chn
olo
gy
Sp
eci
fic
Instream WetlandAnaerobic Baffled Reactor (ABR)
ConditionCriteria
Sit
e S
pe
cifi
c
Yes
Medium
1.0 - 5.0 CM/S
More than 2.0 m
Full Access
500 000 - 1 000 000 LE
1 500 - 3 000 LE
50%-65%
250 - 500kg/d
ResetDone
Selected treatment technology through DSS
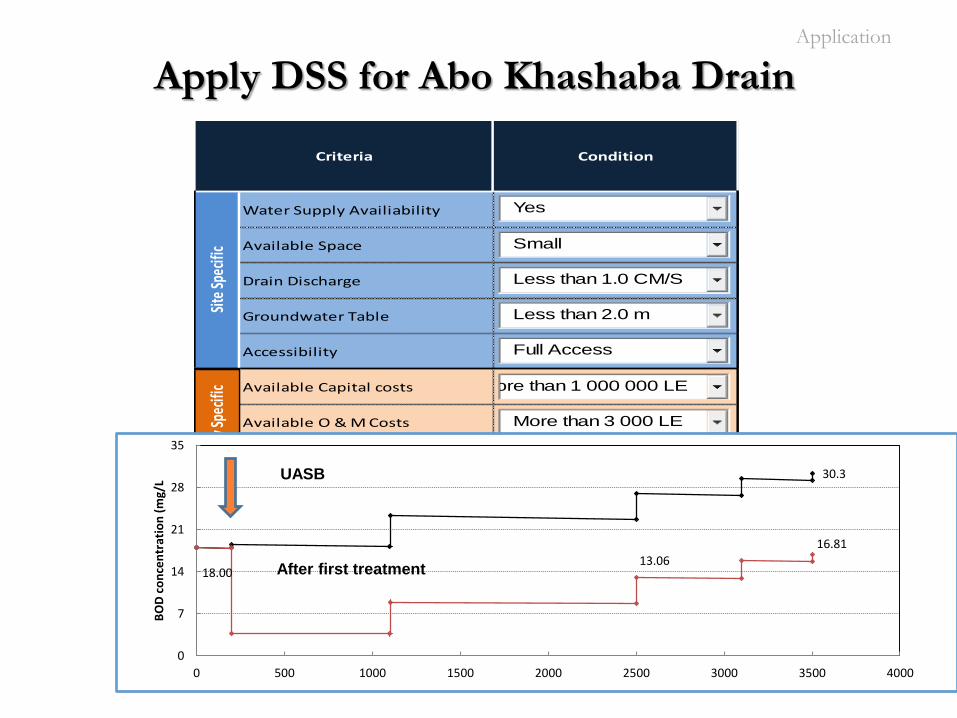
Apply DSS for Abo Khashaba Drain
24
Water Supply Availiability
Available Space
Drain Discharge
Groundwater Table
Accessibility
Available Capital costs
Available O & M Costs
BOD Removal Efficiency
BOD Concentration
Total
Recommendations:
-- It is recommended to use: UASB
-- The highest Score equal: 9.68
Tech
nolo
gy Sp
ecifi
c
ConditionCriteria
Site
Spec
ific
Yes
Small
Less than 1.0 CM/S
Less than 2.0 m
Full Access
More than 1 000 000 LE
More than 3 000 LE
More than 80%
250 - 500kg/d
ResetDone
Application
30.3
18.00 13.06
16.81
0
7
14
21
28
35
0 500 1000 1500 2000 2500 3000 3500 4000
BO
D c
on
cen
trat
ion
(m
g/L
After first treatment
UASB
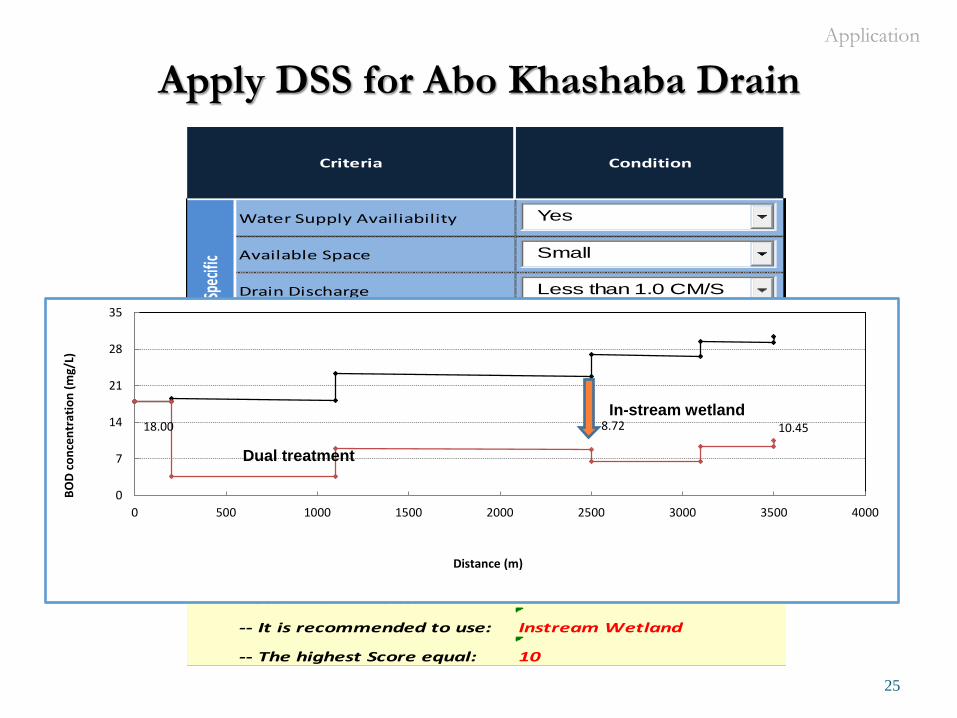
Apply DSS for Abo Khashaba Drain
25
Application
Water Supply Availiability
Available Space
Drain Discharge
Groundwater Table
Accessibility
Available Capital costs
Available O & M Costs
BOD Removal Efficiency
BOD Concentration
Total
Recommendations:
-- It is recommended to use: Instream Wetland
-- The highest Score equal: 10
Tech
nolo
gy Sp
ecifi
c
ConditionCriteria
Site S
pecif
icYes
Small
Less than 1.0 CM/S
Less than 2.0 m
Full Access
Less than 500 000 LE
Less than 1 500 LE
50%
0 - 250kg/d
18.00 8.72 10.45
0
7
14
21
28
35
0 500 1000 1500 2000 2500 3000 3500 4000
BO
D c
on
cen
trat
ion
(m
g/L)
Distance (m)
Dual treatment
In-stream wetland
26
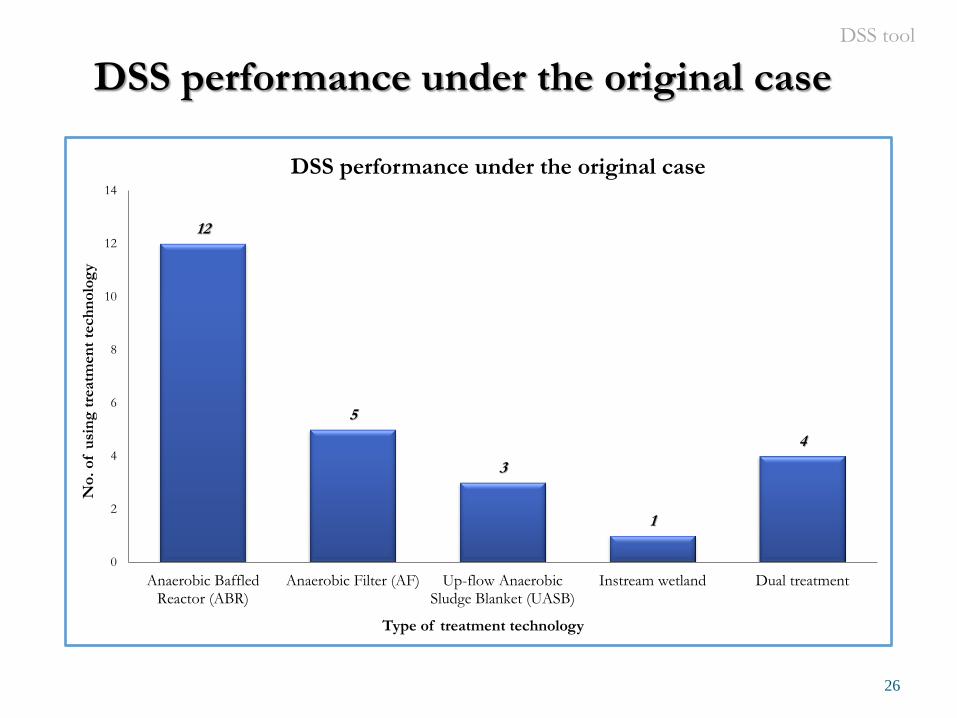
DSS performance under the original case
12
5
3
1
4
0
2
4
6
8
10
12
14
Anaerobic BaffledReactor (ABR)
Anaerobic Filter (AF) Up-flow AnaerobicSludge Blanket (UASB)
Instream wetland Dual treatment
No
. o
f u
sin
g t
reatm
en
t te
ch
no
log
y
Type of treatment technology
DSS performance under the original case
DSS tool
27
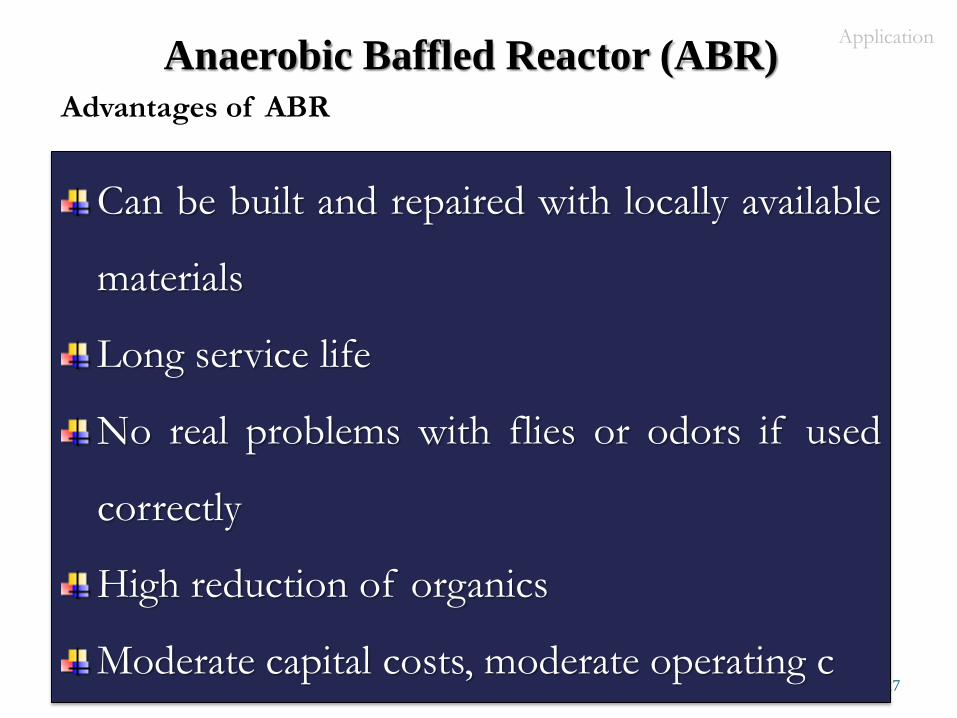
Anaerobic Baffled Reactor (ABR)
Can be built and repaired with locally available
materials
Long service life
No real problems with flies or odors if used
correctly
High reduction of organics
Moderate capital costs, moderate operating c
Advantages of ABR
Application
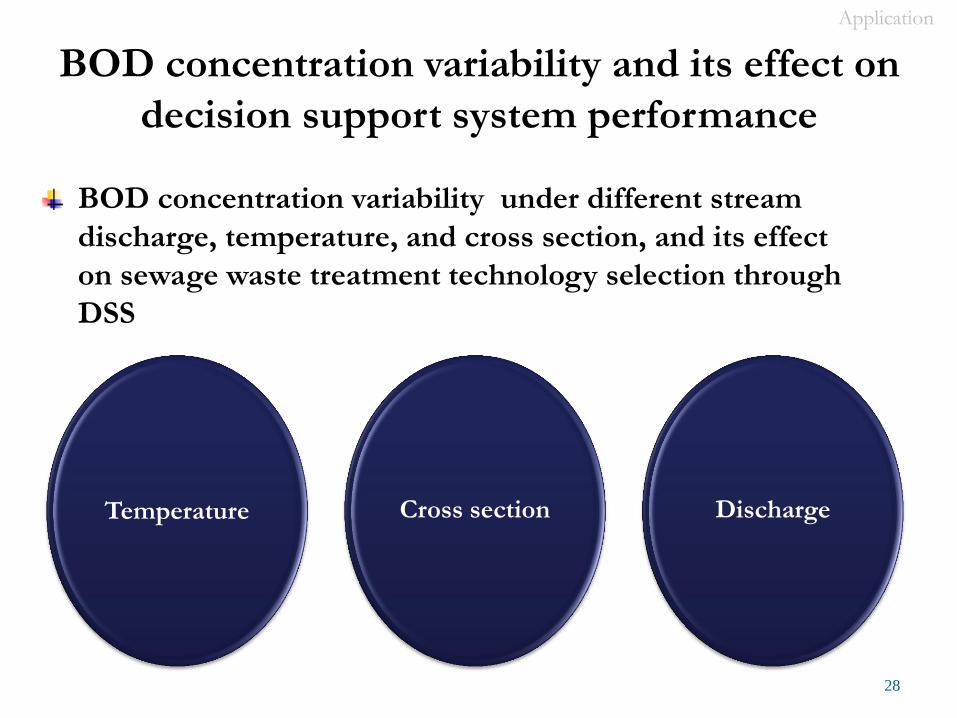
BOD concentration variability and its effect on
decision support system performance
28
BOD concentration variability under different stream
discharge, temperature, and cross section, and its effect
on sewage waste treatment technology selection through
DSS
Cross section Temperature Discharge
Application
29
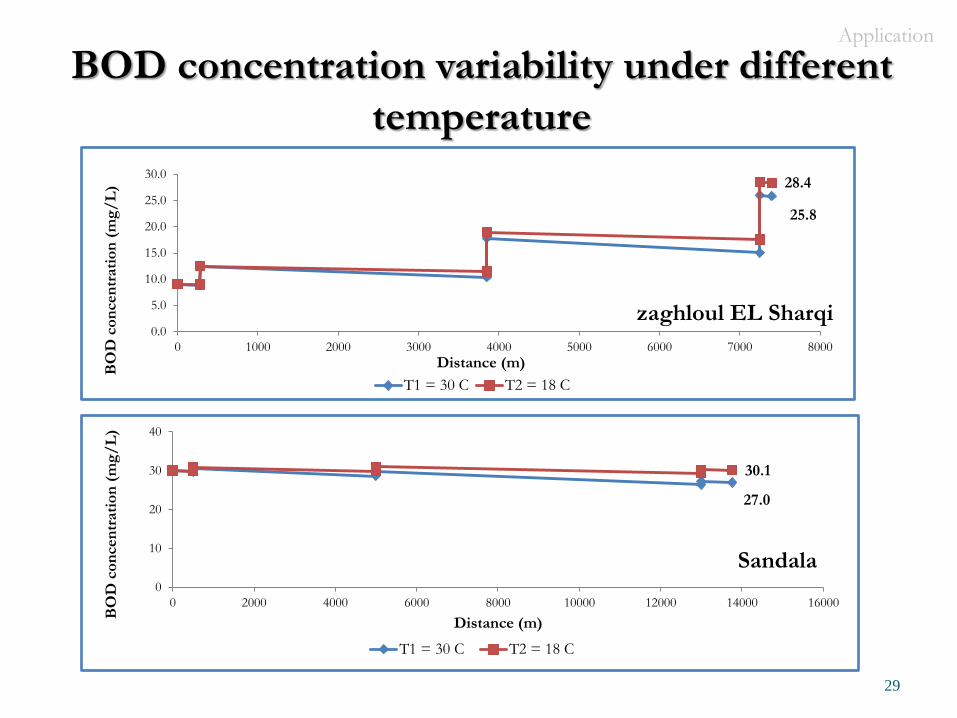
BOD concentration variability under different
temperature
25.8
28.4
0.0
5.0
10.0
15.0
20.0
25.0
30.0
0 1000 2000 3000 4000 5000 6000 7000 8000
BO
D c
on
cen
trati
on
(m
g/
L)
Distance (m)
zaghloul EL Sharqi
T1 = 30 C T2 = 18 C
27.0
30.1
0
10
20
30
40
0 2000 4000 6000 8000 10000 12000 14000 16000
BO
D c
on
cen
trati
on
(m
g/
L)
Distance (m)
Sandala
T1 = 30 C T2 = 18 C
Application
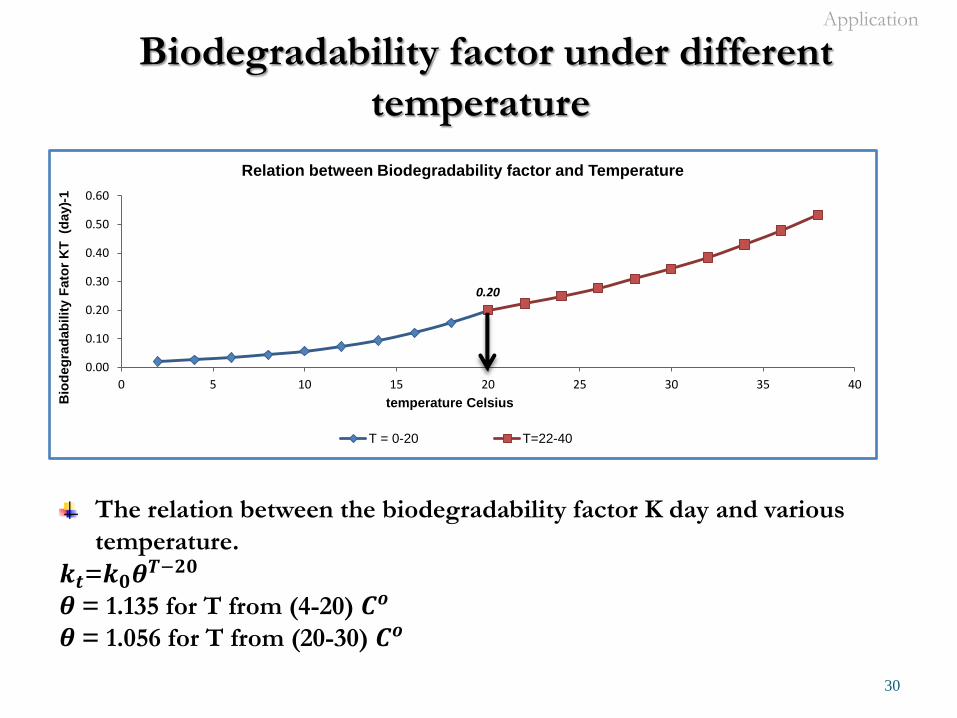
Biodegradability factor under different
temperature
30
The relation between the biodegradability factor K day and various
temperature.
𝒌𝒕=𝒌𝟎𝜽𝑻 𝟐𝟎
𝜽 = 1.135 for T from (4-20) 𝑪𝒐
𝜽 = 1.056 for T from (20-30) 𝑪𝒐
0.20
0.00
0.10
0.20
0.30
0.40
0.50
0.60
0 5 10 15 20 25 30 35 40
Bio
deg
rad
ab
ilit
y F
ato
r K
T (d
ay)-
1
temperature Celsius
Relation between Biodegradability factor and Temperature
T = 0-20 T=22-40
Application
31
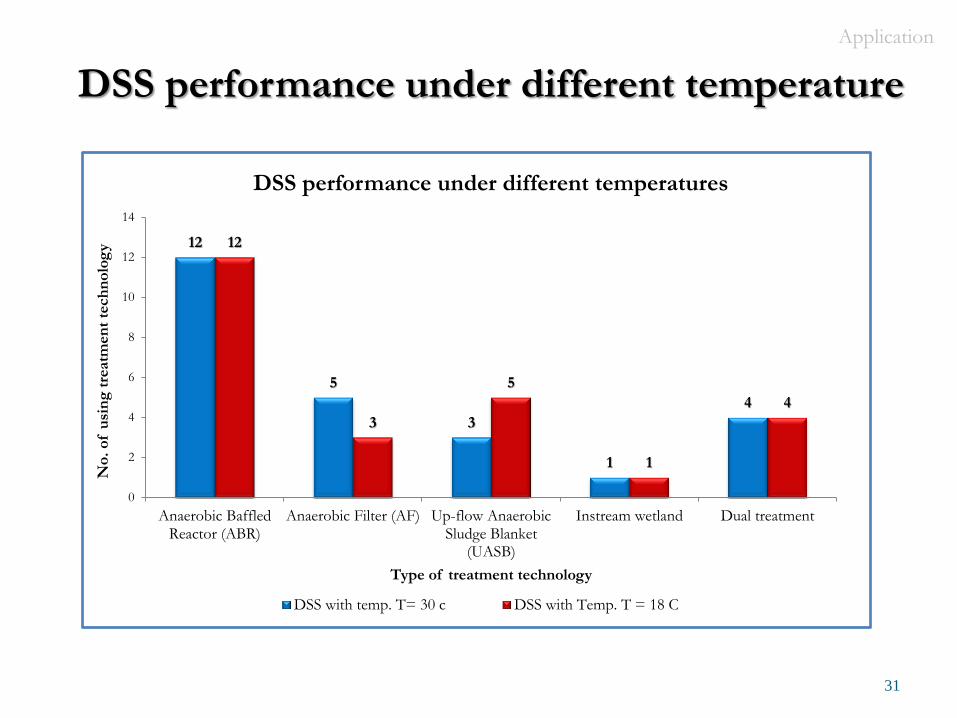
DSS performance under different temperature
12
5
3
1
4
12
3
5
1
4
0
2
4
6
8
10
12
14
Anaerobic BaffledReactor (ABR)
Anaerobic Filter (AF) Up-flow AnaerobicSludge Blanket
(UASB)
Instream wetland Dual treatment
No
. o
f u
sin
g t
reatm
en
t te
ch
no
log
y
Type of treatment technology
DSS performance under different temperatures
DSS with temp. T= 30 c DSS with Temp. T = 18 C
Application
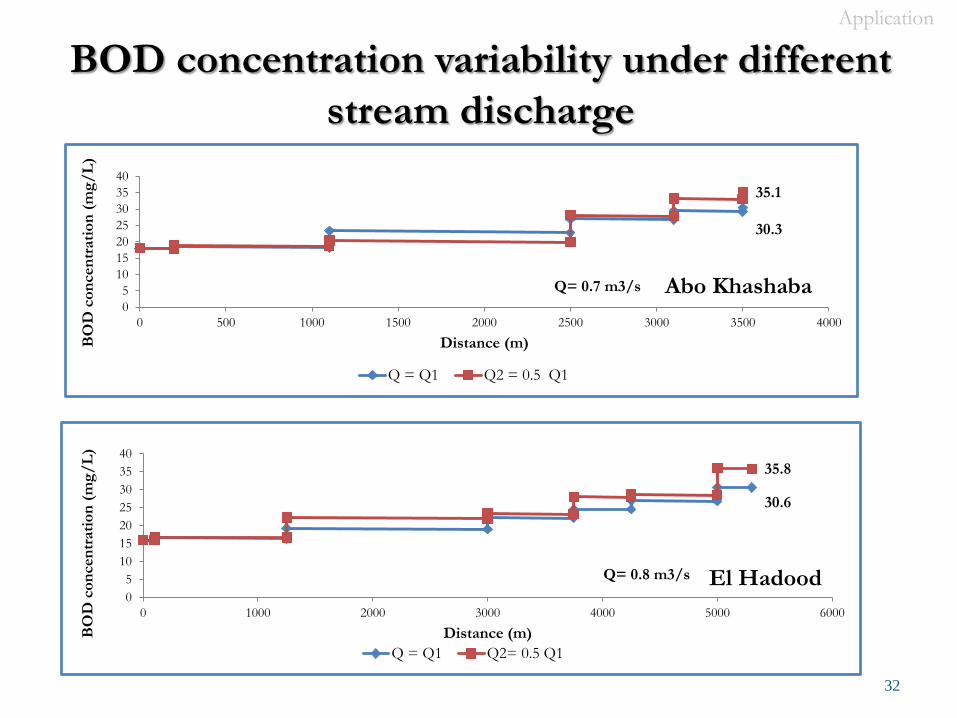
BOD concentration variability under different
stream discharge
32
30.3
35.1
0
5
10
15
20
25
30
35
40
0 500 1000 1500 2000 2500 3000 3500 4000
BO
D c
on
cen
trati
on
(m
g/
L)
Distance (m)
Abo Khashaba
Q = Q1 Q2 = 0.5 Q1
30.6
35.8
0
5
10
15
20
25
30
35
40
0 1000 2000 3000 4000 5000 6000
BO
D c
on
cen
trati
on
(m
g/
L)
Distance (m)
El Hadood
Q = Q1 Q2= 0.5 Q1
Q= 0.8 m3/s
Application
Q= 0.7 m3/s
33
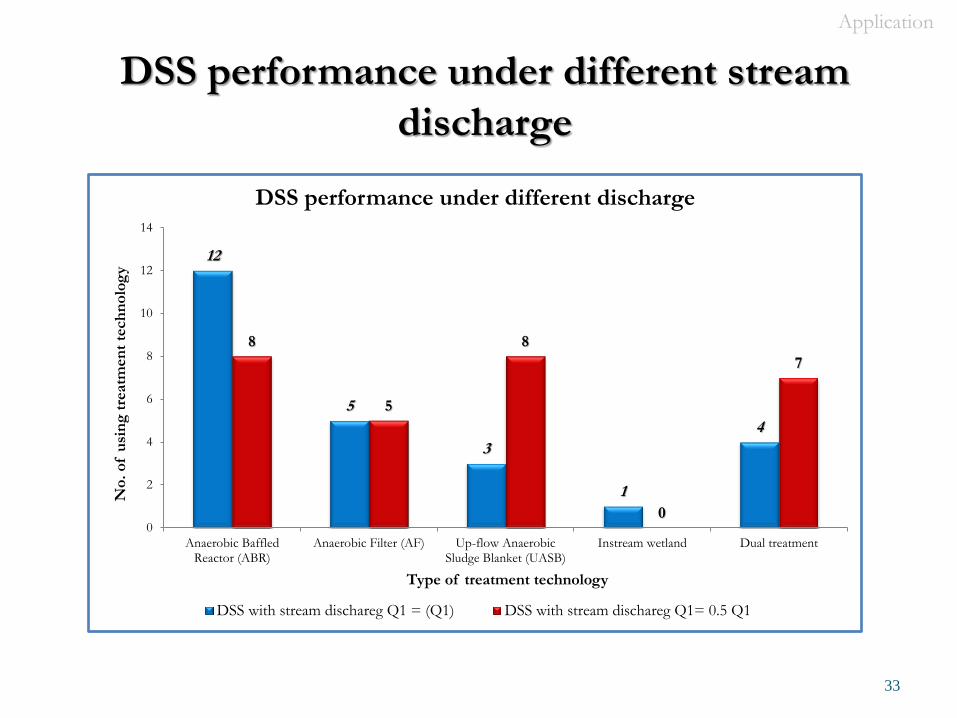
DSS performance under different stream
discharge
12
5
3
1
4
8
5
8
0
7
0
2
4
6
8
10
12
14
Anaerobic BaffledReactor (ABR)
Anaerobic Filter (AF) Up-flow AnaerobicSludge Blanket (UASB)
Instream wetland Dual treatment
No
. o
f u
sin
g t
reatm
en
t te
ch
no
log
y
Type of treatment technology
DSS performance under different discharge
DSS with stream dischareg Q1 = (Q1) DSS with stream dischareg Q1= 0.5 Q1
Application
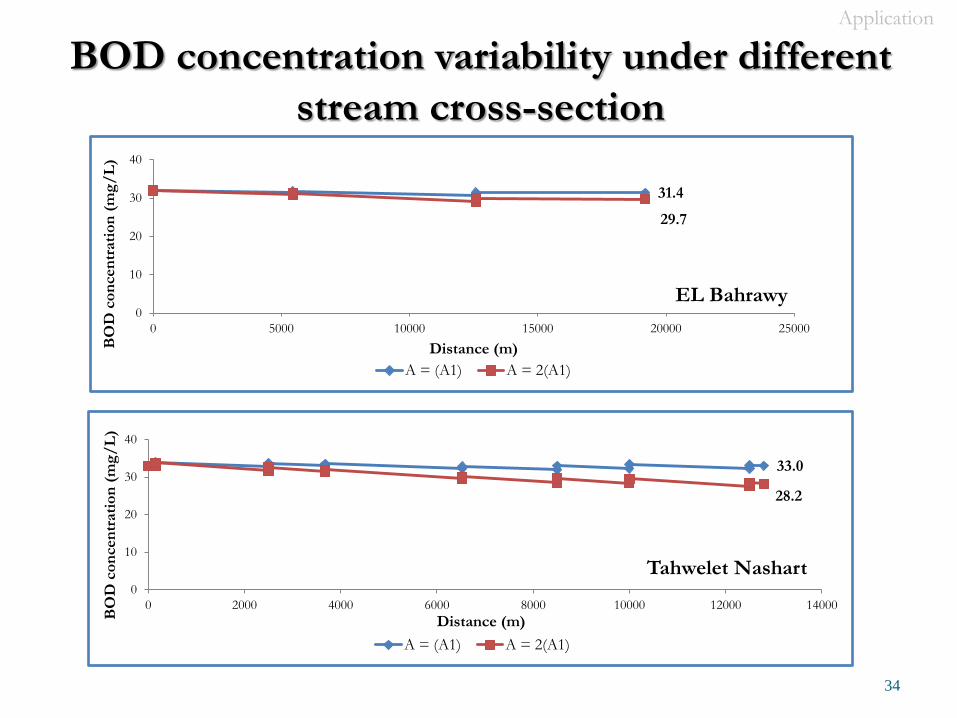
34
BOD concentration variability under different
stream cross-section
31.4
29.7
0
10
20
30
40
0 5000 10000 15000 20000 25000
BO
D c
on
cen
trati
on
(m
g/
L)
Distance (m)
EL Bahrawy
A = (A1) A = 2(A1)
33.0
28.2
0
10
20
30
40
0 2000 4000 6000 8000 10000 12000 14000
BO
D c
on
cen
trati
on
(m
g/
L)
Distance (m)
Tahwelet Nashart
A = (A1) A = 2(A1)
Application
35
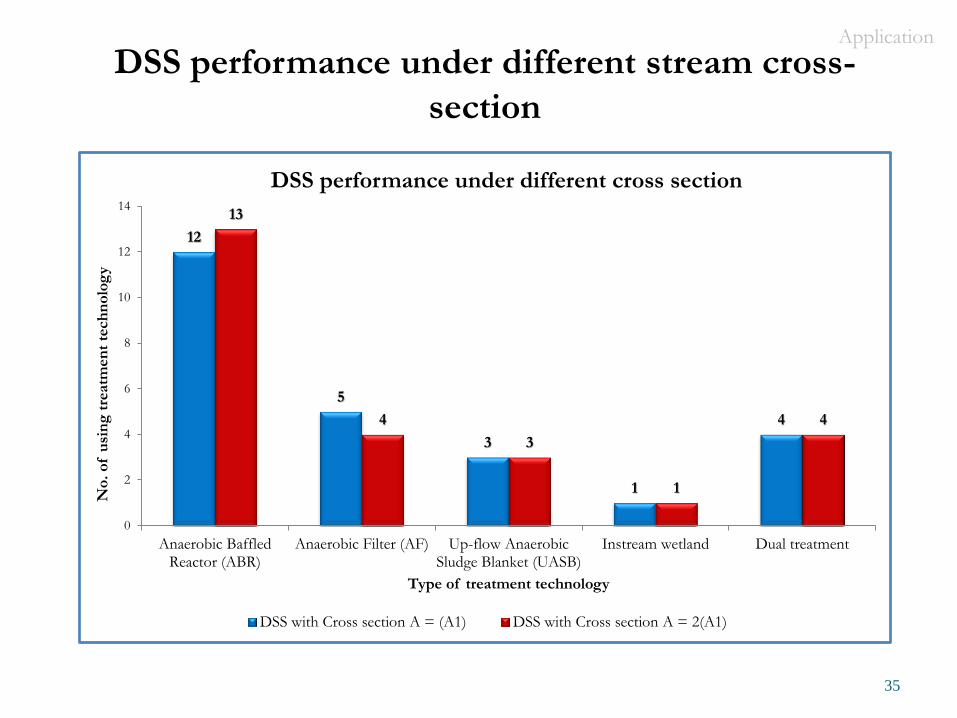
DSS performance under different stream cross-
section
12
5
3
1
4
13
4
3
1
4
0
2
4
6
8
10
12
14
Anaerobic BaffledReactor (ABR)
Anaerobic Filter (AF) Up-flow AnaerobicSludge Blanket (UASB)
Instream wetland Dual treatment
No
. o
f u
sin
g t
reatm
en
t te
ch
no
log
y
Type of treatment technology
DSS performance under different cross section
DSS with Cross section A = (A1) DSS with Cross section A = 2(A1)
Application
36
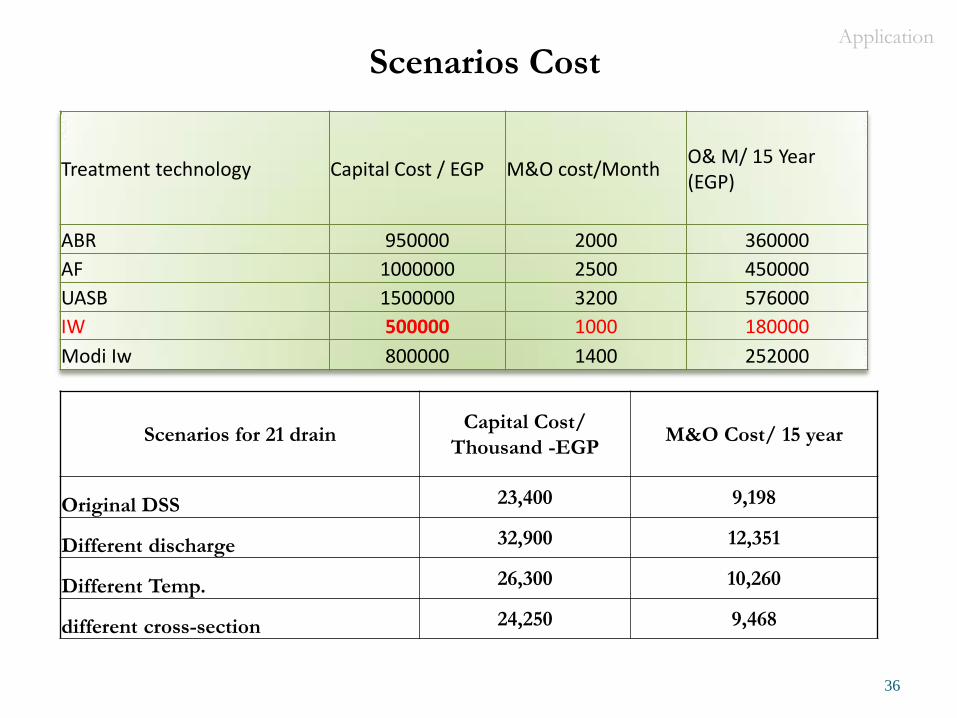
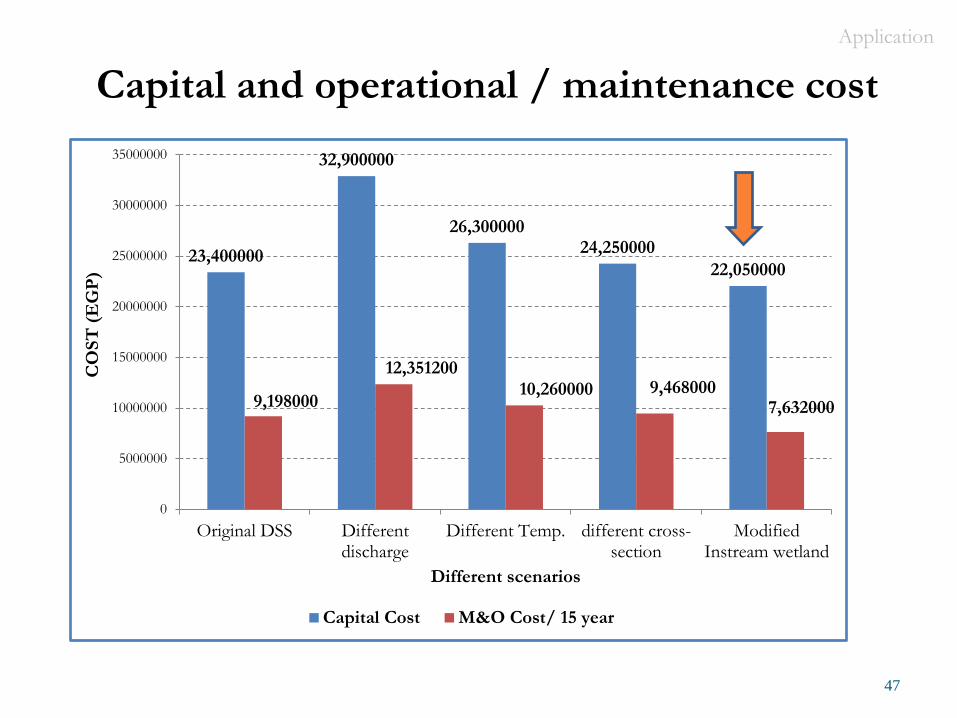
Scenarios Cost
Scenarios for 21 drain Capital Cost/
Thousand -EGP M&O Cost/ 15 year
Original DSS 23,400 9,198
Different discharge 32,900 12,351
Different Temp. 26,300 10,260
different cross-section 24,250 9,468
Treatment technology Capital Cost / EGP M&O cost/Month O& M/ 15 Year (EGP)
ABR 950000 2000 360000
AF 1000000 2500 450000
UASB 1500000 3200 576000
IW 500000 1000 180000
Modi Iw 800000 1400 252000
Application
37
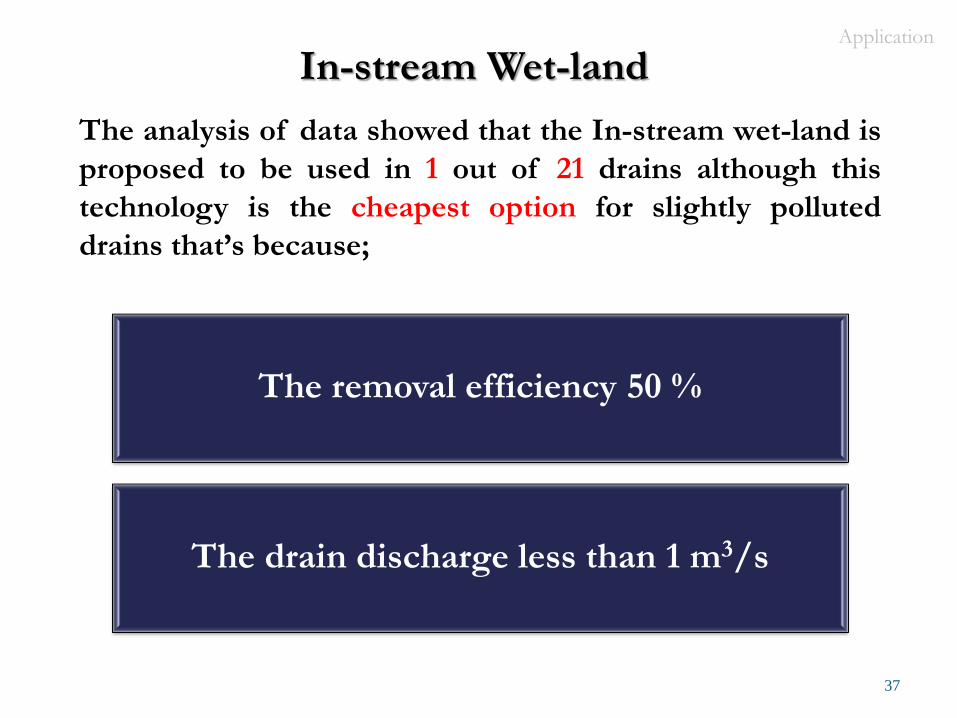
In-stream Wet-land
The analysis of data showed that the In-stream wet-land is
proposed to be used in 1 out of 21 drains although this
technology is the cheapest option for slightly polluted
drains that’s because;
The removal efficiency 50 %
The drain discharge less than 1 m3/s
Application
38
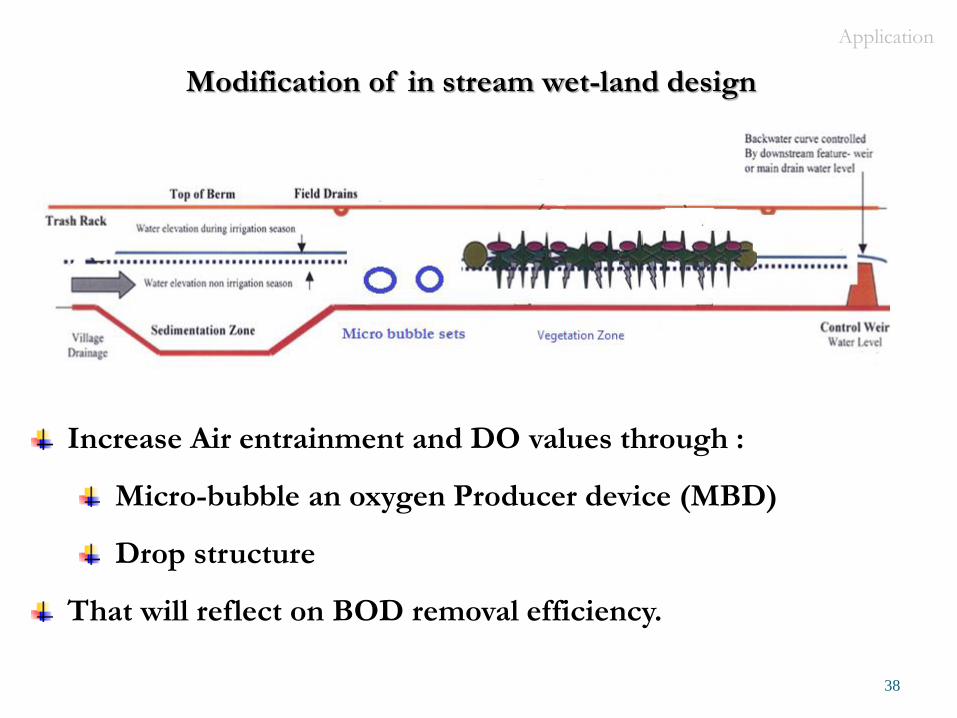
Modification of in stream wet-land design
Increase Air entrainment and DO values through :
Micro-bubble an oxygen Producer device (MBD)
Drop structure
That will reflect on BOD removal efficiency.
Application
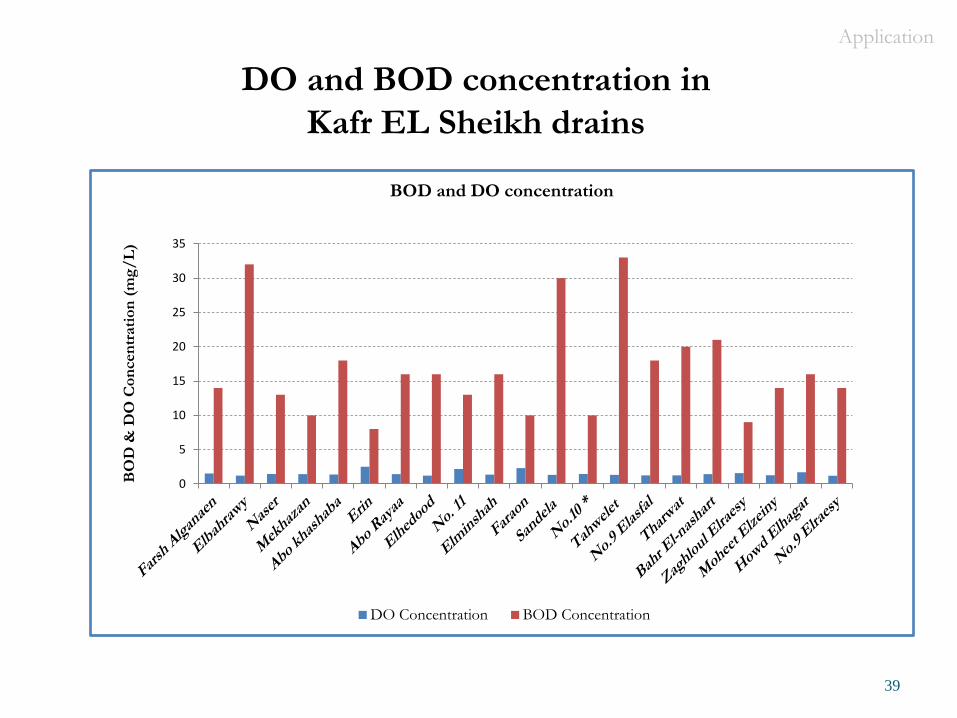
DO and BOD concentration in
Kafr EL Sheikh drains
39
0
5
10
15
20
25
30
35
BO
D &
DO
Co
ncen
trati
on
(m
g/
L)
BOD and DO concentration
DO Concentration BOD Concentration
Application
40
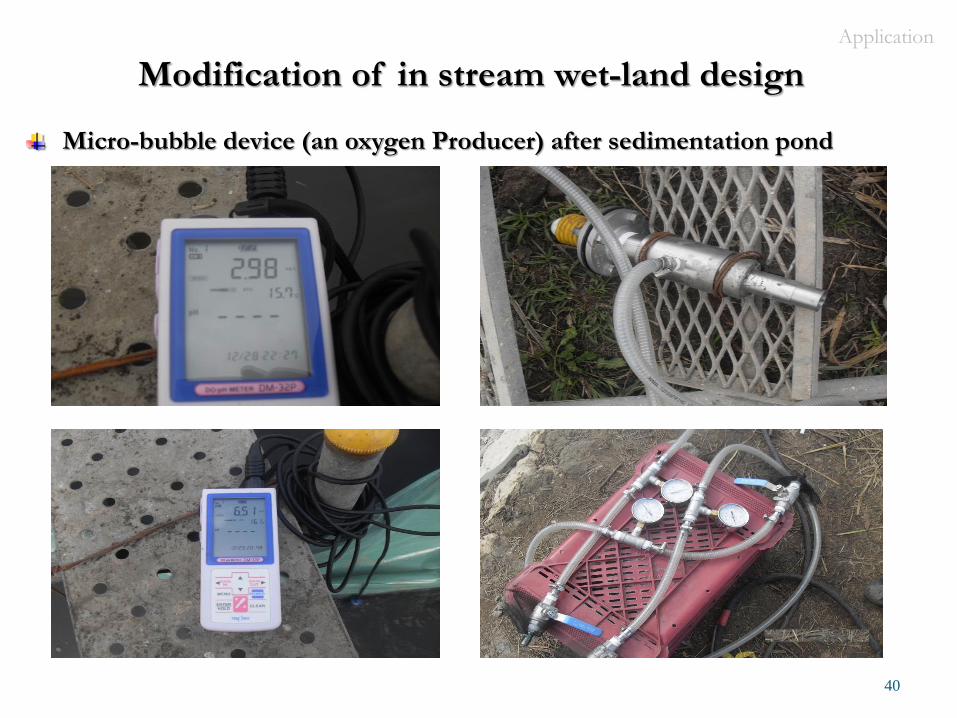
Modification of in stream wet-land design
Micro-bubble device (an oxygen Producer) after sedimentation pond
Application
41
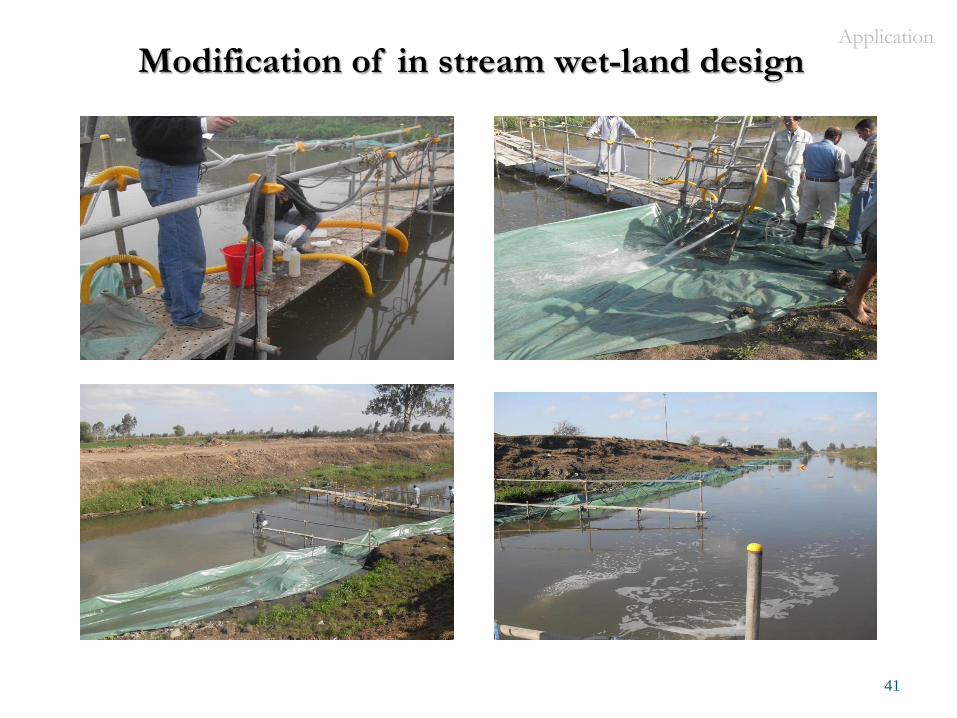
Modification of in stream wet-land design Application
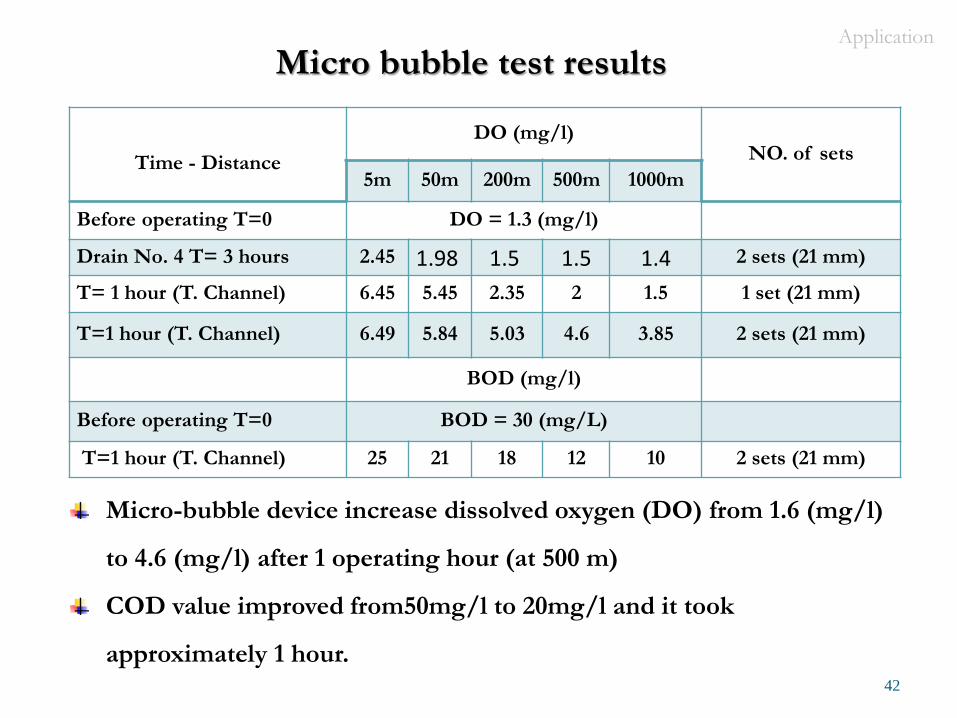
Time - Distance
DO (mg/l) NO. of sets
5m 50m 200m 500m 1000m
Before operating T=0 DO = 1.3 (mg/l)
Drain No. 4 T= 3 hours 2.45 1.98 1.5 1.5 1.4 2 sets (21 mm)
T= 1 hour (T. Channel) 6.45 5.45 2.35 2 1.5 1 set (21 mm)
T=1 hour (T. Channel) 6.49 5.84 5.03 4.6 3.85 2 sets (21 mm)
BOD (mg/l)
Before operating T=0 BOD = 30 (mg/L)
T=1 hour (T. Channel) 25 21 18 12 10 2 sets (21 mm)
42
Micro bubble test results
Micro-bubble device increase dissolved oxygen (DO) from 1.6 (mg/l)
to 4.6 (mg/l) after 1 operating hour (at 500 m)
COD value improved from50mg/l to 20mg/l and it took
approximately 1 hour.
Application
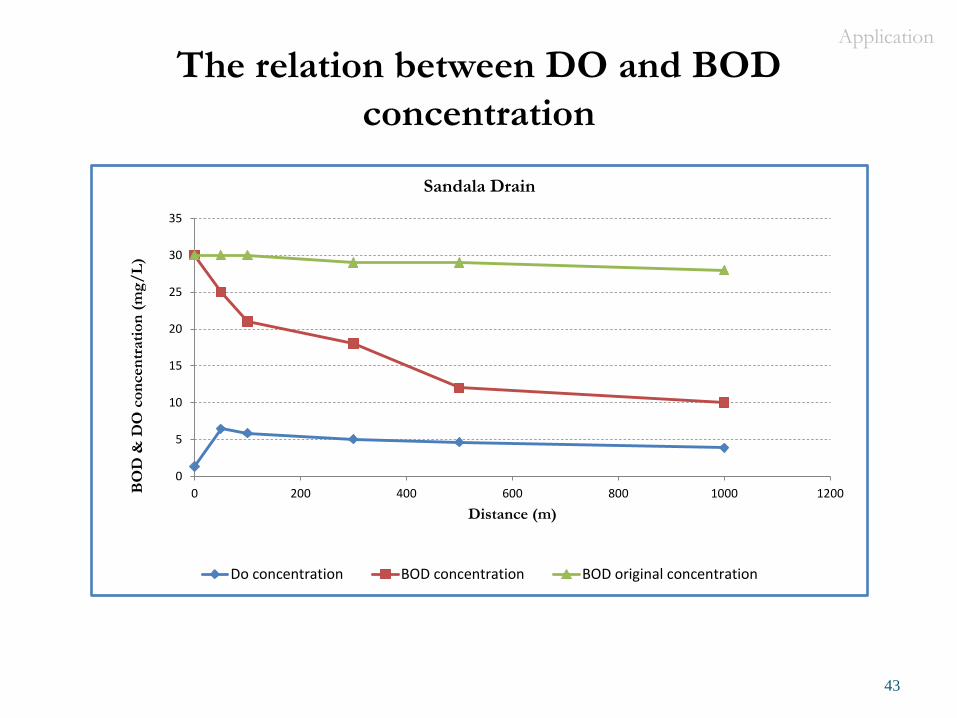
43
0
5
10
15
20
25
30
35
0 200 400 600 800 1000 1200BO
D &
DO
co
ncen
trati
on
(m
g/
L)
Distance (m)
Sandala Drain
Do concentration BOD concentration BOD original concentration
Application
The relation between DO and BOD
concentration
44
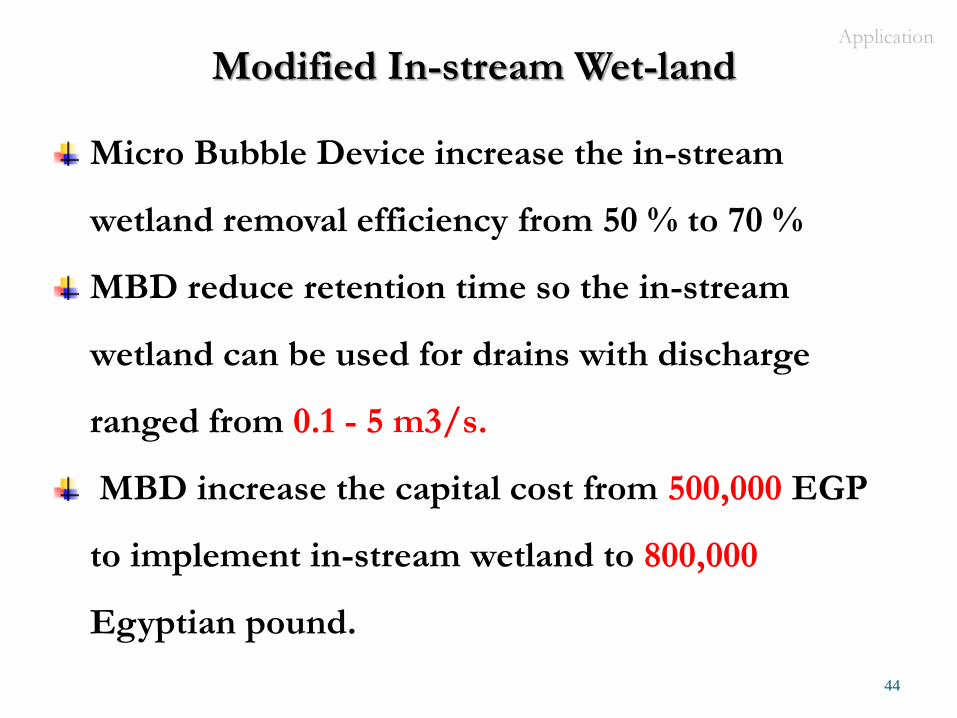
Modified In-stream Wet-land
Micro Bubble Device increase the in-stream
wetland removal efficiency from 50 % to 70 %
MBD reduce retention time so the in-stream
wetland can be used for drains with discharge
ranged from 0.1 - 5 m3/s.
MBD increase the capital cost from 500,000 EGP
to implement in-stream wetland to 800,000
Egyptian pound.
Application
45
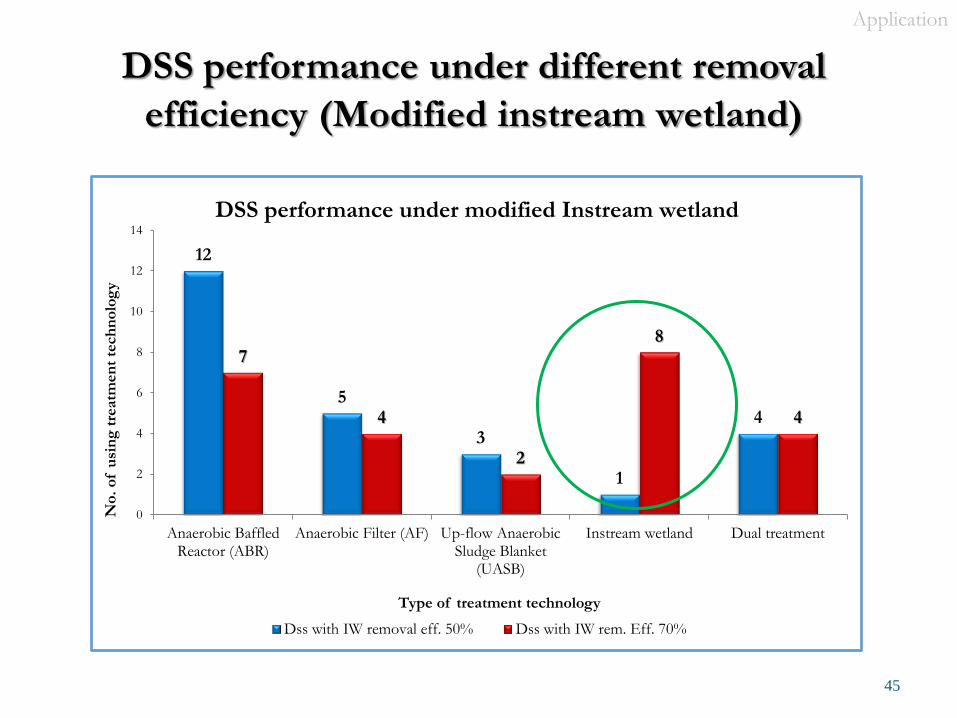
DSS performance under different removal
efficiency (Modified instream wetland)
12
5
3
1
4
7
4
2
8
4
0
2
4
6
8
10
12
14
Anaerobic BaffledReactor (ABR)
Anaerobic Filter (AF) Up-flow AnaerobicSludge Blanket
(UASB)
Instream wetland Dual treatment
No
. o
f u
sin
g t
reatm
en
t te
ch
no
log
y
Type of treatment technology
DSS performance under modified Instream wetland
Dss with IW removal eff. 50% Dss with IW rem. Eff. 70%
Application
46
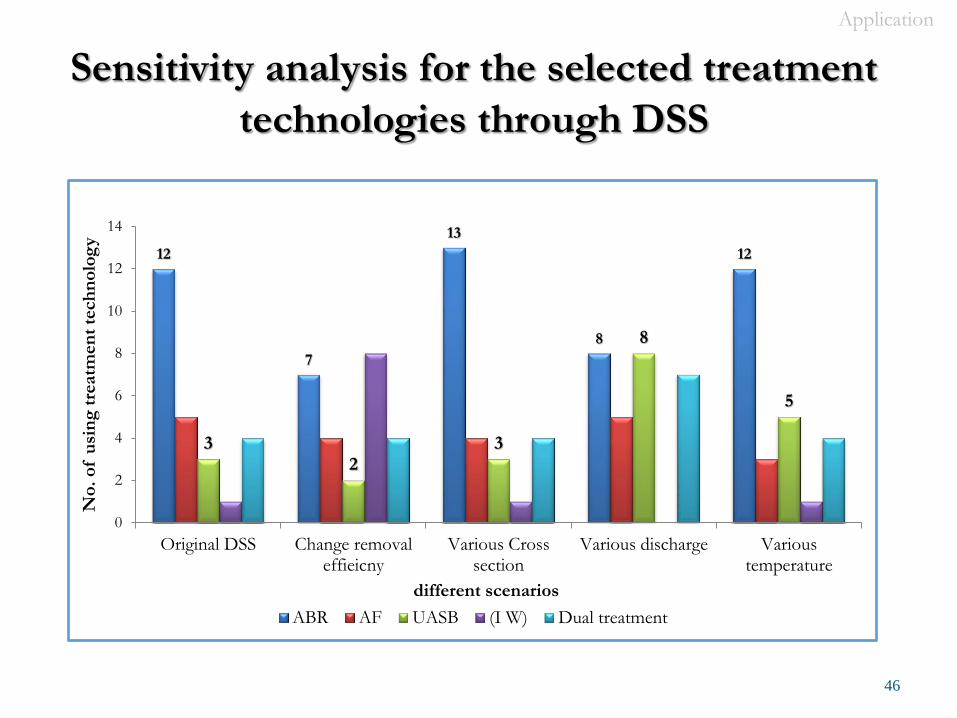
Sensitivity analysis for the selected treatment
technologies through DSS
12
7
13
8
12
3 2
3
8
5
0
2
4
6
8
10
12
14
Original DSS Change removaleffieicny
Various Crosssection
Various discharge Varioustemperature
No
. o
f u
sin
g t
reatm
en
t te
ch
no
log
y
different scenarios
ABR AF UASB (I W) Dual treatment
Application
47
Capital and operational / maintenance cost
23,400000
32,900000
26,300000 24,250000
22,050000
9,198000
12,351200 10,260000 9,468000
7,632000
0
5000000
10000000
15000000
20000000
25000000
30000000
35000000
Original DSS Differentdischarge
Different Temp. different cross-section
ModifiedInstream wetland
CO
ST
(E
GP
)
Different scenarios
Capital Cost M&O Cost/ 15 year
Application
48
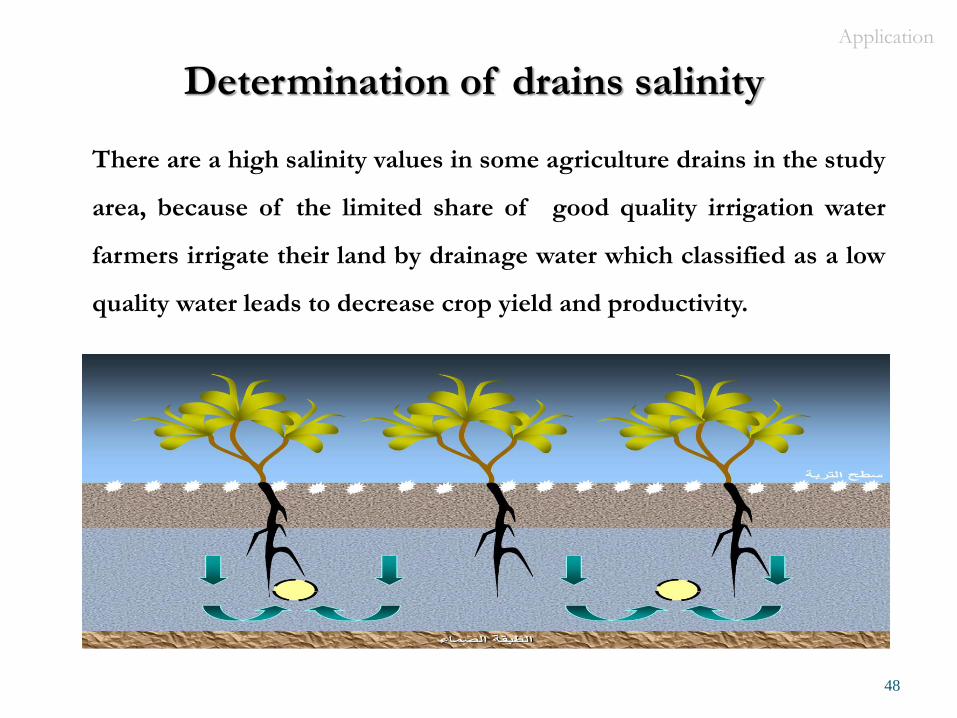
Determination of drains salinity
There are a high salinity values in some agriculture drains in the study
area, because of the limited share of good quality irrigation water
farmers irrigate their land by drainage water which classified as a low
quality water leads to decrease crop yield and productivity.
Application
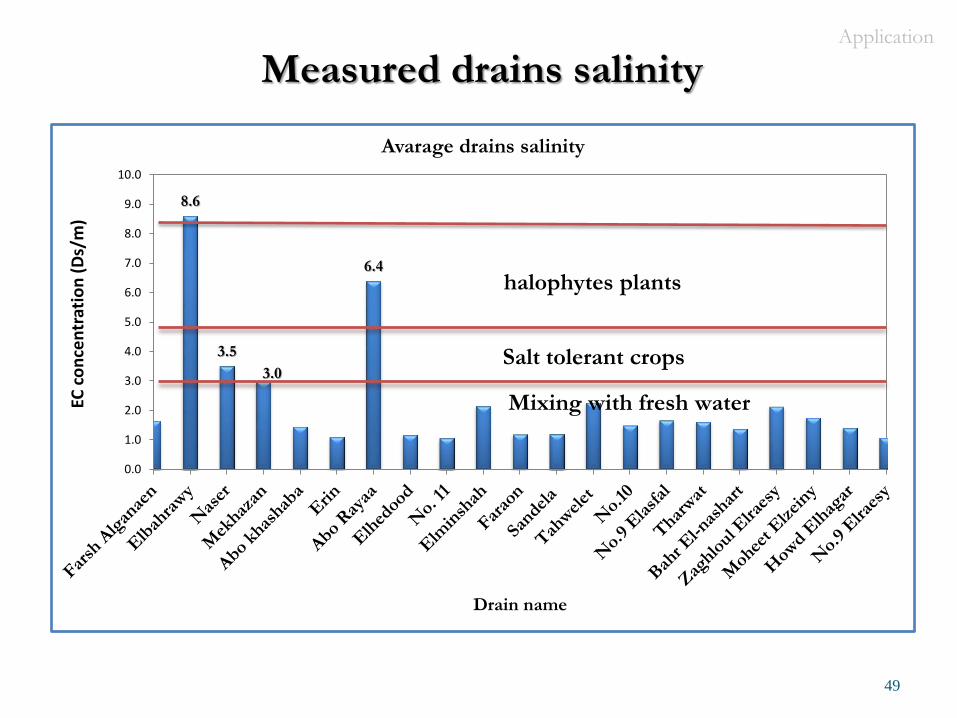
Measured drains salinity
49
8.6
3.5
3.0
6.4
0.0
1.0
2.0
3.0
4.0
5.0
6.0
7.0
8.0
9.0
10.0
EC c
on
cen
trat
ion
(D
s/m
)
Drain name
Avarage drains salinity
Salt tolerant crops
halophytes plants
Mixing with fresh water
Application
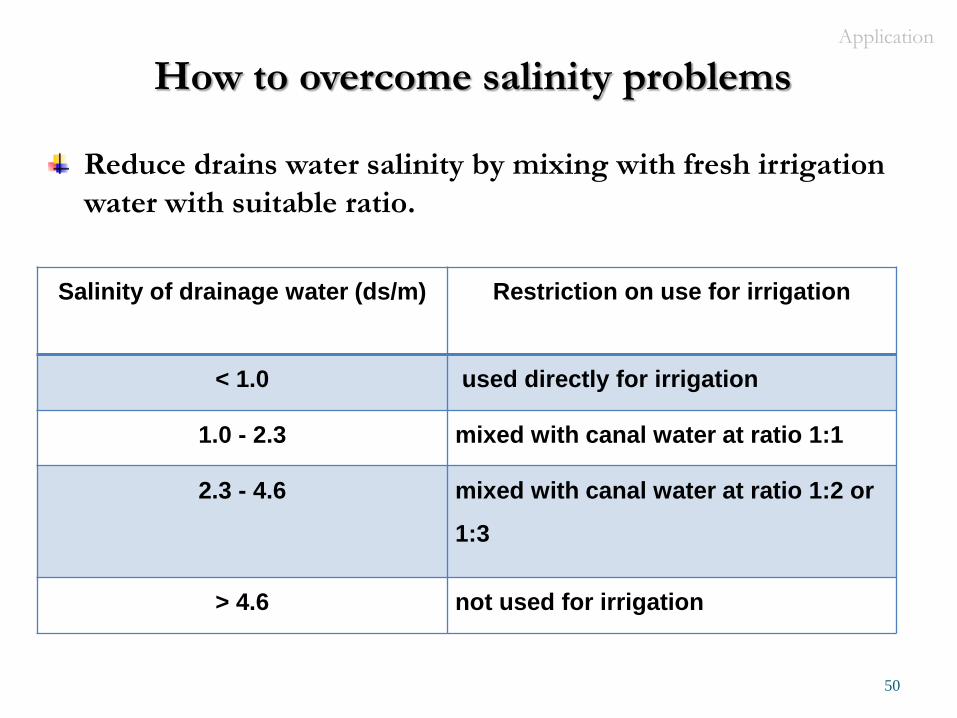
How to overcome salinity problems
Reduce drains water salinity by mixing with fresh irrigation
water with suitable ratio.
50
Salinity of drainage water (ds/m) Restriction on use for irrigation
< 1.0 used directly for irrigation
1.0 - 2.3 mixed with canal water at ratio 1:1
2.3 - 4.6 mixed with canal water at ratio 1:2 or
1:3
> 4.6 not used for irrigation
Application
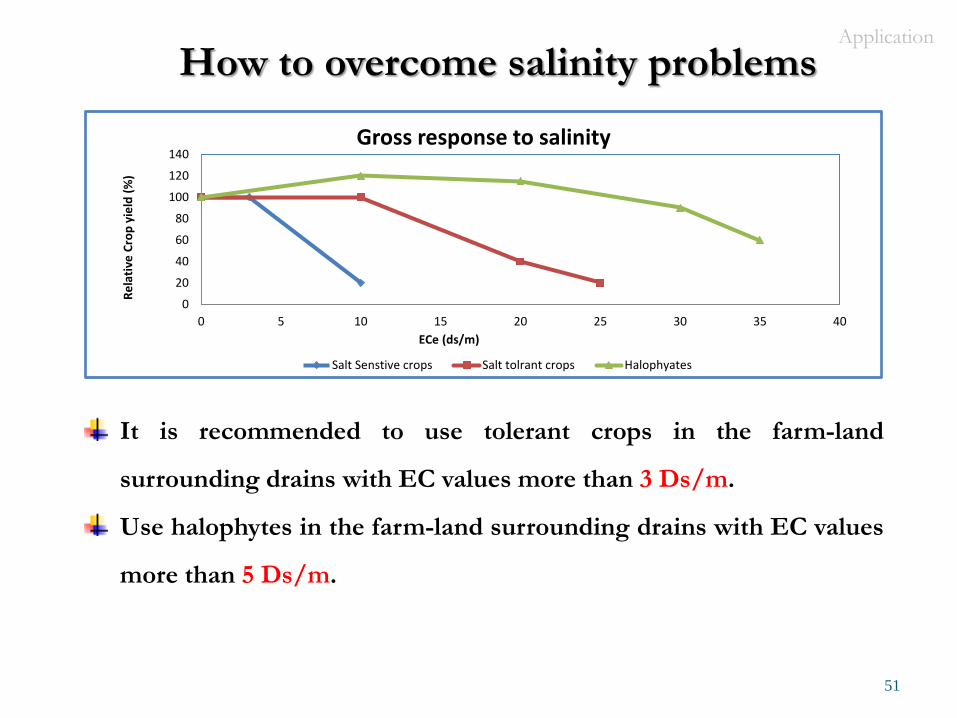
How to overcome salinity problems
51
It is recommended to use tolerant crops in the farm-land
surrounding drains with EC values more than 3 Ds/m.
Use halophytes in the farm-land surrounding drains with EC values
more than 5 Ds/m.
0
20
40
60
80
100
120
140
0 5 10 15 20 25 30 35 40
Re
lati
ve C
rop
yie
ld (
%)
ECe (ds/m)
Gross response to salinity
Salt Senstive crops Salt tolrant crops Halophyates
Application
Conclusion
52
It was observed that drains with discharges more than
5 m3/sec is less affected with BOD effluent from villages with
population up to 60,000 inhabitants.
There is a relation between BOD concentration and crop
pattern in the area, where in the summer season BOD values
concentration decrease with rice cultivation.
Irrigation with direct drainage water leads to increase soil
salinity Northern East part of Kafr EL sheikh Governorate.
Results and conclusions Results and conclusions
Conclusion
53
The change of temperature, stream cross section, and
stream discharge have an effect on the BOD
concentration and the selected treatment technologies
through decision support system.
Using a decentralized treatment station in the
beginning of the drains keep BOD concentration
values within the allowable limits which enable to
direct reuse of drainage water in irrigation.
Results and Conclusions Results and conclusions
Conclusion
54
Increasing air entrainment in the in-stream wetland
technology will increase the BOD removal efficiency from 50%
to 70% , and that modified scenario increase using instream
wetland to be used in 8 sites out of 21.
The modified in-stream wetland technology is the most
suitable solution in the study area in terms of the
required space and construction, operational and
maintenance cost ( especially drains with discharge less
than 5 m3/S.)
Results and conclusions Results and conclusions
Recommendations for further work
55
the scenario of using modified instream wetland have the least
Capital and M&O costs. The second best option is to modifying
the instream wetland although the capital cost is most equal the
original case, but in-terms of long term maintenance and
operational cost is less that the others scenarios.
Recommendations
The research focused on the point source of sewage waste
pollution comes from villages, it is recommended to consider
branch drains and sub-surface drainage effect in the calculation
in further works.
It also recommended to calculate the nitrate decay along the
drains.
Further works should study the behavior of the industrial wastes
and heavy metals concentration values in samples of water and
sediment along the drains.

56
57
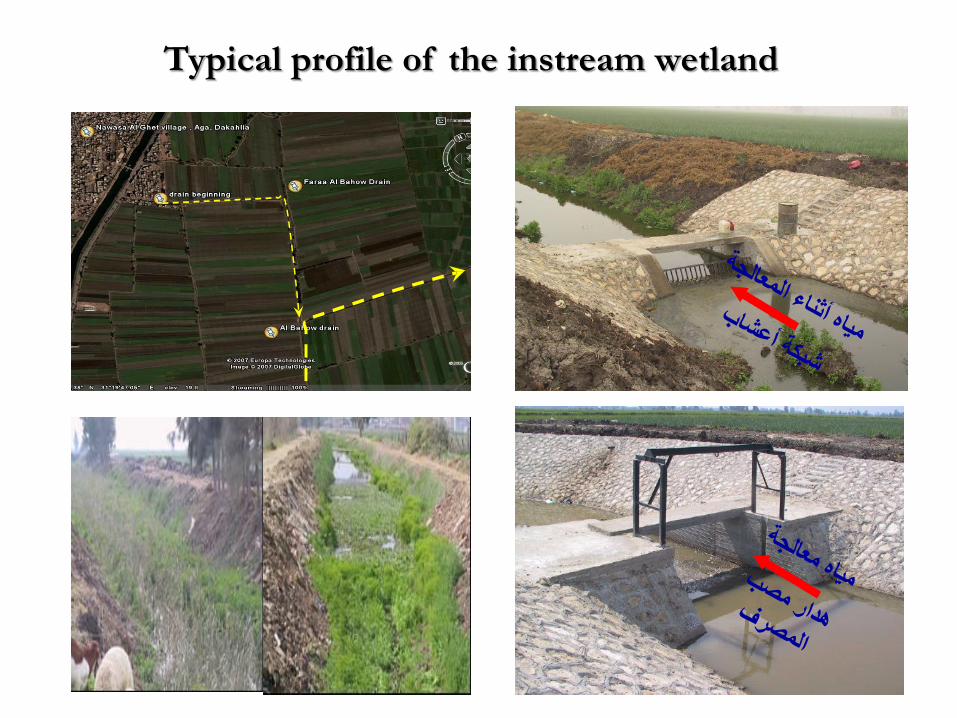
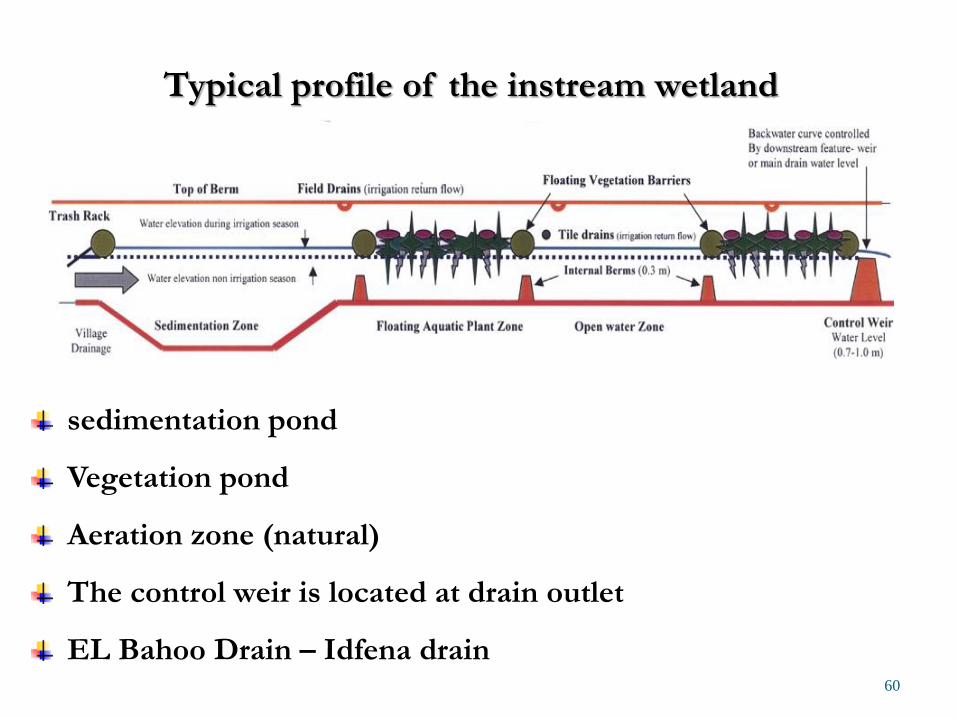
Typical profile of the instream wetland
Sanors village AL Fayoum Sambo village – AL Garbayia
Kafe Al Hamam- AL Shrkiya AL Ibarhimia - Sharkeya 58
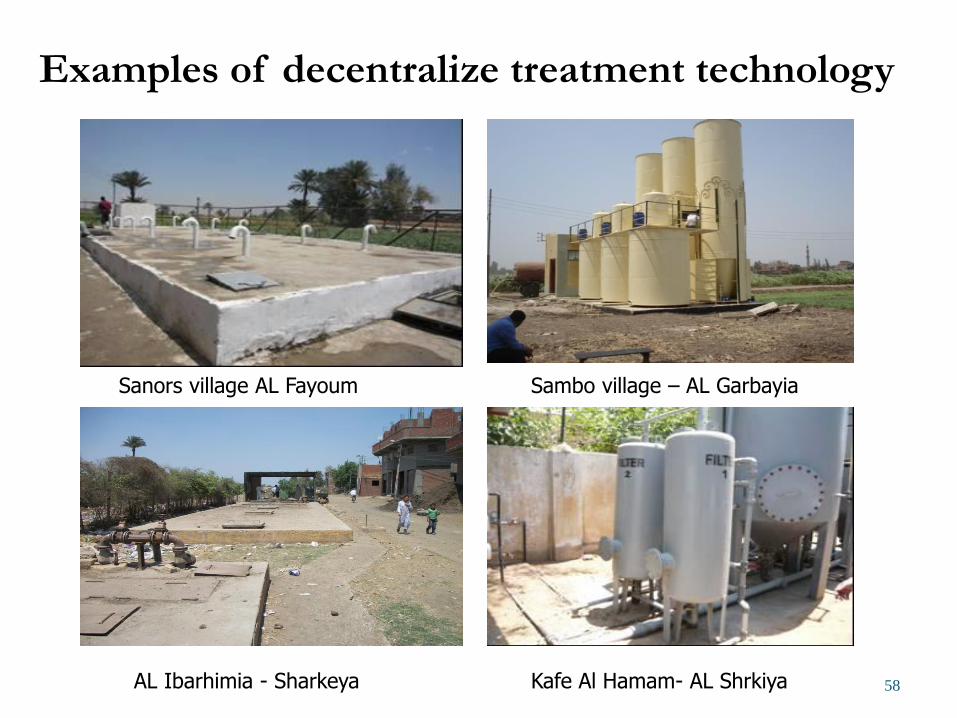
Examples of decentralize treatment technology
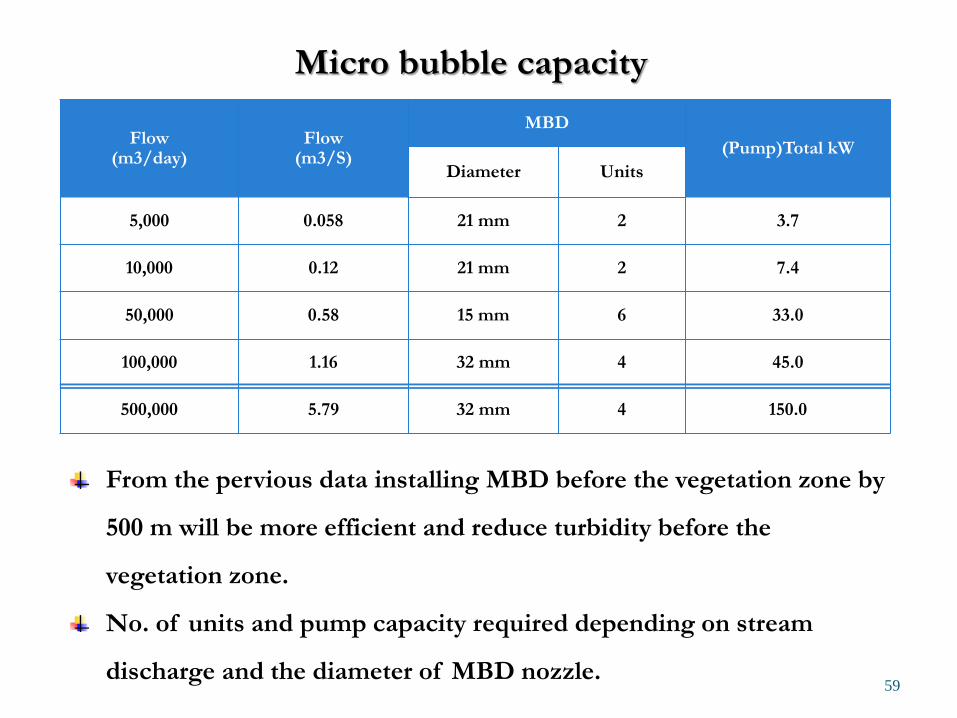
Flow (m3/day)
Flow (m3/S)
MBD
(Pump)Total kW
Diameter Units
5,000 0.058 21 mm 2 3.7
10,000 0.12 21 mm 2 7.4
50,000 0.58 15 mm 6 33.0
100,000 1.16 32 mm 4 45.0
500,000 5.79 32 mm 4 150.0
59
Micro bubble capacity
From the pervious data installing MBD before the vegetation zone by
500 m will be more efficient and reduce turbidity before the
vegetation zone.
No. of units and pump capacity required depending on stream
discharge and the diameter of MBD nozzle.
60
Typical profile of the instream wetland
sedimentation pond
Vegetation pond
Aeration zone (natural)
The control weir is located at drain outlet
EL Bahoo Drain – Idfena drain
61