Embed Size (px)
Citation preview

Axioma Case Study
www.axioma.com
Enhancing the Investment Process with a Custom Risk Model
September 26, 2013
A case study by Axioma and Credit Suisse HOLT examines the benefits of using custom risk models generated by Axioma’s Risk Model Machine, in combination with HOLT’s highly regarded proprietary return models. The results of the study show that Axioma’s custom risk models provide further validation of the efficacy of HOLT’s fundamental-factor data. Combining a custom risk model with HOLT’s factors produced more efficient portfolios with better risk forecasts, and resulted in enhanced performance attribution.

1
Enhancing the Investment Process with a Custom Risk Model: A Case Study Chris Canova, Vice President, Product Management, Axioma Inc.1
Melissa Brown, Senior Director, Applied Research, Axioma Inc.
Adam Steffanus, Director, US Head of HOLT Investment Strategy, Credit Suisse
Summary2
Axioma and Credit Suisse HOLT recently conducted a study to examine the benefits of using custom risk models generated by Axioma’s Risk Model Machine in combination with HOLT’s highly regarded proprietary return models.
HOLT’s research, as well as the adoption of their data by a large number of practitioners, confirms the robustness of their alpha signals. We at Axioma set out to confirm the returns of HOLT’s factors using a custom risk model-based approach to determine if Axioma can more accurately forecast risk and improve information ratios by creating portfolios using a custom risk model, and to verify whether attribution shows that the factors contribute to portfolio returns as expected.
It is clear from the study that the HOLT factors worked quite well, producing consistently strong risk-adjusted returns over the short and long term. More importantly, the study demonstrated how the use of Axioma-generated custom risk models significantly enhanced the portfolio construction process through effective factor validation, increased portfolio efficiency, better risk forecasts and enhanced portfolio attribution.
1 The authors would like to thank Rob Stubbs, Chris Martin and especially Vishv Jeet, all of Axioma, for all of their technical assistance and valuable insights. This paper would not have been possible without their hard work. 2 This version of the paper reflects a few table and chart updates from the original version released September 16, 2013.

2
What is HOLT?
HOLT is a value-based, return on capital framework proprietary to Credit Suisse. HOLT provides an objective view of over 20,000 companies in 65 countries worldwide using a rigorous methodology that examines accounting information, converts it to cash and then values that cash, allowing investors to survey the entire corporate capital structure and identify key drivers of value. HOLT uses this valuation and corporate performance framework to help institutional investors across the entire investment process, from idea generation and company analysis to portfolio construction and risk management.
Key HOLT Principles
HOLT has three primary alpha factors along the Quality, Valuation, and Momentum axes. The HOLT factors can be used to determine whether a company is generating strong returns on capital, trading at a discount to intrinsic value or has improving economic returns based on analyst sentiment. The factors are derived from the adjusted income statement and balance sheet data that HOLT converts into a cash-based measure of performance that more closely approximates the underlying economics of the business. The HOLT valuation model is an objective, long-term valuation discounted cash flow framework. Embedded in the valuation model is a company specific life-cycle framework, which forecasts baseline long-term patterns of change in economic returns and growth, using empirical research on how thousands of companies with similar characteristics have performed in the past.
The HOLT framework is built upon a foundation of clean data, free of accounting distortions. Fundamental analysts make some accounting adjustments – HOLT makes all of them (and then some) for all of the stocks in the HOLT database. Sample accounting issues for which HOLT makes adjustments include: inflation, financing and capital structure decisions (including financial subsidiaries and operating leases), depreciation methods, treatment of non-operating investments, revaluation of assets, write-downs/write-offs, R&D capitalization, special items, inventory valuation methods, acquisition goodwill, fair-value markup to acquired plant, pensions, special reserves, stock compensation expense, and regional- and industry-specific conventions.
Enhancing the Investment Process with a Custom Risk Model
Axioma’s Risk Model Machine allows users to create their own proprietary risk models by combining their proprietary signals with other common risk factors. The result is a model that fully recognizes the risk in the bets the manager takes and allows the manager to more efficiently utilize his or her risk budget.

3
There are at least four benefits of a custom risk model (CRM):
1. A CRM can be used to validate factor returns. Typical methodologies for testing model effectiveness use regression-based returns that do not incorporate all risk factors, or simply examine quintile spreads. These approaches provide factor return estimates, but they cannot establish whether the factor contains unique information or whether its perceived success is instead the result of exposure to other variables. A CRM enables the model builder to understand the model’s signals with respect to risk, holding the effects of all other components in the process constant. It also provides insight into the factor’s impact on portfolio construction.
2. A CRM leads to more efficient portfolios. In other words, it can help a manager allocate risk to those factors expected to lead to outperformance and avoid taking risk where the manager does not have a view. This more deliberate allocation of the risk budget allows a manager to produce better returns per unit of risk.
3. By identifying all the factors to which a manager hopes to expose a portfolio, a CRM improves the accuracy of portfolio risk forecasts. In contrast, an off-the-shelf model will not “see” the risk in factors that are not part of the model. Optimized portfolios will load up on such factors since they are a risk-free source of return. Since any factor used as part of an alpha-generating process will by definition involve risk, a standard model will therefore underestimate the true risk of the portfolio.
4. A CRM allows managers and asset owners to better understand what is driving portfolio returns, by identifying all the “bets”— exposures in the portfolio—a manager is taking, and calculating returns to those exposures. Any factor a manager uses can be incorporated into a CRM, whether the factor is a traditional “quant” factor or a more fundamentally based concept (such as tilting toward high ROE).
Case Study Objective
HOLT’s research, as well as the adoption of their data by a large number of practitioners, has confirmed the efficacy of their approach. We at Axioma set out to confirm the returns to their factors using a risk model-based approach, to determine if we could more accurately forecast risk and improve information ratios by creating portfolios using a custom risk model, and to verify whether attribution shows that the factors contribute to portfolio returns as expected.
Validation of Factor Returns
One of most important questions to be answered at the beginning on any model building is, “do the factors contain information?” Accordingly, our first task was to validate the factor returns. We examined three factors HOLT considers to be alpha factors: HOLT Momentum, HOLT Quality and HOLT Value3.
3 HOLT Momentum is the CFROI Momentum variable. HOLT Quality consists of CFROI LFY (economic return on capital) and Change in Value Creation (change in economic profit Y/Y). HOLT Value consists of four factors:

4
One common method of testing the efficacy of model factors is calculating univariate exposures to a factor and then measuring the performance of quintile spreads. While this may give the user a clue as to whether the model might be effective, it is fraught with potential hazards. To illustrate this issue we calculated exposures of our universe of stocks to HOLT’s alpha factors along with Axioma’s Medium-Term Momentum factor from the Worldwide model. We then created portfolios that were long the top quintile and short the bottom. While this provided some useful information (Table 1), attribution analysis revealed that these portfolios had some very large and likely undesirable factor exposures.
As we see in Table 2, attribution analysis of the Value Top minus Bottom Quintile portfolio (run using Axioma’s Worldwide Medium-Horizon model) revealed large contributions to return from Short-Term Momentum and Volatility, along with Value. Large negative exposures to both of Axioma’s Momentum factors, as well as a somewhat smaller exposure to Liquidity, likely impacted returns over shorter periods, too. In addition, industries contributed significantly. In summary, the quintile spread portfolio does not represent an isolated return for Value; it includes a lot of other “baggage” that investors may not want.
Table 1. Returns to Quintile Spread Portfolios, 2000-2012
HOLT Momentum
HOLT Quality
HOLT Value
WW Momentum
Annualized Return 5.20% 7.38% 17.16% 8.48% Average Annualized (Total) Risk 11.53% 11.06% 14.81% 25.98% Sharpe Ratio 0.45 0.67 1.16 0.33
Source: Credit Suisse HOLT, Axioma Inc.
Percent Change to Warranted Value (HOLT’s DCF Warranted Price relative to the current trading price), HOLT Economic P/E, HOLT Value/Cost (HOLT Price to Book) and Market Implied Discount Rate (a real cost of capital akin to a YTM on an equity). A full description of each of the alpha factors appears in Appendix 1.

5
Table 2. Value Quintile Spread Worldwide Model Attribution, 2000-2012
Source of Return Contribution Avg
Exposure Portfolio Return 17.16% Specific Return 1.24% Factor Contribution 15.92% Style 11.81% Exchange Rate Sensitivity -0.08% -0.01 Growth -0.14% 0.06 Leverage 0.04% 0.02 Liquidity -0.50% -0.15 Medium-Term Momentum 0.06% -0.43 Short-Term Momentum 5.63% -0.27 Size 0.46% -0.10 Value 3.75% 1.10 Volatility 2.59% 0.03 Country 1.22% Industry 2.32% Currency 0.56%
Source: Credit Suisse HOLT, Axioma Inc.
Factor Returns
Using the custom risk model to create factor returns allowed us to isolate the impact of each factor, while simultaneously recognizing the impact of the other factors. In other words, we were able to distill a “pure” return for each factor without the impact of unwanted exposures. So, our next step was to build a custom risk model using the following factors4:
• HOLT Value • HOLT Quality • HOLT Momentum • HOLT Leverage • HOLT Growth
• Axioma Exchange Rate Sensitivity • Axioma Liquidity • Axioma (WW) Medium-Term Momentum • Axioma Size • Axioma Volatility
4 HOLT Leverage is the Leverage at Market variable (Market value of debt includes off B/S debt items). HOLT Growth comprises CFROI Change (Forecast CFROI less trailing historical CFROI) and Normalized Growth Rate Used in Valuation (HOLT real asset growth forecast).
6
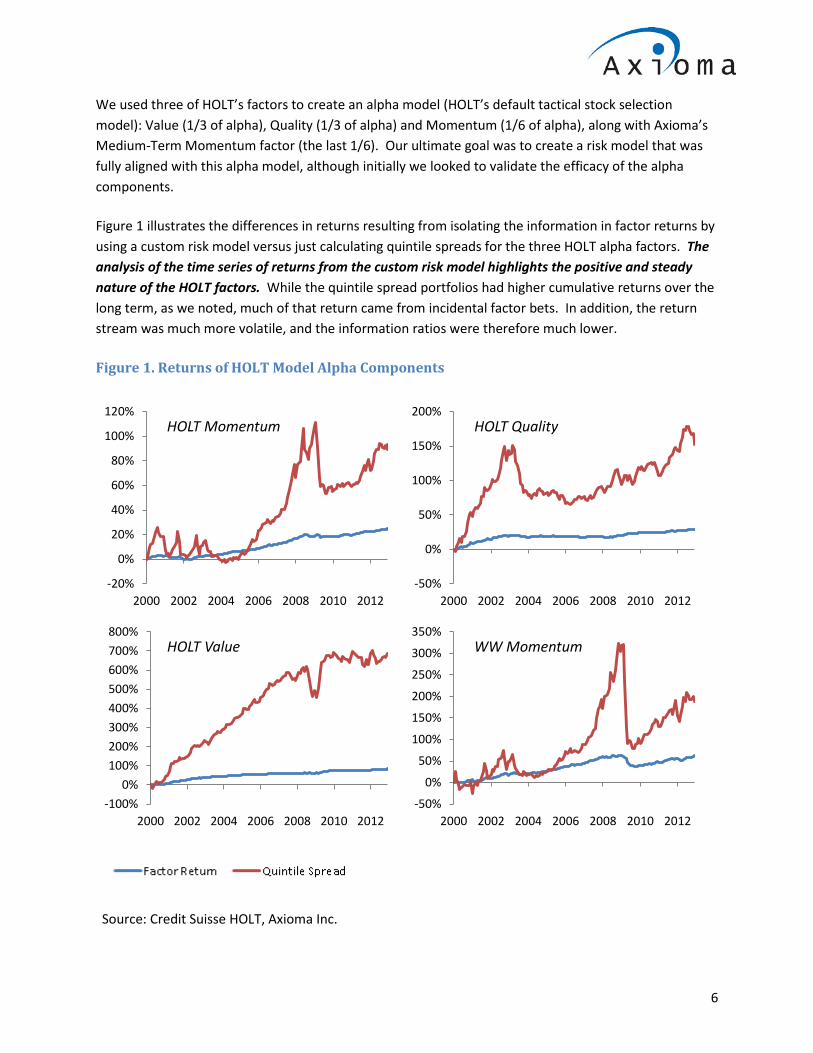
We used three of HOLT’s factors to create an alpha model (HOLT’s default tactical stock selection model): Value (1/3 of alpha), Quality (1/3 of alpha) and Momentum (1/6 of alpha), along with Axioma’s Medium-Term Momentum factor (the last 1/6). Our ultimate goal was to create a risk model that was fully aligned with this alpha model, although initially we looked to validate the efficacy of the alpha components.
Figure 1 illustrates the differences in returns resulting from isolating the information in factor returns by using a custom risk model versus just calculating quintile spreads for the three HOLT alpha factors. The analysis of the time series of returns from the custom risk model highlights the positive and steady nature of the HOLT factors. While the quintile spread portfolios had higher cumulative returns over the long term, as we noted, much of that return came from incidental factor bets. In addition, the return stream was much more volatile, and the information ratios were therefore much lower.
Figure 1. Returns of HOLT Model Alpha Components
Source: Credit Suisse HOLT, Axioma Inc.
-20%
0%
20%
40%
60%
80%
100%
120%
2000 2002 2004 2006 2008 2010 2012
HOLT Momentum
-50%
0%
50%
100%
150%
200%
2000 2002 2004 2006 2008 2010 2012
HOLT Quality
-100%0%
100%200%300%400%500%600%700%800%
2000 2002 2004 2006 2008 2010 2012
HOLT Value
-50%
0%
50%
100%
150%
200%
250%
300%
350%
2000 2002 2004 2006 2008 2010 2012
WW Momentum

7
In Table 3, we show the factor return results for the HOLT factors used in the alpha model using the returns from the custom risk model. It is clear that the HOLT factors worked quite well, producing consistently strong risk-adjusted returns over the long term, as well as more recently.
Table 3. Long-Term Results of Alpha Factors
Alpha Model Factors Cumulative Return (%)
Annualized Return (%)
Average Monthly
Return (%)
Annualized Standard
Deviation of Return (%)
Information Ratio
Full Period (January 2000 - December 2012) HOLT Momentum 23.5 1.6 0.1 1.1 1.4
HOLT Quality 28.3 1.9 0.2 1.3 1.5 HOLT Value 84.9 4.7 0.4 1.5 3.1 WW Momentum 61.4 3.6 0.3 2.5 1.4
5 Years Ended 2012 HOLT Momentum 6.2 1.2 0.1 1.2 1.0
HOLT Quality 8.2 1.5 0.1 1.0 1.6 HOLT Value 15.5 2.8 0.2 1.4 2.0 WW Momentum 1.0 0.2 0.0 2.7 0.1
3 Years Ended 2012 HOLT Momentum 4.6 1.5 0.1 0.7 2.1
HOLT Quality 3.1 1.0 0.1 0.8 1.2 HOLT Value 5.9 1.9 0.2 1.0 1.9 WW Momentum 15.6 4.8 0.4 1.8 2.7 Source: Credit Suisse HOLT, Axioma Inc.
Backtest Results
Having validated that the signals have information, we wanted to bring them into portfolio construction. Our next step aimed to show how a custom risk model can produce portfolios with better returns per unit of risk. We ran a series of frontier backtests for long-only portfolios, where the frontiers incremented the targeted active risk (1.5% to 5%) and the alpha was as described above. We also tested several constraint scenarios for fully invested long-only portfolios: no other constraints, turnover constrained5, turnover and active sector weights constrained6, and turnover, active sector and active 5 Maximum two-way turnover was set to 30% per month
6 Maximum active sector weight of 4%

8
stock weights constrained7. Of course there are infinite scenarios possible, but we believed this set, based on realistic constraints, provided good insight into the benefits of using the custom risk model, while highlighting the efficacy of HOLT’s proprietary alpha signals. The benchmark we used was the Russell Global Developed Index.
Our tests produced the results we expected. Compared with the standard model, using the custom risk model produced realized risk that was closer to target and had lower model bias, information ratios that were 10%-30% higher, and attribution that showed significant contribution and information ratios from all of the alpha factors, as well as from the combination of factors.
As readers might have discerned from the alpha components chart above, the HOLT alpha model produced successful portfolios over our test period, but the results improved when the risk model factors were aligned with the alpha factors.
More Efficient Portfolios
A custom risk model recognizes all the risks inherent in a manager’s particular process including correlations between alpha model factors. This information identifies hedging opportunities between the factors. Therefore, a portfolio built using a custom risk model should be more efficient—that is, produce a better return per unit of risk—than one built using a standard model.
Many managers use constraints as a tool to potentially prevent the negative effects of misalignment from manifesting itself in the portfolio. While some may expect that constraints are likely an easier implementation approach to addressing such problems, we believe that the key to creating the most efficient portfolio is to ensure that the proper risk-return tradeoff is implemented. Therefore, we believe the best approach is to return to the unconstrained problem, identify the true impact of alpha factors, and then layer only the necessary constraints from that point forward. Constraints may address the problem of misalignment, but they are accompanied by a loss of alpha. If the risk model is correcting the alignment problem, it will reflect a more appropriate amount of systematic risk in the factors. The portfolio construction research can then be focused on ensuring the desired exposures are present. Of course, many constraints are institutionally required (long-only, maximum asset weights, choice of a specific benchmark, etc.). Our tests below (Figures 2-4) start with the long-only case against a specific benchmark, but we also examine the results incorporating some common required constraints.
As we noted, we ran a series of backtests to compare the results of an optimized portfolio using a risk model customized to HOLT’s alpha and risk factors to those derived from a process that used the same alpha model but a standard risk model (Axioma’s Medium-Horizon Worldwide model). Using the Russell Global Developed Index, we looked at the impact across nine levels of tracking error (evenly spaced from 1.5% to 5.0%). Across the tracking error spectrum we found that portfolios constructed using the 7 Maximum active stock weight of 2%

9
custom risk model produced a higher information ratio than those created with the standard risk model. We also looked at the impact of successively added constraints, starting with the only constraints being long-only and fully invested. Unconstrained, the portfolio at frontier point 7 (4.1% maximum tracking error), for example, had a CRM information ratio of 0.78, 25% higher than the 0.63 information ratio from the standard-model portfolio. The custom (standard) model realized active risk was 5.01% (5.77%), the CRM portfolio had more names (an average of 230 vs. 168), and roughly equivalent turnover (56% vs. 53%)8.
When we limited turnover to 30%, the IR from the standard model actually improved slightly at some of the frontier points (relative to the unconstrained portfolio), while the IR using the CRM slightly deteriorated. However, at all points the CRM produced higher IRs than the standard model, with the improvement ranging from 18% (at point 7 of the frontier) to 39% at the lowest level of tracking error. Adding a sector constraint marginally improved some of the IRs for both models, but the custom model still dominated. Finally, the addition of an active asset-level constraint led to the lowest average improvement in IR for the custom versus standard models, but the improvements were still impressive, ranging from 11% in the higher end of the tracking error range to 35% for the lowest tracking error point on the frontier. Looked at another way, in Figure 4 we see that at almost every level of risk the portfolio constructed with the custom risk model had a higher active return than that of the standard risk model. Note that this chart uses ex-ante tracking error levels as the basis for comparison. If we look at information ratios for frontier points with similar levels of realized risk, we find that there was still an improvement, but the magnitude was lower. For example, comparing the most-constrained portfolio frontier point 8 for the standard model with frontier point 9 for the custom model (realized risk of 5.48% and 5.35%, respectively) we see the improvement in IR was about 3.5%.
Note that the tests did not include any transaction cost variables other than turnover. However, since the two risk models produced similar turnover (even unconstrained) the impact of transactions costs should have been quite similar for each portfolio. Thus, while realized active returns would probably be lower, conclusions about the differences between the custom risk model and standard model results still hold.
8 Please contact you Axioma representative for the full set of test results.

10
Figure 2. Realized Information Ratios, Unconstrained Portfolios
Source: Credit Suisse HOLT, Axioma Inc.
Figure 3. Difference in Information Ratio, Custom Minus Standard
Source: Credit Suisse HOLT, Axioma Inc.
0.0
0.2
0.4
0.6
0.8
1.0
1.2
1 (1.5%) 2 3 4 5 6 7 8 9 (5%)Frontier Point
Standard Custom
0%
5%
10%
15%
20%
25%
30%
35%
40%
45%
1 (1.5%) 2 3 4 5 6 7 8 9 (5%)Frontier Point
Unconstrained Turnover
Turnover and Sector Turnover, Sector and Asset

11
Figure 4. Realized Risk Versus Return
Source: Credit Suisse HOLT, Axioma Inc.
One objection to the use of custom risk models is that because a factor has gone from seemingly “risk free” to having risk, the optimizer will necessarily reduce exposure to the factor or to alpha as a whole. However, we observed the CRM portfolio9 did not have consistently lower exposure to alpha than the standard model portfolio (Figure 5 & 6). Some of the time the CRM had higher alpha and some of the time it was lower. On average the CRM had a slightly lower alpha. In other words, the CRMs produced portfolios that were more efficient without sacrificing alpha.
9 Here we are comparing two portfolios with similar realized risk- point 4 for the custom risk model and point 3 for the standard model portfolios.
1.0%1.5%2.0%2.5%3.0%3.5%4.0%4.5%
1% 3% 5% 7%
Real
ized
Act
ive
Retu
rn
Realized Active Risk
Unconstrained
1.0%
1.5%
2.0%
2.5%
3.0%
3.5%
4.0%
1% 3% 5% 7%
Real
ized
Act
ive
Retu
rn
Realized Active Risk
Turnover Constraint
1.0%
1.5%
2.0%
2.5%
3.0%
3.5%
4.0%
1% 3% 5% 7%
Real
ized
Act
ive
Retu
rn
Realized Active Risk
Turnover and Sector Constraint
1.0%
1.5%
2.0%
2.5%
3.0%
3.5%
4.0%
1% 3% 5% 7%
Real
ized
Act
ive
Retu
rn
Realized Active Risk
Turnover, Sector, Asset Constraint

12
When we looked at the individual alpha components we found that their allocation was somewhat different in our two sample portfolios. Figure 6 compares the factor volatility estimated by the CRM for each factor through time with the difference in exposure to the factor (CRM minus standard model). We note that HOLT Value’s exposure was lower in the CRM portfolio, but HOLT Momentum generally had a higher exposure. The relative exposure of HOLT Quality varied, but on average was higher in the CRM portfolio. Axioma’s Momentum factor (WW Momentum) was the only factor that appeared in both risk models, but it had consistently higher weight in the CRM portfolio.
We also note that the magnitude of the difference in weight in general varied with overall factor risk. The custom risk model recognized the factor risk, and therefore had lower weight relative to the standard model when risk was higher—exactly the behavior we would expect. Although the exposure to value was lower in the CRM portfolio, we will show later that HOLT Value’s contribution to return was the same for both portfolios, suggesting that the risk model did a good job of getting the CRM portfolio into and out of the factor.
Figure 5. Alpha Exposure and Difference in Exposure, CRM Portfolio vs. Standard Model Portfolio
Source: Credit Suisse HOLT, Axioma Inc.
-0.20.00.20.40.60.81.01.21.41.6
2000 2001 2002 2003 2004 2005 2006 2007 2008 2009 2010 2011 2012
Alpha - CRM Alpha - Standard Difference

13
Figure 6. Exposure Difference (CRM – Standard) vs. Factor Risk
Source: Credit Suisse HOLT, Axioma Inc.
More Accurate Risk Forecasts
Another advantage to using a custom risk model is the superior accuracy attained by a model that fully recognizes the risks inherent in a particular investment process. A standard model may not be able to recognize the risk in an alpha factor, whether it is correlated with or is orthogonal to the risk model factors. Since the risk model “sees” the factor as risk-free and the alpha model sees it as a source of return, the construction processes will load up on that factor, which is, of course, not actually risk free. Therefore, realized risk is likely to be higher than the optimization target. Some risk model users attack this issue with a relatively blunt instrument—if they expect that the model under-predicts risk by 20%, they will set their target 20% lower, with the hope of realizing the desired level of risk. Without knowing what underlies that 20% average under-prediction, the manager may not get the desired overall result and may not be efficiently allocating the risk budget. Others follow a “belt and suspenders” approach, whereby they add constraints to ensure risk will not exceed desired levels. However, the more constrained the problem the less the optimizer is able to reach the best risk-return tradeoff, and alpha
-1.0
-0.5
0.0
0.5
0.0%
1.0%
2.0%
3.0%
4.0%
5.0%
2000 2002 2004 2006 2008 2010 2012
HOLT Value
-1.0
-0.5
0.0
0.5
0.0%0.5%1.0%1.5%2.0%2.5%3.0%3.5%
2000 2002 2004 2006 2008 2010 2012
HOLT Quality
-1.0
-0.5
0.0
0.5
0.0%
0.5%
1.0%
1.5%
2.0%
2.5%
2000 2002 2004 2006 2008 2010 2012
HOLT Momentum
-1.0
-0.5
0.0
0.5
0.0%1.0%2.0%3.0%4.0%5.0%6.0%7.0%
2000 2002 2004 2006 2008 2010 2012
WW Momentum

14
may not be reflected in the portfolio holdings. In other words, the constraints define the solution rather than the alpha model.
In contrast, a custom risk model recognizes the risk in each factor underlying the investment process. It can therefore allow the manager to wisely spend the risk budget on those bets he or she believes will pay off, while simultaneously avoiding other common risks. To the extent that one factor may hedge another, the optimizer may be able to take bigger exposures to both factors, thus enhancing return without impacting risk. The net effect should be a more efficient allocation of the risk budget and realized risk that is closer to the target. The best way to measure the improved effectiveness of the CRM is to create an unconstrained or lightly constrained portfolio.
A bias statistic compares actual (active) returns to predicted (active) risk10. A bias statistic of 1.00 means the volatility of returns was exactly what would have been expected, given the target tracking error. A bias statistic greater than 1.00 means the actual risk was higher than predicted (in other words, the model under-predicted risk), whereas a value below 1.00 means the model over-predicted risk. We divided our test period into four “risk regime” slices: the relatively high-risk environments that prevailed in 2000-2003 and again in 2007-2010, and the lower risk environments of 2004-2006 and 2011-201211.
In Figure 7 we see that the standard Worldwide model under-predicted active risk for most points along our tracking error frontier from 2004 to 2012, and therefore for the full test period, as well. The model was relatively accurate at the beginning of our test period, but the under-prediction was particularly notable during the years of the financial crisis.
In contrast, the custom risk model was unbiased during the 2000-2003 and 2011-2012 regimes. And although it under-predicted risk from 2007 to 2010, the magnitude of under-prediction was much lower than it was using the standard model.
In this discussion we do not mean to imply that the standard model is “bad”. Even the “gold standard” Axioma World Wide Risk Model will under-predict risk during optimization when the alpha model contains factors that are not aligned with the risk model.
10 We compare the actual daily return to the daily expected tracking error each day. The bias statistic is the standard deviation of the difference. The shaded areas in the table highlight those observations that are outside the 95% confidence interval. For more information see Axioma Research Paper No. 12, “How To Evaluate a Risk Model”, September 2008. 11 The range is a function of the number of observations, so the shorter time periods had a higher threshold for determining if the model was biased.

15
Figure 7. Active Risk Bias Statistics Standard vs. Custom Model
Source: Credit Suisse HOLT, Axioma Inc.
Better Attribution and Understanding of Returns
We have established that using a CRM for portfolio construction results in better realized information ratios. However, whether you believe in using a custom model during portfolio construction or not, using a custom risk model for performance attribution should become an essential tool for any investment process that relies on the use of factors; the attribution allows us to see the true sources of that performance.
0.6
0.8
1.0
1.2
1.4
1.6
1.8
2.0
1 (1.5%) 3 5 7 9 (5%)
2000-2003
0.6
0.8
1.0
1.2
1.4
1.6
1.8
2.0
1 (1.5%) 3 5 7 9 (5%)
2004-2006
0.6
0.8
1.0
1.2
1.4
1.6
1.8
2.0
1 (1.5%) 3 5 7 9 (5%)
2007-2010
0.6
0.8
1.0
1.2
1.4
1.6
1.8
2.0
1 (1.5%) 3 5 7 9 (5%)
2011-2012

16
A custom risk model allows users to directly attribute returns to their alpha factors. In Table 4 we show the attribution for “point 4” of the custom risk model portfolio with turnover, sector and asset constraints (our most constrained version)12. We have divided the style contributions into those included in our alpha factors and other risk factors. Most of the excess return from the CRM portfolio came from exposures to the custom style factors, and those results were statistically significant. Specific return offset the factors to a small extent, as did a slight small-cap bias, and most notably a small positive exposure to Axioma’s Volatility factor. Contributions from country, industry, currency and market were all minimal.
Table 4. Annualized Attribution Results for Custom Risk Model Portfolio “Point 4”, January 2000 to January 2013
Source of Return Con-
tribution Avg
Exposure Hit
Rate Risk IR T-Stat Portfolio 6.65% 18.36% Benchmark 3.54% 16.93% Active 3.11% 3.44% 0.90 3.26 Specific Return -0.94% 2.24% -0.42 -1.52 Alpha Factors Medium-Term Mom 1.33% 0.28 71.2% 1.08% 1.23 4.42 HOLT Momentum 0.65% 0.54 59.0% 0.56% 1.16 4.17 HOLT Quality 0.68% 1.21 63.5% 0.64% 1.06 3.81 HOLT Value 2.52% 1.38 73.7% 1.16% 2.17 7.81 Risk Factors
HOLT Growth -0.55% 0.66 48.7% 1.24% -0.45 -1.62 HOLT Leverage -0.13% -0.20 36.5% 0.55% -0.23 -0.82 Exch Rate Sensitivity -0.03% 0.05 45.5% 0.15% -0.21 -0.75 Liquidity 0.02% 0.03 42.9% 0.16% 0.13 0.46 Size 0.67% -0.28 57.7% 1.14% 0.59 2.13 Volatility -1.06% 0.13 38.5% 0.75% -1.42 -5.13
Source: Credit Suisse HOLT, Axioma Inc.
In Table 5 we compare the summary attribution results for two of our scenarios with almost identical realized tracking error of 3.4%—point 4 from the custom risk model portfolio frontier and point 3 from the standard model frontier (the same two portfolios we detailed earlier). We ran attribution using the custom factors for both portfolios, as well as standard attribution for the portfolio constructed using the standard model. Large differences in the contributions from alpha and risk factors were evident. Using
12 Note that this attribution is based on our methodology of “Adjusted Factor-Based Performance Attribution” which will be described in a forthcoming paper.

17
the custom risk model for attribution highlights the major contribution from the alpha factors, not only for the CRM portfolio but for the standard portfolio as well. Country, Industry, currency and market contributions were comparable across our three scenarios. When we evaluated the standard portfolio using the standard model, we were not able to see the impact of the alpha factors, with the exception of Axioma’s Medium-Term Momentum, which was the only factor in both the alpha and risk models. Some of the excess return was now attributable to “specific return” (which moved from negative to positive), and industry contribution was higher, but most was attributed to “risk factors”.
Table 5. Top-Line Contribution Comparison
Optimization Model/Attribution Model
Source of Return CRM/CRM WW/CRM WW/WW Active Return 3.11% 2.67% 2.67% Specific Return -0.94% -0.70% 0.51% Factor Contribution 4.05% 3.37% 2.16% Alpha Factors 5.17% 4.06% 0.50% Risk Factors -1.08% -0.79% 1.33% Country 0.16% 0.14% 0.18% Industry 0.01% 0.15% 0.32% Currency -0.22% -0.18% -0.17% Market 0.01% 0.00% 0.01%
Source: Credit Suisse HOLT, Axioma Inc.
In Table 6 we drilled down further to determine the impact of individual factors. We already noted the strong performance of HOLT’s alpha factors. Using the CRM for attribution we can see their contribution to our standard portfolio as well (although HOLT Momentum did not contribute very much, likely the result of being absent from the risk model used in optimization). However, we cannot get any sense of the contribution of our alpha factors (except Axioma’s Momentum factor) without using the custom model for attribution.

18
Table 6. Style Factor Breakdown
Optimization Model/Attribution Model
Source of Return CRM/CRM WW/CRM WW/WW Factor Contribution 4.05% 3.37% 2.16% Alpha Factors 5.17% 4.06% 0.50% Medium-Term Momentum 1.33% 0.72% 0.50% HOLT Momentum 0.65% 0.14% -- HOLT Quality 0.68% 0.62% -- HOLT Value 2.52% 2.57% -- Risk Factors -1.08% -0.79% 1.33% HOLT Growth -0.55% -0.42% -- HOLT Leverage -0.13% -0.06% -- Exchange Rate Sensitivity -0.03% -0.06% -0.03% Liquidity 0.02% -0.09% -0.08% Size 0.67% 0.56% 0.18% Volatility -1.06% -0.72% -0.78% Axioma Growth -- -- 0.65% Leverage -- -- 0.16% Short-Term Momentum -- -- 0.35% Value -- -- 0.87%
Source: Credit Suisse HOLT, Axioma Inc.
To gauge the consistency of factor contributions, we plotted the cumulative contribution from the HOLT alpha factors in aggregate, along with the cumulative contribution (actually detraction) from the risk factors. We know each factor performed well, but the combination of factors—the alpha driving returns—was notable in its consistency (Figure 8). In fact, summing the contributions from the alpha components yielded an information ratio for the contribution from alpha of 4.1, far higher than any of the individual components.

19
Figure 8. Cumulative Contribution From HOLT Alpha Factors
Source: Credit Suisse HOLT, Axioma Inc.
Finally, we examined the consistency of contribution from the alpha factors. As we saw in Table 3, each alpha factor produced a statistically significant information ratio; these charts illustrate the evolution of the IR through time. Overall, the contribution from the sum of the alpha factors was extremely steady through time. The factors did a good job of offsetting each other. For example, when WW Momentum struggled in 2009, Quality kicked in and kept performance steady. Also notable was the negative return from risk factors after 2006. This was largely the result of a positive exposure to Volatility at a time when low volatility stocks were faring much better than high volatility stocks.
-40%
-20%
0%
20%
40%
60%
80%
100%
120%
140%
2000 2002 2004 2006 2008 2010 2012
Alpha Factors Risk Factors
-10%
0%
10%
20%
30%
40%
50%
60%
70%
2000 2002 2004 2006 2008 2010 2012HOLT Value HOLT QualityHOLT Momentum WW Momentum

20
Conclusion
In this study we set out to show the benefits of creating portfolios with custom risk models, using a well-known and highly regarded third-party set of factors. Our empirical results highlighted and validated four key points:
1. A custom risk model is a useful tool to validate the efficacy of factors going into a model. The methodology allows users to look beyond univariate tests, such as quintile spreads and multivariate regression-based returns, to fully understand factor returns as they will be used in practice: combined with a risk model.
2. A custom risk model can create portfolios that are more efficient—that is, produce better information ratios. At the same time the custom risk model did not significantly impact the portfolios’ exposure to alpha. Although we have only shown the results based on one particular set of factors here, our experience working with custom models indicates that most model builders see a better risk-return tradeoff using a custom risk model.
3. A custom risk model should do a better job of forecasting risk than a standard model, because it recognizes the risks associated with each factor in a manager’s process, and therefore does not ignore sources of risk or assume there is a risk-free source of return. At the same time, we do not dispute the value of using a standard risk model to measure and manage a portfolio’s financial risk. We do believe, however, that managers and their clients will be better served using a risk model that is unique to their process.
4. Using a custom risk model for attribution allows a manager to understand more fully what is driving a portfolio’s returns, by identifying all of the relevant exposures and determining their impact.
We believe that we were not only able to prove all four of these points, but also to highlight the value that can be derived from using HOLT’s factors in an investment process, especially when they were combined into an alpha score. These results are easily replicable by our joint clients.

21
Appendix 1: HOLT Model Description
What is HOLT?
HOLT is a value-based, return on capital framework proprietary to Credit Suisse. HOLT provides an objective view of over 20,000 companies worldwide using a rigorous methodology that examines accounting information, converts it to cash and then values that cash, allowing investors to survey the entire corporate capital structure and identify key drivers of value. HOLT uses this valuation and corporate performance framework to help institutional investors across the entire investment process, from idea generation and company analysis to portfolio construction and risk management. The HOLT framework covers over 20,000 companies in 65 countries.
The Market Values Firms on Expected Cash Flows
Accounting data misrepresents the underlying economics of business activities due to the distortions found in traditional accounting measures of performance. Having uncovered a number of accounting distortions over time, HOLT converts reported income statement and balance sheet information into a cash-based measure of performance more closely approximating the underlying economics of the business. Therefore, cash flows generated from true economic activities, which can be measured by HOLT’s cash flow return metric (CFROI®), are a superior measure of economic performance. With these improvements, we can more effectively estimate a firm’s value from levels of and changes in CFROI and life-cycle patterns, operating assets, reinvestment rates and discount rates.
Key HOLT Accounting Adjustments
Sample accounting issues for which we make adjustments include: inflation, financing and capital structure decisions (including financial subsidiaries and operating leases), depreciation methods, treatment of non-operating investments, revaluation of assets, write-downs/write-offs, R&D capitalization, special items, inventory valuation methods, acquisition goodwill, fair-value markup to acquired plant, pensions, special reserves, stock compensation expense, and regional- and industry-specific conventions. Our adjustments improve performance comparisons important to valuation and investment decision making by providing comparability across time, among companies (peers) and across international borders.

22
CFROI as a Proxy for Economic Return
HOLT’s CFROI (Cash Flow Return On Investment) is an estimated real ROI. CFROI approximates the average real ROIs being achieved on the firm’s ongoing projects by converting the income statement and balance sheet into a CFROI, which can then be used as a proxy for the firm’s economic return.
CFROI is calculated by comparing the inflation-adjusted gross cash flows available to all capital owners are measured and compared to the inflation-adjusted gross investment made by the capital owners. This ratio is then translated into an IRR by recognizing the finite economic life of depreciating assets and the residual value of non-depreciating assets, such as land and working capital. As a percent-per-year IRR, this CFROI approximates the economic return produced by the firm’s projects and can be directly compared against the return investors demand (i.e., the firm’s discount rate, or cost of capital) in order to gauge if the firm is creating or destroying economic wealth.
The HOLT Valuation Model
The Credit Suisse HOLT valuation model is a type of discounted cash flow model. Among our model’s distinguishing features, is the way by which the forecasted stream of net cash receipts (NCRs) is generated and the method by which the firm’s discount rate (DR) is estimated.
From a beginning asset base, the forecasted NCR stream is derived from inputs that actually generate cash flows – namely, economic returns (CFROI), reinvestment rates (growth), and their expected patterns of change over time due to competition (fade). The path of a firm’s forecasted NCR stream is based on a company specific life-cycle framework, which forecasts baseline long-term patterns of change in economic returns (CFROI) and growth (reinvestment rates), using empirical research on how thousands of companies with similar characteristics have performed in the past.
The discount rate is the rate of return investors demand for making their funds available to the firm. Consistent with CFROI, DRs used in our model are real rates, not nominal rates. Also, consistent with our model, base DRs are mathematically derived from known market values and from NCR streams. Adjustments (positive or negative) to the base rate are made for company-specific leverage and liquidity characteristics.
HOLT’s default model assigns each company a warranted valuation based on the forecasts of net cash receipts and the company specific discount rate.
HOLT Alpha Factors
Using these principles, HOLT created three alpha factors along the HOLT Valuation, HOLT Quality, and HOLT Momentum axes. Each of these factors is derived from the adjusted income statement and balance sheet data used by HOLT to calculate CFROI. In particular, HOLT Quality is a combination of the level and change in cash flows relative to the market derived cost of capital for each firm. HOLT

23
Momentum is primarily based on the change in the near-term forecasted CFROI as consensus EPS changes. HOLT Valuation provides the fundamental attractiveness of the company based on the HOLT Discounted Cash Flow Model and HOLT multiples. In addition to the primary alpha factors, HOLT Leverage is the Leverage at Market variable (Market value of debt includes off B/S debt items), while HOLT Growth comprises CFROI Change (Forecast CFROI less trailing historical CFROI) and Normalized Growth Rate Used in Valuation (HOLT real asset growth forecast).HOLT Valuation
HOLT Valuation consists of four factors: (1) Percent Change to Warranted Value (2) HOLT Economic P/E (3) HOLT Value/Cost (4) Market Implied Discount Rate. Percent Change to Warranted Value is derived from HOLT’s DCF Warranted Price relative to the current trading price. HOLT Price / Earnings is conceptually similar to traditional PE, and is calculated as the HOLT Value/Cost ratio divided by the forecasted CFROI. HOLT Value/Cost ratio is conceptually similar to a Price to Book ratio. It indicates the degree to which the market value of the company's total outstanding equity and debt is higher (lower) than cost of the company's investment in operating assets (representing its portfolio of projects). The numerator is the market value of Equity (inclusive of minority interest) plus of our Total Debt estimate (inclusive of debt equivalents), and the denominator is our inflation-adjusted net asset amount plus 3 years of capitalized research and development expenditures. Market Implied Discount Rate is a real, market-implied cost of capital calculated from the CFROI valuation model. It is dependent on CFROI fade rate and sustainable growth rate assumptions inherent in the Net Cash Receipt (NCR) forecasts that drive valuation. It is a forward-looking cost of capital that equates the NCR forecasts with current market price.
HOLT Quality
HOLT Quality consists of two factors: (1) CFROI and (2) Change in Value Creation. CFROI is the Cash Flow Return on Investment for the last fiscal year. Change in Value Creation measures the change in economic profit over the last two years. Economic profit is defined as CFROI minus the HOLT Discount Rate multiplied by the asset base. Companies that improve value creation score well (high scores are better).
HOLT Momentum
HOLT Momentum consists of one factor: CFROI Momentum. CFROI momentum measures the impact on the CFROI from a change in the consensus earnings estimates from one period to the next. The CFROI momentum measure refers to this 13-week change in either CFROI (FY1) or CFROI (FY2) depending on the time elapsed from fiscal year-end.
HOLT Leverage
HOLT Leverage is the Leverage at Market. Leverage at Market includes debt attributed to leased property but excludes the net economic pension and post-retirement liabilities.
24
HOLT Growth
HOLT Growth comprises (1) CFROI Change and (2) Normalized Growth Rate Used in Valuation. CFROI Change identifies those companies expected to have a large change in profitability (in either direction) in the next year. The variable is calculated as forecasted CFROI FY1 minus the three year trailing median CFROI. Normalized Growth Rate Used in Valuation (FY5) is the potential growth in gross investment based on normalized cash flows available to the firm and management's capital structure decisions. This variable is a forecast for the growth in gross investment and, together with a specified series of CFROI and discount rates, determines the value of future investments.
CFROI is a registered trademark of Credit Suisse Group AG or its affiliates in the United States and other countries.
HOLT is a corporate performance and valuation advisory service of Credit Suisse.
© 2013 Credit Suisse Group AG and its subsidiaries and affiliates. All rights reserved.


![DRAFT - Axioma...DRAFT Stress Testing using Factor Risk Models in Axioma Portfolio Analytics [t b;t e].The most obvious way of conducting stress testing is to simply apply the historical](https://img.pdfslide.us/doc/110x75/5ec53479019a9440661e9779/draft-axioma-draft-stress-testing-using-factor-risk-models-in-axioma-portfolio.jpg)