Embed Size (px)
Citation preview

Enhancing the Data Supply Chain
Fourth Plenary
Chair: Dan Pollock, MD
9:00 AM – 10:15 AM

2012 HAI Data Summit
Key Question Addressed
2. With increasing adoption of electronic health record systems and advances in information technology for detecting and reporting HAIs and collecting and submitting closely related data, what actions need to be initiated or intensified to assure that the data supply chain is as fully developed and widely used as possible, produces data that are valid, and meets prevention, public reporting, and payment purposes?

EHR Adoption in the U.S.:
From Meaningful Questions to Tides
David R. Hunt, MD, FACS
Medical Director, Office of Provider Adoption & Support
HHS Office of the National Coordinator for Health IT

2012 HAI Data Summit John Donne 1532-1631
No man is an island entire of itself; every man is a piece of the continent, a part of the main…
Oscar Björck (1860 – 1929) “Boat on Shore”
…any man's death diminishes me, because I am involved in mankind. And therefore never send to know for whom the bell tolls; it tolls for thee.
Meditations 17

2012 HAI Data Summit Year Hospitals Intend to Apply for Meaningful Use

2012 HAI Data Summit
Hospital EHR Adoption Nationally and in Kansas
Data Source AHA Hospital Survey

2012 HAI Data Summit
Source: NAMCS, 2008-10 *Rural = Non-metropolitan, rural estimates not shown for 2008 because relative standard error >30%

2012 HAI Data Summit State EHR Adoption: Higher or Lower than National Average

2012 HAI Data Summit William Osler, M.D. (1849 – 1919)

2012 HAI Data Summit Who RECs Are Helping
Over 120,000 providers:
≈ 40% of all PCPs in US ≈ 70% of all rural providers ≈ 70% of FQHCs *Not shown: 10,000+ specialists
http://dashboard.healthIT.gov
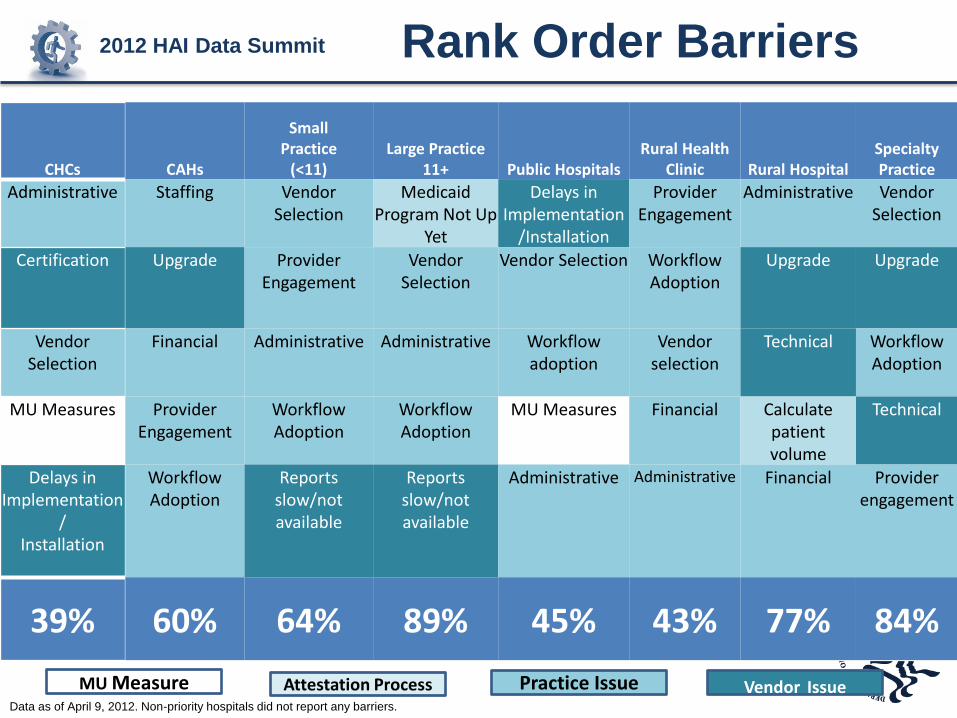
2012 HAI Data Summit Rank Order Barriers
CHCs CAHs
Small Practice
(<11) Large Practice
11+ Public Hospitals Rural Health
Clinic Rural Hospital Specialty Practice
Administrative Staffing Vendor Selection
Medicaid Program Not Up
Yet
Delays in Implementation
/Installation
Provider Engagement
Administrative Vendor Selection
Certification Upgrade Provider Engagement
Vendor Selection
Vendor Selection Workflow Adoption
Upgrade Upgrade
Vendor Selection
Financial Administrative Administrative Workflow adoption
Vendor selection
Technical Workflow Adoption
MU Measures Provider Engagement
Workflow Adoption
Workflow Adoption
MU Measures Financial Calculate patient volume
Technical
Delays in Implementation
/ Installation
Workflow Adoption
Reports slow/not available
Reports slow/not available
Administrative Administrative Financial Provider engagement
39% 60% 64% 89% 45% 43% 77% 84%
MU Measure Attestation Process Practice Issue Vendor Issue Data as of April 9, 2012. Non-priority hospitals did not report any barriers.

2012 HAI Data Summit Support Beyond Implementation
Primary goal: Give providers as much
support as possible
1 Plan:
• Conduct readiness assessment
• Identify tools needed for change (i.e. EHR system, workflow changes, etc)
2 Transition:
• Redesign practice workflow
• Perform HIT education & training
3
Implement: • Provide technical assistance
• Partner with local stakeholders, HIEs
4 Operate & Maintain:
• Continuous quality improvement
• MU Stages 1,2,3
5 Improve Care Quality: • Assess ACO, PCMH
models
• Prepare for future pay for performance
• Empower patients in their own health care

2012 HAI Data Summit
• RECs are currently working on over 190 different programs to help providers meet the Three-Part Aim goals
* As reported by 53 out of 62 RECs. Some REC are working on several different Three-Part Aim Programs.

2012 HAI Data Summit
Nutrition Health
Literacy
Education
Medical Education
Quality
Payment Reform
Comparative Effectiveness
Research
Basic Science Research
Clinical Research
Meaningful Use of EHRs
Prevention & Chronic Disease
Management
Public Heath
Individual Responsibility
•Improved individual and population health outcomes
•Increased transparency and efficiency
•Improved ability to study and improve care delivery

2012 HAI Data Summit
And therefore never send to know for whom the bell tolls…
Oscar Björck (1860 – 1929) “Boat on Shore” c. 1885 oil on canvas

2012 HAI Data Summit
http://healthit.hhs.gov

EHR Systems Configuration to
Automatically Produce HAI Data to
CDC’s NHSN Marc-Oliver Wright, MT(ASCP), MS, CIC
Director of Infection Control
NorthShore University HealthSystem

2012 HAI Data Summit “The Web of Surveillance” at
NorthShore
Tranquil Gardens Nursing Home
Home Care
Acute Care Facility (4)
Outpatient/ Ambulatory Facility (>80)
Long Term Care Facility (future?)
Modified from the

2012 HAI Data Summit
Pros and Cons of EHR at NSUHS
• Communication throughout continuum of care
• In-house developed CDSS for QI
• Regulatory Compliance
• Expanded surveillance
• Research
• Communication (cut/paste)
• Regulatory compliance <> QI
• Overly dependent

2012 HAI Data Summit
EMR +/-
LIS, etc
Basic EDW Schematic
http://res.sys-con.com

2012 HAI Data Summit
High-Level Data in NorthShore’s EDW
• o Patient demographics • o Encounter • o Provider clinical diagnoses • o Problem list • o Provider info • o Reason for visit/chief complaint • o Medication schedule • o Medication administration • o Associated medication diagnoses • o Provider • o Current medications• o Order detail • o Discrete result detail • o Vitals information • o Specific list of measurements selected by users • o Admit / Discharge / Transfer
>700 Unique Data Categories

2012 HAI Data Summit
In the context
of Foley
catheter care
Practical Examples from NSUHS
• Automated device days
• System List
• Best Practice Alerts
• Exposure workup
• Syndromic surveillance
• Clinical decision support for MDRO surveillance
• Automated surveillance

2012 HAI Data Summit
Where ‘device days’ come from
• 1 person in ICU collecting data each day
– 30 sec/patient X 67 beds = 204 hrs per year
– Error potential, cost
• Error potential, cost

2012 HAI Data Summit

2012 HAI Data Summit
Denominator Data • Medical devices not limited to the
ICU.
• NHSN evaluating weekly prevalence and extrapolation; Hota et al found an algorithmic prediction from the EMR to be asaccurate as manual data collection
-Denominator simplification update. NHSN-eNews.2011; 6:1.
-Hota et al Infect Control Hosp Epidemiol. 2010 Jan;31(1):4-11.
- AJIC Jun;37(5):364-70 2009

2012 HAI Data Summit

2012 HAI Data Summit
The System List
• Some EMRs have customizable patients lists based on select criteria
– Patients with a Foley
– Patients at risk for a pressure ulcer
• Allows dedicated staff to monitor in real-time and intervene

2012 HAI Data Summit
Isolation System List

2012 HAI Data Summit
Foley System List• Unit-based list of
all patients with RN documented Foley
• Allows unit champion to review and intervene in real-time

2012 HAI Data Summit
Best Practice Alerts (BPAs)
• Automated rules based on decision algorithms of data entered into the EMR. When select criteria are met, an actionable alert or “pop up” appears to the EMR user.
• More effective alerts are – Timely
– Targeted
– Immediately actionable (link to an order)

2012 HAI Data Summit
BPA: Foley Orders
• Foley present without an order? BPA
• Foley present >48 hours? BPA

2012 HAI Data Summit
BPA Rules of Engagement
• Don’t confuse the user
• BPA Fatigue
– Click through
– X Out
• Avoid BPA fatigue by frequent reassessment of existing alerts and retiring those no longer needed.

2012 HAI Data Summit
Foley Experience Summary
• Automated device days allows organizational, facility and unit level data
• System lists decentralized authority and responsibility to the assigned individual
• BPAs engage and hold physicians accountable

2012 HAI Data Summit

2012 HAI Data Summit
Exposure Workup
• I have a patient with active pulmonary multi-drug resistant MTB who wasn’t in airborne precautions with potentially hundreds of workers exposed. How do I find them?
• I need every HCW who opened the patient’s Medical Record during the time of the exposure. – Audit trails

Filter on MRN, press “Run”
2012 HAI Data Summit

2012 HAI Data Summit
Exposure workup

2012 HAI Data Summit
Exposure Workup
• Used for communicable disease exposures
– From patients to healthcare workers
– From healthcare workers to patients
• ‘Exposure’ to recorded implants/devices
– Non-sterile bone putty packaging

2012 HAI Data Summit
Syndromic Surveillance Influenza Like Illness (ILI)
• Diagnosis codes are delimited and captured in the EMR
• We developed a query that looked for a combination of the following in outpatient or ED setting
– Fever
– Respiratory illness including cough, sore throat

2012 HAI Data Summit
From a Weekly Automated

2012 HAI Data Summit IL
I %
of
ou
tpati
en
t v
isit
s
0
2
4
6
8
10
12
1 3 5 7 9 11 13 15 17 19 21 23 25 27 29 31 33 35 37 39 41 43 45 47 49 51
ILI percentage by week
2007 % ILI
2008 % ILI
2009 %ILI
2012 HAI Data Summit
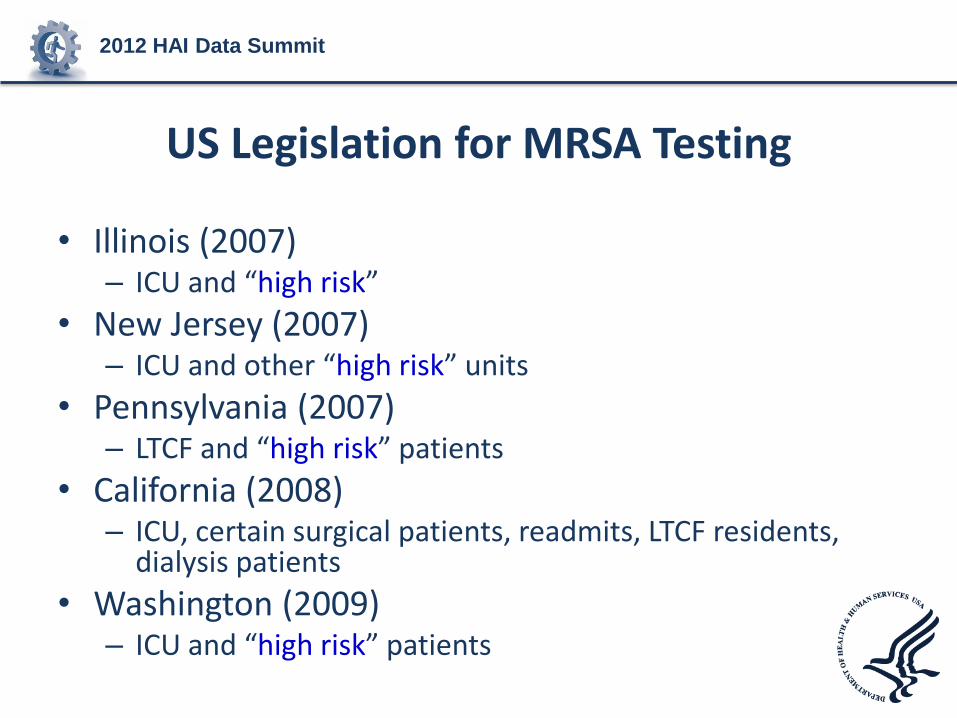
US Legislation for MRSA Testing
• Illinois (2007) – ICU and “high risk”
• New Jersey (2007) – ICU and other “high risk” units
• Pennsylvania (2007) – LTCF and “high risk” patients
• California (2008) – ICU, certain surgical patients, readmits, LTCF residents,
dialysis patients
• Washington (2009) – ICU and “high risk” patients

2012 HAI Data Summit
Background • MRSA surveillance programs are inefficient, and
false-positive tests are a concern
• Prediction rules have been proposed to allow targeted testing of high risk patient
– Furuno et al: “admission in the past year” – test 65% of patients and identify 76% of MRSA colonized-patients
– Harbarth et al: Hx of hospitalization, Abx, age – test ~60% of patients and detect 79% of all MRSA carriers
• Small added efficiency, must be done “manually”
Furuno JP, et al. Arch Intern Med 2006 March 13;166(5):580-5. Harbarth S, et al. J Am Coll Surg 2008 November;207(5):683-9.

2012 HAI Data Summit
Methods • Population
– 3 community-academic hospitals in Chicago suburbs, universal surveillance for MRSA using nasal swab
– Derivation cohort: all patients admitted and tested for MRSA colonization at Hospital 1 from April 19, 2007 through December 31, 2008 who were not known to be MRSA colonized previously
– Validation cohort: all patients admitted and MRSA-tested at Hospitals 2 and 3 during same period
• Microbiologic methods – qPCR with culture confirmation and lukF qPCR to detect PVL – Validation against PFGE for USA300: PPV 94.9%, NPV 100%
• Data collection – Electronic health record clinical data warehouse – Limited to variables available within first day of admission
Robicsek A et al. ICHE 2011 Jan;32(1):9-19.
2012 HAI Data Summit
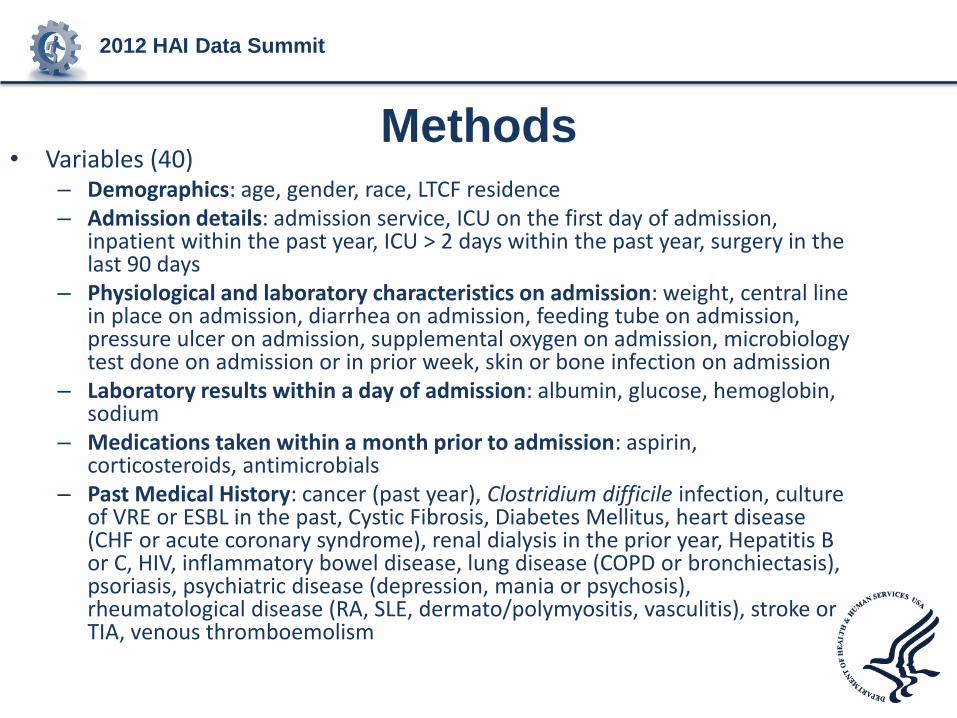
Methods • Variables (40)
– Demographics: age, gender, race, LTCF residence – Admission details: admission service, ICU on the first day of admission,
inpatient within the past year, ICU > 2 days within the past year, surgery in the last 90 days
– Physiological and laboratory characteristics on admission: weight, central line in place on admission, diarrhea on admission, feeding tube on admission, pressure ulcer on admission, supplemental oxygen on admission, microbiology test done on admission or in prior week, skin or bone infection on admission
– Laboratory results within a day of admission: albumin, glucose, hemoglobin, sodium
– Medications taken within a month prior to admission: aspirin, corticosteroids, antimicrobials
– Past Medical History: cancer (past year), Clostridium difficile infection, culture of VRE or ESBL in the past, Cystic Fibrosis, Diabetes Mellitus, heart disease (CHF or acute coronary syndrome), renal dialysis in the prior year, Hepatitis B or C, HIV, inflammatory bowel disease, lung disease (COPD or bronchiectasis), psoriasis, psychiatric disease (depression, mania or psychosis), rheumatological disease (RA, SLE, dermato/polymyositis, vasculitis), stroke or TIA, venous thromboemolism
2012 HAI Data Summit
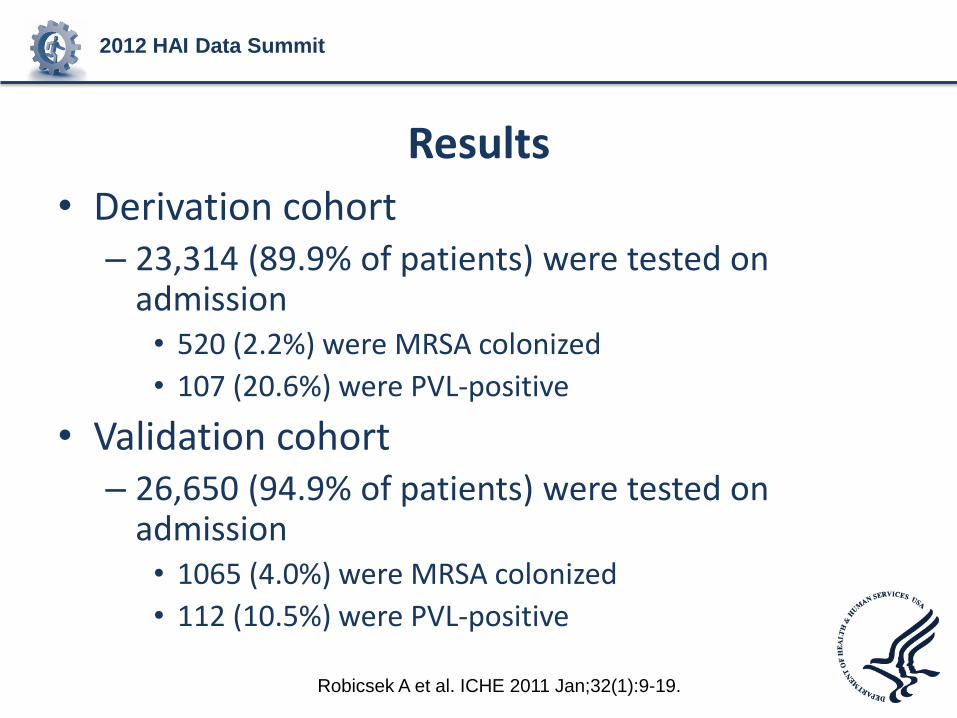
Results
• Derivation cohort – 23,314 (89.9% of patients) were tested on
admission • 520 (2.2%) were MRSA colonized
• 107 (20.6%) were PVL-positive
• Validation cohort – 26,650 (94.9% of patients) were tested on
admission • 1065 (4.0%) were MRSA colonized
• 112 (10.5%) were PVL-positive
Robicsek A et al. ICHE 2011 Jan;32(1):9-19.

Risk Factor
MRSA negative
n = 22794
MRSA positive
n = 520
Univariate analysis
Odds Ratio
95% Wald
Confidence Limits
P value
Parsimonious Multivariable Model
Odds Ratio
95% Wald
Confidence Limits
P value
Demographics
Age: mean (standard deviation), [OR per decade] • ■ * † 55.5 (21.4) 66.2 (21.8) 1.3 1.2, 1.3 <0.001 1.1 1.0, 1.2 0.005
Male (data missing on 3 patients) • ■ * † 7381 (32.4) 236 (45.4) 1.7 1.5, 2.1 <0.001 1.3 1.1, 1.6 0.004
Race (data missing on 3 patients) • ■ * † <0.001 <0.001
Black 2898 (12.7) 118 (22.7) 1.8 1.5, 2.3 1.9 1.5, 2.4
White (reference group) 14806 (65.0) 328 (63.1) 1.0 NA 1.0 NA
Other non-white race 5087 (22.3) 74 (14.2) 0.7 0.5, 0.8 1.0 0.8, 1.3
Nursing Home residence • ■ † ‡ 573 (2.5) 72 (13.8) 6.2 4.8, 8.1 <0.001 2.8 2.1, 3.7 <0.001
Admission details (current and recent)
Admission Service • ■ † <0.001 <0.001
Internal Medicine 10175 (44.6) 382 (73.5) 5.6 4.0, 7.8 2.2 1.4, 3.3
Obstetrics (reference group) 5658 (24.8) 38 (7.3) 1.0 NA 1.0 NA
Psychiatry 885 (3.9) 18 (3.5) 3.0 1.7, 5.3 2.4 1.3, 4.3
Surgery 6076 (26.7) 82 (15.8) 2.0 1.4, 3.0 1.2 0.8, 1.9
ICU on the first day of admission * 2067 (9.1) 56 (10.8) 1.2 0.9, 1.6 0.183
Inpatient within the past year • * ‡ 7442 (32.6) 250 (48.1) 1.9 1.6, 2.3 <0.001
ICU > 2 days within the past year • * 570 (2.5) 30 (5.8) 2.4 1.6, 3.5 <0.001
Surgery in the last 90 days † ‡ 2087 (9.2) 40 (7.7) 0.8 0.6, 1.1 0.253
Physiological and laboratory characteristics on admission
Weight < 50 kg 1167 (5.1) 35 (6.7) 1.3 0.9, 1.9 0.101
Central line in place on admission ‡ 244 (1.1) 10 (1.9) 1.8 1.0, 3.4 0.068
Diarrhea on admission • 426 (1.9) 18 (3.5) 1.9 1.2, 3.0 0.010
Feeding tube on admission • ■ † 275 (1.2) 26 (5.0) 4.3 2.9, 6.5 <0.001 2.4 1.5, 3.7 <0.001
Pressure ulcer on admission • ■ † 788 (3.5) 80 (15.4) 5.1 4.0, 6.5 <0.001 2.0 1.5, 2.7 <0.001
Supplemental oxygen on admission 14564 (63.9) 311 (59.8) 0.8 0.7, 1.0 0.056
Microbiology test done on admission or in prior week • ■ 8069 (35.4) 301 (57.9) 2.5 2.1, 3.0 <0.001 1.3 1.1, 1.6 0.008
Skin or bone infection on admission • ■ † 685 (3.0) 42 (8.1) 2.8 2.1, 3.9 <0.001 1.7 1.2, 2.3 0.004

Univariate analysis Parsimonious Multivariable ModelMRSA
negativeMRSA
positive 95% Wald 95% WaldRisk Factor
n = 22794 n = 520
Odds Ratio Confidence
Limits
P valueOdds Ratio Confidence
Limits
P value
Laboratory results within a day of admission
Albumin < 3 • * 2696 (11.8) 133 (25.6) 2.6 2.1, 3.1 <0.001
Glucose >= 23 • * 2170 (9.5) 93 (17.9) 2.1 1.6, 2.6 <0.001
Hemoglobin < 8.6 • ■ * 1367 (6.0) 59 (11.3) 2.0 1.5, 2.6 <0.001 1.5 1.1, 2 0.006
Sodium < 131 or > 143 • * 985 (4.3) 47 (9.0) 2.2 1.6, 3.0 <0.001
Medications taken within a month prior to admission
Aspirin 3837 (16.8) 97 (18.7) 1.1 0.9, 1.4 0.273
Corticosteroids (systemic) 2878 (12.6) 79 (15.2) 1.2 1.0, 1.6 0.082
Antimicrobials
Cephalosporins • ■ 2119 (9.3) 23 (4.4) 0.5 0.3, 0.7 <0.001 0.3 0.2, 0.4 <0.001
Fluoroquinolones • 2234 (9.8) 71 (13.7) 1.5 1.1, 1.9 0.004
MRSA-active antimicrobials 1922 (8.4) 48 (9.2) 1.1 0.8, 1.5 0.517
Other antimicrobials • ■ 4856 (21.3) 157 (30.2) 1.6 1.3, 1.9 <0.001 1.4 1.1, 1.7 0.003
Past Medical History
Cancer (visit to an affiliated oncology center in the past year) 1924 (8.4) 40 (7.7) 0.9 0.7, 1.3 0.544
Clostridium difficile infection 66 (0.3) 4 (0.8) 2.7 1.0, 7.4 0.058
Culture of VRE or ESBL in the past • 196 (0.9) 13 (2.5) 3.0 1.7, 5.2 <0.001
Cystic Fibrosis • ■ † 20 (0.1) 4 (0.8) 8.8 3.0, 25.9 <0.001 8.8 2.8, 27.7 <0.001
Diabetes Mellitus • 2912 (12.8) 108 (20.8) 1.8 1.4, 2.2 <0.001
Heart disease (CHF or acute coronary syndrome) • ■ † 1705 (7.5) 91 (17.5) 2.6 2.1, 3.3 <0.001 1.4 1.1, 1.8 0.006
Renal dialysis in the prior year • ‡ 735 (3.2) 31 (6.0) 1.9 1.3, 2.8 <0.001
Hepatitis B or C 162 (0.7) 4 (0.8) 1.1 0.4, 2.9 0.875
HIV infection 59 (0.3) 4 (0.8) 3.0 1.1, 8.3 0.035
Inflammatory bowel disease 343 (1.5) 7 (1.3) 0.9 0.4, 1.9 0.769
Lung disease (COPD or bronchiectasis) • ■ † 587 (2.6) 35 (6.7) 2.7 1.9, 3.9 <0.001 1.6 1.1, 2.4 0.010
Psoriasis 173 (0.8) 5 (1.0) 1.3 0.5, 3.1 0.600
Psychiatric disease (depression, mania or psychosis) 574 (2.5) 13 (2.5) 1.0 0.6, 1.7 0.979
Rheum. disease (RA, SLE, Dermato/polymyositis, vasculitis) 462 (2.0) 19 (3.7) 1.8 1.1, 2.9 0.011
Stroke or Transient Ischemic Attack • 865 (3.8) 34 (6.5) 1.8 1.2, 2.5 0.002
Venous thromboemolism • 844 (3.7) 37 (7.1) 2.0 1.4, 2.8 <0.001

2012 HAI Data Summit Final Model Predicted probability of MRSA = eLO / (1 + eLO) where LO = - 4.655
+ 0.083 x (Age/10) + 0.135(if Male) + 0.421(if Black or African-American†) - 0.229(if other, non-White race†) + 1.010(if Nursing Home Resident) + 0.267(if Admission Service‡ = Internal Medicine) + 0.421(if Admission Service‡ = Psychiatry) - 0.249(if Admission Service‡ = Surgery) + 0.006(if Inpatient within last year ) + 0.339(if ICU > 2 days within last year ) + 0.153(if Diarrhea on admission) + 0.780(if Feeding Tube on admission) + 0.663(if Pressure Ulcer on admission ) + 0.234(if Microbiology test done on admission or in prior week ) + 0.480(if Skin or Bone Infection on admission ) + 0.231(if Albumin < 3) + 0.245(if Glucose ≥ 23) + 0.355(if Hemoglobin < 8.6) + 0.133(if Sodium < 131 or > 143) - 1.409(if Cephalosporins in past month ) - 0.212(if Fluoroquinolones in past month ) + 0.316(if Other Antimicrobials in past month ) + 0.322(if Past VRE or ESBL) + 2.146(if Cystic Fibrosis) + 0.019(if Diabetes Mellitus) + 0.324(if Heart Disease) - 0.187(if Dialysis past year) + 0.479(if Lung Disease) - 0.135(if Stroke or TIA) + 0.175(if Venous Thromboemolism)

2012 HAI Data Summit


2012 HAI Data Summit
Logic
• Alert will “fire” if:
– Score is high enough (“magic number”) OR
– MRSA on problem list OR
– ICU admission (LAW) OR
– Last digit in Encounter Number is ‘0’ (random sample for ongoing model validation in the event of epidemiologic change)
2012 HAI Data Summit

2012 HAI Data Summit
Real-life prospective validation
• All patients admitted and MRSA tested in Sept-Nov 2011 (~8899 patients)
• Ranked patients by scoring and determined MRSA ‘capture’ at a spectrum of threshold
• Layered additional criteria into analysis

Prospective validation, Sept-Nov 2011
89%

148 tests/day 87 tests/day

2012 HAI Data Summit
MRSA CDSS Summary
• Leveraging EDW data from a universal surveillance program able to build a mathematical model that predicts ‘high risk’
• Built model into EHR for CDSS; tested in the background, captures ~90% of MRSA days while testing ~50% of patients
• Built ongoing random sampling to continually evaluate/update model as needed

2012 HAI Data Summit
Surveillance Assisted, Automated and Otherwise
• Infection preventionists spend the majority oftheir working hours on HAI surveillance
• Manual review subjective, prone to error and influence
• Automation has the potential to reduce error and time, freeing the IP to prevent

2012 HAI Data Summit
Courtesy of R. Olmsted

2012 HAI Data Summit
Acute Care
Facility Outpatient/ Ambulatory
Facility
Electronically Assisted Surveillance • 2001 Friedman and colleagues show that just having
an EMR caused their infection rate (via enhanced
case finding) to triple for TKA.
– 1.3 to 4.5 per 100 procedures (p<0.01)
– Facilitated post-discharge surveillance (outpatient visits)
Friedman C et al AJIC 2001;29(5)329-332
2012 HAI Data Summit
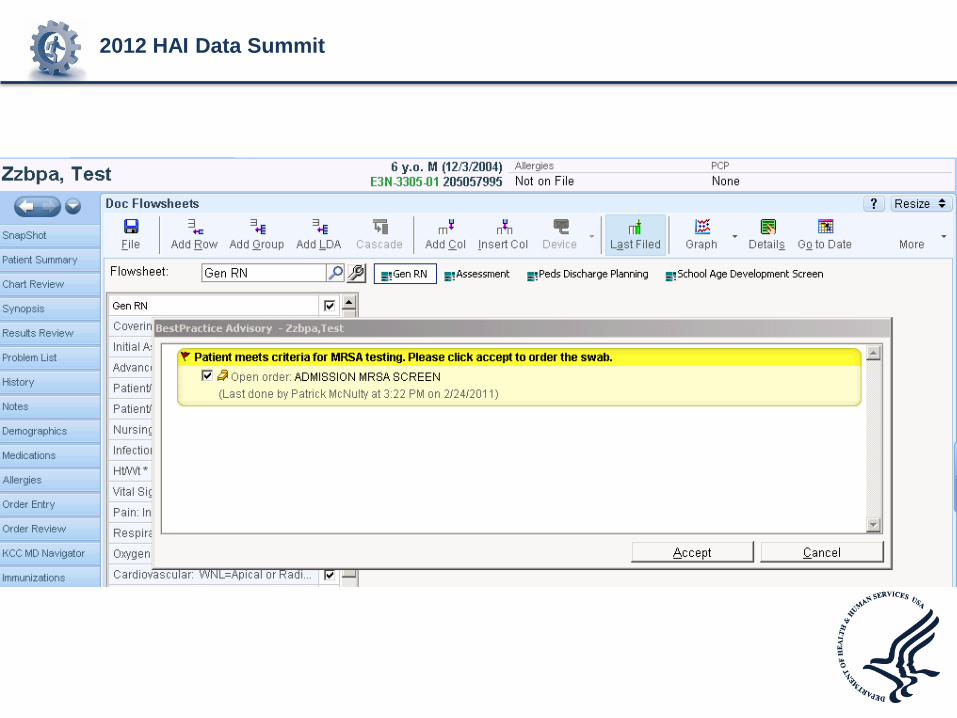
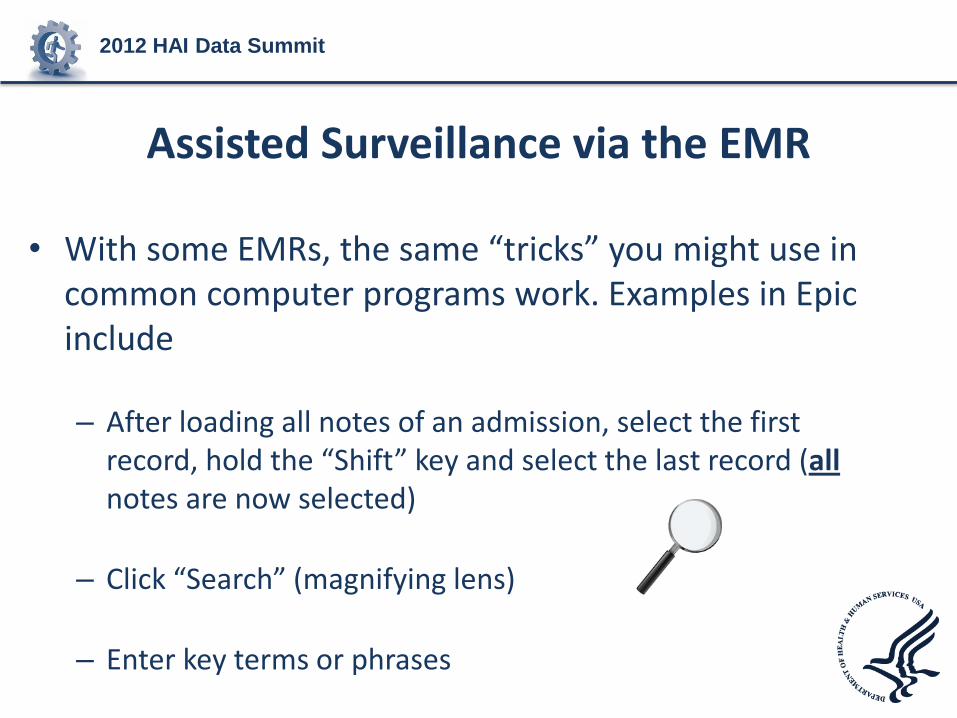
Assisted Surveillance via the EMR
• With some EMRs, the same “tricks” you might use in common computer programs work. Examples in Epic include
– After loading all notes of an admission, select the first record, hold the “Shift” key and select the last record (all notes are now selected)
– Click “Search” (magnifying lens)
– Enter key terms or phrases

2012 HAI Data Summit

2012 HAI Data Summit
Electronically Assisted Surveillance
• Survey of 207 hospitals in CA
• 23% (N=44) use EAS
– 13% data mining
• Predictors: org. support and larger facility
• EAS did not decrease time IPs spent on HAI identification
Grota PG, et al. AJIC 2010
Courtesy of R. Olmsted

2012 HAI Data Summit
Electronically Assisted Surveillance
• Survey of 241 hospitals in CA
• 32% use EAS
– 30% custom pgm
– 26% surv. Software
– 24% data mining service
• Use of EAS did correlate with greater use of evidence-based practices to prevent HAIs, esp. CLABSI and VAP
Halpin H, et al. AJIC 2011
Courtesy of R. Olmsted

2012 HAI Data Summit
Practical Solutions
Systematic review of studies involving cost effectiveness of technology
Findings: Only 2 studies assessed cost variables;
CAUTI surveillance and MRSA screening Does surveillance technology lead to improved patient safety? Difficult to make business case based on available evidence Furuno J, et al. AJIC 2008;36:S12-7
Courtesy of R. Olmsted

2012 HAI Data Summit
EAS Challenges
• Most vendor-based systems are costly and hard to continually cost-justify
• In-housed constructed EAS systems require infrastructure that comes with cost
• Neither removes the human element

2012 HAI Data Summit
EAS vs. Automated Surveillance
• EAS does not necessarily perform the surveillance itself; it sifts the hospital data to construct ‘useful’ information – Identifies sentinel events (+BSI in patient with LOS
>2) • More sophisticated models aimed at true HAI
surveillance have had limited validation
– May identify patterns / data mining (>2s.d. + urine cultures from ICU vs. baseline)

2012 HAI Data Summit
Truly Automated Surveillance
• The most successful and validated example of automated surveillance is with CLABSIs from Stroger Hospital (fka Cook County) in Chicago, IL
• Algorithms, schema and final SQL code open access at http://bsi.cchil.org/index.html

2012 HAI Data Summit
• EDW-based algorithms performed well vs.expert review
• Similar model successfully expanded beyond initial facility
Trick et al Emerg Infect Dis. 2004 Sep;10(9):1612-20.
Borlawksy et al AMIA Annu Symp Proc. 2008; 2008: 56–60.

2012 HAI Data Summit
The ‘Final’ CLABSI Model
Hotal et al J Am Inform Assoc 2010;17:42-48

2012 HAI Data Summit
Challenges and Solutions to Diffusion
Hotal et al J Am Inform Assoc 2010;17:42-48

2012 HAI Data Summit
Automated Surveillance Summary
• Attainable, scalable, and open access; at least for CLABSIs
• Next steps will require vital signs and more granular data elements from EMRs rather than LIS/ADT/Rx
• Balance between letting a hundred flowers bloom and the need for diffusion and standardization

Future of Reporting Quality Data and
Using Data for Various Accountability
Purposes
James (Jim) Poyer, MS, MBA Director, Division of Quality Improvement Policy for
Acute Care
Quality Improvement Group
Office of Clinical Standards and Quality
Centers for Medicare & Medicaid Services

2012 HAI Data Summit
Agenda
• Summary of current CMS quality initiatives
• Electronic health records – Current programs reporting quality data
• Future intended direction – quality measures and domains

2012 HAI Data Summit
CMS Quality Initiatives using HAI data
• -Value based Purchasing (VBP) – linking quality performance to paying providers for services to Beneficiaries – Hospital VBP – ESRD Quality Incentive Program
• Quality Reporting programs – linking quality reporting to paying for services to Beneficiaries – Hospital (inpatient, outpatient, long-term acute), inpatient
rehabilitation facilities, ambulatory surgical centers
• Nonpayment for infections associated with hospital (Medicare) and health care acquired conditions (Medicaid)

2012 HAI Data Summit
Electronic Health Records and Quality Measures – current CMS initiatives
• Physician Quality Reporting System (PQRS) – pay for reporting
• E-Prescribing initiative
• Medicare E H R Incentive program – meaningful use – 2013 Hospital Medicare – Stroke, VTE, Emergency Dept.
Throughput
– 2014 Hospital Medicare (proposed) – 2013 measures plus AMI, Heart Failure, Pneumonia, Asthma, SCIP, Pediatric ICU, perinatal care, immunization
• Medicaid E H R Incentive program – meaningful use

2012 HAI Data Summit
Future Direction – CMS Medicare Payment and E H R Meaningful Use
• Starting with Fiscal Year 2015 payment, Medicare Inpatient PPS Hospital market basket update is linked to the following: – (3/4 of update) Meaningful user of E H R’s – (1/4 of update) Reporting quality data to CMS
• The HHS Secretary shall provide preference to Hospital IQR measure for meaningful use reported measures
• Hospital VBP measure must be included in the Hospital IQR program

2012 HAI Data Summit
Implications of Future Statutory Guidance
• E H R measures will likely be used for the following:
– Determining meaningful use requirement
– CMS hospital quality reporting initiatives
– CMS Hospital VBP program
– Most importantly……improving quality of care to patients, better health for populations, and lowering cost!

2012 HAI Data Summit
CMS 3-Part Aim
– Better Care: Improve the overall quality, by making health care more patient-centered, reliable, accessible, and safe.
– Healthy People and Communities: Improve the health of the U.S. population by supporting proven interventions to address behavioral, social, and environmental determinants of health in addition to delivering higher-quality care.
– Affordable Care: Reduce the cost of quality health care for individuals, families, employers, and government.

2012 HAI Data Summit
HHS National Quality Strategy
HHS National Quality Strategy – 6 Domains • Making care safer by reducing harm caused in the delivery of care. • Ensuring that each person and family are engaged as partners in
their care. • Promoting effective communication and coordination of care. • Promoting the most effective prevention and treatment practices
for the leading causes of mortality, starting with cardiovascular disease.
• Working with communities to promote wide use of best practices to enable healthy living.
• Making quality care more affordable for individuals, families, employers, and governments by developing and spreading new health care delivery models.
2012 HAI Data Summit
CMS Future Direction of Quality Measures
• Alignment with the 6 National Quality Strategy domains
• CMS proposed using these domains starting with the FY 2016 Hospital VBP program (please submit comments)
• Adding settings of care consistent with the HAI action plan

2012 HAI Data Summit
CMS Future Direction of Quality Measures and Reporting (continued)
• Collaborate with the Secretary’s Measure Endorsement Entity to harmonize measures across settings – Reduces burden to providers/practitioners through
simplified quality measures – Facilitates care coordination through more seamless
quality information exchange – CMS and HHS Quality Reporting using standard E H R
exchange, libraries, and format across settings should increase E H R usage and standardized data elements across settings

2012 HAI Data Summit
Thanks!

Questions & Answers


![Systematic correlation of environmental exposure and … · 2018-08-30 · dinal factor based on [Health.gov] physical activity guide-line categories as previously described.10,25](https://img.pdfslide.us/doc/110x75/5f5ae0ccda58dc08e00b35cd/systematic-correlation-of-environmental-exposure-and-2018-08-30-dinal-factor-based.jpg)