Embed Size (px)
Citation preview

Atmos. Chem. Phys., 14, 8017–8042, 2014www.atmos-chem-phys.net/14/8017/2014/doi:10.5194/acp-14-8017-2014© Author(s) 2014. CC Attribution 3.0 License.
Enhancing non-refractory aerosol apportionment from an urbanindustrial site through receptor modeling of complete hightime-resolution aerosol mass spectra
M. L. McGuire 1, R. Y.-W. Chang1,2,*, J. G. Slowik1,2,** , C.-H. Jeong1, R. M. Healy1, G. Lu3, C. Mihele3,J. P. D. Abbatt1,2, J. R. Brook3, and G. J. Evans1
1Southern Ontario Centre for Atmospheric Aerosol Research, University of Toronto, 200 College St.,Toronto, Ontario, Canada2Department of Chemistry, University of Toronto, St. George St., Toronto, Ontario, Canada3Air Quality and Research Division, Science and Technology Branch, Environment Canada, 4905 Dufferin St.,Toronto, Ontario, Canada* now at: School of Engineering and Applied Sciences and Department of Earth and Planetary Sciences, Harvard University,Cambridge, MA, USA** now at: Paul Scherrer Institute, Laboratory of Atmospheric Chemistry, General Energy Research Department,Paul Scherrer Institute, Villigen, Switzerland
Correspondence to:G. J. Evans ([email protected])
Received: 26 January 2014 – Published in Atmos. Chem. Phys. Discuss.: 24 February 2014Revised: 7 June 2014 – Accepted: 30 June 2014 – Published: 13 August 2014
Abstract. Receptor modeling was performed on quadrupoleunit mass resolution aerosol mass spectrometer (Q-AMS)sub-micron particulate matter (PM) chemical speciationmeasurements from Windsor, Ontario, an industrial citysituated across the Detroit River from Detroit, Michigan.Aerosol and trace gas measurements were collected on boardEnvironment Canada’s Canadian Regional and Urban In-vestigation System for Environmental Research (CRUISER)mobile laboratory. Positive matrix factorization (PMF) wasperformed on the AMS full particle-phase mass spectrum(PMFFull MS) encompassing both organic and inorganic com-ponents. This approach was compared to the more com-mon method of analyzing only the organic mass spectra(PMFOrg MS). PMF of the full mass spectrum revealed thatvariability in the non-refractory sub-micron aerosol con-centration and composition was best explained by six fac-tors: an amine-containing factor (Amine); an ammoniumsulfate- and oxygenated organic aerosol-containing factor(Sulfate-OA); an ammonium nitrate- and oxygenated or-ganic aerosol-containing factor (Nitrate-OA); an ammoniumchloride-containing factor (Chloride); a hydrocarbon-like
organic aerosol (HOA) factor; and a moderately oxygenatedorganic aerosol factor (OOA). PMF of the organic mass spec-trum revealed three factors of similar composition to some ofthose revealed through PMFFull MS: Amine, HOA and OOA.
Including both the inorganic and organic mass proved tobe a beneficial approach to analyzing the unit mass resolutionAMS data for several reasons. First, it provided a method forpotentially calculating more accurate sub-micron PM massconcentrations, particularly when unusual factors are present,in this case the Amine factor. As this method does not relyon a priori knowledge of chemical species, it circumventsthe need for any adjustments to the traditional AMS speciesfragmentation patterns to account for atypical species, andcan thus lead to more complete factor profiles. It is expectedthat this method would be even more useful for HR–ToF–AMS data, due to the ability to understand better the chemi-cal nature of atypical factors from high-resolution mass spec-tra. Second, utilizing PMF to extract factors containing inor-ganic species allowed for the determination of the extent ofneutralization, which could have implications for aerosol pa-rameterization. Third, subtler differences in organic aerosol
Published by Copernicus Publications on behalf of the European Geosciences Union.

8018 M. L. McGuire et al.: Enhancing non-refractory aerosol apportionment from an urban industrial site
components were resolved through the incorporation of in-organic mass into the PMF matrix. The additional tempo-ral features provided by the inorganic aerosol componentsallowed for the resolution of more types of oxygenated or-ganic aerosol than could be reliably resolved from PMF oforganics alone. Comparison of findings from the PMFFull MSand PMFOrg MS methods showed that for the Windsor air-shed, the PMFFull MS method enabled additional conclusionsto be drawn in terms of aerosol sources and chemical pro-cesses. While performing PMFOrg MS can provide importantdistinctions between types of organic aerosol, it is shown thatincluding inorganic species in the PMF analysis can permitfurther apportionment of organics for unit mass resolutionAMS mass spectra.
1 Introduction
Atmospheric aerosol or particulate matter (PM) is knownto have important implications for atmospheric visibility(Watson, 2002), climate change (IPCC, 2013), and humanhealth (Pope and Dockery, 2006; Anderson et al., 2012;Brook et al., 2010). Understanding the sources and processesresponsible for PM composition and concentration is criti-cal to enacting effective PM reduction strategies. Receptormodeling of PM chemical speciation data is one method to-wards achieving this. Historically, receptor modeling stud-ies have focused on understanding integrated filter measure-ments, which have been particularly useful for providing anoverview of the main chemical components of major sourcecategories and their longer-term temporal trends (Gordon,1980; Hopke, 2003; Watson et al., 2008). More recently, re-ceptor modeling analyses have been focused on online hightime-resolution chemical analysis techniques, as they canprovide additional insight into sources and processes not cap-tured by the chemical or temporal resolution of daily filtermeasurements.
Aerosol mass spectrometry is among the most widely usedhigh-time resolution PM chemical speciation methods thatcan be used to quantify the impacts of non-refractory sourcecomponents, including both organic and inorganic compo-nents. Receptor modeling using positive matrix factorization(PMF) has become a useful analytical technique for furtherunderstanding the origins of AMS-measured aerosol. Amongthese studies, most have focused on the organic fraction ofthe AMS mass spectrum (e.g., Lanz et al., 2007; Ulbrichet al., 2009) in an effort to resolve uncertainty regardingthe sources and processes contributing to secondary organicaerosol (SOA), an aerosol component with potential implica-tions for climate (IPCC, 2013). Many of these studies havefocused on the application of factor analysis to the organicmass fraction in an attempt to deconvolve it into descriptivesub-components, namely a hydrocarbon-like organic aerosol(HOA) factor, and an oxygenated organic aerosol (OOA)
factor. Examination of data sets from numerous, diverseenvironments has shown that the OOA fraction often splitsinto two sub-components, OOAI and OOAII (Zhang et al.,2011). Observations of their temporal behavior have shownthat these two factors typically exhibit different volatilityregimes, whereby OOAII exhibits significant diurnal vari-ability associated with condensation and volatilization fromtemperature cycling, and, by contrast, OOAI has been mainlyassociated with synoptic flow regimes, with no significant as-sociation with temperature cycling. The semi-volatile OOAIItype factor was first reported in a study by Lanz et al. (2007),although its volatile nature was first substantiated with exter-nal measurements in a study by Huffman et al. (2009); in thelatter study it was shown that decreased volatility of OA fac-tors was associated with increasing oxygenation or oxygento carbon (O/C) ratio (Huffman et al., 2009). As a result,the OOAI and OOAII factors are often referred to in the lit-erature as low-volatility OOA (LV-OOA), and semi-volatileOOA (SV-OOA), respectively (Jimenez et al., 2009). Whilethe HOA and OOA components have been the most widelyobserved organic components deconvolved in the multitudeof AMS studies performed to date (Zhang et al., 2007), otherfactors have been identified, such as biomass burning organicaerosol (BBOA) (e.g., Aiken et al., 2009), amine-containingorganic aerosol (e.g., Aiken et al., 2009; Sun et al., 2012;Docherty et al., 2011; Hildebrandt et al., 2011), and evencooking organic aerosol (COA) (e.g., Lanz et al., 2007; Allanet al., 2010; Sun et al., 2011; Mohr et al., 2012; Crippa et al.,2013a). In many studies, correlation analysis of organics withinorganic species has been used for further ascertaining thesources and processes contributing to a particular factor. Forinstance, significant correlations have been found betweenOOAI and SO2−
4 , and between OOAII and NO−3 (Lanz et al.,2007; Ulbrich et al., 2008).
This study presents a receptor modeling analysis of hightime-resolution unit mass resolution quadrupole AMS mea-surements. Aerosol and trace gas speciation measurementswere made on board Environment Canada’s CRUISER(Canadian Regional and Urban Investigation System for En-vironmental Research) mobile laboratory at MicMac Park inWindsor, Ontario in the winter of 2005. A different approachwas taken in this study with respect to the majority of pre-vious receptor modeling analyses of the non-refractory sub-micron chemical composition, as PMF was applied to the fullmass spectrum, comprising both the organic and inorganiccomponents. To the authors’ knowledge, combined PMFanalysis of organic and inorganic AMS mass spectra has beenperformed in only three other studies (Chang et al., 2011; Sunet al., 2012; Crippa et al., 2013b). Of these, the study by Sunet al. (2012) was the only one to include all inorganic and or-ganic species together. While PMF had previously been ap-plied to data including AMS-derived bulk concentrations ofinorganic and organic species (e.g., Buset et al., 2006; Crippaet al., 2013b), Chang et al. (2011) were the first to applythe PMF multivariate deconvolution algorithm to combined
Atmos. Chem. Phys., 14, 8017–8042, 2014 www.atmos-chem-phys.net/14/8017/2014/

M. L. McGuire et al.: Enhancing non-refractory aerosol apportionment from an urban industrial site 8019
2km
Airport
MicMac Park
Coal Fired Power Plants
Steel Mills Potential Amine Sources
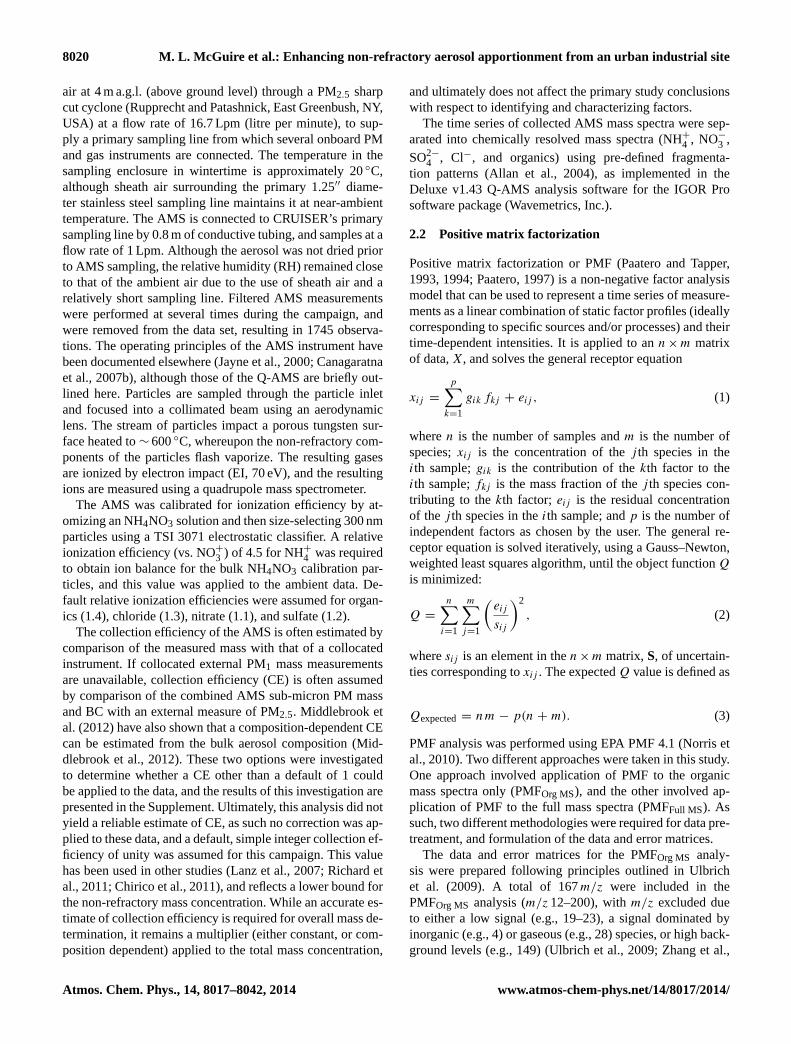
Figure 1. The location of the sampling site (MicMac Park) in Windsor, Ontario relative to major industrial sources, namely coal-fired powerplants, steel mills, and potential large amine sources. It can be seen that the measurement site was located close to the largest internationalborder crossing between the US and Canada (Huron Church Road and the Ambassador Bridge).
organic and inorganic mass spectra, in that case to ambientArctic aerosol (Chang et al., 2011). However, low ambientaerosol concentrations, and low associated signal-to-noiseratios, prevented the inclusion of all species in the analysis.As a result, NH+4 was excluded, which precluded certain con-clusions regarding aerosol neutralization from being drawn.Nonetheless, four factors were extracted in that study, includ-ing factors representing marine biogenic emissions (contain-ing methanesulfonic acid or MSA), continental emissions,ship emissions, and OOA. Each factor was characterized bydiffering degrees of cross-apportionment between organicand inorganic species. Eight factors were identified in thestudy by Sun et al., many more than found in the Arctic study,mainly due to the urban sampling location in New York City(Sun et al., 2012). Similar to Chang et al. (2011), signifi-cant organic and inorganic cross-apportionment was notedfor most of the factors. In the study by Crippa et al. (2013b),only SO2−
4 -related ions were included in the PMF analysis inaddition to organics, which allowed for the apportionment ofSO2−
4 ions to marine and terrestrial aerosol factors (Crippa etal., 2013b).
This study focuses on the physical interpretation of cross-apportionment between organic and inorganic non-refractorysub-micron PM species between factors. Drawing upon coldcondition measurements from a complex, industrialized site,this analysis illustrates how this methodology can help to un-derstand underlying aerosol sources and processes better, andto identify new scientific and methodological conclusions.
2 Experimental methods
2.1 Aerosol mass spectrometer measurements
Aerosol and trace gas measurements were collected on boardEnvironment Canada’s CRUISER mobile laboratory, whichwas stationed at MicMac Park in Windsor (42◦17′5.38′′ N,83◦4′31.42′′ W) in January and early February 2005. Lo-cated next to Detroit on the Canada–US border in southwest-ern Ontario, Windsor has historically been known to expe-rience frequent episodes of poor air quality. Local sourcesof PM are numerous and diverse due to a large manufac-turing base, including sources such as steelmaking, salt andgypsum mining, petrochemical refining, and coal-fired powergeneration. Another significant local source is traffic, giventhat the Windsor–Detroit border crossing is the largest inter-national border crossing between Canada and the US. Re-gionally, Windsor is impacted by many sources, but perhapsmost significantly by coal-fired power plants to the south inthe Ohio River valley. A map of the Windsor–Detroit area isshown in Fig. 1.
Chemical speciation measurements of sub-micron PMwere made on board CRUISER using a unit mass resolutionquadrupole aerosol mass spectrometer (Q-AMS) (AerodyneResearch Inc., Billerica, MA, USA). The AMS sampled from12 January to 2 February 2005, except for a period between15 and 18 January, when it was not operating. Sampling oc-curred at a 15 min time resolution, except for a short periodat the beginning of the campaign (12 to 13 January), whenit sampled at a 5 min time resolution. CRUISER samples
www.atmos-chem-phys.net/14/8017/2014/ Atmos. Chem. Phys., 14, 8017–8042, 2014
8020 M. L. McGuire et al.: Enhancing non-refractory aerosol apportionment from an urban industrial site
air at 4 m a.g.l. (above ground level) through a PM2.5 sharpcut cyclone (Rupprecht and Patashnick, East Greenbush, NY,USA) at a flow rate of 16.7 Lpm (litre per minute), to sup-ply a primary sampling line from which several onboard PMand gas instruments are connected. The temperature in thesampling enclosure in wintertime is approximately 20◦C,although sheath air surrounding the primary 1.25′′ diame-ter stainless steel sampling line maintains it at near-ambienttemperature. The AMS is connected to CRUISER’s primarysampling line by 0.8 m of conductive tubing, and samples at aflow rate of 1 Lpm. Although the aerosol was not dried priorto AMS sampling, the relative humidity (RH) remained closeto that of the ambient air due to the use of sheath air and arelatively short sampling line. Filtered AMS measurementswere performed at several times during the campaign, andwere removed from the data set, resulting in 1745 observa-tions. The operating principles of the AMS instrument havebeen documented elsewhere (Jayne et al., 2000; Canagaratnaet al., 2007b), although those of the Q-AMS are briefly out-lined here. Particles are sampled through the particle inletand focused into a collimated beam using an aerodynamiclens. The stream of particles impact a porous tungsten sur-face heated to∼ 600◦C, whereupon the non-refractory com-ponents of the particles flash vaporize. The resulting gasesare ionized by electron impact (EI, 70 eV), and the resultingions are measured using a quadrupole mass spectrometer.
The AMS was calibrated for ionization efficiency by at-omizing an NH4NO3 solution and then size-selecting 300 nmparticles using a TSI 3071 electrostatic classifier. A relativeionization efficiency (vs. NO+3 ) of 4.5 for NH+
4 was requiredto obtain ion balance for the bulk NH4NO3 calibration par-ticles, and this value was applied to the ambient data. De-fault relative ionization efficiencies were assumed for organ-ics (1.4), chloride (1.3), nitrate (1.1), and sulfate (1.2).
The collection efficiency of the AMS is often estimated bycomparison of the measured mass with that of a collocatedinstrument. If collocated external PM1 mass measurementsare unavailable, collection efficiency (CE) is often assumedby comparison of the combined AMS sub-micron PM massand BC with an external measure of PM2.5. Middlebrook etal. (2012) have also shown that a composition-dependent CEcan be estimated from the bulk aerosol composition (Mid-dlebrook et al., 2012). These two options were investigatedto determine whether a CE other than a default of 1 couldbe applied to the data, and the results of this investigation arepresented in the Supplement. Ultimately, this analysis did notyield a reliable estimate of CE, as such no correction was ap-plied to these data, and a default, simple integer collection ef-ficiency of unity was assumed for this campaign. This valuehas been used in other studies (Lanz et al., 2007; Richard etal., 2011; Chirico et al., 2011), and reflects a lower bound forthe non-refractory mass concentration. While an accurate es-timate of collection efficiency is required for overall mass de-termination, it remains a multiplier (either constant, or com-position dependent) applied to the total mass concentration,
and ultimately does not affect the primary study conclusionswith respect to identifying and characterizing factors.
The time series of collected AMS mass spectra were sep-arated into chemically resolved mass spectra (NH+
4 , NO−
3 ,SO2−
4 , Cl−, and organics) using pre-defined fragmenta-tion patterns (Allan et al., 2004), as implemented in theDeluxe v1.43 Q-AMS analysis software for the IGOR Prosoftware package (Wavemetrics, Inc.).
2.2 Positive matrix factorization
Positive matrix factorization or PMF (Paatero and Tapper,1993, 1994; Paatero, 1997) is a non-negative factor analysismodel that can be used to represent a time series of measure-ments as a linear combination of static factor profiles (ideallycorresponding to specific sources and/or processes) and theirtime-dependent intensities. It is applied to ann × m matrixof data,X, and solves the general receptor equation
xij =
p∑k=1
gik fkj + eij , (1)
wheren is the number of samples andm is the number ofspecies;xij is the concentration of thej th species in theith sample;gik is the contribution of thekth factor to theith sample;fkj is the mass fraction of thej th species con-tributing to thekth factor; eij is the residual concentrationof thej th species in theith sample; andp is the number ofindependent factors as chosen by the user. The general re-ceptor equation is solved iteratively, using a Gauss–Newton,weighted least squares algorithm, until the object functionQ
is minimized:
Q =
n∑i=1
m∑j=1
(eij
sij
)2
, (2)
wheresij is an element in then × m matrix,S, of uncertain-ties corresponding toxij . The expectedQ value is defined as
Qexpected= nm − p(n + m). (3)
PMF analysis was performed using EPA PMF 4.1 (Norris etal., 2010). Two different approaches were taken in this study.One approach involved application of PMF to the organicmass spectra only (PMFOrg MS), and the other involved ap-plication of PMF to the full mass spectra (PMFFull MS). Assuch, two different methodologies were required for data pre-treatment, and formulation of the data and error matrices.
The data and error matrices for the PMFOrg MS analy-sis were prepared following principles outlined in Ulbrichet al. (2009). A total of 167m/z were included in thePMFOrg MS analysis (m/z 12–200), withm/z excluded dueto either a low signal (e.g., 19–23), a signal dominated byinorganic (e.g., 4) or gaseous (e.g., 28) species, or high back-ground levels (e.g., 149) (Ulbrich et al., 2009; Zhang et al.,
Atmos. Chem. Phys., 14, 8017–8042, 2014 www.atmos-chem-phys.net/14/8017/2014/

M. L. McGuire et al.: Enhancing non-refractory aerosol apportionment from an urban industrial site 8021
2005). Uncertainties for the PMFOrg MS analysis were calcu-lated according to the method of Allan et al. (2003), and aminimum error corresponding to the counting of a single ionwas enforced throughout the data set (Ulbrich et al., 2009).Within the AMS organic fraction extraction process, certainm/z (16, 17, 18, and 44) are assumed to be a constant fractionof m/z 44. The uncertainties in these ions were accordinglymultiplied by
√4 to prevent them from being overweighted
by the PMF algorithm. The signal-to-noise ratio (S/N) foreachm/z was calculated to identify weak (0.2< S/N < 2),and bad (S/N < 0.2) variables; a downweighting policy wasapplied such that weak variables are downweighted by a fac-tor of 2, and bad variables excluded. No variables were des-ignated as bad for this analysis.
The data and error matrices for the PMFFull MS analy-sis were prepared following principles outlined by Chang etal. (2011). The data matrix was calculated in nitrate equiv-alent (NO3eq) mass (refer to Sect. 2.3) and calculated bytaking the entire raw MS matrix (“All”) and from it, sub-tracting the mass spectral matrices of species not of inter-est to the analysis (i.e., air and water), leaving the contri-butions from fragments associated with NH+
4 , NO−
3 , SO2−
4 ,Cl−, and organics. Downweighting of selective organic or in-organic peaks as is required when conducting the PMFOrg MSanalysis was not required in the PMFFull MS analysis, asthe PMFFull MS matrix resulted from the subtraction of the“Air” and “Water” components from the original “All” ma-trix. In other words, thePMFFull MS matrix was not con-structed from application of the fragmentation scheme tocreate “Org”, “SO2−
4 ”, “NO −
3 ”, “Chl”, and “NH+
4 ” matri-ces, which could be added together to generate a “Full MS”matrix, but was a result of the subtraction of the “Air” and“Water” components subtracted from the original “All” ma-trix. The corresponding error matrix (in NO3eq mass) wasthen constructed by adding in quadrature the “All_err”, “Wa-ter_err”, and “Air_err” matrices. Similar to the organic ma-trix preparation, a minimum uncertainty corresponding toa single ion was enforced, and the sameS/N policy wasapplied, although no variables were designated as bad (Ul-brich et al., 2009). A total of 173m/z were included in thePMFFull MS analysis, withm/z excluded due to either a lowsignal (e.g., 19–23), known interferences (e.g., 18), a signaldominated by gaseous species (e.g., 28), high backgroundlevels (e.g., 149), or non-linear contributions (m/z 39). Whilem/z 39 (potassium) could be useful in a PMF analysis of thefull mass spectrum for the potential identification of certainfactors (e.g., biomass burning), it was excluded due to non-linearities in the signal. Potassium can ionize by two differ-ent ionization pathways, namely electron impact and surfaceionization, each bearing a different relative ionization effi-ciency (RIE) (Drewnick et al., 2006). The amount of signalmeasured from potassium thus depends not only on the ac-tual initial potassium mass, but also on the particle’s historywithin the AMS. Quantifying the relative degree of vaporiza-tion via electron impaction vs. surface ionization is difficult,
as this ratio is not entirely stable over time (e.g., minor driftsin tuning, fluctuations in the vaporizer temperature), and maydepend on the particle composition. Initial PMF tests indi-cated that potassium inclusion did not aid in the extractionof a biomass burning organic aerosol factor. Although somepotassium is also found atm/z 41, this fragment was domi-nated by organics (potassium contribution< 7 %). This sig-nal could be removed, although doing so requires referring tothe non-linearm/z 39. Due to the low contribution of potas-sium atm/z 41, this fragment was thus left unaltered to avoidintroducing additional noise to the matrix.
In addition to the uncertainties as described above, a globaluncertainty of 5 % of the data (the C3 parameter) was addedto the uncertainty matrix, in a similar fashion to Brown etal. (2012). Solutions were interpreted based on the resultingfactor profiles and temporal trends. The factor profile massspectra were compared with those extracted from other PMFstudies of AMS data; however, it should be noted that thesecomparisons were interpreted with care due to methodolog-ical differences between PMFFull MS and PMFOrg MS analy-ses. Factor temporal trends were examined for particular be-haviors such as diurnal trends and correlations with meteo-rological conditions and external species (e.g., gases and PMmass).
Two methods were employed to test the robustness of thefactor analysis of the AMS data: FPeak rotational analy-sis and bootstrapping. The effect of global matrix rotationsthrough the FPeak parameter was mainly evaluated in termsof the mass spectra: changes in the mass spectra could beevaluated more objectively than changes in temporal trends,due to the availability of comparison mass spectra from otherstudies and the lack of a priori knowledge of source temporaltrends. However, the effect of FPeak rotations on correlationsbetween some factors and key external measurements wasalso evaluated. It should be noted that since EPA PMF 4.1utilizes the multi-linear engine (ME-2), FPeak values areapproximately five times greater than those typically usedfor PMF2 in order to achieve a similar degree of rotation(i.e., in PMF2, FPeaks explored typically range from−2 to 2)(Norris et al., 2010). Similar to the approach used by Brownet al. (2012), FPeak rotations were calculated from−10 to 10in increments of 2 (Brown et al., 2012). This range led toincreases inQ/Qexp of ∼ 1 %, indicating that the base so-lution appeared rotationally robust. Furthermore, this rota-tional range appeared sufficient to provide an indication ofthe relative robustness of factors, by comparing the relativedegree of rotational ambiguity between factors: the robust-ness of each factor was examined by applying the AMS frag-mentation species extraction algorithm (Allan et al., 2003)to the resulting FPeak factor profiles, and the species massfractions across FPeak values were examined. In terms ofthe bootstrap analysis, 100 bootstrap iterations were per-formed. Bootstrap results were mainly interpreted accordingto the number of unmapped factors (factors that could notbe “mapped” to the base case using a threshold uncentered
www.atmos-chem-phys.net/14/8017/2014/ Atmos. Chem. Phys., 14, 8017–8042, 2014

8022 M. L. McGuire et al.: Enhancing non-refractory aerosol apportionment from an urban industrial site
correlation coefficient of 0.6). The results of these tests aredescribed in the Supplement.
2.3 Aerosol mass spectrometer mass quantification
The use of NO3eq mass proved to be a useful method for ob-taining better mass estimates, as the various relative ioniza-tion efficiencies (RIEs) of component species can be consid-ered in the mass quantification of resolved PMF factors. Inthe case of PMF of organic MS, only a single multiplicativefactor of 1.4 is applied to the data set as a whole to accountfor the RIE of organics (RIE of 1.4). However, another ap-proach is required for mass estimates of multi-component,combined inorganic and organic mass spectra. Firstly, PMFanalysis of the full mass spectrum was performed using ni-trate equivalent mass (NO3eq), whereby an instrument sig-nal was converted to mass using a single RIE (in this case,that for nitrate). Following PMF, the factor species composi-tion was determined through application of the fragmentationscheme to factor mass spectra (Allan et al., 2003, 2004), andan effective factor RIE calculated through weighted averagesof RIEs according to the factor composition (Chang et al.,2011). Default RIE values were assumed for the main AMSspecies, and were used to convert the NO3eq factor mass to“real” mass. It should be noted that this method works wellwhen the defining species’ chemical nature is well under-stood, and fragmentation patterns and RIE values are avail-able (i.e., as for NO−3 , SO2−
4 , NH+
4 , chloride, and organics).However, the AMS has been known to detect other species,such as methanesulfonic acid (Zorn et al., 2008; Langley etal., 2010; Chang et al., 2011) and amines (Silva et al., 2008;Docherty et al., 2011; Hildebrandt et al., 2011), for whichless information is available. In particular, it has been shownthat, depending on their chemical nature, amines may dis-play a wide range of fragmentation patterns and RIE values(i.e., from 1.3 to 10) (Silva et al., 2008). An indication ofthe chemical nature of the factor species may thus be integralto the factor mass quantification calculation. Further discus-sion of the implication of these assumptions is provided inSect. 3.2.
2.4 Supporting measurements
Trace gases were measured using a variety of techniques,namely by quadrupole proton-transfer-reaction mass spec-trometry (PTR-MS) (Ionicon, Innsbruck, Austria) to mea-sure Volatile Organic Compounds (VOCs), as well as withother gas analyzers to measure NOx, SO2, O3, and CO.Particle number concentration measurements were providedby a condensation particle counter (model 3010, TSI Inc.,Shoreview, MN, USA). Black carbon measurements werealso available from an aethalometer (Magee Scientific), andmeasurements derived from absorption at 880 nm were used.As reliable collocated sub-micron PM mass concentrationmeasurements were unavailable, PM mass comparisons were
made to 5 min PM2.5 measurements obtained by a TEOM(TEOM model 1400ab, Rupprecht and Patashnick, EastGreenbush, NY, USA) on board CRUISER. Hourly meteo-rological measurements were supplied courtesy of Environ-ment Canada, from a meteorological station located 10 km tothe east of MicMac Park in an open field at Windsor Airport(42◦16′48′′ N, 82◦57′36′′ W). Measurements of wind direc-tion and speed, RH, and visibility were used in this analysis.
2.5 Assessment of geographic origins
The geographic origins of the AMS PMF factors were as-sessed using the conditional probability function (CPF) andthe potential source contribution function (PSCF), whichhave been described elsewhere (Ashbaugh et al., 1985;McGuire et al., 2011). In this study, the CPF threshold wasset to the top 25th percentile, and probabilities associatedwith infrequently observed wind directions (winds< 5 % ofthe time) were downweighted by 3. For the PSCF analysis,each cell was chosen to be 0.5◦ in both latitude and longitude,and the threshold for the PSCF was set to the top 50th per-centile. For the purposes of the Sulfate-OA factor PSCF anal-ysis, three short events known to be associated with localsources were removed from the analysis (see Sect. 3.1.2 forfurther description). The result is a probability distributionmap where higher probabilities indicate more probable re-gional source regions.
3 Results and discussion
An overview of the meteorological conditions observed dur-ing the campaign is presented in Fig. 2. Unusually warm Jan-uary temperatures for southwestern Ontario were observed atthe beginning of the campaign. Higher wind speeds were as-sociated with southerly air flow. Wind speeds dropped dra-matically towards the end of the campaign, resulting in astagnation period that resulted in a significant increase inPM mass concentration. The time series of the AMS non-refractory species, as calculated from the AMS data anal-ysis package, is shown in Fig. 3, and descriptive statisticsfor these species are listed in Table 1. On average, prior toPMF analysis, organic aerosol (37 %) and NO−
3 (31 %) werefound to contribute most to the non-refractory sub-micronPM mass. The following sections first outline results fromPMF analysis of the full mass spectrum, followed by PMFanalysis of the organics. Finally, results from both analysesare compared.
3.1 PMF of AMS full mass spectra
PMFFull MS analysis showed that six factors best capturedthe variability in the data. The following factors were re-trieved: Amine; Sulfate-OA, containing mostly ammoniumsulfate; Nitrate-OA, containing mostly ammonium nitrate;Chloride, composed mostly of ammonium chloride; HOA, a
Atmos. Chem. Phys., 14, 8017–8042, 2014 www.atmos-chem-phys.net/14/8017/2014/

M. L. McGuire et al.: Enhancing non-refractory aerosol apportionment from an urban industrial site 8023
30 30
20 20
10 10
0 0
PM
2.5
Co
nce
ntr
atio
n
(ug
/m3)
1/13
1/13
1/15
1/15
1/17
1/17
1/19
1/19
1/21
1/21
1/23
1/23
1/25
1/25
1/27
1/27
1/29
1/29
1/31
1/31
Day of Year
10
8
6
4
2
Win
d S
pe
ed
(km
hr-1
)
360
270
180
90
0W
ind
Dire
ctio
n
(De
gre
es)
-10 -10
0 0
10 10T
em
pe
ratu
re
(ºC
)
Wind Speed Wind Direction
Figure 2. Meteorological conditions and PM2.5 mass concentration from the CRUISER TEOM for the MicMac Park winter campaign.
3
2
1
0
1/13 1/15 1/17 1/19 1/21 1/23 1/25 1/27 1/29 1/31Day of Year
86420
Mas
s C
once
ntra
tion
(ug
m-3
)
12
8
4
0
543210
2520151050
Org
NH4+
NO3-
SO4-2
Chl
Figure 3. Time series of AMS-measured non-refractory sub-micron PM species.
hydrocarbon-like organic factor, which represented primaryorganic aerosol; and OOA, an oxygenated organic aerosolfactor. Figures 4 and 5 show the time series (in local time)and factor profiles, respectively. Figure 6 shows the massspectra of each factor’s organic components, and Fig. 7 de-tails each factor’s chemical composition by species and fac-tor component.
Solutions containing two through ten factors were ana-lyzed. In brief, as with the six-factor solution, the five-,seven-, and eight-factor solutions contained almost the samefive factors (Sulfate-OA, Nitrate-OA, Chloride, HOA, and
Amine). While the five-factor solution did not extract anOOA factor, the seven-factor solution split the OOA resolvedfrom the six-factor solution into a similar OOA factor, aswell as another OA factor that did not sufficiently resembleany known mass spectra. The eight-factor solution added alocal sulfate factor. More detailed solution descriptions anda justification of the six- to eight-factor solutions are pre-sented in the Supplement. The six-factor solution was cho-sen for the following reasons: among 100 random runs, allruns converged and displayed a constant, global minimumQ value; higher-order solutions did not explain significantly
www.atmos-chem-phys.net/14/8017/2014/ Atmos. Chem. Phys., 14, 8017–8042, 2014

8024 M. L. McGuire et al.: Enhancing non-refractory aerosol apportionment from an urban industrial site
4
2
0
1/13 1/15 1/17 1/19 1/21 1/23 1/25 1/27 1/29 1/31Day of Year
1.00.80.60.40.20.0M
ass
Frac
tion
151050
201510501086420
3020100
Fact
or M
ass
(ug
m-3
)
151050
HOA
OOA
Amine
Sulfate-OA
Nitrate-OA
Chloride
Figure 4. Time series of the factors from the six-factor solution from PMFFull MS analysis. The solid line represents FPeak= 0, and therange of uncertainties through FPeak analysis (−10 and+10) is shown in the shaded regions.
more variance in the data; and factors from this solution werethe most physically meaningful. The following sections de-tail findings for each factor, with a focus on new insightsinto aerosol sources and processes due to the incorporationof both the organic and inorganic aerosol fractions into thePMF analysis.
3.1.1 Amine factor
The Amine factor’s time series, shown in Fig. 4, was char-acterized by several short-duration events. The Amine factorMS (Fig. 5) was distinctly different from the other factors dueto the presence of fragments such asm/z 30, 58, 86, and 100.This factor also contained a significant signal atm/z 30,with the m/z 30/46 ratio much higher than that for nitrate,suggesting the presence of other ions (e.g., CH4N+). Theorganic functionality of this factor was examined throughthe delta (1) pattern displayed by its mass spectral pro-file, whereby1 = m/z − 14n + 1 (wheren is the numberof CH2 groups left in the functional group) (McLafferty andTurecek, 1993). Given its characteristic fragments and strong
1 = 3 pattern (i.e., 30, 44, 58, 72, 86, 100, etc.) representa-tive of alkyl amines (CnH2n+2N), this factor was assigned asAmine. The Amine factor was robust in the solution, emerg-ing in each solution involving at least three factors. In termsof assessing rotational ambiguity from FPeak analysis, theAmine factor appeared robust, and rotationally fixed (Fig. 5).
Gas- and particle-phase amines have been recorded in thetroposphere for some time, and can be emitted from a vari-ety of sources. The largest global sources of amines are an-imal husbandry, industrial operations, and wastewater treat-ment (Ge et al., 2011). Gaseous aliphatic amines at high con-centrations can have serious consequences for human health,with effects ranging from irritation of mucosal membranes,to blood clots, and potentially cancer (Greim et al., 1998).Particle-phase amines have been measured in widely dif-ferent settings, ranging from rural areas in Utah (Silva etal., 2008) and Ontario (McGuire et al., 2011; Rehbein etal., 2011), to heavily urbanized areas such as Mexico City(Aiken et al., 2009), Riverside, California (Pratt et al., 2009),and Toronto (Tan et al., 2002; Rehbein et al., 2011). In this
Atmos. Chem. Phys., 14, 8017–8042, 2014 www.atmos-chem-phys.net/14/8017/2014/

M. L. McGuire et al.: Enhancing non-refractory aerosol apportionment from an urban industrial site 8025
Table 1.Descriptive statistics for AMS-measured non-refractory sub-micron PM species, pre- and post-PMF analysis (µg m−3).
Org NH+
4 NO−
3 SO2−
4 Cl− Total
Pre Post Pre Post Pre Post Pre Post Pre Post Pre Post
Mean 2.73 2.45 1.13 1.15 2.28 2.20 1.18 1.13 0.12 0.12 7.45 7.101σ 2.41 2.17 1.01 1.04 2.58 2.53 0.97 0.91 0.18 0.17 6.30 6.12Min 0.29 0.00 0.00 0.00 0.01 0.00 0.03 0.00 0.00 0.00 0.58 0.00Max 28.08 24.61 5.80 6.22 12.61 12.56 9.09 7.24 3.14 2.79 43.79 41.15
0.10
0.05
0.00
Frac
tion
of S
igna
l
1201101009080706050403020m/z
0.120.080.040.00
0.300.200.100.00
0.300.200.100.00
0.300.200.100.00
0.250.200.150.100.050.00
Amine
Sulfate-OA
Nitrate-OA
Chloride
HOA
OOA29 3043
44
4143
5557
6769
71
3616 17
1716 30
46
1716
48 64
30
86585646
Figure 5.Mass spectra of factors from the six-factor solution from PMFFull MS analysis. Bars represent the central, chosen rotation, and dotsshow the range in mass spectral variation from FPeak rotations (−10 and 10).
study, the measurement site was located in an urban indus-trial setting, with known amine sources located nearby: awastewater reclamation plant and a major amine chemicalmanufacturer were located 1 and 13 km to the southwest,respectively. According to the TRI and NPRI inventories,the amine manufacturer was the largest monitored emitter ofTEA in 2005 in the Windsor–Detroit region (EnvironmentCanada, 2013; US EPA, 2013b). The strong southwest direc-tionality observed in the CPF (Fig. 8a) indicated that both ofthese sources may have contributed. The sharp bursts in tem-porality were consistent with local sources such as fugitiveemissions from industrial operations.
In order to quantify the Amine factor’s mass concentra-tion, it was necessary to obtain an estimate of the factor’seffective RIE. Unfortunately, an effective RIE could not be
determined through application of the traditional AMS frag-mentation table, as the factor contained amines that were notrepresented in the table. It is possible to alter the fragmenta-tion table to include additional species, provided the nature ofthe measured species is known and a species fragmentationpattern is available. This has previously been accomplished,for instance, with methanesulfonic acid (MSA) (Zorn et al.,2008; Langley et al., 2010; Chang et al., 2011). In a studyby Chang et al. (2011), MSA could be positively identifieddue to unique marker fragments and a lack of interferingspecies, and its mass could be calculated through applicationof a laboratory-determined fragmentation pattern and RIE(Chang et al., 2011). Taking this approach was not obviousfor the present study, as the particular amine compound(s)could not be identified easily, and there was a possibility that
www.atmos-chem-phys.net/14/8017/2014/ Atmos. Chem. Phys., 14, 8017–8042, 2014

8026 M. L. McGuire et al.: Enhancing non-refractory aerosol apportionment from an urban industrial site
0.150.100.050.00
Frac
tion
of O
rgan
ic S
pect
rum
Sig
nal
100908070605040302010m/z
0.150.100.050.00
0.150.100.050.00
0.150.100.050.000.150.100.050.00
Sulfate-OA
Chloride
Nitrate-OA
HOA
OOA
Figure 6. Mass spectra of the organic fraction of the factors from the six-factor solution from PMFFull MS analysis. The Amine factor is notshown due to insufficient information regarding the chemical nature of the Amine factor. Bars represent the central, chosen rotation, and dotsshow the range in mass spectral variation from FPeak rotations (−10 and 10).
the factor represented a linear combination of different aminespecies with different RIEs and fragmentation patterns.
Nonetheless, the nature of the Amine factor was investi-gated to determine a potential factor RIE for mass estimation.Amines have been shown to exhibit a wide range of RIEs,depending on their chemical nature. AMS measurements ofamines present in salt form, such as methylammonium chlo-ride, dimethylammonium chloride, and trimethylammoniumchloride, have shown that the amine fraction in these com-pounds can display RIEs from 5 to 10 (Silva et al., 2008).However, oxidized alkyl amines such as trimethylamine-n-oxide (TMAO) have been shown to ionize with an RIE of 1.3,a value closer to organics (RIE= 1.4) (Silva et al., 2008).It has been hypothesized that aminium salts exhibit a rela-tively high RIE due to surface ionization on the AMS vapor-izer, similar to that observed for potassium salts (Silva et al.,2008). Depending on the type of amine compound or mixtureof compounds the Amine factor represents, its RIE may thuslie within a wide range (i.e., 1.3–10).
A reasonable estimate of an effective RIE for the Aminefactor was sought by examining the data for a dominant par-ticle phase amine formation pathway, namely for signs ofaqueous dissolution, acid–base reaction, or oxidation (Geet al., 2011). First, the amine factor time series was exam-ined relative to external measurements. Dissolution into wa-ter droplets was investigated by comparing the time serieswith periods of rain, fog, or high RH: no association could beidentified, as the Amine factor often appeared on clear days
with lower RH. Reaction with acidic species was also consid-ered through time series analysis of the extent of neutraliza-tion, a useful metric for determining periods of particle acid-ity. However, this metric cannot provide reliable information,as NO−
3 cannot be quantified properly prior to PMF analysis,due to amine interferences. The temporality of the Aminefactor was also investigated because the daytime maximumidentified for a similar factor identified by Sun et al. (2012)suggested that photo-oxidation and condensation can also bea likely formation pathway (Sun et al., 2012). However, noconsistent diurnal trend was noted. Docherty et al. (2011)reported similar difficulty in determining the origins of anamine-related factor through time series analysis of resultsfrom a PMFOrg MS analysis (Docherty et al., 2011).
Mass spectral comparison to laboratory-generated amineMS provided a better indication of the chemical nature of theAmine factor. Among comparisons with mass spectra fromsuspected amine compounds reported in the NIST library,the Amine factor’s profile was most similar to that of tri-ethylamine (TEA: C6H15N, 101 g mol−1), as demonstratedin Fig. S2.1 in the Supplement (r2
= 0.23) (Stein, 2013).However, direct comparisons between AMS and NIST massspectra are interpreted with caution, as they use different ion-ization techniques that can lead to mass spectral differences(Canagaratna et al., 2007a). Nonetheless, the amine spec-tra showed the same characteristic peaks (i.e.,m/z 56, 58,and 86).
Atmos. Chem. Phys., 14, 8017–8042, 2014 www.atmos-chem-phys.net/14/8017/2014/

M. L. McGuire et al.: Enhancing non-refractory aerosol apportionment from an urban industrial site 8027
(b)
(d)
3.0
2.5
2.0
1.5
1.0
0.5
0.0
Mass C
oncentr
ation (
ug m
-3)
Sulfa
te-O
A
Chlo
ride
Nitra
te-O
A
HO
A
OO
A
Am
ine
Species
SO4
2-
Org
NO3
-
NH4
+
Chl
TEA+
(a)
1.0
0.8
0.6
0.4
0.2
0.0
Ma
ss F
ractio
n
Su
lfate
-OA
Chlo
ride
Nitra
te-O
A
HO
A
OO
A
Am
ine
PMF Factor
(c) 1.0
0.8
0.6
0.4
0.2
0.0
Ma
ss F
ractio
n
SO
4
2-
Org
NO
3
-
NH
4
+
Ch
l
TE
A+
Species
2.0
1.5
1.0
0.5
0.0
Ma
ss C
on
ce
ntr
atio
n (
ug
m-3
)
SO
4
2-
Org
NO
3
-
NH
4
+
Ch
l
TE
A+
PMF Factor Sulfate-OA Nitrate-OA Chloride HOA OOA Amine
Figure 7. Chemical composition by factor and species components of the six PMF factors from the PMFFull MS analysis.
Examination of AMS mass spectra of amines providedfurther perspective. Amines have been studied by AMS inchamber experiments to examine potential reaction path-ways, for example oxidation, such as by nitrate radicals(Murphy et al., 2007; Silva et al., 2008; Malloy et al., 2009)and reaction with acid gases such as HNO3 (Murphy et al.,2007; Silva et al., 2008). These different mechanisms canactually lead to similar mass spectra (Malloy et al., 2009).The MS of the Amine factor in this study was determinedto be very similar to that of TEAN reported by Murphy etal. (2007), resultant from reaction between TEA and HNO3,with signals atm/z 30, 46, 58, 86 and 100 (Murphy et al.,2007). One sign of reaction formation of amine salts fromreaction with HNO3, as reported by Malloy et al., is the pres-ence of significant signals from NO+ and NO+
2 (at m/z 30and 46) (Malloy et al., 2009). Examination of the MS fromthe Amine factor showed that the signal was very high atm/z 30, and some signal was also present atm/z 46, althoughas mentioned previously,m/z 30 can also represent CH4N+
and CH2O+. There were no mass spectral signs to suggestan oxidation mechanism over salt formation. Ultimately, thefactor was interpreted as being dominated by TEAN.
With this interpretation, an effective RIE for the factorwas calculated. This was achieved by assuming a neutralized
factor, and that TEAN was the only component. Thoughthere did appear to be other contributions (e.g., SO2−
4 ), theseappeared to be very low. The nitrate fraction was calculatedusing the nitrate fragmentation pattern, withm/z 30 alteredto reflect the isotopic ratio betweenm/z 30 and 46 obtainedfrom calibration. The RIE of the amine fraction was deter-mined by assuming factor neutrality, and that the remainingmass following subtraction of nitrate was triethylammonium.An RIE for the amine fraction of 6.0 was determined fromthis calculation, which fell within the range of RIEs previ-ously measured for various amine salts. With the nitrate frac-tion taken into consideration, an effective RIE of 4.3 was es-tablished. This amine salt interpretation appeared to providereasonable mass concentrations, as the calculated RIE re-sulted in spikes (< 2 h) reaching a magnitude of 4.8 µg m−3,while an RIE of 1.3, reflective of oxidized amines, resultedin concentrations exceeding 15 µg m−3. While the factor wasassumed to be dominated by TEAN, its exact nature couldnot be validated; no amine fragmentation pattern provedan exact match, and external high time-resolution collo-cated sub-micron PM mass measurements were not avail-able to validate the RIE through PM mass comparison. Inconsidering acid–base chemistry, calculations by Murphy etal. (2007) have shown that the formation of aminium salts
www.atmos-chem-phys.net/14/8017/2014/ Atmos. Chem. Phys., 14, 8017–8042, 2014

8028 M. L. McGuire et al.: Enhancing non-refractory aerosol apportionment from an urban industrial site
0
45
90
135
180
225
270
315
0% 8% 16%
<=5>5 - 10>10 - 15>15
(b) Sulfate-OA Factor (a) Amine Factor (c) Nitrate-OA Factor
(d) Chloride Factor (e) HOA Factor (f) OOA Factor
(g) Wind rose
0
45
90
135
180
225
270
315
0 0.5 1
0
45
90
135
180
225
270
315
0 0.4 0.8
0
45
90
135
180
225
270
315
0 0.4 0.8
0
45
90
135
180
225
270
315
0 0.4 0.8
0
45
90
135
180
225
270
315
0 0.4 0.8
0
45
90
135
180
225
270
315
0 0.4 0.8
Figure 8. Conditional probability function (CPF) plots for the six factors from the six-factor solution of the PMFFull MS analysis, along witha wind rose plot (wind speed in m s−1). The strongest wind dependence is observed for the Amine and Sulfate-OA factors, which showstrong, yet slightly different directional associations to the southwest.
from the reaction of HNO3 and TEA is only thermodynam-ically favorable in the presence of very low NH3 (Murphyet al., 2007). These conditions may have been provided byplumes from a nearby source.
Four studies to date have identified an amine-related factorthrough PMF of AMS mass spectra to the authors’ knowl-edge (Aiken et al., 2009; Docherty et al., 2011; Hildebrandtet al., 2011; Sun et al., 2012). The analyses by Aiken etal., Docherty et al. (2011) and Hildebrandt et al. (2011) allextracted the amine factors from PMF of the organic MS,while Sun et al. (2012) extracted it from the full MS. Sincethe former three applied PMF only to the organic MS, sig-nificant mass that may have been associated with this factor(i.e.,m/z 30) was potentially not captured. Furthermore, thelatter study did not take into account the potential for a widerange of RIEs for the amine-related species, as highlightedby Silva et al. (2008) and discussed in this study. Regardless
of the exact methodology, it can be seen that PMF can beeffective in resolving atypical factors such as amines.
3.1.2 Sulfate-OA factor
The time series and mass spectral profile of the Sulfate-OA factor are shown in Figs. 4 and 5, respectively, and thechemical composition breakdown for this factor is shownin Fig. 7. A mass spectral comparison between the Sulfate-OA factor and the published MS of atomized (NH4)2SO4(Hogrefe et al., 2004) shows that they exhibit the samemajor peaks atm/z 16, 17, 48, 64, 80, and 81, and com-pare well with anr2 of 0.74. The Sulfate-OA factor on av-erage contributed 1.81 µg m−3, or 25 %, to the sub-micronPM mass, and showed the highest mass concentrations to-wards the beginning of the campaign, when air masses orig-inated from the south. Overall, this factor showed a slightcorrelation with PM2.5 mass concentration (r2
= 0.21). A
Atmos. Chem. Phys., 14, 8017–8042, 2014 www.atmos-chem-phys.net/14/8017/2014/

M. L. McGuire et al.: Enhancing non-refractory aerosol apportionment from an urban industrial site 8029
Table 2. Chemical composition of the six factors from the PMFFull MS analysis, extent of neutralization, and F44 for each factor’s organicfraction.
PMF factor Sub-micron AMS species (factor mass fractional NeutExt F44PM mass contribution)
(µg m−3) (%) SO2−
4 Org NO−
3 NH+
4 Cl−
Sulfate-OA 1.81 25 0.49 0.21 0.09 0.21 0.01 0.99 0.15Nitrate-OA 3.19 45 0.06 0.16 0.58 0.20 0.00 1.04 0.12Chloride 0.34 5 0.18 0.13 0.13 0.27 0.28 1.09 0.03HOA 0.94 13 0.01 0.85 0.09 0.05 0.00 1.62 0.01OOA 0.78 11 0.00 0.93 0.07 0.00 0.00 – 0.09Amine 0.07 1 – – 0.38 – – – –
moderate correlation with SO2 (r2= 0.31) implied that this
factor was likely not only influenced by long-range transport,but also by local sources. A more local influence was deter-mined through examination of these temporal trends, whichshowed that several spikes in the Sulfate-OA factor coincidedwith large spikes (up to 58 ppb) of SO2. Local (within themetropolitan area) and local-to-regional (within∼ 100 km)geographic origins for the Sulfate-OA factor were investi-gated by CPF. This highlighted a strong association withemissions from the southwest (Fig. 8b), which was consistentwith some local and local-to-regional coal-fired power plants(Fig. 1). Three large SO2−
4 spikes were observed on 19, 24,and 27 January: the first two were associated with the west–southwest, and the last with the southeast, and all of themwere likely associated with local coal-fired power plants. Asmaller, yet still significant influence from the northeast wasalso observed, which may have been associated with emis-sions from coal plants located to the northeast. The afore-mentioned spikes were all associated with large excursions inSO2 (24, 34, and 58 ppb, respectively), and each lasted about2–6 h. While the CPF on the whole demonstrated strongdirectionality to the southwest, this method cannot resolvehow far away the responsible source(s) are actually located.Since southwesterly winds in Windsor are also consistentwith typical synoptic flows for this region, even in winter,and there are known large SO2 emissions sources locatedfarther away in the Ohio River valley, regional influencesfor the Sulfate-OA factor were also investigated using thePSCF (Fig. 9a). The PSCF calculations for all factors wereperformed using data greater than the 50th percentile, but forthe Sulfate-OA factor, the three spikes associated with morelocal emissions were removed. The PSCF highlighted high-probability source regions around the Ohio River valley, anarea known as a major SO2 source due to the presence ofmany large coal-fired power plants. A dominant regional in-fluence was also demonstrated by a reasonably constant di-urnal profile (Fig. 11a). The geographic origins of the fac-tor were also consistent with those of a sulfate factor derivedfrom a long-term receptor modeling study of Windsor (Jeong
0 290 580 870 1,160145km
LakeMichigan
LakeHuron Lake Ontario
Lake Erie
Canada
United States
SO2 emissions (tons/yr)Windsor
0 - 5,0005,001 - 15,00015,001 - 25,000
25,001 - 45,000
45,001 - 70,000
70,001 - 115,000
115,001 - 200,000
PSCF Probability0 - 0.50.5 - 0.60.6 - 0.70.7 - 0.80.8 - 0.90.9 - 1
a)
0 290 580 870 1,160145km
LakeMichigan
LakeHuron Lake Ontario
Lake Erie
Canada
United States
b)
Figure 9. Potential source contribution function (PSCF) plot forthe Sulfate-OA(a) and Nitrate-OA(b) factors from the PMFFull MSanalysis. Both factors showed regional source influences, with theSulfate-OA factor showing more prominent, distant influences tothe south and southwest. The Nitrate-OA factor showed the mostprominent influences to the southwest, over Indiana and Illinois.
et al., 2011), and the nearby rural location of Harrow, Ontario(McGuire et al., 2011).
As the NH+
4 and SO2−
4 contained within the Sulfate-OAfactor likely formed an (NH4)2SO4 salt, the extent of neutral-ization was calculated (Table 2). It was assumed that the onlyspecies capable of participating in the neutralization reaction,in this factor and in others, were NH+4 , NO−
3 , SO2−
4 , and Cl−.Aminium species were assumed to have been effectively sep-arated into the Amine factor through PMF, and thus it wasassumed that they did not contribute to the neutralization of
www.atmos-chem-phys.net/14/8017/2014/ Atmos. Chem. Phys., 14, 8017–8042, 2014

8030 M. L. McGuire et al.: Enhancing non-refractory aerosol apportionment from an urban industrial site
other factors. The extent of neutralization (NeutExt), reportedas the ratio of cations/anions in units of molar equivalents,was defined by
NeutExt =
NH+
418
2SO2−
496 +
NO−
362 +
Chl35.5
, (4)
where a neutral factor shows a NeutExt of 1, and acidic factorsshow values less than 1.
The extent of neutralization of the Sulfate-OA factorwas 0.99, indicating that the factor was reasonably neutral.It should be noted that a source of uncertainty in this valuelies in the use of default RIE values for most species. Despitethis potential uncertainty, the factor appeared neutral, simi-lar to several other factors. Rotational analysis showed thatthe composition of this factor, and thus the degree of neu-tralization, did not change with FPeak rotations (Fig. S2.5in the Supplement). This suggested that regional rather thanlocal sources of SO2−
4 had a greater influence on the chem-ical composition of this factor. While the Sulfate-OA fac-tor appeared neutralized, simultaneous SO2 and SO2−
4 spikessuggested contributions from more local, possibly primarySO2−
4 emissions sources, which may have been more acidic.As highlighted in Fig. 10a, these SO2−
4 events, while highin mass, did not account for a significant fraction of the to-tal sulfur, due to the magnitude of the coincident SO2 spikes(up to 65 ppb, 1 min average). This could be attributed to theobserved winter conditions that do not favor rapid oxidationof SO2. Interestingly, a smaller SO2−
4 size distribution wasobserved during these spikes (from AMS p-ToF data), sub-stantiating local SO2−
4 contributions. Figure 10b shows thatSO2−
4 measured over the entire campaign showed an averagemodal size of 500 nm (accumulation mode consistent with re-gional transport), while the size modes observed during thespikes were much smaller (150–250 nm). These results indi-cate that proximate sources of SO2−
4 contributed to the totalSO2−
4 , particularly during the largest SO2−
4 spikes.Examination of the residuals from the six-factor solution
shows that some AMS signal cannot be accounted for duringthe Sulfate-OA factor/SO2−
4 spikes, indicating that anotherfactor may be required to explain more fully the mass dur-ing these spikes. As a result, higher-order solutions were in-vestigated, and are reported in the Supplement. Figure S2.12in the Supplement shows that at eight factors, the Sulfate-OA factor split into two factors: a regional sulfate factor thatwas characterized by synoptic-scale temporal rises, and a lo-cal sulfate factor that captured the SO2−
4 spikes. While thelocal sulfate factor appeared meaningful in that it capturedresidual SO2−
4 , the eight-factor solution could not be justi-fied for several reasons, which are further detailed in the Sup-plement. First, while the local sulfate factor appeared acidic(NeutExt = 0.25), consistent with more local origins, the re-gional sulfate factor in the eight-factor solution now appearedover-neutralized (NeutExt = 1.27) relative to a reasonably
2.5
2.0
1.5
1.0
0.5
0.0
dM/d
logD
va (
µg m
-3)
102 3 4 5 6
1002 3 4 5 6
10002
Vacuum Aerodynamic Diameter (nm)
(b) SO42-
campaign average SO4
2- during SO4
2- spikes
1.0
0.5
0.0Fra
ctio
n
SO
42-
/ Tot
al S
1/13 1/18 1/23 1/28Day of Year
8
6
4
2
0
SO
4 2-
Con
cent
ratio
n
(ug
m-3
)
60
50
40
30
20
10
0
SO
2(g) Concentration (ppb)
pSO42-
SO2
SO42-/ Total S
(a)
230º 250º
100º
90º
Figure 10. Particulate sulfate concentration (SO2−
4 )
vs. SO2(g) concentration, and fraction of SO2−
4 /Total S (To-
tal S = SO2−
4 + SO2) (a). Due to the winter conditions, the
fractional contribution ofpSO2−
4 to total S was typically verylow. Shown in (b) are the averaged particle size distributionsof AMS SO2−
4 over the entire campaign, as well as during the
extreme SO2−
4 spikes. Particulate SO2−
4 measured during thespikes appeared highly local due to their significantly smallermodal diameters.
unchanged and neutral Nitrate-OA factor. Second, the OOAfactor appeared split, resulting in an OA factor that did notshow a strong enough resemblance to any known, ambientdeconvolved OA. Finally, the correlation between HOA fac-tor MS from the eight-factor solution and the reference HOAwas worse than in lower-order solutions. Mass spectral exam-ination showed that more signal was apportioned tom/z 16and 17 in higher-order solutions; this effect was mainly at-tributed to solution uncertainty, as FPeak analysis of the six-factor solution showed some variability in these fragmentsupon rotation. Although the Sulfate-OA factor from the six-factor solution did not capture fully the variability and typesof SO2−
4 observed, it appeared stable, with a low degree ofrotational uncertainty (Fig. S2.5 in the Supplement). It ispossible that the local sulfate factor could be extracted moredefinitively if it were more prominent in the data set. How-ever, resolving acidic factors may not always be realistic, asdata quality, receptor site complexity and atmospheric dy-namics can all influence factor resolution. Nonetheless, re-solving acidic factors could be useful from a parameteriza-tion perspective for resolving the effects of acidic aerosolson health, impacts on materials, or acidic seed particle chem-istry, such as the competition between NH3 and organic gasuptake to acidic SO2−
4 containing particles (Liggio et al.,2011; Liggio and Li, 2013).
Atmos. Chem. Phys., 14, 8017–8042, 2014 www.atmos-chem-phys.net/14/8017/2014/

M. L. McGuire et al.: Enhancing non-refractory aerosol apportionment from an urban industrial site 8031
5
4
3
2
1
0
HO
A F
acto
r (u
g m
-3)
201612840
Hour of Day
(c)2.5
2.0
1.5
1.0
0.5
0.0O
OA
Facto
r (u
g m
-3)
201612840
Hour of Day
(d)
12
8
4
0Nitra
te-O
A F
acto
r (u
g m
-3)
201612840
Hour of Day
(b)
6
4
2
0
Sulfa
te-O
A F
acto
r (u
g m
-3)
201612840
Hour of Day
(a)
-20
-10
0
10
Te
mp
era
ture
(ºC
)
201612840
Hour of Day
(e)
Figure 11.Boxplots of diurnal trends for the Sulfate-OA(a), Nitrate-OA(b), HOA (c), and OOA(d) factors, from the PMFFull MS analysis,along with temperature(e). Boxes indicate interquartile ranges, horizontal lines indicate median hourly values, cross markers indicate hourlymeans, and whiskers represent the 5th and 95th percentiles. The HOA factor demonstrated a strong diurnal trend consistent with trafficpatterns, while the OOA factor demonstrated a trend more consistent with daytime lows and overnight highs. The Nitrate-OA factor showeda minor diurnal trend indicative of more regional contributions as compared to OOA, while the Sulfate-OA factor showed a minimal diurnaltrend.
The organic fraction of the Sulfate-OA factor was ex-tracted for comparison with the organic fraction of otherfactors, as well as published organic factor MS (Fig. 6).Uncertainty in the organic fraction was assessed throughrotational analysis, and was found to be low, suggestingthat these organics were reasonably rotationally fixed. Theorganic composition amongst factors extracted using thePMFFull MS analysis was assessed against that from otherstudies. Only one of the past three similar studies, that ofSun et al. (2012), was sufficiently similar for comparison;Chang et al. (2011) involved Arctic aerosol, and the analy-sis by Crippa et al. (2013b) only involved the organics and
SO2−
4 . The Sulfate-OA factor contained 21 % of organics bymass, accounting for 16 % of the total measured organics;interestingly, this value was the same as that produced in theanalysis by Sun et al. (2012). Although both of these stud-ies were conducted in highly urban environments, such anagreement is interesting, considering that different organicfactors were found. Compared to other factors from thisstudy with significant organic content (i.e.,> 15 % by mass),the Sulfate-OA factor organics were most similar to typi-cal OOA mass spectra, and were the most highly oxidizedaccording to the associated F44 and O/C ratios. The F44metric (fractional contribution ofm/z 44 within the organic
www.atmos-chem-phys.net/14/8017/2014/ Atmos. Chem. Phys., 14, 8017–8042, 2014
8032 M. L. McGuire et al.: Enhancing non-refractory aerosol apportionment from an urban industrial site
MS) has been used in PMFOrg MS studies to assess the de-gree of oxygenation of OOA factors, as it primarily repre-sents CO+2 , the most prevalent oxygenated fragment withinthe organic MS. An empirical relation between F44 and theatomic oxygen to carbon ratio (O/C) within a PMF–OOAfactor has been developed based on a collection of laboratoryand field study data (based on PMFOrg MS analyses) (Aikenet al., 2008), and has been used to estimate the O/C ratio forsimilar factors in other studies, including previous PMF stud-ies of combined organic and inorganic mass spectra (Changet al., 2011; Sun et al., 2012; Crippa et al., 2013b). An F44of 0.15 (estimated O/C= 0.65) was calculated for this factor,the highest value from this study, and consistent with the av-erage values obtained for OOA for two-component OA datasets (i.e., HOA and OOA) across the Northern Hemisphere(F44= 0.14± 0.04, O/C= 0.62± 0.15, mean±1σ ) (Ng etal., 2010).
Many previous AMS PMF studies have shown that a highdegree of correlation exists between SO2−
4 and OOA (Lanzet al., 2008; Ulbrich et al., 2009; Slowik et al., 2010; Richardet al., 2011). However, this analysis has been useful for sub-apportionment of the oxygenated organic fraction of OA todifferent factors, as the Sulfate-OA factor was found to con-tain a notable fraction (31 %) of the total OOA (defined hereas the proportion ofm/z 44 signal apportioned to this factor,excluding the Amine factor) and, in this case, the most ox-idized fraction of the OOA. The higher degree of oxygena-tion exhibited by this factor is consistent with its regionalorigins from the south and a longer atmospheric lifetime.Although the mixing state of particles associated with thisfactor cannot be positively deduced from these data, two ex-tremes exist. Either this factor mainly represents externallymixed OOA and (NH4)2SO4 particles that exhibit similartemporality due to regional transport, or it represents inter-nally mixed (NH4)2SO4 particles coated by lower-volatilitySOA during regional transit.
In summary, the Sulfate-OA factor was neutralized and as-sociated with the most highly oxygenated organics. Cross-apportionment of the most oxygenated organics measuredduring this campaign further reinforced this factor’s aged,regional nature. While the Sulfate-OA factor appears to bedominated by regional transport of neutralized ammoniumsulfate, minor contributions from more local, primary SO2−
4sources were present as well.
3.1.3 Nitrate-OA factor
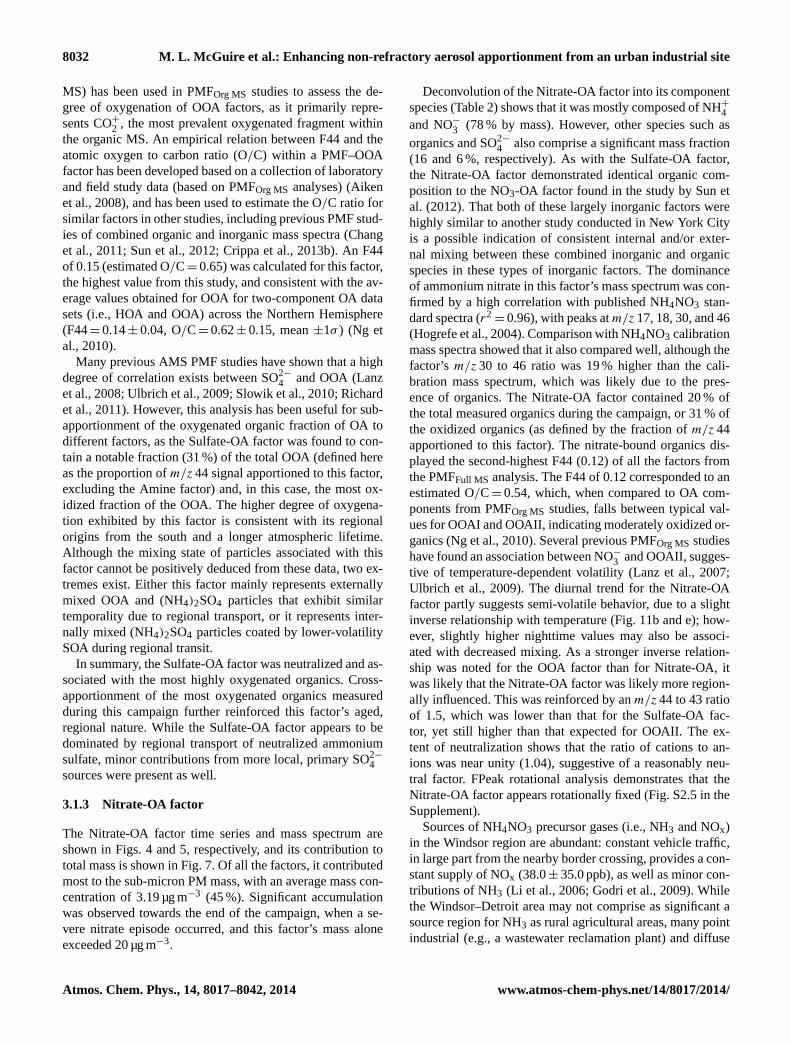
The Nitrate-OA factor time series and mass spectrum areshown in Figs. 4 and 5, respectively, and its contribution tototal mass is shown in Fig. 7. Of all the factors, it contributedmost to the sub-micron PM mass, with an average mass con-centration of 3.19 µg m−3 (45 %). Significant accumulationwas observed towards the end of the campaign, when a se-vere nitrate episode occurred, and this factor’s mass aloneexceeded 20 µg m−3.
Deconvolution of the Nitrate-OA factor into its componentspecies (Table 2) shows that it was mostly composed of NH+
4and NO−
3 (78 % by mass). However, other species such asorganics and SO2−
4 also comprise a significant mass fraction(16 and 6 %, respectively). As with the Sulfate-OA factor,the Nitrate-OA factor demonstrated identical organic com-position to the NO3-OA factor found in the study by Sun etal. (2012). That both of these largely inorganic factors werehighly similar to another study conducted in New York Cityis a possible indication of consistent internal and/or exter-nal mixing between these combined inorganic and organicspecies in these types of inorganic factors. The dominanceof ammonium nitrate in this factor’s mass spectrum was con-firmed by a high correlation with published NH4NO3 stan-dard spectra (r2
= 0.96), with peaks atm/z 17, 18, 30, and 46(Hogrefe et al., 2004). Comparison with NH4NO3 calibrationmass spectra showed that it also compared well, although thefactor’s m/z 30 to 46 ratio was 19 % higher than the cali-bration mass spectrum, which was likely due to the pres-ence of organics. The Nitrate-OA factor contained 20 % ofthe total measured organics during the campaign, or 31 % ofthe oxidized organics (as defined by the fraction ofm/z 44apportioned to this factor). The nitrate-bound organics dis-played the second-highest F44 (0.12) of all the factors fromthe PMFFull MS analysis. The F44 of 0.12 corresponded to anestimated O/C= 0.54, which, when compared to OA com-ponents from PMFOrg MS studies, falls between typical val-ues for OOAI and OOAII, indicating moderately oxidized or-ganics (Ng et al., 2010). Several previous PMFOrg MS studieshave found an association between NO−
3 and OOAII, sugges-tive of temperature-dependent volatility (Lanz et al., 2007;Ulbrich et al., 2009). The diurnal trend for the Nitrate-OAfactor partly suggests semi-volatile behavior, due to a slightinverse relationship with temperature (Fig. 11b and e); how-ever, slightly higher nighttime values may also be associ-ated with decreased mixing. As a stronger inverse relation-ship was noted for the OOA factor than for Nitrate-OA, itwas likely that the Nitrate-OA factor was likely more region-ally influenced. This was reinforced by anm/z 44 to 43 ratioof 1.5, which was lower than that for the Sulfate-OA fac-tor, yet still higher than that expected for OOAII. The ex-tent of neutralization shows that the ratio of cations to an-ions was near unity (1.04), suggestive of a reasonably neu-tral factor. FPeak rotational analysis demonstrates that theNitrate-OA factor appears rotationally fixed (Fig. S2.5 in theSupplement).
Sources of NH4NO3 precursor gases (i.e., NH3 and NOx)in the Windsor region are abundant: constant vehicle traffic,in large part from the nearby border crossing, provides a con-stant supply of NOx (38.0± 35.0 ppb), as well as minor con-tributions of NH3 (Li et al., 2006; Godri et al., 2009). Whilethe Windsor–Detroit area may not comprise as significant asource region for NH3 as rural agricultural areas, many pointindustrial (e.g., a wastewater reclamation plant) and diffuse
Atmos. Chem. Phys., 14, 8017–8042, 2014 www.atmos-chem-phys.net/14/8017/2014/

M. L. McGuire et al.: Enhancing non-refractory aerosol apportionment from an urban industrial site 8033
(e.g., traffic, population) sources do emit large quantities ofNH3. According to Environment Canada’s NAPS monitoringnetwork, NH3 levels are lowest in wintertime in Windsor, yetare still detectable: using the multi-year average NH3 winter-time concentration measured by ion chromatography, the av-erage wintertime NH3 concentration in downtown Windsorbetween 2004 and 2007 was 0.5± 0.6 ppb, which exceedsthe 0.1 ppb detection limit for this analytical method. Fig-ure 11b presents the diurnal trend for the Nitrate-OA factor.Noted along with a slight diurnal profile that was likely in-fluenced by both temperature (Fig. 11b) as well as reducedmixing overnight and into the early morning, were two smallpeaks consistent with morning and afternoon rush-hour traf-fic, at 09:00 and 17:00 LT (local time). These peaks werelikely due to NH4NO3 formation from traffic emissions. Amore general traffic contribution to the Nitrate-OA factor wasobserved by moderate and slight correlations with black car-bon (BC) (r2
= 0.31) and NO (r2= 0.17), respectively, both
traffic tracers.The geographic origins of the Nitrate-OA factor were ex-
plored. The CPF, presented in Fig. 8c, did not reveal anysignificant directionality; this indicated that this factor wasnot significantly influenced by any local point sources, butdid not discount potential contributions from local diffusesources such as traffic. The regional nature of the factor wasexplored through the PSCF (Fig. 9b), which highlighted ar-eas of high source probability to the south and southwest. Incomparison with the PSCF from the Sulfate-OA factor, theNitrate-OA factor also appeared more regionally influencedthan the Sulfate-OA factor, yet from less specific source re-gions. Regional influences are more likely in winter com-pared to summer in this location, as nitrate can persist and betransported greater distances provided there are cold enoughtemperatures. In summary, the Nitrate-OA factor contributedmost to sub-micron PM mass, was associated with moder-ately oxidized organics, and was likely attributed to both lo-cal and regional sources, with regional contributions likelydominating.
3.1.4 Chloride factor
Presented in Figs. 4 and 5, respectively, are the time seriesand mass spectral profile of the Chloride factor. The chemi-cal composition breakdown for this factor is shown in Fig. 7.Strong peaks observed atm/z 16 and 17 indicate signifi-cant NH+
4 content, while peaks atm/z 35, 36, 37 and 38indicate chloride. The factor appeared to be dominated byNH4Cl, as it compared well with the NIST mass spectrumfor this species (r2
= 0.71). The isotopic ratio ofm/z 35 tom/z 37 matched that from the AMS chloride fragmentationpattern (3.09). Application of the AMS fragmentation ta-ble to the MS demonstrates that NH+
4 and Cl− contributed28 and 27 %, respectively, to the mass of this factor; how-ever, other species were also evident, namely NO−
3 (13 %),organics (13 %), and SO2−
4 (18 %). This study represents the
first PMF analysis of AMS mass spectral data to apportionNH+
4 and Cl− to a unique factor suggestive of mostly ammo-nium chloride. The extent of neutralization (1.09) shows thatthis factor was fairly close to neutral, taking into account allidentifiable ions (i.e., NH+4 , Cl−, NO−
3 , and SO2−
4 ), and con-sidering potential PMF error and uncertainty in RIEs.
Interestingly, the factor was composed 13 % by mass oforganics (Fig. 6). The most significant organic peaks werem/z 29, 41, and 55, and a mass spectral delta pattern with1 = 0 (i.e.,m/z 27, 41, 55, 69, etc.) was noted (McLaffertyand Turecek, 1993). However, despite a distinct delta pat-tern, the factor showed rotational uncertainty that precludedover-interpretation of the factor’s organics. With negativerotations, the Cl− and NH+
4 content varied only slightly.However, rotation in both the positive and negative direc-tion caused significant changes to the organic fraction deltapattern: negative rotations caused the1 = 0 pattern to de-crease and the1 = 2 pattern (m/z 29, 43, 57, 71, etc.) to in-crease, while there was insignificant change in the organicmass spectral profile with positive rotations. As the organicprofile and content varied most significantly among all of theChloride factor components (from 18 to 40 % by mass), thedelta pattern could not be used with confidence for factoridentification. It should be noted that little uncertainty wasobserved for the SO2−
4 mass fraction of the Chloride factor,indicating that the SO2−
4 cross-apportionment was relativelyrobust. Although the Chloride factor showed the most un-certainty among all PMF factors (Fig. S2.5 in the Supple-ment), its appearance from five to eight factors suggested itwas robust.
The presence of NH4Cl aerosol in the atmosphere has pre-viously been noted. Pio and Harrison (1987a, b) performedearly experiments to assess the thermodynamic behavior ofNH4Cl under tropospheric conditions and found that, likeNH4NO3, NH4Cl formation is favored by lower tempera-tures and higher RH (Pio and Harrison, 1987a, b). The con-ditions associated with the Chloride factor were examined(i.e., temperature, RH, cloudiness, fog, rain) to determine ifrapid meteorological changes triggered gas-to-particle tran-sition. No association could be discerned. However, it shouldbe noted that from 14 January onward, on the whole, the con-ditions for NH4Cl were favorable, with a mean temperatureof −8± 5◦C and RH of 73± 13 %.
Although not measured directly, particulate NH4Cl hasbeen speculated to be present in several settings due to ahigh correlation between its component species. Perron etal. (2010) have reported NH4Cl-containing particles in aSwiss Alpine valley setting due to a significant correlationin NH+
4 and Cl− spikes, with Cl− likely emitted as KCl dur-ing biomass combustion (Perron et al., 2010). In a study inMexico City, Salcedo et al. (2006) reported large yet short-lived plumes of chloride, which were coincident with spikesin both NH+
4 and organics; the simultaneous appearance ofboth NH+
4 and Cl− indicated NH4Cl formation (Salcedo et
www.atmos-chem-phys.net/14/8017/2014/ Atmos. Chem. Phys., 14, 8017–8042, 2014

8034 M. L. McGuire et al.: Enhancing non-refractory aerosol apportionment from an urban industrial site
al., 2006). Precursor gases (e.g., NH3, HCl, and HNO3) andtheir sources are plentiful in this region. Although NH3 istypically the limiting agent in these reactions, in this region,point industrial (e.g., a wastewater reclamation plant) anddiffuse (e.g., traffic, population) sources of NH3 are numer-ous. There are thus two plausible mechanisms for NH4Clformation in the Windsor–Detroit region. In the first case,NH3 could react with primary HCl that has been emitted di-rectly by anthropogenic sources. According to NPRI and TRIemissions inventories, the largest primary emitter of HCl inWindsor–Detroit in 2005 was the River Rouge power plant,located 3 km southwest of the receptor site (EnvironmentCanada, 2013; US EPA, 2013b). However, secondary reac-tions may lead to HCl production, and eventually to NH4Clformation as well. It is possible that acidic, ammonia-poor,industrial plumes with sufficient HNO3 content may liberateHCl from certain sources, which then subsequently reparti-tions as NH4Cl to the particle phase under NH3-rich con-ditions. Some of these sources include NaCl particles fromroad salt and KCl from biomass burning emissions (includingcoal combustion and domestic wood burning). Waste incin-eration has also been identified as a potential source of short-duration, strong chloride events; Moffet et al. (2008a, b) re-ported Cl− spikes along with spikes in Zn- and Pb-containingparticles measured by ATOFMS in Mexico City (Moffet etal., 2008a, b). These events were attributed to rapid sec-ondary HCl formation from the reaction of HNO3 with PbCland ZnCl in a waste incineration plume. All of these sourceswere likely in this study: as mentioned previously, there areseveral coal plants near the site, and a waste incineratoris located to the northwest. Furthermore, given the winter-time conditions, domestic wood burning was prevalent in theregion.
Examination of the CPF (Fig. 8d) and PSCF (not shown)did not provide any additional information with respect tolocal or regional source origins. However, the concurrentappearance of sharp spikes in Cl− and SO2−
4 (Fig. 3), andmoreover the apportionment of significant SO2−
4 to this fac-tor, suggested an association with industrial emissions. Bothof these spikes corresponded to a 230–250◦ wind direction,consistent with coal plants to the west–southwest. Despitethese spikes having been partially captured by their respec-tive, reasonably neutralized PMF factors, the Cl− and SO2−
4observed in these spikes were likely not well neutralized, asconcurrent spikes in NH+4 at these times were not as strongas those observed for its counter-ions. Any available NH3 atthis time was likely partitioned as (NH4)2SO4 first, because(NH4)2SO4 formation should be thermodynamically morefavorable than NH4Cl formation under the given meteorolog-ical conditions. As such, while the Chloride factor appearedreasonably close to neutral on the whole, there was likelysome variation in acidity that was not captured by this factor,as more acidic particles appeared to be present during thespikes. Furthermore, the rotational uncertainty determined
through FPeak analysis may have been an indication of themore dynamic nature of this factor’s components. In sum-mary, the Chloride factor was most likely associated withlocal atmospheric processing, whereby ammonium chloridesecondary aerosol formed rapidly in-plume from the reactionof NH3 and HCl emissions. The source of HCl emissionsmay have been primary emissions from an industrial facility,and/or it may have formed from secondary reactions.
3.1.5 HOA factor
A hydrocarbon-like organic factor (HOA) was extracted byPMF, and its time series and mass spectral profile are pre-sented in Figs. 4 and 5, respectively. The factor’s chemicalcomposition is shown in Fig. 7. Accounting for 0.94 µg m−3
or 13 % of the sub-micron PM mass during the campaign, theHOA factor represented the third-largest contributor to sub-micron PM mass. Delta patterns of1 = 0 and1 = 2 wereobserved in the mass spectral profile, most likely correspond-ing to alkanes and H2-neutral losses from alkyl fragmentsand/or alkenes, respectively (McLafferty and Turecek, 1993;Zhang et al., 2005). The extracted HOA factor was similar tothose from the Pittsburgh fall of 2002 (Ulbrich et al., 2009)and Zurich winter of 2006 (Lanz et al., 2008) studies, withr2 values of 0.56 and 0.66, respectively.
Deconvolution of the HOA MS into organic and inorganicspecies was performed using the AMS fragmentation table.Contributions from NH+4 (5 %) and NO−3 (9 %) were noted,indicating that this factor was likely mixed with NH4NO3.FPeak rotational analysis shows that, although the contri-butions of these species were moderate, their variation withrotation precluded their over-interpretation (Fig. S2.5 in theSupplement). A less-than-plausible extent of neutralizationof 1.62 also served to highlight the rotational ambiguity as-sociated with the inorganics, although this uncertainty couldbe a result of low overall inorganic contributions. With an or-ganic composition of 85 %, it was not as similar to the HOAfactor found in Sun et al. (2012) (97 %) as it was for otherfactors.
HOA is often referred to as a surrogate for fossil fuel com-bustion emissions, with traffic cited as the most significantsource contributor (Aiken et al., 2008). The same can be saidfor this study; moderater values of 0.48 and 0.64 were foundbetween the HOA factor with BC and NO, respectively, pol-lutants that are typically associated with relatively fresh traf-fic emissions. The HOA factor also displayed moderate andslight correlations with CO (r2
= 0.41), particle number con-centration (r2
= 0.21), and aromatic hydrocarbons measuredby PTR-MS, such as benzene (m/z 79, r2
= 0.43), toluene(m/z 93, r2
= 0.32), C2–benzene (m/z 107, r2= 0.58), and
C3–benzene (m/z 121, r2= 0.54), which are also typically
associated with primary anthropogenic emissions such astraffic (Vlasenko et al., 2009). Distinct rush hour peaks inthe morning (05:00–09:00 LT) and evening (18:00–22:00 LT)further supported source attribution to traffic emissions
Atmos. Chem. Phys., 14, 8017–8042, 2014 www.atmos-chem-phys.net/14/8017/2014/

M. L. McGuire et al.: Enhancing non-refractory aerosol apportionment from an urban industrial site 8035
(Fig. 11c). The CPF for the HOA factor provides modestsupport for a traffic source, as excursions in this factor weremoderately associated with the northeast wind sector (0–90◦), consistent with higher traffic density from the inter-national border crossing (Fig. 8e). While general circulationtraffic is also likely to be a significant contributor to the HOAfactor, many industrial operations in the region combust fos-sil fuels in their processes, for instance heavy machinery usedfor onsite material transport. As such, other sources may alsocontribute to this factor. The HOA factor thus representedprimary organic aerosol emissions, with its most significantcontributions likely emitted from traffic.
3.1.6 OOA factor
A factor consistent with oxygenated organic aerosol (OOA)was extracted using PMFFull MS, and its time series and MSare presented in Figs. 4 and 5, respectively. On average,the OOA factor comprised 0.76 µg m−3 or 11 % of the sub-micron PM mass. The fragmentation table was applied tothis factor to decouple the inorganic and organic speciesfor species-based mass spectral and temporal examination.The only other species associated with this factor was NO−
3(7 % by mass). While the OOA factor represented the lowestF44 compared to Sulfate-OA and Nitrate-OA (F44= 0.09), itcontained the highest fraction of oxygenated organic aerosol,as 35 % ofm/z 44 was apportioned to this factor. The ro-bustness of the factor mass spectrum was examined usingFPeak analysis. It was found that rotations caused the minorNO−
3 concentration to vary (Fig. S2.5 in the Supplement).With a lack of neutralizing species (i.e., NH+
4 ) present, thenitrate contribution may have been attributed to model er-ror. In examining the robustness of the F44 content throughFPeak analysis (Table S2.1 in the Supplement), it variedonly slightly, suggesting minor rotational ambiguity with re-spect to the oxygenated organic fragments. In terms of or-ganic composition, this factor’s organic composition (93 %)was most comparable to the LV-OOA factor from Sun etal. (2012), which comprised 94 % organics.
Comparing this F44 value with previous studies, it is ap-parent that the F44 observed in the OOA factor in this studyis lower than others from two-component organic results (Nget al., 2010). This observation highlights a distinct differencein PMFOrg MS vs. PMFFull MS. Typically, the contribution ofm/z 44 to the total organic spectrum is highest in the OOAfactor when PMF is applied to the organic MS only. How-ever, in this study it represents the third-most oxygenatedorganic component among the PMF factors, yet the highestcontributor to oxygenated organic aerosol. Compared withmass spectral profiles from other studies, this OOA factormore closely resembled semi-volatile OOAII factors, insteadof highly oxygenated OOAI factors, given the comparativelylow m/z 44/43 ratio. The diurnal trend provided further in-sight into the nature of the OOA factor (Fig. 11d). It canbe seen that this factor was significantly higher overnight
than during daylight hours, suggesting either buildup in con-centration in the nighttime boundary layer, or semi-volatilenighttime gas-to-particle partitioning. The latter was sus-pected, as lower concentrations were observed on warmernights, suggestive of a temperature–volatility concentrationdependence. In addition, the OOA factor exhibited a strongeranti-correlation with temperature than the Nitrate-OA fac-tor (r = −0.26), suggesting that temperature played a greaterrole in explaining the variability in the OOA factor than inthe Nitrate-OA factor. This was evident in increased contri-butions in the OOA factor mid-way through to the end of thecampaign, when the air was colder. These results show thatless oxygenated, and thus likely more local and semi-volatileOOA, appeared to be a significant fraction of the total oxy-genated organic aerosol.
The moderately oxidized and semi-volatile behavior ofthe OOA factor was further demonstrated through thehighest correlation between all factors with acetaldehyde(r2
= 0.31), a VOC with an atmospheric lifetime of less thana day. Slowik et al. also report observing high correlationsbetween a semi-volatile OOAII factor and acetaldehyde inToronto, Ontario (Slowik et al., 2009), and a similar conclu-sion can be drawn here that this factor’s variability is influ-enced by both the oxidation timescale as well as gas–particlepartitioning. Ultimately, this factor more closely resemblesOOAII rather than OOAI.
The geographic origins of the OOA factor were investi-gated by both CPF and PSCF. The CPF, shown in Fig. 8f,shows a similar result as was found for the HOA factor, witha moderate association with emissions to the northeast, sug-gestive of contributions from traffic. However, on the whole,no strong directionality was observed, supporting local ox-idation of organic aerosol. The PSCF for this factor wasalso generated (not shown), although no distinct source re-gions could be identified, reinforcing the notion that trans-port was not responsible for the temporal behavior of OOAin Windsor’s wintertime air. Hence, the OOA factor mainlyrepresented local atmospheric processing, and appeared tobe characterized by less oxygenated, semi-volatile organicaerosol.
3.2 PMFFull MS vs. PMFOrg MS
As only two other studies to date have performed PMF onthe complete or near-complete MS, the following sectioninvestigates the effect of including both inorganics and or-ganics in the analysis. The two- to six-factor solutions fromPMFOrg MS were examined and compared to the six-factorPMFFull MS solution. Based on the mass spectral profiles andPMF diagnostics, the three-factor solution provided the mostphysically meaningful results. A two-factor solution gener-ated Amine and OOA factors, and moving to a three-factorsolution produced Amine, OOA and HOA factors similarin profile to those from the PMFFull MS analysis. Addinga fourth factor caused the OOA factor to split, leading to
www.atmos-chem-phys.net/14/8017/2014/ Atmos. Chem. Phys., 14, 8017–8042, 2014

8036 M. L. McGuire et al.: Enhancing non-refractory aerosol apportionment from an urban industrial site
53%
47%
32%
30%
16%
2% 20%
(d) PMFFull MS
PMFOrg MS
0.12
0.08
0.04
0.00Fra
ctio
n o
f S
igna
l
100908070605040302010
m/z
0.15
0.10
0.05
0.00
0.25
0.20
0.15
0.10
0.05
0.00
Amine Factor PMFOrg MS
PMFFull MS
OOA Factor PMFOrg MS
PMFFull MS
HOA Factor PMFOrg MS
PMFFull MS
(a)
(b)
(c)
2.0
1.5
1.0
0.5
0.0
Ma
ss C
on
ce
ntr
atio
n (
ug
m-3
)
SO
4
2-
Org
NO
3
-
NH
4
+
Ch
l
TE
A+
PMF Factor Sulphate-OA Nitrate-OA Chloride HOA OOA Amine
Figure 12.Comparison of factor profiles from the PMFOrg MS analysis with comparable factors found by PMF of the full mass spectra(a, b,c). The factors are normalized to the total organic fraction signal, except for the Amine factor, which is normalized to the total factor signal.Only minor differences in mass spectra are noted for the HOA factor. The most significant difference for the Amine factor is represented bythe addition of them/z 30 peak, and for the OOA factor by the difference in the magnitude of them/z 44 peak. Dots show the range in massspectral variation from FPeak rotations (−10 and 10). Also shown in(d) is the average factor composition of organics for both the PMF ofthe full mass spectrum and the organics only.
another with an MS that did not sufficiently resemble anyknown factors (or any of the organic fractions containedwithin the factors from the PMFFull MS solution). The sameapplied to the five- and six-factor solutions. A comparisonbetween higher-order solutions from the PMFOrg MS analysisand the organic fraction of the PMFFull MS six-factor solutionshowed that they did not contain the same information, in-dicating that organics were resolved differently between theanalyses. As the three-factor solution led to the most physi-cally meaningful results, it was compared with the six-factorPMFFull MS solution, and is discussed below. The three-factorsolution justification along with descriptions of the four- tosix-factor solutions are presented in the Supplement.
Overall, the organic fraction was mainly split into theHOA and OOA factors, whereby these factors each con-tributed 53 and 47 %, respectively, to the total OA as assessedby the PMFOrg MS analysis. This nearly 50 : 50 division be-tween these two organic components was somewhat differ-ent than that found in other two-component studies in urbanareas, with HOA making a greater contribution (Zhang et al.,2007). Such a difference could possibly be attributed to thesignificant industrial activity and traffic contributions fromthe international border crossing.
3.2.1 Amine factor comparison
The mass spectra of the Amine factors extracted from thetwo PMF analyses are compared in Fig. 12a. The most no-table difference between the two profiles was the presenceof a significant contribution fromm/z 30 in the PMFFull MS
analysis. The majority of this signal was removed during ex-traction of the organic MS, as it is mostly attributed to NO+
in the fragmentation table. Excellent agreement was foundbetween the factor time series (r2
= 0.99), indicating that thisfactor was similarly extracted in the two analyses (Fig. 13a).
The extraction of the Amine factor in this study highlightsadvantages of applying PMF to the full AMS mass spectrumfor unit mass resolution data. Firstly, it can be seen that PMFcan provide better resolution of AMS species (i.e., SO2−
4 ,NO−
3 , NH+
4 , Cl−, and organics) than using the traditionalAMS fragmentation scheme, as this method does not pre-sume the nature of chemical species. In this study, the pres-ence of the Amine factor had consequences for the estimationof organics mass concentrations and, ultimately, sub-micronPM mass. A comparison between the AMS-resolved speciescalculated pre-PMF analysis with those calculated from thefactors post-PMFFull MS analysis (excluding any mass asso-ciated with the Amine factor) is presented in Table 1. It canbe seen that organics may have been overestimated by up to11 %. Although the PMFOrg MS analysis could be improvedby stoichiometrically fixing the contribution of the subtractedinorganic component ofm/z 30 (NO+) to m/z 46 to includeamine ions in the analysis, this was not performed for thisanalysis, in order to highlight the potential benefits of usingthe PMFFull MS method (namely that no a priori assumptionsare required regarding the chemical nature of the aerosol).Ultimately, when comparing the pre-PMF sub-micron PMmass to the post-PMF reconstructed mass, it can be seen thatthe mass may have been overestimated by up to 5 % usingthe traditional fragmentation scheme.
Atmos. Chem. Phys., 14, 8017–8042, 2014 www.atmos-chem-phys.net/14/8017/2014/

M. L. McGuire et al.: Enhancing non-refractory aerosol apportionment from an urban industrial site 8037
10
8
6
4
2
0O
rgs
from
OO
A +
Nitr
ate
OA
+ Su
lfate
OA
from
PM
F Ful
l MS A
naly
sis
(µg
m-3
)86420
PMFOrg MS OOA Factor (µg m-3)
y = 1.53xr2 = 0.94
(a) (b)
(c) (d)
4
3
2
1
0
PM
F Ful
l MS A
min
e Fa
ctor
(RIE
= 4
.3) (
ug m
-3)
121086420
PMFOrg MS Amine Factor (RIE = 1.4) (ug m-3)
y = 0.38xr2 = 0.99
20
15
10
5
0PM
F Ful
l MS H
OA
Fac
tor (
ug m
-3)
20151050
PMFOrg MS HOA Factor (ug m-3)
y = 0.91xr2 = 0.98
8
6
4
2
0
PM
F Ful
l MS O
OA
Fac
tor (
ug m
-3)
6543210
PMFOrg MS OOA Factor (ug m-3)
y = 0.76xr2 = 0.72
Figure 13. Scatter plots Amine(a), HOA (b), and OOA(c, d) factors comparing their mass derived from PMFFull MS vs. PMFOrg MSanalyses. One observation (31 January 2005, 21:00 LT) was removed from the HOA comparison to enhance the fit of the trendline.
Secondly, PMF of the full MS also provided better factorresolution and mass estimates than PMF of the organic MS;with PMFOrg MS, the organic MS was extracted through ap-plication of the organic fragmentation pattern, while in thePMFFull MS analysis, the full MS remained as measured, ex-cept for subtraction of air and water. Comparison between thePMFFull MS and PMFOrg MS Amine factor time series showedthat the mass of the Amine factor from the PMFOrg MS was2.6 times greater than that from the PMFFull MS analysis. Thisdifference accounted for both the differences in RIE (an ef-fective RIE of 4.3 was assumed in the PMFFull MS analysis)as well as mass contributions from other fragments (namelym/z 30, which is typically associated with nitrate, but whichmay also represent amines). A more direct comparison be-tween the Amine factors resolved in the PMFFull MS andPMFOrg MS analyses using NO−3 eq mass showed that thefactor resolved in the PMFFull MS analysis contained 25 %more mass, given inorganic contributions. This suggests thatsome factors may not be resolved fully using the PMFOrg MSmethod. As amine species were assigned as organics in thePMFOrg MS analysis (with an RIE of 1.4 as opposed to 4.3),it can be seen that errors of up to two and a half times themass may arise from not considering alternate possibilitiesfor the chemical nature of certain species, which may be-come clearer through the extraction of the factor’s full MS. Itis possible that in some cases (e.g., amine-rich areas with
amines of higher RIE), this type of error could outweighother AMS errors such as collection efficiency.
3.2.2 HOA factor comparison
Figure 12b presents the mass spectral comparison betweenthe HOA factors resolved from PMF analysis of the fullMS vs. the organic MS. The HOA factor mass spectra fromthe two PMF analyses compared very well (r2
= 0.98), andgood agreement was also found between their time series (r2
of 0.98); a slope of 0.91 for the time series comparison indi-cated that a portion of this factor had been cross-apportionedto other factors in the full MS analysis (Fig. 13b). Due tominimal differences between MS, it was difficult to distin-guish across which factors this HOA was further distributedin the PMFFull MS analysis.
3.2.3 OOA factor comparison
Figure 12c provides a comparison between the OOA factorprofiles extracted in the PMFFull MS and PMFOrg MS analy-ses. Enhanced cross-apportionment ofm/z 44 to other fac-tors in the PMFFull MS analysis is evident due to the sig-nificant difference in the relative contributions of F44 inthe OOA factors (i.e.: PMFFull MS F44= 0.09; PMFOrg MSF44= 0.15). An F44= 0.15 found in the PMFOrg MS in thisfactor is comparable to that found in other studies, also
www.atmos-chem-phys.net/14/8017/2014/ Atmos. Chem. Phys., 14, 8017–8042, 2014

8038 M. L. McGuire et al.: Enhancing non-refractory aerosol apportionment from an urban industrial site
indicative that this factor included the highly oxidized or-ganics that were separated into the Sulfate-OA factor inPMFFull MS. Comparing the time series of the OOA fac-tors between the PMFFull MS and PMFOrg MS analyses, acomparatively lowr2
= 0.72 highlighted the fact that someOOA signal was cross-apportioned to inorganic factors in thePMFFull MS analysis (Fig. 13c). A mass difference was alsoobserved between the factors, with the PMFFull MS weigh-ing on average 0.76 µg m−3, and the PMFOrg MS measur-ing on average 1.01 µg m−3. A higher mass attributed to thePMFOrg MS OOA factor is likely linked to the higher contri-bution fromm/z 44. A comparison of just the organic contri-butions from the factors containing oxidized organic aerosol(Nitrate-OA, Sulfate-OA, and OOA) with the OOA factorfrom the PMFOrg MS three-factor solution showed that ther2 was much improved, from 0.72 to 0.94, with the addi-tional variability from the organic component of these factors(Fig. 13d). A slope slightly higher than unity suggested thatthe organic aerosol extracted from these three factors waslikely not entirely oxidized organic aerosol as defined fromthe OOA factor from the PMFOrg MS analysis, and may havecontained some less oxidized aerosol as well. This was cor-roborated by a slope of slightly less than unity for the HOAfactor comparison.
Interestingly, the OOA factor could not be split into moreOOA factors (i.e., OOAI and OOAII) using PMF analysis ofthe organics alone. Moving to a four-factor solution resultedin an OOA factor, and another OA factor, which could notbe fully justified as its mass spectrum, did not sufficiently re-semble any known mass spectra to accept the solution (seethe Supplement for further details). It is likely that the inor-ganics in the PMFFull MS analysis provide additional corre-lational structure to apportion organics more effectively. Ifmoderately oxygenated organics are calculated as those ap-portioned to the OOA and Nitrate-OA factors, and highlyoxygenated organics are those apportioned to the Sulfate-OA factor, it can be seen that highly oxygenated organicscomprise only about a quarter of the total oxygenated organ-ics. With the low prevalence of highly oxygenated organicsobserved in this campaign, these species may not have car-ried sufficient weight in the model to result in the splittingof the OOA factor in the PMFOrg MS analysis into the OOAIand OOAII types. With the OOA dominated by moderatelyoxidized organics, the addition of the inorganics-introducedcorrelational structure for these more minor, more oxidizedOAA types could be isolated.
The effect of having performed PMF on the full MS isevident when comparing the time series between SO2−
4 andthe PMFFull MS and PMFOrg MS OOA factors. In many pre-vious studies, particularly in urban locations, the OOA fac-tor from PMF of the organic MS has been highly corre-lated with SO2−
4 . Here, anr2 of 0.38 was found betweenSO2−
4 and OOA from PMF of the organic fraction. How-ever, following PMF of the full MS, the correlation between
the PMFFull MS OOA factor and SO2−
4 was markedly lower(r2
= 0.08). The PMFFull MS OOA factor thus shows a differ-ent temporal character, due to the removal of the highly ox-idized contribution. The remaining OOA that characterizesthis factor thus more resembles the OOAII typically foundwhen two OOA factors are extracted during PMFOrg MS. Ap-portionment of organics of varying degrees of oxidation wasthus more effectively accomplished through the PMFFull MSwith the PMFOrg MS method, most likely due to correla-tions with inorganic species of differing atmospheric behav-ior (e.g., volatility) and origins.
4 Conclusions
Six factors were identified through PMF analysis of the fullAMS mass spectrum: an Amine factor suspected to be tri-ethylamine nitrate; a Sulfate-OA factor composed of mostly(NH4)2SO4 and highly oxidized organics; a Nitrate-OA fac-tor consisting of mostly NH4NO3 along with moderately ox-idized organics; a Chloride factor hypothesized to be mostlyNH4Cl along with organics and sulfate; an HOA factor clas-sified as mostly primary organics from fossil fuel combus-tion; and an OOA factor, consisting of moderately oxidizedorganics.
Factor variability was governed by chemical processing,primary source emissions, and transport. The OOA factor ap-peared to be influenced mostly by local processing, as it ex-hibited a strong nighttime diurnal trend consistent with gas-to-particle partitioning. While both the Amine and Chloridefactors showed temporal trends with brief excursions sug-gestive of primary source emissions, rapid secondary aerosolformation could not be ruled out in either case. Rapid in-plume secondary formation of the Chloride factor was sup-ported by its sporadic appearance and the concurrent appear-ance with short-lived spikes in SO2−
4 , consistent with indus-trial emissions plumes. While the precise mechanism of for-mation for the Amine factor could not be validated, it washypothesized to be a result of acid–base reaction of primarytriethylamine gaseous emissions with HNO3. Two significantindustrial sources of amines located to the southwest of themeasurement site were likely the main contributing sources.By contrast, the main determinant for the HOA factor wasprimary source emissions, given its strong daytime diurnaltrend, and high correlations with short-lived traffic-relatedgases such as NO. Regional transport was most likely thedominant determinant of variability for the Sulfate-OA andNitrate-OA factors, although local gas-to-particle partition-ing also appeared to contribute to the Nitrate-OA factor.
Allowing for PMF to cross-apportion inorganic and or-ganic species between factors led to richer conclusions re-garding the potential sources, chemical nature, and behav-ior of certain factors than would otherwise have been ob-tained through the application of PMF of organics only. First,cross-apportionment of inorganic species between factors led
Atmos. Chem. Phys., 14, 8017–8042, 2014 www.atmos-chem-phys.net/14/8017/2014/

M. L. McGuire et al.: Enhancing non-refractory aerosol apportionment from an urban industrial site 8039
to some enhanced aerosol chemistry conclusions, such asthe relative degree of neutralization of co-varying inorganicspecies. It was found that NH+4 was cross-apportioned tothe Sulfate-OA, Nitrate-OA and Chloride factors, and on thewhole, each of these factors appeared reasonably neutral,at least relative to one another. In an eight-factor solution,a more acidic local sulfate factor appeared. While this so-lution on the whole could not be justified, it suggests thatacidic factors could be extracted in other studies. Second, in-clusion of inorganics led to enhanced apportionment of or-ganic aerosol, which in turn led to a better understanding ofeach factor’s degree of oxygenation and chemical nature. Forinstance, less oxygenated organics were associated with theChloride and HOA factors, which supported local, primaryemissions sources. Inclusion of the inorganics also providedan additional correlational structure to apportion the oxy-genated organic fraction, with the most highly oxygenatedOA apportioned to the regional Sulfate-OA factor, and themoderately oxygenated OA apportioned to the Nitrate-OAand OOA factors. Using this technique, the resulting OOAfactor displayed behavior typical of temperature-dependentgas-to-particle partitioning, while the more oxidized organicscontained in the Nitrate-OA and Sulfate-OA factors appearedlonger lived, and more associated with regional transport.Without the inclusion of inorganics, the highly oxygenatedand moderately oxygenated organics could not be separatedeffectively.
The methodology used in this study also proved advan-tageous for extracting atypical factors, and for obtainingmore accurate mass quantification for data obtained from aunit mass resolution AMS. In this study, PMF of the fullMS resulted in the extraction of the Amine factor, whichwas only partially extracted using PMF of the organic MSonly. A more complete mass spectral profile including inor-ganic fragments (e.g.,m/z 30) was extracted, which permit-ted further exploration of the factor’s chemical nature. Al-though its formation mechanism could not be positively vali-dated, the Amine factor was ascertained to have resulted froman acid–base neutralization reaction, and a factor-specificrelative ionization efficiency was calculated to provide im-proved mass estimates. This method was useful for prevent-ing overestimation of certain species, such as nitrate, whenthe aerosol is influenced by species unaccounted for by thetypical AMS analysis scheme. It is likely that this methodwould be even more useful for HR–ToF–AMS data, due tothe ability to understand the chemical nature of atypical fac-tors from high-resolution mass spectra better. In summary,PMF of the full AMS unit mass resolution MS has beenshown to be a useful method for obtaining additional insightsinto the sources and processes governing fluctuations in non-refractory sub-micron PM chemical composition, in compar-ison to the PMF of the organics alone.
The Supplement related to this article is available onlineat doi:10.5194/acp-14-8017-2014-supplement.
Acknowledgements.These measurements were supported byEnvironment Canada. Funding for SOCAAR was provided bythe Canadian Foundation for Innovation, the Ontario InnovationTrust, and the Ontario Research Fund. M. L. McGuire is grateful toEnvironment Canada for funding this analysis through the ResearchAffiliate Program (RAP). The authors gratefully acknowledge theNOAA Air Resources Laboratory (ARL) for the provision of theHYSPLIT transport and dispersion model and/or READY website(http://www.arl.noaa.gov/ready.php) (Draxler and Rolph, 2013;Rolph, 2013) used in this publication. The authors also thankanonymous referees for helpful comments.
Edited by: P. DeCarlo
References
Aiken, A. C., Decarlo, P. F., Kroll, J. H., Worsnop, D. R., Huff-man, J. A., Docherty, K. S., Ulbrich, I. M., Mohr, C., Kimmel,J. R., Sueper, D., Sun, Y., Zhang, Q., Trimborn, A., Northway,M., Ziemann, P. J., Canagaratna, M. R., Onasch, T. B., Alfarra,M. R., Prevot, A. S. H., Dommen, J., Duplissy, J., Metzger,A., Baltensperger, U., and Jimenez, J. L.: O/C and OM/OC ra-tios of primary, secondary, and ambient organic aerosols withhigh-resolution time-of-flight aerosol mass spectrometry, Envi-ron. Sci. Technol., 42, 4478–4485, 2008.
Aiken, A. C., Salcedo, D., Cubison, M. J., Huffman, J. A., DeCarlo,P. F., Ulbrich, I. M., Docherty, K. S., Sueper, D., Kimmel, J.R., Worsnop, D. R., Trimborn, A., Northway, M., Stone, E. A.,Schauer, J. J., Volkamer, R. M., Fortner, E., de Foy, B., Wang,J., Laskin, A., Shutthanandan, V., Zheng, J., Zhang, R., Gaffney,J., Marley, N. A., Paredes-Miranda, G., Arnott, W. P., Molina,L. T., Sosa, G., and Jimenez, J. L.: Mexico City aerosol analysisduring MILAGRO using high resolution aerosol mass spectrom-etry at the urban supersite (T0) – Part 1: Fine particle composi-tion and organic source apportionment, Atmos. Chem. Phys., 9,6633–6653, doi:10.5194/acp-9-6633-2009, 2009.
Allan, J. D., Jimenez, J. L., Williams, P. I., Alfarra, M. R., Bower,K. N., Jayne, J. T., Coe, H., and Worsnop, D. R.: Quan-titative sampling using an Aerodyne aerosol mass spectrom-eter: 1. Techniques of data interpretation and error analysis(vol 108, art no 4090, 2003), J. Geophys. Res.-Atmos., 108,4283, doi:10.1029/2002JD002358, 2003.
Allan, J. D., Delia, A. E., Coe, H., Bower, K. N., Alfarra, M. R.,Jimenez, J. L., Middlebrook, A. M., Drewnick, F., Onasch, T. B.,Canagaratna, M. R., Jayne, J. T., and Worsnopf, D. R.: A gen-eralised method for the extraction of chemically resolved massspectra from aerodyne aerosol mass spectrometer data, J. AerosolSci., 35, 909–922, 2004.
Allan, J. D., Williams, P. I., Morgan, W. T., Martin, C. L., Flynn, M.J., Lee, J., Nemitz, E., Phillips, G. J., Gallagher, M. W., and Coe,H.: Contributions from transport, solid fuel burning and cook-ing to primary organic aerosols in two UK cities, Atmos. Chem.Phys., 10, 647–668, doi:10.5194/acp-10-647-2010, 2010.
Anderson, J. O., Thundiyil, J. G., and Stolbach, A.: Clearing theAir: A Review of the Effects of Particulate Matter Air Pollutionon Human Health, J. Med. Toxicol., 8, 166–175, 2012.
www.atmos-chem-phys.net/14/8017/2014/ Atmos. Chem. Phys., 14, 8017–8042, 2014

8040 M. L. McGuire et al.: Enhancing non-refractory aerosol apportionment from an urban industrial site
Ashbaugh, L. L., Malm, W. C., and Sadeh, W. Z.: A residence timeprobability analysis of sulfur concentrations at Grand-CanyonNational Park, Atmos. Environ., 19, 1263–1270, 1985.
Brook, R. D., Rajagopalan, S., Pope, C. A., Brook, J. R., Bhatna-gar, A., Diez-Roux, A. V., Holguin, F., Hong, Y., Luepker, R.V., Mittleman, M. A., Peters, A., Siscovick, D., Smith, S. C.,Whitsel, L., and Kaufman, J. D.: Particulate matter air pollutionand cardiovascular disease: An update to the scientific statementfrom the american heart association, Circulation, 121, 2331–2378, 2010.
Brown, S. G., Lee, T., Norris, G. A., Roberts, P. T., Collett, Jr., J.L., Paatero, P., Worsnop, D. R., van Zyl, P. G., Tiitta, P., andJosipovic, M.: Receptor modeling of near-roadway aerosol massspectrometer data in Las Vegas, Nevada, with EPA PMF, Atmos.Chem. Phys., 12, 309–325, doi:10.5194/acp-12-309-2012, 2012.
Buset, K. C., Evans, G. J., Leaitch, W. R., Brook, J. R., and Toom-Sauntry, D.: Use of advanced receptor modelling for analysis ofan intensive 5-week aerosol sampling campaign, Atmos. Envi-ron., 40, S482–S499, 2006.
Canagaratna, M. R., Jayne, J. T., Jimenez, J. L., Allan, J. D., Al-farra, M. R., Zhang, Q., Onasch, T. B., Drewnick, F., Coe, H.,Middlebrook, A., Delia, A., Williams, L. R., Trimborn, A. M.,Northway, M. J., DeCarlo, P. F., Kolb, C. E., Davidovits, P., andWorsnop, D. R.: Chemical and microphysical characterization ofambient aerosols with the aerodyne aerosol mass spectrometer,Mass Spectrom. Rev., 26, 185–222, 2007a.
Canagaratna, M. R., Jayne, J. T., Jimenez, J. L., Allan, J. D., Al-farra, M. R., Zhang, Q., Onasch, T. B., Drewnick, F., Coe, H.,Middlebrook, A., Delia, A., Williams, L. R., Trimborn, A. M.,Northway, M. J., DeCarlo, P. F., Kolb, C. E., Davidovits, P., andWorsnop, D. R.: Chemical and microphysical characterization ofambient aerosols with the aerodyne aerosol mass spectrometer,Mass Spectrom. Rev., 26, 185–222, 2007b.
Chang, R. Y.-W., Leck, C., Graus, M., Müller, M., Paatero, J.,Burkhart, J. F., Stohl, A., Orr, L. H., Hayden, K., Li, S.-M.,Hansel, A., Tjernström, M., Leaitch, W. R., and Abbatt, J.P. D.: Aerosol composition and sources in the central ArcticOcean during ASCOS, Atmos. Chem. Phys., 11, 10619–10636,doi:10.5194/acp-11-10619-2011, 2011.
Chirico, R., Prevot, A. S. H., DeCarlo, P. F., Heringa, M. F., Richter,R., Weingartner, E., and Baltensperger, U.: Aerosol and trace gasvehicle emission factors measured in a tunnel using an AerosolMass Spectrometer and other on-line instrumentation, Atmos.Environ., 45, 2182–2192, doi:10.1016/j.atmosenv.2011.01.069,2011.
Crippa, M., DeCarlo, P. F., Slowik, J. G., Mohr, C., Heringa, M.F., Chirico, R., Poulain, L., Freutel, F., Sciare, J., Cozic, J., DiMarco, C. F., Elsasser, M., Nicolas, J. B., Marchand, N., Abidi,E., Wiedensohler, A., Drewnick, F., Schneider, J., Borrmann,S., Nemitz, E., Zimmermann, R., Jaffrezo, J.-L., Prévôt, A. S.H., and Baltensperger, U.: Wintertime aerosol chemical compo-sition and source apportionment of the organic fraction in themetropolitan area of Paris, Atmos. Chem. Phys., 13, 961–981,doi:10.5194/acp-13-961-2013, 2013a.
Crippa, M., El Haddad, I., Slowik, J. G., Decarlo, P. F., Mohr,C., Heringa, M. F., Chirico, R., Marchand, N., Sciare, J., Bal-tensperger, U., and Prévôt, A. S. H.: Identification of marine andcontinental aerosol sources in Paris using high resolution aerosol
mass spectrometry, J. Geophys. Res.-Atmos., 118, 1950–1963,2013b.
Docherty, K. S., Aiken, A. C., Huffman, J. A., Ulbrich, I. M., De-Carlo, P. F., Sueper, D., Worsnop, D. R., Snyder, D. C., Peltier,R. E., Weber, R. J., Grover, B. D., Eatough, D. J., Williams, B.J., Goldstein, A. H., Ziemann, P. J., and Jimenez, J. L.: The 2005Study of Organic Aerosols at Riverside (SOAR-1): instrumentalintercomparisons and fine particle composition, Atmos. Chem.Phys., 11, 12387–12420, doi:10.5194/acp-11-12387-2011, 2011.
Draxler, R. R. and Rolph, G. D.: HYSPLIT (Hybrid Single-ParticleLagrangian Integrated Trajectory) Model access via NOAA ARLREADY, available at:http://ready.arl.noaa.gov/hysplit.php, lastaccess: December 2013, NOAA Air Resources Laboratory, Sil-ver Spring, MD, 2013.
Drewnick, F., Hings, S. S., Curtius, J., Eerdekens, G., and Williams,J.: Measurement of fine particulate and gas-phase species duringthe New Year’s fireworks 2005 in Mainz, Germany, Atmos. Env-iron., 40, 4316–4327, 2006.
Environment Canada: National Pollutant Release Inventory, 2013,downloadable at:http://www.ec.gc.ca/inrp-npri/, last access: De-cember 2013.
Ge, X., Wexler, A. S., and Clegg, S. L.: Atmospheric amines –Part I. A review, Atmos. Environ., 45, 524–546, 2011.
Godri, K. J., Evans, G. J., Slowik, J., Knox, A., Abbatt, J., Brook,J., Dann, T., and Dabek-Zlotorzynska, E.: Evaluation and ap-plication of a semi-continuous chemical characterization sys-tem for water soluble inorganic PM2.5 and associated precur-sor gases, Atmos. Meas. Tech., 2, 65–80, doi:10.5194/amt-2-65-2009, 2009.
Gordon, G. E.: Receptor Models, Environ. Sci. Technol., 14, 792–800, 1980.
Greim, H., Bury, D., Klimisch, H. J., Oeben-Negele, M., andZiegler-Skylakakis, K.: Toxicity of aliphatic amines: Structure-activity relationship, Chemosphere, 36, 271–295, 1998.
Hildebrandt, L., Kostenidou, E., Lanz, V. A., Prevot, A. S. H., Bal-tensperger, U., Mihalopoulos, N., Laaksonen, A., Donahue, N.M., and Pandis, S. N.: Sources and atmospheric processing of or-ganic aerosol in the Mediterranean: insights from aerosol massspectrometer factor analysis, Atmos. Chem. Phys., 11, 12499–12515, doi:10.5194/acp-11-12499-2011, 2011.
Hogrefe, O., Drewnick, F., Lala, G. G., Schwab, J. J., and De-merjian, K. L.: Development, operation and applications of anaerosol generation, calibration and research facility, Aerosol Sci.Tech., 38, 196–214, 2004.
Hopke, P. K.: Recent developments in receptor modeling, J.Chemometr., 17, 255–265, 2003.
Huffman, J. A., Docherty, K. S., Aiken, A. C., Cubison, M. J., Ul-brich, I. M., DeCarlo, P. F., Sueper, D., Jayne, J. T., Worsnop,D. R., Ziemann, P. J., and Jimenez, J. L.: Chemically-resolvedaerosol volatility measurements from two megacity field studies,Atmos. Chem. Phys., 9, 7161–7182, doi:10.5194/acp-9-7161-2009, 2009.
IPCC: Intergovernmental Panel on Climate Change, Fifth Assess-ment Report, 2013, downloadable at:http://www.ipcc.ch/, lastaccess: December 2013.
Jayne, J. T., Leard, D. C., Zhang, X. F., Davidovits, P., Smith, K.A., Kolb, C. E., and Worsnop, D. R.: Development of an aerosolmass spectrometer for size and composition analysis of submi-cron particles, Aerosol Sci. Tech., 33, 49–70, 2000.
Atmos. Chem. Phys., 14, 8017–8042, 2014 www.atmos-chem-phys.net/14/8017/2014/

M. L. McGuire et al.: Enhancing non-refractory aerosol apportionment from an urban industrial site 8041
Jeong, C.-H., McGuire, M. L., Herod, D., Dann, T., Dabek-Zlotorzynska, E., Wang, D., Ding, L., Celo, V., Mathieu, D., andEvans, G. J.: Receptor Model Based Identification of the Sourcesof PM2.5 in Canadian Cities, Atmos. Poll. Res., 2, 158–171,2011.
Jimenez, J. L., Canagaratna, M. R., Donahue, N. M., Prevot, A. S.H., Zhang, Q., Kroll, J. H., DeCarlo, P. F., Allan, J. D., Coe,H., Ng, N. L., Aiken, A. C., Docherty, K. S., Ulbrich, I. M.,Grieshop, A. P., Robinson, A. L., Duplissy, J., Smith, J. D., Wil-son, K. R., Lanz, V. A., Hueglin, C., Sun, Y. L., Tian, J., Laak-sonen, A., Raatikainen, T., Rautiainen, J., Vaattovaara, P., Ehn,M., Kulmala, M., Tomlinson, J. M., Collins, D. R., Cubison, M.J., Dunlea, E. J., Huffman, J. A., Onasch, T. B., Alfarra, M. R.,Williams, P. I., Bower, K., Kondo, Y., Schneider, J., Drewnick,F., Borrmann, S., Weimer, S., Demerjian, K., Salcedo, D., Cot-trell, L., Griffin, R., Takami, A., Miyoshi, T., Hatakeyama, S.,Shimono, A., Sun, J. Y., Zhang, Y. M., Dzepina, K., Kimmel, J.R., Sueper, D., Jayne, J. T., Herndon, S. C., Trimborn, A. M.,Williams, L. R., Wood, E. C., Middlebrook, A. M., Kolb, C.E., Baltensperger, U., and Worsnop, D. R.: Evolution of organicaerosols in the atmosphere, Science, 326, 1525–1529, 2009.
Langley, L., Leaitch, W. R., Lohmann, U., Shantz, N. C., andWorsnop, D. R.: Contributions from DMS and ship emissionsto CCN observed over the summertime North Pacific, Atmos.Chem. Phys., 10, 1287–1314, doi:10.5194/acp-10-1287-2010,2010.
Lanz, V. A., Alfarra, M. R., Baltensperger, U., Buchmann, B.,Hueglin, C., and Prévôt, A. S. H.: Source apportionment of sub-micron organic aerosols at an urban site by factor analytical mod-elling of aerosol mass spectra, Atmos. Chem. Phys., 7, 1503–1522, doi:10.5194/acp-7-1503-2007, 2007.
Lanz, V. A., Alfarra, M. R., Baltensperger, U., Buchmann, B.,Hueglin, C., Szidat, S., Wehrli, M. N., Wacker, L., Weimer, S.,Caseiro, A., Puxbaum, H., and Prevot, A. S. H.: Source attribu-tion of submicron organic aerosols during wintertime inversionsby advanced factor analysis of aerosol mass spectra, Environ.Sci. Technol., 42, 214–220, 2008.
Li, Y. Q., Schwab, J. J., and Demerjian, K. L.: Measurements of am-bient ammonia using a tunable diode laser absorption spectrom-eter: Characteristics of ambient ammonia emissions in an urbanarea of New York City, J. Geophys. Res.-Atmos., 111, D10s02,doi:10.1029/2005JD006275, 2006.
Liggio, J. and Li, S.-M.: A new source of oxygenated organicaerosol and oligomers, Atmos. Chem. Phys., 13, 2989–3002,doi:10.5194/acp-13-2989-2013, 2013.
Liggio, J., Li, S. M., Vlasenko, A., Stroud, C., and Makar, P.: De-pression of ammonia uptake to sulfuric acid aerosols by compet-ing uptake of ambient organic gases, Environ. Sci. Technol., 45,2790–2796, 2011.
Malloy, Q. G. J., Li Qi, Warren, B., Cocker III, D. R., Erupe, M.E., and Silva, P. J.: Secondary organic aerosol formation fromprimary aliphatic amines with NO3 radical, Atmos. Chem. Phys.,9, 2051–2060, doi:10.5194/acp-9-2051-2009, 2009.
McGuire, M. L., Jeong, C.-H., Slowik, J. G., Chang, R. Y.-W.,Corbin, J. C., Lu, G., Mihele, C., Rehbein, P. J. G., Sills, D.M. L., Abbatt, J. P. D., Brook, J. R., and Evans, G. J.: Elucidat-ing determinants of aerosol composition through particle-type-based receptor modeling, Atmos. Chem. Phys., 11, 8133–8155,doi:10.5194/acp-11-8133-2011, 2011.
McLafferty, F. W. and Turecek, F.: Interpretation of mass spectra,vol. xviii, 4th Edn., University Science Books, Sausalito, Calif.,371 pp., 1993.
Middlebrook, A. M., Bahreini, R., Jimenez, J. L., and Canagaratna,M. R.: Evaluation of composition-dependent collection efficien-cies for the Aerodyne aerosol mass spectrometer using field data,Aerosol Sci. Tech., 46, 258–271, 2012.
Moffet, R. C., de Foy, B., Molina, L. T., Molina, M. J., and Prather,K. A.: Measurement of ambient aerosols in northern Mexico Cityby single particle mass spectrometry, Atmos. Chem. Phys., 8,4499–4516, doi:10.5194/acp-8-4499-2008, 2008a.
Moffet, R. C., Desyaterik, Y., Hopkins, R. J., Tivanski, A. V., Gilles,M. K., Wang, Y., Shutthanandan, V., Molina, L. T., Abraham, R.G., Johnson, K. S., Mugica, V., Molina, M. J., Laskin, A., andPrather, K. A.: Characterization of aerosols containing Zn, Pb,and Cl from an industrial region of Mexico City, Environ. Sci.Technol., 42, 7091–7097, doi:10.1021/es7030483, 2008b.
Mohr, C., DeCarlo, P. F., Heringa, M. F., Chirico, R., Slowik, J.G., Richter, R., Reche, C., Alastuey, A., Querol, X., Seco, R.,Peñuelas, J., Jiménez, J. L., Crippa, M., Zimmermann, R., Bal-tensperger, U., and Prévôt, A. S. H.: Identification and quan-tification of organic aerosol from cooking and other sources inBarcelona using aerosol mass spectrometer data, Atmos. Chem.Phys., 12, 1649–1665, doi:10.5194/acp-12-1649-2012, 2012.
Murphy, S. M., Sorooshian, A., Kroll, J. H., Ng, N. L., Chhabra,P., Tong, C., Surratt, J. D., Knipping, E., Flagan, R. C., and Se-infeld, J. H.: Secondary aerosol formation from atmospheric re-actions of aliphatic amines, Atmos. Chem. Phys., 7, 2313–2337,doi:10.5194/acp-7-2313-2007, 2007.
Ng, N. L., Canagaratna, M. R., Zhang, Q., Jimenez, J. L., Tian,J., Ulbrich, I. M., Kroll, J. H., Docherty, K. S., Chhabra, P.S., Bahreini, R., Murphy, S. M., Seinfeld, J. H., Hildebrandt,L., Donahue, N. M., DeCarlo, P. F., Lanz, V. A., Prévôt, A. S.H., Dinar, E., Rudich, Y., and Worsnop, D. R.: Organic aerosolcomponents observed in Northern Hemispheric datasets fromAerosol Mass Spectrometry, Atmos. Chem. Phys., 10, 4625–4641, doi:10.5194/acp-10-4625-2010, 2010.
Norris, G., Vedantham, R., Duvall, R., Wade, K., Brown, S., Prouty,J., Bai, S., and DeWinter, J.: EPA Positive Matrix Factoriza-tion 4.1 Fundamentals & User Guide, EPA, Research TrianglePark, North Carolina, 2010.
Paatero, P.: Least squares formulation of robust non-negative factoranalysis, Chemometr. Intell. Labor. Syst., 37, 23–35, 1997.
Paatero, P. and Tapper, U.: Analysis of Different Modes of Factor-Analysis as Least-Squares Fit Problems, Chemometr. Intell. La-bor. Syst., 18, 183–194, 1993.
Paatero, P. and Tapper, U.: Positive Matrix Factorization – ANonnegative Factor Model With Optimal Utilization of Error-Estimates of Data Values, Environmetrics, 5, 111–126, 1994.
Perron, N., Sandradewi, J., Alfarra, M. R., Lienemann, P., Gehrig,R., Kasper-Giebl, A., Lanz, V. A., Szidat, S., Ruff, M., Fahrni,S., Wacker, L., Baltensperger, U., and Prévôt, A. S. H.: Com-position and sources of particulate matter in an industrialisedAlpine valley, Atmos. Chem. Phys. Discuss., 10, 9391–9430,doi:10.5194/acpd-10-9391-2010, 2010.
Pio, C. A. and Harrison, R. M.: The equilibrium of ammoniumchloride aerosol with gaseous hydrochloric acid and ammoniaunder tropospheric conditions, Atmos. Environ., 21, 1243–1246,1987a.
www.atmos-chem-phys.net/14/8017/2014/ Atmos. Chem. Phys., 14, 8017–8042, 2014

8042 M. L. McGuire et al.: Enhancing non-refractory aerosol apportionment from an urban industrial site
Pio, C. A. and Harrison, R. M.: Vapour pressure of ammonium chlo-ride aerosol: Effect of temperature and humidity, Atmos. Envi-ron., 21, 2711–2715, 1987b.
Pope, C. A. and Dockery, D. W.: Health effects of fine particulateair pollution: Lines that connect, J. Air Waste Manage. Assoc.,56, 709–742, 2006.
Pratt, K. A., Hatch, L. E., and Prather, K. A.: Seasonal volatility de-pendence of ambient particle phase amines, Environ. Sci. Tech-nol., 43, 5276–5281, 2009.
Rehbein, P. J. G., Jeong, C.-H., McGuire, M. L., Yao, X., Corbin,J., and Evans, G. J.: Cloud and Fog Processing Enhanced Gas-to-Particle Partitioning of Trimethylamine, Environ. Sci. Technol.,45, 4346–4352, 2011.
Richard, A., Gianini, M. F. D., Mohr, C., Furger, M., Bukowiecki,N., Minguillón, M. C., Lienemann, P., Flechsig, U., Appel, K.,DeCarlo, P. F., Heringa, M. F., Chirico, R., Baltensperger, U.,and Prévôt, A. S. H.: Source apportionment of size and time re-solved trace elements and organic aerosols from an urban court-yard site in Switzerland, Atmos. Chem. Phys., 11, 8945–8963,doi:10.5194/acp-11-8945-2011, 2011.
Rolph, G. D.: Real-time Environmental Applications and DisplaysYstem (READY) Website available at:http://ready.arl.noaa.gov,last access: December 2013, NOAA Air Resources Laboratory,Silver Spring, MD, 2013.
Salcedo, D., Onasch, T. B., Dzepina, K., Canagaratna, M. R.,Zhang, Q., Huffman, J. A., DeCarlo, P. F., Jayne, J. T., Mor-timer, P., Worsnop, D. R., Kolb, C. E., Johnson, K. S., Zuberi,B., Marr, L. C., Volkamer, R., Molina, L. T., Molina, M. J., Car-denas, B., Bernabé, R. M., Márquez, C., Gaffney, J. S., Marley,N. A., Laskin, A., Shutthanandan, V., Xie, Y., Brune, W., Lesher,R., Shirley, T., and Jimenez, J. L.: Characterization of ambientaerosols in Mexico City during the MCMA-2003 campaign withAerosol Mass Spectrometry: results from the CENICA Supersite,Atmos. Chem. Phys., 6, 925–946, doi:10.5194/acp-6-925-2006,2006.
Silva, P. J., Erupe, M. E., Price, D., Elias, J., Malloy, Q. G. J., Li, Q.,Warren, B., and Cocker Iii, D. R.: Trimethylamine as precursor tosecondary organic aerosol formation via nitrate radical reactionin the atmosphere, Environ. Sci. Technol., 42, 4689–4696, 2008.
Slowik, J. G., Vlasenko, A., McGuire, M., Evans, G. J., and Abbatt,J. P. D.: Simultaneous factor analysis of organic particle and gasmass spectra: AMS and PTR-MS measurements at an urban site,Atmos. Chem. Phys., 10, 1969–1988, doi:10.5194/acp-10-1969-2010, 2010.
Stein, S. E.: Mass Spectra, NIST Chemistry WebBook, NIST Stan-dard Reference Database Number 69, National Institute of Stan-dards and Technology, Gaithersburg, MD, 2013.
Sun, Y.-L., Zhang, Q., Schwab, J. J., Demerjian, K. L., Chen, W.-N., Bae, M.-S., Hung, H.-M., Hogrefe, O., Frank, B., Rattigan,O. V., and Lin, Y.-C.: Characterization of the sources and pro-cesses of organic and inorganic aerosols in New York city witha high-resolution time-of-flight aerosol mass apectrometer, At-mos. Chem. Phys., 11, 1581–1602, doi:10.5194/acp-11-1581-2011, 2011.
Sun, Y. L., Zhang, Q., Schwab, J. J., Yang, T., Ng, N. L., and Demer-jian, K. L.: Factor analysis of combined organic and inorganicaerosol mass spectra from high resolution aerosol mass spec-trometer measurements, Atmos. Chem. Phys., 12, 8537–8551,doi:10.5194/acp-12-8537-2012, 2012.
Tan, P. V., Evans, G. J., Tsai, J., Owega, S., Fila, S., Malpica, O.,and Brook, J. R.: On-line analysis of urban particulate matterfocusing on elevated wintertime aerosol concentrations, Environ.Sci. Technol., 36, 3512–3518, 2002.
Ulbrich, I. M., Canagaratna, M. R., Zhang, Q., Worsnop, D. R., andJimenez, J. L.: Interpretation of organic components from posi-tive matrix factorization of aerosol mass spectrometric data, At-mos. Chem. Phys. Discuss., 8, 6729–6791, doi:10.5194/acpd-8-6729-2008, 2008.
Ulbrich, I. M., Canagaratna, M. R., Zhang, Q., Worsnop, D. R., andJimenez, J. L.: Interpretation of organic components from Posi-tive Matrix Factorization of aerosol mass spectrometric data, At-mos. Chem. Phys., 9, 2891–2918, doi:10.5194/acp-9-2891-2009,2009.
US EPA: National Emission Inventory (NEI) 2013: Inventory Data:Point Sector Data – ALLNEI HAP Annual, Research TrianglePark, North Carolina, 2013a.
US EPA: Toxics Release Inventory, Washington, D.C., 2013b.Vlasenko, A., Slowik, J. G., Bottenheim, J. W., Brickell, P. C.,
Chang, R. Y. W., Maedonald, A. M., Shantz, N. C., Sjostedt, S. J.,Wiebe, H. A., Leaitch, W. R., and Abbatt, J. P. D.: Measurementsof VOCs by proton transfer reaction mass spectrometry at a ruralOntario site: Sources and correlation to aerosol composition, J.Geophys. Res., 114, D21305, doi:10.1029/2009JD012025, 2009.
Watson, J. G.: Visibility: Science and Regulation, J. Air Waste Man-age. Assoc., 52, 628–713, 2002.
Watson, J. G., Chen, L. W. A., Chow, J. C., Doraiswamy, P., andLowenthal, D. H.: Source apportionment: Findings from theU.S. supersites program, J. Air Waste Manage. Assoc., 58, 265–288, 2008.
Zhang, Q., Alfarra, M. R., Worsnop, D. R., Allan, J. D., Coe, H.,Canagaratna, M. R., and Jimenez, J. L.: Deconvolution and quan-tification of hydrocarbon-like and oxygenated organic aerosolsbased on aerosol mass spectrometry, Environ. Sci. Technol., 39,4938–4952, 2005.
Zhang, Q., Jimenez, J. L., Canagaratna, M. R., Allan, J. D., Coe,H., Ulbrich, I., Alfarra, M. R., Takami, A., Middlebrook, A.M., Sun, Y. L., Dzepina, K., Dunlea, E., Docherty, K., De-Carlo, P. F., Salcedo, D., Onasch, T., Jayne, J. T., Miyoshi,T., Shimono, A., Hatakeyama, S., Takegawa, N., Kondo, Y.,Schneider, J., Drewnick, F., Borrmann, S., Weimer, S., Demer-jian, K., Williams, P., Bower, K., Bahreini, R., Cottrell, L.,Griffin, R. J., Rautiainen, J., Sun, J. Y., Zhang, Y. M., andWorsnop, D. R.: Ubiquity and dominance of oxygenated speciesin organic aerosols in anthropogenically-influenced NorthernHemisphere midlatitudes, Geophys. Res. Lett., 34, L13801,doi:10.1029/2007GL029979, 2007.
Zhang, Q., Jimenez, J. L., Canagaratna, M. R., Ulbrich, I. M., Ng,N. L., Worsnop, D. R., and Sun, Y.: Understanding atmosphericorganic aerosols via factor analysis of aerosol mass spectrometry:A review, Anal. Bioanal. Chem., 401, 3045–3067, 2011.
Zorn, S. R., Drewnick, F., Schott, M., Hoffmann, T., and Bor-rmann, S.: Characterization of the South Atlantic marine bound-ary layer aerosol using an aerodyne aerosol mass spectrometer,Atmos. Chem. Phys., 8, 4711–4728, doi:10.5194/acp-8-4711-2008, 2008.
Atmos. Chem. Phys., 14, 8017–8042, 2014 www.atmos-chem-phys.net/14/8017/2014/