Embed Size (px)
Citation preview
Enhancing Full-Film Lubrication Performance viaArbitrary Surface Texture Design∗
Yong Hoon LeeGraduate Student, ASME Student Member
Mechanical Science and EngineeringUniversity of Illinois at Urbana-Champaign
Urbana, Illinois 61801Email: [email protected]
Jonathon K. SchuhGraduate Student
Mechanical Science and EngineeringUniversity of Illinois at Urbana-Champaign
Urbana, Illinois 61801Email: [email protected]
Randy H. EwoldtAssistant Professor, ASME Member
Mechanical Science and EngineeringUniversity of Illinois at Urbana-Champaign
Urbana, Illinois 61801Email: [email protected]
James T. Allison†
Assistant Professor, ASME MemberIndustrial and Enterprise Systems Engineering
University of Illinois at Urbana-ChampaignUrbana, Illinois 61801
Email: [email protected]
ABSTRACTMinimizing energy loss and improving system load capacity and compactness are important objectives for
fluid power systems. Recent studies reveal that micro-textured surfaces can reduce friction in full-film lubrication,and that asymmetric textures can reduce friction and increase normal force simultaneously. As an extension ofthese previous discoveries, we explore how enhanced texture design can maximize these objectives together. Wedesign surface texture using a set of distinct parameterizations, ranging from simple to complex, to improve per-formance beyond what is possible for previously investigated texture geometries. Here we consider a rotationaltribo-rheometer configuration with a fixed textured bottom disk and a rotating top flat disk with controlled separa-tion gap. To model Newtonian fluid flow, the Reynolds equation is formulated in cylindrical coordinates and solvedusing a pseudo-spectral method. Model assumptions include incompressibility, steady flow, constant viscosity, anda small gap height to disk radius ratio. Multiobjective optimization problems are solved using the epsilon-constraintmethod along with an interior-point nonlinear programming algorithm. The trade-off between competing objectivesis quantified, revealing mechanisms of performance enhancement. Various geometries are explored and optimized,including symmetric and asymmetric circular dimples, and novel arbitrary continuous texture geometries repre-sented using two-dimensional cubic spline interpolation. Shifting from simple dimpled textures to more generaltexture geometries resulted in significant simultaneous improvement in both performance metrics for full-film lu-brication texture design. An important qualitative result is that textures resembling a spiral blade tend to improveperformance for rotating contacts.
1 INTRODUCTIONFriction is a significant source of energy loss in mechanical components. The influence of surface roughness within
lubricated hydrodynamic contacts has been well-studied in the tribology community. Creating micro-dimples at frictionalcontact interfaces is known to be effective in reducing frictional losses [2–4]. Furthermore, recent studies proposed a pos-sibility that textured surfaces for sliding hydraulic interfaces can reduce effective friction, improve sealing, and increasethe load capacity simultaneously by creating texture in favorable shapes and dimensions [5–7]. However, the roughenedor dimpled surfaces in previous studies were restricted to relatively simple shapes, such as predefined shapes, randomlyroughened surfaces, and macroscopic sinusoidal textures [4, 8–16]. Although most existing studies in the literature include
∗This work was presented in part at the 42nd Design Automation Conference, Charlotte, NC, August 21-24, 2016 of the ASME [1].†Corresponding author
1
Published in Journal of Mechanical DesignThe final pulbication is available at ASME Digital Collection viahttp://dx.doi.org/10.1115/1.4036133
either symmetric texture profiles, or asymmetry only for the top profile of texture rim perimeters, Refs. [13, 14, 17] showedthat generating normal force with an asymmetric depth profile is more effective than with a symmetric depth profile. Due torecent manufacturing advancements, such as additive manufacturing and electric/electrochemical micromachining, textureswith more general geometries and scales are realizable for hydrodynamic lubrication surfaces [5,18,19]. Here more generaltexture geometries are investigated.
Film lubrication involves lubricant flow, which is often modeled using the fluid flow governing equations (e.g., Navier-Stokes equations). Solution of general forms of these equations is computationally expensive, limiting the utility of suchmodels for design studies [6, 20]. In hydrodynamic lubrication, however, the distance between sliding surfaces is muchsmaller than other length scales in the system; this allows the governing equations for flow to be simplified to the Reynoldsequation, which is more favorable for computation [21]. In a recent study, the Reynolds equation was solved for the full-film lubrication problem with circular dimples using the pseudo-spectral method [22]. This numerical method exhibitsexponential convergence with increasing order of polynomial basis function, is computationally efficient, and has beenvalidated against experiments [22, 23].
Here we are building upon this pseudo-spectral solution method for the Reynolds equation to explore a much widerrange of surface texture designs with the primary objective of friction reduction. Arbitrary continuous texture shapes areoptimized using effective parameterization techniques. Important existing options for describing curved shape designs in-clude analytical approaches, basis vectors, domain elements, Fourier descriptors, polynomial functions, response surfaces,and splines [24, 25]. These methods are often used in aeronautical system design (e.g., airfoil shape optimization [24])and other applications (e.g., photo-voltaic internal reflection texture design [26]). The specific parameterization used in thisstudy involves spline functions defined in two orthogonal directions to represent arbitrary texture shapes in three dimensionalspace.
2 PROBLEM DESCRIPTIONThe objective of the design problem in this study is to maximize the film lubrication efficiency and effectiveness by
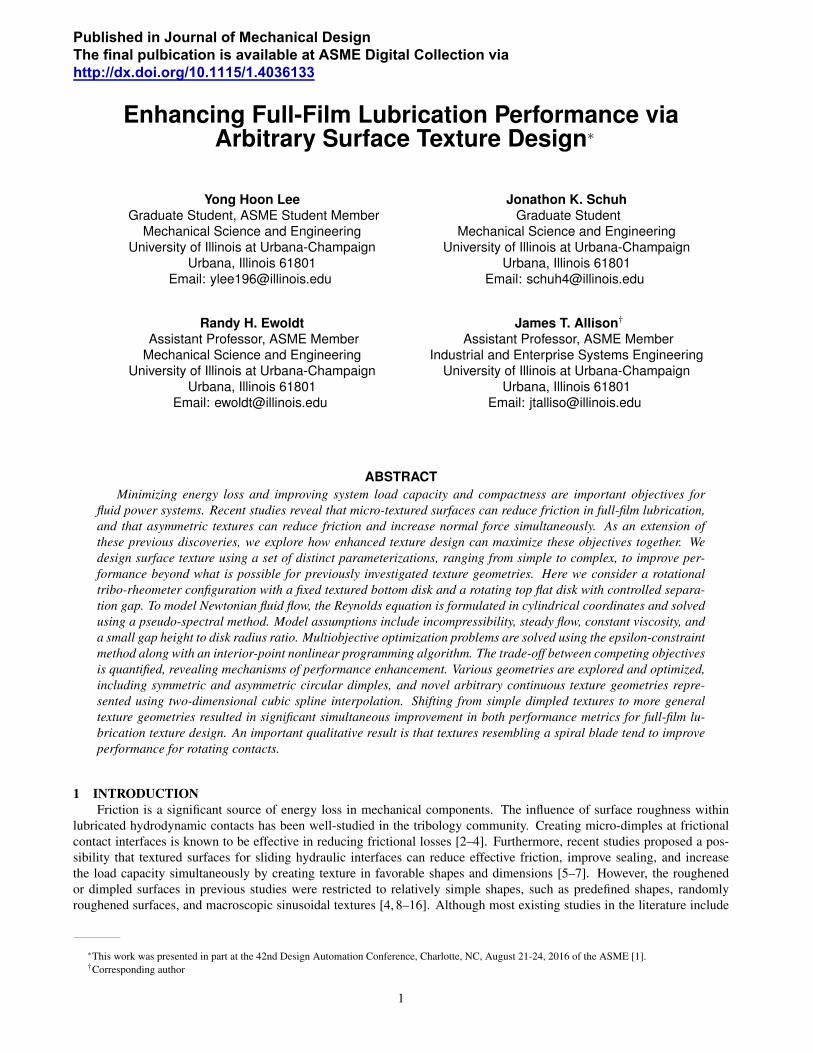
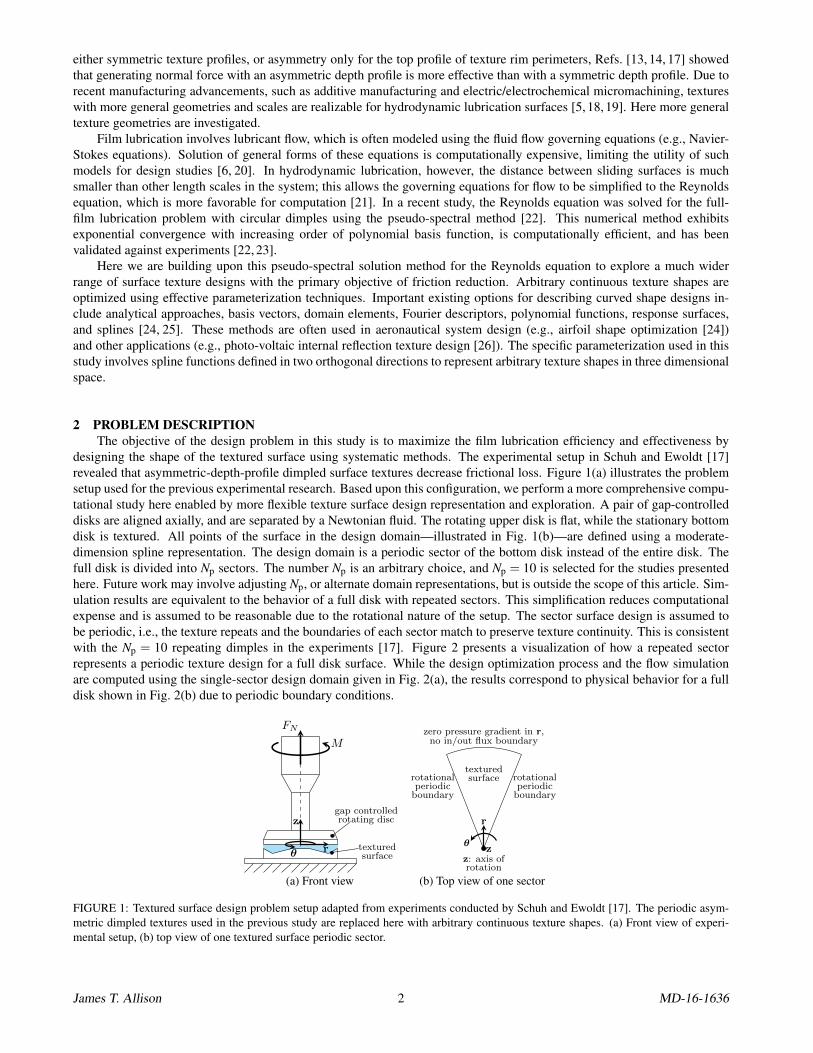
designing the shape of the textured surface using systematic methods. The experimental setup in Schuh and Ewoldt [17]revealed that asymmetric-depth-profile dimpled surface textures decrease frictional loss. Figure 1(a) illustrates the problemsetup used for the previous experimental research. Based upon this configuration, we perform a more comprehensive compu-tational study here enabled by more flexible texture surface design representation and exploration. A pair of gap-controlleddisks are aligned axially, and are separated by a Newtonian fluid. The rotating upper disk is flat, while the stationary bottomdisk is textured. All points of the surface in the design domain—illustrated in Fig. 1(b)—are defined using a moderate-dimension spline representation. The design domain is a periodic sector of the bottom disk instead of the entire disk. Thefull disk is divided into Np sectors. The number Np is an arbitrary choice, and Np = 10 is selected for the studies presentedhere. Future work may involve adjusting Np, or alternate domain representations, but is outside the scope of this article. Sim-ulation results are equivalent to the behavior of a full disk with repeated sectors. This simplification reduces computationalexpense and is assumed to be reasonable due to the rotational nature of the setup. The sector surface design is assumed tobe periodic, i.e., the texture repeats and the boundaries of each sector match to preserve texture continuity. This is consistentwith the Np = 10 repeating dimples in the experiments [17]. Figure 2 presents a visualization of how a repeated sectorrepresents a periodic texture design for a full disk surface. While the design optimization process and the flow simulationare computed using the single-sector design domain given in Fig. 2(a), the results correspond to physical behavior for a fulldisk shown in Fig. 2(b) due to periodic boundary conditions.
r
z
θ
M
FN
texturedsurface
gap controlledrotating disc
(a) Front view
z: axis ofrotation
z
rotationalperiodic
boundary
rotationalperiodic
boundary
texturedsurface
zero pressure gradient in r,no in/out flux boundary
r
θ
(b) Top view of one sector
FIGURE 1: Textured surface design problem setup adapted from experiments conducted by Schuh and Ewoldt [17]. The periodic asym-metric dimpled textures used in the previous study are replaced here with arbitrary continuous texture shapes. (a) Front view of experi-mental setup, (b) top view of one textured surface periodic sector.
James T. Allison 2 MD-16-1636
(a) Design domain (a sector) (b) Physical shape (full disk)
FIGURE 2: An example of texture height profile contours shown for a design domain sector (a) and for a full disk (b). Darker colorcorresponds to a lower surface level (larger gap height)
3 SURFACE PARAMETERIZATION METHODIn previous related work, surface textures have been described using very simple parameterizations. For example, one
strategy assumes that surface texture features consist only of cylindrical dimples, either with flat or angled lower surfaces,and are parameterized using dimple diameter, depth, and lower surface angle [6, 17]. Another strategy prescribes a setof allowable surface textures (e.g., circle, ellipse, triangle) and selects among them by comparing performance [8, 12, 13].Another study designed texture with respect to its top profile view, but maintained the gap height inside the texture at a fixedvalue [27]. This approach provides a general outline shape as a texture boundary, but still does not represent a general heightprofile for texture design.
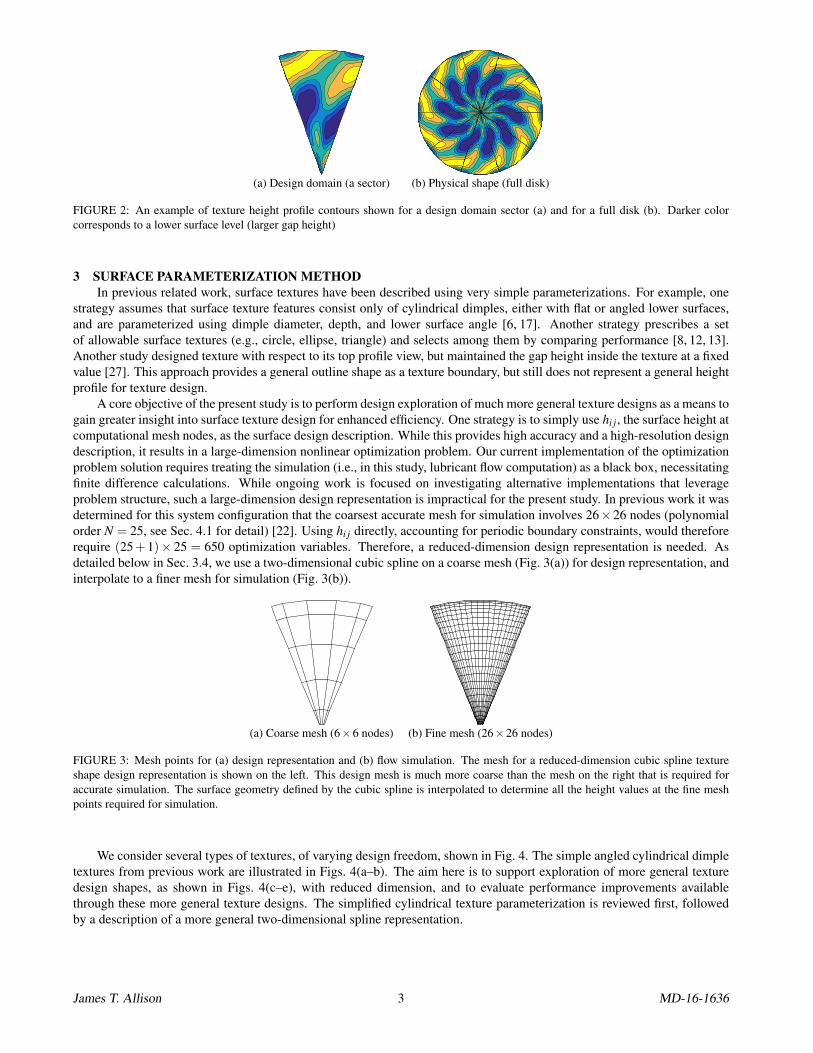
A core objective of the present study is to perform design exploration of much more general texture designs as a means togain greater insight into surface texture design for enhanced efficiency. One strategy is to simply use hi j, the surface height atcomputational mesh nodes, as the surface design description. While this provides high accuracy and a high-resolution designdescription, it results in a large-dimension nonlinear optimization problem. Our current implementation of the optimizationproblem solution requires treating the simulation (i.e., in this study, lubricant flow computation) as a black box, necessitatingfinite difference calculations. While ongoing work is focused on investigating alternative implementations that leverageproblem structure, such a large-dimension design representation is impractical for the present study. In previous work it wasdetermined for this system configuration that the coarsest accurate mesh for simulation involves 26×26 nodes (polynomialorder N = 25, see Sec. 4.1 for detail) [22]. Using hi j directly, accounting for periodic boundary constraints, would thereforerequire (25+1)× 25 = 650 optimization variables. Therefore, a reduced-dimension design representation is needed. Asdetailed below in Sec. 3.4, we use a two-dimensional cubic spline on a coarse mesh (Fig. 3(a)) for design representation, andinterpolate to a finer mesh for simulation (Fig. 3(b)).
(a) Coarse mesh (6×6 nodes) (b) Fine mesh (26×26 nodes)
FIGURE 3: Mesh points for (a) design representation and (b) flow simulation. The mesh for a reduced-dimension cubic spline textureshape design representation is shown on the left. This design mesh is much more coarse than the mesh on the right that is required foraccurate simulation. The surface geometry defined by the cubic spline is interpolated to determine all the height values at the fine meshpoints required for simulation.
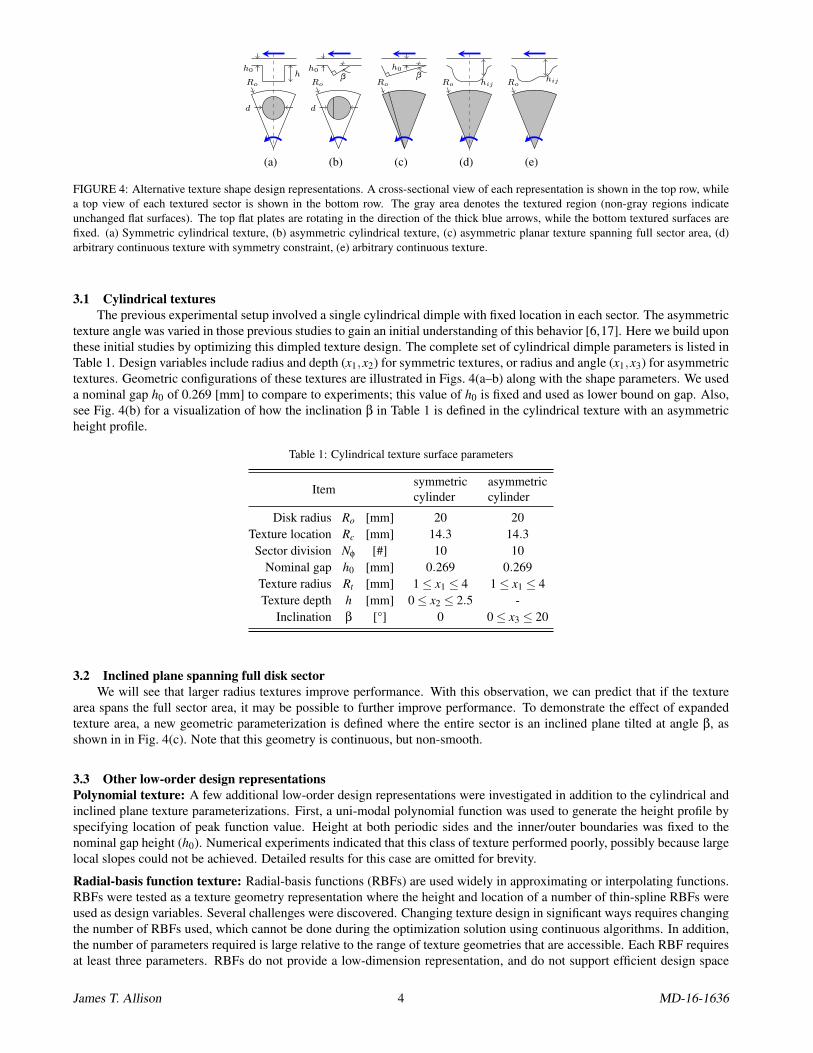
We consider several types of textures, of varying design freedom, shown in Fig. 4. The simple angled cylindrical dimpletextures from previous work are illustrated in Figs. 4(a–b). The aim here is to support exploration of more general texturedesign shapes, as shown in Figs. 4(c–e), with reduced dimension, and to evaluate performance improvements availablethrough these more general texture designs. The simplified cylindrical texture parameterization is reviewed first, followedby a description of a more general two-dimensional spline representation.
James T. Allison 3 MD-16-1636
hh0
Ro
d
(a)
βh0
Ro
d
(b)
βh0
Ro
(c)
hijRo
(d)
hijRo
(e)
FIGURE 4: Alternative texture shape design representations. A cross-sectional view of each representation is shown in the top row, whilea top view of each textured sector is shown in the bottom row. The gray area denotes the textured region (non-gray regions indicateunchanged flat surfaces). The top flat plates are rotating in the direction of the thick blue arrows, while the bottom textured surfaces arefixed. (a) Symmetric cylindrical texture, (b) asymmetric cylindrical texture, (c) asymmetric planar texture spanning full sector area, (d)arbitrary continuous texture with symmetry constraint, (e) arbitrary continuous texture.
3.1 Cylindrical texturesThe previous experimental setup involved a single cylindrical dimple with fixed location in each sector. The asymmetric
texture angle was varied in those previous studies to gain an initial understanding of this behavior [6,17]. Here we build uponthese initial studies by optimizing this dimpled texture design. The complete set of cylindrical dimple parameters is listed inTable 1. Design variables include radius and depth (x1,x2) for symmetric textures, or radius and angle (x1,x3) for asymmetrictextures. Geometric configurations of these textures are illustrated in Figs. 4(a–b) along with the shape parameters. We useda nominal gap h0 of 0.269 [mm] to compare to experiments; this value of h0 is fixed and used as lower bound on gap. Also,see Fig. 4(b) for a visualization of how the inclination β in Table 1 is defined in the cylindrical texture with an asymmetricheight profile.
Table 1: Cylindrical texture surface parameters
Itemsymmetriccylinder
asymmetriccylinder
Disk radius Ro [mm] 20 20Texture location Rc [mm] 14.3 14.3Sector division Nφ [#] 10 10
Nominal gap h0 [mm] 0.269 0.269Texture radius Rt [mm] 1≤ x1 ≤ 4 1≤ x1 ≤ 4Texture depth h [mm] 0≤ x2 ≤ 2.5 -
Inclination β [°] 0 0≤ x3 ≤ 20
3.2 Inclined plane spanning full disk sectorWe will see that larger radius textures improve performance. With this observation, we can predict that if the texture
area spans the full sector area, it may be possible to further improve performance. To demonstrate the effect of expandedtexture area, a new geometric parameterization is defined where the entire sector is an inclined plane tilted at angle β, asshown in in Fig. 4(c). Note that this geometry is continuous, but non-smooth.
3.3 Other low-order design representationsPolynomial texture: A few additional low-order design representations were investigated in addition to the cylindrical andinclined plane texture parameterizations. First, a uni-modal polynomial function was used to generate the height profile byspecifying location of peak function value. Height at both periodic sides and the inner/outer boundaries was fixed to thenominal gap height (h0). Numerical experiments indicated that this class of texture performed poorly, possibly because largelocal slopes could not be achieved. Detailed results for this case are omitted for brevity.
Radial-basis function texture: Radial-basis functions (RBFs) are used widely in approximating or interpolating functions.RBFs were tested as a texture geometry representation where the height and location of a number of thin-spline RBFs wereused as design variables. Several challenges were discovered. Changing texture design in significant ways requires changingthe number of RBFs used, which cannot be done during the optimization solution using continuous algorithms. In addition,the number of parameters required is large relative to the range of texture geometries that are accessible. Each RBF requiresat least three parameters. RBFs do not provide a low-dimension representation, and do not support efficient design space
James T. Allison 4 MD-16-1636
exploration for this problem compared to the spline representation discussed next. Detailed results for this case are alsoomitted for brevity.
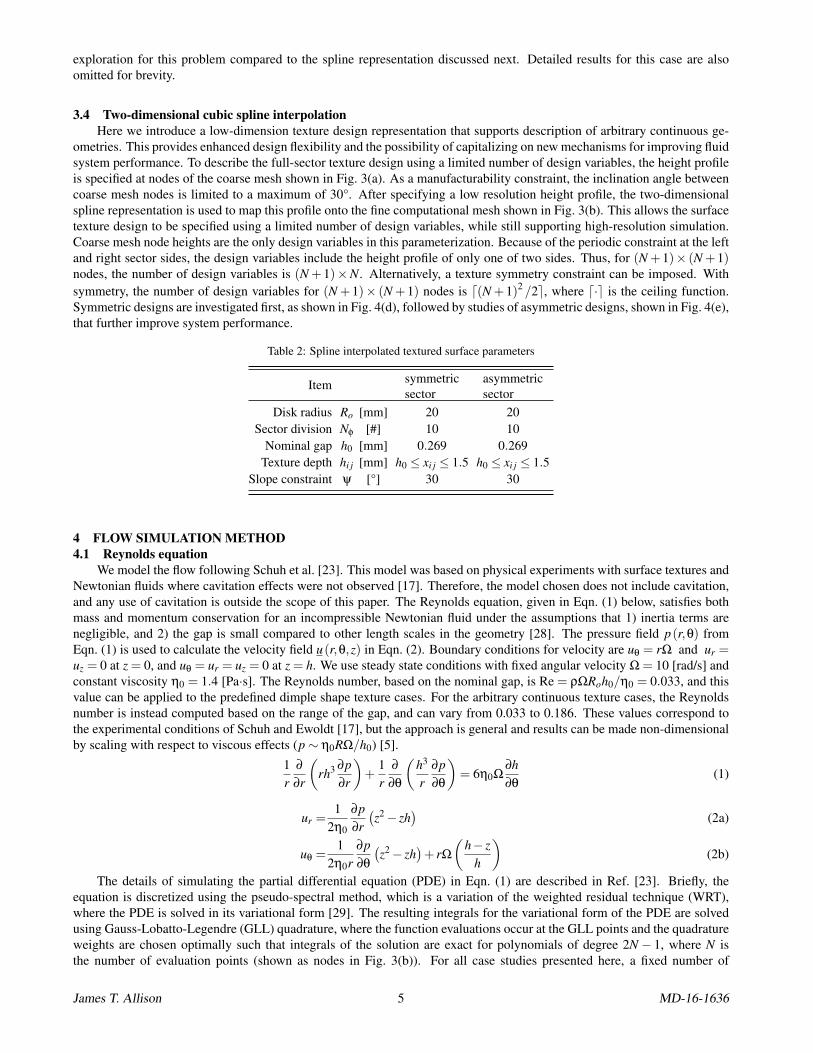
3.4 Two-dimensional cubic spline interpolationHere we introduce a low-dimension texture design representation that supports description of arbitrary continuous ge-
ometries. This provides enhanced design flexibility and the possibility of capitalizing on new mechanisms for improving fluidsystem performance. To describe the full-sector texture design using a limited number of design variables, the height profileis specified at nodes of the coarse mesh shown in Fig. 3(a). As a manufacturability constraint, the inclination angle betweencoarse mesh nodes is limited to a maximum of 30°. After specifying a low resolution height profile, the two-dimensionalspline representation is used to map this profile onto the fine computational mesh shown in Fig. 3(b). This allows the surfacetexture design to be specified using a limited number of design variables, while still supporting high-resolution simulation.Coarse mesh node heights are the only design variables in this parameterization. Because of the periodic constraint at the leftand right sector sides, the design variables include the height profile of only one of two sides. Thus, for (N +1)× (N +1)nodes, the number of design variables is (N +1)×N. Alternatively, a texture symmetry constraint can be imposed. Withsymmetry, the number of design variables for (N +1)× (N +1) nodes is d(N +1)2 /2e, where d·e is the ceiling function.Symmetric designs are investigated first, as shown in Fig. 4(d), followed by studies of asymmetric designs, shown in Fig. 4(e),that further improve system performance.
Table 2: Spline interpolated textured surface parameters
Item symmetricsector
asymmetricsector
Disk radius Ro [mm] 20 20Sector division Nφ [#] 10 10
Nominal gap h0 [mm] 0.269 0.269Texture depth hi j [mm] h0 ≤ xi j ≤ 1.5 h0 ≤ xi j ≤ 1.5
Slope constraint ψ [°] 30 30
4 FLOW SIMULATION METHOD4.1 Reynolds equation
We model the flow following Schuh et al. [23]. This model was based on physical experiments with surface textures andNewtonian fluids where cavitation effects were not observed [17]. Therefore, the model chosen does not include cavitation,and any use of cavitation is outside the scope of this paper. The Reynolds equation, given in Eqn. (1) below, satisfies bothmass and momentum conservation for an incompressible Newtonian fluid under the assumptions that 1) inertia terms arenegligible, and 2) the gap is small compared to other length scales in the geometry [28]. The pressure field p(r,θ) fromEqn. (1) is used to calculate the velocity field u(r,θ,z) in Eqn. (2). Boundary conditions for velocity are uθ = rΩ and ur =uz = 0 at z = 0, and uθ = ur = uz = 0 at z = h. We use steady state conditions with fixed angular velocity Ω = 10 [rad/s] andconstant viscosity η0 = 1.4 [Pa·s]. The Reynolds number, based on the nominal gap, is Re = ρΩRoh0/η0 = 0.033, and thisvalue can be applied to the predefined dimple shape texture cases. For the arbitrary continuous texture cases, the Reynoldsnumber is instead computed based on the range of the gap, and can vary from 0.033 to 0.186. These values correspond tothe experimental conditions of Schuh and Ewoldt [17], but the approach is general and results can be made non-dimensionalby scaling with respect to viscous effects (p∼ η0RΩ/h0) [5].
1r
∂
∂r
(rh3 ∂p
∂r
)+
1r
∂
∂θ
(h3
r∂p∂θ
)= 6η0Ω
∂h∂θ
(1)
ur =1
2η0
∂p∂r
(z2− zh
)(2a)
uθ =1
2η0r∂p∂θ
(z2− zh
)+ rΩ
(h− z
h
)(2b)
The details of simulating the partial differential equation (PDE) in Eqn. (1) are described in Ref. [23]. Briefly, theequation is discretized using the pseudo-spectral method, which is a variation of the weighted residual technique (WRT),where the PDE is solved in its variational form [29]. The resulting integrals for the variational form of the PDE are solvedusing Gauss-Lobatto-Legendre (GLL) quadrature, where the function evaluations occur at the GLL points and the quadratureweights are chosen optimally such that integrals of the solution are exact for polynomials of degree 2N − 1, where N isthe number of evaluation points (shown as nodes in Fig. 3(b)). For all case studies presented here, a fixed number of
James T. Allison 5 MD-16-1636
computational mesh points, as illustrated in Fig. 3(b), was used for the Reynolds equation solver. This computational meshdensity is validated to be sufficient for accurate objective function prediction [22]. Since the Reynolds equation model issolved using the same mesh for the entire set of studies, its computational cost and prediction accuracy are independent ofdesign representation fidelity. Full details of this methodology are given in Refs. [22,23,29,30], where the model predictionshave been validated against experiments from Refs. [17, 22].
A previous study emphasized that the dimensionless parameters are important for interpreting the physics of lubricatedsliding contacts [5]. However, we do not use dimensionless parameters in flow simulation or in the optimization formulation.Analyses with dimensional variables in this study are still meaningful because similarity is maintained for the flow withinthe range of Reynolds numbers we are modeling. Results could be made dimensionless by scaling with respect to viscouseffects [5].
4.2 Boundary conditionsThe Reynolds equation model for this study predicts the pressure field with assumptions that recirculation is not present
in the velocity field, that the r and θ direction velocity field is a linear combination of simple shear and pressure driven flow,and that the pressure is invariant in the z direction. In the experiments, the outer edge of the textured domain was an oil-airinterface with the air at atmospheric pressure. Boundary conditions on the pressure and the velocity at the outer edge can bederived using conservation of normal and tangential stress. It is not possible, however, to implement the boundary conditionson the velocity field directly, because the Reynolds equation only defines and manipulates the pressure field (unlike theNavier-Stokes equations). However, we have explicit equations for velocity fields in terms of pressure as given in Eqn. (2).Therefore, boundary conditions on velocity need to be converted to pressure conditions.
In the design studies presented here it is assumed that texture variations extend all the way to the outermost boundaryof the sector. The boundary condition at the outer edge can be a choice between p = 0 (Dirichlet boundary condition) or∂p/∂r = 0 (Neumann boundary condition). The choice has consequences for the r-velocity ur boundary conditions [23]. Ifp= 0 at the outer edge, then ∂p/∂θ= 0 and this eliminates the pressure driven flow in the θ direction (first term in Eqn. (2b)).Then, if ∂h/∂θ 6= 0, i.e., texturing, at the outer edge, we have ∂uθ/∂θ 6= 0, and thus by mass conservation ∂ur/∂r 6= 0. Thismeans the r velocity component can be non-zero at the outer edge for the condition p = 0. This non-zero r velocity wouldcause fluid to leave the disk-shaped textured domain (which was not observed experimentally), and would also result ina non-zero shear stress component (τrz = η(∂ur/∂z)) on the outer free surface. To enforce ur = 0 at the outer edge (noflux), the gradient of pressure in the r direction at the outer edge must be zero (Eqn. (2a)), i.e., ∂p/∂r = 0, the Neumannboundary condition, and ∂p/∂θ is unspecified. The use of periodic and Neumann boundary conditions results in a pressurefield distribution quantified in terms of relative pressure with respect to an arbitrary fixed pressure at a certain location. Weeliminated this arbitrary shift in the pressure profile by constraining the average value of the pressure to be zero at the outeredge of the texture. This effectively assumes no net pressure drop across the liquid-air interface, e.g., due to surface tensionat a curved interface (Laplace pressure drop). This was also eliminated experimentally by calibrating and subtracting thiseffect [17].
5 OPTIMIZATION METHOD5.1 Multiobjective Optimization
Multiobjective optimization involves minimization or maximization of a set of multiple conflicting objective functions.The solution of such a problem is a set of non-dominated (Pareto-optimal) solutions, as opposed to a single optimum point aswith single objective optimization. A design point is non-dominated if one objective cannot be improved without degradingat least one other objective [31].
Two primary classes of methods are used to solve multiobjective optimization problems: population-based or scalarization-based methods. Population-based methods, such as multiobjective genetic algorithms (MOGAs), solve the optimizationproblem once and generate a set of solutions that form the Pareto set (approximately). These methods often improve theprobability of finding global instead of local optima, but may be computationally expensive due to the large number offunction evaluations typically required [32].
The second class of methods converts a single multiobjective problem into a set of ‘scalarized’ single objective prob-lems. These scalarization-based methods are often used in design optimization studies due to their computational efficiencyand simplicity [33]. The weighted-sum method is the simplest scalarization approach, but cannot identify non-dominatedsolutions in non-convex regions of a Pareto front. In addition, resulting non-dominated points are often clustered insteadof uniformly distributed across the Pareto surface. These limitations can be overcome through other more sophisticatedscalarization approaches, such as the ε-constraint method [34], which is illustrated in Fig. 5 and described in Section 5.3.We used the ε-constraint method in this study to enable identification of non-convex Pareto fronts while supporting use ofcomputationally-efficient gradient-based optimization methods.
James T. Allison 6 MD-16-1636
5.2 Multiobjective FormulationThe conflicting objectives of the full-film lubrication problem considered here are to 1) minimize the shear load, repre-
sented as normalized apparent shear viscosity ηa/η0, and 2) to maximize the normal force load FN . Friction is a significantsource of energy loss for systems involving lubricated hydrodynamic contacts. Friction can be reduced by increasing the gapbetween the sliding contact surfaces. Increasing this gap, however, degrades load capacity and sealing performance.
Fluid and pressure losses due to poor sealing are very undesirable outcomes, e.g., for hydraulic power systems. Improvedsealing requires increased normal force, but increased normal force may increase frictional losses (e.g., fluid squeeze-out,higher contact friction, etc.) [35]. These two objective functions therefore conflict, and the solution to this multi-objectivedesign problem will be a set of non-dominated points that quantify trade-off options. Adding certain types of textures to thefull-film lubrication problem was found in previous studies to simultaneously improve both of these objective functions. Inother words, transitioning to more effective texture classes shifts the Pareto surface toward more desirable objective functionvalues. These previous studies were limited to very simple uniform dimpled textures [4–6, 8, 22, 23]. Here we aim to shiftthe attainable Pareto set even more by considering more general texture designs. We also aim to gain fundamental insightsabout how best to design surface textures for full-film lubrication applications.
The multiobjective problem formulation used here is:
minx
ηa(x)
η0,−FN(x)
(3a)
subject to xmin ≤ x≤ xmax, (3b)hmin ≤ hi j(x)≤ hmax, ∀i, j ∈D, (3c)
where x is a vector of design variables that represents texture geometry (e.g., spline, etc.) and fluid properties are fixed. In thisstudy, geometric parameterizations are formulated to implicitly satisfy the periodic boundary conditions for the surface shape.For a given value of x, the resulting geometric surface description is then used to determine high-resolution surface heightvalues: hi j(x), ∀i, j ∈D. The height values hi j(·) quantify the surface shape at mesh points needed for the pseudo-spectralmethod, D is the set of indices for all mesh points in the design domain, and i, j are node indices in the two-dimensionalmapped mesh space. The objective functions ultimately depend on x. The height values, obtained from x, are used withinthe simulation to obtain intermediate quantities needed to compute the objective function values. The simulation solves forthe pressure distribution p(r,θ) and velocity field ur (r,θ,z), uθ (r,θ,z).
The first objective function, normalized apparent viscosity ηa(x)/η0, is calculated by a ratio of apparent viscosity (ηa(x),depends on design) to actual fluid viscosity (η0, fixed, depends on fluid selection) [36]. The apparent viscosity is definedfrom the torque M on the rotating disk (integrated shear stress). For the rotating disk configuration, apparent viscosity canbe written as a function of disk torque M.
ηa = ηa (M) =2h0
πR4o
MΩ
(4a)
where, M = Nφ
∫ ϕ/2
−ϕ/2
∫ Ro
Ri
τθz|z=0 r2 dr dθ (4b)
and τθz|z=0 =−12
1r
∂p∂θ
h−η0rΩ
h(4c)
Ro is the outer radius of textured disk; h0 is a controlled minimum gap height between the fixed and rotating disks; Ω isthe rotating disk angular velocity. Equation (4b) defines how disk torque is calculated, which requires evaluation of theθ-direction (tangential) shear stress (τθz(r,θ), where z is the vertical coordinate) at the rotating surface across the completedomain. The shear stress calculation requires knowledge of the velocity field, which for the Reynolds equation depends ongradients of the pressure field (∇p(r,θ)) across the entire computational domain of the flow field. For example, the shearstress in the theta direction can be calculated as a function of ∂p(r,θ)/∂θ as given in Eqn. (4c). The second objectivefunction, the negative normal force (−FN), is calculated by integrating pressure over the domain, and then multiplying thisvalue by the total number of disk sectors (Nφ) as shown in Eqn. (5).
FN = FN (p) = Nφ
∫ ϕ/2
−ϕ/2
∫ Ro
Ri
p r dr dθ (5)
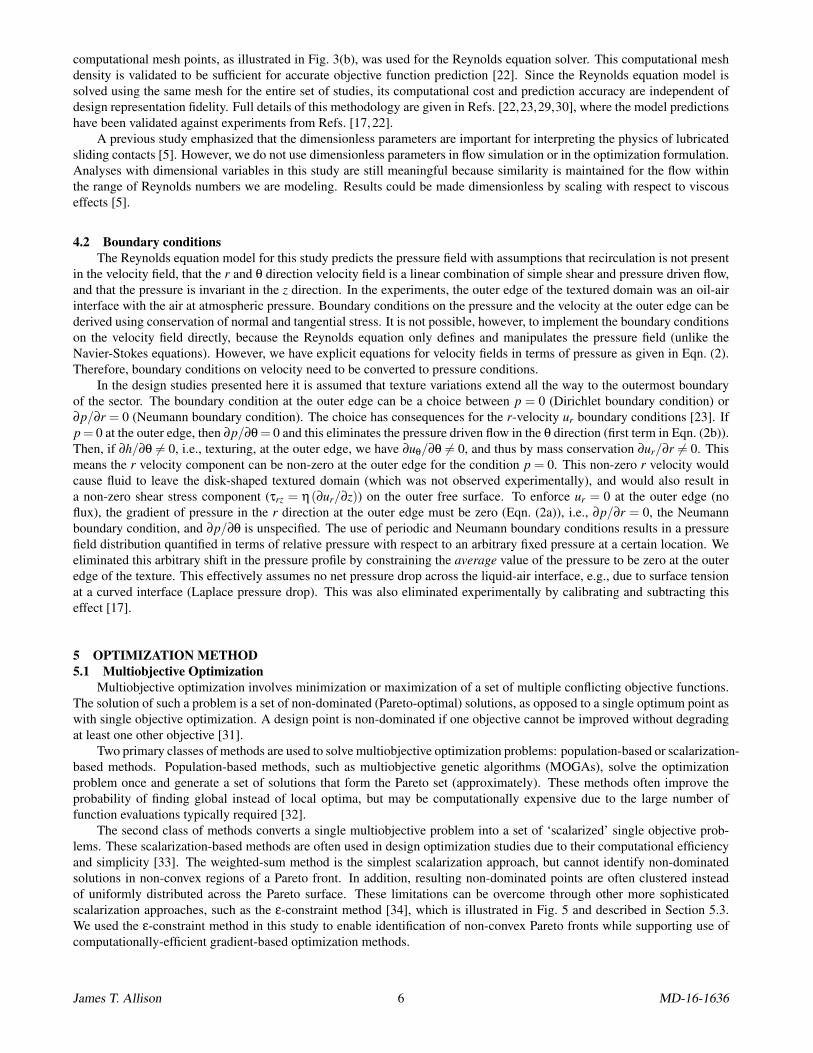
5.3 ε-constraint methodThe ε-constraint method is a type of scalarization technique for multiobjective optimization. A multiobjective problem
is transformed to a single objective problem by retaining just one of the original objective functions, and the remainingobjective functions are converted to constraints that bound these other objective function values [34]. Figure 5 illustrateshow the ε-constraint method minimizes the first objective function ( f1(·)), while a constraint prevents the second objectivefunction ( f2(·)) from exceeding a bound denoted by red horizontal lines in the objective function space. The objectivefunction space is a multidimensional space f ∈ Rm, where R is the real number space and m is the number of objective
James T. Allison 7 MD-16-1636
functions. This procedure is repeated, each time with a different bound on f2(·). In the example shown in Fig. 5 theoptimization problem is solved five times to generate five Pareto-optimal solutions. This strategy supports the use of existingsingle-objective optimization algorithms in solving multiobjective problems, including the ability to resolve non-convexportions of the Pareto surface, and to generate well-distributed Pareto-optimal points. The multiobjective formulation inProb. (3) can be reformulated for ε-constraint solution as follows:
minx
ηa(x)η0
(6a)
subject to −FN ≤ εk (6b)xmin ≤ x≤ xmax (6c)hmin ≤ hi j(x)≤ hmax, ∀i, j ∈D (6d)∀k ∈ 1,2, . . . ,np, (6e)
where np is the number of Pareto-optimal points to solve for. One possible strategy, which is used in this study, is to incrementεi uniformly, i.e., εi+1 = εi +δ, where ε1 = (−FN)min and δ = ((−FN)max− (−FN)min)/(np−1).
(1)
(2)
(3)
(4)
(5)
(1)
(2)
(3)
(4)
(5)f1
f2Attainable set
(n) nth point in Pareto set
(n) nth constraint for f2
FIGURE 5: The ε-constraint method converts a multiobjective optimization problem to multiple single objective optimization problems.For each scalarized problem, one objective is minimized while satisfying bound constraints on the other objectives.
6 RESULTS AND DISCUSSION6.1 Cylindrical textures
A full factorial set of cylindrical texture designs, both in symmetric and asymmetric configurations, was generated andevaluated to provide insight into how design variables influence objective functions, and to assess trade-offs. Texture radius(Rt ) and depth (h) are the design variables used for the symmetric cylindrical texture study, and texture radius (Rt ) and angle(β) are the design variables used for the asymmetric cylindrical texture study. Figure 6 illustrates the contours of the twoobjective functions for both cases. Figures 6(a–b) correspond to the symmetric texture, and Figs. 6(c–d) correspond to theasymmetric texture.
For the symmetric textures, shear load (normalized apparent viscosity) decreases with “big” textures (i.e., larger radiusand deeper depth) down to ηa/η0 = 0.714, while no normal force is observed. Thus, the lowest shear load determines theoptimal design (circles in Fig. 7). For asymmetric textures, the angle β determines texture depth (β = 0 is a flat surface).Shear load is still minimized for “big” textures (i.e., large radius and large β). Normal force is expected to be maximized atan intermediate angle β [17, 23], and here this occurs at β = 3.6°. Normalized shear load ranges from 0.794 to 0.902, andnormal force ranges from 0.212 to 0.762 N. Asymmetry is required to generate normal force.
Design variable bounds are chosen such that the Reynolds equation simulation results reasonably agree with resultsbased on the full Navier-Stokes equation. Figure 7 shows both Reynolds equation and Navier-Stokes equation solutionsusing ANSYS Fluent in terms of normalized apparent viscosity for the symmetric cylindrical texture problem. When thetexture depth is 2 mm and 4 mm, the solution of the Reynolds equation deviates 1.65% and 6.93%, respectively, from thesolution of the full Navier-Stokes equation. Due to this limitation in the Reynolds equation model, the depth variable shouldbe constrained to preserve accuracy. Furthermore, the full Navier-Stokes predictions indicate that normalized apparentviscosity plateaus beyond a certain depth (note that the plot is log-scale). This means that the frictional performance cannotbe enhanced more through increases in depth beyond a certain value.
For both symmetric and asymmetric textures, the first objective function (minimizing normalized apparent viscosity)has monotonic dependence on texture depth and radius as shown in Figs. 6(a, c) (the objective decreases with increasingdepth and radius). In the asymmetric configuration study the angle was varied between 0–20°. Within this range, increasingthe angle corresponds to increased average texture depth, and increased lubricant volume. This observation, along with theresults presented here, indicate that the total volume removed for a texture is important for reducing friction.
The behavior of the second objective function (maximizing normal force) is different for the symmetric and asymmetricconfigurations. Symmetric cylindrical design variables do not influence normal force because geometric symmetry in thesliding direction results in negative and positive pressure distributions that countervail each other through the expanding-
James T. Allison 8 MD-16-1636
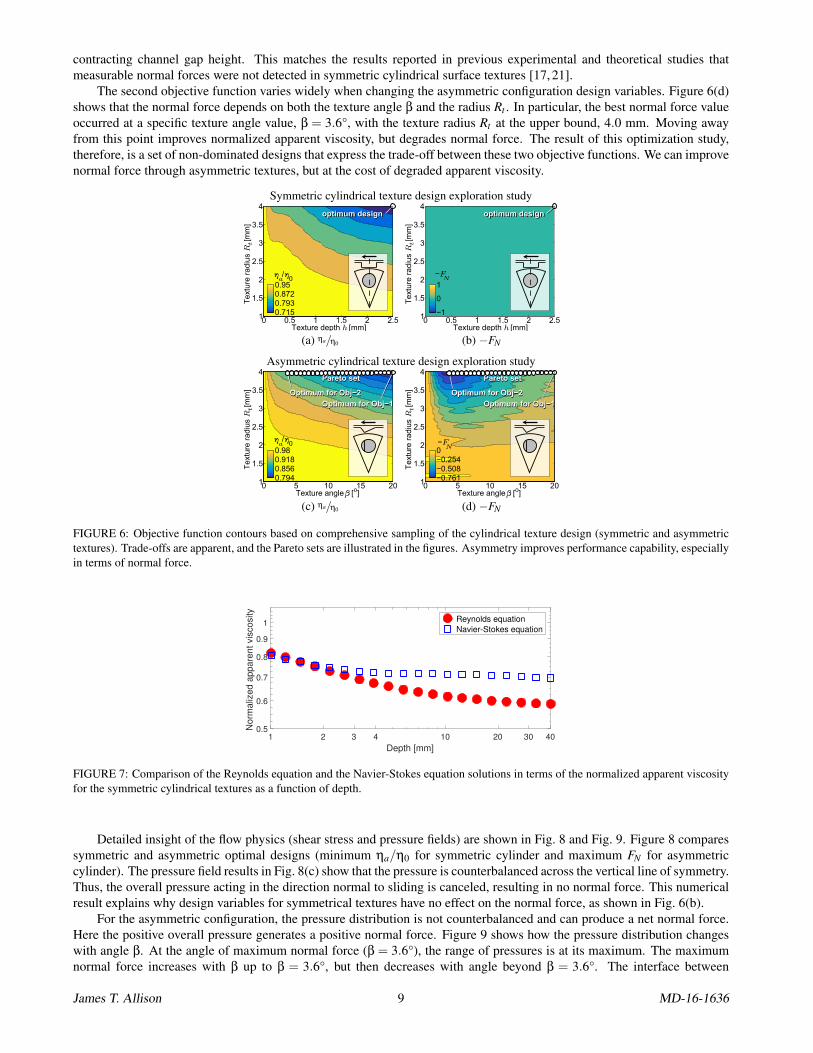
contracting channel gap height. This matches the results reported in previous experimental and theoretical studies thatmeasurable normal forces were not detected in symmetric cylindrical surface textures [17, 21].
The second objective function varies widely when changing the asymmetric configuration design variables. Figure 6(d)shows that the normal force depends on both the texture angle β and the radius Rt . In particular, the best normal force valueoccurred at a specific texture angle value, β = 3.6°, with the texture radius Rt at the upper bound, 4.0 mm. Moving awayfrom this point improves normalized apparent viscosity, but degrades normal force. The result of this optimization study,therefore, is a set of non-dominated designs that express the trade-off between these two objective functions. We can improvenormal force through asymmetric textures, but at the cost of degraded apparent viscosity.
Symmetric cylindrical texture design exploration study
Texture depth h [mm]
Tex
ture
rad
ius Rt[m
m]
optimum designoptimum design
0 0.5 1 1.5 2 2.51
1.5
2
2.5
3
3.5
4
ηa/η0
0.7150.7930.8720.95
(a) ηa/η0
Texture depth h [mm]
Tex
ture
rad
ius Rt[m
m]
optimum designoptimum design
0 0.5 1 1.5 2 2.51
1.5
2
2.5
3
3.5
4
−FN
−1
0
1
(b) −FN
Asymmetric cylindrical texture design exploration study
Texture angle β [o]
Tex
ture
rad
ius Rt[m
m]
Pareto setPareto set
Optimum for Obj−2Optimum for Obj−2
Optimum for Obj−1Optimum for Obj−1
0 5 10 15 201
1.5
2
2.5
3
3.5
4
ηa/η0
0.7940.8560.9180.98
(c) ηa/η0
Texture angle β [o]
Tex
ture
rad
ius Rt[m
m]
Pareto setPareto set
Optimum for Obj−2Optimum for Obj−2
Optimum for Obj−1Optimum for Obj−1
0 5 10 15 201
1.5
2
2.5
3
3.5
4
−FN
−0.761−0.508−0.2540
(d) −FN
FIGURE 6: Objective function contours based on comprehensive sampling of the cylindrical texture design (symmetric and asymmetrictextures). Trade-offs are apparent, and the Pareto sets are illustrated in the figures. Asymmetry improves performance capability, especiallyin terms of normal force.
1 2 3 4 10 20 30 40
Depth [mm]
0.5
0.6
0.7
0.8
0.9
1
Norm
aliz
ed a
ppare
nt vis
cosity
Reynolds equation
Navier-Stokes equation
FIGURE 7: Comparison of the Reynolds equation and the Navier-Stokes equation solutions in terms of the normalized apparent viscosityfor the symmetric cylindrical textures as a function of depth.
Detailed insight of the flow physics (shear stress and pressure fields) are shown in Fig. 8 and Fig. 9. Figure 8 comparessymmetric and asymmetric optimal designs (minimum ηa/η0 for symmetric cylinder and maximum FN for asymmetriccylinder). The pressure field results in Fig. 8(c) show that the pressure is counterbalanced across the vertical line of symmetry.Thus, the overall pressure acting in the direction normal to sliding is canceled, resulting in no normal force. This numericalresult explains why design variables for symmetrical textures have no effect on the normal force, as shown in Fig. 6(b).
For the asymmetric configuration, the pressure distribution is not counterbalanced and can produce a net normal force.Here the positive overall pressure generates a positive normal force. Figure 9 shows how the pressure distribution changeswith angle β. At the angle of maximum normal force (β = 3.6°), the range of pressures is at its maximum. The maximumnormal force increases with β up to β = 3.6°, but then decreases with angle beyond β = 3.6°. The interface between
James T. Allison 9 MD-16-1636
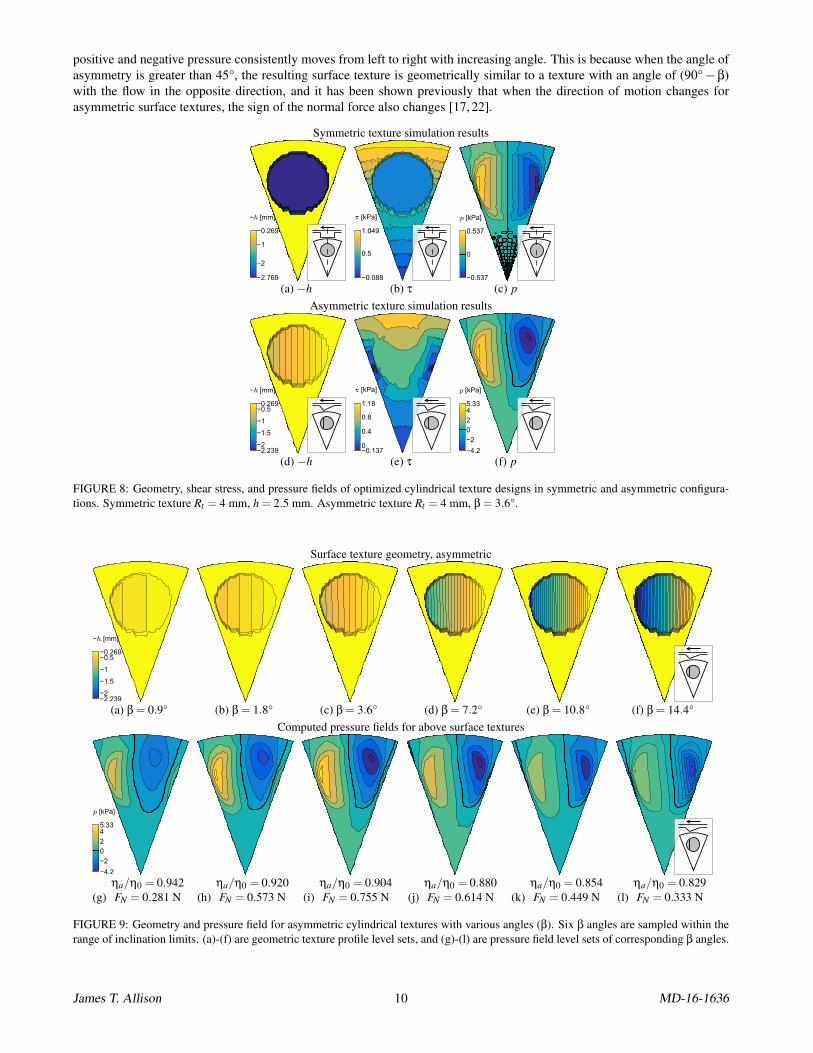
positive and negative pressure consistently moves from left to right with increasing angle. This is because when the angle ofasymmetry is greater than 45°, the resulting surface texture is geometrically similar to a texture with an angle of (90°−β)with the flow in the opposite direction, and it has been shown previously that when the direction of motion changes forasymmetric surface textures, the sign of the normal force also changes [17, 22].
Symmetric texture simulation results
−h
−2.769
−2
−1
−0.269
[mm]
(a) −h
τ
−0.088
0.5
1.049
[kPa]
(b) τ
p
−0.537
0
0.537
[kPa]
(c) pAsymmetric texture simulation results
−h
−2.239−2
−1.5
−1
−0.5−0.269
[mm]
(d) −h
τ
−0.1370
0.4
0.8
1.18
[kPa]
(e) τ
p
−4.2
−2
0
2
45.33
[kPa]
(f) p
FIGURE 8: Geometry, shear stress, and pressure fields of optimized cylindrical texture designs in symmetric and asymmetric configura-tions. Symmetric texture Rt = 4 mm, h = 2.5 mm. Asymmetric texture Rt = 4 mm, β = 3.6°.
Surface texture geometry, asymmetric
−h
−2.239−2
−1.5
−1
−0.5−0.269
[mm]
(a) β = 0.9° (b) β = 1.8° (c) β = 3.6° (d) β = 7.2° (e) β = 10.8° (f) β = 14.4°Computed pressure fields for above surface textures
p
−4.2
−2
0
2
45.33
[kPa]
(g)ηa/η0 = 0.942FN = 0.281 N (h)
ηa/η0 = 0.920FN = 0.573 N (i)
ηa/η0 = 0.904FN = 0.755 N (j)
ηa/η0 = 0.880FN = 0.614 N (k)
ηa/η0 = 0.854FN = 0.449 N (l)
ηa/η0 = 0.829FN = 0.333 N
FIGURE 9: Geometry and pressure field for asymmetric cylindrical textures with various angles (β). Six β angles are sampled within therange of inclination limits. (a)-(f) are geometric texture profile level sets, and (g)-(l) are pressure field level sets of corresponding β angles.
James T. Allison 10 MD-16-1636
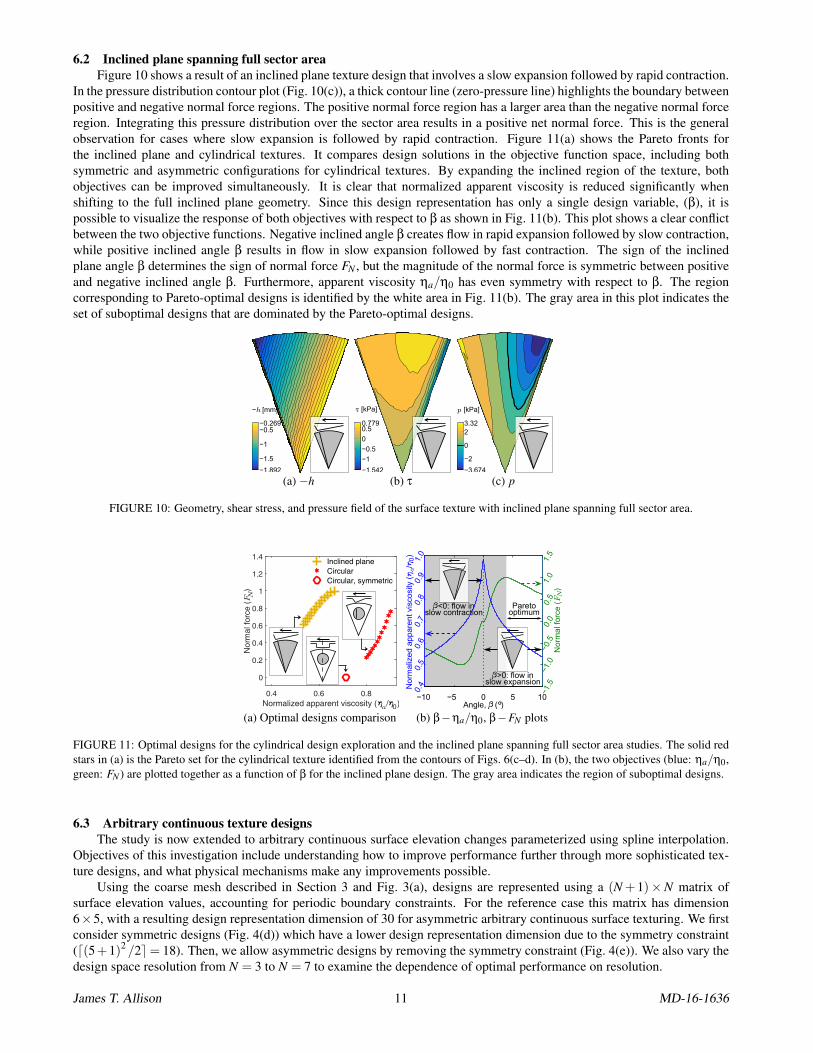
6.2 Inclined plane spanning full sector areaFigure 10 shows a result of an inclined plane texture design that involves a slow expansion followed by rapid contraction.
In the pressure distribution contour plot (Fig. 10(c)), a thick contour line (zero-pressure line) highlights the boundary betweenpositive and negative normal force regions. The positive normal force region has a larger area than the negative normal forceregion. Integrating this pressure distribution over the sector area results in a positive net normal force. This is the generalobservation for cases where slow expansion is followed by rapid contraction. Figure 11(a) shows the Pareto fronts forthe inclined plane and cylindrical textures. It compares design solutions in the objective function space, including bothsymmetric and asymmetric configurations for cylindrical textures. By expanding the inclined region of the texture, bothobjectives can be improved simultaneously. It is clear that normalized apparent viscosity is reduced significantly whenshifting to the full inclined plane geometry. Since this design representation has only a single design variable, (β), it ispossible to visualize the response of both objectives with respect to β as shown in Fig. 11(b). This plot shows a clear conflictbetween the two objective functions. Negative inclined angle β creates flow in rapid expansion followed by slow contraction,while positive inclined angle β results in flow in slow expansion followed by fast contraction. The sign of the inclinedplane angle β determines the sign of normal force FN , but the magnitude of the normal force is symmetric between positiveand negative inclined angle β. Furthermore, apparent viscosity ηa/η0 has even symmetry with respect to β. The regioncorresponding to Pareto-optimal designs is identified by the white area in Fig. 11(b). The gray area in this plot indicates theset of suboptimal designs that are dominated by the Pareto-optimal designs.
−h
−1.892
−1.5
−1
−0.5−0.269
[mm]
(a) −h
τ
−1.542
−1
−0.5
0
0.50.779
[kPa]
(b) τ
p
−3.674
−2
0
23.32
[kPa]
(c) p
FIGURE 10: Geometry, shear stress, and pressure field of the surface texture with inclined plane spanning full sector area.
0.4 0.6 0.8Normalized apparent viscosity (ηa/η0)
0
0.2
0.4
0.6
0.8
1
1.2
1.4
F( ecrof lamro
NN
)
Inclined planeCircularCircular, symmetric
(a) Optimal designs comparison
−5 0 5 10
0.4
0.5
0.6
0.7
0.8
0.9
Nor
mal
ized
app
aren
t vis
cosi
ty (ηa/η0)
Angle, β (°)−10
Nor
mal
forc
e (FN
)
Paretooptimum
−1.5
−0.5
0.5
1.5
1.0
−1.0
0.0
1.0
β>0: flow inslow expansion
β<0: flow inslow contraction
(b) β−ηa/η0, β−FN plots
FIGURE 11: Optimal designs for the cylindrical design exploration and the inclined plane spanning full sector area studies. The solid redstars in (a) is the Pareto set for the cylindrical texture identified from the contours of Figs. 6(c–d). In (b), the two objectives (blue: ηa/η0,green: FN ) are plotted together as a function of β for the inclined plane design. The gray area indicates the region of suboptimal designs.
6.3 Arbitrary continuous texture designsThe study is now extended to arbitrary continuous surface elevation changes parameterized using spline interpolation.
Objectives of this investigation include understanding how to improve performance further through more sophisticated tex-ture designs, and what physical mechanisms make any improvements possible.
Using the coarse mesh described in Section 3 and Fig. 3(a), designs are represented using a (N +1)×N matrix ofsurface elevation values, accounting for periodic boundary constraints. For the reference case this matrix has dimension6×5, with a resulting design representation dimension of 30 for asymmetric arbitrary continuous surface texturing. We firstconsider symmetric designs (Fig. 4(d)) which have a lower design representation dimension due to the symmetry constraint(d(5+1)2 /2e= 18). Then, we allow asymmetric designs by removing the symmetry constraint (Fig. 4(e)). We also vary thedesign space resolution from N = 3 to N = 7 to examine the dependence of optimal performance on resolution.
James T. Allison 11 MD-16-1636
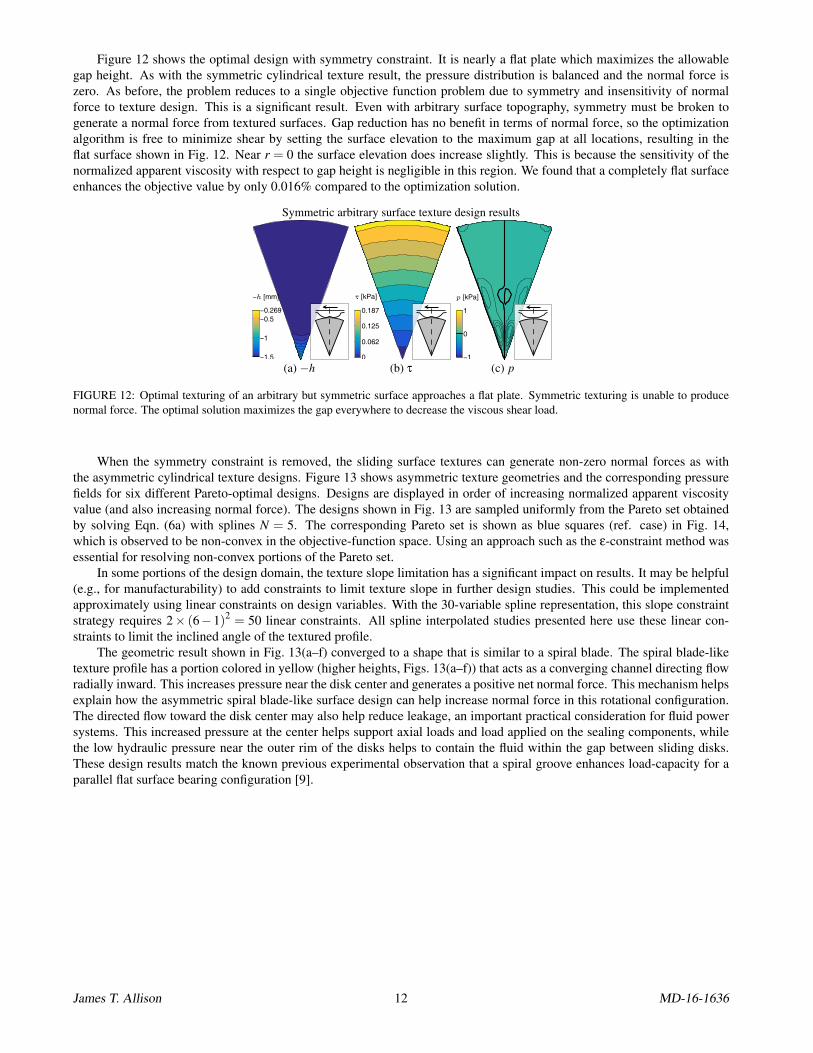
Figure 12 shows the optimal design with symmetry constraint. It is nearly a flat plate which maximizes the allowablegap height. As with the symmetric cylindrical texture result, the pressure distribution is balanced and the normal force iszero. As before, the problem reduces to a single objective function problem due to symmetry and insensitivity of normalforce to texture design. This is a significant result. Even with arbitrary surface topography, symmetry must be broken togenerate a normal force from textured surfaces. Gap reduction has no benefit in terms of normal force, so the optimizationalgorithm is free to minimize shear by setting the surface elevation to the maximum gap at all locations, resulting in theflat surface shown in Fig. 12. Near r = 0 the surface elevation does increase slightly. This is because the sensitivity of thenormalized apparent viscosity with respect to gap height is negligible in this region. We found that a completely flat surfaceenhances the objective value by only 0.016% compared to the optimization solution.
Symmetric arbitrary surface texture design results
−h
−1.5
−1
−0.5−0.269
[mm]
(a) −h
τ
0.062
0.125
0.187
0
[kPa]
(b) τ
p
−1
0
1
[kPa]
(c) p
FIGURE 12: Optimal texturing of an arbitrary but symmetric surface approaches a flat plate. Symmetric texturing is unable to producenormal force. The optimal solution maximizes the gap everywhere to decrease the viscous shear load.
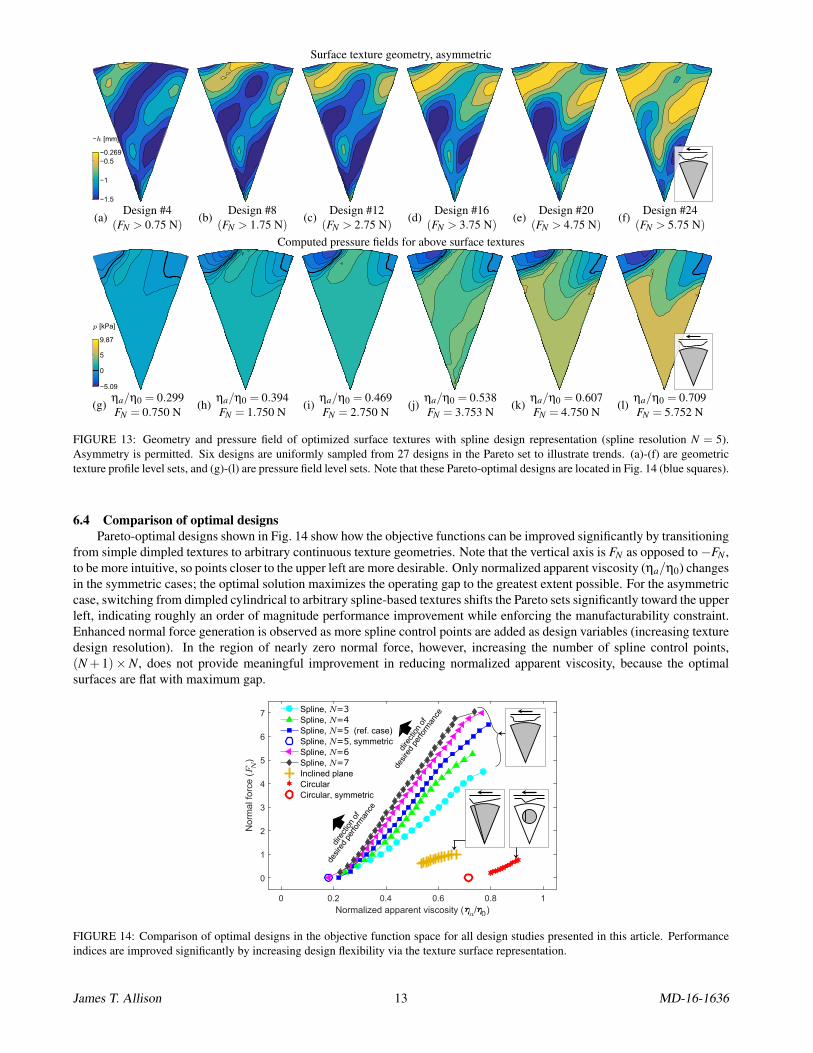
When the symmetry constraint is removed, the sliding surface textures can generate non-zero normal forces as withthe asymmetric cylindrical texture designs. Figure 13 shows asymmetric texture geometries and the corresponding pressurefields for six different Pareto-optimal designs. Designs are displayed in order of increasing normalized apparent viscosityvalue (and also increasing normal force). The designs shown in Fig. 13 are sampled uniformly from the Pareto set obtainedby solving Eqn. (6a) with splines N = 5. The corresponding Pareto set is shown as blue squares (ref. case) in Fig. 14,which is observed to be non-convex in the objective-function space. Using an approach such as the ε-constraint method wasessential for resolving non-convex portions of the Pareto set.
In some portions of the design domain, the texture slope limitation has a significant impact on results. It may be helpful(e.g., for manufacturability) to add constraints to limit texture slope in further design studies. This could be implementedapproximately using linear constraints on design variables. With the 30-variable spline representation, this slope constraintstrategy requires 2× (6−1)2 = 50 linear constraints. All spline interpolated studies presented here use these linear con-straints to limit the inclined angle of the textured profile.
The geometric result shown in Fig. 13(a–f) converged to a shape that is similar to a spiral blade. The spiral blade-liketexture profile has a portion colored in yellow (higher heights, Figs. 13(a–f)) that acts as a converging channel directing flowradially inward. This increases pressure near the disk center and generates a positive net normal force. This mechanism helpsexplain how the asymmetric spiral blade-like surface design can help increase normal force in this rotational configuration.The directed flow toward the disk center may also help reduce leakage, an important practical consideration for fluid powersystems. This increased pressure at the center helps support axial loads and load applied on the sealing components, whilethe low hydraulic pressure near the outer rim of the disks helps to contain the fluid within the gap between sliding disks.These design results match the known previous experimental observation that a spiral groove enhances load-capacity for aparallel flat surface bearing configuration [9].
James T. Allison 12 MD-16-1636
Surface texture geometry, asymmetric
−h
−1.5
−1
−0.5−0.269
[mm]
(a)Design #4
(FN > 0.75 N)(b)
Design #8(FN > 1.75 N)
(c)Design #12
(FN > 2.75 N)(d)
Design #16(FN > 3.75 N)
(e)Design #20
(FN > 4.75 N)(f)
Design #24(FN > 5.75 N)
Computed pressure fields for above surface textures
−5.09
0
5
9.87
p [kPa]
(g)ηa/η0 = 0.299FN = 0.750 N
(h)ηa/η0 = 0.394FN = 1.750 N
(i)ηa/η0 = 0.469FN = 2.750 N
(j)ηa/η0 = 0.538FN = 3.753 N
(k)ηa/η0 = 0.607FN = 4.750 N
(l)ηa/η0 = 0.709FN = 5.752 N
FIGURE 13: Geometry and pressure field of optimized surface textures with spline design representation (spline resolution N = 5).Asymmetry is permitted. Six designs are uniformly sampled from 27 designs in the Pareto set to illustrate trends. (a)-(f) are geometrictexture profile level sets, and (g)-(l) are pressure field level sets. Note that these Pareto-optimal designs are located in Fig. 14 (blue squares).
6.4 Comparison of optimal designsPareto-optimal designs shown in Fig. 14 show how the objective functions can be improved significantly by transitioning
from simple dimpled textures to arbitrary continuous texture geometries. Note that the vertical axis is FN as opposed to−FN ,to be more intuitive, so points closer to the upper left are more desirable. Only normalized apparent viscosity (ηa/η0) changesin the symmetric cases; the optimal solution maximizes the operating gap to the greatest extent possible. For the asymmetriccase, switching from dimpled cylindrical to arbitrary spline-based textures shifts the Pareto sets significantly toward the upperleft, indicating roughly an order of magnitude performance improvement while enforcing the manufacturability constraint.Enhanced normal force generation is observed as more spline control points are added as design variables (increasing texturedesign resolution). In the region of nearly zero normal force, however, increasing the number of spline control points,(N +1)×N, does not provide meaningful improvement in reducing normalized apparent viscosity, because the optimalsurfaces are flat with maximum gap.
0 0.2 0.4 0.6 0.8 1Normalized apparent viscosity (ηa/η0)
0
1
2
3
4
5
6
7
F( ecrof la
mroN
N)
Spline, N=3Spline, N=4Spline, N=5 (ref. case)Spline, N=5, symmetricSpline, N=6Spline, N=7Inclined planeCircularCircular, symmetric
dire
ctio
n of
desi
red
perfo
rman
ce
dire
ctio
n of
desi
red
perfo
rman
ce
FIGURE 14: Comparison of optimal designs in the objective function space for all design studies presented in this article. Performanceindices are improved significantly by increasing design flexibility via the texture surface representation.
James T. Allison 13 MD-16-1636
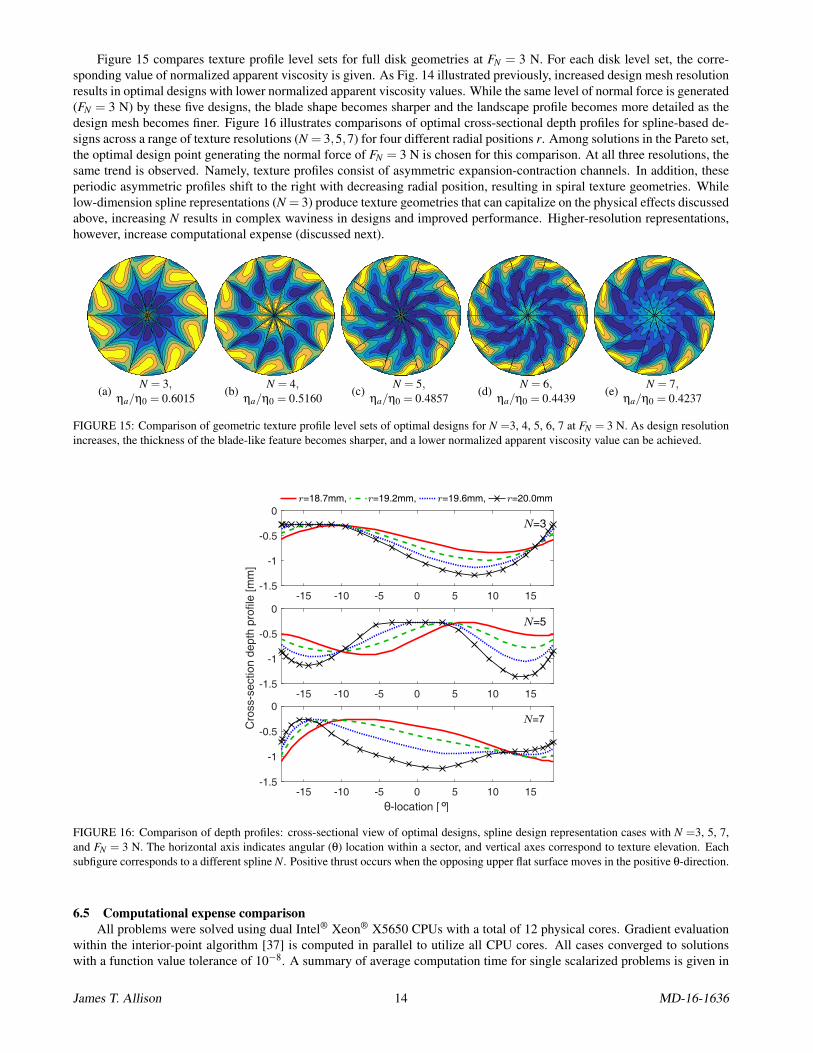
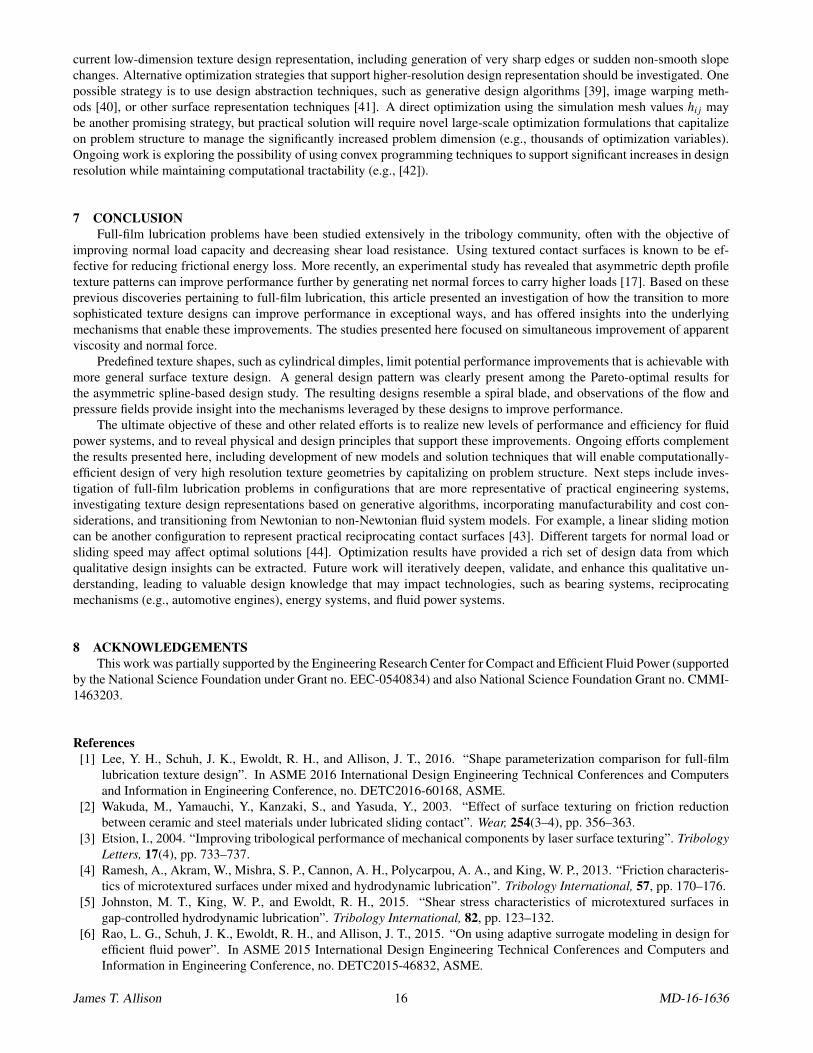
Figure 15 compares texture profile level sets for full disk geometries at FN = 3 N. For each disk level set, the corre-sponding value of normalized apparent viscosity is given. As Fig. 14 illustrated previously, increased design mesh resolutionresults in optimal designs with lower normalized apparent viscosity values. While the same level of normal force is generated(FN = 3 N) by these five designs, the blade shape becomes sharper and the landscape profile becomes more detailed as thedesign mesh becomes finer. Figure 16 illustrates comparisons of optimal cross-sectional depth profiles for spline-based de-signs across a range of texture resolutions (N = 3,5,7) for four different radial positions r. Among solutions in the Pareto set,the optimal design point generating the normal force of FN = 3 N is chosen for this comparison. At all three resolutions, thesame trend is observed. Namely, texture profiles consist of asymmetric expansion-contraction channels. In addition, theseperiodic asymmetric profiles shift to the right with decreasing radial position, resulting in spiral texture geometries. Whilelow-dimension spline representations (N = 3) produce texture geometries that can capitalize on the physical effects discussedabove, increasing N results in complex waviness in designs and improved performance. Higher-resolution representations,however, increase computational expense (discussed next).
(a)N = 3,
ηa/η0 = 0.6015(b)
N = 4,ηa/η0 = 0.5160
(c)N = 5,
ηa/η0 = 0.4857(d)
N = 6,ηa/η0 = 0.4439
(e)N = 7,
ηa/η0 = 0.4237
FIGURE 15: Comparison of geometric texture profile level sets of optimal designs for N =3, 4, 5, 6, 7 at FN = 3 N. As design resolutionincreases, the thickness of the blade-like feature becomes sharper, and a lower normalized apparent viscosity value can be achieved.
-15 -10 -5 0 5 10 15-1.5
-1
-0.5
0N=3
-15 -10 -5 0 5 10 15-1.5
-1
-0.5
0
Cro
ss-s
ectio
n de
pth
prof
ile [m
m]
N=5
-15 -10 -5 0 5 10 15
θ-location [°]
-1.5
-1
-0.5
0N=7
r=18.7mm, r=19.2mm, r=19.6mm, r=20.0mm
FIGURE 16: Comparison of depth profiles: cross-sectional view of optimal designs, spline design representation cases with N =3, 5, 7,and FN = 3 N. The horizontal axis indicates angular (θ) location within a sector, and vertical axes correspond to texture elevation. Eachsubfigure corresponds to a different spline N. Positive thrust occurs when the opposing upper flat surface moves in the positive θ-direction.
6.5 Computational expense comparisonAll problems were solved using dual Intel® Xeon® X5650 CPUs with a total of 12 physical cores. Gradient evaluation
within the interior-point algorithm [37] is computed in parallel to utilize all CPU cores. All cases converged to solutionswith a function value tolerance of 10−8. A summary of average computation time for single scalarized problems is given in
James T. Allison 14 MD-16-1636
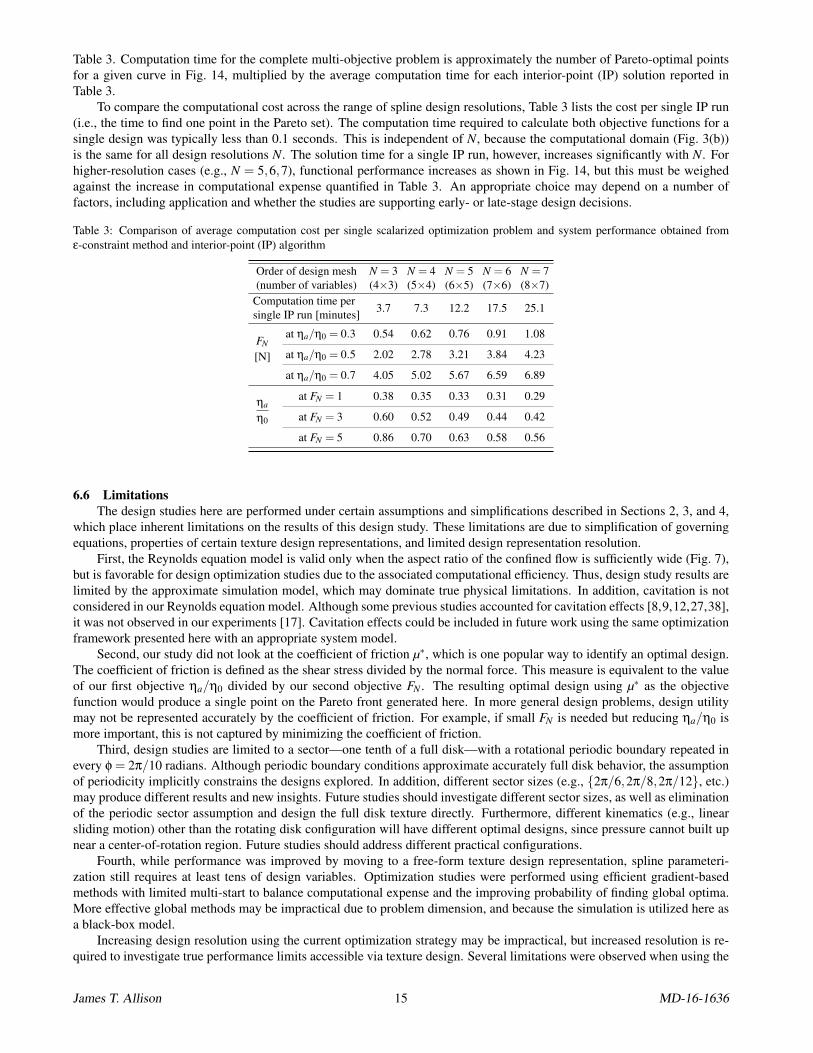
Table 3. Computation time for the complete multi-objective problem is approximately the number of Pareto-optimal pointsfor a given curve in Fig. 14, multiplied by the average computation time for each interior-point (IP) solution reported inTable 3.
To compare the computational cost across the range of spline design resolutions, Table 3 lists the cost per single IP run(i.e., the time to find one point in the Pareto set). The computation time required to calculate both objective functions for asingle design was typically less than 0.1 seconds. This is independent of N, because the computational domain (Fig. 3(b))is the same for all design resolutions N. The solution time for a single IP run, however, increases significantly with N. Forhigher-resolution cases (e.g., N = 5,6,7), functional performance increases as shown in Fig. 14, but this must be weighedagainst the increase in computational expense quantified in Table 3. An appropriate choice may depend on a number offactors, including application and whether the studies are supporting early- or late-stage design decisions.
Table 3: Comparison of average computation cost per single scalarized optimization problem and system performance obtained fromε-constraint method and interior-point (IP) algorithm
Order of design mesh(number of variables)
N = 3(4×3)
N = 4(5×4)
N = 5(6×5)
N = 6(7×6)
N = 7(8×7)
Computation time persingle IP run [minutes] 3.7 7.3 12.2 17.5 25.1
FN
[N]
at ηa/η0 = 0.3 0.54 0.62 0.76 0.91 1.08
at ηa/η0 = 0.5 2.02 2.78 3.21 3.84 4.23
at ηa/η0 = 0.7 4.05 5.02 5.67 6.59 6.89
ηa
η0
at FN = 1 0.38 0.35 0.33 0.31 0.29
at FN = 3 0.60 0.52 0.49 0.44 0.42
at FN = 5 0.86 0.70 0.63 0.58 0.56
6.6 LimitationsThe design studies here are performed under certain assumptions and simplifications described in Sections 2, 3, and 4,
which place inherent limitations on the results of this design study. These limitations are due to simplification of governingequations, properties of certain texture design representations, and limited design representation resolution.
First, the Reynolds equation model is valid only when the aspect ratio of the confined flow is sufficiently wide (Fig. 7),but is favorable for design optimization studies due to the associated computational efficiency. Thus, design study results arelimited by the approximate simulation model, which may dominate true physical limitations. In addition, cavitation is notconsidered in our Reynolds equation model. Although some previous studies accounted for cavitation effects [8,9,12,27,38],it was not observed in our experiments [17]. Cavitation effects could be included in future work using the same optimizationframework presented here with an appropriate system model.
Second, our study did not look at the coefficient of friction µ∗, which is one popular way to identify an optimal design.The coefficient of friction is defined as the shear stress divided by the normal force. This measure is equivalent to the valueof our first objective ηa/η0 divided by our second objective FN . The resulting optimal design using µ∗ as the objectivefunction would produce a single point on the Pareto front generated here. In more general design problems, design utilitymay not be represented accurately by the coefficient of friction. For example, if small FN is needed but reducing ηa/η0 ismore important, this is not captured by minimizing the coefficient of friction.
Third, design studies are limited to a sector—one tenth of a full disk—with a rotational periodic boundary repeated inevery φ = 2π/10 radians. Although periodic boundary conditions approximate accurately full disk behavior, the assumptionof periodicity implicitly constrains the designs explored. In addition, different sector sizes (e.g., 2π/6,2π/8,2π/12, etc.)may produce different results and new insights. Future studies should investigate different sector sizes, as well as eliminationof the periodic sector assumption and design the full disk texture directly. Furthermore, different kinematics (e.g., linearsliding motion) other than the rotating disk configuration will have different optimal designs, since pressure cannot built upnear a center-of-rotation region. Future studies should address different practical configurations.
Fourth, while performance was improved by moving to a free-form texture design representation, spline parameteri-zation still requires at least tens of design variables. Optimization studies were performed using efficient gradient-basedmethods with limited multi-start to balance computational expense and the improving probability of finding global optima.More effective global methods may be impractical due to problem dimension, and because the simulation is utilized here asa black-box model.
Increasing design resolution using the current optimization strategy may be impractical, but increased resolution is re-quired to investigate true performance limits accessible via texture design. Several limitations were observed when using the
James T. Allison 15 MD-16-1636
current low-dimension texture design representation, including generation of very sharp edges or sudden non-smooth slopechanges. Alternative optimization strategies that support higher-resolution design representation should be investigated. Onepossible strategy is to use design abstraction techniques, such as generative design algorithms [39], image warping meth-ods [40], or other surface representation techniques [41]. A direct optimization using the simulation mesh values hi j maybe another promising strategy, but practical solution will require novel large-scale optimization formulations that capitalizeon problem structure to manage the significantly increased problem dimension (e.g., thousands of optimization variables).Ongoing work is exploring the possibility of using convex programming techniques to support significant increases in designresolution while maintaining computational tractability (e.g., [42]).
7 CONCLUSIONFull-film lubrication problems have been studied extensively in the tribology community, often with the objective of
improving normal load capacity and decreasing shear load resistance. Using textured contact surfaces is known to be ef-fective for reducing frictional energy loss. More recently, an experimental study has revealed that asymmetric depth profiletexture patterns can improve performance further by generating net normal forces to carry higher loads [17]. Based on theseprevious discoveries pertaining to full-film lubrication, this article presented an investigation of how the transition to moresophisticated texture designs can improve performance in exceptional ways, and has offered insights into the underlyingmechanisms that enable these improvements. The studies presented here focused on simultaneous improvement of apparentviscosity and normal force.
Predefined texture shapes, such as cylindrical dimples, limit potential performance improvements that is achievable withmore general surface texture design. A general design pattern was clearly present among the Pareto-optimal results forthe asymmetric spline-based design study. The resulting designs resemble a spiral blade, and observations of the flow andpressure fields provide insight into the mechanisms leveraged by these designs to improve performance.
The ultimate objective of these and other related efforts is to realize new levels of performance and efficiency for fluidpower systems, and to reveal physical and design principles that support these improvements. Ongoing efforts complementthe results presented here, including development of new models and solution techniques that will enable computationally-efficient design of very high resolution texture geometries by capitalizing on problem structure. Next steps include inves-tigation of full-film lubrication problems in configurations that are more representative of practical engineering systems,investigating texture design representations based on generative algorithms, incorporating manufacturability and cost con-siderations, and transitioning from Newtonian to non-Newtonian fluid system models. For example, a linear sliding motioncan be another configuration to represent practical reciprocating contact surfaces [43]. Different targets for normal load orsliding speed may affect optimal solutions [44]. Optimization results have provided a rich set of design data from whichqualitative design insights can be extracted. Future work will iteratively deepen, validate, and enhance this qualitative un-derstanding, leading to valuable design knowledge that may impact technologies, such as bearing systems, reciprocatingmechanisms (e.g., automotive engines), energy systems, and fluid power systems.
8 ACKNOWLEDGEMENTSThis work was partially supported by the Engineering Research Center for Compact and Efficient Fluid Power (supported
by the National Science Foundation under Grant no. EEC-0540834) and also National Science Foundation Grant no. CMMI-1463203.
References[1] Lee, Y. H., Schuh, J. K., Ewoldt, R. H., and Allison, J. T., 2016. “Shape parameterization comparison for full-film
lubrication texture design”. In ASME 2016 International Design Engineering Technical Conferences and Computersand Information in Engineering Conference, no. DETC2016-60168, ASME.
[2] Wakuda, M., Yamauchi, Y., Kanzaki, S., and Yasuda, Y., 2003. “Effect of surface texturing on friction reductionbetween ceramic and steel materials under lubricated sliding contact”. Wear, 254(3–4), pp. 356–363.
[3] Etsion, I., 2004. “Improving tribological performance of mechanical components by laser surface texturing”. TribologyLetters, 17(4), pp. 733–737.
[4] Ramesh, A., Akram, W., Mishra, S. P., Cannon, A. H., Polycarpou, A. A., and King, W. P., 2013. “Friction characteris-tics of microtextured surfaces under mixed and hydrodynamic lubrication”. Tribology International, 57, pp. 170–176.
[5] Johnston, M. T., King, W. P., and Ewoldt, R. H., 2015. “Shear stress characteristics of microtextured surfaces ingap-controlled hydrodynamic lubrication”. Tribology International, 82, pp. 123–132.
[6] Rao, L. G., Schuh, J. K., Ewoldt, R. H., and Allison, J. T., 2015. “On using adaptive surrogate modeling in design forefficient fluid power”. In ASME 2015 International Design Engineering Technical Conferences and Computers andInformation in Engineering Conference, no. DETC2015-46832, ASME.
James T. Allison 16 MD-16-1636
[7] Yu, H., Wang, X., and Zhou, F., 2010. “Geometric shape effects of surface texture on the generation of hydrodynamicpressure between conformal contacting surfaces”. Tribology Letters, 37(2), pp. 123–130.
[8] Hsu, S. M., Jing, Y., Hua, D., and Zhang, H., 2014. “Friction reduction using discrete surface textures: principle anddesign”. Journal of Physics D: Applied Physics, 47(33), p. 335307 (12pp).
[9] Fesanghary, M., and Khonsari, M. M., 2013. “On the optimum groove shapes for load-carrying capacity enhancementin parallel flat surface bearings: theory and experiment”. Tribology International, 67, pp. 254–262.
[10] Shen, C., and Khonsari, M. M., 2013. “Effect of dimple’s internal structure on hydrodynamic lubrication”. TribologyLetters, 52(3), pp. 415–430.
[11] Kango, S., Singh, D., and Sharma, R. K., 2012. “Numerical investigation on the influence of surface texture on theperformance of hydrodynamic journal bearing”. Meccanica, 47(2), pp. 469–482.
[12] Dobrica, M. B., Fillon, M., Pascovici, M. D., and Cicone, T., 2010. “Optimizing surface texture for hydrodynamic lubri-cated contacts using a mass-conserving numerical approach”. Proceedings of the Institution of Mechanical Engineers,Part J: Journal of Engineering Tribology, 224(8), pp. 737–750.
[13] Nanbu, T., Ren, N., Yasuda, Y., Zhu, D., and Wang, Q. J., 2008. “Micro-textures in concentrated conformal-contactlubrication: effects of texture bottom shape and surface relative motion”. Tribology Letters, 29(3), pp. 241–252.
[14] Han, J., Fang, L., Sun, J., Wang, Y., Ge, S., and Zhu, H., 2011. “Hydrodynamic lubrication of surfaces with asymmetricmicrodimple”. Tribology Transactions, 54(4), pp. 607–615.
[15] Burton, R. A., 1963. “Effects of two-dimensional, sinusoidal roughness on the load support characteristics of a lubricantfilm”. Journal of Fluids Engineering, 85(2), pp. 258–262.
[16] Tzeng, S. T., and Saibel, E., 1967. “Surface roughness effect on slider bearing lubrication”. ASLE Transactions, 10(3),pp. 334–348.
[17] Schuh, J. K., and Ewoldt, R. H., 2016. “Asymmetric surface textures decrease friction with Newtonian fluids in fullfilm lubricated sliding contact”. Tribology International, 97, pp. 490–498.
[18] Lipson, H., 2012. “Frontiers in additive manufacturing”. Bridge, 42(1), pp. 5–12.[19] Hao, X., Pei, S., Wang, L., Xu, H., He, N., and Lu, B., 2015. “Microtexture fabrication on cylindrical metallic surfaces
and its application to a rotor-bearing system”. The International Journal of Advanced Manufacturing Technology,78(5), pp. 1021–1029.
[20] Arghir, M., Roucou, N., Helene, M., and Frene, J., 2003. “Theoretical Analysis of the Incompressible Laminar Flowin a Macro-Roughness Cell”. Journal of Tribology, 125(2), pp. 309–318.
[21] Stachowiak, G. W., and Batchelor, A. W., 1993. Engineering Tribology, 1 ed. Elsevier, Amsterdam.[22] Schuh, J. K., 2015. “Surface textures and non-Newtonian fluids for decreased friction in full film lubrication”. Master’s
thesis, University of Illinois at Urbana-Champaign, Urbana, IL.[23] Schuh, J. K., Lee, Y. H., Allison, J. T., and Ewoldt, R. H., 2017. “Design-Driven Modeling of Surface-Textured Full-
Film Lubricated Sliding: Validation and Rationale of Non-Standard Thrust Observations”. Tribology Letters, 65(2),p. 35 (17pp).
[24] Samareh, J. A., 2001. “Survey of shape parameterization techniques for high-fidelity multidisciplinary shape optimiza-tion”. AIAA Journal, 39(5), pp. 877–884.
[25] Zhang, D., and Lu, G., 2004. “Review of shape representation and description techniques”. Pattern Recognition, 37(1),pp. 1–19.
[26] Ganapati, V., Miller, O. D., and Yablonovitch, E., 2014. “Light trapping textures designed by electromagnetic opti-mization for sub-wavelength thick solar cells”. IEEE Journal of Photovoltaics, 4(1), pp. 175–182.
[27] Shen, C., and Khonsari, M. M., 2015. “Numerical optimization of texture shape for parallel surfaces under unidirec-tional and bidirectional sliding”. Tribology International, 82, pp. 1–11.
[28] Reynolds, O., 1886. “On the theory of lubrication and its application to Mr. Beauchamp Tower’s experiments, includingan experimental determination of the viscosity of olive oil”. Philosophical Transactions of the Royal Society of London,177, pp. 157–234.
[29] Heath, M. T., 2002. Scientific Computing: An Introductory Survey, 2 ed. McGraw-Hill.[30] Fornberg, B., 1996. A Practical Guide to Pseudospectral Methods. Cambridge University Press, Cambridge.[31] Sawaragi, Y., Nakayama, H., and Tanino, T., 1985. Theory of Multiobjective Optimization. Academic Press, Orlando,
FL.[32] Deb, K., 1999. “Multi-objective genetic algorithms: problem difficulties and construction of test problems”. Evolu-
tionary Computation, 7(3), pp. 205–230.[33] Ehrgott, M., 2005. Multicriteria Optimization. Springer-Verlag, Berlin/Heidelberg, Germany.[34] Haimes, Y. Y., Lasdon, L. S., and Wismer, D. A., 1971. “On a bicriterion formulation of the problems of integrated
system identification and system optimization”. IEEE Transactions on Systems, Man, and Cybernetics, SMC-1(3),pp. 296–297.
[35] Bauer, W., 2011. Hydropneumatic Suspension Systems. Springer, Heidelberg.[36] Macosko, C. W., 1994. Rheology: Principles, Measurements, and Applications. Wiley, New York, NY.
James T. Allison 17 MD-16-1636
[37] Forsgren, A., Gill, P. E., and Wright, M. H., 2002. “Interior methods for nonlinear optimization”. SIAM Review, 44(4),pp. 525–597.
[38] Qiu, Y., and Khonsari, M. M., 2009. “On the prediction of cavitation in dimples using a mass-conservative algorithm”.Journal of Tribology, 131(4), p. 041702 (11pp).
[39] Lohan, D. J., Dede, E. M., and Allison, J. T., 2016. “Topology optimization for heat conduction using generative designalgorithms”. Structural and Multidisciplinary Optimization, in press. doi: 10.1007/s00158-016-1563-6.
[40] Glasbey, C. A., and Mardia, K. V., 1998. “A review of image-warping methods”. Journal of Applied Statistics, 25(2),pp. 155–171.
[41] Alexander, M. J., Allison, J. T., and Papalambros, P. Y., 2011. “Reduced representations of vector-valued couplingvariables in decomposition-based design optimization”. Structural and Multidisciplinary Optimization, 44(3), pp. 379–391.
[42] Kanzow, C., Nagel, C., Kato, H., and Fukushima, M., 2005. “Successive linearization methods for nonlinear semidefi-nite programs”. Computational Optimization and Applications, 31(3), pp. 251–273.
[43] Ryk, G., Kligerman, Y., and Etsion, I., 2002. “Experimental investigation of laser surface texturing for reciprocatingautomotive components”. Tribology Transactions, 45(4), pp. 444–449.
[44] Takabi, J., and Khonsari, M. M., 2015. “On the dynamic performance of roller bearings operating under low rotationalspeeds with consideration of surface roughness”. Tribology International, 86, pp. 62–71.
James T. Allison 18 MD-16-1636
List of Figures
FIGURE 1 Textured surface design problem setup adapted from experiments conducted by Schuh and Ewoldt [17]. Theperiodic asymmetric dimpled textures used in the previous study are replaced here with arbitrary continuous texture shapes.(a) Front view of experimental setup, (b) top view of one textured surface periodic sector.
FIGURE 2 An example of texture height profile contours shown for a design domain sector (a) and for a full disk (b).Darker color corresponds to a lower surface level (larger gap height)
FIGURE 3 Mesh points for (a) design representation and (b) flow simulation. The mesh for a reduced-dimension cubicspline texture shape design representation is shown on the left. This design mesh is much more coarse than the mesh on theright that is required for accurate simulation. The surface geometry defined by the cubic spline is interpolated to determineall the height values at the fine mesh points required for simulation.
FIGURE 4 Alternative texture shape design representations. A cross-sectional view of each representation is shown in thetop row, while a top view of each textured sector is shown in the bottom row. The gray area denotes the textured region (non-gray regions indicate unchanged flat surfaces). The top flat plates are rotating in the direction of the thick blue arrows, whilethe bottom textured surfaces are fixed. (a) Symmetric cylindrical texture, (b) asymmetric cylindrical texture, (c) asymmetricplanar texture spanning full sector area, (d) arbitrary continuous texture with symmetry constraint, (e) arbitrary continuoustexture.
FIGURE 5 The ε-constraint method converts a multiobjective optimization problem to multiple single objective optimiza-tion problems. For each scalarized problem, one objective is minimized while satisfying bound constraints on the otherobjectives.
FIGURE 6 Objective function contours based on comprehensive sampling of the cylindrical texture design (symmetricand asymmetric textures). Trade-offs are apparent, and the Pareto sets are illustrated in the figures. Asymmetry improvesperformance capability, especially in terms of normal force.
FIGURE 7 Comparison of the Reynolds equation and the Navier-Stokes equation solutions in terms of the normalizedapparent viscosity for the symmetric cylindrical textures as a function of depth.
FIGURE 8 Geometry, shear stress, and pressure fields of optimized cylindrical texture designs in symmetric and asym-metric configurations. Symmetric texture Rt = 4 mm, h = 2.5 mm. Asymmetric texture Rt = 4 mm, β = 3.6°.
FIGURE 9 Geometry and pressure field for asymmetric cylindrical textures with various angles (β). Six β angles aresampled within the range of inclination limits. (a)-(f) are geometric texture profile level sets, and (g)-(l) are pressure fieldlevel sets of corresponding β angles.
FIGURE 10 Geometry, shear stress, and pressure field of the surface texture with inclined plane spanning full sector area.
FIGURE 11 Optimal designs for the cylindrical design exploration and the inclined plane spanning full sector area studies.The solid red stars in (a) is the Pareto set for the cylindrical texture identified from the contours of Figs. 6(c–d). In (b), thetwo objectives (blue: ηa/η0, green: FN) are plotted together as a function of β for the inclined plane design. The gray areaindicates the region of suboptimal designs.
FIGURE 12 Optimal texturing of an arbitrary but symmetric surface approaches a flat plate. Symmetric texturing is unableto produce normal force. The optimal solution maximizes the gap everywhere to decrease the viscous shear load.
FIGURE 13 Geometry and pressure field of optimized surface textures with spline design representation (spline resolutionN = 5). Asymmetry is permitted. Six designs are uniformly sampled from 27 designs in the Pareto set to illustrate trends.(a)-(f) are geometric texture profile level sets, and (g)-(l) are pressure field level sets. Note that these Pareto-optimal designsare located in Fig. 14 (blue squares).
FIGURE 14 Comparison of optimal designs in the objective function space for all design studies presented in this article.Performance indices are improved significantly by increasing design flexibility via the texture surface representation.
FIGURE 15 Comparison of geometric texture profile level sets of optimal designs for N =3, 4, 5, 6, 7 at FN = 3 N. As design
James T. Allison 19 MD-16-1636
resolution increases, the thickness of the blade-like feature becomes sharper, and a lower normalized apparent viscosity valuecan be achieved.
FIGURE 16 Comparison of depth profiles: cross-sectional view of optimal designs, spline design representation cases withN =3, 5, 7, and FN = 3 N. The horizontal axis indicates angular (θ) location within a sector, and vertical axes correspondto texture elevation. Each subfigure corresponds to a different spline N. Positive thrust occurs when the opposing upper flatsurface moves in the positive θ-direction.
List of Tables
TABLE 1 Cylindrical texture surface parameters
TABLE 2 Spline interpolated textured surface parameters
TABLE 3 Comparison of average computation cost per single scalarized optimization problem and system performanceobtained from ε-constraint method and interior-point (IP) algorithm
James T. Allison 20 MD-16-1636


![[Tech-lubrication]Lubrication Inst for BEVT S1501CII ... · Microsoft Word - [Tech-lubrication]Lubrication Inst for BEVT S1501CII_20130613R02.doc Author: EHickman Created Date: 11/7/2013](https://img.pdfslide.us/doc/110x75/5f063c3e7e708231d416f958/tech-lubricationlubrication-inst-for-bevt-s1501cii-microsoft-word-tech-lubricationlubrication.jpg)