Embed Size (px)
Citation preview
Enhancing Bioremediation of Saudi Desert Soils Polluted with Hydrocarbons
Ph. D. Thesis
By: Majdah M. Aburas Student no. 3256618
Supervisors: Dr. F.A.A.M. de Leij & Prof. J. M. Lynch
Faculty of Health and Medical Sciences University of Surrey~ Guildford
Surrey GU2 7XH
January 2010

The aim of this research was to device a (bio) remediation strategy for arid desert
soils that are polluted with crude oil through: selecting plants that can tolerate
petroleum oil and grow under arid conditions, inoculating plants with the fungus
T.harzianum T22 and optimizing environmental factors. Experiments were fIrst
carried out in temperature controlled glasshouses and laboratories, with optimized
systems then being trialled under fIeld conditions. Maize, wheat, acacia, alfalfa and
sunflower plants were tested. The most tolerant to crude oil contamination was
maize, which germinated at all concentrations. This could be because maize is a C4
plant which uses less water than C3 plants for metabolism. The number of
hydrocarbon degraders was higher in the rhizosphere of maize than in non
rhizosphere soil, suggesting that plant root exudates provide microorganisms capable
of degrading hydrocarbons with essential mineralization nutrients. Consequently,
planting maize in petroleum contaminated soil increased the mean degradation rate of
petroleum hydrocarbons by 35% during the first 4 weeks. Plants inoculated with
Trichoderma T22 grew better than non-inoculated plants with shoot and root dry
weights increasing by a mean average of 18% and 7% respectively. Even at high
concentrations of petroleum oil (100,000 andl50, 000 ppm), better plant growth was
obtained with inoculated plants. Besides optimizing biotic factors, abiotic factors
such as nutrient availability, moisture content and temperature also proved crucial for
enhancing the degradation of hydrocarbons in desert soils. Microbial respiration rates
were almost 50 times higher at 50% WHC of the soil compared to dry soil.
Maintaining temperatures between 25 and 35°C resulted in fast degradation of
hydrocarbons. Therefore, in outdoor trials, covering with white polyethylene not
only reduced moisture loss but also had a cooling effect.
In conclusion, hydrocarbon degradation in polluted desert soil can be enhanced
dramatically by optimizing both biological and abiotic parameters.
I

Acknowledgements
Praise be to the Almighty Allah, the Merciful and Beneficent, for the strength
and blessings attained throughout this study.
I wish in particular to express my greatest gratitude to my supervisor Dr. Frans
De-Leij, Lecturer at the School of Biomedical and Molecular Science, Surrey
University, the United Kingdom for his guidance, invaluable criticisms, suggestions and
great support while seeing this thesis through to its completion. I am also very much
indebted to my supervisor Prof. Jim Lynch at the same university for his valuable and
sincere help during this work.
I would like also to thank my advisor, Prof. Dr. Saleh Algarni, King Abdulaziz
University, Saudi Arabia for his keen supervision, valuable guidance and great advice
throughout the course of this investigation.
I am extremely grateful to King Abdulaziz University, which has financed my
study program. Exceptional mentions also go to Prof. Dr. Saleh Kabli, Prof. Dr. Fahad
Alfasi and Dr. Seif-Aldein Ayyad, the Faculty of Science and the staff of the King
Fahad Research Center for the encouragement and facilities offered during the course of
the work.
II

Dedication
I dedicate this work, with my heartfelt thanks, to the following: my sons, for being the
source of my inspiration; my parents, for their love and prayers, and my godfather,
sisters and brothers for the encouragement, understanding and immeasurable support
they offered throughout the period of my post graduate studies.
III

I...,is1.: of .A.bbrevia1.:ioIIs
C:lV1:C=
EPA=
GC/lV1S=
:lV1:PN=
NS=
(n=#)=
N.P.K=
PAHs=
PAJV1:=
TPHs=
V\TH:C=
Carboxy Methyl Cellulose
Environmental Protaction Agency
Gas Chromatography Mass Spectrometry
Most Probable Number
Non-Significant
n=#: Number (#) of Replicates
Nitro gen, Phosphorus, Potassium
Polyaromatic Hydrocarbons
Poly Acrylamide Membrane
Total Petroleum Hydrocarbons
Water Holding Capacity
IV

1.1
1.2
1.3
1.4
1.5
1.6
1.6.1
1.6.2
1.7
1.8
1.8.1
1.8.2
1.8.3
1.9
1.9.1
1.10
1.11
Table of ~o:nt:e:nt:
Co"-t:e"-t:
Abstract
List of Abbreviations
CIIAPTER ONE
General Introduction
Pollution of Saudi Arabian soil with crude oil
Chemistry and biodegradability of petroleum hydrocarbon
Environmental fate of petroleum
Factors influencing petroleum hydrocarbon biodegradation
Distribution of petroleum-utilizing microorganisms in the environment
Biological degradation of petroleum hydrocarbon
Bacterial degradation of oil
Fungal degradation
Enumeration of petroleum degrading microorganisms
Bioremediation: the use of living organism for the remediation of polluted sites
Intrinsic bioremediation (Natural attenuation)
Types of bioremediation
Bioavailability
The role of microbial communities in soil
Rhizoremediation
Role of hydrogels
Role of plastic covering
v
Page No.
V
IV
1
1-23
1
2
3
3-6
6
6
6-7
7-8
8-9
9-10
10
10-13
13-14
14
14-15
15-16
16

1.11.1
1.11.2
1.11.3
1.11.4
1.12
1.12.1
1.12.2
1.13
1.14
1.15
2.1
2.2
2.3
2.4
2.5
2.5.1
2.6
2.6.1
3.1
Effect of plastic cover on soil temperature 17
Effect of plastic cover on soil moisture 17
Effect of plastic cover on plant growth 17-18
Manipulating soil-plant-pathogen interactions 18
Phytoremediation of petroleum hydrocarbon 18-19
Mechanisms of phytoremediation 19
Plant - assisted hydrocarbon degradation 20
Phytotoxicity of hydrocarbons 20-21
Use of Trichoderma harzianum (T22) to degrade organic 21-22 hydrocarbons
Main Aims of this study 22-23
CIIAPTER TVVO 24
General Materials and Methods
Soil 24-25
Crude petroleum oil 26
Plants 26-27
Trichoderma harzianum (T22) 27
Laboratory experiments 27
Role of Trichoderma harzianum (T22) in bioremediation 27-30 of petroleum crude oil
Greenhouse experiments 30
Effect of petroleum crude oil contamination on maize 30-36 growth and soil microorganisms
CIIAPTER TIIREE 37
Selection of plants tolerant to crude oil
Introduction
VI
37-39

3.2 Materials and methods 39
3.2.1 Effect of crude oil on seed germination 39
3.2.2 Effect of petroleum crude oil on plants grown in 39 contaminated desert soil
3.2.2.1 Experimental design 39-40
3.3 Results 40
3.3.1 Effect of crude oil on seed germination 40-41
3.3.2 Effect of petroleum crude oil on plants grown in 41 contaminated desert soil
3.3.2.1 Maize 41-42
3.3.2.2 Sunflower 43
3.3.2.3 Acacia 44
3.3.2.4 Wheat 45
3.3.2.5 Alfalfa 46
3.4 Discussion 47
3.4.1 Effect of crude oil on seed germination 47-48
CFIAPTER FOUR 49
Effect of maize plants on the biodegradation of petroleum crude oil in polluted soi
4.1 Introduction 49-51
4.2 Materials and methods 51-52
4.3 Results 52
4.3.1 Germination, growth and plant biomass 52-53
4.3.2 Total bacterial counts in rhizosphere and non- 54 rhizosphere soil
4.3.3 Totall?etroleum hydrocarbon degraders in rhizosphere 55 and sod
4.3.4 Biodegradation of some petroleum hydrocarbons 56
VII

4.4
5.1
5.2
5.3
5.3.1
5.3.1.1
5.3.1.2
5.3.2
5.3.2.1
5-3-2-2
5.3.3
5.3.3.1
5.3.3.2
5.4
6.1
6.2
Discussion
CIIAPTER FIVE
Effect of Trichoderma harzianum,( strain T22 )on plant growth and hydrocarbon degradation in soil polluted
with petroleum crude oil
Introduction
Materials and Methods
Results
Maize
Effect of T.harzianum (T22) on maize growth in crude oil polluted soil
Effect of T.harzianum (T22) on bacterial and fungal populations in crude oil polluted soil
Sunflower
Effect of T.harzianum (T22) on sunflower growth in crude oil polluted soil
Effect of T.harzianum (T22) Bacterial and Fungal Populations in crude oil polluted soil
Acacia
Effect of T.harzianum (T22) on acacia growth in crude oil polluted soil
Effect of T.harzianum (T22) Bacterial and Fungal Populations in crude oil polluted soil
Discussion
CIIAPTER SIX
Effect of T.harzianum (strain T22 )inoculated maize plants on the degrading of petroleum crude oil in soil
Introduction
Materials and Methods
VIII
57-58
59
59
59-60
61
61
61-62
62
63
63-64
64-65
65
65-66
66
67-78
69
69-70
71-72
6.3 Results 72
6.3.1 Germination, growth and biomass 72-74
6.3.2 Total bacterial counts in rhizosphere and soil 74-76
6.3.3 Total petroleum hydrocarbon degraders 76-78
6.3.4 Biodegradation of some petroleum hydrocarbons 78-80
6.4 Discussion 80-81
CI-IAPTERSEVEN 82
Effect of water content, mineral nutrients and temperature on the degadation of hydrocarbons in soil
polluted wit petroleum crude oil
Laboratory experiments
7.1 Introduction 82-84
7.2 Materials and Methods 84
7.2.1 Effect of soil moisture contents on microbial 84-85 populations and CO2 production in non-polluted soil
7.2.2 Effect of soil moisture on microbial po{>ulations and 85 CO2 production of petroleum contamInated soil
7.2.3 Effect of soil moisture content levels on microbial 86 populations and CO2 production of petroleum contaminated soil amended with N .. K. fertilizers
7.2.4 Effect of soil temperature on microbial populations and 86 their activity in soils cntaminated withjetroleum hydrocarbons and amended with N.P. fertilizers
7.3 Results 87
7.3.1 Effect of soil moisture on microbial populations and 87 CO2 production in non-polluted soil
7.3.1.1 Bacterial Populations 87
7.3.1.2 Fungal Populations 88
7.3.1.3 Soil Respiration 88-89
7.3.2 Effect of soil moisture on microbial populations and 89
IX
7.3.2.1
7.3.2.2
7.3.2.3
7.3.3
7.3.3.1
7.3.3.2
7.3.3.3
7.3.4
7.3.4.1
7.3.4.2
7.4
8.1
8.2
8.3
8.3.1
8.3.2
8.3.3
8.3.4
CO2 production of petroleum contaminated soil
Bacterial Populations 89
Fungal Population 90
Soil Respiration 90-91
Effect of soil moisture content levels on microbial 91 populations and CO2 production of :petroleum contaminated soil amended with N .. K.fertilizers
Bacterial Populations 91
Fungal Populations 92
Soil Respiration 92-93
Effect of soil temperature on microbial populations and 93 their activity in soils contaminated with ~etroleum hydrocarbons and amended with N.P.K ertilizers
Bacterial Populations 93
Fungal Populations 94
Discussion 94-95
CIIAPTER EIGIIT 96
Ability of Trichoderma harzianum (strain T22) to degrade petroleum crude oil
Introduction
Materials and Methods
Results
Total bacterial counts in polluted soil inoculated with T.harzianum (T22)
Total hhdrocarbon de~raders in polluted soil inoculated with T. arzianum (T2 )
CO2 evolution from polluted soil inoculated with T.harzianum (T22)
Biodegradation of some petroleum hydrocarbons in polluted soil inoculated with T.harizianum (T22)
X
96
96-97
97
97
98
99
100
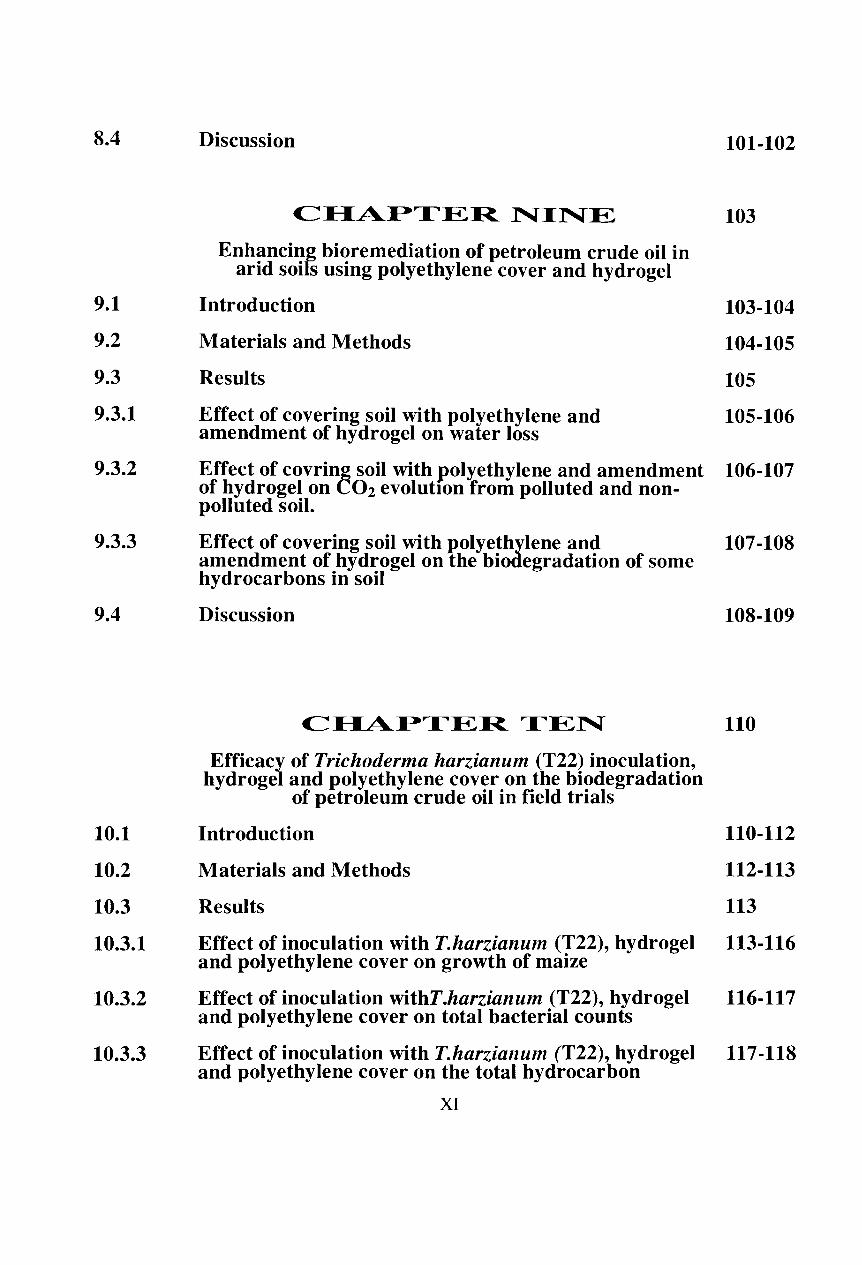
8.4
9.1
9.2
9.3
9.3.1
9.3.2
9.3.3
9.4
10.1
10.2
10.3
10.3.1
10.3.2
10.3.3
Discussion
CIIAPTER NINE
Enhancinrs bioremediation of petroleum crude oil in arid soi s using polyethylene cover and hydrogel
Introduction
Materials and Methods
Results
Effect of covering soil with polyethylene and amendment of hydrogel on water loss
Effect of covrine soil with polyethylene and amendment of hydrogel on O2 evolutIon from polluted and non-polluted soil.
Effect of covering soil with polyeth~lene and amendment of hydrogel on the bio egradation of some hydrocarbons in soil
Discussion
CIIAPTER TEN
Efficacy of Trichoderma harzianum (T22) inoculation, hydrogel and polyethylene cover on the biodegradation
of petroleum crude oil in field trials
Introduction
Materials and Methods
Results
Effect of inoculation with T.harzianum (T22), hydrogel and polyethylene cover on growth of maize
Effect of inoculation withT.harzianum (T22), hydrogel and polyethylene cover on total bacterial counts
Effect of inoculation with T.harzianum (T22), hydrogel and polyethylene cover on the total hydrocarbon
XI
101-102
103
103-104
104-105
105
105-106
106-107
107-108
108-109
110
110-112
112-113
113
113-116
116-117
117-118

10.3.4
10.3.5
10.4
11.1
11.2
11.3
11.4
degraders
Effect of inoculation with T.harizanum (T22), hydrogel 118-119 and polyethylene cover on the CO2 evolution
Effect of inoculation with T.harzianum (T22), hydrogel 119-120 and polyethylene cover on the biodegradation of some petroleum hydrocarbons in field soil
Discussion 120-122
CI-IAPTER ELEVEN 123
General Discussion 123-125
The role of (T22) and rlant interaction in remediation 125-128 of petroleum crude oi
Bioremediation of petroleum polluted soil by using 128 polyethylene cover and hydrogel
Effect of T.harzianum T22 inoculation, hydrogel and 128-129 polyethy'lene cover on the biodegradation of petroleum crude 011 in soil
Future work 129-130
REFERENCES 131-149
XII

I-is"t of Tables
Table Page No.
Table 1: Some physicochemical characteristics of the used soil prior to 24-remediation and cultivation. The soil represents the upper 25cm layer of a soil taken from the eastern part of J eddah City, Saudi Arabia.
Table 2: Major physical and chemical properties of petroleum crude oil taken 26 from Saudi Aramco Jeddah refinery, Saudi Arabia.
Table 3: Average percentage of seed germination of maize, sunflower, wheat, 40 acacia and alfalfa seeds placed on wet filter paper amended with different amounts of crude petroleum oil. Seeds were incubated for 20 days at 30o±2°C. For each treatment four Petri-dishes each containing 10 seeds were used (n=4).
Table 4: Growth parameters of maize grown in sandy soil applied with 42 different concentrations of crude petroleum oil 7 weeks from sowing. Each pot was sown with 10 maize seeds and placed in a thermostatically controlled greenhouse at 30o±2°C (n=4).
Table 5: Growth parameter of sunflower plants grown in sandy soil 43 contaminated with different concentrations of crude petroleum oil 7 weeks after sowing. Each pot was sown with 10 sunflower seeds and placed in a thermostatically controlled greenhouse at 30o±2°C (n=4).
Table 6: Growth parameters of acacia plants grown in sandy soil amended 44 with different concentrations of crude petroleum oil, 7 weeks after sowing. Each pot was sown with 10 acacia seeds and were placed in a thermostatically controlled greenhouse at 30o±2°C (n=4).
Table 7: Growth parameters of wheat plants grown in sandy soil contaminated 45 with different concentrations of crude petroleum oil, 7 weeks after sowing. Each pot was sown with 10 wheat seeds and placed in a thermostatically controlled greenhouse at 30o±2°C (n=4).
Table 8: Growth parameters of alfalfa plants grown in sandy soil 46 contaminated with different concentrations of crude petroleum oil, 7 weeks after sowing. Each pot was sown with 10 alfalfa seeds and placed in a thermostatically controlled greenhouse at 30o±2°C (n=4).
Table 9: Growth parameters of maize plants grown in sandy soil polluted with 52-53 petroleum crude oil at 75g/kg soil for 8 weeks in greenhouse at 30o±2°C (n=4).
Table 10: Total bacterial counts (Log cfulg dry soil) in rhiwsphere and bulk 54 soil of maize plants grown in soil polluted with petroleum crude oil at 75g/kg soil. Plants were grown for 8 weeks in greenhouse at 30o±2°C. Microbial
XIII
populations were measured by dilution plating on soil extract agar (n=4).
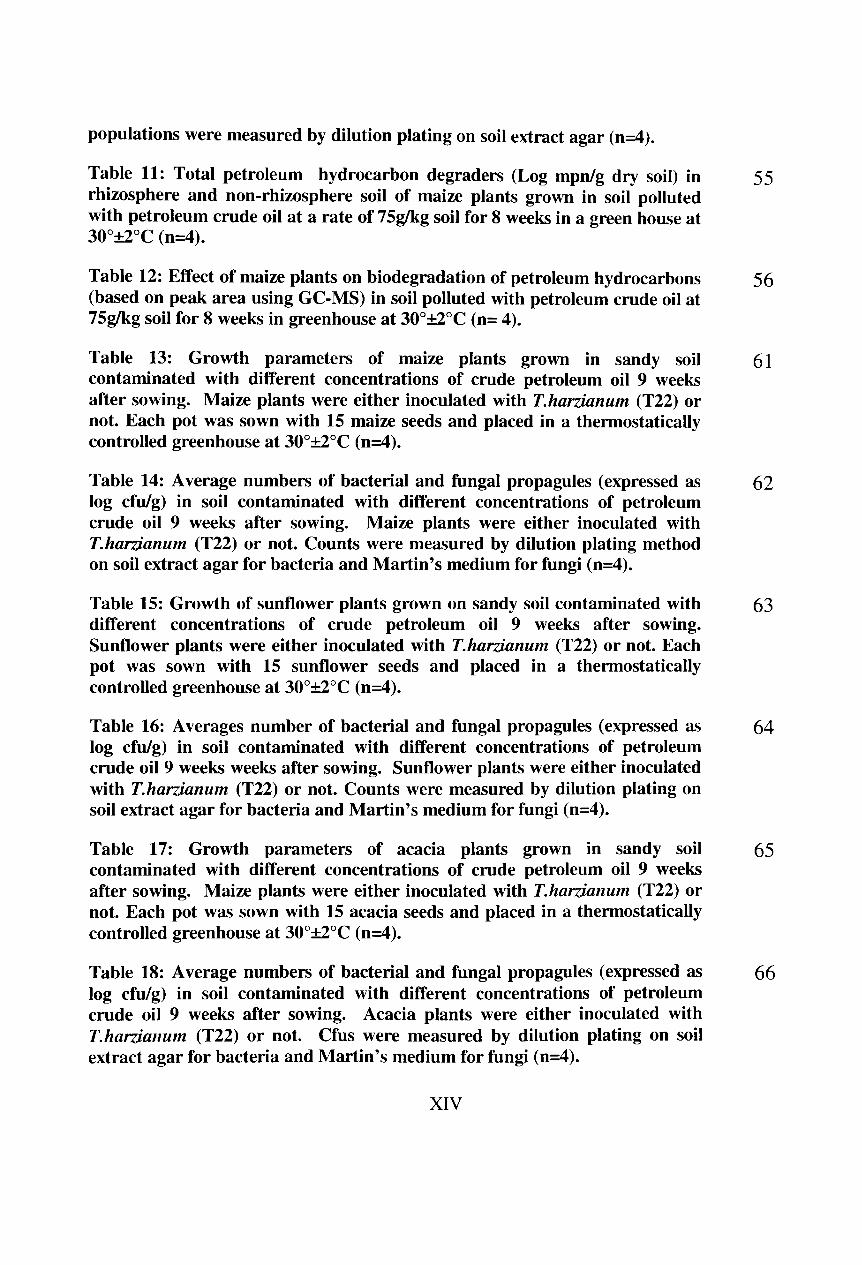
Table 11: Total petroleum hydrocarbon degraders (Log mpn/g dry soil) in 55 rhizosphere and non-rhizosphere soil of maize plants grown in soil polluted with petroleum crude oil at a rate of 75g!kg soil for 8 weeks in a green house at 30o±2°C (n=4).
Table 12: Effect of maize plants on biodegradation of petroleum hydrocarbons 56 (based on peak area using GC-MS) in soil polluted with petroleum crude oil at 75g!kg soil for 8 weeks in greenhouse at 30o±2°C (n= 4).
Table 13: Growth parameters of maize plants grown in sandy soil 61 contaminated with different concentrations of crude petroleum oil 9 weeks after sowing. Maize plants were either inoculated with T.har'lianum (T22) or not. Each pot was sown with 15 maize seeds and placed in a thermostatically controlled greenhouse at 30o±2°C (n=4).
Table 14: Average numbers of bacterial and fungal propagules (expressed as 62 log cfulg) in soil contaminated with different concentrations of petroleum crude oil 9 weeks after sowing. Maize plants were either inoculated with T.harVanum (T22) or not. Counts were measured by dilution plating method on soil extract agar for bacteria and Martin's medium for fungi (n=4).
Table 15: Growth of sunflower plants grown on sandy soil contaminated with 63 different concentrations of crude petroleum oil 9 weeks after sowing. Sunflower plants were either inoculated with T.har:danum (T22) or not. Each pot was sown with 15 sunflower seeds and placed in a thermostatically controlled greenhouse at 30o±2°C (n=4).
Table 16: Averages number of bacterial and fungal propagules (expressed as 64 log cfulg) in soil contaminated with different concentrations of petroleum crude oil 9 weeks weeks after sowing. Sunflower plants were either inoculated with T.harzianum (T22) or not. Counts were measured by dilution plating on soil extract agar for bacteria and Martin's medium for fungi (n=4).
Table 17: Growth parameters of acacia plants grown in sandy soil 65 contaminated with different concentrations of crude petroleum oil 9 weeks after sowing. Maize plants were either inoculated with T.harzianum (T22) or not. Each pot was sown with 15 acacia seeds and placed in a thermostatically controlled greenhouse at 30o±2°C (n=4).
Table 18: Average numbers of bacterial and fungal propagules (expressed as 66 log cfulg) in soil contaminated with different concentrations of petroleum crude oil 9 weeks after sowing. Acacia plants were either inoculated with T.har:dallum (T22) or not. Cfus were measured by dilution plating on soil extract agar for bacteria and Martin's medium for fungi (n=4).
XIV

Table 19: Physical and chemical properties of the soil taken from the upper 25 71 cm layer of Wadi Fatma region, eastern part of Jeddah, Saudi Arabia.
Table 20: Effect of inoculation with Trichoderma harzianum (T22) as a seed 73 treatment on some growth parameters of maize plants grown in soil polluted with petroleum crude oil at (75g/kg soil), for 8 weeks in greenhouse at 30o±2°C (n=4).
Table 21 : Effect of inoculation with Trichoderma harzianum (T22), as seed 75 and soil treatments, on the total bacterial counts (Log cfulg dry soil) in rhizosphere and soil polluted with petroleum crude oil at (75g1kg soil). Plants were grown for 8 weeks in a greenhouse at 30o±2°C. Counts were measured by dilution plating method on soil extract agar (n=4).
Table 22: Effect of inoculation with Trichoderma harzianum (T22), on the 77 number of petroleum hydrocarbon degrades (Log mpn/g dry soil) in rhizosphere and soil polluted with petroleum crude oil at a rate of 75g!kg soil. Plants were grown for 8 weeks in a greenhouse at a temperature of 30o±2°C (n=4).
Table 23: Effect of inoculation with Trichoderma harzianum (T22) on the 79 biodegradation of petroleum hydrocarbons Data presented are based on standard peak area in soil polluted with petroleum crude oil at a rate of 75g!kg (n=4).
Table 24: Effect of soil moisture contents on the average number of bacterial 87 propagules per gram of soil dry weight (expressed as log cfulg soil) over a period of 4 weeks after initial wetting. Counts were measured by dilution plating on soil extract agar medium for bacteria (n=4).
Table 25: Effect of soil moisture content on the average number of fungal 88 propagules per gram of soil dry weight (expressed as log cfulg soil) over a period of 4 weeks after initial wetting. Counts were measured by dilution plating on modified Martin's medium (n=4).
Table 26: Estimated soil respiration rate (C02 mg/h/l00g soil) at 4 different 88 moisture contents. Soils were incubated for 4 weeks at 30o±2°C (n=4).
Table 27: Average number of bacterial propagules per gram of soil (expressed 89 as log.cfulg soil) contaminated with petroleum oil (200g/800g sand soil) in soils with different concentrations of soil moisture during four weeks incubation at 30o±2°C. Counts were measured by dilution plating method on soil extract agar medium (n=4).
Table 28. Average number of fungal propagules per gram of soil dry weight 90 (expressed as log cfulg soil) contaminated with petroleum oil (200g/800g sand
xv

soil) at different soil moisture contents during a four weeks incubation periods at 30o±2°C. Cfus were measured by dilution plating on modified Martin's medium (n=4).
Table 29: Estimation of soil respiration rate (COzlh/l00g soil) in soil 90 contaminated with petroleum oil at a rate of 200g crude oiV800g soil (w/w). Soils were held at different moisture contents. Respiration was estimated during 4 weeks at 30o±2°C (n=4).
Table 30: A verage numbers of bacterial propagules per g/soil dry weight 91 (expressed as log.cfulg of soil) contaminated with petroleum oil (200g/800g soil, w/w) amended with N.P.K. fertilizer. Soils were maintained at different soil moisture contents during a 4 week incubation period at 30o ±20 C. Counts were measured by dilution plating method on soil extract agar medium (n=4).
Table 31: Average numbers of fungal propagules per g/soil dry weight 92 (expressed as log.cfulg of soil) contaminated with petroleum crude oil (200g crude oiV800g soil, w/w) amended with N.P.K. fertilizer. Soil was maintained at different concentrations of soil moisture during a 4 weeks incubation period at 30o±2°C. Counts were measured by dilution plating method on modified Martin's medium (n=4).
Table 32: Estimation of soil respiration rate (ml COzlh/l00g soil) in soil 92 contaminated with petroleum oil at a rate of 200g/800g soil (w/w) and amended with N.P.K. Soils were held at different moisture contents. Respiration was estimated during 4 weeks and the soil was incubated at 30o±2°C (n=4).
Table 33: Average numbers of bacterial cfus per gram of soil dry weight 93 (expressed as log.cfulg of soil) contaminated with petroleum oil at a rate of 200g/800g soil (w/w) amended with N.P.K. fertilizers and incubated at different temperatures during 4 weeks. Counts were measured by dilution plating method on soil extract agar medium (n=4).
Table 34: Average numbers of fungal propagules per gram of soil dry weight 94 (expressed as log cfulg of soil), contaminated with petroleum oil at a rate of 200g/800g soil (w/w) amended with N.P.K. fertilizers and incubated at different temperatures during 4 weeks. Counts were measured by dilution plating method on modified Martin's medium (n=4).
Table 35: Average number of total bacteria (log cfulg dry soil) in soil polluted 97 with petroleum crude oil at a rate of 200g/800g soil and inoculated with a spore suspension of Trichoderma harzianum at a rate of 19/ kg soil. The soil was incubated for 4 weeks at 30o±2°C, addition of N.K.P and 60% water holding capacity of the soil in laboratory. Populations were quantified using dilution plating onto soil extract medium (n=4).
XVI
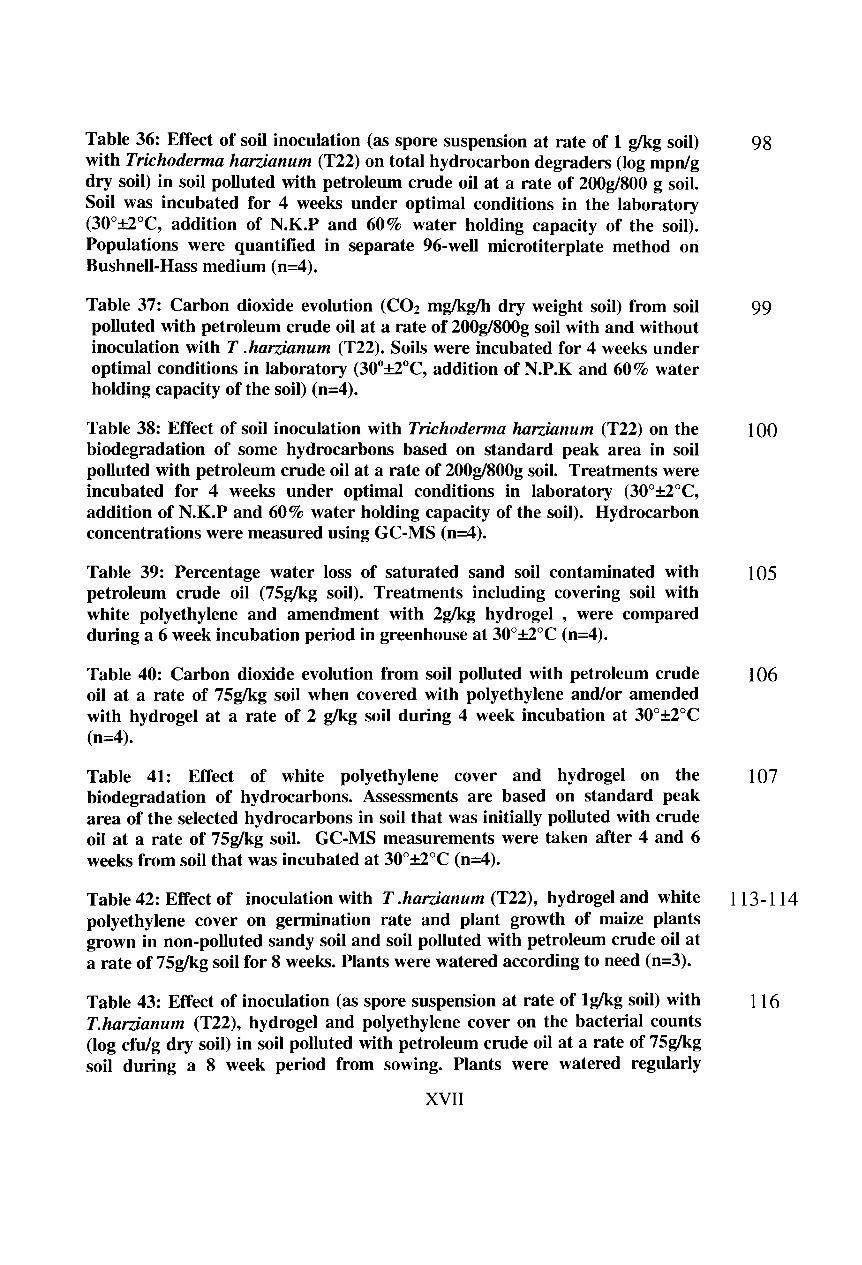
Table 36: Effect of soil inoculation (as spore suspension at rate of 1 g/kg soil) 98 with Trichoderma harzianum (T22) on total hydrocarbon degraders (log mpn/g dry soil) in soil polluted with petroleum crude oil at a rate of 200g/800 g soil. Soil was incubated for 4 weeks under optimal conditions in the laboratory (30 0 ±2°C, addition of N.K.P and 60% water holding capacity of the soil). Populations were quantified in separate 96-well microtiterplate method on Bushnell-Hass medium (n=4).
Table 37: Carbon dioxide evolution (C02 mglkg/h dry weight soil) from soil 99 polluted with petroleum crude oil at a rate of 200g/800g soil with and without inoculation with T .harzi,anum (T22). Soils were incubated for 4 weeks under optimal conditions in laboratory (300 ±2°C, addition of N.P.K and 60% water holding capacity of the soil) (n=4).
Table 38: Effect of soil inoculation with Trichoderma harzianum (T22) on the 100 biodegradation of some hydrocarbons based on standard peak area in soil polluted with petroleum crude oil at a rate of 200g/800g soil. Treatments were incubated for 4 weeks under optimal conditions in laboratory (300 ±2°C, addition of N.K.P and 60% water holding capacity of the soil). Hydrocarbon concentrations were measured using GC-MS (n=4).
Table 39: Percentage water loss of saturated sand soil contaminated with 105 petroleum crude oil (7Sglkg soil). Treatments including covering soil with white polyethylene and amendment with 2g1kg hydrogel , were compared during a 6 week incubation period in greenhouse at 30o ±2°C (n=4).
Table 40: Carbon dioxide evolution from soil polluted with petroleum crude 106 oil at a rate of 7Sglkg soil when covered with polyethylene and/or amended with hydrogel at a rate of 2 glkg soil during 4 week incubation at 30o±2°C (n=4).
Table 41: Effect of white polyethylene cover and hydrogel on the 107 biodegradation of hydrocarbons. Assessments are based on standard peak area of the selected hydrocarbons in soil that was initially polluted with crude oil at a rate of 7Sglkg soil. GC-MS measurements were taken after 4 and 6 weeks from soil that was incubated at 30o±2°C (n=4).
Table 42: Effect of inoculation with T .harzianum (T22), hydrogel and white 113-114 polyethylene cover on germination rate and plant growth of maize plants grown in non-polluted sandy soil and soil polluted with petroleum crude oil at a rate of 7Sglkg soil for 8 weeks. Plants were watered according to need (n=3).
Table 43: Effect of inoculation (as spore suspension at rate of Ig1kg soil) with 116 T.harzianum (T22), hydrogel and polyethylene cover on the bacterial counts (log cfu/g dry soil) in soil polluted with petroleum crude oil at a rate of 7Sglkg soil during a 8 week period from sowing. Plants were watered regularly
XVII

according to need. Microbial populations were enumerated by dilution plating on soil extract agar incubated at 30o±2°C (n=3).
Table 44: Effect of inoculation (as spore suspension at rate of 19lkg soil) with 117 T .harzianum (T22), hydrogel and cover with white polyethylene on the total number of hydrocarbons degraders (log mpn/g dry soil) of soil poUuted with petroleum crude oil at a rate of 75g1kg soil. Populations were monitored over an 8 week period after sowing. Plants were watered regularly according to need. Counts were measured in separate 96-weU micro-titerplate method on Bushnell-Hass medium incubated for 2 weeks at 30o±2°C (n=3).
Table 45: Effect of inoculation (as spore suspension at rate of 19lkg soil) with 118 T.harzianum (T22), hydrogel and covering with white polyethylene on carbon dioxide evolution from non-poUuted soil and soil polluted with petroleum crude oil at a rate of 75g1kg soil. CO2 evolution was monitored over an 8 week period (n=3).
Table 46: Effect of inoculation (as spore suspension at rate of 19lkg soil) with 119 T.harzianum (T22), hydrogel and covered with white polyethylene on the biodegradation of some hydrocarbons in soil poUuted with petroleum crude oil at a rate of 75g1kg soil. Hydrocarbons were monitored 4, 6 and 8 weeks after sowing using GC/MS (n=3).
XVIII

In. "trod u.c"tion.
Petroleum crude oil is extracted world-wide. The world increased its daily oil
consumption from 63 million barrels (Mbbl) in 1980 to 85 million barrels per day in
2006. World demand for oil is projected to increase 37% over 2006 levels by2030 (118
million barrels per day) which consequently meets the bulk of the world energy
requirements. If it is accidentally discharged into the environment, it can cause severe
and lasting damage. Saudi Arabia is increasing its production and oil is shipped all over
the world through pipelines and via tankers. As shipping traffic becomes congested, the
odds of spillage and accidents put the environment at great risk.
Extensive petroleum hydrocarbon exploration activities often result in the
pollution of the environment which could lead to disastrous consequences for the biotic
components of the ecosystem if not restored. Remediation of petroleum-contaminated
systems could be achieved by either physicochemical or biological methods (Okoh,
2006).
Although conventional methods such as physical removal are the first response
option, they rarely achieve complete cleanup of oil spills (Zhu et ai., 2001). According
to the Office of Technology Assessment (OT A, 1990) current mechanical methods
typically recover no more than 10-15 percent of the oil after a major spill. As a
consequence, bioremediation has emerged as one of the most promising secondary
treatment options for oil removal (Bragg et aI., 1994; Prince et aI., 1994).
1.1 Pollution of Saudi Arabian soil with crude oil
The Persian Gulf War brought about some of the worst environmental pollution
caused by humans. The first and most visible effect was related to the damage caused
by oil well fires in terms of air pollution as well as potential damage to the petroleum
reservoirs. The second detrimental effect was caused by the oil spill in the Gulf water
(El. Baz, 1992). During the second Gulf war, about 700km of the Arabian Gulf western
coast became polluted with crude oil (Sorkhon et al .. 1995; Hashem. 1996).
- 1 -

1.2 Chemistry and biodegradability of petroleum hydrocarbon
Petroleum has been known for several years to occur in surface soils and oil
seepage and was fIrst obtained in Pre-Christian times by the Chinese. The modern
petroleum industry had its beginning in Romania, and oil was also recovered from a
well, sunk in Pennsylvania by Colonel Drake in 1859 (Alloway and Ayres, 1993). The
principal early use of the products of the petroleum industry was for the replacement of
expensive whale oil for lighting. Today, its consumption as a fuel and its dominance in
the world market as a source of chemicals has increased tremendously.
Petroleum is defmed as any mixture of natural gas, condensate, and crude oil.
Crude oil is a heterogeneous liquid consisting of hydrocarbons comprised almost
entirely of the elements hydrogen and carbon in the ratio of about 2 hydrogen atoms to 1
carbon atom. It also contains elements such as nitrogen, sulfur and oxygen, all of which
constitute less than 3% of the molecular weight of the hydrocarbons. There are also
trace constituents associated with crude oil, comprising less than 1% (w/w), including
phosphorus and heavy metals such as vanadium and nickel.
Crude oils could be classifIed according to their distillation residues as paraffIn,
naphtha or aromatics (Manani, 2002), and based on the relative proportions of the heavy
molecular weight constituents are classifIed as light, medium or heavy oils. Also, the
composition of crude oil may vary with location and age of an oil field, and may even
be depth dependent within an individual well. About 85 % of the components of all
types of crude oil can be classified as either asphalt base, paraffIn base or mixed base
(Bland and Davidson, 1967; Atlas, 1981).
Among the main other materials usually present in crude oil are small amounts of
sulfur, nitrogen and oxygen in the form of hydrocarbon derivatives (Schabert, 1990).
Since, petroleum is not a homogenous mixture, its behaviour in the environment (e.g.,
volatalization, dissolution and adsorption) will not be determined by the ideal behaviour
of each hydrocarbon components of the product, but by the properties of the mixture
(Ismail, 2000).
The composition and properties of various petroleum hydrocarbons have been
described in detail by Clark and Brown (1977). Large oil databases also exist such as
the one posted on the internet by Environmental Canada (l'vH'w.etcenttre.orglspills).
- 2 -

1.3 Environmental fate of petroleum
Many authors have studied the relationship between soil properties and petroleum
behaviour. Crude oil spilled on soil is subjected to volatilization with the range of loss
being between 0.1 % (Francke and Clark, 1974) to nearly 40% (McGill et al., 198 I).
Pichtel and Liskanen (2001) reported that over a period of ISO days approximately
10.6% of diesel range organics were lost by volatilization.
1.4 Factors influencing petroleum hydrocarbon biodegradation
Successful application of bioremediation technology to contaminated systems
requires knowledge of the characteristics of the sites and the parameters that affect the
microbial degradation of pollutants (Sabate et at., 2004). However, a number of limiting
factors have been recognized that affect the biodegradation of petroleum hydrocarbons.
Typical examples of these factors can be summarized as follows: petroleum
hydrocarbon composition (structure, amount and toxicity), physical state (Aggregation,
spreading, dispersion and adsorption, weathering, evaporation and photooxidation),
water potential of the environment (osmotic and matrix forces and exclusion of water
from hydrophobic aggregates), temperature (evaporation and degradation rates),
presence of oxidants (02 required to initiate oxidation, and N03 or S04 to sustain
hydrocarbon biodegradation), availability of mineral nutrients (N, P, Fe may be
limiting), and presence of microorganisms capable of metabolizing the different
hydrocarbons (Bartha, 1986 and Okoh, 2006).
Biodegradability is inherently influenced by the composition of the pollutant. For
example kerosene, which consists almost exclusively of medium chain alkenes under
suitable conditions, is totally biodegradable. Similarly, crude oil is biodegradable, but
for heavy asphaltic-naphthenic crude oils only about I lo/c may be biodegradable within
a reasonable time period, even if the conditions are favorable (Bartha, 1986; Okoh et al.,
2002; Ghazali et ai., 2004). Okoh (2002) reported that heavier crude oils are generally
much more difficult to biodegrade than lighter ones. In another report (Rahman et aI.,
2002), the percentage of degradation by a mixed bacterial consortium decreased from
78% to 52% as the concentration of crude oil was increased from I to 10% in soil.
- 3 -

There are many reports on the effect of sunlight radiation on hydrocarbon
degradation which focuses on the physicochemical changes that occur in crude oil upon
exposure to sunlight (Jacquot et al., 1996 ; Nicodem et al., 1998). Recent studies have
reported that photooxidation increases the biodegradability of petroleum by
hydrocarbon degrading organisms by increasing its bioavailability and thus enhancing
microbial activities (Maki et al., 2005).
Temperature plays a very important role in the biodegradation of petroleum
hydrocarbons, firstly by its direct effect on the chemistry of the pollutants, and secondly
by affecting the physiology and diversity of the microbial milieu (Okoh, 2006).
Ambient temperature of an environment affects both the properties of spilled oil and the
activity or population of microorganisms (Venosa and Zhu, 2003). Temperature also
affects the solubility of hydrocarbons (Foght et al., 1996). Although hydrocarbon
biodegradation can occur over a wide range of temperatures, the rate of biodegradation
generally decreases with decreasing temperature (Bossert and Bartha, 1984 ; Cooney,
1984). Full scale in-situ remediation of petroleum contaminated soils has not yet been
used in Antarctica for example, partly because it has long been assumed that air and soil
temperatures are too low for effective biodegradation (Delille et al., 2004). Exxon
Valdez spill in Alaska, used differrent types of fertilizers (hydrophilic, oleophilic and
slow release) were applied to contaminated sections of shoreline. The oleophilic and
slow release fertilizers led to an increase of petroleum degradation on beach surfaces,
yielding close to 90% reduction of total resolvable hydrocarbons after 120 days. This
was probably due to the restricted movement of fertilizers into interstitial water and low
oxygen availability associated with the finer beach sediments ( Atlas, 1995).
Aerobic conditions are generally considered necessary for extensive degradation
of oil hydrocarbons, since major pathways for the degradation of both saturated and
aromatic hydrocarbons involve oxygenation (Atlas, 1981; Cerniglia, 1992). Microbial
utilization of hydrocarbons requires therefore an electron acceptor. In the initial attack,
this electron acceptor has to be molecular oxygen. In the subsequent steps too, oxygen is
the most common electron acceptor. In the absence of molecular oxygen. further
biodegradation of partially oxygenated intermediates may be supported by nitrate or
sulfate reduction (Okoh, 2006). In aerobic metabolism, oxygen is the terminal electron
acceptor. The reaction creates both carbon dioxide (carbon is oxidized) and water
-4-

(oxygen is reduced). When something other than oxygen is the terminal electron
acceptor, the reaction is called anaerobic. In general, aerobic degradation proceeds at a
faster rate than does anaerobic degradation (Roberts, 1998).
Nutrients are very important ingredients for successful biodegradation of
hydrocarbon pollutants, especially, nitrogen, phosphorus and in some cases iron
(Cooney, 1984). Depending on the nature of the impacted environment, some of these
nutrients could become limiting thus affecting the biodegradation processes. Hence, the
addition of nutrients is often necessary to enhance the biodegradation of oil pollutants
(Choi et ai., 2002; Kim et ai., 2005). Pelletier et ai. (2004) assessed the effectiveness of
fertilizers for enhancing crude oil bioremediation in sub-Antarctic intertidal sediments
over one year and observed that degradation of oil improved significantly as determined
using chemical, microbial and toxicological parameters.
In another study using poultry manure as organic fertilizer in contaminated soil,
biodegradation was reported to be enhanced in the presence of poultry manure alone,
but the extent of the biodegradation was influenced by the incorporation of alternative
carbon substrates and surfactants (Okolo et ai., 2005). However, high nutrient
concentrations can inhibit biodegradation activity. Chaillan et ai. (2006) and several
others have reported the negative effect of high N.P.K levels on the biodegradation of
hydrocarbons (Oudot et ai., 1998 ; Chaineau et ai., 2005) and more especially on
aromatic hydrocarbon degradation (Carmichael and Pfaender, 1997).
Various species of bacteria have been observed to develop different strategies to
deal with water insoluble substrates, such as hydrocarbons (Rosenberg, 1991). Hence, to
facilitate hydrocarbon uptake through the hydrophilic outer membrane many oil
utilizing microorganisms produce cell wall-associated or extra-cellular surface active
agents (Haferburg et ai., 1986). This includes low molecular weight compounds such as
fatty acids, triacylglycerols and phospholipids, as well as the heavier glycolipids,
examples of which include emulsan and liposan (Cirigliano and Carman, 1984; Karanth
et ai., 2007).
It is clear that the introduction of external non-ionic surfactants, e.g., the mam
components of oil spill dispersants, will influence the oil degradation rate (Bruheim and
Eimhijelle, 1998; Rahman et al., 2003). Experience so far indicates that the use of
surfactants in situations of oil contamination may have a stimulatory. inhibitory or
- 5 -

neutral effect on the bacterial degradation of the oil components (Liu et al., 1995). In
general, hydrophobic pollutants present in soil and water environments requITe
solubilization before being degraded by microbial cells (Karanth et aL 2007).
1.5 Distribution of petroleum-utilizing microorganisms in the
environment
Hydrocarbon-degrading bacteria and fungi are widely distributed in manne,
freshwater and soil habitats. Similarly, hydrocarbon-degrading cyanobacteria have been
reported to be wide-spread in many habitats (Chaillan et al., 2004; Lliros et al., 2003).
Typical bacterial groups already known for their capacity to degrade hydrocarbons
include Pseudomonas, Marinobacter, Alcanivorax, Microbulifer, Micrococcus,
Cellulomonas, Dietzia and Gordonia groups (Brito et al., 2006).
Molds belonging to the genera Aspergillus, Penicillium Fusarium, Amorphoteca,
Neosartoria, Paecilomyces, Talaromyces, Graphium and the yeasts (Candida, Yarrowia
and Pichia) have been implicated in hydrocarbon degradation (Chaillan et al., 2004).
1.6 Biological degradation of petroleum hydrocarbon
It is important to realize that biodegradation of both crude and refined oils
involves a consortium of organisms including both eukaryotic and prokaryotic forms.
Despite the fact that many hydrocarbons are toxic to many organisms, there are many
microorganisms, including bacteria and fungi that use hydrocarbons as a carbon and
energy source (da Silva et al., 2003).
1.6.1 Bacterial degradation of oil
The existence of hydrocarbon utilizing-bacteria, suggests that petroleum crude oil
m contaminated soils can be degraded as long as the right metabolic feedstock is
provided to stimulate the growth and multiplication of these bacteria (Okerentugba and
Ezeronye, 2003; Kogbara, 2008). It is now generally accepted by the scientific
community that no one species of microorganism will completely degrade any particular
- 6 -

oil. Typical bacterial groups already known for their capacity to degrade hydrocarbons
include Pseudomonas, Achromobacter, Micrococcus, Nocardia, Vibrio, Acinetobacter,
Brevibacterium, Corynebacterium, Flavobacterium, Marinobacter, Gordonia group,
Cellulomonas, Alcanivorax, Microbulifer and Sphingomonas (Bartha and Atlas, 1977 ;
Brito et al., 2006). Bacterial strains active during the biodegradation of hydrocarbon
were isolated and identified by Marin et al. (1996). Twenty aerobic strains were
identified by Amund (1996) as Acinetobacter caloaceticus. He and Spain (1997) found
that Pseudomonas pseudoalcaligenes can use nitrobenzene as a sole source of nitrogen,
carbon and energy. Nitrobenzene is reduced to hydroxy I-amino benzene. The 2-
aminomuconic deaminase produced by these bacteria releases ammonia from this
molecule, which serves as the nitrogen source for growth of the organism.
1.6.2 Fungal degradation
A huge diversity of fungal species exists in soil. Fungi playa role in degradation
of hydrocarbons. However, there are significant differences among the fungal taxa in
relation to their sensitivity and ability to mineralize different types of hydrocarbons.
Desirable characteristics for metabolizing specific hydrocarbons include rapid growth,
relatively high tolerance to/and potentiality of utilization of these compounds. These
active degraders could be chosen for the bioremediation of sites polluted with
hydrocarbons. For example, Co rio Ius versicolor decreased total hydrocarbon
concentration from 79 to 32/kg within a 12 month period (Gomez et al., 2003). It is now
widely accepted that many fungi can degrade petroleum hydrocarbons, such as the white
rot fungus Phanerochaete chrysosporium (Huynth et al., 1985; Gold et al., 1994),
Candida and sporobolomyces (Bartha and Atlas, 1977; Yateem et al., 1998 ).
Davis and Westlake (1979) examined 60 fungal isolates for their ability to grow on
N-tetradecane, toluene, naphthalene and seven crude oils of various compositions. Forty
cultures including 25 soil isolates could grow on one or more of the crude oils. The
genera most frequently isolated from soils were those producing large quantities of
small conidia, e.g., Penicillium and Verticillium spp., together with oil-degrading strains
of Beauvaria bassianae, Mortierilla spp., Phoma spp., Sclerobasidium oboratum and
To/ypocladium infiatum.
- 7-

Hashem and AI-Harbi (2000) isolated A.flavus, A.niger, Curvuiaria lunata and
Trichodenna spp. from sandy soil contaminated with crude oil incubated for five weeks.
Trichodenna spp. exhibited an increasing mycelium dry weight with increasing crude
oil concentrations, while Rhizopus spp. exhibited the lowest degradation capability of
crude oil. The most widely studied fungus is Trichodenna harzianum, which grows best
in the presence of petroleum hydrocarbon, followed by A. flavus and Chaetomium
botrychoid. (Bokhary and Parvaz, 1993). Also, Penicillium spp., Trichodenna viride,
Alternaria tenuis and Aspergillus terreus can degrade petroleum oil as reported by
Gomez et al. (2003).
However, reports in the literature on the actual numbers of hydrocarbon utilizers
are at variance with one another because of the methodological differences used to
enumerate petroleum-degrading microorganisms. The most common method to isolate
hydrocarbon degraders involves the use of hydrocarbons incorporated into an agar
based medium (Horowitz et ai., 1978).
1. 7 Enumeration of petroleum degrading microorganisms
In order to demonstrate that biodegradation is taking place in the field, the
chemistry of the environment must be shown to change in ways that would be predicted
if bioremediation were occurring (NRC, 1993; Zhu et ai., 2001).
The use of silica gel-oil media for the enumeration of petroleum-degrading
microorganisms has been recommended. Walker and Colwell (1976), suggested that
counts of petroleum degraders can be expressed as a percentage of the total population
rather than as total numbers of petroleum degraders. Silica gel media used for
propagation and isolation of petroleum-degrading fungi were prepared using procedures
decribed by Fuank and Krulwich (1964). The medium was supplemented with
fungizone fungicide to prevent growth of yeast and fungi. In this study the concentration
of oil in the medium used was 0.5% (v/v), which yielded the highest recovery of
bacteria. Also, the ability of microorganisms to utilize hydrocarbons is widespread even
in environments not subjected to high levels of hydrocarbon pollution. Atlas (1978)
reported that quantitative differences in the distribution of hydrocarbon utilizers were
relatively unimportant over large geographic distances.
- 8 -
The most probable number (MPN) procedure has also been tried as a substitute for
the plate count techniques for the estimation of hydrocarbon-utilizing microorganisms,
since it eliminates the need for the solidifying agent and permits direct assessment of the
ability of an organism to actually utilize hydrocarbons. The use of liquid media for
MPN also permits removal of trace organic contaminants and allows for the chemical
definition of a medium with a hydrocarbon as a sole source of carbon (Zhu et al., 2001;
Okoh, 2006). This technique thus incorporates the specificity for counting only
hydrocarbon utilizers and eliminates the problem of counting organisms growing on
other trace organic contaminants that are often present in solid media (Braddock and
Catterall, 1999). Zhongyun (1998) reported that the degradation of total petroleum
hydrocarbons could be quantified by monitoring hydrocarbon concentration using Gas
Chromatography and by bacterial counting. This method is simple enough for use in the
field and provides reliable estimates for the density and composition of specific
hydrocarbon degrading populations (Wrenn and Venosa, 1996 and Rice and
Hemmingsen, 1997).
1.8 Bioremediation: the use of living organism for the remediation of
polluted sites
Growing awareness of the harmful effects of pollution to the environment and to
human health has led to a marked increase in research into various strategies that might
be used to clean up contaminated sites. Many conventional engineering based
decontamination methods are expensive due to the cost of excavating and transporting
large quantities of contaminated materials for ex-situ treatment, such as soil washing,
chemical inactivation, i.e., the use potassium permanganate and / or hydrogen peroxide
as a chemical oxidant to mineralize non-aqueous contaminants such as petroleum purely
by chemical mechanism (Wrenn, 2003) and incineration (Chaudhry et al., 2005 ; Pilon
Smits, 2005)). The increasing costs and limited efficiency of these traditional physico
chemical treatments of soil have spurred the development of alternative technologies for
in-situ applications, in particular those based on biological remediation capabilities of
plants and microorganisms (Singh and Jain, 2003; Chaudhry et ai., 2005)
The term bioremediation refers to the use of living organisms to degrade
environmental pollutants (Dua et ai., 2002; Kuiper et al., 2004; Barea et al., 2005). - 9-

According to Anderioni et al. (2004) bioremediation is a method that uses
microorganisms to remove petroleum oil pollutants from soil under controlled
conditions.
1.8.1 Intrinsic bioremediation (Natural attenuation)
The simplest form of bioremediation is natural attenuation (NA) or bio-attenuation
during which the indigenous microbial populations degrade recalcitrant hydrocarbons or
xenobiotics based on their natural, non-engineered metabolic processes (Widada et al ..
2002 ; Kuiper et ai., 2004).
According to the Environmental Protection Agency in the United States (USEP A,
1999), NA or intrinsic remediation processes include a variety of physical, chemical and
biological processes that act to reduce the mass, toxicity, mobility, volume, or
concentration of contaminants. These processes include aerobic and anaerobic
biodegradation, dispersion, dilution, sorption, volatilization, radioactive decay and
chemical or biological stabilization, transformation, or destruction of contaminants
(Rittmann, 2004). NA can be applied on sites with low environmental or public value,
when time is not a limiting factor and where no other restoration techniques are cost
effective (Kuiper et al., 2004).
1.8.2 Types of bioremediation
Bioremediation technologies can be generally classified as 1) in situ or 2) ex
situ. In situ bioremediation involves treating the contaminant without removal of the
contaminated material. The microbial strains for in situ bioremediation may be obtained
from a variety of sources, the obvious source would be from the site itself. Nutrients,
inorganic fertilizers (N and P) and oxygen are added to the soil to encourage the growth
of the microorganisms. The oxygen can be supplied by bioventing which stimulates
hydrocarbon degrading microorganisms. As the contaminated soil is left in its original
location, the treatment is non-invasive. The treatment usually takes a long time to
complete and is difficult to monitor. Ex situ remediation involves the removal of the
contaminated material to be treated elsewhere. The primary method used in ex situ
- 10-

bioremediation are slurry phase treatment and solid phase treatment (Frick et al., 1999).
Some example of bioremediation technologies are as follows:-
1- Bioreactors
Above-ground bioreactors have been used widely to treat industrial effluent
and contaminated waste and soils in a slurry form (Frick et ai., 1999). Bioreactors are
designed to maximize microbial degradation of petroleum hydrocarbons under
controlled conditions and to minimize abiotic losses of the contaminants. Soil is mixed
with microorganisms and are encouraged to degrade the pollutant by providing them
with optimum conditions of pH, oxygen and nutrients.
2- Solid phase treatment
Solid phase bioremediation involves treating petroleum-contaminated soil on
site, in a contained above ground system. This type of bioremediation uses indigenous
soil microorganisms to degrade contaminants. Fertilizers, microbial inocula or
surfactants can be applied to the contaminated material to enhance petroleum
biodegradation (Frick et ai., 1999).
3- Landfarming
Landfarming is a process in which petroleum-contaminated soil is spread out
10 a layer 0.3 to 0.5 m thick and tilled every 4 days with addition of nitrogen and
phosphorus in the form of granular agricultural fertilizers. Aerating surface soil via
tilling, irrigation and fertilization encourages the indigenous soil microorganisms to
degrade the crude oil. However, landfarming can only be used to degrade PAHs with no
more than three aromatic rings (Frick et ai., 1999).
4- Composting
Involves making piles of contaminated soil, which are fertilized and irrigated
to encourage indigenous microorganisms to degrade petroleum crude oil. The
bioremediation of petroleum hydrocarbons can be improved by compost amendment,
such as fishbone compost enriched with urea, inorganic phosphorus and a lipidic
surfactant. Also, spent mushroom substrates and bark compost are a rich source of
microorganisms able to degrade pollutants (Frick et ai., 1999).
- 11 -

5- Bio-stimulation
Uses the addition of nutrients and microorganisms to enhance the
degradation of petroleum-contaminated soil. It involves the stimulation of resident
xenobiotic-degrading bacteria by addition of electron acceptors, water, nutrients, or
electron donors (Madsen, 1991; Widada et ai., 2002). In many cases however,
fertilization practices on contaminated sites using compost, nitrogen. phosphorus, and
other carbon sources has been unpredictable (Ramadan et ai., 1990; Namkoong et ai.,
2002; Kuiper et ai., 2004).
6- Bio-augmentation
Uses also the addition of nutrients and enzymes to enhance the growth of
microorganisms to degrade petroleum in contaminated soil. Bio-augmentation is a
method to improve degradation and enhance the transformation rate of xenobiotics by
introducing either wild type or genetically modified microbes into soil (Kuiper, et al.,
2004). Bioinoculation involves introducing beneficial, natural microbes into soil by,
e.g. using, seed coatings or by mixing microbes into a peat preparation. The laboratory
scale results of seeding microbes for degradation of soil pollutants have been ambiguous
(Kuiper et ai., 2004). Possible reasons for the failure of microbial inoculation could be
one or more of the following (Goldstein et al., 1985 ; Kuiper et al., 2004) : First, the
concentration of the contaminants at a site can be too low to support growth of the
inoculants. This also includes the problem of low bioavailability of certain pollutants.
Secondly, the presence of certain toxic compounds in the environment can inhibit the
growth or activity of the inoculated micro-organisms. Thirdly, the inoculant can prefer
to use other carbon sources present in soil, instead of the contaminant. Fourthly,
inocula may fail because of the inability of the microbes to spread through the soil and
reach the pollutant. Co-inoculation of a consortium of microbes, each with different
parts of the catabolic degradation route, involved in the degradation of a certain
pollutant is often found to be more effective than the introduction of one single strain
with the complete pathway to degrade the contaminant (Rahman et ai., 2002 ; Kuiper et
ai.,2004).
Odokuma and Dickson (2003) evaluated a combination of options including
bio-stimulation with agricultural fertilizers, bio-augmentation and physical processes in
the clean up of crude oil polluted soil for a period of 9 weeks. They found that there was
- 12 -
an increase in the total heterotrophic bacterial and hydrocarbon utilizing bacterial counts
throughout the period. These results suggest that bio-stimulation with tilling (nutrient
enhanced in-situ bioremediation) and/or the combination of bio-stimulation and bio
augmentation with indigenous hydrocarbon utilizers would be effective in the
remediation of crude oil polluted soils. Enhanced degradation of petroleum, and poly
aromatic hydrocarbons (PAHs) was observed in rhizosphere soil of Festuca
arundinacea with a maximum reduction in pyrene degradation rate that was 36% higher
than in the bulk soil. Also, the rhizosphere soil contained higher bacterial numbers than
the bulk soil (Ho and Banks, 2006).
7 - Bioventing
The addition of oxygen which stimulates aerobic hydrocarbon degrading
microorganisms where the contaminated soil is left in its original location (Frick et ai.,
1999).
1.8.3 Bioavailability
The bioavailability of organic compounds is one of the most important factors that
determine the overall success of a bioremediation process (Chaudhry et ai., 2005).
Pollutant bioavailability depends on the chemical properties of the pollutant
(hydrophobicity, volability), soil properties, environmental conditions and biological
activity (Pilon-Smits, 2005). There is disagreement among researches whether or not a
contaminant has to be dissolved in water to be bioavailable or whether microorganism
can utilize them directly. However, solubility and dissolution rates undoubtedly affect
bioavailability (Shor and Kossen, 2000). Hydrophobic, less water-soluble molecules
sorb more strongly to soil components than hydrophilic molecules.
Many attempts have been made to increase the bioavailability of hydrophobic
compounds by using surfactants. However, microorganisms themselves produce a range
of biosurfactants, the composition and quantity of which is dependent on growth
conditions (Maier, et ai., 2000). Surfactants are amphipathic molecules with a
hydrophobic and hydrophilic part (Kuiper, et ai., 2004 ; Pilon-Smits, 2005). Many
microbes can produce such surface active agents, referred to as biosurfactants, to
enhance the water solubility and subsequent bacterial degradation of organic
- 13 -

contaminants (Kuiper et al., 2004). Microorganisms have developed different strategies
to overcome the problem of the low bioavailability of hydrophobic substrates using
three mechanisms: a) high-affinity uptake systems (Miyata et al., 2004), b) adhesion to
the solid substrate, sometimes with the formation of a biofilm (Eriksson et al., 2002),
and c) production of biosurfactants or emulsifiers (Lang, 2002).
1.9 The role of microbial communities in soil
Soil is one of our most valuable resources available to life on earth. It regulates
global biogeochemical cycles, filters and degrades pollutants and enables food
production. One particular significant component of soil is microbial communities or
diversity (Borneman et al., 1996). Kennedy and Smith (1995) described some of the key
processes that are controlled by microorganisms, including the decomposition of
organic material, increasing nutrient availability of P, Mn, Zn and Cu, nitrogen fixation,
biological control of pests, biodegradation of pesticides and pollutants and finally
improving soil aggregation.
Microorganisms are vital to the function and maintenance of the ecosystem and
biosphere. They can be used for the biomonitoring of global ecosystems, cleaning of
environments (bioremediation), for counteracting climatic changes, for minimizing the
effects of pollutants and other habitat disturbances (Atlas, 1984).
Microbial communities in soil are made up of five major groups, namely, bacteria,
actinomycetes, fungi, algae and protozoa. Bacteria are the most abundant group. Soils
are reported to contain 105 - 108 culturable bacteria, 106
- 107 culturable actinomycetes
and 105 - 106 fungal colony forming units per g dry soil (Lawlor et al., 2000).
1.9.1 Rhizoremediation
Remediation of soil contaminated with organic chemicals using techniques such
as incineration and land filling can be expensive. An alternative technique which
involves the mutualistic relationship between plants and microorganisms to break down
contaminants can be used to clean-up the environment. This technique is called
rhizoremediation (Nichols et al., 1997). Rhizoremediation is a technique that is used to
- 14 -

clean up the environment contaminated with hazardous pollutants. Plants remediate
organic pollutants by: -1) direct up-take of contaminants, which are converted into non
toxic substances which are accumulated in the cells, -2) release of exudates and
enzymes by roots of plants stimulating microbial activity and biochemical
transformation of pollutants (Mackova et ai.,1997). Rhizoremediation is an effective,
non-destructive and inexpensive means of remediating the environment (Chaney et ai.,
1997). It is more cost effective than other methods such as mechanical and chemical
methods of removing hazardous compounds from the environment (Pradhan et al.,
1998). Besides, rhizoremediation is a natural, aesthetically pleasing and low cost
technology. It is socially accepted by surrounding communities and regulatory agencies
as a potential elegant technology (Alkorka et ai., 2001).
Walton et al. (1994) speculated that when a chemical stress is present in the soil, a
plant may respond by increasing or changing its exudation rate into the rhizosphere
which results in the modification of the rhizosphere microflora composition or activity.
As a result, the microbial community might increase the transformation rates of the
toxicant.
Nichols et al. (1996) showed that some bacteria grow and multiply in a selective
enrichment medium amended with a mixture of petroleum aromatic hydrocarbons and
had the ability to degrade PAHs in the rhizosphere of alfalfa and blue grass. Chaineau et
al. (1997) showed a rapid adaptation of the soil microbial community to degradation of
hydrocarbons in an agricultural field plot amended with drill cuttings, and blue grass.
1.10 Role of hydrogels
In arid regions, lack of moisture is one of the major causes of low microbial
activity. This also means that hydrocarbon degradation is likely to be inhibited if there
is little available moisture. Germination rates of seeds are sometimes enhanced when
hydrophilic polymers are used because of the increase in water availability, especially in
arid and semi arid environments (Woodhouse and Johnson, 1991). These authors also
found that incorporating a hydrogel into the soil aided the germination of barley, white
clover and lettuce. Hydrogels can aid in germination, seedling establishment, and water
availability and root colonization with mycorrihzae and bacteria (Cook and Nelson,
- 15 -

1986 ; Davies et al., 1987). The use of hydrogel to aid plant performance needs to be
matched with the overall need for water of a given plant species in relation to the
existing environmental conditions. The use of hydrogel soil amendments may have the
largest impact in arid reforestation nurseries, since minor irrigation failures could result
in massive plant losses (Callaghan et al., 1989). Hydrogel is commonly found in
horticultural markets where they are sold as water super- absorbers with the capability
of absorbing 400 to 1500 g of water per dry gram of hydrogel (Bowman and Evans,
1991). The majority of bacterial responses to hydrogels as reported in the literature have
been related to oil clean-up and drilling practices. Microorganisms suspended and/or
held by hydrogel can therefore be used in bioremediation (Degiorgi et al., 2002).
Acrylamide sodium acrylateco-polymer (cross-linked polyacrylamide membrane:
PAM) hydrogel is used to hold the bacteria in place so they do not migrate out of the
target area. The hydrogel can aid in stabilizing bacteria and the removal of heavy metals
like lead, cadmium, chromium and copper by stimulating uptake of these elements into
plants (Degiorgi et al., 2002). Hydrogels have been used in field establishment of
revegetation projects using perennial and annual plants. Also, hydrogels have been used
to establish tree seedlings and transplants in arid regions of Africa and Australia to
increase plant survival (Specht and Harvey, 2000).
1.11 Role of plastic covering
Plastic cover, the spreading of material around the base of a plant to mitigate
adverse temperatures or moisture loss, control weeds or enhance soil structure and
fertility has been an accepted horticultural practice for at least three centuries in Europe
(Waggoner et al., 1960).There are several commonly reported mechanisms by which
cover affected field grown herb and vegetable yields. Mulches may increase crop
growth by reducing weed infestations (Thompson et al., 1977; Teasdal and Mohler
2000), by reducing water loss or by modifying tempurature extremes. Organic mulches
however can reduce yields by introduction of weeds (Whitten, 1999).
- 16-
1.11.1 Effect of plastic cover on soil temperature
In the course of studying plastic cover effects on soil temperature, Lippert and
Witing (1964) found that the influence of the type of polyethylene cover on soil
temperature and crop response was dependent upon fIlm color. Richard (1976) reported
that the use of plastic cover would affect soil temperatures in four main ways: it would
reduce connective heat loss, outgoing radiation, evaporation, all of which raise soil
temperature, but it could also reflect incoming radiation when light in color, thus
reducing soil temperature. Kamp (1975), Salman and Gorski (1985), Bananno and
Lamont (1987) and Hassan (1988) showed that soil temperatures were on average 4.9°C
higher under clear plastic cover. Similarly, Hill et al. (1982) reported that clear and
black films warmed the soil. The average differences in temperature reported by
different authors between bare soil at a depth of 10cm were between 6.7 and 3.3 0c.
1.11.2 Effect of plastic cover on soil moisture
It has been known that soil moisture not only has a direct positive effects on water
absorption but also an indirect effect through its stimulating influence on root growth
and possibly on microbial activity in roots (Kramer, 1969). A great number of reports
deal with the response of soil moisture to plastic cover. Asano et al. (1981) reported that
by covering the surface of the medium with polyethylene fIlm the water requirement of
spring to summer cropped was reduced by 25- 30%.
1.11.3 Effect of plastic cover on plant growth
Plant vigor is of a great importance in food production. Early plant growth was
much faster in plots covered with transparent plastic compared with non covered plots
(Hopen and Oebker, 1976). The role of plastic cover in the development of roots has
been demonstrated by Lippert and Witing (1964). They found that more roots developed
in the upper soil layer in the presence of a plastic cover. The soil was also found to be
richer in nutrients and contained more microorganisms. The study of Mahajan et al.
(2007) revealed that plastic cover increased baby com yield by 18.9CJe compared to
uncovered treatments. Therefore, covering soil with plastics may prove beneficial for
- 17 -

crop growth because of the induced complex change in soil environment through
modifying soil temperature, reduction in water evaporation, weed growth, reduced soil
compaction and erosion.
1.11.4 Manipulating soil-plant-pathogen interactions
Clear polyethylene cover increases soil temperature over several cms of depth.
This can have a significant impact on the survival of various microbial plant pathogens
in the soil.
The effects of covering on soil bacteria are varied. Because few plant pathogenic
bacteria form spores, covering is expected to control their populations fairly effectively
(De vay, et al., 1991). Antagonistic bacteria and bacteria that lyse fungal mycelia often
were found in greater numbers following covering (Greenberger et al., 1987; Garnliel
and Katan, 1991). Populations of actinomycetes have been reported to remain
unchanged after soil covering (Stapleton and De vay, 1984). The covering of soil with a
polyethylene sheet may allow them to rapidly colonize the rhizosphere soil and out
compete deleterious and pathogenic microorganisms (Chen et al., 1991).
Many soil borne fungi are sensitive to heat especially pathogenic fungi (Pullman
et al., 1981 and Chen et al., 1991). There are many reports that claim that covering of
soil effectively controls soil borne pathogenic fungi including Dematophora necatrix
(Lopez-Herrera et al., 1998), Fusarium spp., (Greenberger et al., 1987), Phytophthora
spp. (Coelho et al., 1999); Pythium spp. (Pullman et al., 1981), Rhizoctonia solani
(Pullman et al., 1981) and Verticillium dahliae (Pullman et al., 1981).
1.12 Phytoremediation of petroleum hydrocarbon
Phytoremediation has been defmed as the use of green plants and their associated
microorganisms to degrade, contain or renders harmless environmental contaminants
(Cunningham et al., 1996). This technique is emerging as a potentially cost-effective
option for clean-up of soil contaminated with petroleum hydrocarbons (Frick et al.,
1999).
- 18 -

Research on remediation of petroleum hydrocarbons has included the use of
different plant species for phytoremediation. Root exudates can aid in degradation of
toxic organic chemicals and act as substrates for soil microorganisms (Palmroth et al.,
2002). Microbial popUlations in the rhizosphere may be greater than in non-vegetated
soil. Physicochemical and biological treatments involving microorganism are effective
for the remediation of petroleum hydrocarbon contaminated soils (Chaineau et al.,
2000). Phytoremediation may not be an option at sites with high concentrations of
petroleum hydrocarbons due to the phytotoxic effects of hydrocarbons on the plants.
Some sites may be nutrient limited or limited in water availability.
1.12.1 Mechanisms of phytoremediation
Phytoremediation of petroleum hydrocarbons generally involves three major
mechanisms: (1) degradation of pollutants (2) containment of the pollutant and (3) the
transfer of contaminants from soil to the atmosphere (Cunningham et al., 1996 and
Frick et ai., 1999). Degradation can be accomplished by both plants and their associated
microbes. Plants can stimulate the growth and metabolism of soil microorganisms by
providing root exudates containing carbon, enzymes, nutrients and oxygen which can
result in more than a 100 fold increase in microbial counts (Macek et ai., 2000).
Containment involves the accumulation of contaminants within the plants, adsorption of
contaminants into roots and binding in the rhizosphere through enzymatic activities
(Cunningham et ai., 1996 and Frick et ai., 1999). Plants can also transport volatile
petroleum hydrocarbons directly to the atmosphere through leaves and stems (Ferro et
ai., 1997).
Remediation of petroleum hydrocarbons may occur through rhizodegradation, or
petroleum hydrocarbon accumulation on plant roots (Phytostabilization), plant uptake
(phytoextraction) or transpiration of petroleum hydrocarbons (Phytovolatization) as
reported by Martin (2003). Wiltse et ai., (1998) concluded that planting vegetation may
be a feasible approach for cleaning oil-polluted sites, including the polluted Kuwait
desert areas.
- 19 -

1.12.2 Plant - assisted hydrocarbon degradation
Various studies have shown that petroleum hydrocarbon degradation can occur
through phytoremediation. The influence of the maize rhizosphere on fuel oil
degradation was evaluated in laboratory soil experiments and in hydroponic cultures by
Chaineau et ai., (2000). The maize plants were grown in soil with fuel oil (3300 mg
petroleum hydrocarbon per kg soil) for 120 days. In fertilized soiL the presence of
maize increased the biodegradation of petroleum by more than 20ge compared to the
non-vegetated soils.
Phytoremediation test plots were used to characterize the variability in the
degradation at a crude oil spill site in an agricultural field in Texas (Nedunuri et aI.,
2000). A phytoremediation grid was established two months after the spill occurred.
The plants used for phytoremediation were sorghum, rye grass, and St. Augustine grass.
The total petroleum hydrocarbon (TPH) concentration decreased by 42 % for rye grass
and 50% for St. Augustine grass after 21 months and had 25% greater reduction in mean
of TPH concentrations than did sorghum and the non-vegetated control plot.
Scots pine, poplar, grass mixture and legume mixtures were evaluated for their
ability to contribute to diesel fuel removal in the laboratory (Palmoroth et ai., 2002) For
the legume treatment, between 96% and 99% of the diesel fuel was removed and
amended (N.P.K. fertilizer, compost extract and microbial enrichment culture) soils
significantly increased diesel fuel removal after 30 days only. Diesel fuel removal in
soil was accelerated by the presence of scots pine, poplar, a grass mixture, and a legume
mixture but not by soil organic amendment. The most effective method for removing
diesel fuel was with the legume treatment. In addition, the total hydrocarbons in a
diesel-contaminated soil decreased faster in the presence of roots and nutrients
compared to that in non-vegetated or non-fertilized soil. (Reinolds et al., 1999; Yateem
et al., 2000).
1.13 Phytotoxicity of hydrocarbons
Hydrocarbons can be phytotoxic. A significant reduction in plant VIgor,
productivity and overall growth resulted from transplanting alfalfa genotypes into
contaminated soil (20g crude oil per kg soil) as reported by Wiltse et al. (1998). In a
- 20-

phytotoxicity study of the most resistant plants, e.g., sunflower, wheat, and bean, it was
found that sunflower was the most resistant to oil contamination followed by bean.
wheat, clover, maize, barley and lettuce (Chaineau et al., 1997). The LC50 values for
maize were 2.4% for total fuel oil, 0.3% for the light fraction and 60t for the heavy oil
fraction. Phytotoxicity was highest for low molecular weight and aromatic
hydrocarbons and varied greatly with petroleum concentration (Chaineau et al., 1997).
Yield reduction due to hydrocarbon contamination varied with plant type: biomass
production in contaminated soil (contaminated with 0.5% commercial diesel fuel) was
57% less for grasses and 36% less for legumes compared to the biomass produced in the
vegetated non-contaminated control treatments (Palmroth et al., 2002). In crude oil
contaminated soil (20 g crude oil/kg soil), total forage alfalfa yield and root weight
were 32% and 47% of the value for plants of the control respectively (Wiltse et al.,
1998). For wheat and bean, the reduction in dry biomass of aerial parts was greater than
80% when grown in petroleum contaminated soil, and growth inhibition increased with
increasing hydrocarbon concentration (Chaineau et al., 1997).
Hydrocarbon contamination suppresses the germination rates of seeds of some
types of plants, while others are not affected. Seeds of Scots pine, poplar, a grass
mixture, and a legume mixture germinated at similar rates in diesel-contaminated as in
the control pots, indicating the diesel had no effect on germination. In contrast, seed
germination of sunflower, maize, wheat, barley, bean, lettuce and clover decreased in
the presence of fuel oil hydrocarbons (Chaineau et al., 1997).
1.14 Use of Trichoderma harzianum (T22) to degrade organic
hydrocarbons
Work in the UK has shown that Trichoderma spp can successfully associate with
the roots of a range of plants and trees and promote growth (Lynch et ai, 1991, Ousley
et ai, 1993, 1994; Adams et aI, 2007a). Similarly in the USA (Harman 1996; Harman et
al 2004 a), it has been shown that Trichoderma (strain T22) can be used as a successful
rhizosphere plant symbiont. The capacity to alleviate soil and water pollution with such
rhizosphere associations has been termed phytobial remediation by Harman and Lynch
(Harman et al., 2004 b).
- 21 -

Trichoderma harzianum (T22) was shown to break down anthracene completely
to carbon dioxide using C 14 labeled anthracene. The fungus also physically adsorbed
>80% of added anthracene (Ermisch et al., 1990). Within the genus Trichodenna there
are reports that Trichoderma spp. are involved in hydrocarbon degradation. For
example, Saraswathy and Halberg (2002) isolated five species of fungi from a former
gasworks site that were capable of degrading the P AH pyrene. They found that
T.harzianum degraded 65% and 33.7% of 50 mg and 100 mg/l , respectively, of pyrene
during 28 days incubation. Also, species of Trichoderma tolerant to pyrene and
phenanthrene have been isolated from contaminated estuarine sediments (da Silva et al.,
2003). Despite potential involvement of Trichodenna har~ianum (T22) in hydrocarbon
degradation, the fungus has more potential in stimulating phytoremediation indirectly
by stimulating plant growth and root formation and therefore, inoculation of plants with
this fungus could be a feasible approach to enhance the degradation of hydrocarbons in
polluted soil. T.harzianum (T22) can solubalize metallic ions and produce siderophores
to chelate iron, making metal ions required for plant growth more available to the plant
(Harman et al., 2004 and Adam et af., 2005). The fungus is thought to colonize roots of
annual plants for their entire lifetime, by penetrating the outer layers of the roots
(Harman et al., 2004). This may make the plants release more root exudates to the
surrounding soil, thus stimulating microbial degradation of pollutants. T. ha r::.i an um
(T22) is able to metabolize plant root exudates and in return enhances plant root growth.
Enhanced root growth will lead to enhanced phytoremeditaion of pollutants in the
rhizosphere. Also, T22 has been proven to produce larger and deeper rooting plants and
also produces greater plant biomass. Such plants are more resistant to abiotic stress and
take up nutrients more effectively (Harman et al., 2004). This would be especially
useful in situations that are arid, such as the desert regions of Saudi Arabia.
1.15 Main Aims of this study
The aim of this thesis is to develop a remediation strategy for arid
soil (hot and dry soil, where the soil is low moisture content, low microbial activity and
very poor organic content) contaminated with petroleum crude oil. The strategy was
developed using tolerant plants enhanced by Trichoderma har~ianum (T22) as well as
- 22-

managIng soil conditions in a way that allows retention of moisture under arid
conditions.
Therefore to attain valuable results, the following studies will be carried out:
1. Development of a plant based system that encourages microbes associated with
the rhizosphere to degrade hydrocarbons.
2. Encourage plant growth in soil polluted with crude oil by inoculation with the
known plant growth promoting organism Trichodenna har:ianum, strain T22.
3. Encourage degradation of hydrocarbon degraders in soil polluted with crude oil
by optimising water content, mineral nutrients and temperature.
4. Development of methods that allow optimal conditions for hydrocarbon
degradation, especially moisture, to be maintained.
5. Apply the best system developed in the previous studies in field plots.
- 23 -
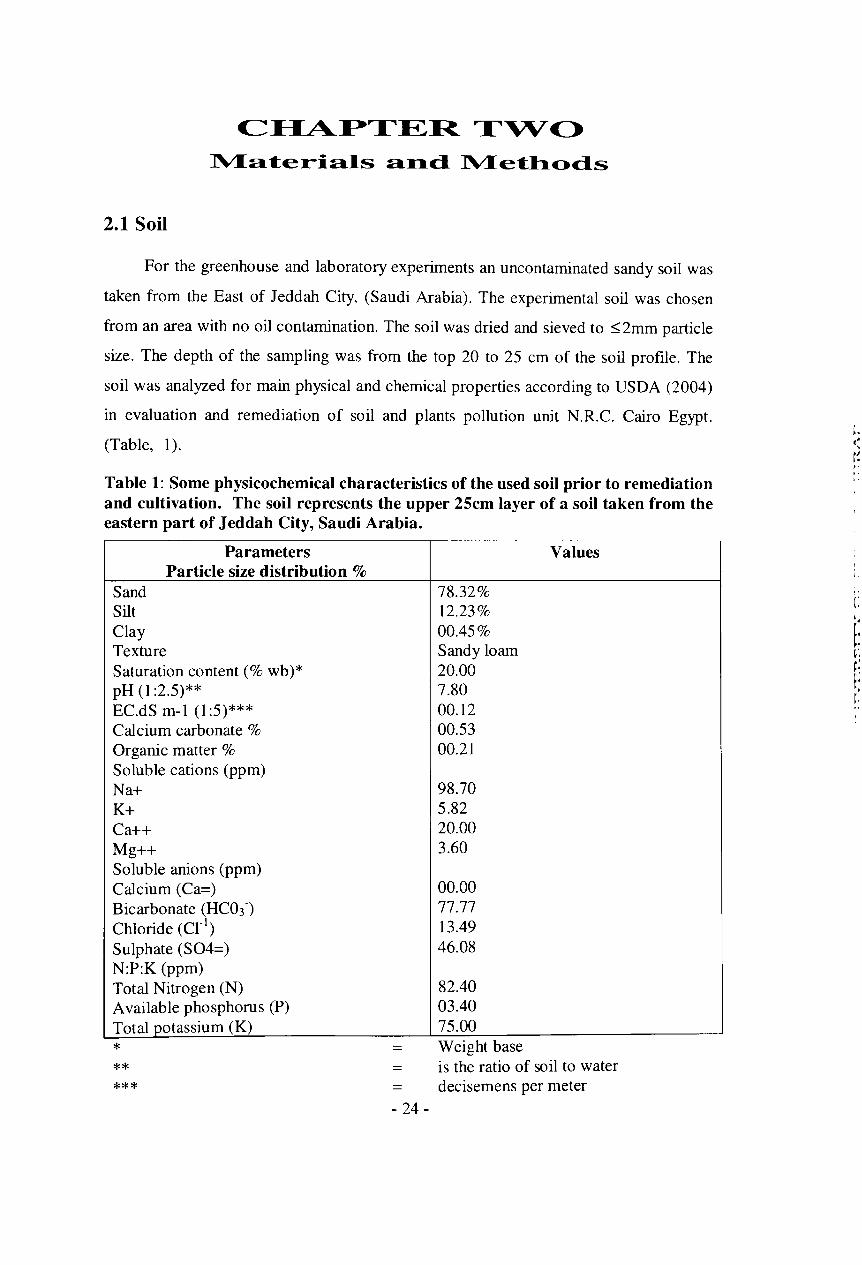
~at:erials a.-.d ~et:hods
2.1 Soil
For the greenhouse and laboratory experiments an uncontaminated sandy soil was
taken from the East of Jeddah City, (Saudi Arabia). The experimental soil was chosen
from an area with no oil contamination. The soil was dried and sieved to ~ 2mm particle
size. The depth of the sampling was from the top 20 to 25 cm of the soil profile. The
soil was analyzed for main physical and chemical properties according to USDA (2004)
in evaluation and remediation of soil and plants pollution unit N.R.C. Cairo Egypt.
(Table, 1).
Table 1: Some physicochemical characteristics of the used soil prior to remediation and cultivation. The soil represents the upper 25cm layer of a soil taken from the eastern part of Jeddah City, Saudi Arabia.
Parameters Particle size distribution %
Sand Silt Clay Texture Saturation content (% wb)* pH (1 :2.5)** EC.dS m-l (1:5)*** Calcium carbonate % Organic matter % Soluble cations (ppm) Na+ K+ Ca++ Mg++ Soluble anions (ppm) Calcium (Ca=) Bicarbonate (HC03-) Chloride (Crl) Sulphate (S04=) N:P:K (ppm) Total Nitrogen (N) A vailable phosphorus (P) Total potassium (K)
* ** ***
= = =
- 24-
Values
78.32% 12.23% 00.45% Sandy loam 20.00 7.80 00.12 00.53 00.21
98.70 5.82 20.00 3.60
00.00 77.77 13.49 46.08
82.40 03.40 75.00 WeIght base is the ratio of soil to water decisemens per meter
Table 1 shows that the soil consisted mostly of sand (78.329c) with very low
percentages of silt and clay (12.23 and 0.45%, respectively). The hydrogen ion
concentration tended to be slightly alkaline (pH-7.80) and the soil was slightly salty (EC
0.12 ds m-I). As was to be expected for a Saudi Arabian sandy soil, the nutrient content
was low; nitrogen 82.4 mg. kg-I soil, available phosphorous 3.4 mg. ktl soil and for
potassium 75mg. kg-I soil. The organic matter content was also very low (0.21 O/C.
(w/w)).
For experimental purposes the soil was fertilized with ammonium nitrate (33.5SL
nitrogen), calcium superphosphate (15.5% P20S) and potassium sulphate (48-527( K) at
rates of 0.3, 0.2 and 0.1 g/kg soil respectively. These nutrients are readily assimilated by
plants and microorganisms (Dibble and Bartha, 1979 ; Harris and Arnold, 1995). They
also have been previously shown to enhance the bioremediation of petroleum
hydrocarbons in soil (Odokuma and Dickson, 2003).
- 25 -

2.2 Crude petroleum oil
Crude petroleum oil was supplied and analyzed by the laboratory of the Saudi
American Company ( Aramco), Jeddah City Refinery, Saudi Arabia. The Arabian light
crude oil was analyzed for major physical and chemical properties (Table, 2).
Table 2: Major physical and chemical properties of petroleum crude oil taken from Saudi Aramco Jeddah refinery, Saudi Arabia.
Properties and compounds Values
G ravityO API 33.20
Sediment, vol % 0.05
Water, vol% Traces
Viscosity @ 70°F 61.90
Sulfur, total weight % 1.82
Hydrogen Sulphide, ppm Nil
Ash, ppm 85.00
Vanadium, ppm 17.00
Nicke~ ppm 5.00
Nitrogen, ppm 803.00 - -- ----
Hydrocaroons Weight %
Methane 0.00
Ethane 0.00
Propane 0.31
I - Butane 0.17
n - Butane 0.97
1- Pentane 0.66
n - Pentane 1.35
CycIopentane 0.07
2,2 Dimethylbutane 0.01
2,3 Dimethylbutane 0.07
2 Methyl pentane 0.56
3 Methyl pentane 0.40
n- Hexane 1.38
MethyIcycIopentane 0.22
Benzene 0.11
CycIohexane 0.16
Heptanes 93.56
Total 100%
The oil had an API (American Petroleum Institute) gravity of 33.20, sulfur content
of 1.82% (w/w) and a nitrogen content of 803 ppm. Heptanes represented the greatest
percentage of the hydrocarbons (93.56%) followed by n-Hexane (Table 2).
2.3 Plants
Zea mays I. (Giza 6, Egypt) was selected in this study because of its efficiency in
phytoremediation and also its extensive root system. During experiments conducted, it
- 26-
r I
I· e
showed to have a positive effect on the bioremediation of hydrocarbons in soil
(Ayotamuno and Kogbara,2007). Seeds were obtained from the Ministry of Agriculture.
Jeddah, Saudi Arabia during the preceding season and kept until used. Ten to fifteen
seeds were sown in 30 em diameter plastic pots. The pots were kept in a greenhouse
under controlled conditions at 30±2°C. Once germinated, the seedlings were irrigated
three times a week (60% WHC). For all experiments involving plants, the plants were
allowed to grow for a period of 6-10 weeks before they were harvested. During the
course of each experiment the germination percentage, plant height, dry weight of
shoots and roots for each plant were measured after the plants were harvested.
2.4 Trichoderma harzianum (T22)
T.harzianum colonized roots is known to enable plants to take up nutrients more
effectively and make them more resistant to abiotic stress (Harman et at., 2004). T22
was obtained from Plant Works (USA) and was formulated as a clay-based powder with
at least 107 cfu g-l inoculum.
2.5 Laboratory experiments
2.5.1 Role of Trichoderma harzianum (T22) in bioremediation of
petroleum crude oil
Soil was polluted with petroleum crude oil at a rate of 200g crude oil /800g soil in
combination with fertilizers applied as ammonium nitrate (33.5% nitrogen),
superphosphate (15.5% P20S) and potassium sulphate (48-52% K) at a rate of I, 0.65
and 0.35 glkg soil respectively (Dibble and Bartha, 1 979; Harris and Arnold,1995). The
thus treated soil was left for 2 weeks to allow evaporation of volatile hydrocarbons
before being used. For treatments involving Trichoderma, soil was inoculated with a
spore suspension at a rate of 1 g formulated spores! kg soil by watering the soil with the
spore suspension at the start of the experiment. The experimental treatments were as
follows:
1- Untreated soil (Control)
- 27-

2- Soil polluted with petroleum crude oil
3- Soil inoculated with T.har;.ianum (T22)
4- Polluted soil inoculated with (T22)
To determine degradation of hydrocarbons, 300 g of soil from each treatment was
put in a sterile flask (500ml) and the soil was moistened to 60% of its water holdina e
capacity and incubated at 30°C±2 for 4 weeks. Flasks were weighed daily and water
was added to maintain the required moisture level. Four replicates were used for each
treatment. Each flask was sampled weekly for microbial analysis (total bacterial count
and specific hydrocarbon degraders expressed as cfu/g soil as mentioned after). CO2
evolution was estimated according to Rowell (1994) and degradation of petroleum
hydrocarbons was estimated by GCIMS (Sadler and Connell, 2003).
CO2 evolution
The CO2 produced by respiration in moist soil was trapped by absorption in
NaOH solution according to Rowell (1994). The amount of NaOH remaining after a
known time period is determined by titration with 0.1 M HCl. Fifty grams (±O.l) of the
moist soil was placed in a 5 liter vessel. In each vessel a vial containing 10ml of 0.3M
NaOH solution was placed and the vessel was closed air tight to trap any evolving CO2.
The control was set up in the same way using 50g sand instead of experimental treated
soil. The soil was incubated for one week at 30±2°C. Moisture content was determined
to allow respiration to be expressed per gram dry weight soil. After incubation, each vial
was taken and the NaOH solution was transferred to a 250ml conical flask by rinsing
the vial with 10 ml distilled water subsequently, 10ml barium chloride (BaCh) was used
to precipitate the carbonate,
Na2C03 + BaCh = BaC03 + 2NaCl. To this solution, phenolphthalein solution (6
drops) was added and the solution was titrated with 0.1 M HCI until the colour changed
from red to colourless. The volume of HCI used was recorded and the amount of CO2
adsorbed determined using the following calculations: 2 mol NaOH react with 1 mol
C02, the molar mass of C02 is 44 g-mor l, therefore, the amount of C02 which has
reacted with NaOH in the flasks is NaOH reacted with C02 (mol) x44 g-morl= amount
of C02 per 50g moist soil per week.
- 28 -

Soil moisture content determination
The water content of the moist soil of different treatments was determined using
the following method: into duplicate 100 ml beakers about 109 of moist soil was
placed. The mass of the beaker and the mass of soil were determined. The soil were
dried overnight at 10SoC, reweighed and the water content calculated. Heating to
10SoC±1 does not affect hydrocarbon loss in soil as the ones that remain after 2 weeks
incubation have all high boiling points.
GC analysis: Gas Chromatography -mass spectrometry [GCIMS]
The procedure used in this study was similar to that reported by Sadler and
Connell (2003) to determine the total petroleum hydrocarbons in soil.
Extraction was as follows:
Two g of soil was mixed with 20ml CH2Cb (ethylene chloride), followed by
shaking for IS minutes using an electric shaker. Filtration and evaporation of the
ethylene chloride was done under reduced pressure. The residue was dissolved in
diethylether (2ml) and filtered using a 0.22/-11 syringe filter to remove any particulate
matter.
Analysis:
The GC used was a Shimadzu GC 17 A, QP-SOOO. Detailed GC parameters are as
follows:
GC Shimadzu, 17 A, QP SOOO
Column Type 0.30rnxO.2SmmID,0.2Smicron
Oven Temp. 32°C (2min) to 280°C at, 6°C/min
Run Time 31.40 min
Detector Mass spectrophotometer
Detector Temp. 230°C
Injection Temp. 200°C
Injection Size 0.2/-11
- 29-

Hydrocarbons were analysed at temperatures of 20, 30, 100, ISO, 200, 2S0, 280°C,
against time 1, 2, 2, 2, 2, 2,10 minutes, respectively. The method of the analysis adopted
from (Bennett et ai., 2007).
2.6 Greenhouse experiments
2.6.1 Effect of petroleum crude oil contamination on maize growth and
soil microorganisms
A pot experiment was conducted using 30 cm diameter pots seeded with Zea
mays (Giza 6, Egypt). The sandy soil was contaminated with petroleum crude oil at a
concentration of 7Sg/kg soil and left for 14 days before sowing. After sowing, N.P.K
fertilizers was added at a rate of 109 per pot containing Skg of soil. In each pot. 10 seeds
were sown and pots were placed in a thermostatically controlled greenhouse at 30±2°C
for 8 weeks.
During the course of the experiment the percentage germination and plant heights
were determined at two weekly intervals. Shoot and root dry weights were measured
every two weeks. Also soil samples were taken from the different treatments at the same
time for microbiological analysis (total bacterial count and specific petroleum
hydrocarbon degraders). After 4 and 8 weeks from sowing, soil samples were taken for
petroleum hydrocarbon analysis based on peak area by GC/MS as mentioned before.
The following treatments were used:
1- Unpolluted soil (general control)
2- Polluted soil with crude oil (7Sglkg soil)
3- Unpolluted soil sown with maize seeds
4- Polluted soil with crude oil sown with maize seeds
Soil moisture was maintained at constant level of 60% of the water holding
capacity (WHC) for the whole plant growth period. Four replicates were used for each
treatment.
- 30-

Microbiological analysis
The method adopted by Louw and Web ely (1959) for studying the
microorganisms of the soil and rhizosphere region was used. The plants were up-rooted
with great care to obtain most of the root-system. The root system was then shaken
gently to get rid of most of the adhering soil. The root system with remaining adhering
soil particles was transferred to a wide-mouth reagent bottle of known weight
containing 99 ml sterilized distilled water. The flasks were then shaken at 180 rpm
using a mechanical shaker for 15 minutes and serial dilutions from 10-2 and 10-7 were
made up using test tubes containing 9 ml sterile water as diluents. The root system was
discarded and the water in the flask was evaporated at 105°C for 24 hrs to determine the
actual weight of soil. The plate count technique according to Allen (1961) was used to
determine total counts of bacteria on soil extract agar medium (Mahmoud et aI .. 1964)
and most probable number (MPN) procedure for estimating total hydrocarbon
degrading bacteria was used (Wrenn and Venosa, 1996).
MPN methods
Total hydrocarbon degraders were enumerated in 96 well microtiter plates.
Petroleum crude oil was the selective substrate for determination of total hydrocarbon
degraders (Haines et aI., 1996). Petroleum crude oil (Sill/well) was added to the
hydrocarbon degrader plates after the wells were fIlled with carbon free growth medium
before they were inoculated. Bushnell-Hass medium (Difco products, Detroit
Michigan) supplemented with 2% NaCl was used as the growth medium for
hydrocarbon-degrader MPN procedures (180 Ill/well).
Samples were diluted in a saline buffer solution that contained 0.1 % (w/v)
sodium pyrophosphate (pH 7.5) and 2% NaCI (w/v). Ten fold serial dilutions were
performed and plates were inoculated by adding 20111 of each dilution to 1 of the 12
rows of eight wells. The last dilution (10- 10) was inoculated into row 11, the 10-
9
dilution was inoculated into row 10, and so on. The first row of each plate was
inoculated with 20111 of undiluted sample, and row 12 remained uninoculated to serve as
a negative control.
- 31 -

The MPN plates for hydrocarbon degraders were incubated for 2 weeks at
27±2°C. Iodonitrototn-zolium violet (INT) was used to identify hydrocarbon
degradation (Haines et al., 1996). After 2 weeks of incubation, 50111 of filter sterilized
INT (3 gIL) was added to each well. In positive wells, INT is reduced to an insoluble
formasan that deposits intracellularly as a red precipitate. Positive wells were scored
after overnight incubation at 27±2°C with INT. A computer program using Microsoft
Excel® (Microsoft) and solver (Frontline Systems) tool according to Briones and
Reichard (1999) was used to calculate the MPN for the hydrocarbon degraders in each
sample.
Encouraging plant growth in polluted soil with petroleum crude Oil
using Trichoderma hanianum (T22)
A greenhouse experiment using petroleum crude oil at a concentration of 75glkg
soil was conducted to assess the contribution of plants and T.harzianum strain (T22) in
bioremediation of petroleum crude oil.
The same plants (maize) and conditions as described in the previous experiment
were used. In this experiment, maize seeds were inoculated with T22 before planting by
coating wetted seeds with formulated inoculum (Harman et al. (2004).
For each of the treatments below, a vegetated and non-vegetated treatment was
created.
1- Soil without treatment (general control)
2- Soil + crude oil
3- Soil + T.harzianum (T22)
4- Soil + crude oil+ T22
The experiment consisted therefore of eight treatments each with four replicates.
Soil moisture was maintained at a constant level of 60% of soil water holding
capacity for the whole growth period of the plants (8 weeks). The percentage
germination, plant height and shoot and dry root weights were measured at 2 week
- 32-

intervals, while soil samples were taken from the soil for microbiological and GC
analysis every month as described in the previous experiment.
The role of hydrogel and covering systems on enhancing
biodegradation of petroleum crude oil of polluted soil
A pot experiment was set up to evaluate the effect of hydrogel combined with
covering the soil with transparent polyethylene sheeting on the bioremediation of
petroleum crude oil.
The soil was contaminated with petroleum crude oil at a rate of 75g/kg soil.
Portions of polluted and non-polluted soil were treated with hydrogel at a rate of 2g
hydrogel/kg soil. The soil was then placed into 30cm diameter pots (5kg soil/pot). The
above mentioned treatments were covered with transparent polyethylene sheets (50
microns thickness). Water was added at the beginning of the experiment and water
content was maintained at 60% of soil WHC (600 ml water/pot). The control treatment
had no hydrogel or cover. Therefore, the experiment had the following treatments:
1) Soil without any treatment (control)
2) Soil amended with petroleum oil at 75g oil/kg soil
3) Soil treated with hydrogel at 2g /kg soil
4) Soil covered with polyethylene (50 microns)
5) Soil amended with petroleum oil (75 g oil/kg soil) and hydrogel
(2 g / kg soil)
6) Soil amended with petroleum oil (75 g oil/kg soil) and covered
with polyethylene
7) Non polluted soil, hydrogel (2g /kg soil) and covered with
polyethylene
8) Soil amended with petroleum oil (75 g oil/kg soil), hydrogel (2g /kg
soil) and covered with polyethylene
- 33 -
Four replicates were used for each treatment and the experiment was set up as a
complete randomized design according to replicate. All measurements were taken
throughout a period of 8 weeks as per the following: pots were weighed on daily basis
to determine soil water loss; C02 evolution was determined on weekly basis for eash
soil sample and the petroleum hydrocarbons analysis using GCIMS were carried out on
monthly bases (at the 4th week and the 8th weeks) using the methods described before.
Field experiment
A field experiment was carried out at the Faculty of Science Farm, King Abdel
Aziz University, Jeddah, Saudi Arabia during 2007. Three replicates for each treatment
were established using a split plot design (each plot was 4 m2). Maize seeds (Zea ma,vs
L. cv. Giza 6) were sown on May, 1 st in rows 30 cm apart. Calcium super-phosphate
(16.5% P20S) and potassium sulphate (48% K20) at a rate of 480 and 120 Kglhectare
respectively, were added before planting. Nitrogen fertilizer, in the form of ammonium
nitrate (33.5% N) was added at a rate equivalent of 720 kglha, in two equal portions,
applied before the first and the second irrigation respectively.
Study area description
The soil used for the field experiment was a sandy soil and the original vegetation
cover consisted of the normal flora of the region. The area used for the experiment was
divided into two blocks and each block was divided into 3 rows (each row represents
one replicate, each with a length of 1m, a width of 30cm and a depth of 30cm).
Treatments were as follows:
The experiment was divided into two equal groups (main factor). The first group
was amended with petroleum crude oil at a rate of 75g/kg soil. The second group was
not amended. After amendment, the plots were left undisturbed for three days. After 10
days the plots were treated as follows:
1 - Sown with maize seeds
- 34-

2- Sown with maize seeds + T22 (T22 applied as a seed dressing at a
rate of 19 inoculum/kg maize seed using lo/c CMC (carboxyl methyl
cellulose) as sticker
3 - Sown with maize seeds inoculated with T22 + soil amended with
hydrogel (2 g/kg) and plots covered with white reflective polyethylene
The amount of irrigation water for each replicate was estimated as follow:
3 liters were used for the treatment with hydrogel and cover, and 6 liters for the
other treatments. All plants were irrigated twice a week.
The rate of sowing used was 25 kg of maize seeds/ha (approximately 60
seeds/plot) (recommended sowing rate by the Ministry of Agriculture, Jeddah, Saudi
Arabia).
Sample collection
The percentage germination, plant height and dry weights of shoots
and roots were measured at 2, 4, 6 and 8 weeks after sowing. Tap water was used to
wet the soil before samples were taken. The wet soil was then loosened with a spatula.
Three plants were chosen at random from each replicate for analysis. Plants were
carefully pulled from the soil without breaking the roots. Rhizosphere soil samples were
collected in separate plastic bags and 109 of rhizosphere soil was taken for
microbiological analysis from each plot (total bacterial count and specific hydrocarbon
degraders). CO2 evolution and hydrocarbon analysis were determined using GCIMS
using the methods described before.
Statistical analysis
Data obtained for the different experiments were subjected to analysis
of variance (ANOVA) according to method described by Snedecor and Cochran (1982)
using the Mastatic Programme. If data were not normally distributed they were
normalized using log transformation before ANOVA was carried out. Least significant
- 35 -

differences were used to compare treatment means according to Walter and Duncan
(1969) at a probability 5%.
- 36-
Selection of plants tolerant to crude oil
3.1 Introduction
Petroleum crude oil is a complex mixture of thousands of hydrocarbons and non
hydrocarbon compounds, including heavy metals. Although, the toxicity of each
individual component is known (Baek et al., 2004), the toxicity of complex mixtures
such as those present in petroleum crude oil and refined oil products is extremely
difficult to assess (Overton et al., 1994), because little is known about the additive,
synergistic or antagonistic effects of the various compounds within mixtures. In
addition, the chemical composition of each crude oil or petroleum product varies
significantly and can adversely affect different organisms within the same ecosystem
(Overton et al., 1994). These differences in toxic effects are due to compositional
differences in various products, as well as concentration differences of the chemical
constituents (Albert, 1995). Bioassays such as measurements of seed germination and
early seedling growth have been used to monitor treatment effects and monitor
restoration of oil contaminated sites (Sayles et al., 1999). Baek et al. (2004) tested the
phytotoxic effects of petroleum crude oil and oil components on seed germination and
growth of red beans and corn. They found that crude oil-contaminated soil at a
contamination level of 10,000 mg oil/kg soil was phytotoxic. According to results of
germination tests carried out by Dibble and Bartha (1979), germination of wheat and
soybean in kerosene-contaminated soil (0.34% w/w) was delayed, while Wiltse et al.
(1998) found that alfalfa seeds germinated in soil contaminated with up to 50 g crude oil
per kg soil. Udo and Faymi (1975) determined that at levels of 10.6% (w/w) crude oil,
maize did not germinate. Germination and growth of five plant species in a plant growth
medium supplemented with a hydrocarbon mixture of three polycyclic aromatic
hydrocarbons and crude oil were studied by Cuevas et al. (2008). They found that
germination for assayed concentration however, the length of the stems and roots
decreased when hydrocarbons increased and the survival of the four species also
diminished. Except, for F. arundinacea, a direct link between hydrocarbon and plant
survival was observed. Chouychai et al. (2007) tested four plants (corn, ground nut,
- 37 -

cowpea and mungbean) for their ability to germinate and grow in soil contaminated with
phenanthrene or pyrene. They found that the growth of com was the least sensitive to
crude oil. However, its germination rate was less in the presence of contaminants, hence
they concluded that the corn is the most suitable plant to be grown in PAH
contaminated acidic soil.
The effect on microorganisms and plants depends on the concentration and the type of
oil (Boethling and Alexander, 1979). Light crude oils have volatile components that can
be toxic to living organisms of the soil (Shahriari et ai., 2007). The effect of crude oil
and its components on germination and growth of some plants has been studied by
Adam and Duncan (2002), Amakiri and Onofeghara (1984) and Shahriari et al. (2007).
They demonstrated that petroleum hydrocarbon additions to the soil at concentrations of
10.6% (w/w) impeded germination of maize plants and reduced maize yield by 95%.
This poor yield response was attributed to the exclusion of air from the soil due to the
oil interfering with soil/water relationships, and also to the depletion of oxygen by
microbial degradation of the contaminants. Results obtained by Egharevba (2001)
revealed that oil treatment of soil at high concentrations of 3.04 % and 4.56% adversely
affected the growth of two forest fruit tree seedlings in terms of plant height, collar
girth, leaf area, leaf number and dry weight.
Also, diesel oil applied at 2.4, 4.8 and 4.8 mllkg of soil was found to have a
negative effect on the growth and development of oat (Wyszkowska et al., 2002). On
the other hand, the results of Ayotamuno and Kogbara (2007) revealed that maize can
survive in soil contaminated with 21 % oil by volume (similar to 177000 mg/kg) and still
produce 60% of the fresh crop yield compared to the yield in non-contaminated soil.
Sharifi et al., (2007) found a significant reduction on germination, above ground
height and biomass for six herbaceous plant species (one species of Fabaceace, four
species of Gramineae and one species of linaceae) cultivated in contaminated soil
containing 25,50,75,1 OOg oillkg soil. Properties of oil determine its environmental
behavior and effect, and thus it is important for clean-up operators to select proper
cleanup strategies. The physical-chemical properties of crude oil and its products
include specific gravity, sulfur and water contents, solubility in water, viscosity, surface
tension, adhesion, chemical dispensability, evaporation rate, etc. according to method
- 38-
used by Aramco Refinary Company, Saudi Arabia. These properties vary in oils from
different origins (Xu, 200 I).
This experiment aims to investigate the tolerance of a range of plants that could
potentially be grown in arid soils, for their ability to tolerate crude oil.
3.2 Materials and methods
3.2.1 Effect of crude oil on seed germination
Seed germination of alfalfa, acacia, sunflower, maize and wheat, in the presence
of petroleum crude oil was estimated to examine whether, these test plants were tolerant
to petroleum crude oil. In this experiment 0, 200, 400, 600, 800, 1000, 1200, 1400,
1600, 1800 and 2000 ppm of crude oil was mixed with 10 seeds in a Petri-dish
containing 2 ml water with two drops of Tween 80 and left to dry. Ten seeds were
subsequently arranged on wet filter paper placed in a Petri-dish. Four replicates were
used for each treatment. Every other day, 2 ml water was applied to the seeds to prevent
them drying out. The control had only distilled water. Seeds were incubated at 30DC and
the maximum percentage germination over a 20 days incubation period was recorded.
3.2.2 Effect of petroleum crude oil on plants grown in contaminated
desert soil
3.2.2.1 Experimental design
A pot experiment was conducted using five different plant species, namely;
Alfalfa egyptiaca, Acacia baileyane, Annuus sp. (Sunflower Dwarf-Holland), Zea mays
(geza 6-Egypt) and Triticum aestium (Wheat Westbred-USA). The sandy soil described
previously, was contaminated with the following crude oil concentrations: 0 (control),
10,000 , 30,000 , 50,000 , 75,000 , 100,000 and 150,000 ppm. Contaminated soil was
left for 10 days to allow evaporation of the most volatile components, before planting.
Four replicates were set up for each treatment. The soil was then placed into 20cm
diameter pots. In each pot 10 seeds were planted. Seeds were cleaned with water
- 39-
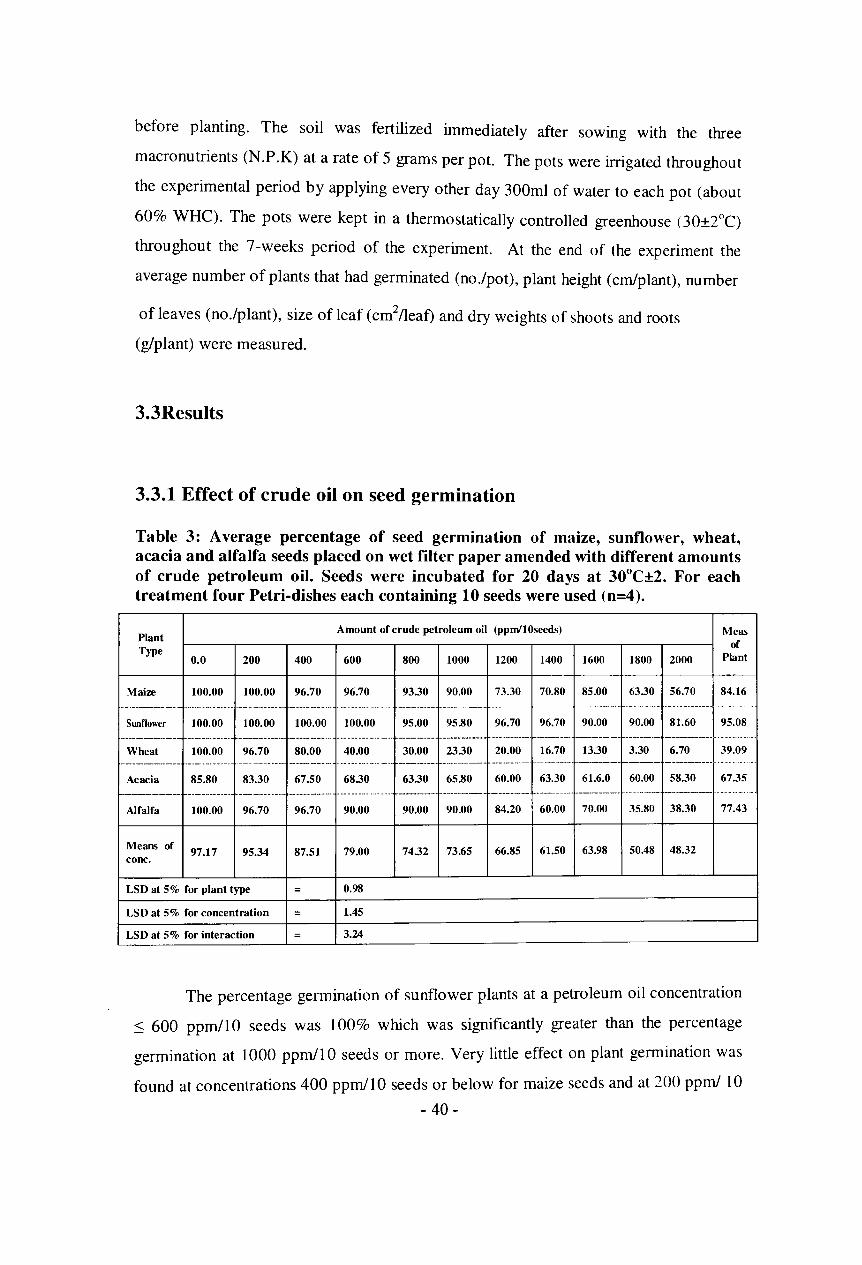
before planting. The soil was fertilized immediately after sowmg with the three
macronutrients (N.P.K) at a rate of 5 grams per pot. The pots were irrigated throughout
the experimental period by applying every other day 300ml of water to each pot (about
60% WHC). The pots were kept in a thermostatically controlled greenhouse (30±2°C)
throughout the 7 -weeks period of the experiment. At the end of the experiment the
average number of plants that had germinated (no./pot), plant height (cm/plant), number
ofleaves (no./plant), size of leaf (cm2/leaf) and dry weights of shoots and roots
(glplant) were measured.
3.3Results
3.3.1 Effect of crude oil on seed germination
Table 3: Average percentage of seed germination of maize, sunflower, wheat, acacia and alfalfa seeds placed on wet filter paper amended with different amounts of crude petroleum oil. Seeds were incubated for 20 days at 30°C±2. For each treatment four Petri-dishes each containing 10 seeds were used (n=4).
Plant Type
Amount of crude petroleum oil (ppm'10seeds) Meas of
Plant 0.0 200 400 600
Maize 100.00 100.00 96.70 96.70
Sunflower 100.00 100.00 100.00 100.00
Wheat
Acacia
Alfalfa
Means of conc.
100.00 96.70
85.80 83.30
100.00 96.70
97.17 95.34
LSD at 5% for plant type
LSD at 5% for concentration
LSD at 5% for interaction
80.00 40.00
67.50 6830
96.70 90.00
87.51 79.00
0.98
1.45
3.24
800 1000 1200 1400 1600 1800 2000
9330 90.00 73.30 70.80 85.00 6330 56.70 84.16
95.00 95.80 96.70 96.70 90.00 90.00 81.60 95.08
30.00 2330 20.00 16.70 1330 3.30 6.70 39.09
6330 65.80 60.00 63.30 61.6.0 60.00 58.30 67.35
90.00 90.00 84.20 60.00 70.00 35.80 38.30 77.43
7432 73.65 66.85 61.50 63.98 50.48 48.32
The percentage germination of sunflower plants at a petroleum oil concentration
~ 600 ppm/IO seeds was 100% which was significantly greater than the percentage
germination at 1000 ppm/I 0 seeds or more. Very little effect on plant germination was
found at concentrations 400 ppm/IO seeds or below for maize seeds and at 200 ppm/ 10
- 40-

seeds for wheat, acaCia, and alfalfa seeds compared to the non-amended control. At
concentrations above 1200 ppmll 0 seeds much more inhibition was seen and the
germination percentage decreased dramatically for all plants. The maximum reduction
in germination percentages (maximum toxicity) were recorded for the five plants at the
higher concentrations of petroleum oil (1800 and 2000 ppm/lO seeds). The results
suggest that an exposure to low concentration of crude petroleum oil during germination
was less toxic to seed germination as compared with the higher concentrations.
Sunflower was the most resistant to the toxicity effect of the crude petroleum oil
followed by maize, alfalfa and acacia. Wheat was the most sensitive to crude oil of the
plant species test.
3.3.2 Effect of petroleum crude oil on plants grown in contaminated
desert soil
3.3.2.1 Maize
The average number of plants per pot are shown in Table 4. These data showed that
crude petroleum oil was toxic to maize seeds and strongly affected their growth at the
different concentrations. A significant reduction of 64% compared to the control
treatment was observed at a concentration 50 x 103 ppm. The lowest dose of crude oil
(lOx 103 ppm) decreased the number of maize plant/pot by about 27%, while the
highest dose of 150 x 103 ppm caused a 88 % reduction in germination. With regard to
plant height, contamination of soil with crude petroleum oil had a pronounced effect on
plant growth. Significant reductions in plant height were observed for plants that grew
in soil contaminated with more than 30 x 103 ppm crude oil compared to the control.
There was more than fifty percent reduction in shoot length for plants grown in soil
treated with oil at 30 x 103 ppm as compared to the control. Above this concentration,
plant height was greatly reduced reaching 87% reduction at a concentration of 150 x 103
ppm.
- 41 -

Table 4: Growth parameters of maize grown in sandy soil applied with different concentrations of crude petroleum oil 7 weeks from sowing. Each pot was so\\n with 10 maize seeds and placed in a thermostatically controlled greenhouse at 30o±2°C (n=4).
Crude oil Growth Parameters
concentration (ppm x 103
) No. of Plant height No. of Leaf surface area Dry weight(g)/p1ant plantsIPot (cm) leavesIPlant (cmz/leaf)
Shoot Root 0 8.30 47.00 8.00 42.80 18.30 6.90
10 6.10 26.40 5.70 35.90 8.00 3.00
30 7.00 20.20 4.80 29.80 3.20 1.60
50 3.00 12.30 3.80 25.70 3.00 0.70
75 1.60 11.50 3.30 21.00 3.00 0.70
100 1.40 9.30 3.10 13.90 2.50 0.70
150 1.00 6.00 2.00 6.00 1.30 0.40
L.S.D. at 5% 3.20 27.50 4.50 24.00 8.20 KS.
Soil contaminated with petroleum crude oil also reduced the average number
of leaves from 5.7 in the lowest dose of crude oil of 10 x 103 ppm down to 2
leaves/plant in the soil with the highest concentration of crude oil of 150 x 103 ppm.
Contamination of soil with petroleum crude oil had also a pronounced effect on the leaf
surface area (cm2/leaf). Plants exposed to 75 x 103 ppm of petroleum oil had
significantly reduced leaf surface areas (about 51 % decrease). Above this concentration
toxicity was more drastic reaching 86% reduction at concentration of 150 x 103 ppm.
There was a significant decrease in biomass of plants (shoot and root dry weights)
grown in the polluted soils as compared to control soil. Dry matter of maize (g/plant)
was reduced with increasing concentration of oil. Petroleum crude oil at concentration
of 30 x 103 ppm was responsible for a 83% and 77% decline in dry weight of shoots and
roots, respectively. At 150 x 103 ppm crude oil concentration, dry weight of shoots and
roots were reduced by 93% and 94%, respectively.
- 42-
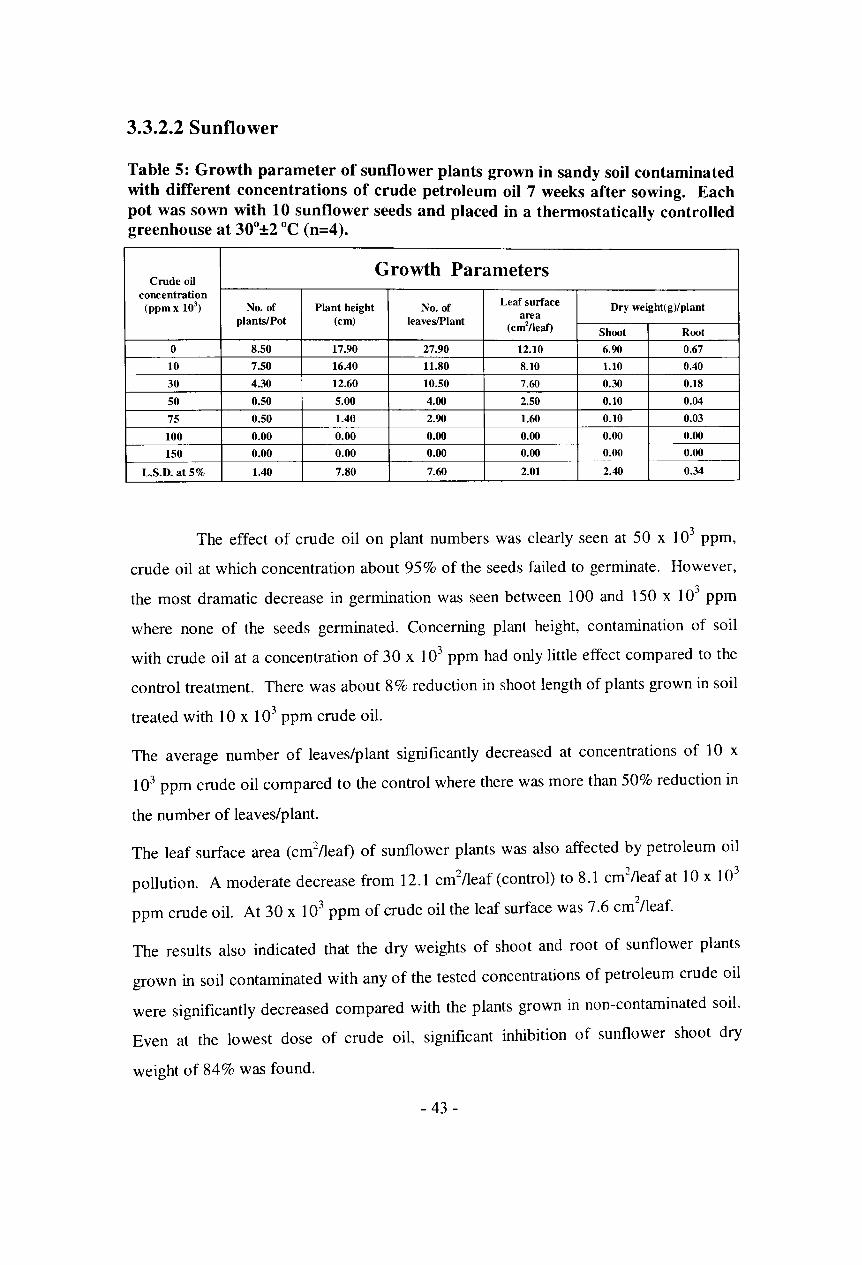
3.3.2.2 Sunflower
Table 5: Growth parameter of sunflower plants grown in sandy soil contaminated with different c?ncentrations of crude petroleum oil 7 weeks after sowing. Each pot was sown wIth 10 sunflower seeds and placed in a thermostatically controlled greenhouse at 30o±2 °C (n=4).
Growth Parameters Crude oil
concentration (ppmx 103
) No. of Plant height No. of Leaf surface Dry weight(g)/plant plants/Pot (em) leavesIPlant area
(cm2/leaf) Shoot Root
0 8.50 17.90 27.90 12.10 6.90 0.67
10 7.50 16.40 11.80 8.10 1.10 0.40
30 4.30 12.60 10.50 7.60 0.30 0.18
50 0.50 5.00 4.00 2.50 0.10 0.04
75 0.50 1.40 2.90 1.60 0.10 0.03
100 0.00 0.00 0.00 0.00 0.00 0.00
150 0.00 0.00 0.00 0.00 0.00 0.00
L.S.D. at5% 1.40 7.80 7.60 2.01 2.40 0.34
The effect of crude oil on plant numbers was clearly seen at 50 x 103 ppm,
crude oil at which concentration about 95% of the seeds failed to germinate. However,
the most dramatic decrease in germination was seen between 100 and 150 x 103
ppm
where none of the seeds germinated. Concerning plant height, contamination of soil
with crude oil at a concentration of 30 x 103 ppm had only little effect compared to the
control treatment. There was about 8% reduction in shoot length of plants grown in soil
treated with lOx 103 ppm crude oil.
The average number of leaves/plant significantly decreased at concentrations of lOx
103 ppm crude oil compared to the control where there was more than 50% reduction in
the number of leaves/plant.
The leaf surface area (cm2/leaf) of sunflower plants was also affected by petroleum oil
pollution. A moderate decrease from 12.1 cm2/leaf(control) to 8.1 cm2/leafat 10 x 10
3
ppm crude oil. At 30 x 103 ppm of crude oil the leaf surface was 7.6 cm2/leaf.
The results also indicated that the dry weights of shoot and root of sunflower plants
grown in soil contaminated with any of the tested concentrations of petroleum crude oil
were significantly decreased compared with the plants grown in non-contaminated soil.
Even at the lowest dose of crude oil, significant inhibition of sunflower shoot dry
weight of 84% was found.
- 43 -

3.3.2.3 Acacia
Table 6: Growth parameters of acacia plants grown in sandy soil amended with different concentrations of crude petroleum oil, 7 weeks after sowing. Each pot was sown with 10 acacia seeds and were placed in a thermostatically controlled greenhouse at 30o±2 °C (n=4).
Crude oil Growth Parameters
concentration (ppm x 103
) No. of Plant height No. of Leaf Surface Dry weight(g)/plant plants/Pot (cm) leavesIPlant area
(cm2/leaf) Shoot Root
0 2.20 10.90 7.40 2.00 1.30 0.12
10 1.30 6.90 4.40 0.90 0.30 0.04
30 1.00 5.40 3.50 0.90 0.10 0.03
50 0.80 2.10 2.50 0.40 0.09 0.01
75 0.80 2.00 2.60 0.40 0.07 0.01
100 0.30 1.20 1.50 0.20 0.04 0.00
150 0.00 0.00 0.00 0.00 0.00 0.00
L.S.D. at 5% N.S. 5.90 4.10 0.60 0.46 0.07
The crude petroleum oil proved to be also a powerful toxic to seeds and plants of
acacia (Table 6). Plant height showed decreases of about 37 and 50 % at 10 and 30 x
103 ppm as compared to the control. Above these concentrations no growth occurred.
There was more than a 50% reduction in the number of leaves/plant grown in the soil
polluted with crude oil at 30 x 103 ppm compared to the non-polluted control.
The leaf surface area (cm2/leaf) of acacia was also greatly affected by crude oil
pollution. A decrease in the leaf surface area of about 55% was seen at a concentration
of lOx 103 ppm crude oil.
Dry weight of acacia shoots and roots showed that soil contaminated with crude
petroleum oil dramatically reduced the shoot and dry weights of acacia compared with
the control plants. At lOx 103 ppm of crude oil a significant inhibition of 77% and 68%
for shoot and root dry weights was found respectively.
- 44-

3.3.2.4 Wheat
T?ble ?: Growth param~ters of wheat plants grown in sandy soil contaminated wIth different co~centrabons of crude petroleum oil, 7 weeks after sowing. Each pot was sown With 10 wheat seeds and placed in a thermostatically controlled greenhouse at 30o±2°C (n=4).
Crude oil Growth Parameters
concentration (ppm x 103
) No. of
Plant No. of Leaf surface Dry weightlg)/plant
plants/Pot height leaveslPlant area
(em) (cm2/1eaf) Shoot Root
0 8.30 16.80 6.10 58.10 1.80 0.80
10 4.30 11.70 4.80 42.70 0.20 0.40
30 3.80 11.50 3.30 34.60 0.20 0.20
50 2.90 8.60 2.40 10.40 0.20 0.20
75 3.10 4.20 1.70 4.00 0.20 0.10
100 1.00 2.20 1.30 3.00 0.10 0.10
150 0.00 0.00 0.00 0.00 0.00 0.00
L.S.D. at5% 3.10 7.08 3.90 20.70 0.70 0.30
The lowest concentration of crude oil decreased the average number of wheat
plants/pot by 48% (Table 7) , while none of the plants germinated at a concentration of
150 x 103 ppm crude oil.
Concerning plant height, contamination of soil with crude oil showed moderate
effect on plant height causing about 30% at concentrations between 10 and 30 x 103
ppm crude oil while at 100 ppm plant height of the plants that grew was reduced by
87%.Number of leaves /plant was reduced from 6.1 in the control to 3.3 leaves/plant at a
concentration of 30 x 103 ppm. Above these concentrations the no. of leaves/plant was
significantly reduced reaching zero at the highest dose.
Plants exposed to 75 x 103 ppm crude oil had a highly significant reduction in leaf
surface area compared to the control (about 93.1 % reduction).
Soil contaminated with different concentrations of crude oil greatly reduced the shoot
and root dry weights of the wheat plants compared with the control plants. At 10 x 103
ppm a significant inhibition of 89% for the shoot dry weight and a reduction of 50lJ( for
the root dry weight were obtained.
- 45 -

3.3.2.5 Alfalfa
Table 8: Growth parameters of alfalfa plants grown in sandy soil contaminated with different concentrations of crude petroleum oil, 7 weeks after sowing. Each pot was sown with 10 alfalfa seeds and placed in a thermostatically controlled greenhouse at 30o±2°C (n=4).
Crude oil Growth Parameters concentration (ppm x 103
)
No. of Plant height No. of Leaf surface area Dry weight(g)/plant plantslPot (em) leaveslPlant (cm2/leaf)
Shoot Root
0 5.70 8.50 11.50 1.60 1.10 0.10
10 4.50 5.90 6.60 1.10 0.30 0.08
30 2.80 1.00 4.50 0.30 0.24 0.06
50 1.30 0.60 2.70 0.10 0.13 0.03
75 0.40 0.60 1.00 0.10 0.10 0.01
100 0.00 0.00 0.00 0.00 0.00 0.00
150 0.00 0.00 0.00 0.00 0.00 0.00
L.S.D. at 5% 1.80 2.40 5.60 0.40 0.04 0.003
There was a significant effect on the number of plants per pot at concentrations
greater than 10 x 103 ppm compared to the control. No plants grew at the highest two
concentrations of crude oil.
Plant height at a concentration of lOx 103 ppm was significantly decreased
compared with the control. A 88 % reduction in plant height was seen at dose of 30 x 103
ppm crude oil.
The average number of leaves/plant showed a >77% decrease at concentrations greater
than 50 x 103 ppm crude oil compared to the control.
A large decrease in leaf surface area was seen between concentrations of 30 and 75 x
103 ppm where the surface area for each leave was reduced by 81 % and 94%,
respectively.
Petroleum crude oil significantly reduced the shoot and root dry weight compared to the
untreated control with reductions of 100% for the shoot and root dry weights at 100 and
ISO x 103 ppm.
- 46-

3.4 Discussion
3.4.1 Effect of crude oil on seed germination
Results of this study clearly showed that petroleum oil had a significant
inhibitory effect on the germination of maize, sunflower, acacia, wheat and alfalfa
seeds. At concentration above 1.2m1l10 seeds, germination was significantly inhibited
with minimum germination percentages being recorded for the five tested plants at
concentrations of 1.8 and 2 ml oil per 10 seeds. This is consistent with previous reports
which studied differences in sensitivity of different plant species to petroleum
hydrocarbons. Differences in sensitivity may be related to some volatile fraction with
less than 3 rings found in the oil. These compounds are known to have severe inhibitory
impact on germination of several plant species (Henner et ai., 1999). Another group of
chemical compounds which are polyaromatic compound (PAHs) have been shown to
have indirect secondary effects including disruption on plant -water-air relationships
(Renault et ai., 2000). This result is in line with that obtained by Wiltse et al., (1998)
who found that alfalfa seeds germinated in soil contaminated with up to a 50g crude
oil/kg soil (5% w/w). In this study, at levels of 10.6% (w/w) crude oil, maize did not
germinate. The results presented here suggest that plant exposure to low concentrations
of petroleum oil during germination was not toxic, especially not for sunflower and
maIze.
According to the results of germination tests by Dibble and Bartha (1979).
germination of wheat and soybean in petroleum hydrocarbon-contaminated soil (0.34%
w/w) was delayed compared to uncontaminated control soil.
- 47-

The most tolerant plant to oil contamination in petroleum contaminated soil was maize,
which germinated at all tested concentrations. The results of this in-vitro test agree with
the works of Ogbo (2009). This might be because maize is a typical C4 plant which
uses less water for its metabolism than C3 plants (Heldt, 2005). As a result, maize is
relatively resistant to toxins including herbicides (Cotter, 2007).
, . (,
f: c·
- 48-

Effect of maize plants on the biodegradation of petroleum crude oil in polluted soil
4.1 Introduction
Increasing dependence of humanity on fossil fuels, especially petroleum
hydrocarbons has led to the pollution of cultural lands, owing to spillage of crude oil
during extraction and processing operations, in many oil-producing countries.
Utilizing plants to absorb, accumulate and detoxify contaminants in the growth
substrate through physical, chemical or biological processes are a widespread practice
(White et al., 2006, ; lilani and Khan, 2006).
Various plants have been identified for their potential to facilitate the
phytoremediation of sites contaminated with petroleum hydrocarbons. In the majority
of studies, grasses and legumes have been singled out for their potential in this regard
(Aprill and Sims, 1990; Gunther et al., 1996; Reilley et al.,1996; Sharifi et at., 2007;
Cuevas et al., 2008). Enhanced biological degradation in the rhizosphere soil appeared
to be the primary mechanism of dissipation, while leaching, plant uptake, abiotic
degradation, mineralization and irreversible sorption were shown to be insignificant
(Reilley et al., 1996). Scwab et al., (1995) studied three plants (sorghum, bermuda grass
and alfalfa) during 14 days in petroleum-polluted soil and found that significantly
higher mineralization of 14C-phenanthrene degradation occurred in the rhizosphere of
these plants compared with the bulk soil.
The mechanisms by which phytoremediation operates include degradation and
containment as well as transfer of the hydrocarbons from the soil to the atmosphere
(Cunningham et at., 1996 ; Siciliano and Germida, 1998). Plants provide root exudates
that contain carbon, mineral nutrients, enzymes and sometimes oxygen that can be used
by microbial populations in the rhizosphere (Cunningham et at., 1996 ; Vance, 1996).
This plant-induced enhancement of microbial populations is referred to as the
rhizosphere effect (Atlas and Bartha, 1998) and is believed to result in enhanced
degradation of organic contaminants in the rhizosphere. According to Greensmith
(2005) pea plants increased the numbers of pyrene and phenanthrene degrading bacteria
- 49-
in contaminated soil, by providing the bacteria with nutrients via root exudates. Some
plant root exudates or compounds from decomposing plant material may increase the
solubility of petroleum hydrocarbons, making them more bioavailable to degrading
microorganisms (Qui et ai., 1997). Compounds that do this are known as surfactants and
are amphiphilic (have both hydrophobic and hydrophilic groups) compounds that lower
surface tension and increase the solubility of compounds such as PAHs (Mulligan,
2005).
Also, plants create a vegetative cover over the soil surface, thus stabilizing
temperature and moisture conditions (Gunther et ai., 1996) in a range that is more
suitable for microbial growth.
Direct mechanisms of containment of hydrocarbons by plants include the
accumulation of petroleum hydrocarbons within the plants and adsorption of the
contaminants on the root surface (Cunningham et ai., 1996).
Plant root growth influences degradation of organic chemicals also indirectly. The
colonization of the soil by roots can help to liberate contaminants trapped in micropores,
therefore making them available for microbial attack.
The rhizosphere is a zone of increased microbial activity at the soil-root interface
(Anderson et ai., 1993 ; Frick et ai., 1999). Microbial activity in the rhizosphere is
usually described as the ratio of the number of microorganisms in the rhizosphere soil to
the number in the bulk soil (the RlS ratio). This ratio can range from 5 to as high as 100.
This range in activity is often referred to as the "rhizosphere effect" and is responsible
for increased microbial degradation of organic contaminants (Anderson et ai., 1993).
Root growth can stimulate microbial activity by encouraging the development of
soil structure, increasing water and oxygen infiltration. In addition, the rhizosphere
effect can be attributed to the release of root exudates (Hutchinson et ai., 2003).
The rhizosphere effect becomes highly significant when dealing with
hydrophobic contaminants such as PAHs. These compounds are not readily taken up by
plants due to their tendency to partition off into soil organic matter, therefore making
rhizosphere degradation the main detoxification pathway (Hutchinson et al., 2003). The
plant roots stimulate the bacteria in the rhizosphere, which leads to enhanced
biodegradation of petroleum hydrocarbons (Gunther et al., 1996). Hydrocarbon
- 50-

contamination can have therefore a significant effect on soil microbial populations.
(Loser et ai., 1998; Riser-Roberts, 1998). Many heterotrophic bacteria are able to utilize
hydrocarbons as a source of carbon and energy, and most ecosystems support
indigenous communities of microbes that are capable of hydrocarbon degradation.
(Nichols et ai., 1996).
Given this fact, it is not surprising that hydrocarbon contamination can increase
microbial activity in soil, an effect that can lead to rapid degradation of hydrocarbons
but can come at the expense of species diversity. Hydrocarbon degraders usually are
present in the soil at a ratio of approximately 0.1 % of the culturable microbial
populations (Gunderson, 2006). As contamination increases, these microbes may
eventually make up a larger proportion of the total bacterial community. (Atlas, 1981).
Morelli et ai. (2005) found that while both hydrocarbon-degrading and
heterotrophic bacteria were present in sludge-soil mixtures that were amended with 2.5,
5 and 109 petroleumlkg-1 dry soil, the diversity of the microbial community decreased
with increasing contamination.
The objective of this experiment was to test whether planting using maize plant
enhances bioremediation of petroleum crude oil contaminated soil and to assess the role
of rhizosphere soil microbes in the degradation of petroleum hydrocarbons.
4.2 Materials and methods
To study the effect of petroleum crude oil contamination on maize growth and soil
microorganisms an experiment involving maize (Zea mays) cv. Giza 6, cv. (10 seeds per
pot) was set up in a greenhouse. Pots were filled with 5.0 kg of the sandy soil described
in chapter 3, and contaminated with petroleum crude oil at a rate of 75g1kg soil. After
mixing, the soil was left for 14 days to allow volatilization of volatile hydrocarbons.
Once sown, pots were placed in a thermostatically controlled greenhouse at a
temperature of 30 ± 2°C for 8 weeks. Chemical fertilizers were added to the soil before
sowing. Plant samples were taken at 2, 4, 6 and 8 weeks after sowing. Treatments were
replicated four times. Control treatments did not receive petroleum crude oil.
During the course of the experiment, indices of plant performance such as
percentage germination and plant height (cm per plant) were measured every two
- 51 -
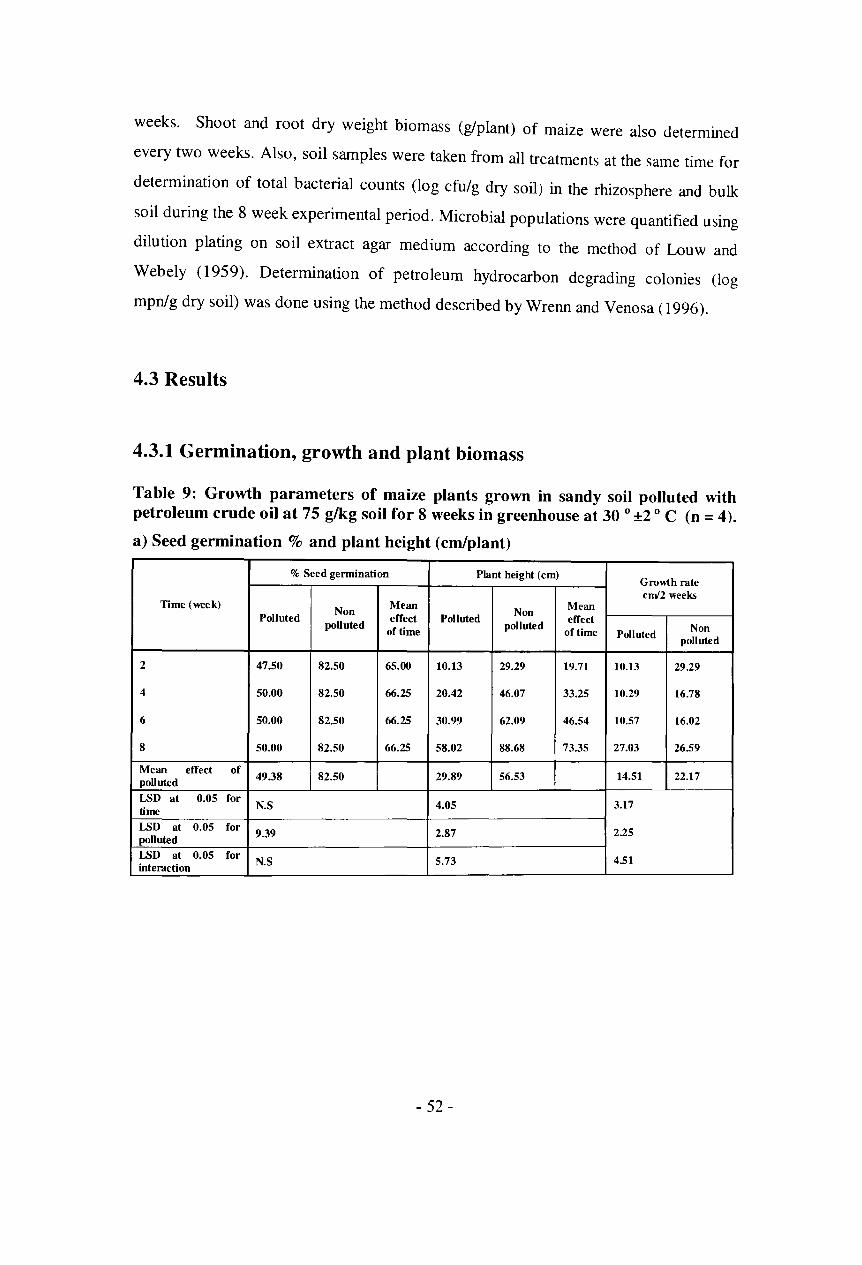
weeks. Shoot and root dry weight biomass (glplant) of maize were also determined
every two weeks. Also, soil samples were taken from all treatments at the same time for
determination of total bacterial counts (log cfu/g dry soil) in the rhizosphere and bulk
soil during the 8 week experimental period. Microbial popUlations were quantified using
dilution plating on soil extract agar medium according to the method of Louw and
Web ely (1959). Determination of petroleum hydrocarbon degrading colonies (log
mpn/g dry soil) was done using the method described by Wrenn and Venosa (1996).
4.3 Results
4.3.1 Germination, growth and plant biomass
Table 9: Growth parameters of maize plants grown in sandy soil polluted with petroleum erude oil at 7S g/kg soil for 8 weeks in greenhouse at 30 0 ±2 0 C (n = 4).
a) Seed germination % and plant height (em/plant)
% Seed gennination PIant height (cm) Growth rate cm'2 weeks
Time (week) Mean Non Mean
Polluted Non
effect Polluted effect polluted polluted Non of time of time Polluted polluted
2 47.50 82.50 65.00 10.13 29.29 19.71 10.13 29.29
4 50.00 82.50 66.25 20.42 46.07 33.25 10.29 16.78
6 50.00 82.50 66.25 30.99 62.09 46.54 10.57 16.02
8 50.00 82.50 66.25 58.02 88.68 73.35 27.03 26.59
Mean effect of 49.38 82.50 29.89 56.53 14.51 22.17 polluted
LSD at 0.05 for N.S 4.05 3.17
time LSD at 0.05 for
9.39 2.87 2.25 polluted LSD at 0.05 for
N.S 5.73 4.51 interaction
- 52 -
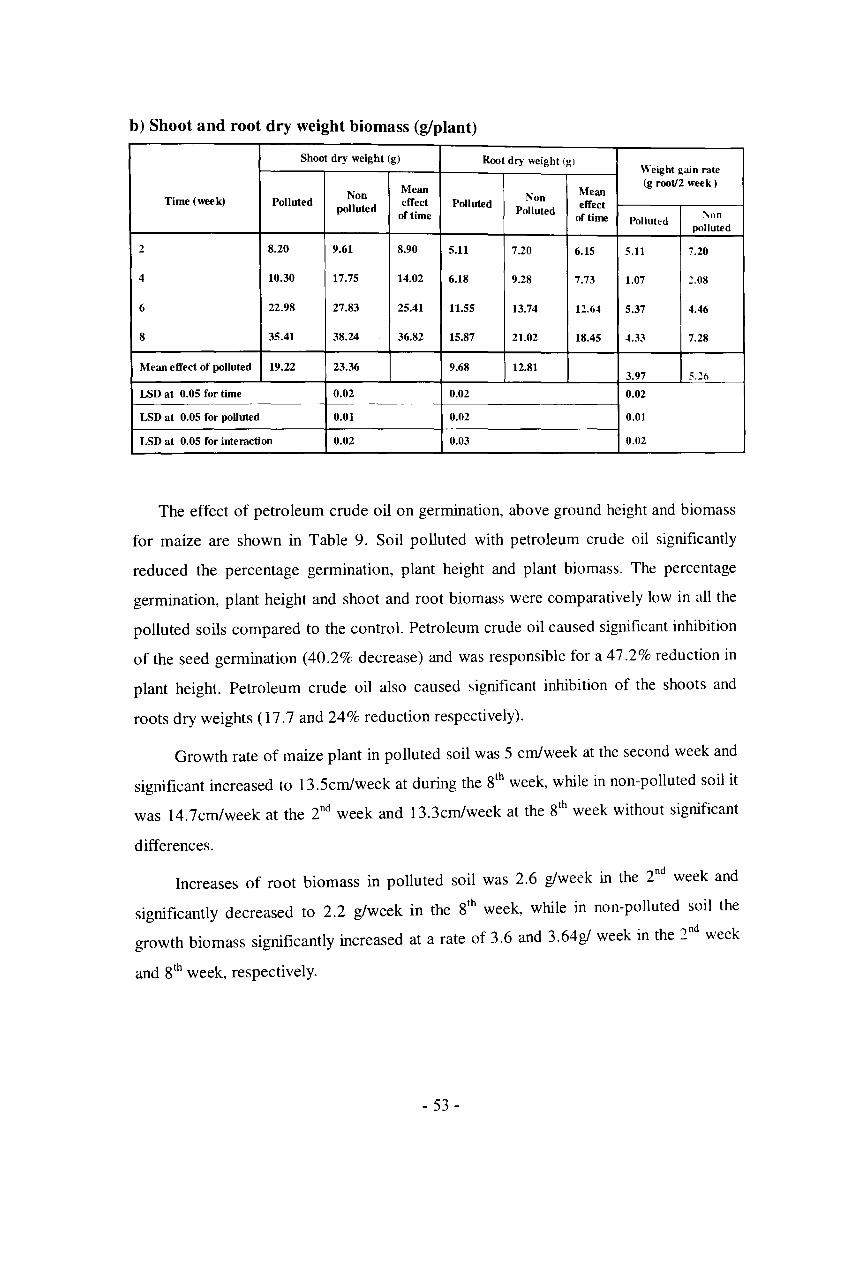
b) Shoot and root dry weight biomass (glplant)
Shoot dry weight (g) Root dry weight (gl Weight gain rate
Non Mean Mean (g rootl2 week)
Time (week) Polluted effect Polluted !l.'on effect polluted
of time Polluted '\on of time Polluted polluted
2 8.20 9.61 8.90 5.11 7.20 6.15 5.11 7.20
4 10.30 17.75 14.02 6.18 9.28 7.73 1.07 2.08
6 22.98 27.83 25.41 11.55 13.74 12.6.t 5.37 4.46
8 35.41 38.24 36.82 15.87 21.02 18.45 4.33 7.28
Mean effect of polluted 19.22 23.36 9.68 12.81 3.97 5.26
LSD at 0.05 for time 0.02 0.02 0.02
LSD at 0.05 for polluted 0.01 0.02 0.01
LSD at 0.05 for interaction 0.02 0.03 0.02
The effect of petroleum crude oil on germination, above ground height and biomass
for maize are shown in Table 9. Soil polluted with petroleum crude oil significantly
reduced the percentage germination, plant height and plant biomass. The percentage
germination, plant height and shoot and root biomass were comparatively low in all the
polluted soils compared to the control. Petroleum crude oil caused significant inhibition
of the seed germination (40.2% decrease) and was responsible for a 47.2% reduction in
plant height. Petroleum crude oil also caused significant inhibition of the shoots and
roots dry weights (17.7 and 24% reduction respectively).
Growth rate of maize plant in polluted soil was 5 cm/week at the second week and
significant increased to 13 .5cm/week at during the 8th week, while in non-polluted soil it
was 14.7cmfweek at the 2nd week and 13.3cm/week at the 8th
week without significant
differences.
Increases of root biomass in polluted soil was 2.6 g/week in the 2nd
week and
significantly decreased to 2.2 g/week in the 8th week, while in non-polluted soil the
growth biomass significantly increased at a rate of 3.6 and 3.64g/ week in the 2nd
week
and 8th week, respectively.
- 53 -

4.3.2 Total bacterial counts in rhizosphere and non-rhizosphere soil
Ta~le 10: Total bact~rial.counts (Log cfulg dry soil) in rhizosphere and bulk soil of maIze plants grown lD sod polluted with petroleum crude oil at 75 glkg soil. Plants were grown for 8 weeks in greenhouse at 30o±2°C. Microbial populations were measured by dilution plating on soil extract agar (n=4).
(Log cfulg dry weight soil)
Rhizosphere Soil
Time (week) Polluted Non poDuted Polluted Non polluted
2 5.01 6.05 3.17 4.14
4 6.25 7.51 4.98 6.41
6 7.17 7.54 5.26 6.46
8 7.34 7.62 5.95 6.56
Average 6.44 7.18 4.84 5.89
Average m 6.81 5.37
Average polluted and non-polluted 5.64 6.54 treatments
LSD at 0.05 for plant 0.06
LSD at 0.05 for polluted 0.06 LSD at 0.05 for interaction 0.61
LSD at 0.05 for time 0.08
Table 10 shows the total heterotrophic bacterial population (THBe) during the
eight-week test period. Total colony forming units were determined in rhizosphere and
non-rhizosphere soil. There was a significant (p<O.05) increase in the population of total
heterotrophic bacterial numbers as affected by time in both rhizosphere and non
rhizosphere soil in all treatments.
Petroleum crude oil significantly reduced the total heterotrophic bacterial counts
in the rhizosphere and soil. In non-rhizosphere samples the total count for the control
(non-polluted) was 5.89 log cfu g-l soil, while in petroleum crude oil contaminated soil
the population was 4.84 log cfu g-l soil. The same trend was also observed in the
rhizosphere samples of maize plant, where mean population size was 7.18 log cfu g-I
soil in non-polluted soil and 6.44 log cfu g-I soil in polluted soil.
The percentage reduction for the total heterotrophic bacterial counts because of
petroleum crude oil contamination was 82 and 910/( in the rhizosphere and soil
respectively.
- 54 -

4.3.3 Total petroleum hydrocarbon degraders in rhizosphere and soil
Ta.ble 11: Total petro~eum hydro~arbon degraders (Log mpn/g dry soil) in rhlzosphere and n.on-rhlzosphere sod of maize plants grown in soil polluted with petroleum crude 011 at a rate of 75g/kg soil for 8 weeks in a green house at 30o±2°C (n=4).
(Log mpn/g dry weight soil)
Rhizosphere Soil
Time (week) Polluted Non polluted Polluted !lion polluted
0 4.33 4.61 4.50 4.28
2 4.55 4.77 4.40 ·.1,38
4 4.49 4.86 4.56 4.20
6 4.63 5.10 4.60 4.47
8 4.93 5.36 4.87 4.62
Plant x polluted 4.59 4.94 4.58 4.39
Mean effect of plant 4.76 4.49
Mean effect of pollution 4.59 4.66
LSD at 0.05 for plant 0.06
LSD at 0.05 for pollution 0.06
LSD at 0.05 for time 0.10
Table 11 shows the most probable number (log mpn) of the total petroleum
hydrocarbon degraders in the rhizosphere of maize plants and in soil. There was a
significant (p<0.05) increase in the total petroleum hydrocarbon degraders in the
rhizosphere of polluted and non-polluted soil as the plant grew up, reaching its
maximum on the 8th week. The same trend was observed in non-rhizosphere soil. In
general, the hydrocarbon degrading population was almost 2 times greater (P <0.05) in
the rhizosphere soil compared to non-rhizosphere soil, indicating the role of plant
exudates in the enhancement of the bacterial population.
There were 57% fewer (p<0.05) hydrocarbon degraders in rhizosphere of maize
plants that grew in polluted soil than in the rhizosphere of plant roots that grew in non
polluted soil. In non-rhizosphere soil the opposite trend was observed; the number of
petroleum hydrocarbon degraders was 60% greater in polluted than in non-polluted soil.
- 55 -

4.3.4 Biodegradation of some petroleum hydrocarbons
Table 12: Effect of maize plants on biodegradation of petroleum hydrocarbons (based on peak area using GC-MS) in soil polluted with petroleum 'crude oil at 75g/kg soil for 8 weeks in greenhouse at 30o±2 °c (n= 4).
(Degradation %)
~ Rhiwsphere Soil
Detected Mean effect "lean effect
compounds Week 4 Week 8 of detected of detected compounds Week 4 Week8 compounds
C •• H24 (undecane) 93.26 98.76 96.01 19.00 43.35 31.18
CJ2FIu (dodecane) 94.29 97.72 96.01 71.19 84.29 77.7~
CI3H28 (tridecane) 94.88 97.81 96.35 50.42 95.21 7:!.S2
C.JI3(1 (tetradecane) 96.15 97.29 96.72 84.37 93.68 89.30
C.SH32 (pentadecane) 97.42 97.02 97.22 77.84 89.04 83.44
C.JH~(hexadecane) 90.40 87.66 89.03 87.92 95.59 91.76
C.,H36 (heptadecane) 84.16 97.11 90.64 85.26 94.77 90.02
Plant x Time 92.94 96.19 68.00 85.13
Mean effeet of plant 94.57 76.57
Mean eO·eet of time 80.47 90.66
LSD at 0.05 for plant 3.34
LSD at 0.05 for time 3.34
LSD at 0.05 for detected compounds 6.24
LSD at 0.05 for plant x Time 4.72
LSD at 0.05 for interaction 12.48
Table 12 shows the percentage degradation of some petroleum hydrocarbons in
the rhizosphere- and non-rhizosphere soil. Generally, the concentrations of the detected
compounds in the 8th week were significantly (p<0.05) lower than in the 4th week in
both the rhizosphere and non-rhizosphere soil (3.4% and 20.20/( lower respectively).
In the rhizosphere of maize plants at week 8, undecane (C II H:~4) was most easily
degraded, while hexadecane (C I6H34) was the most persistent. In non-rhizosphere soil,
the compound hexadecane (C I6H34) was the most rapidly degraded compound, while
undecane (C ll H24) was the least easily degraded. Data also showed that maize plants
significantly increased degradation of the different compounds from 76.6 in non
rhizosphere soil to 94.6% in rhizosphere soil (a 23.59( increase in hydrocarbon
degradation).
- 56-
4.4 Discussion
The principal aim of this experiment was to test whether plants enhanced the
biodegradation of petroleum oil and to asses the potential role of rhizosphere microbes
in the degradation of petroleum hydrocarbons. The natural soil used in this experiment
has low percentages of mineral nutrients and clay. The pH was 8.4 and the ability of
these soils to hold water is very limited. These factors not only make these soils support
limited plant growth, it also means that microbial activity is normally low.
Results of this study clearly showed that petroleum hydrocarbons contamination
reduced seed germination and plant growth rate. Petroleum crude oil caused significant
inhibition of maize seed germination (40.2% decrease) and a 47.1 o/c decline in the plant
height and caused inhibition of the shoot and root dry weights of 17.7 and 2.+.4%
respectively.
These results were in line with those of Ekundayo et al., (2001) who assessed
the effect of crude oil on the growth of maize in a pot experiment and found that in
crude oil polluted soil, percentage germination and plant growth were significantly
lower compared to the non-polluted control. These authors found that grain yield was
reduced by as much as 96.5 % in crude oil contaminated soil after 7 weeks. Hydrocarbon
molecules can penetrate into plant tissues and damage the cell membranes causing
leakage of cell contents and blocking intercellular spaces reducing metabolite transport
and respiration rates (Xu and Johnson,1995). The toxic effect on germination and plant
growth may be due also to the soil's hydrophobicity (Li et al., 1996). Other researchers,
such as Amakiri and Onofeghara (1984). Adam and Duncan (2002) and Shahriari et aI,
(2007) also confirmed the toxic influence of petroleum crude oil on seed germination
and plant growth.
In the experiment reported here, petroleum crude oil added to soil had also an
inhibitory effects on the total heterotrophic bacterial populations in the rhizosphere of
maize plants and in non-rhizosphere soil. The percentage reduction for the total
heterotrophic bacterial counts as a result of petroleum oil pollution were 91 and 82<7c in
the rhizosphere and in soil respectively.
Petroleum crude oil may limit the accessibility of nutrients to microorganisms
by reducing the availability of water in which the nutrients are dissolved
- 57 -

(Schwendinger, 1968). The initial drop in the total heterotrophic counts in the
contaminated soil sample in the beginning of experiment could be attributed to selective
inhibition of non-resistant members of the microbial community which are sensitive to
the toxic components of petroleum and also could suffer from reduced aeration.
The data presented here clearly show that the number of hydrocarbon degraders
was higher in the rhizosphere of maize plant than in non-rhizosphere soil. The same
results were also obtained by Ebuehi et al. (2005). This suggests that plant root
exudates provide soil microorganisms capable of degrading hydrocarbons with nutrients
such as organic acids, sugars and amino acids that are essential for the mineralization of
hydrocarbons (Singer et ai., 2003).
Soil texture affects phytoremediation by influencing the bioavailability of the
contaminant (Frick et ai., 1999). For example, Carmichael and Pfaender (1997) found
that soils with larger particls (e.g. sand) had greater mineralization of PAHs than soils
with smaller particles (e.g. silt and clay), possibly due to the greater bioavailability of
the contaminants in the sandy soil. As the soil used here consisted mainly of sand this
would likely result in high bio-availability of petroleum hydrocarbons. It appeared that
maize plants cultivated in soil contaminated with petroleum crude oil was highly
effective in increasing hydrocarbon degradation. Our results confIrm those of previous
studies by Anderson et al. (1993), Gunther et al. (1996), Hutchinson et al. (2003) and
Kirk et ai. (2005).
Result of this study showed that maize plants significantly increased the mean
degradation rate of petroleum hydrocarbons by 36% during the first 4 weeks after
planting. Various studies have shown that hydrocarbon degradation can occur through
phytoremediation. The influence of the maize rhizosphere on petroleum hydrocarbon
degradation was evaluated in laboratory soil experiments by Chaineau et al. (2000).
These authors found that the presence of maize increased the biodegradation from day
20 to day 80 and the removal of hydrocarbon in the presence of plants was 20O/C faster
than in the non-vegetated soil. These results are in line with those obtained by Walton et
al. (1994), Nedunuri et al. (2000), Pichtel and Liskanen (2001), Palmroth et al. (2002)
and Shahriari et al. (2007).
This suggests the bioremediation of polluted sand soil can be enhanced by
planting soil contaminated with hydrocarbons with maize plants.
- 58-

CIIA.PTER. FI"VE
Effect of Trichoderma harzianum (strain T22) on plant growth and hydrocarbon degradation in soil polluted with petroleum crude oil
5.1 Introduction
Trichoderma harzianum (T22) has potential in stimulating phytoremediation
directly and indirectly and therefore inoculation of plants with this fungus could be a
feasible approach to enhance the degradation of hydrocarbons in polluted soil.
Trichoderma har~ianum (T22) was shown to break down anthracene completely to
carbon dioxide using 14C-Iabeled anthracene. The fungus also physically adsorbed
>80% of added anthracene (Errnisch et al .. 1990). Also, species of Trichodenna that
were tolerant to pyrene and phenanthrene have been isolated from contaminated
estuarine sediments (da Silva et ai., 2003).
T.harzianum (T22) can solubilize metal ions and produce siderophores to chelate
iron, making metal ions required for plant growth more available to the plant (Harman
et ai., 2004). The fungus is thought to colonize roots of annual plants for their entire
lifetime by penetrating the outer layers of the roots (Harman et al., 2004). This may
make the plants release more root exudates to the surrounding soil, thus stimulating
microbial degradation of pollutants.
T22 has been shown to induce the production of larger and deeper root systems,
and plants inoculated with T22 also produce greater plant biomass. Such plants are
more resistant to abiotic stress and take up nutrients more effectively (Harman et al.,
2004). This would be especially useful in situations that are arid, such as the desert
regions of Saudi Arabia.
5.2 Materials and Methods
A greenhouse experiment using different concentrations of petroleum crude oil was set
up to study if T.har~ianum strain (T22) enhanced plant growth and stimulated microbial
communities of bacteria and fungi in soil contaminated with petroleum crude oil. In this
- 59-

experiment maize, sunflower, acacia were used as test plants. For each plant species the following treatments were used.
1. Soil + N.P.K
2. Soil + T22 + N.P.K.
3. Soil + N.P.K. + crude oil at 10,000 ppm
4. Soil + T22 + N.P.K. + crude oil at 10,000 ppm 5. Soil + N.P.K. + crude oil at 30,000 ppm
6. Soil + T22 + N.P.K. + crude oil at 30,000 ppm
7. Soil + N.P.K. + crude oil at 50,000 ppm
8. Soil + T22 + N.P.K. + crude oil at 50,000 ppm
9. Soil + N.P.K. + crude oil at 75,000 ppm
10. Soil + T22 + N.P.K. + crude oil at 75,000 ppm
11. Soil + N.P.K. + crude oil at 100,000 ppm
12. Soil + T22 + N.P.K. + crude oil at 100,000 ppm
13. Soil + N.P.K. + crude oil at 150,000 ppm
14. Soil + T22 + N.P.K. + crude oil at 150,000 ppm
Four replicates were used for each treatment and pots were arranged in a
complete randomised design according to replicate. Fifteen seeds of each plant species
were planted in each pot. As in the previous experiments, the number of plants, plant
height, number of leaves, and dry weights of both shoot and roots were measured at the
end of the experiment. The results from each plant species were analyzed separately.
The obtained data were SUbjected to analysis of variance (ANOVA) and the significance
of differences between treatments was assessed using LSD values. Soil samples were
taken at the end of the experiment to quantify total bacterial and total fungal populations
using methods described previously.
- 60-
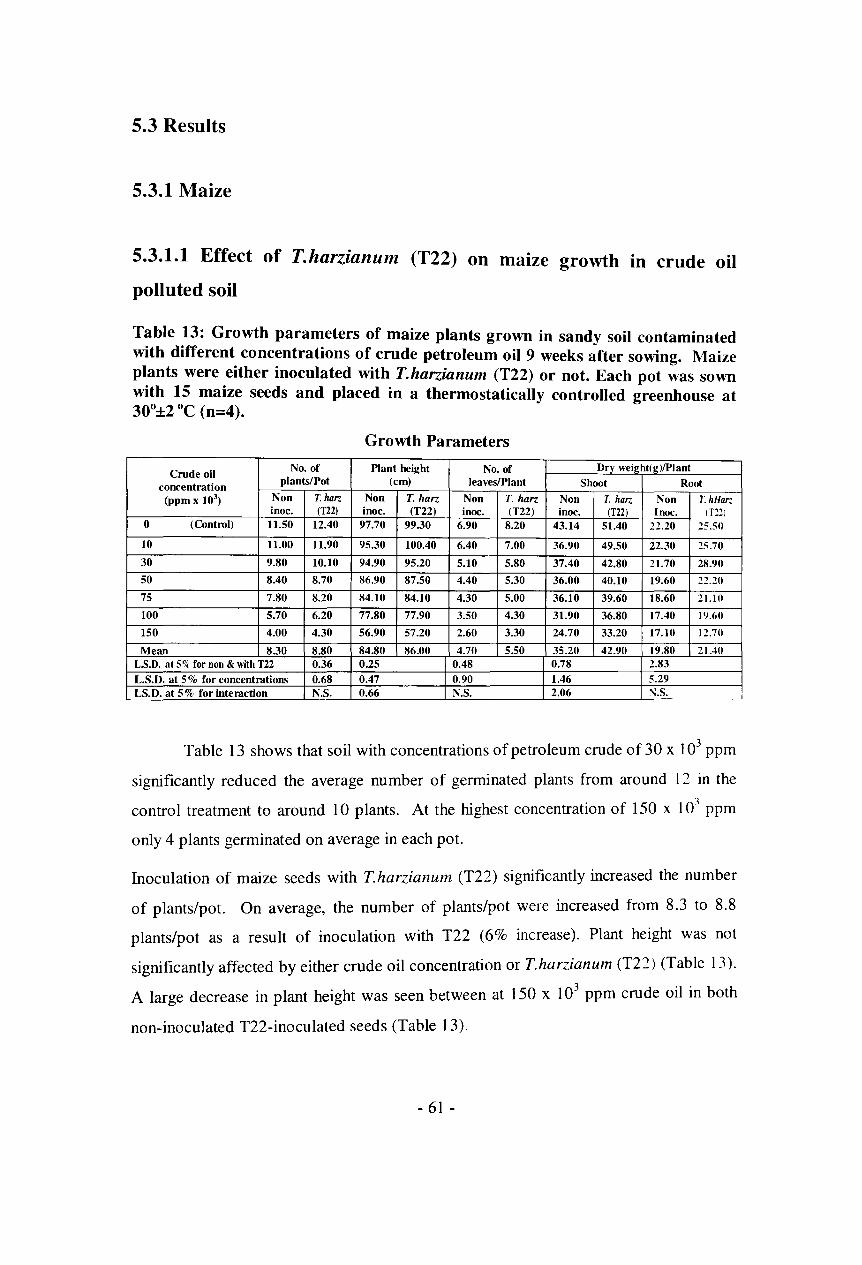
5.3 Results
5.3.1 Maize
5.3.1.1 Effect of T.harzianum (T22) on maize growth in crude oil
polluted soil
Table 13: Growth parameters of maize plants grown in sandy soil contaminated with different concentrations of crude petroleum oil 9 weeks after sowing. Maize plants were either inoculated with T.harzianum (T22) or not. Each pot was sown with 15 maize seeds and placed in a thermostatically controlled greenhouse at 30o±2°C (n=4).
Growth Parameters
Crude oil No. of Plant height No. of Drv wei2ht(2)lPlant
concentration plants/Pot (cm) leaves/Plant Shoot Root
(ppm x 103) Non T. harz Non T. harz Non T. harz Non T. harz Non T. hHar..
inoc. (T22) inoc. (T22) inoc. (T22) inoc. (T22) Inoc. IT221 0 (Control) 11.50 12.40 97.70 99.30 6.90 8.20 43.14 51.40 22.20 25.50
10 11.00 11.90 95.30 100.40 6.40 7.00 36.90 49.50 22.30 25.70
30 9.80 10.10 94.90 95.20 5.10 5.80 37.40 42.80 21.70 28.90
50 8.40 8.70 86.90 87.50 4.40 5.30 36.00 40.10 19.60 22.20
75 7.80 8.20 84.10 84.10 4.30 5.00 36.10 39.60 18.60 2l.1 ()
100 5.70 6.20 77.80 77.90 3.50 4.30 31.90 36.80 17.40 19.60
150 4.00 4.30 56.90 57.20 2.60 3.30 24.70 33.20 17.10 I2.70
Mean 8.30 8.80 84.80 86.00 4.70 5.50 35.20 42.90 19.80 21040 L.s.D. at 50/( for non & with T22 0.36 0.25 0.48 0.78 2.83
L.S.D. at 5 % for concentrations 0.68 0.47 0.90 1.46 5.29 LS.D. at 5 % for interaction N.S. 0.66 N.S. 2.06 r>;.S.
Table 13 shows that soil with concentrations of petroleum crude of 30 x 103 ppm
significantly reduced the average number of germinated plants from around 12 in the
control treatment to around 10 plants. At the highest concentration of 150 x 103
ppm
only 4 plants germinated on average in each pot.
Inoculation of maize seeds with T.harzianum (T22) significantly increased the number
of plants/pot. On average, the number of plants/pot were increased from 8.3 to 8.8
plants/pot as a result of inoculation with T22 (6% increase). Plant height was not
significantly affected by either crude oil concentration or T.harzianum (T22) (Table 13).
A large decrease in plant height was seen between at 150 x 103
ppm crude oil in both
non-inoculated T22-inoculated seeds (Table 13).
- 61 -

Application of T.harzianum (T22) had a significant effect on the number of
leaves/plant which increased on average from 4.7 leaves per plant in the control to 5.5
leaves in the T22 treated plants (an increase of 17%). Also, the dry weights of shoots
and roots were significantly greater in plants inoculated with T22. Shoot weight
increased from an average of 35.2 to 42.9g1plant while root weight increased from 19.8
to 21 .4 glplant as a result of inoculation with T22
5.3.1.2 Effect of T.harzianum T22 on bacterial and fungal population in
crude oil polluted soil
Table 14: Average numbers of bacterial and fungal propagules (expressed as log cfulg) in soil contaminated with different concentrations of petroleum crude oil 9 weeks after sowing. Maize plants were either inoculated with T.harzianum (T22) or not. Counts were measured by dilution plating method on soil extract agar for bacteria and Martin's medium for fungi (n=4).
o
Concentrations (ppm x 103
)
Means of concentrations L.S.D. at 5% for non & inoc. L.S.D. at 5 % for concentration L.S.D. at 5 % for interaction
6.70
6.40
Total bacerial counts Total fungal counts T. IUJrz
Non inoc. Non Inoc. inoc. T. IUJrz inoc.
7.10 3.00 4.30
6.70 2.80 3.70 0.02 L.S.D. at 50/( for non & inoc.
f..-.':'-'0.0'::":3'-------l L.S.D. at 5 % for concentration - 0.02
0.03
= 0.05 L.S.D. at 5 <;( for interaction 0.05
Bacterial counts per gram soil in the non-polluted control treatment (0) were 2.5
times greater (P < 0.05) in T22 inoculated soil than in non-inoculated soil, while fungal
counts were almost 20 times greater (P < 0.05) in inoculated soil compared with in non
inoculated soil (Table 14). Whereas, populations of both bacteria and fungi in crude oil
polluted soil were in general lower than in non-polluted soil, inoculation with T22
increased numbers of both groups of organisms in all crude oil polluted treatments.
Overall inoculation with T22 increased bacterial counts two fold (P < 0.05) and fungal
populations eight fold (P < 0.05).
- 62-

5.3.2 Sunflower
5.3.2.1 Effect of T.hanianum (T22) on sunflower growth in crude oil
polluted soil
Table 15: Growth of sunflower plants grown on sandy soil contaminated with different con~entra.tions of cru~e petroleum oil 9 weeks after sowing. Sunflower pl.ants were eIther moculated WIth T.harzianum (T22) or not. Each pot was sown WIth 15 sunflower seeds and placed in a thermostatically controlled greenhouse at 3oo±2°C (n=4).
Growth Parameters
No. of leaveslPlant Dry weight(g)!PIant
Crude oil concentration (ppm x 103
)
No. of PlantslPot
Plant height (em) Shoot Root
Non : T.lwrz inoe. '(T22)
Non 'T. Iwrz Non T. harz Non T. Iwrz inoe. : (T22) inoe. (T22) inoe.· (T22)
o (Control) 12.10 i 12.70 .... '" ._ .... _____ ._ ~._, .... _ ... ___ .................. _._ ...... 1. __ .. _. __ . __ ._ 26.60_J_:?_~~~_. __ .. 6.90 i 8.30_1_~~~~_j:~.~0
27.10 27.60 '-6j-O--'--"'-r-6~SO--"--- 16.20 '18.00 10 10.30 10.60
24.00 ;24.90 . ! 3.40 i 4.00 17.801 16.40 50 22.30 22.60 .. "3j-o----t-iso-·-·-----i4-:-io---i -is. 20
9.30 9.70 .........
9.30---8.90
30
......... -.-.-----.- .•. -. "'-' "'--" -··)···-c·-----·---j·· --"'--'---'-'- .. -,-.. -.. -.. -.-... -.. -.-.. --. ..-.. --.. -.. -... -.-j -'-"'-" ... -.. "'-" ....... .
75 15.40 16.00 2.80 '3.40 13.60' 13.90 --_._._.-
9.00 9.30
)lion inoe. 7.08
.. -6.30
T. ha17. (T2:!)
: lIAO I 10.30 .... --.-.
7.80_ i_?~?_ 7.50 . 8.80
8.00 8.80
::: :~:o:::::~~~~::·::::: ::::.~::_ ::::~:.:~~-:: ··::::j::~:~~~:~::~f ..... ~3.~~~ .. "._ .. ;",, __ 13 .... _._9 __ 0_. __ .. ""-i~9-0--·--"T·i50·-"-···--" "··iiio-·--T"j 4. iii "7.6-0 -. ["Sj!O--·- .. --. IS 6.30 I 7.10 11.20 11.30 ·-i:s-o·-·--·-i-·iso-·---·-9.IO-·--j--i2.so .... - -5-.(;0.----1-830-------o Means 9.30 9.70 20.00 20.50 37.50 1 44.60 14.60 116.30 7.10 1 9.40
L.S.D. at 5% for non & 0.39 0.48 0.36 0.47 0.67
with.!~~...._ ..... _ ... _. __ .... + ___ _ L.S.D. at 5% for 0.73 0.90 0.68 0.82 1.25
concentrations ................................•... --...
LS.D. at 5% for N.S. N.S. N.S. 1.16 1.76 interaction
Petroleum crude oil reduced germination of sunflower seeds of T22 T.har:ianum
inoculated and non-inoculated plants (Table, 15). Inoculation of sunflower seeds with
T22 slightly increased the number of plants/pot from 9.3 to an average of 9.7 plants/pot
(4.3% increases). Plants grown in petroleum oil contaminated soil that were treated
with T.harzianum (T22) were slightly taller (2.5%) than the corresponding plants that
were not inoculated with T22. However this difference was significant. Table 15 also
shows that as the concentration of petroleum crude oil increased, the number of
leaves/plant decreased. Inoculation of sunflower seeds with T.harzianum (T22)
significantly increased the average number of leaves/plant at all concentrations of
petroleum oil.
- 63 -
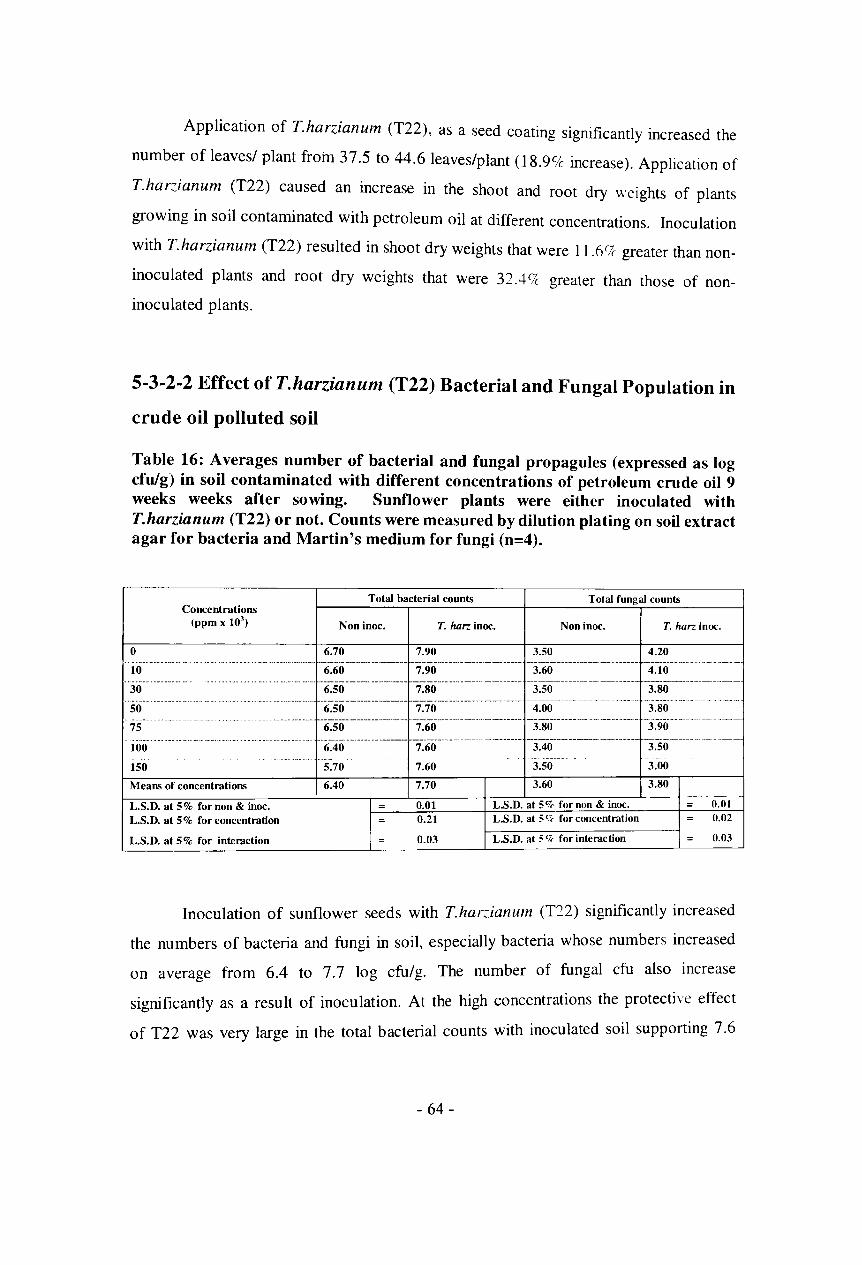
Application of T.harzianum (T22), as a seed coating significantly increased the
number of leaves/ plant from 37.5 to 44.6 leaves/plant (l8.9CJc increase). Application of
T.harz,ianum (T22) caused an increase in the shoot and root dry weights of plants
growing in soil contaminated with petroleum oil at different concentrations. Inoculation
with T.harzianum (T22) resulted in shoot dry weights that were 11.6CJc greater than non
inoculated plants and root dry weights that were 32.4CJc greater than those of non
inoculated plants.
5-3-2-2 Effect of T.harzianum (T22) Bacterial and Fungal Population in
crude oil polluted soil
Table 16: Averages number of bacterial and fungal propagules (expressed as log cfo/g) in soil contaminated with different concentrations of petroleum crude oil 9 weeks weeks after sowing. Sunflower plants were either inoculated with T.harzianum (T22) or not. Counts were measured by dilution plating on soil extract agar for bacteria and Martin's medium for fungi (n=4).
o
Concentrations (ppm x 103
)
Total bacterial counts
Noninoc. T. harz inoc.
6.70 7.90
Total fungal counts
Noninoc. T. harz inoc.
3.50 4.20 .. i 0······· ...... ...... ....... ............... ............... ·'6:60'·'-'·"·"·-··---·'-·":9·0"·"·'·'·'·-'·'--·-·.--- -i·60-··-····-------·-·--··- -4."iO····-····-·_-·-
30
50
75
6.50 7.70 4.00
....... _ ... 100
.......................... 6:40'- .... -.. ---.. - ··7:6·0-··· -_ .. _.-.. --.- ·'3:40' -.- --.- --_._--.
150
Means of concentrations
L.S.D. at 5% for non & moe. L.S.D. at 5% for concentration
L.S.D. at 5% for interaction
._ ... -5.70
6.40
7.60
7.70
0.01 0.21
0.03
3.50
3.60
L.S.D. at 5'7< for non & inoc. L.S.D. at 5 '7( for concentration
L.S.D. at 50/( for interaction
3.80
3.80
3.90
3.50 - ..
3.00
3.80
(1.01 0.02
0.03
Inoculation of sunflower seeds with T.har:ianum (T22) significantly increased
the numbers of bacteria and fungi in soil, especially bacteria whose numbers increased
on average from 6.4 to 7.7 log cfu/g. The number of fungal cfu also increase
significantly as a result of inoculation. At the high concentrations the protective effect
of T22 was very large in the total bacterial counts with inoculated soil supporting 7.6
- 64-

log cfu/g soil while soil that was not inoculated supported only 5.7 log efu/ g soil (a
reduction of 99%).
5.3.3Acacia
5.3.3.1 Effect of T.harlianum (T22) on acacia growth in crude oil
polluted soil
Table 17: Growth parameters of acacia plants grown in sandy soil contaminated with different concentrations of crude petroleum oil 9 weeks after sowing. Maize plants were either inoculated with T.harzianum (T22) or not. Each pot was sown with 15 acacia seeds and placed in a thermostatically controlled greenhouse at 300±2°C (n=4).
Crude oil concentration
(ppm x 103)
No. of plants/Pot
Plant height (em)
No. of leavesIPlant
T. Non T. Non T. Non inoc. Harz inoc. Harz inoc. Harz
(T22) (T22) (T22)
Non inoc.
Dry weight (g)/ Plant
Shoot
T. Harz (T22)
I\on inoc.
Root
T. Harz (T22)
0_('~~~~~~_1._~·80 1 10.20 ._~~~_~~_. __ L.~!:~_~ __ ~.50 l 6.70 _ __ ~::~_~ __ L!_~~~~____ 8.60 10.90 10 10.20 10.80 17.90 i 18.70 4.40·--~·--5:40 13.60' 14.50 "8:1I)-----"-io:50--
... -.... _ ............ _ .. _ .............. -...... _._ .............. -.. "'-'"'' ... _ .... _ ....... -....... -.. -.-.-.. -.. -... _ .. __ ._ ... _ ...... _ ..... ;_ ..... _ ... _._.- ..... _.. . ... _.. --_._ ... -._ ..... -'---_ .. _. __ . __ ... - -. __ ._ .. _--_ .. _ ... _._ .. _._ .. _._ ... -30 8.80 • 9.20 13_20 i 13.90 3.20 4.20 12.10: 13.50 9.20 9.60
... 5'0" ......... - ......... "'" ..... 7.90:8·:40-"- "i3:10" ' .. 1i80"" .. 2.80 3.30-'-' '-I-ii:4'O-t-li~60--'--8jio-----'-'9:00-'"
7 5 .. ·.::::: .:"~"::"::: .. ::.:.:':?~~? ·.·t?:~:?~:·-·- ·'i2.-00' !ii 10 ........ 1.90 ";'2.50-- ., .. !..!?:~~: .. 1 :!~~~~:~~:~ -8:3!.:·:~~I:~~~?~_~·:: 100 .......... _ .......................................... _~.~I_~ ....... L~.~~_~_._ .. :.~'.~?~~:~::.:.:J.~~'?~-"-' 2.20 . _ .. ", ._~:.~O___" _~!~ ____ ..L .. !_~~~~_____ 7.30 8.60 150 5.10 ! 5.60 8.80 i 9.80 1.50 2.00 7.60 i 8.90 5.60 7.60
MeaJl<; 7.70 830 13.50: 14.40 3.10 3.80 10.60 12.30 8.00 • 9.30
L.S.D. at 5% for non & with T22 0.42 0.11 0.43 1.46 0.55
L.S.D. at 5% for concentrations 0.79 0.21 0.81 2.74 1.02
LS.D. at 5 % for interaction N.S. 0.30 N.S. N.S. KS.
Similar results and trends were obtained as mentioned before concerning the
effect of different concentrations of petroleum oil on the plant growth parameters of
maize and sunflower plants. Inoculation of acacia seeds with Thar:ianum (T22)
significantly increased the number of plants/pot from 7.7 to 8.3 plants/pot.
The heights of plants inoculated with T har:ianum (T22) were greater than those
that were not inoculated. On average, plant height was increased from 13.5 to 14.4 em
(P<O.05) as a result of inoculation with Tharziallum (T22). Similarly, inoculation with
T22 increased the number of leaves/plant from an average of 3.1 leaves per plant to 3.8
leaves per plant. Also, application of Tharzianum (T22) had a significant effect on the
- 65 -

shoot and root dry weights which were both on average 16o/c heavier, as a result of
inoculation with T22.
5.3.3.2 Effect of T.harzianum (T22) Bacterial and Fungal Population in
crude oil polluted soil
Table ~8: ~verage n~mbers ~f ba~terial and fungal propagules (expressed as log cfu/g) III soil contaInlnated WIth dIfferent concentrations of petroleum crude oil 9 weeks after sowing. Acacia plants were either inoculated with T.harzianum (T22) or not. Cfus were measured by dilution plating on soil extract agar for bacteria and Martin's medium for fungi (n=4).
Concentrations Total bacterial counts Total fungal counts
(ppm x 103) Noninoc. T. harz inoc. Noninoc. T. harz inoe.
0 6.70 6.70 3.40 -t.30
10 6.60 6.60 3.60 4.00
30 6.30 6.50 3.80 3.80
50 6.20 6.50 3.90 3.70
75 6.10 6.50 4.00 3.70
100 5.90 6.40 3.30 3.50
150 5.90 6.00 3.30 3.10
Means of concentrations 6.20 6.50 3.60 3.70
L.S.D. at 5% for non & inoc. = 0.03 L.S.D. at 5% for non & inoe. = 0.02
L.S.D. at 5% for concentration = 0.06 L.S.D. at 5 c;;. for concentration = 0.03
L.S.D. at 5% for interaction = 0.09 L.S.D. at 5 C7( for interaction = 0.03
It is clear from the Table 18 that inoculation of acacia seeds with Tharzianum
(T22) as a seed coating increased the total bacterial and fungal counts in the non
polluted control treatment. The cfu numbers of total bacteria in soil with Thar:.iallum
(f22) coated and uncoated acacia seeds were reduced by petroleum contamination
resulting in a 5-fold reduction in the cfu count at a petroleum concentration of 150 x 103
ppm compared with the non-polluted control treatments In the non-inoculated
treatments, fungal cfu counts increased up to 5 fold with increasing petroleum
contamination with a maximum count at 75,000 ppm, but at higher concentrations cfu
counts were similar as for the non-polluted control. In treatments inoculated with
Tharzianum the fungal cfu count decreased with increasing petroleum concentrations to
a level that was around 4 times lower than the non-polluted control.
- 66-

5.4 Discussion
Maize, sunflower and acacia have been chosen as they were shown to tolerate
contamination with petroleum crude oil. It was clear from the data obtained that
introducing Trichoderma T22 as a seed coat promoted plant growth, increasing the
mean numbers of plants/pot, mean plant heights (crn/plant), leaves number (no./plant)
and shoot and root biomass of maize, sunflower, and acacia compared with the non
inoculated controls.
The present study indicates that Trichoderma T22 provides protection against
the toxicity of petroleum crude oil. Plants inoculated with T22 grew better than non
inoculated plants. The shoot and root dry weights were increased by a mean a\'erage of
21.8% and 8% for maize, 11.6 and 32.4% for sunflower and 16 and 160t for acacia,
respectively. Even at the two higher concentrations of petroleum oil (100,000 and
150,000 ppm), better plant growth was obtained with T22 inoculated plants than with
those that were not inoculated. The reasons why Trichodenna protects plants against
hydrocarbon toxicity are not clear. Greensmith (2005) reported that T.har;,ianum (T22)
increased bioavailability of phenanthrene, suggesting that plants inoculated with T22
could be exposed to higher levels of hydrocarbons. It is possible that (T22) solubilized
plant nutrients leading to increased plant growth. It is therefore more likely that
increased plant growth resulting from inoculation with Trichodenna T22 is independent
of pollution but is simply the result of the fungus acting as a plant growth promoting
agent in both polluted and non-polluted soil.
Data also showed that (T22) when applied as a seed coating, significantly
increases the total bacterial and fungal counts in non-polluted or petroleum-polluted soil
of maize, sunflower and acacia plants. Studies by other investigators reported that there
are conflicting reports on the effectiveness of inoculating contaminated soil with
microorganisms. However, these results are in line with the limits given by Amadi and
Odu (1993) who reported an initial gradual increase in microbial population size
following the application of petroleum hydrocarbon followed by a decline as the
biodegradation progressed.
On the other hand, (Radwan et at., 1997) found that the population of
indigenous, oil degrading Arthrobacter in sand treated with crude oil at a rate of 20r:(
(w/w) decreased dramatically following inoculation with non-indigenous oil degraders.
- 67-

Other studies have found that inoculation enhances degradation of petroleum
hydrocarbons (Ford et ai., 1999; da Silva et ai., 2003; Gomez et aI., 2003 ; Zhang et al.,
2005).
The present results indicate that inoculation of seeds with (T22) enhanced and
caused a proliferation of the bacteria and fungi in soil contaminated with petroleum
crude oil. This might be due to the fact that Trichodenna (T22) increased the
bioavailability of some hydrocarbon components leading to a larger population of
hydrocarbon degraders.
- 68-

C~PTER. SI:X Effect of Trichoderma harzianum (strain T22) inoculated maize plants
on the degradation of petroleum crude oil in soil
6.1 Introduction
Among the positive effects of Trichodenna on maIze that have been noted
included are the following (Harman et ai., 2004 and Harman, 2006):
a) Control of root and foliar pathogens
b) Changes in the micro flora composition on roots
c) Enhanced nutrient uptake of plants
d) Enhanced solubilization of soil nutrients
e) Enhanced root development
f) Increased root hair formation
g) Deeper rooting
T.harzianum (T22) has most potential in stimulating phytoremediation indirectly
and therefore, inoculation of plants with this fungus could be a feasible approach to
enhance the degradation of hydrocarbons in polluted soil. By inoculating this fungus
into the rhizosphere, the inoculants might also protect the plants from the toxic effects
of the contaminants, i.e., it has been reported that T22 can break down anthracene
completely to carbon dioxide or was found to adsorb > 80% of added anthracene.
(Ermisch et al., 1990).
Successful inoculation requires sufficient microbial biomass that can survive in
the root zone of an actively growing plant in the soil environment where survival of the
inoculants is likely to be high and the inoculant may show good colonization capacity
and survival on the roots of selected species for prolonged periods of time (Femet,
2008). The survival of plants and inoculants is a deciding factor in the rate of
degradation of hydrocarbons (Mishra et ai., 2001).
Any contact with crude oil results in damage to soil conditions of agricultural soiL
microorganisms and plants. (Onuoha et ai., 2003). These authors also reported that
- 69-

concentration of crude oil of >3% in an environment, crude oil becomes increasingly
deleterious to soil biota and crop growth. In Nigeria, Adedokun and Ata£a (2007)
reported that addition of Pleurotus pulmonarium as a bioaugumentation agent to crude
oil-pollu ted soil significantly increased seed germination from 60 to 96 7c. increased
plant height from 10.3 to 22 cm and increased biomass production from 0.5 to 1.5g dry
wt per plant. In addition to direct degradation of oil, fungi may enhance oil degradation
indirectly by improving plant performance (Marx and Artman, 1979 ; Castellano and
Trappe, 1985). Because most fungal species are sensitive to oil, this positive effect can
be diminished in heavily polluted soils. Terrestrial studies that have been conducted in
arctic and subarctic environments, petroleum oil has been shown to stimulate the growth
of filamentous fungi, yeasts and heterotrophic bacteria. (Campbell et at., 1973 ; Sparrow
et al., 1978).
The objective of the present study was to investigate the effect of inoculation of
maize plants with the fungus T.har-;.ianum (T22) on maize plant growth and quantify if
bacterial and petroleum hydrocarbon degraders are increased petroleum crude oil
degradation in rhizosphere soil.
- 70-

6.2 Materials and Methods
An experiment with maize seeds (cv. Egypt 6) was conducted in a greenhouse
using petroleum crude oil at concentration of 75g/kg soil. To assess the phytotoxicity of
the petroleum crude oil in soil. The soil represents the upper 25 cm layer of Wadi F atma
region, eastern part of Jeddah City, Saudi Arabia. The soil was analyzed for main
physical and chemical properties according to USDA (2004) in evaluation and
remediation of soil and plants pollution unit N.R.C, Cairo Egypt (Table, 19).
Table 19: Physical and chemical properties of the used soil prior to remediation and cultivation .The soil represents the upper 25 cm layer of Wadi Fatma region, eastern part of J eddah City, Saudi Arabia.
Parameters Values % A. Physical Properties:
Very coarse sand 11.20 Coarse sand 8.30 Medium sand 16.00 Fine sand 39.60 Very fine sand 15.40 Silt+c1ay 9.50 Texture class Sandy soil Saturation rate 27.30%
B. Chemical Properties:
pH (1:2.5) * 8.46
EC.dS m·l ** 1.62 2.23
CaC03 % 0.46 Organic matter % 0.00 C03·> (ppm)
250.1 HC03> (ppm) 227.2 crl (ppm) 180.0 Ca++ (ppm) 93.6 Mg++ (ppm) 155.0 Na+ (ppm) 31.20 K+ (ppm)
C. Total N.P.K: N (ppm) 127.00
P (ppm) 0.06
K (ppm) 0.20
* = is the ratio of soil to water
** = decisemens per meter
The soil consisted for 90.5 % of sand. Both CaC03 and organic matter content
1 2 23 d 0 46o/t: respectively The EC of the soil extract (1.62 ds mol) were very ow; . an . 0 .
indicates slight salinity, whereas the nutrient status of the soil was very poor with N.P.K
contents of 127,0.06 and 0.20 ppm, respectively.
- 71 -

A commercial formulation of T.harzianum strain T22 was dusted onto maIZe
seeds (15 seeds per pot), resulting in a thin film of spores on the seed surface. This is the
method of commercial application for the EPA-registered products. The petroleum
crude oil was added to the soil before sowing. Therefore, the treatment for each planted
and non-planted pots were as follows:
Soil without treatment
Soil and crude oil
Soil and T.harzianum
Soil and crude oil and T. hari;:janum
Four replicates were used for each treatment and pots were arranged in a
randomized block design according to replicate. Soil moisture was maintained at
constant level of 60% water holding capacity of the soil during the course of experiment
(8 weeks). The percentage germination, plant height and shoot and root dry biomass
were measured as mentioned before in the previous experiment. Soil samples were
taken from the rizosphere soil and non-rhizosphere soil at harvest at the end of the
experiment to estimate the number of culturable bacteria and hydrocarbon degrading
bacteria. Also, soil samples from the polluted pots were taken for hydrocarbon analysis
using GC-MS analysis as mentioned previously. The obtained results were subjected to
analysis of variance (ANOV A) and the significance of differences between treatments
was assed using LSD values.
6.3 Results
6.3.1 Germination, growth and biomass
- 72-

Table 20: Effect of inoculation with Trichoderma harzianum (T22) as a seed treatment on some growth parameters of maize plants grown in soil polluted with petroleum crude oil at (7Sg/kg soil), for 8 weeks in greenhouse at 30o±2°C (n=4).
) Seed germination % and plant height (cm) Seed germination % Plant height (em) Gro,,1h rate
Time (week) Polluted NonpoUuted Mean effect Polluted NonpoUuted Mean effect cml2 week
T22 Without T22 T22 WithoutT22 of time T22 Without T22 T22 Without T22 of time Polluted Non polluted
2 67.50 52.50 90.00 82.50 73.13 9.28 7.84 35.42 22.65 18.80 8.56 29.03 4 67.50 52.50 90.00 82.50 73.13 24.38 19.36 45.95 35.48 31.29 13.31 11.68 6 67.50 52.50 90.00 82.50 73.13 44.30 37.33 74.44 57.38 53.36 18.95 25.20 8 67.50 52.50 90.00 82.50 73.13 69.89 51.40 101.52 89.52 78.08 19.83 29.60 Polluted X T22 67.50 52.50 90.00 82.50 36.96 28.98 64.33 51.26 15.16 1 23.88 Mean effect of polluted 60.00 86.25 32.97 57.79 Mean effect of T22 78.75 67.50 50.64 40.12 LSD at 0.05 for time N.S 1.85 8.04 LSD at 0.05 for~olluted 2.05 1.31 5.69 LSD at 0.05 for T22 2.05 1.31 ..
--LSD at 0.05 for pollutedxT22 3.08 1.85 .. LSD at 0.05 for interaction N.S 3.70 N.S
b) Shoot and root dry biomass weight (g/plant): Shoot dry weight (glplant). Root dry weight (g/plantl. Weight rate gl2 week
Time (week) Polluted Non polluted Mean effect Polluted Non polluted Mean effect (Root)
T22 Without T22 T22 Without T22 of time T22 Without T22 T22 Without T22 of tillle Polluted Non pollllted
2 13.31 9.20 20.90 17.36 15.19 4.22 3.21 10.17 5.51 5.78 3.71 7.84 4 21.44 18.35 38.32 25'()4 25.79 7.83 6.14 16.74 9.92 10.16 3.27 5.49 6 31.79 28.23 45.77 39040 36.30 13.51 10.11 20.16 15.33 14.78 4.82 4.42 8 37.72 33.60 55.13 47.52 .. U.49 19.99 16.75 23.54 20.14 20.1() 6.56 4.09
Polluted X T22 26.06 22.34 40.03 32.33 11.39 9.05 17.65 12.72 4.59 I 5046
Mean etTect of polluted 24.20 36.18 10.22 15.19
Mean etTeet of T22 33.04 27.34 14.52 10.89 LSD at 0.05 for time 0.03 ().O8 N.S LSD at 0.05 for jlnlluted 0.02 0.06 N.S LSD at ().OS for 1'22 0.02 ().O6 .. LSD at 0.05 for pollutedxT22 0.03 0.08 .. LSD at 0.05 for intuaetion 0.06 0.16 N.S
- 73 -

Table 20 shows that crude oil pollution significantly decreased the percentage
germination by 26% from 86% to 60% .Inoculation of polluted and non-polluted soils
with T.harzianum (T22) significantly enhanced the percentage germination of maize
seeds. In petroleum crude oil-polluted soil, T22 inoculation improved seed germination
from 52.50 to 67.50% (15% increases), while seed germination in non-polluted soil was
improved from 82.50 to 90.00% (8.50% increase).
The crude petroleum oil was toxic to maize plants (Table 20). Pollution of soil
with crude oil significantly decreased plant height from 57.8 to 33.0 cm/plant (430'('
decrease). Inoculation of polluted and non-polluted soils with T.har:ian1l11l (T22)
significantly increased plant height of maize seedlings. In polluted soiL the inoculation
increased plant height from 29.0 to 37.0 cm/plant (27.5% increases) and from 51.3 to
64.3 cm/plant (25.5% increase) in non-polluted soil. Inoculation of crude oil polluted
and non-polluted soils with T22 significantly enhanced the formation of shoot and root
biomass. Inoculation of polluted soil with T.har;:.ianllln significantly increased the shoot
dry weights from 22.3 to 26.1 g/plant (16.7% increase) and root dry weight from 9.1 to
11.4 g/plant (25.3% increase). In addition, inoculation of non-polluted soil with T22
significantly increased the shoot dry biomass from 32.3 to 40.0 g/plant (23.8% increase)
and the root dry biomass from 12.7 to 17.7 g/plant (38.8% increase).
In general, inoculation of maize seeds with T22 resulted in a significant increase
in the shoot and root dry weights of plants grown in polluted and non-polluted soil
(main effect). Inoculated plants had 20.9% more shoot biomass and 33.3% more shoot
biomass (Compared with non-inoculated plants).
6.3.2 Total bacterial counts in rhizosphere and soil
- 74-
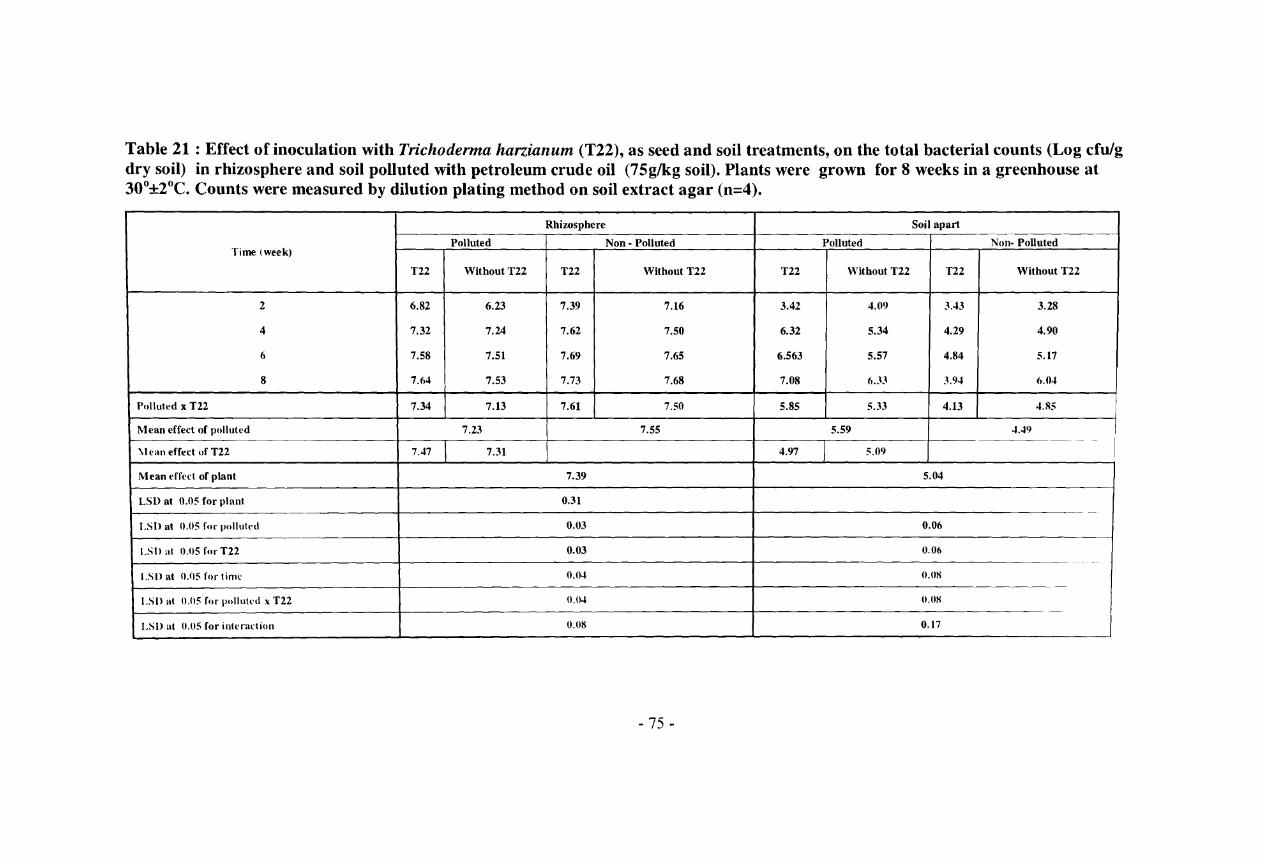
Table 21 : Effect of inoculation with Trichoderma harziallum (T22), as seed and soil treatments, on the total bacterial counts (Log cfulg dry soil) in rhizosphere and soil polluted with petroleum crude oil (7Sg/kg soil). Plants were grown for 8 weeks in a greenhouse at 30o±2°C. Counts were measured by dilution plating method on soil extract agar (n=4).
Rhizosphere Soil apart
Polluted Non - Polluted Polluted Non- Polluted Time (week)
T22 WithoutT22 T22 Without T22 T22 Without T22 T22 Without T22
2 6.82 6.23 7.39 7.16 3.42 4.09 3.43 3.28
4 7.32 7.24 7.62 7.50 6.32 5.34 4.29 4.90
I
6 7.58 7.51 7.69 7.65 6.563 5.57 4.84 5.17
8 7.64 7.53 7.73 7.68 7.08 6.33 3.9.t 6.0.t
Polluted x T22 7.34 7.13 7.61 7.50 5.85 5.33 4.13 4.S5
Mean effect of polluted 7.23 7.55 5.59 4,49 -- --
I \Iean effect of T22 7.47 7.31 4.97 5.09 I
Mean effect of plant 7.39 5.04
LSD at 0.05 for plant 0.31 -~-
LSD at 0.05 for polluted 0.03 0.06
LSD at (I.0S for T22 0.03 0.06 -~
LSD at O.OS for time 0.1l4 Il.OK -
LSD Ht 0.05 for pollull'd x T22 1l.04 (l.OK -
LSD at O.OS for interartion 0.08 0.17 - - - -- -- -- -- - ---_ .. - -- ------ -- -
- 75 -

Comparison between total bacterial counts in the rhizosphere of maize plants and
soil (Table, 21) showed that the numbers of heterotrophic bacteria were higher in the
rhizosphere than in the soil, in the presence of petroleum crude oil. with and without
T22. The total mean counts in the rhizosphere of polluted and T22 inoculated treatment
were 7.34 and 5.85 log cfu/g- soil in the rhizosphere and soil. respectively. The same
trend was also observed in the rhizosphere of non-polluted soil inoculated with T22
where mean counts were 7.61 and 4.13 log cfu/g soil. The number of the total
heterotrophic bacterial counts increased significantly over the course of the experiment
in the rhizosphere by 0.4 log units and by> 1 log unit soil.
Inoculation of polluted and non-polluted soil with T.harjanum (T22) significantly
increased the total heterotrophic bacterial counts in the rhizosphere of maize plants from
7.13 to 7.34 log cfu/g rhizosphere soil (increase of 62.1 %) and from 7.50 to 7.61 log
cfu/g in non-rhizosphere soil (increase of 29 o/c). The same trend was obtained in non
vegetated soil polluted with petroleum crude oil where the bacterial count was higher in
T22 inoculated soil. In non-polluted soil, the opposite trend was observed. Inoculation
of non-polluted soil with T.har:ianum significantly decreased the total bacterial count
from 4.85 to 4.13 log cfu/g soil (an average decrease of 80. 9o/c).
6.3.3 Total petroleum hydrocarbon degraders
The total count of petroleum hydrocarbon degraders (log mpn / g dry soil) in the
rhizosphere of maize plant polluted with crude oil and inoculated with T22 and their
controls increased significantly as the plants grew up reaching their maximum numbers
at the 8th. week (Table 22).
- 76 -

Table 22: Effect of inoculation with Trichoderma harzianum (T22) on the number of petroleum hydrocarbon degraders (Log mpn/g dry soil) in rhizosphere and soil polluted with petroleum crude oil at a rate of 75glkg soil. Plants were grown for 8 weeks in a greenhouse at a temperature of 30o±2 °C (n=4).
Rhizosphere Soil
Time (week) Polluted Non-Polluted Polluted Non- Polluted
T22 Without T22 T22 Without T22 T22 Without T22 T22 Without T22
2 4.44 4.14 4.22 4.31 4.71 4.42 4.50 4.26
4 4.48 4.51 4.72 4.60 4.54 4.27 4.22 4.32
6 4.50 4.57 5.43 4.85 4.27 4.42 4.48 4.30
8 5.36 5.45 6.15 5.56 4.47 4.56 4.27 4.74
Plant x polluted 4.70 4.67 5.13 4.83
4.50 4.42 4.37 4.41
Mean effect of polluted 4.68 4.98 4.46 4.39
!\lean effect of T22 4.91 4.75 4.41 4.43
Mean effect of plant 4.83 4.42
LSD at 0.05 for plant 0.17
LSD at 0.115 for polluted 0.06 0.06
LSD at 0.115 for T22 O. ()6 N.S
LSD at (1.115 for time 0.09 (I.OS -- ------------ _. - ~-- ~-- -~ - - ------
LSD at (I.I)S for polluted x T22 0.09 0.08
LSD at (1.115 for interaction 0.18 0.16 -- - -- - - - - --~
- 77 -
Table 22 shows that inoculation of maize seeds with T22 planted in petroleum
polluted soil significantly increased the petroleum hydrocarbon degraders from 4.67 to
4.70 log mpn/g soil ( 7.15% increases) and from 4.83 to 5.13 log mpn/g soil (3989'c
increases) in non-polluted soil. The same trend was also observed in non-rhizosphere
soil that was polluted where the total hydrocarbon degraders count increased slightly
(but not significantly) from 4.42 to 4.50 log mpn/g soil. In non- rhizosphere soil of
plants grown in non-polluted soil and inoculated with T22 the number of hydrocarbon
degraders were not significantly different from the non-treated control (4A 1 log mpn/g
soil compared with the non treated control being 4.37 log mpn/g soil ).
Generally, in the rhizosphere, T22 inoculation of plants grown in polluted and
non-polluted soil significantly increased the total petroleum hydrocarbon degraders
counts compared to treatments that were not inoculated with T22. Inoculation with T22
increased the hydrocarbon degraders in the rhizosphere from 4.74 to 4.91 log mpn/g dry
soil (48% increase) while in non-rhizosphere soil there was no significant effect of
inoculation.
6.3.4 Biodegradation of some petroleum hydrocarbons
- 78-

Table 23: Effect of inoculation with Trichoderma harzianum (T22) on the biodegradation of petroleum hydrocarbons Data presented are based on standard peak area in soil polluted with petroleum crude oil at a rate of 7Sg/kg (n=4).
Rhizosphere Soil
~ T22 Without T22 Main effect of T22 Without T22 Mean effect of
Detected compounds Week 4 Week 8 Week4 Week8 compounds Week~ Week8 Week 4 Week 8 compounds
C11Hz.I (undecane) 93.54 98.65 67.00 87.65 86.71 80.43 88.24 86.85 91.86 86.85
C12H26 (dodecane) 94.43 99.01 77.87 93.54 91.21 87.30 86.91 77.49 83.03 83.68
C1JH1• (tridecane) 93.70 97.74 75.34 80.91 86.92 78.20 94.35 23.69 77.54 6804~
I CI4HJO (tetradecane) 93.65 99.08 60.35 80.84 83.48 83.30 84.14 33.71 66.45 66.90
C5HJ2 (pentadecane) 92.76 99.27 66.06 80.45 84.63 80.85 96.89 29.67 73.60 70.25
C1.H," (hexadecane) 96.01 99.50 72.88 90.48 89.72 37.57 64.02 51.82 76.17 57040
C 7H,. (heptadecane) 71.01 96.80 53.88 76.51 74.55 27.43 85.46 53.55 61.73 57.04
90.73 98.58 67.63 84.34 67.87 85.72 50.97 75.77 T22 x time
Mean effect of T22 94.65 75.98 76.79 63.37
Mean effect of time 79.18 91.46 59.42 8().74
Mean effect of plant 85.32 70.08
LSD at 0.05 for plant 8.23
LSD at 0.05 for time 3.70 3.90
LSD at 0.05 for T22 3.70 3.90
LSD at 0.05 for T22 x time 5.23 N.S
LSD at (1.1'5 compounds
for detected 6.92 7.30
LSD at 0.05 for interaction 14.61 N.S
---
- 79-

Table 23 shows the effect of T.har~ianum inoculation on petroleum degradation
over an 8-week period. The data show that there was more degradation of hydrocarbons
in the rhizhosphere of maize than in non-rhizosphere soil, suggesting a stimulatory
effect of rhizosphere on petroleum degradation. Inoculation with T22 increased the
percentage degradation of hydrocarbons from 76 to 95CJc (p<0.05). Similarly.
inoculation significantly increased degradation of petroleum hydrocarbons in non
rhizosphere soil from 63.4 to 77%. Table 23 also shows that maize plants themselves
significantly increased the degradation rate of petroleum hydrocarbons from 70<;'( 10
non-rhizosphere soil to 85 % in the rhizosphere soil.
6.4 Discussion
The aim of this experiment was to investigate the effect of inoculating maize plants with
the fungus Trichoderma harzianum strain T22 on plant growth parameters, the number
of total bacterial and petroleum hydrocarbon degraders, and to determine, whether the
fungus enhanced the degradation of petroleum crude oil in rhizosphere and non
rhizosphere soil.
Petroleum crude oil was toxic to plants as expected. Treatment of soil with
petroleum crude oil consistently inhibited germination, plant height, shoot and root dry
weight biomass. This is in line with the work of Atlas (1977) who found that oil
pollution prevents normal oxygen exchange between soil and atmosphere due to
hydrophobic properties of oil, thus inhibiting plant growth. Hydrocarbons may coat
roots thus inhibiting water and nutrient absorption (Kuhn et al., 1998). Odjegba and
Sadiq (2002) reported that the mean height of Amaranthus was significantly (P < 0.05)
smaller for plants grown in soil treated with 1 to 5 percent hydrocarbon engine oil
compared to the height of plants grown in non-polluted soil.
It is clear from the present data that T22 inoculation improved seed germination in
petroleum polluted soil, suggesting that T22 provided protection against the toxicity of
petroleum crude oil. Inoculated plants grew taller than non-inoculated plants. T22
inoculation of petroleum hydrocarbon polluted soil also significantly enhanced plant
height, shoot biomass and root biomass. Generally, inoculation with T22 strain showed
a significant increase of maize plant growth when grown in soil polluted with petroleum
hydrocarbons. Results of previous studies support this finding (Ermisch et al .. 1990;
Harman et ai., 2004) which showed that T.har~iallum T22 enhanced plant growth and
- 80-

produced longer, deeper rooting plants (Harman, 1996). Many others also found that
better plant growth and quality were induced when plants were inoculated with
T.harzianum (Windham et ai., 1986; Inbar et al., 1994; Bjorkman et al .,1998).
The data presented here show that there were more heterotrophic bacteria in
rhizosphere soil of maize plants than in unplanted soil. This is in line with work of Atlas
(1978), Dibble and Bartha (1979), Buckley (1980) and Gunther et al. (1996). It was
noticeable that T22 inoculation significantly increased the total number of heterotrophic
bacteria in the rhizosphere of polluted soil. The same trend was also obtained in non
rhizosphere soil that was polluted with petroleum crude oil. It is possible that
T.harzianum increases root activity and root exudation resulting in a stimulation of
microbial activity.
The present results indicate that inoculation of maize seeds with T22 resulted in
an increase in the total number of hydrocarbon degraders in the rhizosphere of maize
that grew in soil contaminated with petroleum crude oil. The same trend was reported in
non-rhizosphere soil polluted with hydrocarbons. The ability of T.har:.ianlllll to increase
the numbers of petroleum hydrocarbon degraders may have something to do with the
solubility of petroleum hydrocarbons. Perhaps T.har:.ianum T22 produces surfactants
such as fatty acids which increase the solubility of petroleum hydrocarbons making
them more bioavailable to the bacteria resulting in increased numbers of petroleum
hydrocarbon degraders (Greensmith, 2005).
It appears from the present study that the petroleum hydrocarbons that were
detected were the same in the rhizosphere of maize plants as in non-rhizosphere soil, but
they varied in their concentration. Also degradation for all detected compounds was
greater in the rhizosphere, suggesting a stimulatory effect of the rhizosphere on
petroleum degradation. This could be explained by the effect of the root exudates that
were deposited in the rhizosphere which could provide nutrients that allow hydrocarbon
degradation to commence.
- 81 -

CIIAP'TE~SEV-E~
Effect ~f water content, mineral nutrients and temperature on the degradatton of hydrocarbons in soil polluted with petroleum crude oil
Laboratory experiments
7.1. Introduction
Microorganisms have different levels of tolerance for particular environmental
conditions. Factors that affect the rate of microbial activity include nutrient availability.
moisture content, pH, and the temperature of the soil matrix (Walworth et al.. 2005).
All soil microorganisms require moisture for cell growth and function.
Availability of water affects diffusion of soluble nutrients into and out of
microorganism cells. However, excess moisture, such as in saturated soil, is undesirable
because it reduces the amount of available oxygen for aerobic respiration. Anaerobic
respiration, which produces less energy for microorganisms than aerobic respiration
therefore slows the rate of biodegradation of hydrocarbons. A soil moisture content
"between 45 and 85 percent of the water-holding capacity (field capacity) of the soil or
about 12 percent to 30 percent by weight" is optimal for petroleum hydrocarbon
degradation (USEP A, 2006, "Landfarming").
Seasonal changes in soil moisture and soil temperature affect the
ability of soil to supply nutrients to plants through soil organic matter turnover (Bonde
and Roswall, 1987). Microbial biomass has been reported to vary seasonally in
European soils (Patra et ai., 1990). Singh et ai. (1989) have also reported a seasonal
variation in the microbial C, N and P in forests and savanna soils. Generally, a negative
relationship between soil moisture content and microbial biomass was reported by Ross
(1971) for New Zealand soils under tussock grassland and introduced pasture. Short
term fluctuations of moisture and temperature conditions have been shown to influence
the amount of microbial biomass carbon (MacGill et ai., 1986). Soil organic carbon
levels, too, have been reported to be governed by climatic conditions (Jenny. 1980).
A number of limiting factors have been recognized to affect the biodegradation
of petroleum hydrocarbons. Biodegradability is inherently influenced by the
composition of the oil pollutant. Okoh (2002) reported that heavy crude oil is generally
much more difficult to biodegrade than light ones. Major environmental factors
affecting oil biodegradation include weathering processes. temperature. a\'ailability and - 82 -

concentration of nutrients, availability of moisture, oxygen and pH (Zhu et al ..
2001 ;Okoh, 2006).
For example, the bioavailability of contaminants may be lower in soils with high
clay or organic matter contents (Carmichael and Pfaender, 1997: Otten. 1997).
Nutrients are very important ingredients for successful biode!ITadation of b
hydrocarbon pollutants, especially nitrogen, phosphorus and in some cases iron
(Cooney, 1984). Depending on the nature of the impacted environment, some of these
nutrients could become limiting thus affecting the biodegradation processes (Okoh.
2006). Hence, the addition of nutrients is often necessary to enhance the biodegradation
of oil pollutants (Choi et al., 2002 ; Kim et al., 2005).
Inorganic nutrients including nitrogen and phosphorus are necessary for
microbial activity and cell growth. It has been shown that "treating petroleum
contaminated soil with nitrogen can increase cell growth rate, decrease the microbial lag
phase, help to maintain microbial populations at high activity levels. and increase the
rate of hydrocarbon degradation" (Walworth et aI., 2005). However, it has also been
shown that excessive amounts of nitrogen in soil cause microbial inhibition. Walworth
et al. (2005) suggest maintaining nitrogen levels below 1800 mg nitrogen/kg H~O for
optimal biodegradation of petroleum hydrocarbons. Addition of phosphorus has benefits
similar to that of nitrogen, but also results in similar limitations when applied in excess
(State of Mississippi, Department of Environmental Quality, 1998).
Temperature plays a very important role in the biodegradation of petroleum
hydrocarbons fIrstly by its direct effect on the chemistry of the pollutants and secondly
on the physiology and diversity of the microbial milieu. Ambient temperature of an
environment affects both the properties of spilled oil and the activity of population of
microorganisms (Venosa and Zhu, 2003). At low temperatures, the viscosity of the oil
increases while the volatility of toxic low-molecular weight hydrocarbons is reduced.
delaying the onset of biodegradation (Atlas, 1981). Temperatures also affect the
solubility of hydrocarbons (Foght et al., 1996). Highest degradation rates generally
occur in the range of 30-40 °C in soil environments, 20-30°C is the optimum range in
some fresh water and IS-20°C is the optimum range in marine environments (Bossert
and Bartha, 1984 ; Cooney, 1984).
Generally, "speed of enzymatic reactions in the cell approximately douhles for
each 10°C rise in temperature" (Nester et al .. 200 I). There is an upper limit to the
- 83 -

temperature that microorganisms can withstand Most bacteria fou d . '1' 1 d' . n m SOl , mc u mg
many bacteria that degrade petroleum hydrocarbons, are mesophiles which have an
optimum temperature range from 25 to 45°C (Nester et al., 2001). Thermophilic
bacteria (those which survive and thrive at relatively high temperatures) are normally
found in hot springs and compost heaps exist indigenously in cool soil environments
and can be activated to degrade hydrocarbons with an increase in temperature to 60 "C.
This finding "suggested an intrinsic potential for natural attenuation in cool soils
through thermally enhanced bioremediation techniques" (Perfumo et al., 2007).
Because soil moisture and other abiotic factors play such an important
role for microbial activity, it is hypothesized that management these factors in arid soils
is a key factor for increasing degradation of petroleum hydrocarbons in those soils. A
range of experiments was carried out to investigate how different factors affected
microbial activity and hydrocarbon degradation.
7.2 Materials and Methods
7.2.1 Effect of soil moisture content on microbial population and C02
production in non-polluted soil
Effect of soil moisture content on the total bacterial and fungal counts and
microbial activity (measured as C02 evolution) in non-polluted soil was studied by
using 5 different moisture levels. These levels were 0, 10, 30, 50 and 70% of the total
water holding capacity of the soil. Three hundred g of soil was put in a sterile flask
(500ml) and the soil moisture level was adjusted to the above mentioned levels. The
flasks were incubated at 30°C±2 for four weeks. Flasks were weighed daily and
watered to maintain the required moisture level. Four replicates were used for each
moisture level. The soil samples were taken weekly for microbial analysis expressed as
log cfu/g soil as mentioned before. The C02 evolution (C0 2 ml/h/lOOg soil) was
estimated according to Zidan (1993) using infra red C02 analyzer as follows:
100g soil was poured into plexiglass tubes (25cm long, .fcm diam.), stoppered at both
ends with polyurethane foam rubber plugs and connected to infra-red gas analyzer
system for incubation at 23° ± 0.5°C. Every two hours C02 free air was drawn through
the samples for 20 minutes and the rate of C02 production was recorded for 15 minutes.
- 84-

The tested soil samples were either unamended (basal) or am d d . h I en e wJt g ucose at a
rate of 100mg glucose/l OOg dry soil.
The soil respiration rate was calculated from the following equation:
Respiration rate = JC 1 0-6
Where:
J = the flow rate of 200 or 400 mllmin
C = C02 production in ppm
Measurement of respiration rate of each soil sample was made at 2-hour
intervals for 10 hours after placing the sample into the tube.
My experience showed that the used infra red CO2 analyzer was not able to give
measurements for the very wet samples. Hence, the CO2 production at the level of the
moisture content 70% of the total WHC was not detected as these samples would
damage the machine.
7.2.2 Effect of soil moisture on microbial population and CO2
production of petroleum-contaminated soil
A parallel experiment was set up using soil contaminated with crude oil (200g
crude oil/ 800g soil) that was left for 2 weeks to allow evaporation of volatile
hydrocarbons before being used. Portions of 300g soil were put in flasks and soil
moisture content was maintained at the same level of moisture content (0, 10, 30, 50 and
70% of the total water holding capacity of soil).
The flasks were kept at 30°C for four weeks, during which the soil samples were
taken periodically 1, 2, 3 and 4 weeks, and the total microbial counts and CO2 were
determined as mentioned before. The evolution (C02 rnlIhiIOOg soil) was estimated
according to Zidan (1993).
- 85 -
7.2.3 Effect of soil moisture content levels on microbial population and
CO2 production of petroleum-contaminated soil amended with
N.P .K. fertilizers
This experiment aimed to quantify the effect of the five levels of soil moisture
content in combination with N.P.K. fertilizers. The same five moisture levels as
mentioned in the previous experiment were used. Each level of soil moisture content
was amended with N.P.K. fertilizers.
As mentioned before, the soil was previously polluted with crude petroleum oiL
300g was put in flasks, the soil was fertilized with the three macronutrients as
ammonium nitrate (33.5% nitrogen), super phosphate (15.5% P20 S) and potassium
sulphate (48-52%K) at the rate equivalent to 300, 200 and 100 kglhectare respectively,
according to the recommendation of Ministry of Agriculture in Saudi Arabia.
As before, 100 g soil samples were taken after 1, 2, 3 and -+ weeks, incubated at
30°C and analyzed for CO2 evolution and colony forming units as described before.
7.2.4. Effect of soil temperature on microbial population and their
activity in soils contaminated with petroleum hydrocarbons and
amended with N.P.K fertilizers
Sterilized flasks (500rnl) were filled with 300g of polluted soil that was
moisturized to 50% soil moisture content as described before and incubated at 25, 30,
35, 40 and 45°C in incubator, with four replicated for each treatment.
As mentioned above soil samples were taken after 1, 2. 3 and 4 weeks incubation and
analyzed for C02 evolution and microbial population size.
- 86-

7.3 Results
7.3.1 Effect of soil moisture on microbial population and CO2
production in non-polluted soil
7.3.1.1 Bacterial Population
Table 24: Effect of soil moisture content on the average number of bacterial propagules per gram of soil dry weight (expressed as log cfufg soil) over a period of 4 weeks after initial wetting. Counts were measured by the dilution plating on soil extract agar medium for bacteria (n=4).
Time after treatment
(weeks)
One
Two
Three
Four
Means of treatment
L.S.D. at 5% for time
L.S.D. at 5% for moisture
L.S.D. at 5% for interaction
*0
6.00
6.10
6.50
6.70
6.30
(Iog.cfufg dry weight soil )
10
6.00
6.30
6.60
7.20
6.50
Soil moisture content %
30 50 70
6.10 630 5.90
6.20 630 5.90
6.60 6.90 6.70
7.10 7.60 7.60
6.50 6.80 6.50
0.01
0.01
0.01
*original soil moisture content (3.2%).
Means of periods
6.10
6.20
6.70
7.20
Data show that the total bacterial count in the soil increased with the time of
incubation period irrespective of the moisture content as long as there was some
moisture present (Table 24). Even without moisture the microbial count increased by
0.7 log units, but at 10% WHC and above microbial counts in all soils increased by
more than 1.2 log units over the 4 week incubation period (Table ~.f).
- 87-
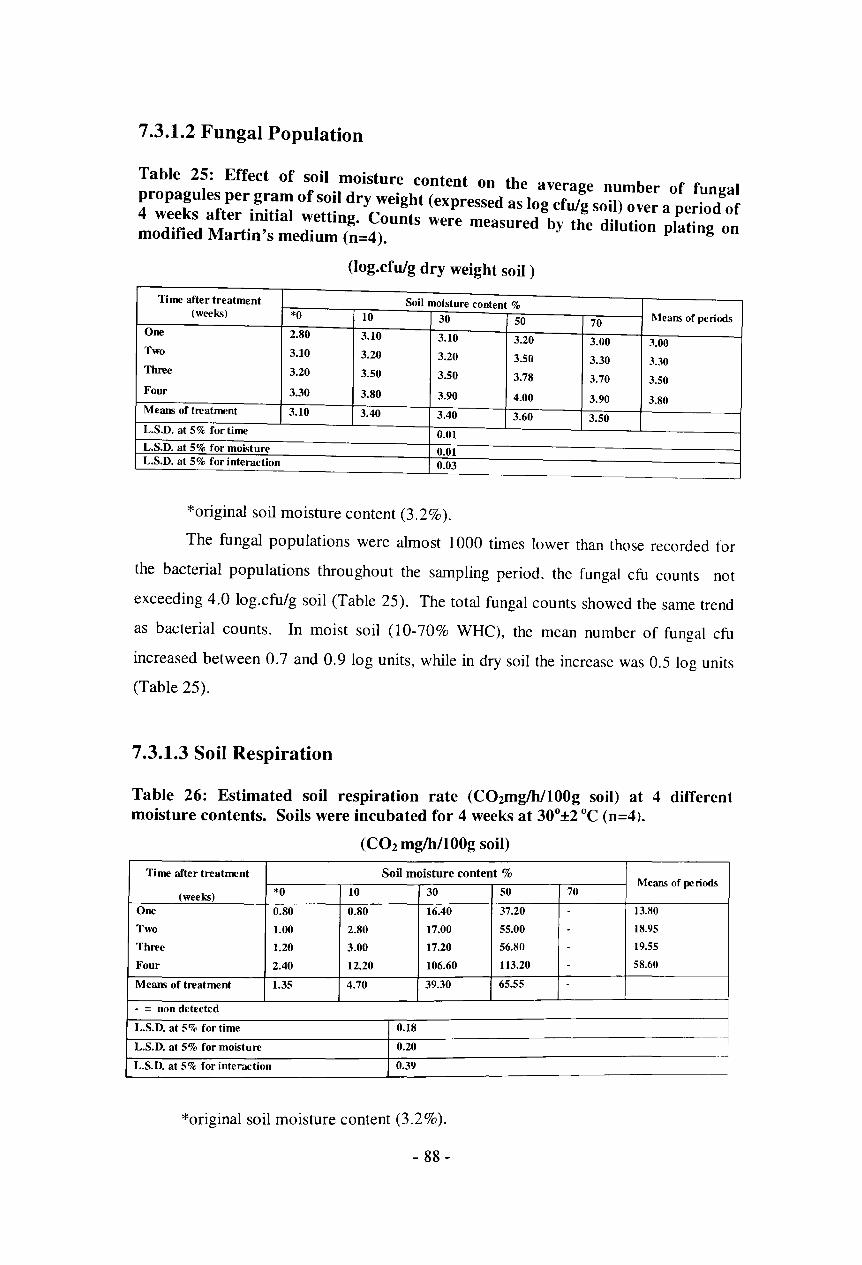
7.3.1.2 Fungal Population
Table 25: Effect of soil moisture content on the average number of fungal propagules per gram of soil dry weight (expressed as log cfulg soil) over a period of 4 weeks after initial wetting. Counts were measured by the dilution plating on modified Martin's medium (n=4).
(log.cfulg dry weight soil )
Time after treatment Soil moisture content % (weeks) *0 10 30 50 70 l\Ieaffi of periods
One 2.80 3.10 3.10 3.20 3.00 3.00 Two 3.10 3.20 3.20 3.50 3.30 3.30 Three 3.20 3.50 3.50 3.78 3.70 3.50 Four 3.30 3.80 3.90 4.00 3.90 3.80 Means of treatment 3.10 3.40 3.40 3.60 3.50 L.S.D. at 5% for time 0.01 L.S.D. at 5% for moisture 0.01 L.S.D. at 5% for interaction 0.03
*original soil moisture content (3.2%).
The fungal popUlations were almost 1000 times lower than those recorded for
the bacterial popUlations throughout the sampling period. the fungal cfu counts not
exceeding 4.0 log.cfu/g soil (Table 25). The total fungal counts showed the same trend
as bacterial counts. In moist soil (10-70% WHC), the mean number of fungal cfu
increased between 0.7 and 0.9 log units, while in dry soil the increase was 0.5 log units
(Table 25).
7.3.1.3 Soil Respiration
Table 26: Estimated soil respiration rate (C02mg/h/IOOg soil) at 4 different moisture contents. Soils were incubated for 4 weeks at 30o±2 °C (n=4).
(C02 mg/h/lOOg soil)
Time after treatment Soil moisture content % Means of periods
*0 10 30 50 70 (weeks) One 0.80 0.80 16.40 37.20 . 13.80
Two 1.00 2.80 17.00 55.00 - 18.95
Three 1.20 3.00 17.20 56.80 . 19.55
Four 2.40 12.20 106.60 113.20 - 58.60
Means of treatment 1.35 4.70 39.30 65.55 -
- - non detected
L.S.D. at 5% for time 0.18 ~
L.S.D. at 5% for moisture 0.20
L.S.D. at 5% for interdction 0.39
*original soil moisture content (3.2 %).
- 88 -
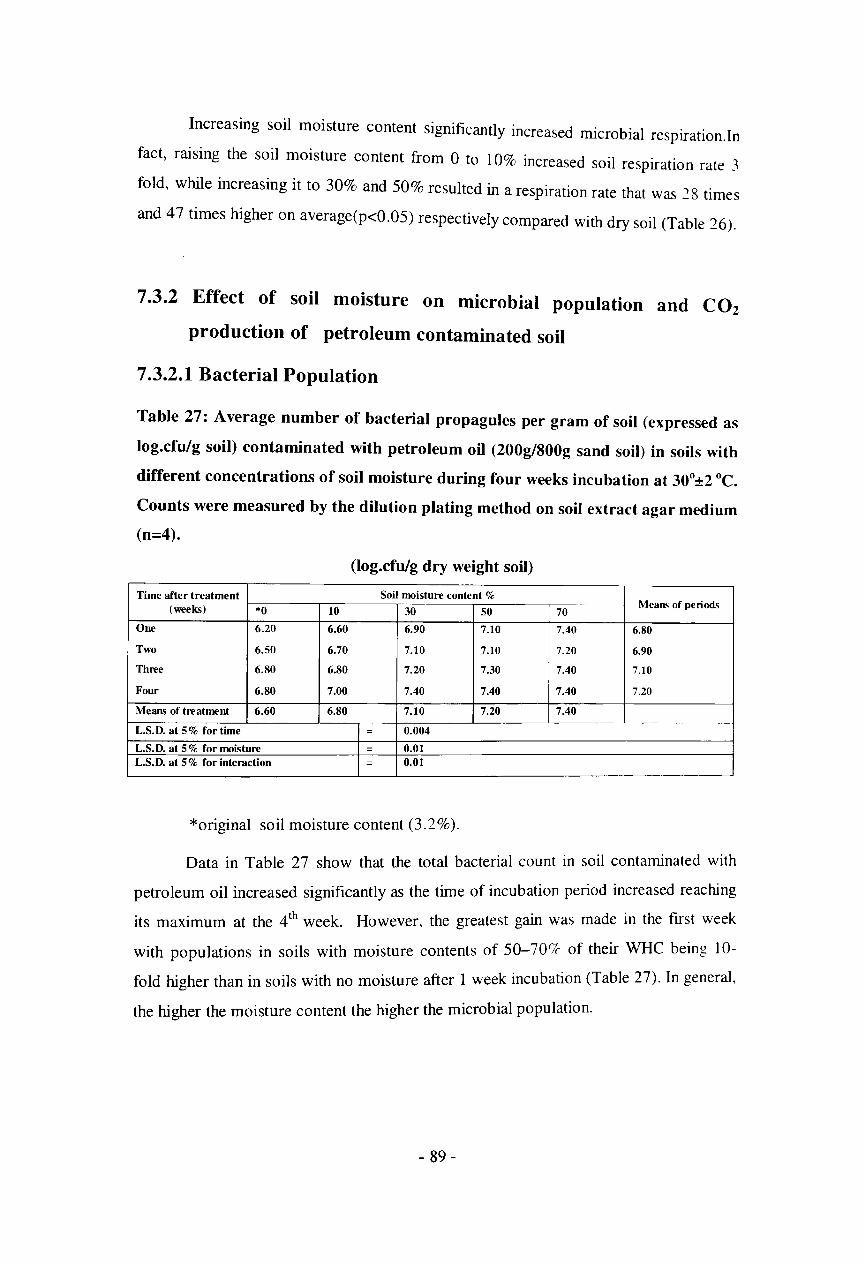
Increasing soil moisture content significantly increased microbial respiration.ln
fact, raising the soil moisture content from 0 to 10% increased soil respiration rate .3
fold, while increasing it to 30% and 50% resulted in a respiration rate that was 28 times
and 47 times higher on average(p<0.05) respectively compared with dry soil (Table 26).
7.3.2 Effect of soil moisture on microbial population and CO2
production of petroleum contaminated soil
7.3.2.1 Bacterial Population
Table 27: Average number of bacterial propagules per gram of soil (expressed as
log.cfulg soil) contaminated with petroleum oil (200g/800g sand soil) in soils with
different concentrations of soil moisture during four weeks incubation at 30o±2 °C.
Counts were measured by the dilution plating method on soil extract agar medium
(n=4).
(log.cfulg dry weight soil)
Time after treatment Soil moisture content % Means of periods --
(weeks) *0 10 30 50 70
One 6.20 6.60 6.90 7.10 7.40 6.80
Two 6.50 6.70 7.10 7.10 7.20 6.90
Three 6.80 6.80 7.20 7.30 7.40 7.10
Four 6.80 7.00 7.40 7.40 7.40 7.20
Means of treatment 6.60 6.80 7.10 7.20 7.40
L.S.D. at 5 % for time - 0.004
L.S.D. at 5% for moisture 0.01 L.S.D. at 5% for interaction - 0.01
* original soil moisture content (3.2%).
Data in Table 27 show that the total bacterial count in soil contaminated with
petroleum oil increased significantly as the time of incubation period increased reaching
its maximum at the 4th week. However. the greatest gain was made in the first week
with populations in soils with moisture contents of 50-700'c of their WHC being 10-
fold higher than in soils with no moisture after 1 week incubation (Table 27). In general,
the higher the moisture content the higher the microbial population.
- 89-

7.3.2.2 Fungal Population
Table 28: Average num~er of fu~gal propagules per gram of soil dl1' weight (exp~essed as l~g cfu~g soIl) contammated with petroleum oil (200g/800g sand soil) at dIfferent soIl mOIsture contents during a four weeks incubation periods at 30
o±2°C. Cfus were measured by the dilution plating on modified Martin's
medium (n=4).
(log.cfulg dry weight soil )
Time after treatment Soil moisture content o/c :--Ieans of periods
(weeks) *0 10 30 50 70
One 2.20 2.70 2.70 3.00 3.00 2.70
Two 2.80 2.90 3.10 3.30 3.20 3.10
Three 2.80 3.20 3.20 3.30 3.20 3.10
Four 3.00 3.20 3.20 3.30 3.20 3.20
Means of treatment 2.70 3.00 3.00 3.20 3.20
L.S.D. at 5% for time - 0.02 L.S.D. at 5 % for moisture - 0.02 ----L.S.D. at 5 % for interaction = 0.05
*original soil moisture content (3.2%).
The total fungal counts showed similar trends as the bacterial counts In general
the number of cfu increased slightly over time but the greatest gain occurred in the fIrst
week with levels in moist soil being 0.8 log units higher than in dry soil (Table 28).
7.3.2.3 Soil Respiration
Table 29: Estimation of soil respiration rate (C02mg/h/lOOg soil) in soil contaminated with petroleum oil at a rate of 200g/800g soil (w/w). Soils were held at different moisture contents. Respiration as estimated during 4 weeks at 30
o±2°C
(n=4).
(C02 mg/hIlOOg soil)
Time after treatment Soil moisture content % Means of periods
(weeks) *0 10 30 50 70
One 4.00 22.00 38.00 28.60 - 23.15
Two 5.20 27.20 56.00 58.00 - 36.60
Three 6.60 36.00 56.00 62.00 - 40.15
Four 22.60 46.00 74.60 71.20 - 53.60
Means of treatment 9.60 32.80 56.15 54.95 -
- - non detected
L.S.D. at 5% for time - 0.13
L.S.D. at 5% for moisture - 0.15
L.S.D. at 5% for interaction - 0.30
*original soil moisture content (3.2%).
- 90-
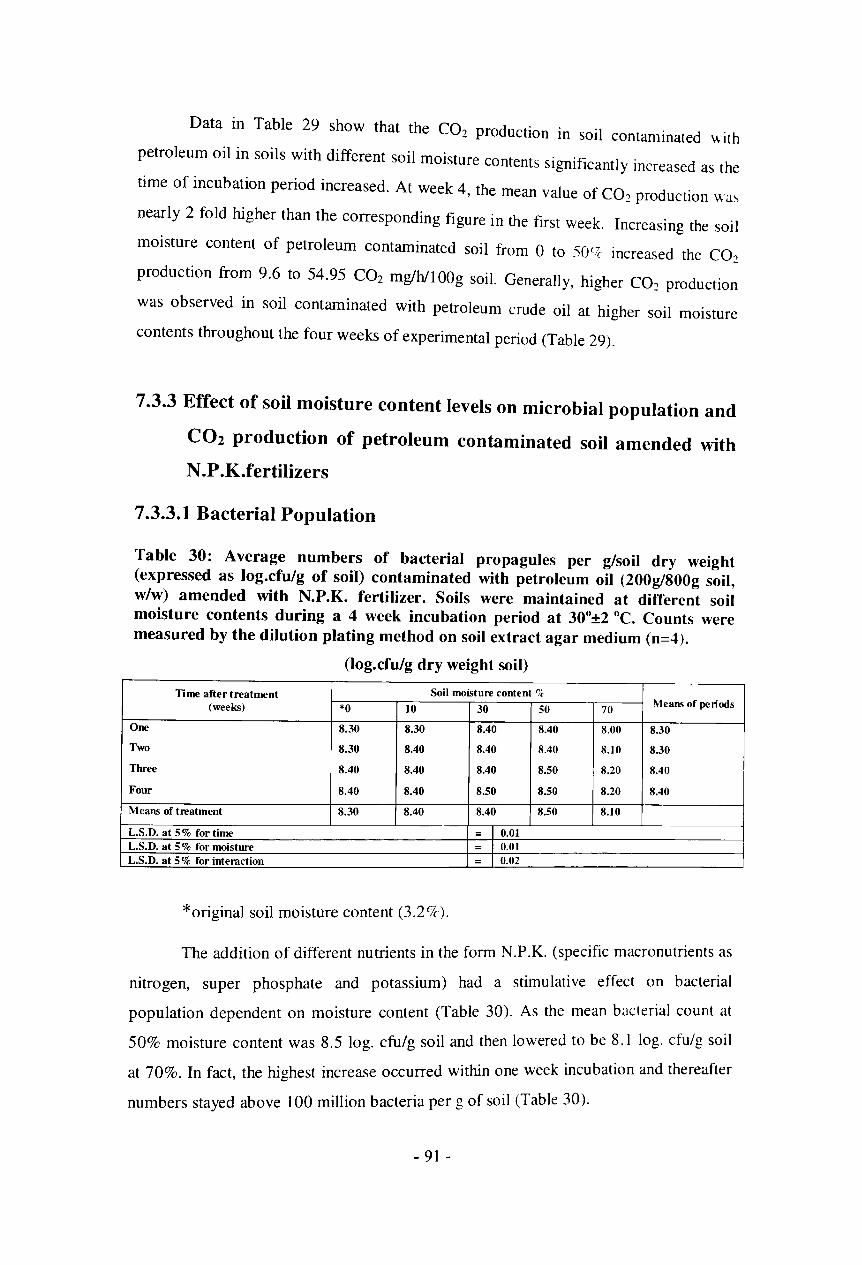
Data in Table 29 show that the CO2 production in soil contaminated with
petroleum oil in soils with different soil moisture contents significantly increased as the
time of incubation period increased. At week 4, the mean value of CO2
production was
nearly 2 fold higher than the corresponding figure in the first week. Increasing the soil
moisture content of petroleum contaminated soil from 0 to 50<7c increased the CO2
production from 9.6 to 54.95 CO2 mglh/IOOg soil. Generally, higher CO2
production
was observed in soil contaminated with petroleum crude oil at higher soil moisture
contents throughout the four weeks of experimental period (Table 29).
7.3.3 Effect of soil moisture content levels on microbial popUlation and
CO2 production of petroleum contaminated soil amended with
N.P .K.fertilizers
7.3.3.1 Bacterial Population
Table 30: Average numbers of bacterial propagules per g/soil dry weight (expressed as log.cfu/g of soil) contaminated with petroleum oil (200g/800g soil, w/w) amended with N.P.K. fertilizer. Soils were maintained at different soil moisture contents during a 4 week incubation period at 30o±2 °C. Counts were measured by the dilution plating method on soil extract agar medium (n=4).
(Iog.cfulg dry weight soil)
Time after treatment Soil moisture content 0/,
(weeks) *0 10 30 50 70 Means of periods
One 8.30 8.30 8.40 8.40 8.00 8.30
Two 8.30 8.40 8.40 8.40 8.10 8.30
Three 8.40 8.40 8.40 8.50 8.20 8.40
Four 8.40 8.40 8.50 8.50 8.20 8.40
Means of treatment 8.30 8.40 8.40 8.50 8.10
L.S.D. at 5 % for time 0.01 L.S.D. at 5 % for moisture 0.01 L.S.D. at 5 % for interaction 0.02
*original soil moisture content (3.20/(').
The addition of different nutrients in the form N.P.K. (specific macronutrients as
. hos hate and potassium) had a stimulative effect on bacterial rutrogen, super p p
popUlation dependent on moisture content (Table 30). As the mean bacterial count at
50% moisture content was 8.5 log. cfu/g soil and then lowered to be 8.1 log. cfu/g soil
at 70%. In fact, the highest increase occurred within one week incubation and thereafter
numbers stayed above 100 million bacteria per g of soil (Table 30).
- 91 -
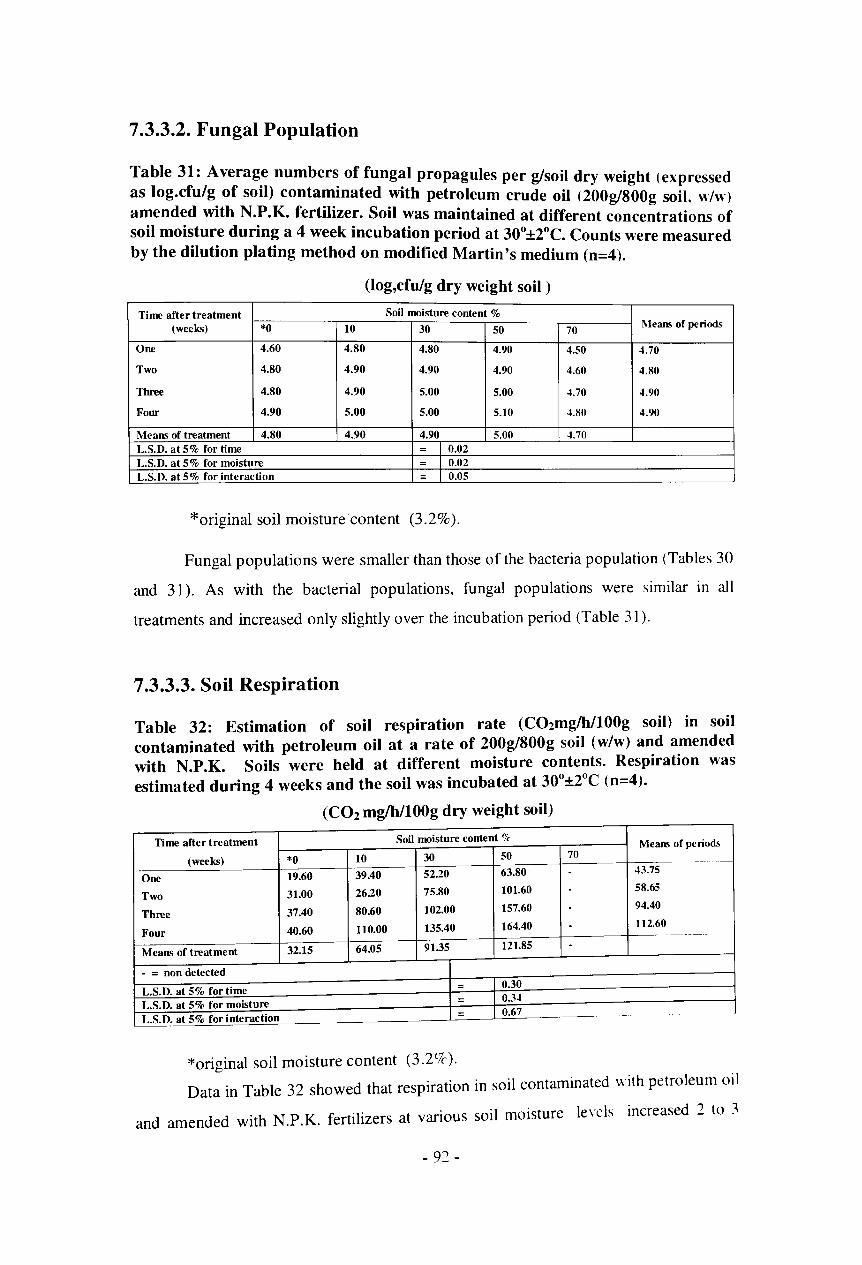
7.3.3.2. Fungal Population
Table 31: Average numbers of fungal propagules per g/soil dry weight (expressed as log.cfu/g of soil) contaminated with petroleum crude oil (200g/800g soil, w/w)
amended with N.P.K. fertilizer. Soil was maintained at different concentrations of soil moisture during a 4 week incubation period at 30o±2°C. Counts were measured by the dilution plating method on modified Martin's medium (n=4).
(Iog,cfulg dry weight soil )
Time after treatment Soil moisture content % (weeks) *0 10 30 50 70
Means of periods
One 4.60 4.80 4.80 4.90 4.50 4.70
Two 4.80 4.90 4.90 4.90 4.60 4.80
Three 4.80 4.90 5.00 5.00 4.70 4.90
Four 4.90 5.00 5.00 5.10 4.80 4.90
Means of treatment 4.80 4.90 4.90 5.00 4.70 L.S.D. at 5% for time - 0.02 L.S.D. at 5% for moisture - 0.02 L.S.D. at 5% for interaction = 0.05
*original soil moisture 'content (3.2%).
Fungal populations were smaller than those of the bacteria population (Tables 30
and 31). As with the bacterial popUlations, fungal populations were similar in all
treatments and increased only slightly over the incubation period (Table 31).
7.3.3.3. Soil Respiration
Table 32: Estimation of soil respiration rate (C02mglhll00g soil) in soil contaminated with petroleum oil at a rate of 200g/800g soil (w/w) and amended with N.P.K. Soils were held at different moisture contents. Respiration was estimated during 4 weeks and the soil was incubated at 30
o±2°C (0=4).
(C0 2 mg/h/l00g dry weight soil)
Time after treatment Soil moisture content 0/< Means of periods
(weeks) *0 10 30 50 70 --- --
One 19.60 39.40 52.20 63.80 . 43.75
Two 31.00 26.20 75.80 101.60 - 58.65
Three 37.40 80.60 102.00 157.60 - 94.40
Four 40.60 110.00 135.40 164.40 - 112.60 -------
Means of treatment 32.15 64.05 91.35 121.85 -- - non detected
L.S.D. at 5% for time 0.30
L.S.D. at 5% for moisture 034
L.S.D. at 5% for interaction 0.67 -
*original soil moisture content (3.29'c).
Data in Table 32 showed that respiration in soil contaminated with petroleum oil
and amended with N.P.K. fertilizers at various soil moisture le\'els increased 2 to .3
- 92 -
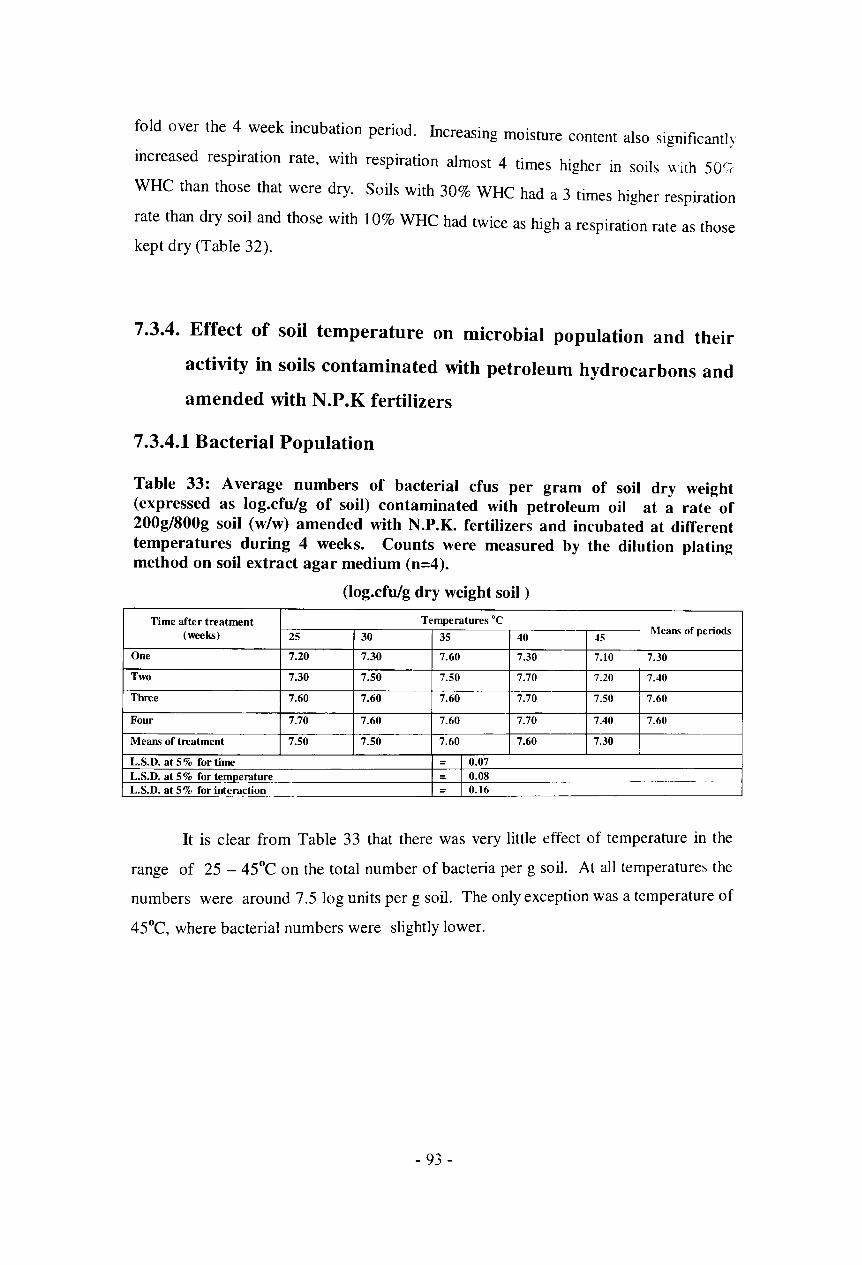
fold over the 4 week incubation period. Increasing moisture content also significantly
increased respiration rate, with respiration almost 4 times higher in soils with SOC;(
WHC than those that were dry. Soils with 30% WHC had a 3 times higher respiration
rate than dry soil and those with 10% WHC had twice as high a respiration rate as those
kept dry (Table 32).
7.3.4. Effect of soil temperature on microbial popUlation and their
activity in soils contaminated with petroleum hydrocarbons and
amended with N.P.K fertilizers
7.3.4.1 Bacterial Population
Table 33: Average numbers of bacterial cfus per gram of soil dry weight (expressed as log.cfulg of soil) contaminated with petroleum oil at a rate of 200g/800g soil (w/w) amended with N.P.K. fertilizers and incubated at different temperatures during 4 weeks. Counts were measured by the dilution plating method on soil extract agar medium (n=4).
(Iog.cfulg dry weight soil )
Time after treatment Temperatures °C (weeks) 25 30 35 40 .t5
Means of periods
One 7.20 7.30 7.60 7.30 7.10 7.30
Two 7.30 7.50 7.50 7.70 7.20 7.40
Three 7.60 7.60 7.60 7.70 7.50 7.60
Four 7.70 7.60 7.60 7.70 7.40 7.60
Means of treatment 7.50 7.50 7.60 7.60 7.30
L.S.D. at 5% for time - 0.07 L.S.D. at 5% for temperature 0.08 L.S.D. at 5% for interaction 0.16
It is clear from Table 33 that there was very little effect of temperature in the
range of 25 - 45°C on the total number of bacteria per g soil. At all temperatures the
numbers were around 7.5 log units per g soil. The only exception was a temperature of
45°C, where bacterial numbers were slightly lower.
- 93 -

7.3.4.2 Fungal Population
Table 34: Average numbers of fungal propagules per gram of soil dry weight (expressed as. log cfulg of soil), contaminated with petroleum oil at ~ rate of 200g/800g sod (w!w) amended with N.P.K. fertilizers and incubated at different temper~tures dur~ng 4 w~ks. Counts were measured by dilution plating method on modIfied Martm's medIUm (n=4).
(Iog.cfulg dry weight soil)
Incubation Period Temperatures DC l\1e3ll'i (weeks) 25 30 35 40 45 of periods
One 4.00 4.10 4.00 3.60 2AO 3.60
Two 4.10 4.10 4.00 3.70 I 2.50 3.70
Three 4.40 4.20 3.90 3.90 2.90 3.80
Four 4.50 4.30 4.10 3.90 3.60 ·uo Means of treatment 4.20 4.20 4.00 3.80 2.90 L.S.D. at 5% for time O.oz L.S.D. at 5 % for temperature 0.02 L.S.D. at 5 % for interaction 0.05
The total fungal counts in polluted soil amended with N.P.K. was more than 10-
fold lower at 45°C than at any of the other temperatures tested. The best temperatures
for fungi seemed to be between 25 and 30°C (Table 36).
7.4 Discussion
The effect of soil moisture content as a factor required for bioremediation on the
microbial activity in petroleum contaminated soil was studied. Data obtained show that
the total bacterial and fungal counts and CO2 evolution of non-petroleum contaminated
soil increased during the course of the experiment reaching its maximum values at the
4th week. Generally higher total mean count of bacteria and fungi and C02 production
were obtained when the soil contained moisture. Respiration was almost 50 times
higher at 50% WHC compared to soil that was kept dry. Water is important to plants
and microbes (Eweis et al.,1998). Water is not only a major component of living
organisms, it also serves as transport medium to carry nutrients to biota and carry
wastes away. If the moisture content of the soil is low, there will be a loss of microbial
activity (Frick et aI., 1999).
Similarly, it could be shown that the total bacterial count of soil contaminated
with petroleum oil increased significantly as the time of incubation period increased
reaching their maximum at the 4th week. The population of aerobic bacteria increased
- 94-
significantly as the levels of soil moisture content increased reaching their maximum at
70% soil moisture content during the different incubation periods.
As reported by Alexander (1961), soil moisture content affects the rate of waste
breakdown reaching maximum microbial activity when the optimum moisture averaged
50-80% of the water holding capacity of a given soil, while Dibble and Bartha (1979)
reported that optimal rates of sludge degradation in soil occurring at 30-90ge water
saturation.
It was therefore expected that hydrocarbon degradation in the dry soils of Saudi
Arabia could be dramatically improved just by irrigation or by devising means that
preserve soil moisture.
- 95 -

C~PTER. EIG-I-IT Ability of Trichoderma harzianum (strain T22) to degrade petroleum
crude oil
8.1 Introduction
Trichoderma spp. have potential for use in the remediation of pollutants in soil
(Harman et ai., 2004a,b; Lynch and Moffat,2005). Furthermore. Trichodenna spp. are
highly resistant to a range of toxicants, including cyanide (Ezzi and Lynch. 2002.
2005a,b; Ezzi et ai, 2003) and heavy metals (Adams et ai, 2007a,b). Trichodenna
harzianum strain T22 was shown to break down anthracene completely to CO2 (Ermisch
et ai., 1990). Furthermore, Trichoderma harzianum (T22) is rhizosphere competent.
meaning that it will grow effectively on the root systems of plants. It is claimed that T22
will associate and grow on the roots of any plant species and in soil, but the extent of
colonization will depend on the physical growth conditions including suitable
temperature, soil water content and nutritional content (Harman et al ., 2004 a).
Strategies to accelerate the biological breakdown of petroleum hydrocarbons in
soil include stimulation of the used inoculant (i.e., T.har~ial111m) by optimizing the
nutrients, humidity, oxygen and the temperature and physical conditions
(biostimulation). This study will attempt to demonstrate the role of T22 to degrade
petroleum crude oil in soil under a range of growth conditions in the laboratory.
8.2 Materials and Methods
Soil was polluted with petroleum crude oil at a rate of 200gl800g soil and mixed
thoroughly for 30 min. After mixing the soil was added to flasks of 500ml each one
containing 300g of soil sample with water content corrected to 60';( of the soil's water
holding capacity. A number of flasks were inoculated with a spore suspension of
T.har;.ianum (T22) at a rate of 1 glkg soil at the start of the experiment. All flasks were
incubated at 30o±2°C for 4 weeks. Flasks were weighed daily and water was added to
maintain moisture at 60% WHC. Four replicates were used for each of the following
treatments:
1. untreated soil (control)
2. soil polluted with petroleum crude oil
- 96-

3. soil inoculated with Trichoderma har:.ianum (T22)
4. polluted soil inoculated with Trichoderma har;ianum (T22)
As before, soil samples were taken weekly for microbial analysis including total
bacterial counts and specific hydrocarbon degraders as mentioned before. CO2
and some
degradable hydrocarbons present in petroleum crude oil were quantified using standard
peak area obtained using GC-MS analysis.
8.3 Results
8.3.1 Total bacterial counts in polluted soil inoculated with
T.harzianum (T22)
Table 35: Average number of total bacteria (log cfu/g dry soil) in soil polluted with petroleum crude oil at a rate of 200gl800g soil and inoculated with a spore suspension of Trichoderma harzianum at a rate of Ig/kg soil. The soil was incubated for 4 weeks at 30o±rC, addition of N.K.P and 60% water holding capacity of the soil in laboratory. Populations were quantified using dilution plating onto soil extract medium (n=4).
(Log cfulg dry weight soil)
Polluted Non-polluted I\lcan effect Time (week)
of time T22 Without T22 T22 Without T22
1 4.63 4.51 4.17 3.79 4.28 2 5.05 4.95 4045 4.51 4.74 3 5.17 5.04 3.94 4.98 4.78 4 6.08 5.22 6.15 6.26 5.93 Polluted X T22 5.23 4.93 4.68 4.89
Mean effect of polluted 5.08 4.78
Mean effect of T22 4.95 4.91 LSD at 0.05 for time 0.28 LSD at 0.05 for polluted 0.20 LSD at 0.05 forT22 N.S LSD at 0.05 for pollutedxT22 0.28 LSD at 0.05 for interaction 0.55
Table 35 shows that the total heterotrophic bacterial counts in the non-polluted
soil inoculated with T22 or without, generally increased 100 fold (P < 0.05) over the 4
week incubation period, reaching its maximum on the 4th week. In
microbial populations inoculated with T22 increased 2 fold. while
population in non-inoculated soil decreased slightly (Table 35).
- 97-
polluted soil
the hacterial

8.3.2 Total hydrocarbon degraders in polluted soil inoculated \lith
T.harzianum (T22)
Table 36: Effect of soil inoculation (as spore suspension at rate of 1 g/kg soil) \\ith T.harzianum (T22) on total hydrocarbon degraders (log mpn/g dry soil) in soil polluted with petroleum crude oil at a rate of 200g/800 g soil. Soil was incubated for 4 weeks under optimal conditions in the laboratory (300±2°C, addition of N.K.P and 60% water holding capacity of the soil). Populations were quantified in separate 96-well microtiter plate method on Bushnell-Hass medium (n=4).
(Log mpn/g dry weight soil )
Polluted Non polluted
Time (week) Mean effect
T22 Without T22 T22 Without T22 of time
0 4.38 4.27 433 4.05 4.26
I 4.45 4.47 4.16 4.40 4.37
2 4.57 4.83 4.05 4.39 4.46
3 4.96 434 4.10 4.74 4.54
4 5.59 4.40 4.70 3.97 4.67
Polluted x T22 4.80 4.46 4.27 4.31
Mean effect of polluted 4.63 4.29
Mean effect of T22 4.53 439
LSD at 0.05 for polluted 0.12
LSD at 0.05 for T22 0.12
LSD at 0.05 for time 0.19
LSD at 0.05 for polluted x T22 0.17
LSD at 0.05 for interaction 0.38
Table 36 shows that the total number of hydrocarbon degraders (log mpnJdw) in
soil polluted with crude oil increased slightly during the 4- week incubation period
hi · . t the 4th week The T')') inoculated polluted soil showed a reac ng Its maXlffium a .--
sudden 4 fold increase in the number of hydrocarbon degraders between week 3 and 4.
None of the other treatments showed this trend. In non-polluted soil the number of
hydrocarbon degraders remained constant over the entire incubation period (Table 36).
- 98 -

8.3.3 CO2 evolution from polluted soil inoculated with T.harziallul1l
(T22)
Table 37: .Carbon dioxide evolution (C02ffiglkg/h dry weight soil) from soil polluted WIth petroleum crude oil at a rate of 200g/800g soil Wl'th d 'th t . I' , h ' an \\1 ou mo~u atJon ~~ T,?arzranum (T22). Soils were incubated for 4 weeks under optll~al condl.tlOns m laboratory (300±2°C, addition of N.P.K and 60% water holdmg capacIty of the soil) (n=4).
(C02 mglh/kg dry weight soil)
Time (week) Polluted Without polluted !\lean effect of
T22 Without TI2 T22 Without T22 time
0 0.01 0.00 0.00 0.01 0.01
1 0.04 0.02 0.00 0.01 0.02
2 0.06 0.05 0.01 0.03 0.04
3 0.09 0.07 0.02 0.05 0.06
4 0.13 0.10 0.03 0.08 0.08
Polluted X T22 0.07 0.05 0.02 0.04
Mean effect of pollution 0.06 0.03
Mean effect of T22 0.04 0.04
LSD at 0.05 for time 0.002
LSD at 0.05 for polluted 0.002
LSD at 0.05 for T22 0.002
LSD at 0.05 for pollutedxT22 0.002
LSD at 0.05 for interaction 0.005
CO2 evolution increased significantly over time in all treatments (Table, 37).
Pollution of soil with petroleum crude oil more than doubled CO2 evolution from 0.026
to 0.057 CO2 mg/kg/h dw soil compared with CO2 evolved from non-polluted soil
(Table 37).
Inoculation of polluted soil with petroleum crude oil with T.har::.ianum (T22
strain) significantly increased the respiration from 0.050 to 0.065 CO2 mglkglh dw
(30% increases). The opposite trend was observed in non-polluted soil where T22
inoculation resulted in a decrease of the respiration rate from 0.036 to 0.015 C02
mglkg/h dw soil (58.33% decreases) compared to treatments without T22 (Table 37).
- 99-
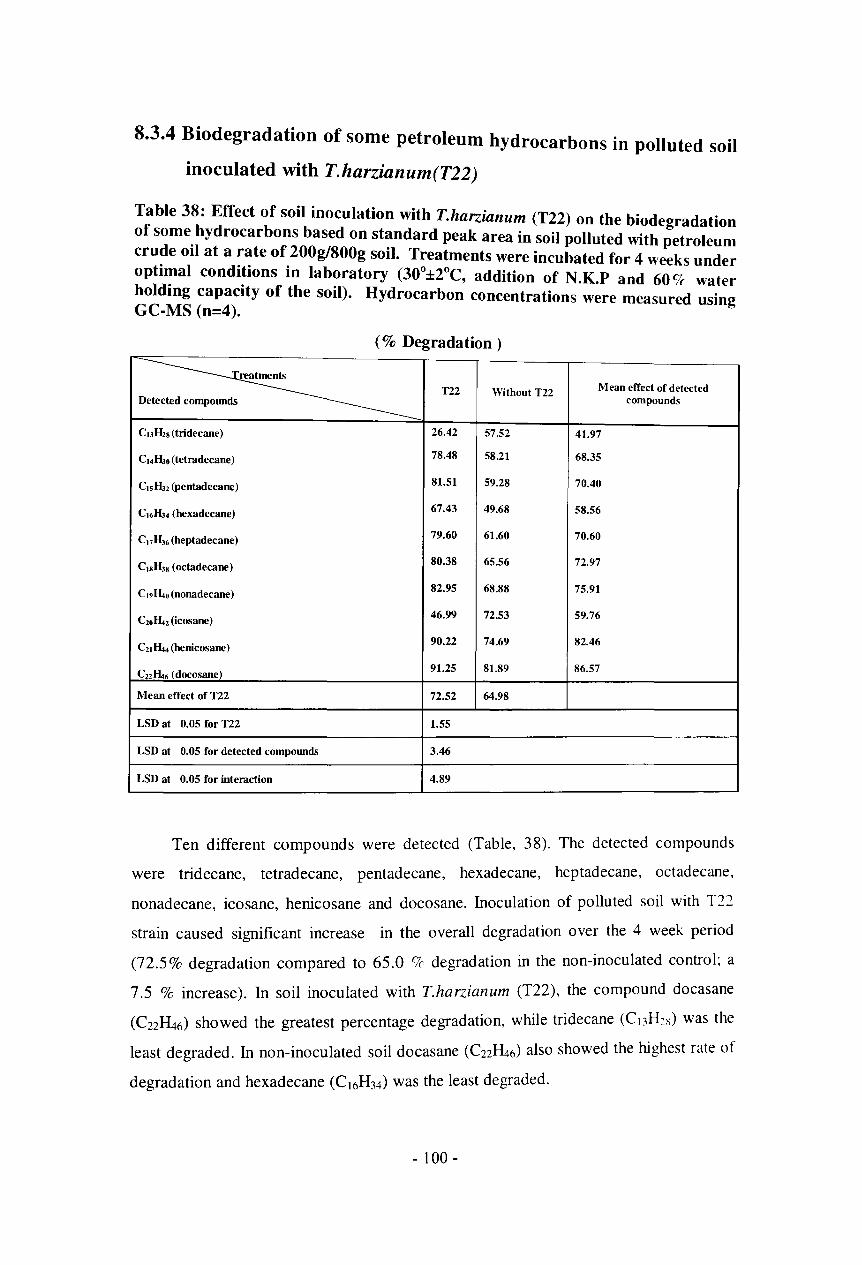
8.3.4 Biodegradation of some petroleum hydroca b ' II d ' r ons In po ute sod inoculated with T.harzianum(T22)
Table 38: Effect of soil inoculation with T harzianum (T22) th b' d d' f h 'on e 10 egra atlOn o some, ydrocarbons based on st~ndard peak area in soil polluted with petroleum crude 011 at a rate of 200gl800g soIl. Treatments were incubated tor 4 w k d
t ' I d't' 'I ee s un er op Ima con I Ions m aboratory (300±2°C addition of N K P d 60r7 hid" " ,an -IC water o mg capacity of the soil), Hydrocarbon concentrations were measured using
GC-MS (n=4),
(% Degradation)
~ T22 Without T22 Mean effect of detected Detected compounds compounds
C\3ILs (tridecane) 26.42 57.52 41.97
C14 HaO (tetradecane) 78.48 58.21 68.35
C1SHa2 (pentadecane) 81.51 59.28 70.40
C16Ha4 (hexadecane) 67.43 49.68 58.56
C17Hl6 (heptadecane) 79.60 61.60 70.60
CUHlS (octadecane) 80.38 65.56 72.97
C I9aO(nonadecane) 82.95 68.88 75.91
C2oH42 (icosane) 46.99 72.53 59.76
C21a4 (henicosane) 90.22 74.69 82.46
C22a6 (docosane) 91.25 81.89 86.57
Mean effect of T22 72.52 64.98
LSD at 0.05 for T22 1.55
LSD at 0.05 for detected compounds 3.46
LSD at 0.05 for interaction 4.89
Ten different compounds were detected (Table, 38). The detected compounds
were tridecane, tetrad ecane , pentadecane, hexadecane, heptadecane, octadecane,
nonadecane, icosane, henicosane and docosane. Inoculation of polluted soil with T22
strain caused significant increase in the overall degradation over the 4 week period
(72.5% degradation compared to 65.0 o/c degradation in the non-inoculated control; a
7.5 % increase). In soil inoculated with T.harzianum (T22), the compound docasane
(C22~6) showed the greatest percentage degradation, while tridecane (C13H2X) was the
least degraded. In non-inoculated soil docasane (C22~6) also showed the highest rate of
degradation and hexadecane (C I6H34) was the least degraded.
- 100 -
8.4 Discussion
In general the study showed that most of the total bacterial and total hydrocarbon
degrader population in the treatments increased as the time of incubation period
increased reaching its maximum on the 4th week. These results are in line with those of
Amadi and Odu (1993) who reported a gradual increase in microbial numbers followin a c
the application of petroleum hydrocarbon to soil under optimal conditions for microbial
growth. T22 inoculation into non-polluted soil resulted in a slight decrease in the
bacterial counts. As reported by Harman (2006) the T22 strain of T.harzianum is known
to antagonize several microorganisms in-vitro and in soil due to production of
antibiotics. It is possible that this has led to the observed effects.
This study shows that pollution of soil with petroleum crude oil more than
doubled CO2 evolution as compared to that in non-polluted soil control. CO2 is the final
product of the oxidation of the carbonaceaus compounds in soil. The soil used in this
experiment contained very little natural organic matter. It must therefore be assumed
that this increase in CO2 evolution is mainly contributed by the degradation of
hydrocarbons. Namkoong et ai. (2002) verified that degradation of total petroleum
hydrocarbon was related to microbial respiration. On the other hand, Franco et al.
(2004) reported that contamination with crude oil caused a variable increase in the
cumulative CO2 emissions, this increase was not only due to the mineralization of crude
oil components, but included the stress response of soil microbial biomass to
contamination. Inoculation of petroleum polluted soil with T.harzianum T22
significantly increased the respiration rate by 309c. These results are in line with the
work of Ezzi (200 I) and Harman et al. (2004). They stated that Trichodenna spp. have
a wide range of metabolic activities that could be used in the bioremediation of
pollutants. The fungus also physically absorbed >80lff of added anthracene (Ermisch et
ai., 1990) and can tolerate pyrene and phenanthrene (da Silva et al., 2003). It is
therefore possible that the fungus itself played a direct role in the degradation of several
of the hydrocarbons present in crude oil.
The analysis of crude oil hydrocarbons by GC/MS is a powerful measurement to
evaluate oil biodegradation. The present data detected ten different degradable
compounds in petroleum polluted soil, i.e., tridecane, tetradecane. pentadecane.
hexadecane, octadecane, nonadecane, icosane, henicosane and docosane. Inoculation
with T22 strain caused an increase in the degradation percentage of some of the detected
compounds but a decrease in degradation of others. This suggests agam
- 101 -
that
Trichodenna metabolises some compounds more effectively than others. Combined
with the observation that Trichodenna reduced the population of indigenous
hydrocarbon degraders, this might explain that some compounds which the fungus did
not degrade accumulated in the Trichodenna inoculated treatments.
The results presented here show that the bioremediation of soil that is polluted
with petroleum hydrocarbon can be enhanced by treating the polluted soil \vith
T.harzianum strain T22.
- 102 -

CIIA.PTER. ~I~E Enhancing bioremediation of petroleum crude oil in arid soils using
polyethylene cover and hydrogel
9.1 Introduction
Studies have shown that several agro-technical methods including. cover with
polyethylene sheets, watering, addition of hydrophilic polymers (hydrogels) and mineral
fertilizers can be used to increase microbial activity and therefore could facilitate the
oxidation of easily degradable petroleum components (Rhykerd et al., 1999; Marin et
ai., 2005; Kogbara, 2008).
The soil is a key component of natural ecosystems because environmental
sustainability depends largely on optimal functioning soil ecosystem (Adriano et al.,
1998). When soil is polluted with petroleum crude oil, the ecosystem is altered, and
microbial activities are affected partly as a result of impeded oxygen exchange between
soil and atmosphere due to hydrophobic properties of oil (Atlas, 1977). The fate and
effects of spilled crude oil and petroleum products in soils have already been the subject
of several studies (Atlas, 1977; Walworth and Reynolds. 1995). Soils contaminated by
crude oil spills in Kuwait, during the Gulf War. have been classified as slightly polluted
when contaminated with up to 3% crude oil and heavily polluted if polluted with 6\7c to
8% crude oil (AI-Awadhi et ai., 1996).
Remediation of petroleum-contaminated systems could be achieved by either
physicochemical or biological methods. Soil moisture. i.e., water is an essential
component for microorganisms and therefore biodegradation of petroleum oil requires
water for microbial growth. Besides its inherent importance for microbial activity.
water also allows diffusion of nutrients and waste by-products (Hoeppel and Hinchee,
1994). Dibble and Bartha (1979) demonstrated that biodegradation of an oily sludge
within a sandy loam soil was enhanced when the soil water content ranged from 20-8or~
of its water holding capacity. Stegmenn (1994) found that the optimal biodegradation of
diesel fuel occurred at a moisture content of 60% of field capacity.
A great number of reports deal with the response of soil moisture to plastic cover.
Asano et al. (1981) reported that covering the surface of the soil with polyethylene film
resulted in a reduction of 25-30% of the water requirement of crops. HanaJa (1991 )
reported that cover with transparent plastic has a number of effects: it increased the soil
- 103 -
temperature, can preserve soil moisture, affect soil texture and fertility. and can lead to
more effective control of weeds, pests and diseases. Covering (soil cover with
polyethylene) may prove beneficial for plant growth through modifying soil
temperature, reducing evaporation, a reduction in weed competition, less soil
compaction and reduced erosion.
Considerable attention has been paid in the last few decades to using synthesized
soil conditioners to promote plant growth in sandy soils. Among these conditioners are
super absorbent materials, i.e., hydrogel (EI-Hady, 1987). Hydrophilic polymers
(hydrogels) can alter soil properties, since they often absorb many times their weight of
water. Hydrogels influence water infiltration rates, soil density and structure (Helalia
and Letey, 1988) and evaporation rates (Tayel and El-Hady, 1981). The addition of
hydrogel to a sandy soil changed the water holding capacity to be comparable to silty
clay or loamy soil (Huttermann et al., 1990). Furthermore, hydrogel addition improved
water storage properties of porous soils and resulted in the delay and onset of permanent
wilting when subjected to intense evaporation (Akhter et al.. 2004). Because
polyethylene cover and addition of hydrogel stimulate biological activity in soil this
study investigated if these measures could lead to enhanced bioremediation of soils that
were heavily polluted with crude oil.
9.2 Materials and Methods
To determine the effect of polyethylene plastic cover and hydrogel treated soil, the
total water holding capacity (60%) of the wet soil was determined on a basis of oven dry
weight at 105°C for 24h. Non-polluted and soil polluted with petroleum at a rate of
75glkg soil were mixed thoroughly before being placed in 30cm diam. plastic pots as
mentioned before. The following treatments were established, each replicated .+ times:
1. Non-Polluted soil
2. Crude oil polluted soil
3. Non-polluted soil covered with polyethylene
4. Polluted soil covered with polyethylene
5. Non-polluted soil amended with hydrogel (2g1kg)
- 104-

6. Polluted soil amended with hydrogel (2 g/kg)
7. Non-polluted soil covered with polyethylene and amended with hydrogel
8. Polluted soil covered with polyethylene and amended with hydrogel
Pots were placed in a completely randomized design in a greenhouse at
a constant temperature of 30°C. Pots were weighted every day over a period of 6 weeks
to determine water loss. Soil samples were also taken weekly to determine CO2
evolution, and hydrocarbon degradation was quantified using GCIMS after -l and 6
weeks.
9.3 Results
9.3.1 Effect of covering soil with polyethylene and amendment of
hydrogel on water loss
Table 39: Percentage water loss of saturated sand soil contaminated with petroleum crude oil (75 g/kg soil). Treatments including covering soil with white polyethylene and amendment with 2g1kg hydrogel, were compared during a 6 week incubation period in greenhouse at 30o±2°C (n=4).
(Water loss %)
PolJuted Non polluted Mean Cover
Non Cover
Non effect Time (week) + Hydro- + Hydro- of time Cover Cover
gel Hydro- gel treated
Hydro-treated
-.&el I:cl 1 1.11 3.11 6.89 8.25 0.05 0.11 5.28 8.57 4.17 2 1.36 3.35 8.33 9.02 0.16 0.25 7.73 10.05 5.03 3 1.56 3.57 8.84 9.45 0.45 0.50 9.25 10.73 5.54 4 1.75 3.69 9.21 9.83 0.61 0.72 10.35 11.50 5.96 5 1.93 3.91 9.58 10.28 0.88 0.99 11.01 11.84 6.30 6 2.17 4.00 9.77 10.50 1.11 1.22 11.45 11.95 6.52 Polluted x treatments 1.65 3.61 8.77 9.56 0.54 0.63 9.18 10.77
Mean effect of polluted 5.89 5.28
Mean effect of treatments 10.16 I 2.12 1 8.97 [1.09
LSD at 0.05 for time 0.62
LSD at 0.05 for polluted 0.36
LSD at 0.05 for treatments 0.51
LSD at 0.05 for polluted x treatments 0.71
- 105 -

Percentage water loss in polluted soil was between 8.25 and 10.50llc Iweek and
between 8.56 and 11.95%1 week in non-polluted soil (Table 39). Data also showed that
at all sampling times water loss from covered soil was 2.5 times lower in polluted soil
and ten to twenty times lower in non polluted soil compared to non-covered soil.
Application of hydrogel, as a soil treatment only, slightly decreased the percentage of
water loss by an average of around 10% compared to the non-amended control. Soil
with polyethylene cover and hydrogel showed the greatest decrease of the percentage of
water loss in polluted and non-polluted soil. The application of both polyethylene coyer
and hydrogel to polluted and non-polluted soil significantly decreased the percentage
water loss from 9.55 to 1.64%/week (a six fold decrease) in the polluted soil and from
10.77 to 0.54%/week (a 20 fold decrease) in the non-polluted soil.
9.3.2 Effect of covering soil with polyethylene and amendment of hydrogel on CO2 evolution from polluted and non-polluted soil.
Table 40: Carbon dioxide evolution from soil polluted with petroleum crude oil at a rate of 75g/kg soil when covered with polyethylene and/or amended with hydrogel at a rate of 2 g/kg soil during 4 week incubation at 30o±2°C (n=4).
(C02mglh/kg dry weight soil) _ .. .-
Polluted Non polluted I\lean
Cover Hydro-Non Cover + Hydro-
!lion ElTect Time (week) gel gel Of + Cover Cover Hydro- Hydro-
treated time treated gel gel
0 0.03 0.06 0.03 0.03 0.03 0.03 0.02 0.02 0.03
1 0.09 0.07 0.07 0.05 0.10 0.08 0.08 0.05 0.07
2 0.11 0.10 0.09 0.07 0.13 0.11 0.11 0.08 0.10
3 0.13 0.11 0.12 0.09 0.16 0.13 0.13 0.10 0.12
4 0.14 0.13 0.13 0.10 0.17 0.15 0.15 0.12 0.J.t
Polluted x treatments 0.10 0.09 0.09 0.07 0.12 0.10 0.10 0.07
Mean effect of polluted 0.09 0.095
Mean effect of treatments 0.07 1 0.10 0.09 0.11
LSD at 0.05 for time 0.01 --1
LSD at 0.05 for polluted 0.004
LSD at 0.05 for treatments 0.004
LSD at 0.05 for polluted x treatments N.S
The rate of C02 evolution in petroleum polluted soil that was covered with
. I· h ·n Table'+O The respiration rate polyethylene cover or amended WIth hydroge IS s own I .
was initially low but increased over the incubation period. Application of polyethylene
- 106-

cover and hydrogel alone in polluted soil increased CO2 evolution from 0.066 to 0.093
CO2 mglkg/h dw soil (41 % increases) and from 0.066 to 0.088 mg CO:/kglh dw (33((
increases), respectively. The same trend was also observed in non-polluted soil. A
combination of polyethylene cover and hydrogel significantly increased CO2
evolution
by around 50% in both polluted and non-polluted soil compared with the corresponding
non-treated controls (Table 40).
9.3.3 Effect of covering soil with polyethylene and amendment of
hydrogel on the biodegradation of some hydrocarbons in soil
Table 41: Effect of white polyethylene cover and hydrogel on the biodegradation of hydrocarbons. Assessments are based on standard peak area of the selected hydrocarbons in soil that was initially polluted with crude oil at a rate of 75 g/kg soil. GC-MS measurements were taken after 4 and 6 weeks from soil that was incubated at 30o±2°C (n=4).
(Degradation %)
Cover+ H..1d~el Cover Hvdrt!Kel Non treated
~ Week Week Week Week Week Week Week Week 4 6 4 6 4 6 4 6 Detected compounds
Cul:lu; (dodecane) 55.08 90.34 52.89 97.56 81.13 73.25 42.93 38.74
C\JH28 (tridecane) 98.08 98.14 39.23 98.30 71.08 76.20 28.60 54.35
C14H JO (tetradecane) 97.69 98.43 97.19 99.17 75.00 81.59 58.18 76.32
C.sH32 (pentadecane) 98.89 99.60 96.61 94.97 66.47 71.93 35.45 54.44
C.JI34 (hexadecane) 99.21 99.69 97.78 95.88 77.97 73.45 36.33 82.33
C.7H~heptadecan~ 99.13 99.73 93.56 91.87 84.66 70.04 48.39 37.02
Treatments x time 91.35 97.66 79.55 96.29 76.05 74.41 41.64 57.20
Mean effect of treatments 94.50 87.92 75.23 49.42 Mean effect of time 72.15 81.39
LSD at 0.05 for treatments 5.023
LSD at 0.05 for time 3.56 LSD at 0.05 for detected compounds 6.16 LSD at 0.05 for treatments x time 7.11 LSD at 0.05 for interaction 17.41
Generally, percentage degradation of selected hydrocarbons
significantly over the course of the experiment.
Mean effect of detected com~und
66.49
70.50
85.45
77.30
82.83
78.05
increased
Covering polluted soil with polyethylene significantly increased degradation of the
hydrocarbons from 49.4% (in the non-treated soil) to 87.99C (38.5 clc increases). Also,
application of hydrogel to soil significantly increased the degradation of hydrocarbons
by 52.2% compared with the non-treated soil. Combination of polyethylene coyer and
- 107 -

hydrogel was the best treatment resulting in a 91 ') C1 ill h d b ' .~ I( crease III Y' rocar on
degradation compared with the non-treated control.
9.4 Discussion
The objective of this experiment was to study if methods aimed at preserYing the
water content in soil could enhance microbial hydrocarbon degradation significantly.
9.4.1. Effect of polyethylene cover and hydrogel on water loss
It was shown that the water loss under polyethylene cover was reduced by
62.3% in polluted soil and by 94.1 % in non polluted soil compared to non-covered soil.
As reported by Hoepel and Hinchee (1994) soil moisture is essential for microbial
activity, including microbial activity that leads to the oxidation of hydrocarbons. The
results of moisture retention are therefore in agreement with previous reports on the
beneficial effect of polyethylene cover through its effectiveness on conservation of soil
moisture as reported by Waggoner et ai. (1960); Asano et al. (1981); Hanada (1991)
and Mahajan et ai. (2007). Interestingly in our experiment water conservation was
better in non-polluted soil than in polluted soil. It is likely that polluted soil was more
hydrophobic resulting in the added water not being able to penetrate into the finer soil
pores. The water in larger soil pores would be more prone to drainage and evaporation.
Application of hydrogel also decreased water loss by an average of 8.27r in
polluted soil and by 14.8% in non polluted soil compared to non-amended bare soil.
Many studies related to application of hydrogels in horticulture have been reported
(Wang and Gregg, 1990; Akhter et ai., 2004; El-Hady et ai., 2006) and we have shown
here that its use in bioremediation seems highly effective.
The present study also indicated that covering of soil with polyethylene was more
effective in reducing water loss from soil than hydrogel which may be due to the limited
ability of hydrogel to absorb water. However, application of a combination of
polyethylene cover and hydrogel decreased water loss most and would encourage
microbial activity the most. This suggests the bioremediation of polluted soil can be
carried out by treating the soil with polyethylene cover in combination with hydrogel.
- 108 -

9.4.2. Effect of polyethylene cover and hydrogel on CO2
respiration
Application of both polluted and non polluted soil with polyethylene cover in
combination with hydrogel significantly increased CO2 evolution by 48.5 and 56.8S'(
respectively, compared with non-treated soil. As mentioned before the amendment with
hydrogel in combination with polyethylene cover improves moisture availability and
this most likely provided the indigenous microorganisms with available water for
growth and respiration (Akhter et al., 2004).
Amendment with hydrogel and polyethylene cover resulted in soil conditions that
stimulated the growth and activity of hydrocarbon degrading microorganisms and since
hydrocarbons were the most common carbon sources in the soil it can be assumed that
the CO2 evolved was the end product of hydrocarbon degradation.
9.4.3. Effect of polyethylene cover and hydrogel on the percentage
degradation of detected compounds
Six different degradable compounds in petroleum polluted soil were quantified
1.e., dodecane, tridecane, tetradecane, pentadecane, hexadecane, and heptadecane.
Dodecane and tridecane are more likely to volatilize from soil as they are lighter than
pentadecane, hexadecane and heptadecane.
Oil polluted soil covered with polyethylene and/or amended with hydrogel
significantly increased degradation of these compounds. The highest percentage
degradation was recorded in polluted soil with the combination of polyethylene and
hydrogel which most probably resulted in more conductive conditions for hydrocarbon
degradation in terms of available water that could be used by hydrocarbon degrading
microorganisms. This was indicated by high microbial counts. This suggests the fastest
bioremediation of polluted desert soil can be achieved by treating the petroleum
polluted soil with polyethylene cover in combination with applications of hydrogel.
- 109 -
C~PTER..TE~
Efficacy of Trichoderma harzianum (T22) inoculation, hydrogel and polyethylene cover on the biodegradation of petroleum crude oil in
field trials
10.1 Introduction
Bioremediation of polluted soil is increasingly recognized as a treatment
technology for polluted soils (Wang and Bartha, 1990). In order to improve the natural
tendency of soil microorganisms to decompose hydrocarbons, many techniques have
been proposed and tested including mineral fertilization (Kogbara, 2008) and organic
amendments (investigated by Franco et ai., 2004). They also studied the effect of
glucose and maize compost on crude oil degradation. Sims and Sims (1999) proposed
many techniques of land farming to improve the natural tendency of soil microorganisms
to decompose hydrocarbons and tested mineral fertilization, organic amendments,
cropping systems, etc.
The application of hydro gels is an important practice to assist seedling growth and
establishment, by increasing the water holding capacity of soils and regulating the plant
available water supplies, particularly under arid conditions (Akhter et at., 200.+).
Synthetic polymers in the form of crystals or tiny beads available under trade names
such as super absorbent polymers, root watering crystals and drought crystals are
collectively known as hydrogels. They have enormous capacity to absorb water and
make it available to plants over an extended period of time. Many studies related to the
application of hydrogels in horticulture have been reported (Wang and Gregg, 1990;
Akhter et at., 2004).
Heavy crude oil has higher reSIn and asphaltine than light crude oil, these
compounds do not biodegrade easily and remain in soil for many years (Walker et at.,
1976). On the other hand, some gaseous and volatile hydrocarbons are often toxic to
biological systems in soil (Atlas, 1975). Shahriari et al. (2007) showed that the
germination, number of leaves and total dry biomass of alfalfa plants decreased by
increasing light crude oil concentrations in soil.
The existence of bacteria within an extremely broad range of environmental
conditions coupled with the ability of certain species of hydrocarbon-utilizing bacteria
- 110-

to degrade petroleum in contaminated soils, when given the right metabolic feedstock to
stimulate their growth and multiplications, have been previously reported (Huy et al ..
1999 ; Okerentugba and Ezeronye, 2003).
Exposure to petroleum oil causes changes in the populations and activity of the
microbial community (Braddock and Richter, 1998). Hydrocarbon contamination can
also lead to an increase in populations of microorganisms that utilize the intermediate
products of hydrocarbon metabolism (Bartha and Atlas. 1987). These authors also found
that increases in microbial popUlations after hydrocarbon contamination can be found in
different environments including soils and marine sediments.
Phytoremediation as a means of cleaning up petroleum polluted soil has gained
popularity during the last decade due its convenience and low costs of installation and
maintenance. When the target pollutant is biodegradable, this technology exploits the
stimulating effect that roots have on microbial processes and physical/chemical
modifications in the rhizosphere that result from the release of root exudates (Oner and
Eyval, 2003).
Recently, more hazardous wastes have been treated usmg phytoremediation
(Cunningham et ai., 1996; Hutchinson et al., 2001; Tischer and Hubner, 2002). The
presence of plant roots and increased microbial popUlations significantly improved both
the physical structure of the soil and hydrocarbon degradation (Tischer and Huener,
2002).
Udo and Fayemi (1975) demonstrated that hydrocarbon additions to the soil at a
rate of 10.6% (w/w) impeded germination of maize plants. In fact these authors
observed a reduction in plant growth at hydrocarbon concentrations as law as 1 C;(. This
poor plant growth was attributed to the exclusion of air from the soil due to the
contaminants interfering with soil/water relationships, and also to the depletion of
oxygen resulting from the microbial degradation of the contaminants (Gunderson.
2006).
The effect of soil cover with plastic film on the concentration and form of N in
soil has been studied because of the importance of this nutrient for plant growth. While
studying the effect of mulching on populations of nitrogen fixing bacteria. Linke et al.
(1991) observed that levels of nitrate (N03) in covered soil were lower than tho..,c in
non-covered soil during the rapid growth stage of legumes. The difference was - III -
attributed to accelerated N consumption by plants growing with enhanced VIgor III
covered soil (Hasing, 2002).
Here we look at a combination of treatments including inoculation of plants with
Trichodenna harzianum (T22) as well as polyethylene cover and amendment with
hydrogel on the degradation of crude oil applied to small desert field I t po s.
10.2 Materials and Methods
During 2007, a completely randomized field experiment with three replications
for each treatment was conducted on a sandy soil at the Faculty of Science farm, King
Abdel-Aziz University, Jeddah, Saudi Arabia as follows:
The area under study was divided into two plots and every plot was divided into .3
rows (lm in length 0.30 m width and 30 em depth). One plot was the control
(unpolluted plot), the other plot was polluted with petroleum crude oil by mixing 7') g
crude oil /kg soil up to a depth of 30 cm. After 10 days, soil of three rows in the polluted
and non polluted plots were inoculated with T.har-;.ianum (T22) or treated with hydrogel
at 2g/kg soil at a depth 30cm then covered with white polyethylene cover (El-Hady ct
aI., 2008). Soil moisture was measured using a laboratory cabinet dryer at 105"C to
remove residual water. The normal rate of sowing used for pure sands was 25 kg maize
seeds per hectare. Chemical fertilizers were added to the soil before sowing, ammonium
nitrate, calcium super phosphate and potassium sulphate at the rate of 22.5, 15.0 and 7.5
g/plot, respectively, as mentioned before.
Germination and biomass: the percentage germination and plant height (em/plant)
were determined 2, 4, 6 and 8 weeks after planting. Also, plant biomass was measured.
Roots and shoots were measured separately, dried at 80°C and expressed as dry weight
(g/plant).
Enumeration of microorganisms: changes in microbial nutrients in the rhizosphere of
maize plant were monitored using spread plating for total bacterial counts and a most
probable number (mpn) technique for total hydrocarbon degraders as described before.
Soil respiration measurements: in-vitro respiration rates of soil sample were
determined by measuring carbon dioxide evolution rates in biometric flasks according
to the procedure of Rowell (1994) as described before. - 112 -
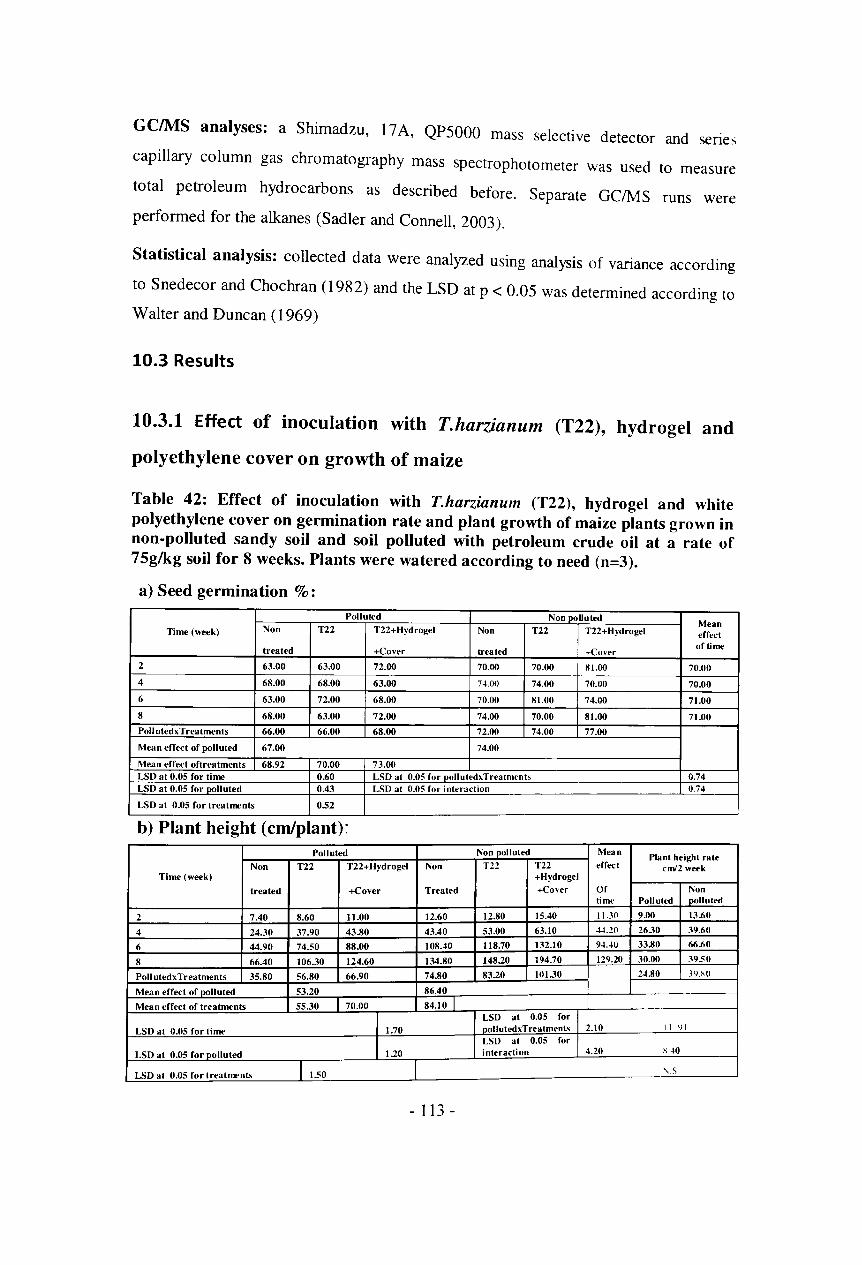
GelMS analyses: a Shimadzu, 17 A, QP5000 mass selective detector and senes
capillary column gas chromatography mass spectrophotometer was used to measure
total petroleum hydrocarbons as described before. Separate GCIMS runs were
performed for the alkanes (Sadler and Connell, 2003).
Statistical analysis: collected data were analyzed using analysis of variance according
to Snedecor and Chochran (1982) and the LSD at p < 0.05 was determined according to
Walter and Duncan (1969)
10.3 Results
10.3.1 Effect of inoculation with T.harzianum (T22), hydrogel and
polyethylene cover on growth of maize
Table 42: Effect of inoculation with T.harzianum (T22), hydrogel and white polyethylene cover on germination rate and plant growth of maize plants grown in non-polluted sandy soil and soil polluted with petroleum crude oil at a rate of 7Sg/kg soil for 8 weeks. Plants were watered according to need (n=3).
a) Seed germination %:
Polluted Non poUuted Mean
Time (week) Non T22 T22+Hydrogei Non T22 T22+Hydrogel effect
treated +Cover treated +Cover ortime
2 63.00 63.00 72.00 70.00 70.00 81.00 70.00
4 68.00 68.00 63.00 7.t.lH) 74.00 70.00 70.00
6 63.00 72.00 68.00 70.00 81.00 74.00 71.00
8 68.00 63.00 72.00 74.00 70.00 81.00 71.00
PollutedxTreatments 66.00 66.00 68.00 72.00 74.00 77.00
Mean effect of polluted 67.00 74.00
Mean effect of treatments 68.92 70.00 73.00 LSD at 0.05 for time 0.60 LSD at 0.05 for pollutedxTreatment, 0.74 LSD at 0.05 for polluted 0.43 LSD at 0.05 for interaction 0.74
LSD at 0.05 for treatments 0.52
b) Plant height (em/plant): Polluted Non polluted Mean Plant height rate
Non T22 T22+Hydrogel Non T22 T22 effect cml2 week Time (week) +Hydrogel
treated +Cover Treated +Cover Of Non time Polluted ~Iuted
2 7.40 8.60 11.00 12.60 12.80 15.40 II.JO 9.00 13.60
4 24.30 37.90 43.80 43.40 53.00 63.10 ~.20 26.30 39.60
6 44.90 74.50 88.00 108.40 118.70 132.10 9.t.40 33.80 66.60
8 66.40 106.30 124.60 134.80 148.20 194.70 129.20 30.00 3950
PollutedxTreatments 35.80 56.80 66.90 74.80 83.20 101.30 24.80 JIJXO
Mean effect of polluted 53.20 86.40
Mean effect of treatments 55.30 70.00 84.10 I LSD at 0.05 for
LSD at 0.05 for time 1.70 pollutedxTreatmenL. 2.10 11 41
LSD at 0.05 for [ SAO 1.20 interaction 4.20 LSD at 0.05 fo~olluted
LSD at 0.05 for treatmenL, 1150 '\s
- 113 -

c) Shoot biomass dry weight (g/plant): Polluted Non poUuted
Time Non Mean Weight rate gl2 week
(week) T22 T22+Hydrogel Non T22 effect (Shoot) treated +Cover treated T22 +Hydrogel ortime
2 0.00 0.00 +Cover Polluted !'Oon polluted
0.10 0.00 0.10 0.10 0.10 0.10 0.10 4 0.10 0.20 0.60 0.30 0.30 1.10 0.40 0.20 6 0.60 1.60 5.80 3.40 4.20
0.50 10.40 4.30 2.30 5.40
8 10.20 14.70 20.40 18.300 34.00 43.00 23.40 12.40 25.80
Poll utedxTreatments 2.70 I 4.10 I 6.70 5.50 9.6 13.60 3.80 7.94 Mean effect of polluted 4.50 9.60 Mean effect of
4.10 I 6.90 110.20 treatments LSD at 0.05 for time 0.40 LSD at 0.05 for pollutedxTreatmenb 0.50 4.60 LSD at 0.05 for polluted 0.30 LSD at 0.05 for interaction 1.00 3.30 LSD at 0.05 for treatments 0.40 6.60
d) Root biomass dry weight (g/plant): Polluted Non polluted
Time Mean Weight rate f!l2 week
(week) Non T22+Hydrogel Non T22+ effect (Root)
Tn treated +Cover treated TZ2 Hydrogel of time +CO\l'r Polluted Non
polluted
2 0.00 (UlII 0.00 0.00 11.00 11.10 0.00 0.00 0.00
4 0.00 (1.I 0 0.50 0.20 0.50 0.60 0.30 O.lO 0.40
6 0.20 0.30 1.30 1.10 1.70 2.40 1.20 0.40 1.30
8 1.70 2.50 9.80 4.00 12.50 15.80 7.70 4.10 9.10
Pollutedx Treatments 0.50 0.70 2.90 1.30 3.70 4.70 1.20 2.70
Mean effect of polluted 1.40 3.20
Mean effect of 13.80 I treatments 0.90 2.20
LSD at 0.05 for time 0.60 LSD at 0.05 for pollutedxTreatments 0.70 2.'10
LSD at 0.05 for polluted 0.40 LSD at 0.05 for interaction lAO I\;S
LSD at 0.05 for I treatments 0.50 "'s
Petroleum crude oil contamination reduced maize germination significantly (P <
0.05) from 74 to 67% (7% decrease) (Table, 42a). Inoculation with T22 in petroleum
polluted soil did not significantly improve, while in non-polluted soil, T22 inoculation
slightly increased maize germination from 72 to 74% (2 % increase).
Treatment of polluted soil with T22 and a combination of white polyethylene
cover and hydrogel significantly enhanced (P < 0.05) seed germination from 66 to 680(
(2% increase). The same trend was obtained in the non-polluted soil where seed
- 114 -
germination increased from 72 to 77 (5% increase) compared with the non-treated
control (Table, 42a).
Data presented in Table 42b show that maize plants growing in untreated, non
polluted soil were more than twice as high as plants that grew in polluted soil. In
polluted soil treated with T22 plants were 59% higher compared with the plants grown
in non-inoculated soil. Treatment of polluted soil with T22 in combination with
polyethylene and hydrogel increased plant height from 35.8 to 66.9 em (P < 0.05)
compared to the controls. The same trends were also obtained in non-polluted soil,
where plants were 11 % higher in the T22 inoculated treatment and 35 % higher when
treated with a combination of T22, hydrogel and polyethylene cover (P < 0.05). Growth
rates of maize plants growing in polluted soil was 4.5 em/week during the first '2 weeks
of the experiment which increased to 15 cm/week at the end of the experiment. In non
polluted soil the growth rate was 6.8 cm/week during the first two weeks of growth and
19.8 cm/week at the end of the experiment.
Similar results were obtained for shoot weights which were twice as large in non
polluted soil compared with polluted soil (Table 42c). Overall shoot weights of maize
plants growing in polluted soil were twice as low as compared to plants grown in non
polluted soil. In polluted soil, inoculation with T22 increased shoot weight from 2.7 to
4.1 g/plant (52% increase; P < 0.05) compared with the non-treated control.
Treatment of polluted and non-polluted soils with the combination of T22 + white
polyethylene cover + hydrogel increased shoot dry weight 2.5 fold (P < 0.05) compared
with plants grown in the non-treated controls (Table 42c).
In non-polluted soil, T22 inoculation alone increased the shoot weight by 75o/c
compared with the non-treated control. Comparing the effect of T22 inoculation alone
or in combination with white polyethylene cover and hydrogeL data in Table ..l2c
showed that soil treated with the combination treatment increased shoot dry weight
biomass by 63% in polluted soil and by 41.7O/c in the non-polluted soil compared to the
T22 inoculation treatment alone.
Similar to plant height and shoot dry weight, the root weights were also affected
by petroleum crude oil pollution. Overall, root weights were 2.3 times greater in non
polluted soil than in polluted soil (Table 42d). Inoculation of polluted soil with T22
resulted in roots that were 40% heavier than those from plants grown in the non-treated
- 115 -

control treatments. In polluted soil the combination of T22 + hydrogel + polyethylene
cover resulted in root systems that were more than 6 times heavier than root systems of
plants that grew in the non-treated control treatment. In non-polluted soil. T22
inoculation alone resulted in root systems that were 2.8 times heavier than those of
plants that grew in the non-treated control. T22 inoculation in combination with
hydrogel and white polyethylene cover resulted in root systems that were 3.6 times
heavier than those of plants that grew in the non-treated control soil. (Table, -1-2d).
In polluted soil, the combination T22 + hydrogel + polyethylene cover resulted in
root systems that were four times heavier than those inoculated with T22 only. In non
polluted soil the same treatment (T22 + hydrogel + polyethylene cover) resulted in root
systems that were 27% heavier than root systems inoculated with T22 only.
10.3.2 Effect of inoculation with T.harzianum (T22), hydrogel and
polyethylene cover on total bacterial counts
Table 43: Effect of inoculation ( at rate of 19!kg maize seeds) with T.harzianum (T22), hydrogel and polyethylene cover on the bacterial counts (log cfulg dry soil) in soil polluted with petroleum crude oil at a rate of 7Sg/kg soil during a 8 week period from sowing. Plants were watered regularly according to need. Microbial popUlations were enumerated by dilution plating on soil extract agar incubated at 30o±2°C (n=3).
(Log cfu /g dry weight soil)
Polluted Non Polluted Mean
Time (week) T22+Hydrogel+ Effect Without T22+Hydrogel+ Without
T22 T22 of time T22 Cover T22 Cover
2 5.00 5.52 5.63 6.33 6.43 6.57 5.91
4 5.51 5.68 5.58 7.28 7.39 7.45 6.48 - --~--
6 6.53 6.55 6.58 7.31 7.50 7.63 7.02
8 7.21 7.42 7.47 8.27 8.40 8.49 7.88
Polluted x treatments 6.06 6.29 6.32 7.29 7.43 7St
Mean effect of polluted 6.23 7.42
Mean effect of treatments 6.68 6.86 6.92
LSD at 0.05 for time 0.06 LSD at 0.05 for pollutedxtreatmenL~ 0.07 ~
LSD at 0.05 for polluted 0.04 LSD at 0.05 for interaction 0.13
LSD at 0.05 for treatments 0.05
- 116 -
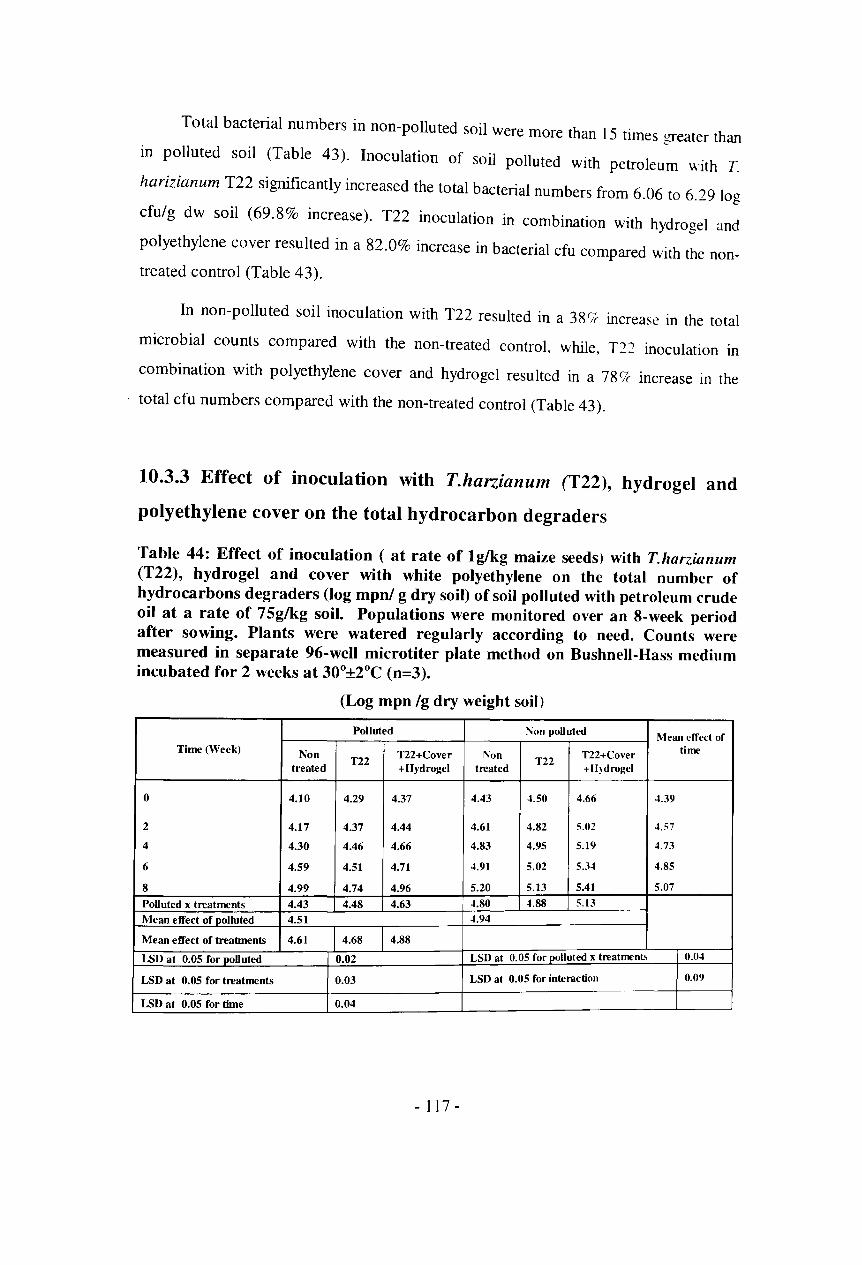
Total bacterial numbers in non-polluted soil were more than 15 times greater than
In polluted soil (Table 43). Inoculation of soil polluted with petroleum with T.
harizianum T22 significantly increased the total bacterial numbers from 6.06 to 6.29 log
cfu/g dw soil (69.8% increase). T22 inoculation in combination with hydrogel and
polyethylene cover resulted in a 82.0% increase in bacterial cfu compared with the non
treated control (Table 43).
In non-polluted soil inoculation with T22 resulted in a 389c increase in the total
microbial counts compared with the non-treated control, while, T22 inoculation in
combination with polyethylene cover and hydrogel resulted in a 789c increase in the
total cfu numbers compared with the non-treated control (Table 43).
10.3.3 Effect of inoculation with T.harzianum (T22), hydrogel and
polyethylene cover on the total hydrocarbon degraders
Table 44: Effect of inoculation ( at rate of 19lkg maize seeds) with T.harzianum (T22), hydrogel and cover with white polyethylene on the total number of hydrocarbons degraders (log mpnJ g dry soil) of soil polluted with petroleum crude oil at a rate of 7Sg/kg soil. Populations were monitored over an 8-week period after sowing. Plants were watered regularly according to need. Counts were measured in separate 96-well microtiter plate method on Bushnell-Hass medium incubated for 2 weeks at 300 ±2°C (n=3).
(Log mpn /g dry weight soil)
Polluted 1'0n poUuted Mean etTect of Time (Week) T22+Cover time Non T22+Cover 1'0n
T22 treated
T22 +Hydrogel treated +IIydrogel
0 4.10 4.29 4.37 4.43 4.50 4.66 4.39
2 4.17 4.37 4.44 4.61 4.82 5.02 4.57
4 4.30 4.46 4.66 4.83 4.95 5.19 4.73
6 4.59 4.51 4.71 4.91 5.02 5.34 4.85
8 4.99 4.74 4.96 5.20 5.13 5.41 5.07
PoUuted x treatments 4.43 4.48 4.63 4.80 4.88 5.13
Mean effect of polluted 4.51 4.94
Mean effect of treatments 4.61 4.68 4.88
LSD at 0.05 for ..£.oUuted 0.02 LSD at 0.05 for..£.olluted x treatment~ 0.04
LSD at 0.05 for treatments 0.03 LSD at 0.05 for interaction 0.09
LSD at 0.05 for time 0.04
- 117 -

Data in Table 44 show that T22 inoculation in combination with hydrogel and
polyethylene cover significant increased the total hydrocarbon degraders further from
4.428 to 4.626 log mpn/g dw (57.8% increases) compared with the non-treated control.
However, in non-polluted soil inoculation of T22 alone had little effect on the number
hydrocarbon degraders, but in combination with hydrogel and polyethylene cover the
number of hydrocarbon degraders more than doubled compared with the non-treated
control (Table 44).
To evaluate the effect of T22 inoculation in combination with hydrogel and
polyethylene cover, data showed that the total hydrocarbon degraders increased in
petroleum polluted soil from 4.372 to 4.958 log mpn/g dw (285lJc increases) at mixing
time and after 8 weeks of plant growth.
10.3.4 Effect of inoculation with T.harzianum (T22), hydrogel and
polyethylene cover on the CO2 evolution
Table 45: Effect of inoculation ( at rate of 19/kg maize seeds) with T.harzianum (T22), hydrogel and covering with white polyethylene on carbon dioxide evolution from non-polluted soil and soil polluted with petroleum crude oil at a rate of 75g/kg soil. CO2 evolution was monitored over an 8-week period (n=3).
(C02 mg/hlkg dry weight soil)
Polluted Non polluted Main effect
Time (week) Non T22 T22+Hydrogel Non T2l T22+Hydrogel of time
treated +Cover treated +Cover
0 0.04 0.05 0.10 0.02 0.03 0.12 0.06
2 0.07 0.10 0.12 0.10 0.16 0.18 0.12
4 0.09 0.26 0.67 0.20 1.12 1.38 0.62
6 0.19 1.06 1.47 0.88 1.56 1.73 1.15 -
8 0.27 1.26 1.68 1.18 1.82 2.07 1.38
Polluted x treatments 0.13 0.55 0.81 0.47 0.94 1.10
Main effect of polluted 0.51 0.84
Main effect of treatments 0.30 0.74 0.95
LSD at 0.05 for time 0.03 LSD at 0.05 for polluted x Treatments 0.03
LSD at 0.05 for polluted 0.02 LSD at 0.05 for interaction 0.07
LSD at 0.05 for treatments 0.02
- 1 18-
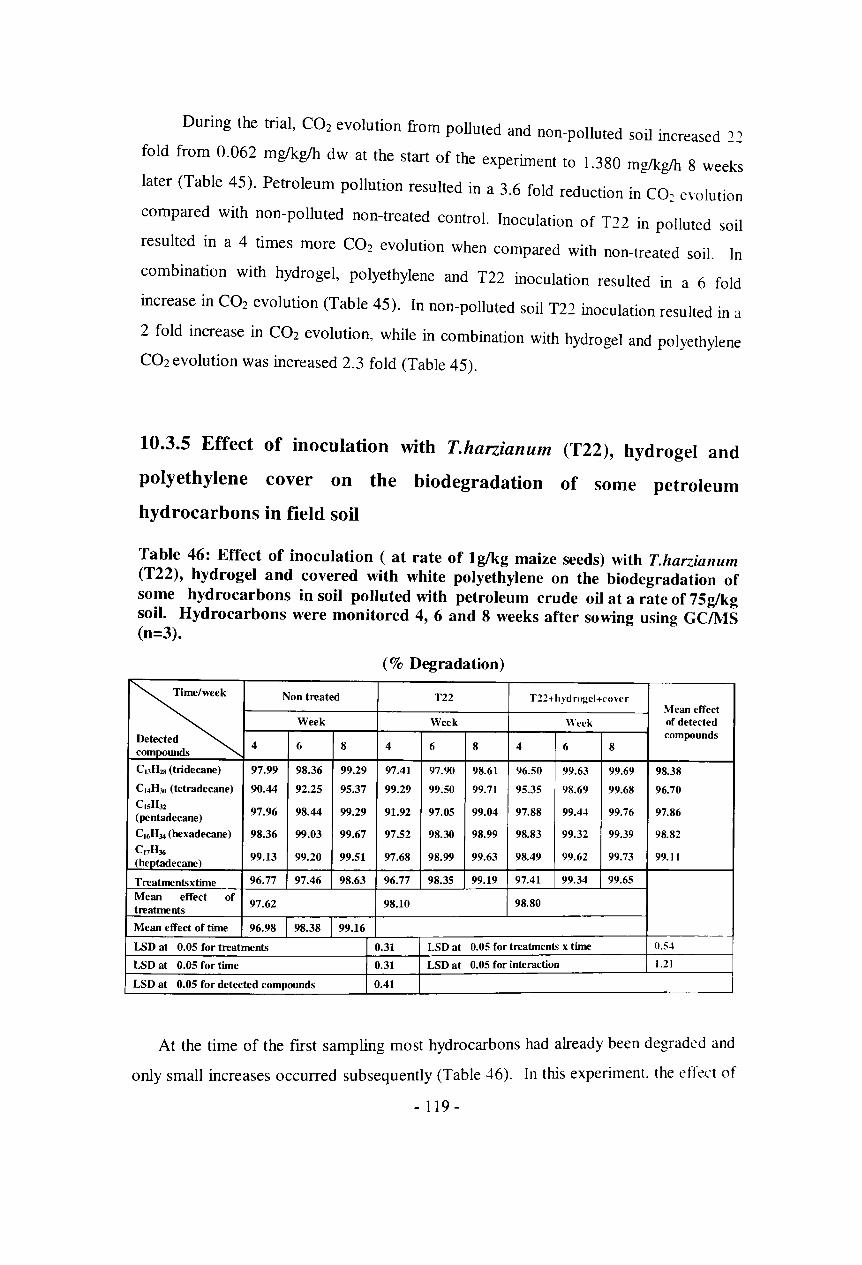
During the trial, CO2 evolution from polluted and non-polluted soil increased 22
fold from 0.062 mglkglh dw at the start of the experiment to 1.380 mglkglh 8 weeks
later (Table 45). Petroleum pollution resulted in a 3.6 fold reduction in CO2
evolution
compared with non-polluted non-treated control. Inoculation of T22 in polluted soil
resulted in a 4 times more CO2 evolution when compared with non-treated soil. In
combination with hydrogel, polyethylene and T22 inoculation resulted in a 6 fold
increase in CO2 evolution (Table 45). In non-polluted soil T22 inoculation resulted in a
2 fold increase in C02 evolution, while in combination with hydrogel and polyethylene
CO2 evolution was increased 2.3 fold (Table 45).
10.3.5 Effect of inoculation with T.harzianum (T22), hydrogel and
polyethylene cover on the biodegradation of some petroleum
hydrocarbons in field soil
Table 46: Effect of inoculation ( at rate of 19!kg maize seeds) with T.harziallum (T22), hydrogel and covered with white polyethylene on the biodegradation of some hydrocarbons in soil polluted with petroleum crude oil at a rate of 75g!kg soil. Hydrocarbons were monitored 4, 6 and 8 weeks after sowing using GC/MS (n=3).
(% Degradation)
~ Non treated T22 T22+hyd rogel+cover
Mean effect Week Week Week of detected
compounds Detected 4 6 8 4 6 8 4 6 8 compounds
Cu H211 (tridecane) 97.99 98.36 99.29 97.41 97.90 98.61 96.50 99.63 99.69 98.38
CI4H3tJ (tetradecane) 90.44 92.25 95.37 99.29 99.50 99.71 95.35 98.69 99.68 96.70 C1sH32 97.96 98.44 99.29 91.92 97.05 99.04 97.88 99.4-1 99.76 97.86 (pentadecane)
CI6H34 (hexadecane) 98.36 99.03 99.67 97.52 98.30 98.99 98.83 99.32 99.39 98.82 C17H36 99.20 99.51 97.68 98.99 99.63 98.49 99.62 99.73 99.11 (h~tadecane)
99.13
Treatmentsxtime 96.77 97.46 98.63 96.77 98.35 99.19 97.41 99.34 99.65
Mean effect of 97.62 98.10 98.80
treatments
Mean effect of time 96.98 98.38 99.16
LSD at 0.05 for treatments 0.31 LSD at 0.05 for treatments x time 0.5-1
LSD at 0.05 for time 0.31 LSD at 0.05 for interaction 1.21
LSD at 0.05 for detected compounds 0.41
At the time of the fIrst sampling most hydrocarbons had already been degraded and
I (T bl '+6) In this experiment. the effect of only small increases occurred subsequent y a e .
- 119 -
inoculation, hydrogel and cover were minimal, possibly as a result of the experiment
being watered.
10.4 Discussion
This section described a practical approach for use of bioremediation in arid
regions to clean up sites that are contaminated with petroleum hydrocarbons.
Treatments included inoculation with T.harzianum (T22) to stimulate plant growth,
covenng soil with polyethylene sheet to minimize evaporation of water and adding
hydrogel to increase water retention. All these measures are aimed at stimulating
microbial activity.
It is clear from the present study that soil polluted with petroleum crude oil
caused significant inhibition of seed germination and plant growth. There is not
adequate information regarding the precise mechanisms affecting the reduction in
germination rate. above ground biomass and shoot height resulting from petroleum
contamination. However, there are several possible mechanism suggested by various
authors. According to Henner et al. (1999) some volatile fractions with less than 3 rings
are known to have severe inhibitory impact on germination of several plant species.
Another, group of chemical compounds which are found abundantly in petroleum oil
are polycyclic aromatic compound (P AHs) and these could have indirect secondary
effects including disruption on plant-water-air relationships (Renault et al., 2000) while
negatively affecting soil microorganisms. The toxic effect of petroleum crude oil may
also be due to the crude oil making the soil hydrophobic (Li et al., 1996).
The present study indicates that T22 inoculation provides a large degree of
protection against the toxicity of petroleum crude oil. It could be shown that inoculation
of T22 to polluted soil improved the germination of maize seeds and increased maize
plant growth (plant height and shoot and root dry biomass weight). The reasons why
Trichodenna protects plants against hydrocarbon toxicity are not clear. It is possible
that T22 inoculation solubilized plant nutrients leading to increased plant growth
(Harman et aI., 2004). Among the positive effects of T22 on maize that have been noted
over the past 5 to 10 years in work conducted by Harman et al. (2004) on T.har:iallilm
- 120-

include: enhanced nutrient uptake, enhanced nutrl'ent solubilization, increased root development.
It could be shown that T22 when applied as a seed coating in combination with
polyethylene cover and hydrogel significantly enhanced seed germination and plant
growth compared to the non-treated control treatment. Many studies related to
application of hydrogels in horticulture have been reported by Johnson (1984). Wang
and Gregg (1990) and Akhter et al. (2004) reported that the application of hydrogel
improved seedlings growth and establishment of barley, wheat and chickpea by
increasing the water retention capacity of soil and regulating the plant available water
supplies, particularly under arid conditions.
In this experiment covering soil with polyethylene proved to be beneficial for
crop growth by potentially lowerering soil temperatures and by reducing evaporation
(Stapleton and De Yay 1984; EI Hady et al. 2006 : Mahajan et al 2007). This suggests
the bioremediation of polluted soil can best be carried out by treating the soil with T22
in combination with polyethylene cover and hydrogel.
Inoculation with T22 alone or in combination with polyethylene cover and
hydrogel had stimulatory effects on the total bacterial and total hydrocarbon degraders
in petroleum polluted soil. It is possible that T.har~ianum T22 produces surfactants
such as fatty acids, which increase the solubility of petroleum crude oil, making it more
bioavailble to the bacteria and resulting in an increased the number of hydrocarbon
degrading bacteria (Greensmith, 2005). Also hydrogel and soil cover with polyethylene
positively improving plant growth and moisture availability, providing the
microorganism with nutrients for growth and proliferation (Hasing, 2002; Akhter et aI.,
2004; EI-Hady et aI., 2006 ; Mahajan, 2007).
The effect of T22 inoculation alone or in combination with polyethylene cover
and hydrogel on C02 evolution showed the same trends as recorded for the number of
total bacteria and total hydrocarbon degraders. T22 inoculation alone in polluted soil
caused a four fold increase in C02 evolutionen, while T22 inoculated in combination
with polyethylene cover and addition of hydrogel resulted in a six fold increase in CO2
evolution compared with the non-treated control.
One of the most important processes involved in the degradation of petroleum
crude oil using maize plant in combination with T22 and the other two methods of
- 121 -

remediation is the interaction between plants and microorganisms in the rhizosphere.
Plants can stimulate the growth and metabolism of soil microorganisms by providing
root exudates, surfactants, enzymes, nutrients and oxygen which can result in more than
100 fold increase in microbial counts (Macek et aI., 2000). Ferro et al. (1997) ;
Greensmith (2005) suggested that plant exudates might serve as co-metabolites in
enhancing the biodegradation of pyrene in the rhizosphere.
- 122 -

C~PTER. ELEV-EN
General Discussion
Many sites are contaminated with the toxic compounds found in petroleum
crude. Petroleum hydrocarbons are persistent in soil because of their low water
solubility. Because petroleum hydrocarbons are toxic, mutagenic and carcinogenic to
humans and animals, their elimination from the environment is of paramount
importance. Different chemical procedures, such as incineration and land filling, have
been used extensively in the removal of petroleum hydrocarbons from contaminated
soil. These procedures are expensive, time consuming and require disposable sites.
Therefore, an alternative method that is less expensive and safe to use is required. One
such method is phytoremediation, which is the use of plants in association with other
factors, i.e., microbial inoculation, in combination with other soil treatments (soil
conditioners and polyethylene cover), to enhance the degradation of organic
contaminants and stimulate the removal of inorganic pollutants.
The aim of this work was to device a remediation strategy for the arid desert
soils in Saudi Arabia that was polluted with crude oil. The following strategy was
adopted using maize plants as they are tolerant to petroleum oil, while able to grow
under arid conditions. To enhance plant growth, Trichodenna T22 inoculation was
used.
The following experiments were conducted to quantify the effect of suitable
environmental factors, i.e., soil water content, temperature and nutrition (NPK) on
maize plant growth and microbial activity. some measured maintaining condition that
allow bioremediation of oil polluted land to proceed in arid soil region was also
designed.
In this study, the petroleum crude oil taken from Saudi Aramco Company (2006)
revealed the presence of micro and macro elements, different hydrocarbons and other
organic and inorganic substances including sulphur, nitrogen and oxygen. Heptanes
represented the greatest percentage of the hydrocarbons (93.S6l7c), followed by n-
Hexane.
- 123 -
The natural soil of Saudi Arabia consists mainly of sand with low percentages of
silt and clay. To study the phytotoxicity of the crude oil, a sandy soil with no history of
hydrocarbon contamination was used and analyzed for its main physical and chemical
properties. The pH of the soil used was 7.8, and contained few nutrients. These factors
not only meant that these soils supported limited plant growth, but also that microbial
activity was low.
An important factor in establishing plants in an oil-contaminated soil involves
getting seeds to germinate. A good way of knowing whether the plant being considered
is suitable for phytoremediation, is to assess if the seeds germinate successfully in
contaminated soil (Cunningham et ai., 1996). Lack of germination may be due to the
soil hydrophobicity, as the hydrophobicity significantly decreases soil water holding
capacity (Li, et al., 1996). The slower rate of germination in the soil contaminated with
petroleum crude oil may be a result of decreased oxygen or moisture availability to
seeds. Data resulting from our study show that sunflower plants were relatively
resistant to the toxicity effect of petroleum oil followed by maize and acacia plants.
According to the results of the germination tests that were carried out, the germination
of wheat and soybean in petroleum hydrocarbon-contaminated soil (0.34';(. w/w) was
delayed compared to germination in non-contaminated control soil (Dibble and Barth
1979).
As expected, petroleum crude oil added to soil had an inhibitory effect on
different microbial populations including bacteria and fungi. The percentage reduction
for bacteria and fungi at 150 x 103 ppm crude oil was around lSO/C compared to the
unpolluted control. Our results confirmed those of Ibrahim (1999), Wyszkowska and
Kucharski,(2002); and Rabie (2004). Petroleum hydrocarbons may have also limited the
accessibility of nutrients 3 by reducing the availability of water in which the nutrients
were dissolved (Schwendinger. 1968).
The growth of maize, sunflower, acacia, wheat and alfalfa plants in the presence
of petroleum crude oil was monitored over the course of the experiment to test which
plants were most tolerant to oil pollution. Our results showed that petroleum crude oil
was toxic to all tested plants, depending on the level of petroleum pollution. but that
maize was probably the most tolerant.
- 124 -
Plant numbers (plants/pot) were severely affected by crude '1 . 01 concentratlOns
between 10,000 and 75,000 ppm for all the plant species tested. The number of plants
decreased as the petroleum concentrations increased l'n sOl'l d " , an no germmatlOn
occurred at concentrations between 100,000 and 150,000 ppm in sunflower and al falfa
and at 100 x 103
ppm in acacia and wheat plants. Similar trends were observed for plant
height and plant weight.
11.1 The role of (T22) and plant interaction m remediation of
petroleum crude oil
The aim of this experiment was to investigate the role of Thar~ial1um (strain
T22) as a seed coating in promoting plant growth and in remediation of petroleum oil in
contaminated soil.
It was found that T22 provided protection against the toxicity of petro leu m crude
oil. It could be shown that plants inoculated with T22 grew better and taller than un
inoculated plants. The shoot and root dry weights were increased by a mean average of
21.8 % and 8 % for maize, 11.6% and 33.4% for sunflower and 16 and 16% for acacia.
The reasons why Trichoderma protects plants against hydrocarbon toxicity are not
clear. For example, Greensmith (2005) reported that Thal7.ial1Um (T22) increased the
bio-availability of phenanthrene, suggesting that plants inoculated with T22 should be
exposed to higher levels of hydrocarbons. It is possible that T22 solubilized plant
nutrients, leading to increased plant growth.
Data also showed that T22, when applied as a seed coating. significantly
increased the total bacterial and fungal counts in non-polluted or petroleum polluted soil
of maize, sunflower and acacia plants. Studies by other investigators reported that there
are conflicting reports on the effectiveness of inoculating contaminated soil with
microorganisms. However, these results are in line with the limits given by Amadi and
Odu (1993) who reported an initial gradual increase in microbial population size
following the application of petroleum hydrocarbon, followed by a decline as the
biodegradation progressed.
Other studies have found that inoculation enhances degradation of petroleum
hydrocarbons (Ford et al., 1999: da Silva et al., 2003: Gomez et al.. 2003: Zhang c( al ..
- 125 -

2005) or this might be due to the fact that Trichodenna (T22) increased the bio
availability of some hydrocarbon components leading to a larger population of
hydrocarbon degraders.
Further to the above work, an experiment was conducted to study the role of
maize plant on biodegradation of polluted soil with petroleum crude oil.
The principal aim of this experiment was to test whether or not planting
enhances biodegradation of petroleum hydrocarbons and to asses the role of rhizosphere
microbes in degrading oil and its degradable components.
The soil used consisted mostly of sand particles (90 CJc) of the total soil particles
which is referred to as "sandy textured soil". The natural soil of Saudi Arabia showed
very low organic matter and CaC03 content, meaning the nutrient status is very poor
and the EC of the soil is 1.62 dS m- I .
The present study indicated that petroleum crude oil caused significant inhibition
of maize seed germination (a 40.16 % decrease), a 47.1Y7( decline in the plant height
and inhibition of the shoot and root weight; reaching 16.99 and 24.34CJc. respectively.
The Hydrocarbon molecules can penetrate into plant tissues and damage all
membranes causing leakage of cell contents and block intercellular spaces to reduce
metabolite transport and respiration rates (Xu and Johnson, 1995). The toxic effect may
be also due to the soil hydrophobicity (Li et .al., 1996).
The petroleum crude oil added to soil had an inhibitory effect on the total
heterotrophic bacteria in the rhizosphere of maize plant and non-rhizosphere soil (86.5
and 65.0% respectively). It could also be shown that there were more hydrocarbon
degraders in the rhizosphere than in non-rhizosphere soil. This is because plant root
exudates provide soil microorganisms with nutrients (Singer et al., 2003).
Results of this study showed that maize plants significantly increased petroleum
degradation in the rhizosphere soil by 23.5%. compared to non-rhizosphere soil. This
suggests the bioremediation of polluted soil can be carried out by cultivating petroleum
polluted sites with maize plants.
In studies conducted to investigate the combined effect of T.har:iall1111l (T22)
inoculation and maize plants on bioremediation of petroleum crude oil in soiL it could
be shown that inoculation with T22 improved seed germination by 28.5CJc in polluted
- 126-
soil, providing protection to maize plants against the toxic effect of petroleum crude oil
and that plants grew better and taller than plants that were not inoculated with T22.
The present study indicated that inoculation of maize seeds with T22 enhanced
the total count of heterotrophic and hydrocarbon-degraders (log mpnfgdw soil) in the
rhizosphere and non-rhizosphere soil III petroleum-polluted soil. The ability of
T.harzianum to increase the numbers of bacterial heterotrophic and hydrocarbon
degraders may have something to do with the solubility of petroleum crude oil. Perhaps
T22 produces surfactants such as fatty acids which increase the solubility of
hydrocarbons making them more bioavailable to bacteria (Greensmith, 2005). From the
present study it appears that hydrocarbons present in crude oil are faster degraded in the
rhizosphere than in non-rhizoshere soil. Besides stimulating microbial populations
involved in hydrocarbon degradation, T22 on root may increase uptake of various toxic
metabolites (Harman, 2000).
Besides biotic factors, abiotic factors were shown to be at least as important for
enhanced degradation of petroleum hydrocarbons. Generally, higher total mean count of
bacteria and fungi and also CO2 production were obtained at 50% soil moisture content.
Water is not only a major component of living organisms, it also serves as a transport
medium to carry nutrients to biota and carry wastes away. If the moisture content of the
soil is low, there will be a loss of microbial activity (Frick et al., 1999).
It was clear from the present study that the addition of nutrients in the form of
N.P.K. (specific macro nutrients as nitrogen, super phosphate and potassium) stimulated
the activity of bacteria and fungi in soil. It was found that the mean value of CO2
production at 50% soil moisture content of petroleum contaminated soil amended with
N.P.K. fertilizers was always higher than the corresponding figures of soil polluted with
petroleum oil alone or in soil that was not polluted. These results clearly demonstrate
that enhanced oil biodegradation can be achieved by adding mineral nutrients to
contaminated soil (Frick et ai., 1999).
Soil temperature is a controlling factor for the rate of biodegradation. The results
of the present study revealed that the mean bacterial counts of the petroleum
contaminated soil amended with N.P.K. fertilizers reached their maximum at
temperatures between 35 and 40°C and significantly decreased at both lower and higher
temperatures. In Saudi-Arabia, where soil temperatures can reach well oyer 50"e. it is
- 127 -

therefore important to device a means of cooling soils, rather than increasing soil
temperatures as is the case in more temperate regions of the world.
11.2 Bioremediation of petroleum polluted soil by using polyethylene
cover and hydrogel
The objective of this experiment was to assess the possibility of
remediating polluted soil with polyethylene cover and hydrogel as remedies. It could be
shown that water loss under polyethylene cover was more than 620C lower in polluted
soil and more than 94% lower in non- polluted soil. Therefore, the soil cover led to
increasing the soil moisture content. Application of hydrogel also decreased loss of
water by an average of 8.2% and 14.8% in polluted and non polluted soil, respectively,
compared to bare soil. Application of polyethylene cover and hydrogel in combination
increased the water storage in sandy soil and consequently encouraged and increased the
growth of microorganisms and plants.
Concerning CO2 evolution, covering polluted and non-polluted soil
with polyethylene cover and amending with hydrogel increased C02 evolution by
48.5% in polluted soil and by 56.8% in non-polluted soil. Therefore, amendment with
hydrogel and polyethylene covers created a favourable soil environment for microbial
activity and had a positive effect on growth of hydrocarbon degradable microorganisms.
11.3 Effect of T.harziallum T22 inoculation, hydrogel and polyethylene
cover on the biodegradation of petroleum crude oil in soil
The present study indicates that T22 inoculation to petroleum
polluted soil improved the germination and maize plant growth. The same results were
obtained in the pot experiments. It could be shown that T.harzianum.T22 applied as a
seed coating in combination with polyethylene cover and hydrogel, enhanced seed
germination and plant growth parameters more than in the non treated control or with
T22 inoculation alone.
Polyethylene cover seems beneficial for crop growth because of the
complex change in the soil environment through the modification of soil temperature
- 128 -

and reduction in evaporation, all leading to more vigorous plant growth while enhancing
microbial activity in soil.
As expected, the inoculation with T22 alone or in combination with
polyethylene cover and hydrogel had a stimulatory effect on the total bacterial count.
hydrocarbon degraders and CO2 evolution the percentage increase 49.9S9C and 99.16c;(
for total bacterial count and 15.17 % and 49.30% for hydrocarbon degraders.
T22 inoculation alone in petroleum polluted soil caused a four - fold
increase in C02 evolution but more than a six - fold increase when T22 was inoculated
in combination with polyethylene cover and hydrogeL This suggests that the
bioremediation of polluted soil using T22 is most effective when soil moisture
conditions are optimized. This resulted in increased bioremediation of a numher of
hydrocarbons. This increase may have been due to: 1) the improvement of soil
properties, 2) the increase in plant growth which enhances the bioremediation of a soil
contaminant, 3) changes in the microflora composition on root and soil, or 4) enhanced
nutrient uptake.
11.4 Future work
The Phytoremidiation Technique has many advantages such as:
1. Very low cost;
2. Can be easily monitored;
3. It's a natural technique;
4. Can be used for bio-degradable pollutants.
The results of this studay strongly supported the above mentioned advantages.
Furthermore, it proved that the use of polyethylene cover and hydrogel in combination
with T22 were very effective in the bioremediation of petroleum crude oil in Saudi
Arabian soil.
However, further improvements can be made by:
1) Using dewatered sewage sludge instead of hydrogeL as this material is not
only cheap. but also contains nutrients, making it an ideal soil conditioner.
- 129-

2) Using the agricultural waste of some crops in Saudi Arabia (palm 1eayes or
palm tree waste) as a mulch instead of polyethylene.
3) Using indigenous Saudi Arabian plants instead of maize to provide root
exudates to stimulate rhizosphere mediated or phytobial bioremediation (Caletropes,
Acacia, etc.). Such plants would require little maintenance and will thrive for years.
- 130-
R.EFER.E~CES
Adam, G. and Duncan, H. (2002). Influence of diesel fuel on seed germination. Environ. Pollut. 120, 363-370.
Adams, De-Leij,F.A.M.M .. and Lynch, J. M. (2007a). Trichodenna har~ianum Rifai 1295-22 mediates growth promotion of crack willow (Salix fragilis) in both clean and metal-contaminated soil. Microb. Ecol. 54: 306-313,
Adams, P., De-Leij, F.A.A.,M. and Lynch,J.M. (2007b). Desorption of zinc by extracellularly produced metabolites of Trichodenna harzianum, T. reesei and Coricolus versicolor. J .Appl. Microbiol, 103, 2240-2247
Adedokun, O.M. and Atage, A.E. (2007).Effect of amendments and bio- augmentation of soil polluted with crude oil, automotive gasoline oil and spent engine oil on the growth of cowpea (Vigna ungiculat L. Walp). J.Sci. Res .. 2 (5): 147-149.
Adriano, D.C., Chlopecka, A and Kaplan K.I. (1998). Role of soil chemistry in soil remediation and ecosystem conservation. Soil Sci., Soc., Am. Spec. Public., Madisson: 361-386.
Akhter, J., Mahmood, K. Malik, K.A, Madran, A, Ahmad, M. and Iqbal, M. M. (2004). Effect of hydrogel amendment on water storage of sandy loam and loam soil and seedling growth of barley, wheat and chickpea. Plant. Soi. Em'iro., 50(10): 463-469.
Al Awadhi, N., Al Daher, R., Nawawy, A and Balba, M.T. (1996). Bioremediation oil contaminated soil in Kuwait landonning to remediate oil contaminated soil. J. Soil Contam., 5: 243-260.
Albert, P. H. (1995). Petroleum and individual polycyclic aromatic hydrocarbons. In Handbook of Ecotoxicology, Hoffiman, D. J., Rattner, B. A., Burton, G. A .. , Jr., Cairons, J., Jr., Eds., CRC press: Boca Raton, FL: 330-355.
Alexander,M. (1961) Introduction to soil Microbiology. John Wiley and Sons, Inc., New York
Alkorka, L. and Garbisu, C. (2001). Phytoremediation of organic contaminants in soil. J. Biores. Tech., 79: 273-276.
Allen, O.N. (1961). Experiment on soil bacteriology. Burges Publishing Co., Minneapolis, Minnesota, U.S.A
A llowa v, B. J. and Ayres D. C. (1993). Organic pollutants in: Chemical principles of enviro~mental pollution. 1st
• edition. Chapman and Hall, India, publishers, p. 201.
Amadi, A and Odu, C. T.l. (1993). Effect of stimulated chemical emulsifier (Separal NF. 36 and Servo (6602) contamination of soil, on carbon dioxide. Evolution and shifts in microbial population in a fresh water mangrove ecosystem. Intemational joumal of biochemophysics 2 (1 -2): 97-99.
Amakiri J.~. and Onofeghara, F.A. (1984), Effect of crude oil population on germination of Zea mays and Capsicum Jrutescese. Environ. Pollut. 25, 159-167.
Amund, 0.0. (1996). Utili~ation and degradation of an ester-based synthetic lubricant by Acinetobacter lwoffle. Biodegradation, 7 (2): 91-95.
- 131 -

Anderioni, V., Canalca, L., Nocerino, G., Barnasconi, S.; Dell Amico, E., Colombo, M. and Gianfreda, L. (2004). Bacterial communities and en::.yme activities of PAHs polluted soils. Chemosphere, 57: 401-412.
Anderson, T.A., Guthrie, E.A. and Walton, B.T. (1993). Bioremmediation Environ. Sci. Technol. 27,2630-2632.
Aprill, W. and Sims,R.C. (1990). Evaluation of the use ofprairie grassesfor stimulating polycyclicaromatic hydrocarbon treatment in soil. Chemosphere 20(1-2), 253-265 Bioremediacation. Environ. Sci. Technol., 27: 2630-2632.
Asano, M ... Hayokawa, I., Kinashita, T., Inagaki, I. and Arisawa, M. (1981). Studies 011
isolated culture mediafor vegetables in greenhouse. Res. Bull. of Aichi-Ken, Agric, Res. Centre., No., 13: 183-189.
Atlas, R.M. (1975). Effects of temperature and crude oil composition on petroleum biodegradation, 30: 396-403.
Atlas, R.M. (1977). Stimulated petroleum biodegradation. Crit Rev. Microbiol., 5: 371-386.
Atlas, R.M. (1978). An assessment of the biodegradation of petroleum ill the Arctic. In microbial ecology. Lautit, M. W, Miles 1AR (editors). Springer - Vertag, Berlin, pp. 86-90.
Atlas, R.M. (1981). Microbial degradation of Petroleum hydrocarbons: an environmental perspective. Microbial. Rev. 45: 180-209.
Atlas, R.M. (1984). Pathways of hydrocarbon degradation. In Petroleum microbiolof!..Y. Macmillan publishing company, New York, USA. pp 1-15.
Atlas, R.M. (1995). Bioremediaion of petroleum polWants. International Biodererioration and Biodegdation 35:317-327.
Atlas,R.M. and Bartha,R (1998). Microbial Ecology: Fundamental and ApplicatioBenjaminlCummings Publishing Company, Inc.: Don Mills, ON.
Ayotamuno, 1. and Kogbara, R. (2007). Determening the tolerance level of Zea mays (mai::.e) to oil polluted agricultural soil. African J. Biot., 6 (11): 1332-1337.
Baek, K. H ... Kim, H. S ... Oh, H. M.; Yoon, B. D ... Kim. 1. and Lee, I. S. (2004). Effects of crude oil, oil components and bioremediation on plant growth. 1. Environmental Sci
and Health, A.39: 2465-2472.
Bananno, A.R. and Lamont, W.1. (1987). Effect of Polyethylene mulch, irrigation method and row covers on soil and air temperature and yield of muskmelon. 1. of Am. Soc. Hort. Sci., 112 (5): 735-738.
Barea, 1.M., Pozo, M.1. (2005). Microbial co-operation in the rhi::.osphere. J. of experimental Botany, 56 (417): 1761-1778.
Bartha R. (1986). Biotechnology of petroleum pollutant biodegradation. Microb. Ecol..
12: 155-172.
Bartha, R. and Atlas, R. M. (1977). The microbiology of aquatic oil spills.
Adv.Appl.microb., 22: 225-266.
- 132-

B~rtha: R. and Attas. R.M. (1987). Transport and transfonnations of petroleum. bwLoglcaL precesses, p.287-342. In Long tenn environmental effect of off shore oil and gas development. Elservier applied science, Louisiana
Bennett, B., Larger, A., Potter, D.K., Buckman, J.O. , Larter,S.R .. 2007.Petroleum geochemical proxies for reservoir engineering para-meters. J. Pet. Sci. Eng.58. 367-347. doi: 1 0.1 016/j.petroI.2006. 06. 009.
Bjorkman, T. Blanchard, L. M. And Hannan, G.E. (1998). Growth enhancement of shrunken-2 sweet corn by T.harzianum : Effect of environmental stress. 1. American Soc., Hort. Sci., 123(1): 15-22.
Bland, W.F. and Davidson, R.L. (1967). "Petroleum Processing" Hand Book. McGraw-Hill Book Company, New York, U.S.A.
Boethling, R.S. and Alexander, M. (1979). Effect of concentration of organic chemicals on their biodegradation by natural microbial communities J.App. Environ. Microbial., 37: 1211-1216.
Bokhary, H. and Parvez, S. (1993). Fungi from Petroleum contaminated Saudi Arabia soils. Soil Research and Rehabilitation, 7: 191-195.
Bonde, T.A and Rosswall, T. (1987). Seasonal variation of potentially minerali::able nitrogen in four cropping systems. Soil Science Society of America Journal 51, J 508-1514.
Borneman, J., Skroch, P.w., O'Sullivan K. M., Paulus, J.A., Rumjanek, N.G .. Jansen, J.L., Nienhuis, J. and Triplett, E-W. (1996). Molecular microbial diversity of an agricultural soil in Wisconsin. J. Appl. Environ. Microbial, 62: 1935-1943.
Bossert, 1. and Bartha R. (1984). The late of petroleum in soil ecosystems. In petroleum microbiology, R.M. Atlas (ed.), Macmillan, New York, pp. 453-473.
Bowman. D.C. and Evans, R.Y. (1991). Calcium inhibition of polyacrylamide gel hydration is partially revessible by potassium. Hort. Science, 26 (8): 1063-1065.
Braddock, J. F. and Richter, (1998). Microbial degradation of aromatic hydrocarbons in marine sediments. Final report, OCS Study MMS 97-0041, Unil'. of Alaska Coastal Marine Institute, Unvi. of Alaska Faibanks and USDOI, MMS, Alska OCS Region, 82 p.
Braddock, J.F. and Catterall, P.H. (1999). Assimble method Gasline-and Diesel -Degrading Microoranisms; 3(2):81-84.
Bragg, J.R.b prince, Harner, E.J. and Atlas, R.M. (1994). Effectiveness of bioremediationfor the E::::111 Valde:: oil spill. Nature, 368:413-418
Briones, A.M.and Reichardt, W. (1999). Estimating microbial population counts hy most probale number using Microsoft Excel ® .J. of Microbiologic! Methods. 35:157-161
Brito, E.M.S.; Guvoneaud, R., Goni-Umiza, M., Ranchou-peyruse A.. Verbaere A., Grapez, M.A.C. Wassennan, J.c.A. and Duran, R. (2006). Characteri::ation of hydrocarbon classic bacterial communities from mangrove sediments in Guanabara Bay. Brazil Res. Microbial. (In press).
Bruheim, P. and Eimhijelle, K. (1998). Chemically emulsified crude oil as substrate for bacterial oxidation differences in species response. Can. J. Microbial .. ..J..J (2): 195-199.
- 133 -
Buckley, E. N. (1980). Effects of petroleum hydrocarbon on metabolic activit), and community composition of susbended heterotrophic salt marsh bacteria. ph. D. Thesis, Univ., of North carolina, Chapel Hill.
Callaghan, T. V., Lindley, D.K., Ali, O.M., Abd El Nour, H. and Bacon, P.J. (1989). The effect of water-absorbing synthetic polymers on the stomatal conductance, growth and survival of transplanted Eucalyptus microtheca seedlings in the Sudan. 1. Appl. Ecology, 26: 663-672.
Campbell, W.B., Harris, R. Wand Benoit, R.E. (1973). Response of Alaskan tundra microflora to crude oil spill. Proc. Symp. On the impact of oil resource development on northern plant communities occasional. Pub.on Northern life No 1,53-61.
Carmichael, L.M. and Pfaender, F.K. (1997). The effect of inorganic and organic supplements on the microbial degradation of phenanthrene and pyrene in soil. Biodegradation, 8: 1-13.
Castellano, M.A and Trappe, 1.M. (1985). Ectomycorrhi;.al formation and plantation peiformance of Douglas-fir nursery stock inoculated with Rhi;.opogon spores. Can.J.Res., 15: 613-617.
Cerniglia, CE. (1992). Biodegradation of polycyclic aromatic hydrocarbons. Biodegradation, 3: 351/368.
Chaillan, F., Flecheb, A, Burya E., Phantavonga Y Hui; Sa lio t, A. and Oudot, 1. (2004). Identification and biodegradation potential of tropical aerobic hydrocarbondegrading organisms. Res. Microb., 155 (7): 587-595.
Chaillan, F.; Chaineau, CH.; Point, V. Saliot, A and Oudot, 1. (2006). Factors inhibiting bioremediation of soil contaminated with weathered oil and drill cuttings. Environmental pollution. 144: 255-265.
Chaineau CH.; Rougeux, G.; Yespremain, C. and Oudot, 1. (2005). Effects of nutrient concentration on the biodegradation of crude oil and associated microbial populations in the soil. Soil Boil. Biochem., 37: 1490-1497.
Chaineau, CH., Morel, J.L. andoudot, J. (1997). Phytotoxicit),andplantuptakeoffuel oil hydrocarbons, J. Environ. Quality, 26: 1478-1483.
Chaineau, CH., Morel, J.L. and Oudot, 1. (2000) biodegradation of fuel petroleum hydrocarbons in the rhizosphere of mai;.e. J. Environ. Qual., 29: 569-578.
Chaney, R.L., Malik, M., Li, Y.M., Brown, S.L., Brewer, E.P., Angle, 1.S. and Baker, AJ.M. (1997). Phytoremediation of soil metals. Cur. Opr. Biotech., 8: 279-284.
Chaudhry, Q., Blom-Zandstra, M., Gupta, S. and Joner, E.J. (2005). Utilbng the synergy between plants and rhizosphere microorganisms to enhance breakdown of organic pollutants in the environment. Environ. Sci. Pollut. Res., 12: 34-48.
Chen, Y, Gamliel, A., Stapleton, J.J. and A viad, T. (1991). Chemical, Physical, and microbial changes related to plant growth in disinfected soils. In: Catan, 1. and De. Va)' J.E. (eds). Soil Solari;.ation. CRC Press, Boca Raton, pp. 103-129.
Choi, S.c, Kwon, K.K., John, J.H. and Kim, S.J. (2002). Evaluation of fertili;.er additions to stimulate oil biodegradation in sand seashore mescocosms. 1. Microbial. Biotechnol., 12: 431-436.
- 134-

Chouychai, W; Thongkukiatkul, A.; Upatham, S.; Lee, H. and Pokethitiyook, P. Kruatra.chue, ':1'; (~~07) .. Phytotoxicity assay of plants to phenamhrene and pyrene contammants m aCidic sOil. Toxicology and water quality .22 (6): 597-604.
Cirigliano, M.e. and Carman, G.M. (1984). Isolation ofa bioemulsifierfrom Candida lipolytica. Appl. Environ. Microb., 48: 747-750.
Clark, R.e. and Brown, D. W (1977). Petroleum properties and analysis in biotic and a biotic systems. In Malins (Ed). Effect of Petroleum on Arctic and Subarctic Environments and Organisms. Vol. I. Nature and Fate of Petroleum. Academic Press, Inc., New York, pp 1-89.
Coelho, L., Chellemi, D.O. and Michel, D.J. (1999). Efficacy of solari;.ation and cabbage amendment for the control of Phytophthora spp. In north Florida. Plant Dis., 83: 293-299.
Cook, D.F. and Nelson, S.D. (1986). Effect of polyacrylamide on seedlings emergence in crust fonning soils. Soil sci., 141 (5): 328-333.
Cooney, J.J. (1984). Thefate ofpetroleum pollutants in freshwater ecosystems. K03099 pollution, J. 02905 Water, P. 2000 Freshwater pol/ut.
Cotter, J. (2007). Herbicide tolerant mai;.e (T25): food saftey in doubt; herbicide sa{et\' in environmental dangrs. Greenpeace Reserch Labories, Technical note 0412007
Cuevas, R. ; Martinez, G. M. E ; Sosa, e. F. and Rojas, G. M. (2008). In-vitro evaluation of gennination and growth of five plant species on medium supplemented with hydrocarbons associated with contaminated soils. Bioresources Technology, 99: 6379-6385.
Cunningham, S.D., Anderson, TA., Schwali A.P. and HSll, F.e. (1996). Phytoremediation of soils contaminated with organic pollutants. Adv. In Agronomy, 56: 55-114.
Da Silva, M., Umbuziro, G.A., Pfenning, L.H., Canbos, V.P. and Esposito, E. (2003). Filamintous fungi from Estuarine sediments contaminated with industrial discharge. Soil Sediment Contamination, 12: 345-356.
Davies, F. T, Castro-Jimenez, Jr. Y. and Duray, S.A. (1987). Mycorrhizae, soil amendments, water relations and growth of Rosa multiflora under reduced irrigation regimes. Scientia Horticulturae" 33: 261-267.
Davis, J.S. and Westlake, D. W.S. (1979). Crude oil utilization h.\' fungi: can. J. Microbial., 25: 146-156.
De Vay, J.E., Stapleton, J.J. and Elmore, e.L. (1991). Soil solarization, Amman, Jordan, 19-25 Feb. FAO, plant protection and production paper No. 109.
Degiorgi, e.F., Pi;.arro, R.A., Smolko, E.E., Lara, S. and Carenz.a, M. (~002). Hydrogels for immobilization of bacteria used in the treatment of metal-contaml11ated wastes. Radiation physics and chemistry, 63: 109-113.
Delille, D., Coulon F. and Pelletier, E. (2004) Effects of temperature ~mnning during a bioremediation study of natural and nutrient-amended hydrocarbon-contaminated suhAntarctic soils. Cold Reg. Sci. Tech., 40: 61-70.
Dibble, J.T and Bartha, R. (1979). Effect of em'ironmental parameters on biodegradation of oil sludge. Appl. Environ. Microbial., 37: 729-739.
- 135 -
Dua, M., Sethunathan, N. and lohri, A.K. (2002). Biotechnology and bioremediation: success and limitations. Appl. Microbial. Biotechnol., 59: 143-152.
Ebuehi, O.A.T., Abibo, I.B, Sh ekwo 10, P.D., Sigismund, K.I, Adoki, A. and Okaro, f.e. (2005). Remediation of crude oil contaminated soil by enhanced natural attenuation technique 1. Appl. Sci. Environ., 9 (1): 103-106.
Egharevba, R.K. (2001). The effect of crude oil on seedlings growth of two forest fruit trees: Chryzophyllium albidum and Dacryodes edulis G. Don 1. sustainable Agric., 18: 25-35.
Ekundayo, E.O., Emede, T.O. and Osayande, D.l. (2001). Effect of crude oil spillage on growth and yield of maize (Zea mays L.) in soils of mudwestern Nigeria. 1. plant food for human nutrition, 56(4): 313-324.
El-Baz, F. (1992). Preliminary observation of environmental damage due to Gu/fwar, Natural Resources Forum, 165: 71-75.
El Hady, O.A. (1987). Hydrogels for increasing water and fertilizers use efficiency in sandy soils. Ft con! on fertilizers availability and needs, S. WR.J., A.R. e. Ministry of Agric., Egypt, 478-496.
EI Hady, O.A. and Camilia, Y. El Dewin:v (2006). The conditioning effect of composts (natural) or and acrylamide hydrogels (systhesized) on a sandy calcareous soil f. Growth responses nutrients uptake and water andfertili~ers use efficiency by tomato plants. 1. Appl. Sci. Res., 2(11): 890-898.
El-Hady, o.A. .. Gha!.v, N. F. and Wanas Sh.E. (2008). Hydrophobic hydrophilic combination for sandy soil conditioning and plantation 1- Growth response and water andfertilizers use effiency by casuarinas trees. American-Eurasian 1. Agric. & Environ. Sci., 4(3): 332-342.
Eriksson, M.M., Dalhammar, G. and Mohn, W. W. (2002). Bacterial growth and biofilm production on pyrene. FGMS Microbiology Ecology, 40: 21 -27.
Ermisch, 0., Rehm, Hl. and Behrens, D. (1990). Breakdown of polyc:vclic aromatic hydrocarbons in soil by the immolized fungus Trichoderma har~ianum. Dechema Biotechnology Con! Germany 1989, 3 (B): 905-908.
Eweis,l.B., Ergas,S.J. Chang,D.P. and Schroeder,E.D. (1998). Bioremediation Principles. McGraw-Hill, In. Toronto
E::::j, M.I. (2001), Cyanide detoxification by soil microorganism. Ph.D. thesis, University of Surrey, Guildford, Surrey. England.
E~~i. M.l. and Lynch, 1.M. (2002) Cyanide catabolizing en:::ymes in Trichoderma spp. Enzyme microbial. Techno!., 31: 1042-1047.
E~zi.M.J.. Pascual,l.A., Gould,B.J. and Lynch,J.M.(2003). Characteri~ation of rhodanase enzyme in Trichoderma spp. Enz.Microb.Technol, 32,629-634
E~~i.M.I. and Lynch,l.M. (2005a). Biodegration of cyanide by Trichoderma spp and Fusarium spp. EI1~.Microb. Technol, 36, 849-854.
E~~i,M.I. and Lynch,l.M.(2005b). Plant microcosm studiesdemollstrating bioremediation of cyanide toxicitv bl' Trichodenna and Fusarium spp. BioI.Fert.Soils,42, 40-44
- 136 -

Fernet, J.L. (20~8), l!lant bacterial inoculants to remediate hydrocarbon polluted soil. M.Sc., Dept. Soli SCI. Saskatchewan Univ. Canada.
Ferro, A.M., Kennedy, J., Doucette, W., Nelson, S., Jauregui, G., McFarland, B. and Bugbee, B. (1997). Fate of benzene in soil planted H'ith alfalfa: Uptake, volati;.ation and degradation, In Kruger et al. (Eds). Phytoremediation of soil and water contaminants, Am-chem. Soc., Washington, DC, pp: 223-237.
Foght J.M., Westlake, D., Johnson, WM. and Ridgway, HF. (1996). Em'ironmental gasoline-utilizing isolates and clinical isolates of Pseudomonas aeruginosa are taxonomically indistinguishable by chemotaxonomic and molecular techniques. Microbial., 142: 1333-1340.
Ford, Cz., Sayler,G.S. and Burlage,R.S. (1999). Containment of a genetically engineered microorganism during a field bioremediation application. Appl. Microbiology and Biotechnology 51(3): 397-400
Francke, HC and Clark, F.E. (1974). Disposal of oil wastes by microbial assimilation report (1934). US Atomic Energy Commission, Washington. D.C.
Franco, M. Contin, G. Brugato, B. and Penobil, M. (2004). Microbiological resilience of soil contaminated with crude oil. Geoderma, 121 (1-2): 17-30.
Frick, CM., Germida, J.J. and Farrell, R.E. (1999). Assessment ofphytoremediation as an in-situ technique for cleaning oil-contaminated sites. Proc. Of the phytoremediation Technical Seminar, Environment Canada, Ottawa, pp: 105-124. Funk, H B. and Krulwich, T. A. (1964). Preparation of clear silica gels that can be streaked. J. Bacteriol.. 88: 1200-1201.
Gamliel, A. and Katan, J. (1991). Involvement pseudomonas and other microorganisms in increased growth response of plants in solari;.ed soils. Phytopathology, 81: 494-502.
Ghazali, F.M., Rahman, R.A., Salleh, A.B. and Basri. M. (2004). Biodegradation of hydrocarbons in soil by microbial consortium, Int. Biodeter. Biodegrade., 54: 61-67.
Gold, M.H., Joshi, D.K., Valli, K. and Warilshi, H (1994). Degradation of chlorinated phenols and chlorinated dibenzo-p. dioxins by Phanerochaeta chrysosporium In. Bioremediation of chlorinated and polycyclic aromatic hydrocarbons compounds. Lewis Pub. And Arbor, Mich., : 231-238.
Goldstein, R.M., Mallory, L.M. and Alexander, M. (1985). Reasons for possible failure of inoculation to enhance biodegradation. Appl. and Em'iron. Microbial., 50: 977-983.
Gomez, CB., Quintero, R., Garcia, E. F .. Howard, M.A.. Zarala. Dia7. de la serna, F.l.. Rodrigue:... H. C, Gillen, T., Varaldo, P.R., Cortes. B.J. and Vazque:... R.R. (2003). Removal of phenanthrene from soil by co-cultures of bacteria and fungi pregrowll on sugar cane bagasse pith. Bioresource Tech., 89: 177-183.
Greenberger, A., Yogev, A. and Katan. J. (1987). Induced supressiveness in solarized soils. Phytopath., 77: 1663-1667.
Greensmith. J. (2005). The effects ofplants and afungal inoculation on the degradation of phenanthrene and pyrene in soil. M.Sc. Thesis, Univ. of Surrey, Guildford, Surrey.
England.
- 137 -

Gunderson, J. (2006). The eifi t .1' h d b ec OJ y rocar on contamination and m)'corrhi:.al inoculation on poplar fine root dynamics. M.sc. Univ. Saskatchewan. Saskatoon, Canada.
G.unther, . T.: Dornberger, T. and Frustsche. W. (1996). Effects of reyegrass on blOremedtatlOn of hydrocarbons in soil. Chemosphere, 33: 203-215.
Haferburg D., Hommel, R., Claus, R. and Kleber, H.P. (1986). Extracellular microbial lipids as biosuifactants. Adv. Biochem. Eng. Biotech., 33: 53-93.
Haines, J.R., Wrenn, B.A., Holder, E.L., Strohmeier, K.L., Herrington, R. T. and Venosa, A.D. (1996). Measurement of hydrocarbon-degrading microbial populations by a 96-well most probable-number procedure. J. Ind. Microbial., 16 (1): 36-41.
Hanada, T. (1991). The effect of mulching and raw cover on vegetable production, 23pp. publication of Chugoku Agr. Exp. St. Japan.
Hannan, G.E. (2000). Changes in perceptions derived from research on T.harzianum T22 Plant Dis., 84: 377-393.
Hannan, G. E .. , Latorre, B., Agosin, A., San Martin, R., Riegel. D. G., Nielsen, P. A .. Tronsmo, A., and Pearson, R. C (1996). Biological and integrated control of Botrytis bunch rot of grape using Trichodenna spp. Bioi. Contr. 7:259-296.
Hannan, G.E. (2006). Overview of mechanisms and uses of Trichodcnna Spp. Phytopathology, 96: 190-194.
Hannan, G.E., Howell, CR., Viterbo, A., Chef, I. and Larito, M. (2004a). Trichoderma Spp. - opportunistic a virulent plant sYl71bionts. Nature Reviews Microbiology, 2: 43 -56.
Hannan,G.E., Lorito,M. and Lynch.J.M.(2004b) Uses of Trichodenna to remediate or alleviate soil and water pollution. Adv.AppI.Microbiol, 56,313-330.
Harris, R.F and A 171 old, S.M. (1995) Redox energy aspects of soil biorel71ediation, Biorediation: Science and application. Edited by Skipper, H.D. and Turco, R.F., SSSA Apec.Publ. 43M ASA, CSSA and SSSA, Madison WI: 55-86.
Hashem, A.R. (1996). Influence of crude oil contamination on the chemical and microbiological aspects of Saudi-Arabian Soil. J. King Saud Univ. Sci., 8: 11-18.
Hashem, A.R. and Al Harbi, S.A. (2000). Biodegradation of crude oil in Mohammed and Al Hosani (Eds) Geoengineering in Arid lands. Balkema publication, Rotterdam, Netherlands. Pp: 567-569.
Hasing, J.E. (2002). Agro economic effect of soil solari:.ation on fall-planted lettuce. M.Sc., Agric. and Mech. College, Lousiana state Univ.
Hassan, A.M. (1988). Principles ofvegetable production and protective and technology ofproduction under open field and protective cultivation. Arab-House for publ .. Cairo.
600 pp.
He, Z. and Spain, J. C (1997), studies of the catabolic pathway of degradation of nitroben:.ene by Pseudomonas pseudoacaligenes JS 54: Removal of the amins group from 2-aminomuconic semi aldhyde. Appl. Environ. Microbiology, 63 (12): 4839-·/K.f3.
Helalia, A. and Lete)', J. (1988). Cationic polymer effects on infiltration rates with a rainfall simulator. Soil Sci, Soc. of Am.J., 52: 247-250.
- 138 -

Heldt, H. (2005). C4 plants perform C02 assimilation with less water consumption than C3 plants. Plant bioch. (th.sd.). slsevir Acad.press 200 wheeler Road, Burlingtonp MA, 01803, MSA.
Henner, P., Schiavon, M., Druelle, V., Lichtfouse, E. (1999). Phytotoxicity of ancient gaswork soils, effects of polycyclic aromatic hydrocarbons (PAHs) on plant germination. Org. Geochem., 30: 963-966.
Hill, D.E., Hankin, L.I. and Mulches, G.R. (1982) Mulches: their effect on fruit set timing and yields of vegetable. Bull. Connectent Agric. Exp. Station, New Haven No. 805.
Ho, C. and Banks, M.K. (2006). Degradation of polycyclic aromatic hydrocarbons in the rhizosphere of Fistula arundinacea and associated microbial community changes. Bioremediation J., 10 (3): 93-104.
HoeppeI, R.E. and Hinchee, R.E. (1994) Enhanced Biodegradation for on-site remediation of contaminated soils and ground water, Hazardous waste site soil remediation, Theory and Appl.of Innov. Techno!., ed. Wilson and Clarke. Marcel Dekker, Inc., pp:311-431.
Hopen H.J. and Oebker, N.F. (1976). Vegetable crop response to synthetic mulch. Uni1.'. of Illinois. Agric. Expt. Sta. No. 42.
Horowitz, A., Sexstone A. and Atlas, R.M. (1978). Hydrocarbons and microbial activities in sediment of an Actic Lake one year after contamination with leaded gasoline. Arctic, 31: 180-191.
Hutchinson, S.L., Banks, M.K. and Schwab, A.P. (2001). Ph),toremediation of aged petroleum sludge: effect ofinorganicfertili;.er. J. Environ. Qua!., 30: 395-403.
Hutchinson, S.L., Schwab, A.P. and Banks, M.K. (2003). Bioremediation of petroleum hydrocarbons in the rhizosphere. P: 355-386. In S.c. Mc. Cutcheon and J.L.Schnoor (eds) phytoremediation: transformation and control of contaminants. John Wiley & Sons. Hoboken, NJ.
Hutterman, A., Zommorodi, M. and Raise, K. (1990) Addition of h)'drogels to soil for prolonging the survival of Pinus halepensis seedlings subjected to drought. Soil and Tillage Res., 50: 295-304.
Huy, N. Q., Jin, S., Amada, K., Haruki, M., Huu, w .. Hang, D. T., Camha, D. T., Imanka, T., Morikawa, M. and Kanaya, S. (1999). Characterization of Petroleum Degrading bacteria from oil-contaminated sites in Vietnam. J. Bioscience and Bioengenering 88 (11): 100-103.
Huynth, B. V., Change, H.M., To)'c. T. W. and Kirk, TK. (1985). Dechlorination of chloroorganics by a white rotfungus. TAPP/. J., 86: 98-102.
Ibrahim,A.E.H. (1999). Microbial degradation of some hydrocarbons (Petroleum products) in soil. M. Sc. Fac. of Agriculture, Cairo University
Inbar, J. Abramsky, M., Cohen, D. and Chet, I. (1994). Plant growth enhancement and disease control by T.harzianum in vegetable seedlings grown under commercial conditions. European J. of Plant Pathol., 100 (5):337-346.
Ismail, S.A. (2000). Contamination of new desert lands near petroleum wells of RasSudr, Egypt. M. Sc. Thesis, Fac. of Agric., Cairo Univ.
- 139 -

Jacquot, F., Guiliano, M., Doumerq, P. Muno::., D. and Mille, G. (1996). In-vitro photoaxidation of crude oil malteric fractions: Evolution of fossil biomarkers and polycyclic aromatic hydrocarbons. Chemosph., 33: 671-681.
Jenny,H. (1980) The Soil Resource. Springer, New York.
Jilani, S. and Khan, M. A. (2006). Biodegradation of Cypennethrin b.Y Pseudomonas in a batch activated sludge process. Int. J. Environ. Sci. Tech., 3 (4): 371-380.
Johnson, M.S. (1984). Effect of soluble salts on water absorption by gel-forming soil conditioners. J. Sci. Food Agric., 35: 1063-1066.
Kamp, W. (1975). Herbiude for different vegetable species grmving under plastic polyethylene film or under polyethylene tunnels. Gemuse, 10 (11): 314-318.
Karanth, N.G.K., Deo, P.G. and Vernanadig, N.K. (2007). Microbial production of biosuifactants and their importance. www.ias.acinicurrset/jullOlartic/es19.htm.
Kennedy, A. e and Smith, K. L. (1995). Soil microbial diversity and the sustainability of agricultural soil. J. Soil plant 170, 75-86. . .
Kim, S., Choi, D.H., Sim, D.S. and Oh, S. (2005). Evaluation of bioremediation effectiveness on crude oil - contaminated sand. Chemosph., 59: 845-852.
Kirk, J.L., Klironomos, J.N., Lee, H. and Trevors, J.T. (2005). The effect of perennial ryegrass and alfalfa on microbial abundance and diversity ill petroleum contaminated soil. Environ. Po/lut., 133: 455 - 465.
Kogbara, R.B. (2008). Ranking agro-technical methods and environmental parameters in the biodegradation of petroleum-contaminated soils in Nigeria, Electronic. J. Bio., 11 (1): 1-13.
Kramer, P.I. (1969). Plant and soil water relationships; a modern synthesis. Mc. Graw Hill. Publishing company. New Delhi.
Kuhn, W., Gambino, R.,AI-Awadhi, N., Balfa, M.T. and Dragpun, J. (1998). Growth of tomato plants in soil contaminated with Kuwait crude oil. 1. of Soil Contamination, 7: 801-806.
Kuiper, I., Lagendijk, E.L., Bloemberge, G. V. and lugtenberg B.I.1. (2004). Rhizoremediation: A beneficial plant - microbe interaction, Mol. Plant - microbe interact, 17: 6-15.
Lang, S. (2002). Biological amphiles (michrobial biosuifactants) Current Opinion in Colloid and Inteiface Sci., 7 : 12-20.
Lawlor, K., Knight, B.B., Barbara-Jefferson, V.L. Lane, P. W., Lilley, A.K., Paton, G.I.; Mc Girath, S.P., O'Flaherty, S.M. and Hirsch, P.R. (2000). Comparison of methods to investigate microbial populations in soils under different agricultural management. FEMS Microbiol Ecol, 33: 129-137
Li, x., Storey, J. and Johnson, R.L. (1996). Assessing the effect of petroleum hydrocarbon residuals on plant growth. 33rd Ann. Alba Soil workshop, 201 - 206.
Linke, K.H., Saxena, M.e, Sauerborn, J. and Masri, H. (1991). Effect of soil solari::.ation on the yield of food legumes and on pest control, in soil solari-;.ation proceedings of the first conference on soil solarization, Amman, Jordan (De my. 1.E.,
- 140-

J.J.Stapleton, and CL. Elmone, Eds.) FAO plant production and protection paper., 109: 139-154.
Lippert, T.L.H. and Witing, F.L. (1964). Soil moisture under lands of petroleum and polyethylene mulches, Proc. Amer. Soc. Hort. Sci., 85: 541-546.
Liu, z., Jacobson, A.M. and Luthy, R.G. (1995). Biodegradation of naphthalene in a gueous nonionic suifactant systems. Appl. Environ. Microb., 61: 45-51.
Lliros, M., Munill, x., Sole A., Martinez-Alonso, M., Diestra, E. and Estel', 1. (2003). Analysis of Cyanobacteria biodiversity in pristine and polluted microbial mats in microcosms by confocal laser scanning microscopy. An overview. Bad};.. Fonnt. P. ';'83-489.
Lopez-Herrera, CJ., Perez-Jimenez, R.M., Zea-Bonilla, T., Basallote-Mreba, M.J. and Melero- Vara, J.M. (1998). Soil solarization in established avocado trees for control of Dematophora Necatrix. Plant Dis., 82: 1088-1092.
Loser, CH., Seidel, H., Zehnsdorf, A. And Stalttmeister, M. (1998). Microbial degradation of hydrocarbons in soil during aerobic I anaerobic changes and under purely aerobic conditions. App. Microbial., 49: 631 -636.
Louw H. A. and Webley, D. W. (1959). The bacteriology of root region of the oat plant grown under controlled pot culture conditions. 1. Appl. Bacterial., 22: 216-226.
Lynch,J.M. and Moffat,A.(200S). Bioremediation-prospects for future application of innovative applied biological research. Anl1.AppI.Biol.,146,217-221
Lynch,J.M., Wilson, K.L. , Ousley,M.A. and Whipps.J.M. (J 991 ) Response of lettuce to Trichoderma treatment. Letts. Appl.Microbiol, 12,59-61.
Macek, T., Mackova, M. and Kas, J. (2000). Exploitation of plants for the removal of organics in environmental remediation. J. Adv. Biotechnol., 18: 23-24.
Mackova, M., Macek, T., Ocenaskova, 1., Burkhard, J., Demnerova, K. and Pa;.laroV(J, J. (1997). Biodegradation of polychlorinated biphenyls hy plant cells. J. Intern Biodeter. Biodegrad., 39: 317-325.
Madsen, E.L. (1991). Determining in situ biodegradation: facts and challenges. Environ. Sci. Technol., 25: 1663-1673.
Maha}an, G. Sharda, R. Kumar, A. and Singh, K.c. (2007). Effect ofplastic mulch on economi;.ing irrigation water and weed control in baby corn sown by different methods. Afric. Jonr. Agric. Res., 2(1): 019-026.
Mahmoud, S.A.Z., Abou El-Fadle, A. and EI-Mofty, M.Kh. (1964). Studies on the rhizosphere microflora of desert plant. Folia Microbilogica, 9: 1.
Maier, R.M., Pepper, I.L. and Gerba, CP. (2000). Environmental microbiology, San Diego: Academic Press.
Maki, H., Sasaki, T. and Haramaya, S. (2005). Phytooxidation of biodegradable crude oil and toxicity of the phytooxidized products. Chemosph., 44: 1145-1151.
Manani, R. (2002). Bioremediation of petroleum NJIT, NJ, April 16th
avai/bale at http://web .11 Ut. edulwrhm2lbiopetrol eum. doc
- 141 -

Marin, J.A., Hernandez., T. and Garcia, C. (2005) bioremediation of oil refinery sludge by land fonning in semiarid conditions: Influence on soil microbial actiritY. Environ. Res., 98(2): 185-195. -
Marin, M., Pedregoser, A., Rios, S., Ortiz., M.L. and Laborado, F. (1996). Biodegradation of diesel and heating oil by Acenitobacter calcoaceticus MMS: it's possible application on bioremediation. Biosorption and bioreme dilation, Mariod, Spain, 17-19.
Martin, W. (2003). Investigation of hydrocarbon phytoremediation potential of Lupin us chamissonis in laboratory microsoms. M.sc. Fac. Of California Poly tech. State, San Luis Obispo Univ.
Marx, D.H. and Artman, J.D. (1979). Pisolithus tinctorius ectomycorrhiz.ae improve survival and growth of pine seedlings on acid coal spoilages in Kenlucky and Virgina. Reclamation Rev., 2: 23-31.
Me Gill, WE., Rowell, M.J. and Westlake, D. W.S. (1981). Biochemistry ecolog,l' and microbiology ofpetroleum components. In: soil biochemistry, vol.5 E.A. Paul and Ladd, J.N., Marcel Dekker, New York, pp: 229-269.
McGill, W.B., Cannon,KR., Robertson, J.A. and Cook,F.D. (1986). Dynamics of soil microbial biomass and water soluble organic C in Breton L after 50 years of cropping the two rotations. Canadian Journal of Soil Science 66, 1-19.
Mishra, S., Jyot, J., Kuhad, R.C. and Lal, B. (2001) in situ bioremediation potential of an oily sludge-degrading bacterial consortium. Current Microbiol., 43 (5): 328-335.
Miyata, N., Iwhori, K Foght, J.M. and Gray, M.R. (2004). Saturable, Energy dependent uptake of phenanthrene in aqueous phase by mycobacterium sp. Strain RJG/l- 135. Aplied and Environmental Microbiology, 70(1): 363-369.
Morelli, 1. S., Del Panno, M.T., De Antoni, G.L. and Painceira, M.T. (2005). Laboratory study on the bioremediation ofpetrochemical sludge contaminated soil. Int. Biodeterior. Biodegrad., 55: 271-278.
Mulligan, c.N. (2005). Environmental application for biosuljactants. Environmental
pollution 133, 183-198
Namkoong, W., Hwang, E. Y., Park, J.S. and Choi 1. Y. (2002). Bioremediation of dieselcontaminated soil with composting. Environ. Pollut., 119: 23-31.
NRC,National Research Council (1993). In Situ bioremediation. when does It Work? National Academy Press, Washington D. C.
Nedunuri, K V., Govindaraju, R. S., Banks, M. K Schwab, A. P. and Chen, Z. (2000). Evaluation of phytoremediationfor field-scale degradation of total petroleum hydrocarbons. J. Erviron. Eng. 162, 483-490.
Nester, Eugene W., Denise G. Anderson, C. Evans Roberts Jr., Nancy N. Pearsall, and Martha T. Nester. (2001). Microbiology: A Human Perspective. 3 rd ed. New York:
McGraw-Hill.
Nichols, T.D., Wolf, D.C., Rogers, H.B. Beyrouty, C.A. and Reynolds, C.M. (1997). Rhizosphere microbial populations in contaminated soil. Water Air and Soil Poll., 95:
165-178.
- 142 -

Nicodem, D.E., Guedes, CL.B. and Correa, R.J. (1998). Phytochemistry ofpetro/eum 1, Systematic study of a Bra~ilian intermediate crude oil. Mar. Chem., 63: 93-104.
Odjegba, V.i. and Sadiq, A. 0. (2002). Effect of spent engine oil on the growth parameters, chlorophyll and protein levels of Amaranthus hypridus L. The environmentalist, 22: 23-28.
Odokuma, L. O. and Dickson, A.A. (2003). Bioremediation of a crude oil polluted tropical rain forest soil. Global i. of Environ. Sci., 2 (1): 29-40.
Ogbo, E.M. (2009). Effect of diesel guel contamination on seed gennination of fOllr cropplants- Arachis hypgaea, vigna unguiculatat, sorghumbicolor and ~ea mars. African i. of Biotech., 8(2):250-253. .
Okerentugba, P. O. and Ezeronye, 0. U. (2003). Petroleum degrading potentials of single and mixed microbial cultures isolated from rivers and refinery effluent in Nigeria. i.Biotech, 2: 288-292.
Okoh, A.I. (2006). Biodegradation alternative in the cleanup ofpetroleum hydrocarbon pollutants. Biotechnol. Mol. BioI. Rev., 1 (2): 38-50.
Okoh, A.L., Ajisebutu, S., Babalola, G.O., and Hermande;:, M.R. (2002). Biodegradation of Mexican heavy crude oil (Maya) by Pseudomonas aeruginosa. i. Trop. Biosci., 2 (1): 12-24.
Okolo, i.C, Amdi, E.N. and Odu, CTI. (2005), Effects of soil treatments containing poultry manure on crude oil degradation in a sandy loam soil. Appl. Ecol. Environ. Res., 3 (1): 47-53.
Oner, E.J. and Eyval, CL. (2003). Phytoremediation of organic pollutants using mycorrhizal plant a new aspect of rhi;:osphere interactions. Agronomic. 23: 495-502
Onuoha, Cl., Arin~e, A.E. and Ataga, A.E. (2003). El'aluation of growth of some fungi in crude oil polluted environment. Glob. i. Agric. Sci: ISSN, (2): 1596-1903.
OTA (1990). Office of Technology assessment coping with an oiled sea. Washington, D.C, U.S. Government printing office.
Otten, A., Alphenaar, A., Pijls,C, Spuij. F. and de Wit,H. (1997). In-Situ soil remediation. Kluwer Academic Publishers, Boston
Oudot, i., Merlin, F.x. and pinvidic, P. (1998). Weathering rates of oil components in a bioremediation experiment in estuarine sediments. Mar. Environ. Res., 45: 113-125. Ouslcv,M.A.,L)'nch.J.M. and Whipps,J.M.(1 993). Effect of Trichoderma on plant growth: a bal~nce between toxicity and growth promotion. Microb.Ecol.,26,277-285
Ous/c)"M.A., L)'nch,J.M. and Whipps.J.M. (1994). The effects of additio/l of Trich~derma i~ocula on flowering and shoot growth of bedding plants. Sci. Hort,,59, 147-155
Overton, E. B.; Sharp, W. D. and Robert, P. (1994). Toxicity of petroleum. In Basic Environmental Toxicology, Cockerham, L. G., Shane, B. S. Eds.; CRC press: Boca
Raton, FL: 133-156.
Palmroth, M.R. T., Pichtel. i., Puhakka, l.A. (2002). Phytoremediation of subarctic soil contaminated with diesel fuel. Bioresource Technology, 84: 221 -228.
- 143 -
Pa.tra, .D.D.,. Bro~kes, P.~., Coleman, K., lenkinson, D.S. (1990) Seasonal changes of sOli mlcrobzal bIOmass 111 an arable and a grassland soil which have been under uniform management for many years. Soil Biology & Biochemistry 8,249-253.
Pelletier, E, Delille, D. and Delille, B. (2004). Crude oil bioremediation in subAntarctic intertidal sediments: chemistry and toxicity of oiled residues. Mar. Environ. Res., 57: 311-327.
Pe rfumo , Amedea, Ibrahim M. Banat, Roger Marchant, and Luigi Ve-;-;ulli. (2007). "Thermally Enhanced Approaches for Bioremediation of Hydrocarbon-Contaminated Soils. " Chemosphere 66: 179-184.
Pichtel, 1. and Liskanen, P. (2001). Degradation of diesel fuel in rhi-;asphere soil. Environ. Eng. Sci., 18 (3): 145-157.
Pilon-Smits, E (2005). Phytoremediation. Annu. Rev. Plant, Bioi., 56: 15-39.
Pradhan, S.P., Conrad, 1.R., Paterek, 1.R. and Srivastava. V. 1. (1998). Potential of phyoremediation for treatment of PAHs in soil at MGP site. 1. of soil contamination, 7(4): 467-480.
Prince, R.C., Clark, 1.R., Lindstrom, 1.E., Butler, E.L., Brown, E.l., Winter. G .. Grossman, M.J., Parrish, P.R, Bare, R.E, Braddock. 1. F., Steinhauer, w.G., Douglas. G.S., Kennedy, 1.M., Barter, P.G., Bragg, 1.K., Hamer, E.J. and Atlas, R.M. (1994). Bioremediation of the Exxon Valdez oil spill: monitoring safety and efficacy. In R. E. Hinches et al. Hydrocarbon bioremediation, Lewis Pub., Boca Roton, Florida, pp: 107-124.
Pullman, G.S., Devay, 1. E., and Garber, R.B. (1981). Soil solari~ation and thermal death: a logarithmic relationship between time and temperature for four soil borne plant pathogens. Phytopath., 71: 1285-1289.
Qiu, x., Leland,T. W., ShahS.!., Sorensen,D.L. and Kendall,E. W. (1997). Field study "Grass remediation for cia)' soil contaminated with po/yc)'c1ic aromatic h)'drocarbons" in phytoremediation of soil and water contaminants, 186-199.
Rabie,G.B. (2004). Using wheat-mungbean plant system and arbuscular mycorrhi~a to enhance in-situ bioremediation. Food Agriculture and Environment 2(2): 381-390
Radwan,S.S., N.A.Sorkhoh and EI-Desouf..:y,A.F. (1997). A feasibility study on seedling as a bioremediation practice for the oily Kuwait desert. 1. Applied Microbiolog)' 83, 353
Rahman, K.S.M .. Thahira-Rahman. 1 .. Lakshmanaperumalsamy. P. and Banat, I.M. (2002). Towards efficient crude oil degradation by a mixed bacterial consortium. Biores. Tech., 85: 257-261.
Rahman, K.S.M.: Rahman, T.J.; Kourkoutas, Y.: Petsas, I.; Marchant, R. and Banat, I.M. (2003). Enhanced bioremediation of n-alkane in petroleum sludge using bacterial consortium amended with rhamnolipid and micronutrients. Biores. Tech., 90 (2): 159-168.
Ramadan, M.A., Tayeb, O.M. and Alexander, M- (1990). Inoculation si~e as a factor limiting success of inoculation for biodegradation. Appl. Environ. Microbial., 56: 1392-1396.
- 144 -

Reilley,K.A., Banks,M.K. and Schwab,A.P. (1996). environment dissipation of polycyclic aromatic Environmental Quality 25, 212-219
Organic chemicals in the hydrocarbons. loumal of
Rein 0 lds, C M., Wolf, D. C, Gentry, T. 1., Perry, L. B., Pidgeon, C S., Koene, B. A., Rogers, H.B., Beyrouty, CA. (1999) plant enhancement of indigenous soil microoraganisms: alow cost treatment of contaminated soils. Polar Record., 35(192): 33-40, 1996.
Renault, S., Zwla Zek, 1.J, Fung, M. And tuttle, S. (2000). Vwioko, D.£., Fashemi, D.S., (2005). Growth response of germination, growth and gas exchange of selected boreal ricinus communisl (castor oil) in spent lubricating oil forest seedlings in soil containing oil sands tailing. Environ. Polluted Soil. 1. Appl. Sci. Environ. Manage., 9(2): 73-79.
Rhykerd, R.L., Crews, B., Mcinnes, K.J. and Weaver, R. W. (1999), Impact of bulking agents, forced aeration and tillage on remediation of oil contaminated soil. Bioresource technol., 67 (3): 279-285.
Rice, L.E. and Hemmingsen, B.B. (1997). Enumeration of hydrocarbon-degrading bacteria. In Sheehan (ed.). Methods in Biotechnology, vol. 2: Bioremediation Protocols. Humana Press Inc., Totowa, N.J., pp: 99-109.
Richard, P. (1976). Plastic mulching for vegetable production. Grower guide book No. 7. 44pp.
Riser - Roberts, £. (1998). Remediation of petroleum contaminated soils. CRC Press, Boca Raton, FL.
Rittmann, B.E. (2004). Definition, objectives and evaluation of nature of attenuation. Biodegradation, 15: 349-357.
Roberts, E. V. (1998). Remediation ofpetroleum contaminated soil-biological, physical and chemical processes. Lewis Pub. Boca Raton. London, New York, Washington, D. C.
Rosenberg, E. (1991). The hydrocarbon-oxidizing bacteria, In: The prokaryotes, vol. 1, 2nd
. Edition. Springer- Verlag. New York, U.S.A., pp. 446-458.
Ross, D.J. (1971) Some factors influencing the estimation of dehydrogenase activities of some soils under pasture. Soil Biology & Biochemistry 3, 97-110.
Rowell, D.L. (1994). Soil Science, method and application. Longman group UK, Limited.
Sabate, 1., Vinas, M. and Solanas, A.M. (2004). Laboratory scale bioremediation experiments on hydrocarbon-contaminated soil. Intemet. Biodeter. Biodegrade., 54: 19-25.
Sadler, R. and Connell, D. (2003). Analytical methods for the determination of total petroleum hydrocarbons in soil. Proc. of the fifth national workshop on the assessment of site contamination, pp: 133-150.
Salman, H. M. and Gorski, S.P. (1985). The effects of clear and black po/: .... ethylene mulches on the soil environment. Res. Circular, Ohio Agric. Res. And Develop. Centre
No. 288: 7-9.
Saraswathy, A. and Hallberg, R. (2002). Degradation of pyrene by indigenous fungi from afonner gaswork site. FEMS Microbiology Letters 210.227-232
- 145 -

Sayles, G.D.; Acheson, CM.; Kupferle, M. J.; Shan, Y.; Zhou,Q.; Meier, J. R.; Chang, L.; Brenner, R.C (1999). Land treatment of PAH- contaminated soil:Perfonnance measured by chemical and toxicity assays. Environ. Sci. Technol., 33: 4310-4317.
Schabert, P. T. (1990). Ecological evaluation of surfactants. Tenside. Surfactants deterg 33, 120-124.
Schwendinger, R.B. (1968). Reclamation of soil contaminated with oil. J. of the institute of Petroleum,S: 182-197.
Scwab, A. P. ; Banks, M. K. and Arunachalum, M. (1995). Biodegradation of polycyclic aromatic hydrocarbons in rhizosphere soil., pp. 23-29. In R. E. Hinchee; D. B. Anderson and R. E. Hoeppel (eds), bioremediation of recalcitrant organics. Battelle Press, Columbus, OH.
Shah ria ri, M.H., Firoozahadi, G.S. Az.iz), M. Kalantari, F. And Tehrani D.M. (2007). Study of growth and germination of Medicago sativa (Alfalfa) in light crude oilcontaminated soil. Res. J. Agri and Bio. Sci., 3 (1): 46-51.
Sharifi, M. Sadeghi, Y. and Akbarpour, M. (2007). Gennination and growth of six plant species on contaminated soil with spent oil Int. J. Environ. Sci. Tech., 4(4): ';'63-470.
Shor, L. M. And Kossen, D.S. (2000). Bioavailability of organic contaminants in soil. In J.J. Valdes (ed). Bioremediation P. 15-43, Kluver Aca., Pub/., Amstrdam.
Siciliano,S.D. and Germida,J.J. (1998). Mechanisms ofphytoremediation: biochemical and ecological interactions between plants and bacteria. Environmental Review 6, 65-79
Sims, R.C and Sims, J.L (1999). Land fanning of petroleum contaminated soils. Bioremediation. Contaminated soils. Agro. Series, 37: 767-780.
Singer, A. C, Crowley, D. E., Thompsen, J.P. (2003) secondary plant metablites in phytoremediation and biotransformation. Trends in Biotechnology, 21: 123-130.
Singh, J.S., Raghubanshi, A.S., Singh, R.S., Srivastava, S.c. (1989) Microbial biomass acts as a source of plant nutrients in dry tropicalforest and savanna. Nature (London) 338: 499-500.
Singh, 0. V. and Jain, R.K. (2003). Phytoremediation of toxic aromatic pollutants from soil. Appl. Microbial, Biotechnol., 63: 128-135.
Snedecor, G. W. and Cochran, W.G. (1982). Statistical Methods 6th. Ed. The Iowa State Univ. Press, Amer. Iowa, U.S.A., 593.
Sorkhon, N.A., AI-Hasan, R.H., Khanafer, M. and Raduan, S.S. (1995). Establishment of oil-degrading bacteria associated with Cyanobacteria in oil polluted soil. loumal of
Appl. Bacteria!', 78: 194-199.
Sparrow, E., Davenport:, C V. and Gordon, R. (1978). Response of microorganisms to hot crude oil spills on a subarctic Taiga soil. ARCTIC., 31 (3): 32';'-338.
Specht, A. and Han'ey, J. (2000). Improving water delivery to the roots of recent!." transplanled seedling trees: the use of hydrogels to reduce leaf and hastren root
establishment. Forest. Res., 1:117-123.
- 146-

Stapleton, J.J. and De Vay, J.E. (1984). Thennal components of soil solari:.ation as related to changes in soil and root microflora and increased plant growth response. Phytopath., 74: 255-259.
State of Mississippi. Department of Environmental Quality. 1998. Fundamental Principles of Bioremediation. April 1998. 27 NOl' 2006 <http://www.deq.state.ms.us/MDEQ.nsjlpdjl GARD _Bioremediation/$File/Bioremediation.pdf? Verified 12/15/2006.
Stegmenn, R., Cotter, S. and Heerenklage, J. (1994). Biological treatment of oil contaminated soils in bioreactors, in on-site bio-reclamation: process for xenobiotic and hydrocarbon treatment. Ed.by Hinchee and Olfenbuttel: 188-208.
Tayel, M. Y. and El Hady, O.A. (1981). Super gel as a soil conditioner. Acta Horticultu rea I 119, 247-256.
Teasdal, J.R. and Mohler, E.L. (2000). The quantitative relationship between weed emergence and the physical properties of mulches. Weed Sci., 48 (3): 383-392.
Thompson, K., Grume, J.P. and Mason, G. (1977). Seed gennin(1tion in response to diumalfluctuation in temperature. Nature, 267: 147-149. Tisher, S. and Huener, T. (2002). Model trials for phytoremediation of hydrocarbon contaminated sites by the use of different plant species. Martin-Luther. Univ. Int. 1. of phytorem., 4 (3): pp: 187-203.
U.S.E.P.A (1999). Monitored natural attenuation of petroleum hydrocarbons, EPA 600-F-98-021. Office of Res. And Develop., U.S. Environ. Protect. Agency.
Udo, E. J. and Faymi, A A A (1975). The effect of oil pollution of soil on gennination, growth and nutrient uptake of Corn. J. Envion. Qual. 4, 537-540.
United States Environmental Protection Agency. Landfanning. 9 March 2006 .24 http://www.epa.gov/ousticat/landfann.htm. Verified 12/1512006 Nov 2006.
USDA (2004). "Soil Survey Laboratory Methods Manual" Soil Sun'e.'· Investigation Report No. 42 Version 4.0 November 2004.
Vance,D.B. (1996). Phytoremediation: Enhancing natural attenuation processes. National Environmental Journal 6 (Jan/Feb), 30-31.
Venosa, AD. and Zhu, X. (2003). Biodegradation of crude oil contaminating marine shorelines and freshwater wetlands. Spill Soc. Tech. Bull., 8 (2): 163 -178.
Waggoner, P.E., Meller, P.M. and De Roo, H. C. (1960). Plastic mulching: Principle and benefits. Conn. Agric., Exp. Station Bull. 643.
Walker, J.D. and Colwell, R.R. (1976). Enumeration of petroleum degrading microorganisms. Appl. Environ. Microbial., 31: 198-207.
Walker, J.D., Petrakis, L. and Colwell, R.R. (1976). Comparison of the biodegradability of crude and fuel oils. Can. J. Microbial., 22:598-602.
Walter, A. and Duncan, D. B. (1969): Multiple range and Multiple test. Biometries 11,
124.
Walton, B.T., Guthrie, E.A and Hoylman, A.M. (1994). Toxicant degradatioll ill the rhizosphere. pp. 11-26. In Anderson T.A. and Coats, J.R. (Cds.), Bioremediation
- 147-

through rhizosphere Technology, ACS Symposium Series, Vol. 563. American Chemical Society, Washington, D.C. 82-92.
Walworth, J.L. and Reynolds, C.M. (1995). Bioremediation of a petroleum contaminated cryic soil. Effect of phosphorus, nitrogen and temperature J. Soil contam., 4: 299-310.
Walworth, James, Andrew Pond, 1an Snape, John Rayner, Susan Ferguson, and Paul Harvey. (2005). "Fine Tuning Soil Nitrogen to Maximi::.e Petroleum Bioremediation . .. ARCSACC (2005): 251-257.
Wang, X and Bartha, R. (1990). Effects of bioremediation on residues, activit)' and toxicity in soil contaminated by fuel spills, soil boil. Biochem., 22: 501-505. .
Wang, Y. T. and Gregg, L.K. (1990). Hydrophilic polymers their response to soil amendments and effect on properties. Sci., 115: 943-948.
White, Jr P. M.; Wolf, D.C. Thoma, G.J. and Renolds, C. M.(2006). PIr)'toremediation of alkylated polycyclic aromatiuc hydrocarbons in a crude oil-contamin~ted soil. Water Air Poll., 169: 207-220.
Whitten, G. (1999): Herbal harvest. Bloomings books, Hawthorn.
Widada, J., Nojiri, H. and Omori, T. (2002), Recent developments in moleelllar techniques for identification and monitoring ofxenobiotic-degrading bacteria and their catabolic genes in bioremediation. Appl. Microbial. Biotechnal., 60: 45-59.
Wiltse, c.c., Rooney, W.L., Chen, Z. Schwali, A.P. and Banks, M.K. (1998). Greenhouse evaluation of agronomic and crude oil-ph."rtoremediation potential among alfalfa genotypes. J. Environ. Quality, 27: 169-173.
Windham, M.T., Elad, Y. And Baker, R. (1986). A mechanism for increased plant growth induced by Trichoderma Spp. Phytopathol., 76(5): 518-521.
Woodhouse, J.M. and Johnson, M.S. (1991). The effect of a gel forming polymer on seed germination and establishment. J. Arid Environ., 20:375-380.
World oil demand" to rise by 37%" BBC News. 20-06-2006 Retrieved 25-08-2008. Wrenn, B. (2003). Environmental engineering Sci. program. Washington Univ., St. louis, vol, 3 (no.a): 12-14
Wrenn, W. A. and Venosa, A.D. (1996). Selective enumeration of aromatic and aliphatic hydrocarbon degrading bacteria h)' a most-probable number procedure. Can. 1. Microbial., 42: 252-259.
Wyszkowska, J., Kucharski, J. and Wadowska E. (2002). The influence of diesel oil contamination on soil microorganisms and oat growth. Rostlinna Vyroba., 48 (2): 51 -
57.
Wyszkowska,l. and Kucharski,l. (2000). Biochemical properties of soil contaminated by petroleum. Pol. J. Environ. Studies 9, 479-485
Xu Y. (2001). Biodegradation ofhigh concentrations of crude oil in microcosms. M.Sc. De~t. of Civil and Environ. Eng., College of Engineering, Cincinatti Uni\'.
Xu, J.G. and Johnson, R.L. (1995). Root growth, micro~ial activ~ty and phosphatase activit'!' in oil contaminated, re-mediated and uncontaml11ated sotis planted to barley and fi~ld pea. Plant and soil, 173: 3-10.
- 148-

Yateem, A, Balba, M.T., Al Awadhis, N., and El Nawawy, AS. (1998) white rot fungi and their role in remediated soil. Environ. Int., 24(1): 181-187.
Yateem, AM., Balba, AS., El Nawawy, AS. and Al Awadhi. N. (2000). Plants associated microflora and remediation of soil contaminated oil. Intemational 1. of phytoremediation, 7(3): 182-191.
Zhang,G.L., WU,Y.T. and Qian,X.P. (2005). Biodegradation of crude oil by Pseudomonas aeruginosa in the presence of rhamnolipids. 1. Zhejiang Univ. Sci. 6B(8), 725-730
Zhongyun, Ma. B. (1998). Bioremediation ofpetroleum hydrocarbon contaminated soil using indigenous cultures. M.Sc., Fac. of Eng. and applied science, Memorial Unl\'. of Newfoundland.
Zhu, x., Venosa, A.D., Suidan, M.T. and Lee, K. (2001). Guidelines for the bioremediation of marine shorelines and freshwater wellands. U.S. Environ. Prot. Agency. Office of Res. And Development.
Zidan, M.A (1993). Effect of some salts on soil microbial respiration. Bull. Fac. afSci. Assut. Univ. 22(2): 19-3
- 1.+9 -