Embed Size (px)
Citation preview

Enhancing Algebra Instruction
Through the Use of
Graphing TechnologyBill Gillam 10/18/[email protected]
Http://billandcimgillam.com

Carla’s Lemonade Stand
# glasses $ Profit 0 1 2 3 4 5 6
-9.50Input: number of glasses
Output:Profit
Initial costs are $9.50. Eachglass costs $0.75

Carla’s Lemonade Stand
# glasses $ Profit 0 1 2 3 4 5 6
-9.50-8.75
Input: number of glasses
Output:Profit
Initial costs are $9.50. Eachglass costs $0.75

Initial costs are $9.50. Eachglass costs $0.75
Carla’s Lemonade Stand
Input: number of glasses
Output:Profit
0.0001.0002.0003.0004.0005.000
-9.500-8.750-8.000-7.250-6.500-5.750

Initial costs are $9.50. Eachglass costs $0.75
Carla’s Lemonade Stand
Input: number of glasses
Output:Profit
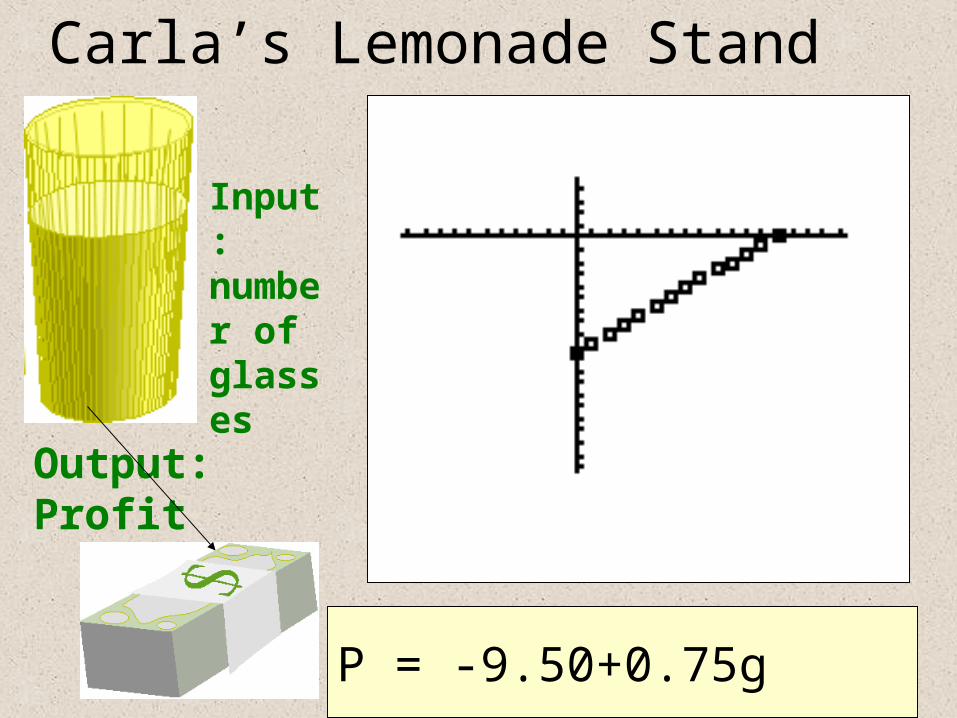
P = -9.50+0.75g
Carla’s Lemonade Stand
Input: number of glasses
Output:Profit

Initial costs are $9.50. Eachglass costs $0.75
Carla’s Lemonade Stand
Input: number of glasses
Output:Profit
Rule: P(n) =0.75n - 9.50n = 0, 1 ,2,3…..
\Y1= 0.75X – 9.50\Y2= \Y3=\Y4=\Y5=\Y6=

Initial costs are $9.50. Eachglass costs $0.75
Carla’s Lemonade Stand
Input: number of glasses
Output:Profit
Rule: P(n) =0.75n - 9.50n = 0, 1 ,2,3…..
12.00013.00014.00015.000
-.5000.2501.0001.750

Initial costs are $9.50. Eachglass costs $0.75
Carla’s Lemonade Stand
Input: number of glasses
Output:Profit
Rule: P(n) =0.75n - 9.50n = 0, 1 ,2,3…..

Variables Related by Rules
# Lawns $ Profit 0 51015202530
-195-135 -75 -15 45 105 165
Rule:

Variables Related by Rules
# Lawns $ Profit 0 51015202530
-195-135 -75 -15 45 105 165
Rule: -195 + 12x = profit

Variables Related by RulesSummary
1. Tables, Graphs & Rules
2. Income , Expense & Profit
Power Point by Bill Gillam
Adapted from Concepts in Algebra: A Technological Approach

Variables Related by Data in Graphs:
Part II - Interpreting Graphs
X
Y
AGE

Variables Related by Data in Graphs:
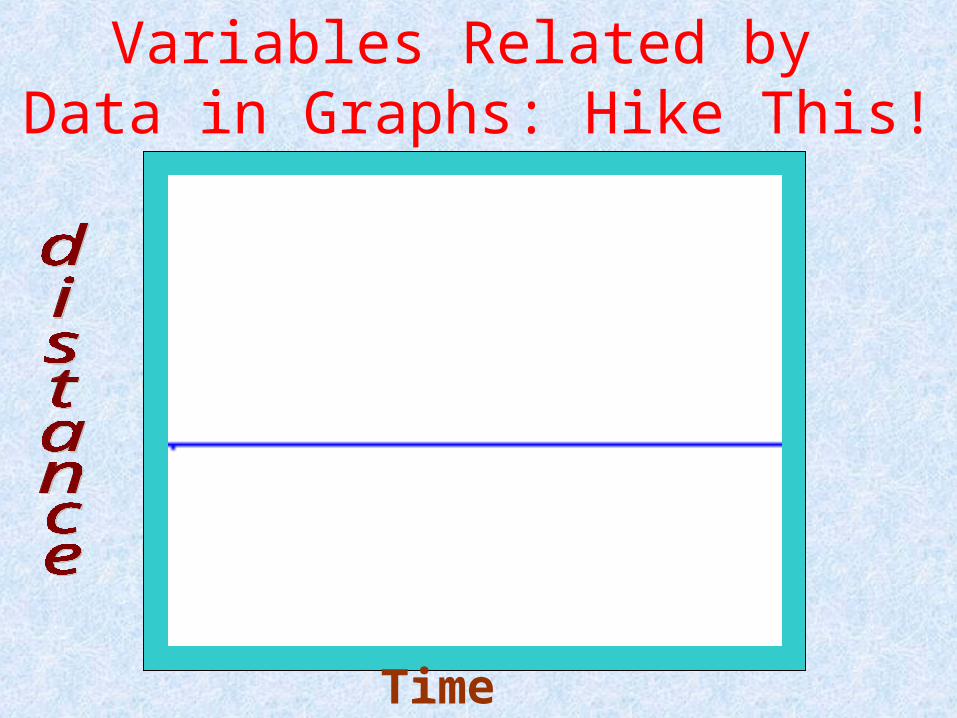
“The Hiker”

Variables Related by Data in Graphs: Hike This!
Time

Time
Variables Related by Data in Graphs: Hike This!

Time
Variables Related by Data in Graphs: Hike This!

Time
Variables Related by Data in Graphs: Hike This!

Time
Variables Related by Data in Graphs: Hike This!

Time
Variables Related by Data in Graphs: Hike This!

Time
Variables Related by Data in Graphs: Hike This!

Time
Variables Related by Data in Graphs: Hike This!
Time
Variables Related by Data in Graphs: Hike This!

Time
Variables Related by Data in Graphs: Hike This!

Time
Variables Related by Data in Graphs: Hike This!

Time
Variables Related by Data in Graphs: Hike This!

Variables Related by Data in Graphs:
Interpreting Graphs
1. CBL Stations2. Graph Stories

Variables Related by Data in Graphs:
Interpreting GraphsSummary
1. Speed 2. Rate of Change

Variables Related by Data in Graphs:
Interpreting Graphs
Power point by Bill Gillam

Rule: Y = *x + f(0)
Variables Related Linearly
# Lawns $ Profit 0 51015202530
-250-200-150-100 -50 0 50
50
50
50
50
50
50
5
5
5
5
5
5
changeX
changeY

Rule: Y = 10x + - 250
Variables Related Linearly
# Lawns $ Profit 0 51015202530
-250-200-150-100 -50 0 50
50
50
50
50
50
50
5
5
5
5
5
5

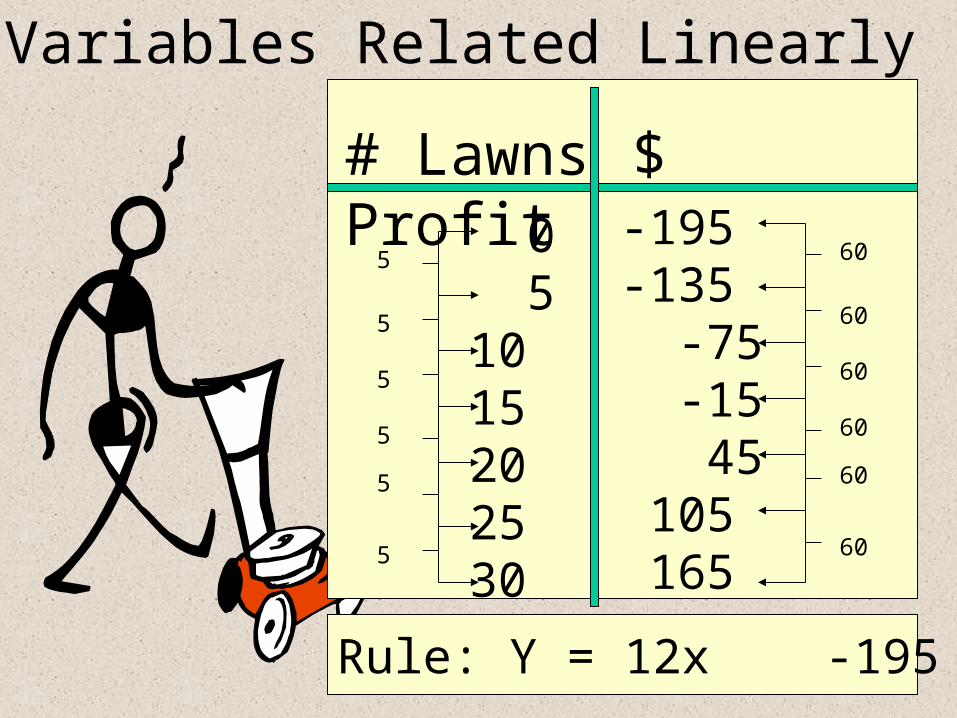
Variables Related Linearly
# Lawns $ Profit 0 51015202530
-195-135 -75 -15 45 105 165
Rule: Y = + f(0)changeX
changeY
Variables Related Linearly
# Lawns $ Profit 0 51015202530
-195-135 -75 -15 45 105 165
Rule: Y = 12x -195
5
5
5
5
5
5
60
60
60
60
60
60

Variables Related Linearly
Rule: Y = 12x - 195
Prof i t lawns
448
12=195/x x =16.25

Variables Related by Rules
Fundraiser Activity
Fundraiser Problem Revisited: Graphing the Function.
I. You are planning a fundraiser dance for your school. Plan your costs and decideon your ticket price, then find the function that represents your profit:
Security: _________ Ticket Purchase Price:
DJ: _________
Food/Bev. _________
Rent: _________
Decorations: _________ Representative Function:
Door prizes, awards, etc. _________ P(T) =
Total Costs: _________
II. Use your calculator to make a table of values, and a graph of the function.
A. Use the table or trace function of your calculator to find the break-even point:
P(T) = 0 when you sell _________ tickets.
B. Complete the following table to C. Use you calculator to make a get an idea of how sales relate to graph of your function. your profits: Sketch your graph below:
T P
0 25 50 75 100 125 150
175C. Is there anything you would change in your planning now that you have analyzed
this model?Bill Gillam
Each tick on thex-axis represents:
Each tick on they-axis represents:

Variables Related LinearlySummary
1. Ratio of change between any two pointsis constant. 2. Rule: y = Mx + b 3. Graphs a straight
line.

Variables Related by RulesSummary
Powerpoint by Bill Gillam

InvestigatingLinear Patternsin Data
7/22/2002

“If he was all on the same scale as his foot, he must certainly have been a giant.” - Sherlock Holmes
The Adventure of Wisteria Lodge.
InvestigatingLinear Patternsin Data

Footlengthand
Height
Question:Is the length of a person’s foot a useful predictor of his/her height?

Footlengthand
Height
1. Measure and record each student’s footlength and height in a table.2. Graph the ordered pairs: (footlength, height).3. Discuss

Strategies:1. Studying numerical patterns (table)2. Matching a graphical pattern (graph)3. Using function fitting tools (symbolic)
InvestigatingLinear Patternsin Data

Studying numerical patterns (table)
Foot Height21.2 15622.1 15922.2 16122.3 15422.5 15822.6 162.5...

Matching a graphical pattern (graph)
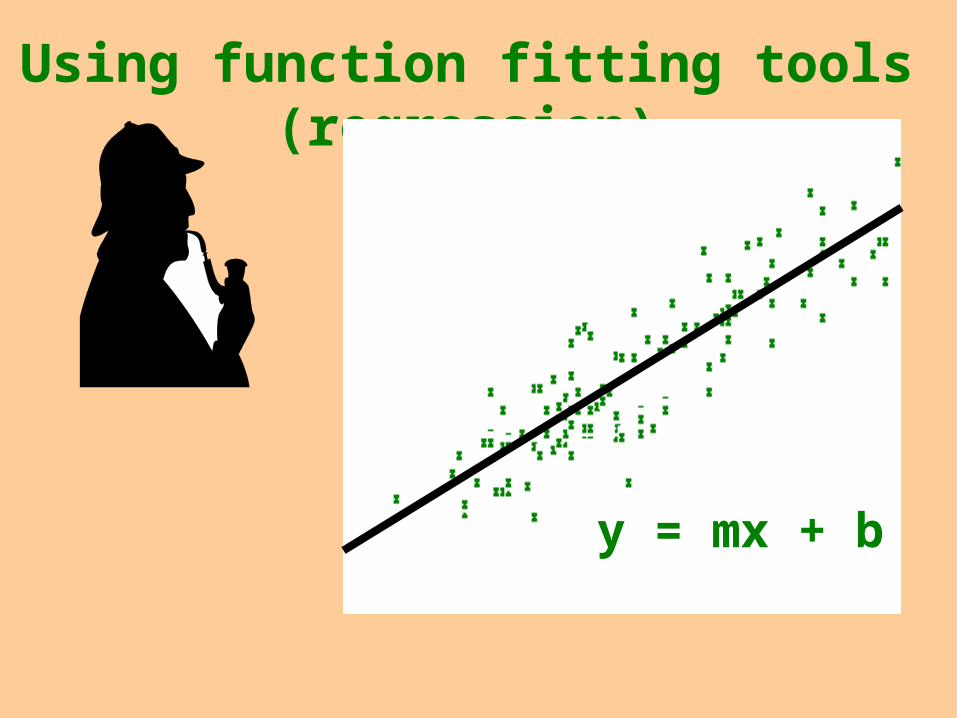
Using function fitting tools (regression)
y = mx + b

Symbolic Representation of Line of Best Fit
y = mx + b

Strategies:1. Studying numerical patterns (table)2. Matching a graphical pattern (graph)3. Using function fitting tools to obtain a modeling function (symbolic)
InvestigatingLinear Patternsin Data

Power point by Bill Gillam
InvestigatingLinear Patternsin Data

End-of -semester Project: Linear Correlation
General Description:The students will be given a question to investigate concerning a possible relationship between two variables. They willcollect data, produce scatter-plots and lines-of-best-fit, analyze their data and present their findings to the class.
Form of report:
Question: What question are you trying to answer? These are listed on the second page of this sheet. Your group willbe assigned one.
Data: Explain where and how you got your data. This should be clear, descriptive and understandable. For example: Ifyou measured, how and what did you measure. Did you exchange data with other sites? If so,how? If you looked on the internet - what site?
Analysis: Tables, graphs, scatter-plots etc. Should be professional looking as possible within the limitation of the toolswe have at our disposal. A scatter-plot and representative line are required.
Interpretation: What did you find out or think you found out? Back up your interpretation by referring to youranalysis.
Grade:
Written Report: 70data: 20analysis: 20interpretation: 20form/ organization/other: 10
Group Presentation:L 30verbal clarity: 10effective use of visual aids: 10form/organization/other: 10
Each group will present a presentation approximately five minutes in length. Presentations should include some visualaids. Suggestions: Title screens, appropriate tables and graphs, web-site if applicable.
Questions we will investigate:1. What, if anything, is the relationship between a persons armspan and height? (armspan. height)2. Can we accurately estimate a person's height ftom their footprint length? (footlength. height)3. Can we accurately estimate a person's height ftom their forearm length? (forearm length, footlength)4. Is there a linear relationship between the model year of a Chevy Cavalier and its current value? (model year, price)5. Is there a linear relationship between the model year of a Chevy Blazer and its current value? (model year, price)6. Is there a linear relationship between the model year of a Ford Explorer and its current value? (model year, price)7. Is the relationship between the circumference and the radius of a circle linear? (radius, circumference)8. Is there a linear relationship between the number of angles in a convex polygon and the sum of the polygon's interiorangles? (number of angles, sum of interior angles)9. Is there a linear relationship between a person's homework grade and their nine- weeks grade in this class?
Note: car data comes from: http://www.edmunds.com/used/


Exponential Growth
According to legend, chess was invented by Grand Vizier Sissa Ben Dahir, and given to King Shirham of India. The king offered him a reward, and he requested the following:
"Just one grain of wheat on the first square of the chessboard. Then put two on the second square, four on the next, then eight, and continue, doubling the number of grains on each successive square, until every square on the chessboard is reached."
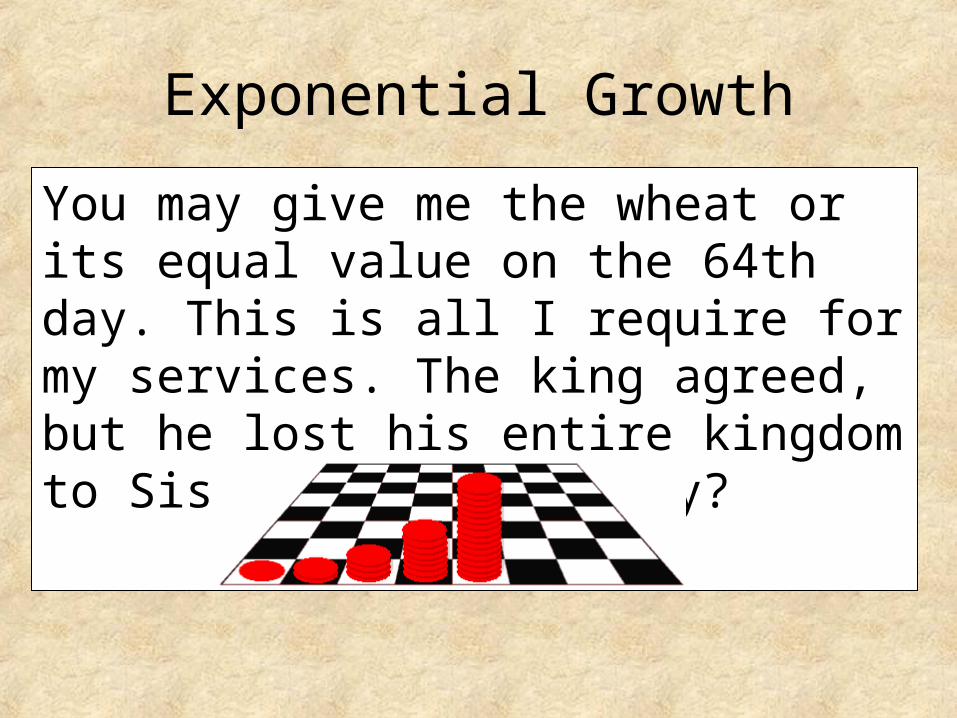
Exponential Growth
You may give me the wheat or its equal value on the 64th day. This is all I require for my services. The king agreed, but he lost his entire kingdom to Sissa Ben Dahir. Why?

Exponential Growthsquare/day rice Sum1 1 12 2 33 4 74 8 155 16 316 32 637 64 127...64 _____ _____
How much wheat did the King owe for 64th day?
How much wheat in all?
Exponential Growth
In all, the king owed about 18,000,000,000,000,000,000 grains of wheat. This was more than the worth of his entire kingdom!

Exponential GrowthThere is a function related to this story: f(x)=2^x
day rice sum riceday rice 2^(day-1) 2^day-11 1 2^0 = ____ 2^1 - 1 = ____2 2 2^1 = ____ 2^2 - 1 = ____ 3 4 2^2 = ____ 2^3 - 1 = ____4 8 2^3 = ____ 2^4 - 1 = ____...64 ____ 2^63 = ____ 2^64-1 = ____Copy and fill out this chart.

Exponential Growth
Grains of Rice
0.00
1000000000000000000.00
2000000000000000000.00
3000000000000000000.00
4000000000000000000.00
5000000000000000000.00
6000000000000000000.00
7000000000000000000.00
8000000000000000000.00
9000000000000000000.00
10000000000000000000.00
0 10 20 30 40 50 60 70
Day
Gra
ins

Exponential Growth
Moore's Law (from the intel website):http://www.intel.com/research/silicon/mooreslaw.htm

Exponential GrowthGordon Moore (co-founded Intel in 1968) made his famous observation in 1965, just four years after the first planar integrated circuit was discovered. The press called it "Moore's Law" and the name has stuck. In his original paper, Moore predicted that the number of transistors per integrated circuit would double every 18 months. He forecast that this trend would continue through 1975. Through Intel's technology, Moore's Law has been maintained for far longer, and still holds true as we enter the new century. The mission of Intel's technology development team is to continue to break down barriers to Moore's Law.

Exponential Growthchip Year Transistors 4004 1971 2,250 8008 1972 2,500 8080 1974 5,000 8086 1978 29,000 286 1982 120,000 386 processor 1985 275,000 486 DX processor 1989 1,180,000 Pentium® processor 1993 3,100,000 Pentium II processor 1997 7,500,000 Pentium III processor 1999 24,000,000 Pentium 4 processor 2000 42,000,000
Produce a plot of year vs. transistors

Exponential Growth
Review of how to do a point plot:"STAT" "Edit" enter year in L1 and transistors in L2."2nd" "Y=" "Plotsoff" "Enter" “Enter""2nd" "Y=" Choose Plot1 {On, Scatterplot, L1, L2, mark}"Zoom" 9

Exponential Growth
Moore’s Law indicates that the growth should be modeled by:Y=2250*2^((12/18)x)orY=2250*2^(x/1.5)
Is this accurate? Use exponential regression to find a curve that fits.

Exponential GrowthExponential Growth
1. Describe the graph:
2. How does this relate to the rice problem?
3. Can you think of other things that “grow” this way (ie. Doubling over a constant period of time?)

Exponential Graphs*************************************

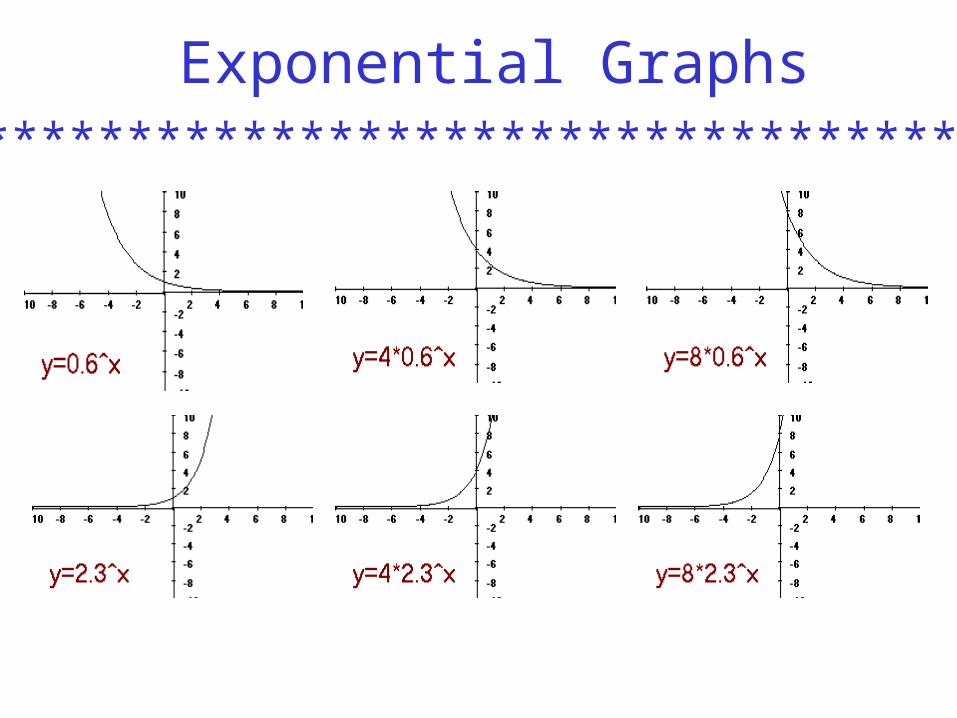
Exponential Graphs
1. Which graph is most likely 4^x?2. Which is most likely 0.25^x?3. Which is most likely 1^x?
*************************************
Y= 4^xY = 0.25^x Y = 1^x

Exponential Graphs
Graph the following pairs of functionson your calculator:A) y = 0.5^x and y = 2^xB) y = 0.25^x and y = 4^xC) y = (3/4)^x and y = (4/3)^x
*************************************
Make a conjecture about the relationshipbetween these graphs.

Exponential Graphs*************************************
Make a statement about the relationshipbetween these graphs.
Exponential Graphs*************************************
Exponential Graphs*************************************
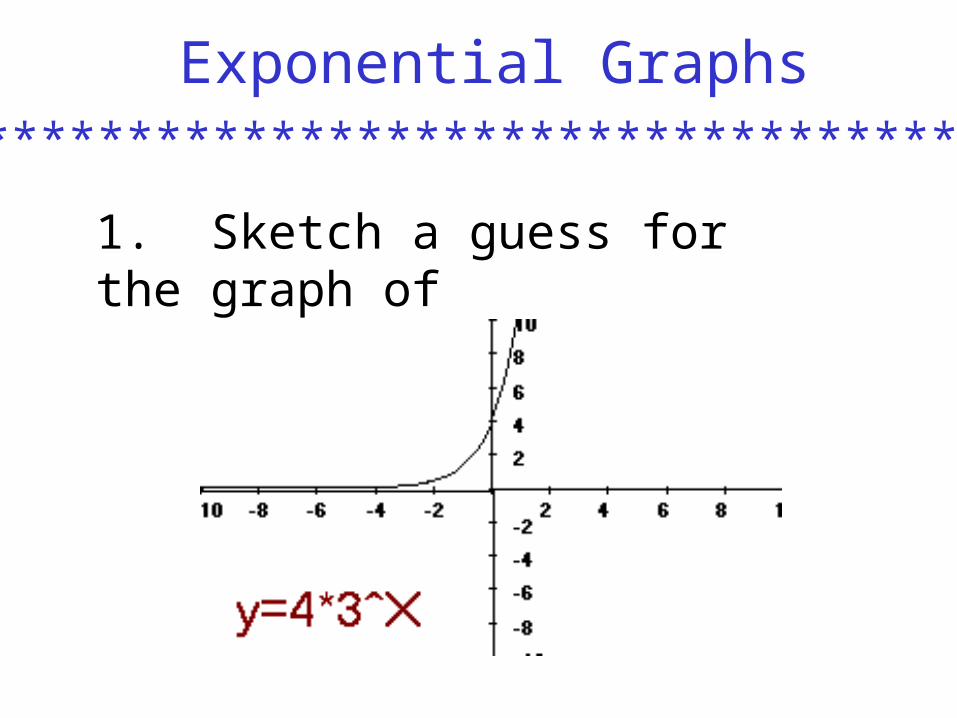
1. Sketch a guess for the graph of y = 4*3^x.

Exponential Graphs*************************************
Sketch a guess for the following graphs, then check them on your calculator to see how close you came.Y = 5^x; Y = 2*5^x; Y =0.2^x;Y = 6*(0.2^x); Y = -3^xand Y = -0.2^x.
Do exercises 1 - 4