Embed Size (px)
Citation preview
at SciVerse ScienceDirect
Applied Thermal Engineering 48 (2012) 41e53
Contents lists available
Applied Thermal Engineering
journal homepage: www.elsevier .com/locate/apthermeng
Enhancement of LNG plant propane cycle through waste heat powered absorptioncooling
P. Rodgers a,*, A. Mortazavi b, V. Eveloy a, S. Al-Hashimi a, Y. Hwang b, R. Radermacher b
a The Petroleum Institute, Abu Dhabi, United Arab EmiratesbDepartment of Mechanical Engineering, University of Maryland, College Park, MD, USA
a r t i c l e i n f o
Article history:Received 11 December 2010Accepted 13 April 2012Available online 21 April 2012
Keywords:Waste heat utilizationLNG plantAbsorption chillerAspen plus
* Corresponding author.E-mail address: [email protected] (P. Rodgers).
1 Approximately 1,188 kJ are consumed for the liqu
1359-4311/$ e see front matter � 2012 Elsevier Ltd.doi:10.1016/j.applthermaleng.2012.04.031
a b s t r a c t
In liquefied natural gas (LNG) plants utilizing sea water for process cooling, both the efficiency andproduction capacity of the propane cycle decrease with increasing sea water temperature. To address thisissue, several propane cycle enhancement approaches are investigated in this study, which requireminimal modification of the existing plant configuration. These approaches rely on the use of gas turbinewaste heat powered water/lithium bromide absorption cooling to either (i) subcool propane after thepropane cycle condenser, or (ii) reduce propane cycle condensing pressure through pre-cooling ofcondenser cooling water. In the second approach, two alternative methods of pre-cooling condensercooling water are considered, which consist of an open sea water loop, and a closed fresh water loop. Inaddition for all cases, three candidate absorption chiller configurations are evaluated, namely single-effect, double-effect, and cascaded double- and single-effect chillers. The thermodynamic performanceof each propane cycle enhancement scheme, integrated in an actual LNG plant in the Persian Gulf, isevaluated using actual plant operating data. Subcooling propane after the propane cycle condenser isfound to improve propane cycle total coefficient of performance (COPT) and cooling capacity by 13% and23%, respectively. The necessary cooling load could be provided by either a single-effect, double-effect orcascaded and single- and double-effect absorption refrigeration cycle recovering waste heat from a singlegas turbine operated at full load. Reducing propane condensing pressure using a closed fresh watercondenser cooling loop is found result in propane cycle COPT and cooling capacity enhancements of 63%and 22%, respectively, but would require substantially higher capital investment than for propane sub-cooling, due to higher cooling load and thus higher waste heat requirements. Considering the presenttrend of short process enhancement payback periods in the natural gas industry, subcooling propaneafter the propane cycle condenser is recommended as the preferred option to boost propane cycleperformance.
� 2012 Elsevier Ltd. All rights reserved.
1. Introduction
The liquefaction of natural gas (NG) serves to reduce NG volumefor economic transportation. Liquefaction is achieved by cooling NGbelow �160 �C [1], which requires a considerable amount ofenergy.1 Enhancing the energy efficiency of the liquefaction processcould therefore significantly improve the efficiency of liquefiednatural gas (LNG) plants, and reduce both fuel consumption andassociated carbon emissions. This is critical to LNG plants located inthe Persian Gulf, whose refrigeration capacities are constrained byhigh yearly ambient temperatures.
efaction of 1 kg of NG [2].
All rights reserved.
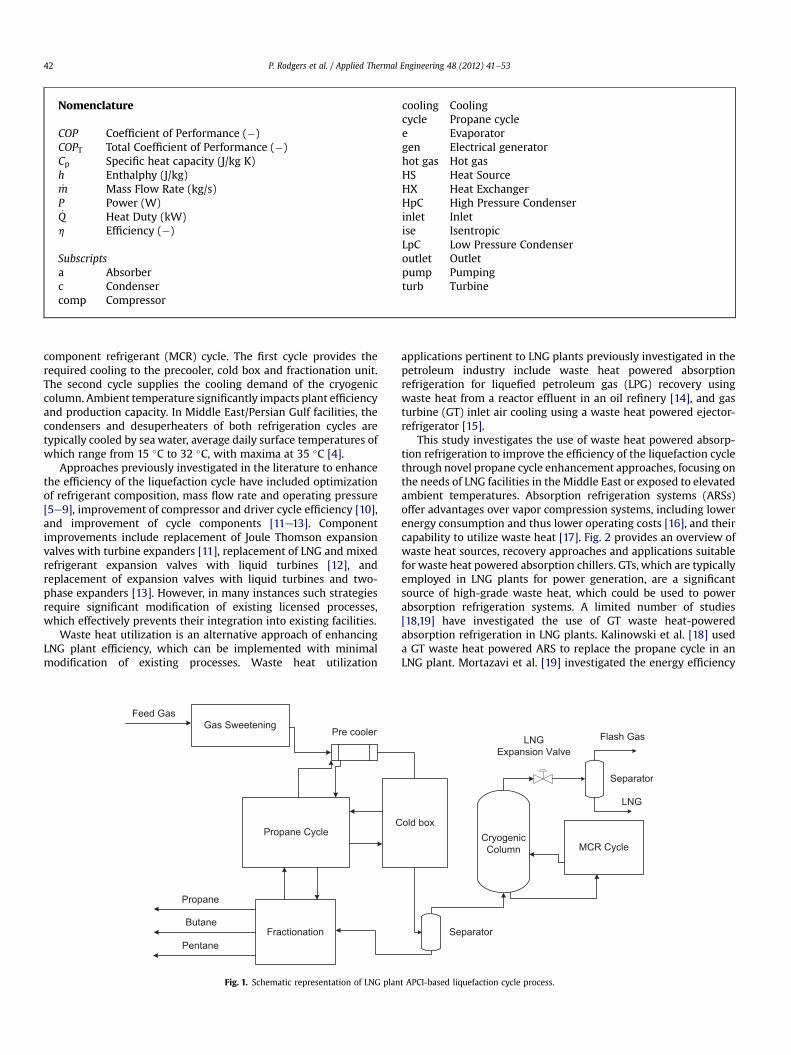
Today, the majority of base-load LNG plants employ the propanepre-cooled mixed refrigerant (APCI) cycle [3]. The plant consideredin this study is a major LNG facility in the Persian Gulf, whoseliquefaction process is based on APCI cycle. In this process, which isillustrated in Fig. 1, the feed gas is passed through a gas sweeteningsection for removal of H2S, CO2, H2O and Hg. As it passes throughthe precooler and cold box, its temperature decreases toapproximately �30 �C, resulting in condensation of certaincomponents. The remaining gas and condensate are separated inthe separator. The condensate is sent to the fractionation unit,where it is separated into propane, butane, pentane, and heavierhydrocarbons. The remaining gas is further cooled in the cryogeniccolumn to below�160 �C and liquefied. Its pressure is then reducedto atmospheric pressure by passing through the LNG expansionvalve. Two refrigeration cycles are involved in the overall processshown in Fig. 1, which are the propane cycle and the multi
Nomenclature
COP Coefficient of Performance (�)COPT Total Coefficient of Performance (�)Cp Specific heat capacity (J/kg K)h Enthalphy (J/kg)_m Mass Flow Rate (kg/s)P Power (W)_Q Heat Duty (kW)h Efficiency (�)
Subscriptsa Absorberc Condensercomp Compressor
cooling Coolingcycle Propane cyclee Evaporatorgen Electrical generatorhot gas Hot gasHS Heat SourceHX Heat ExchangerHpC High Pressure Condenserinlet Inletise IsentropicLpC Low Pressure Condenseroutlet Outletpump Pumpingturb Turbine
P. Rodgers et al. / Applied Thermal Engineering 48 (2012) 41e5342
component refrigerant (MCR) cycle. The first cycle provides therequired cooling to the precooler, cold box and fractionation unit.The second cycle supplies the cooling demand of the cryogeniccolumn. Ambient temperature significantly impacts plant efficiencyand production capacity. In Middle East/Persian Gulf facilities, thecondensers and desuperheaters of both refrigeration cycles aretypically cooled by sea water, average daily surface temperatures ofwhich range from 15 �C to 32 �C, with maxima at 35 �C [4].
Approaches previously investigated in the literature to enhancethe efficiency of the liquefaction cycle have included optimizationof refrigerant composition, mass flow rate and operating pressure[5e9], improvement of compressor and driver cycle efficiency [10],and improvement of cycle components [11e13]. Componentimprovements include replacement of Joule Thomson expansionvalves with turbine expanders [11], replacement of LNG and mixedrefrigerant expansion valves with liquid turbines [12], andreplacement of expansion valves with liquid turbines and two-phase expanders [13]. However, in many instances such strategiesrequire significant modification of existing licensed processes,which effectively prevents their integration into existing facilities.
Waste heat utilization is an alternative approach of enhancingLNG plant efficiency, which can be implemented with minimalmodification of existing processes. Waste heat utilization
Feed GasGas Sweetening
Pre cooler
C
Fractionation
Propane Cycle
Propane
Butane
Pentane
Fig. 1. Schematic representation of LNG plan
applications pertinent to LNG plants previously investigated in thepetroleum industry include waste heat powered absorptionrefrigeration for liquefied petroleum gas (LPG) recovery usingwaste heat from a reactor effluent in an oil refinery [14], and gasturbine (GT) inlet air cooling using a waste heat powered ejector-refrigerator [15].
This study investigates the use of waste heat powered absorp-tion refrigeration to improve the efficiency of the liquefaction cyclethrough novel propane cycle enhancement approaches, focusing onthe needs of LNG facilities in theMiddle East or exposed to elevatedambient temperatures. Absorption refrigeration systems (ARSs)offer advantages over vapor compression systems, including lowerenergy consumption and thus lower operating costs [16], and theircapability to utilize waste heat [17]. Fig. 2 provides an overview ofwaste heat sources, recovery approaches and applications suitablefor waste heat powered absorption chillers. GTs, which are typicallyemployed in LNG plants for power generation, are a significantsource of high-grade waste heat, which could be used to powerabsorption refrigeration systems. A limited number of studies[18,19] have investigated the use of GT waste heat-poweredabsorption refrigeration in LNG plants. Kalinowski et al. [18] useda GT waste heat powered ARS to replace the propane cycle in anLNG plant. Mortazavi et al. [19] investigated the energy efficiency
old boxCryogenicColumn MCR Cycle
LNGExpansion Valve
Separator
Separator
Flash Gas
LNG
t APCI-based liquefaction cycle process.
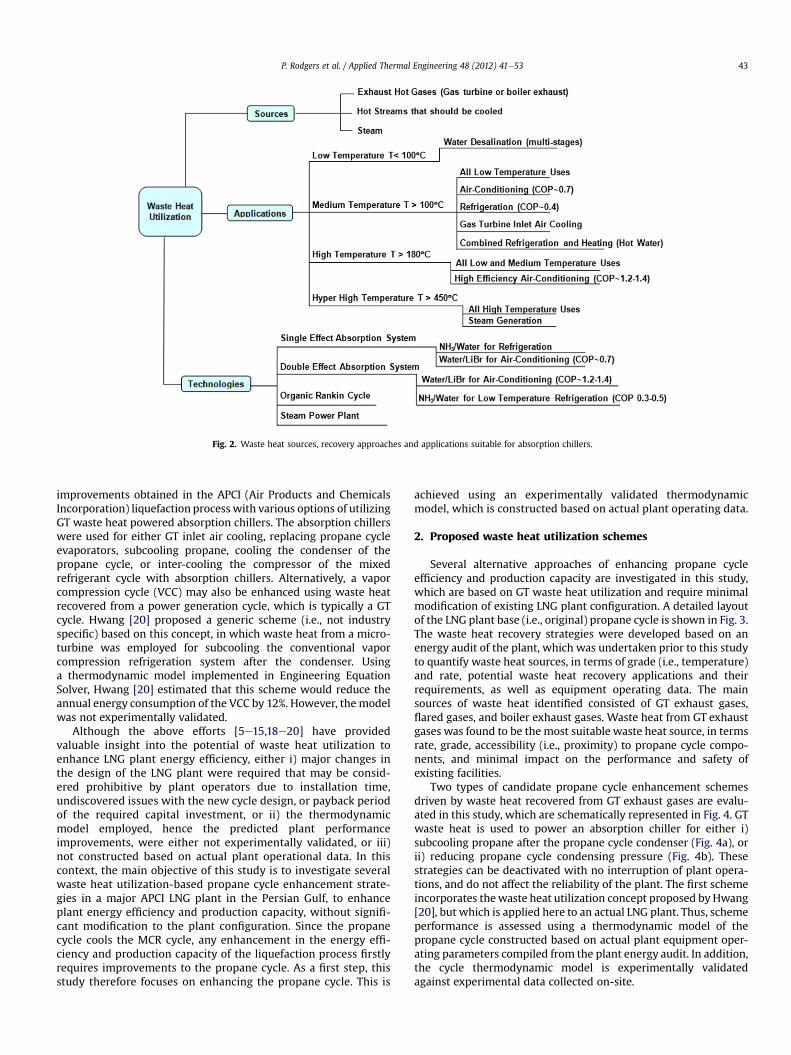
Fig. 2. Waste heat sources, recovery approaches and applications suitable for absorption chillers.
P. Rodgers et al. / Applied Thermal Engineering 48 (2012) 41e53 43
improvements obtained in the APCI (Air Products and ChemicalsIncorporation) liquefaction process with various options of utilizingGT waste heat powered absorption chillers. The absorption chillerswere used for either GT inlet air cooling, replacing propane cycleevaporators, subcooling propane, cooling the condenser of thepropane cycle, or inter-cooling the compressor of the mixedrefrigerant cycle with absorption chillers. Alternatively, a vaporcompression cycle (VCC) may also be enhanced using waste heatrecovered from a power generation cycle, which is typically a GTcycle. Hwang [20] proposed a generic scheme (i.e., not industryspecific) based on this concept, in which waste heat from a micro-turbine was employed for subcooling the conventional vaporcompression refrigeration system after the condenser. Usinga thermodynamic model implemented in Engineering EquationSolver, Hwang [20] estimated that this scheme would reduce theannual energy consumption of the VCC by 12%. However, the modelwas not experimentally validated.
Although the above efforts [5e15,18e20] have providedvaluable insight into the potential of waste heat utilization toenhance LNG plant energy efficiency, either i) major changes inthe design of the LNG plant were required that may be consid-ered prohibitive by plant operators due to installation time,undiscovered issues with the new cycle design, or payback periodof the required capital investment, or ii) the thermodynamicmodel employed, hence the predicted plant performanceimprovements, were either not experimentally validated, or iii)not constructed based on actual plant operational data. In thiscontext, the main objective of this study is to investigate severalwaste heat utilization-based propane cycle enhancement strate-gies in a major APCI LNG plant in the Persian Gulf, to enhanceplant energy efficiency and production capacity, without signifi-cant modification to the plant configuration. Since the propanecycle cools the MCR cycle, any enhancement in the energy effi-ciency and production capacity of the liquefaction process firstlyrequires improvements to the propane cycle. As a first step, thisstudy therefore focuses on enhancing the propane cycle. This is
achieved using an experimentally validated thermodynamicmodel, which is constructed based on actual plant operating data.
2. Proposed waste heat utilization schemes
Several alternative approaches of enhancing propane cycleefficiency and production capacity are investigated in this study,which are based on GT waste heat utilization and require minimalmodification of existing LNG plant configuration. A detailed layoutof the LNG plant base (i.e., original) propane cycle is shown in Fig. 3.The waste heat recovery strategies were developed based on anenergy audit of the plant, which was undertaken prior to this studyto quantify waste heat sources, in terms of grade (i.e., temperature)and rate, potential waste heat recovery applications and theirrequirements, as well as equipment operating data. The mainsources of waste heat identified consisted of GT exhaust gases,flared gases, and boiler exhaust gases. Waste heat from GT exhaustgases was found to be the most suitable waste heat source, in termsrate, grade, accessibility (i.e., proximity) to propane cycle compo-nents, and minimal impact on the performance and safety ofexisting facilities.
Two types of candidate propane cycle enhancement schemesdriven by waste heat recovered from GT exhaust gases are evalu-ated in this study, which are schematically represented in Fig. 4. GTwaste heat is used to power an absorption chiller for either i)subcooling propane after the propane cycle condenser (Fig. 4a), orii) reducing propane cycle condensing pressure (Fig. 4b). Thesestrategies can be deactivated with no interruption of plant opera-tions, and do not affect the reliability of the plant. The first schemeincorporates thewaste heat utilization concept proposed by Hwang[20], but which is applied here to an actual LNG plant. Thus, schemeperformance is assessed using a thermodynamic model of thepropane cycle constructed based on actual plant equipment oper-ating parameters compiled from the plant energy audit. In addition,the cycle thermodynamic model is experimentally validatedagainst experimental data collected on-site.
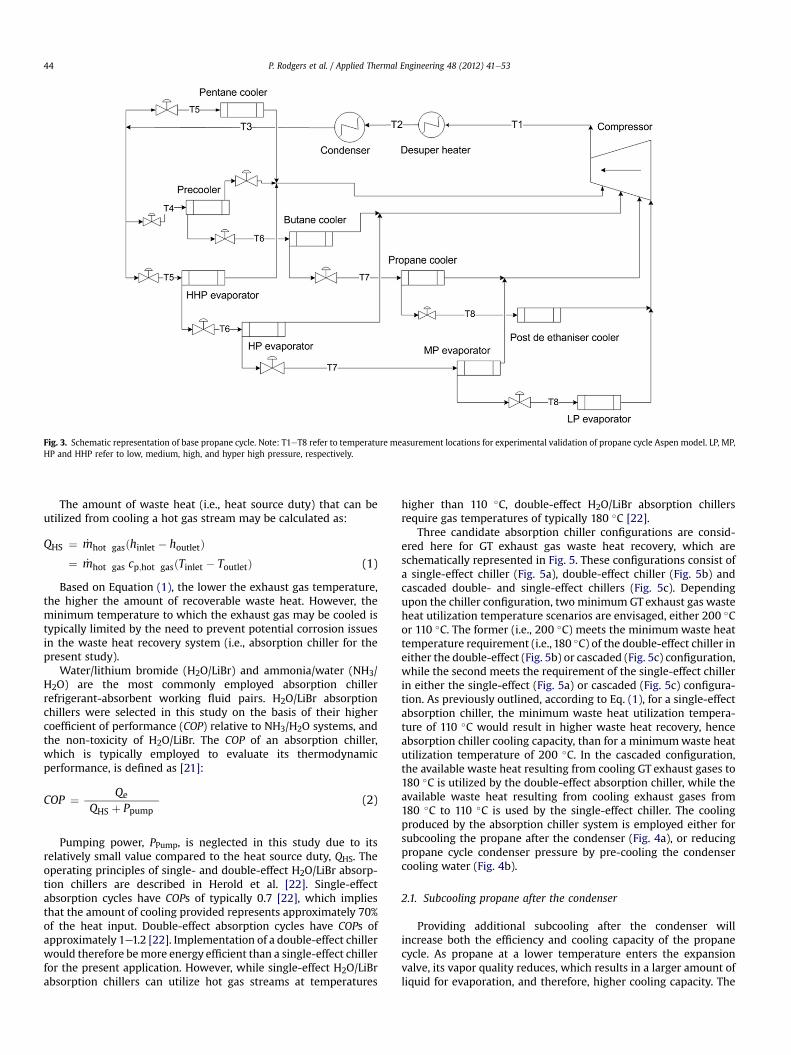
Fig. 3. Schematic representation of base propane cycle. Note: T1eT8 refer to temperature measurement locations for experimental validation of propane cycle Aspen model. LP, MP,HP and HHP refer to low, medium, high, and hyper high pressure, respectively.
P. Rodgers et al. / Applied Thermal Engineering 48 (2012) 41e5344
The amount of waste heat (i.e., heat source duty) that can beutilized from cooling a hot gas stream may be calculated as:
QHS ¼ _mhot gasðhinlet � houtletÞ¼ _mhot gas cp;hot gasðTinlet � ToutletÞ (1)
Based on Equation (1), the lower the exhaust gas temperature,the higher the amount of recoverable waste heat. However, theminimum temperature to which the exhaust gas may be cooled istypically limited by the need to prevent potential corrosion issuesin the waste heat recovery system (i.e., absorption chiller for thepresent study).
Water/lithium bromide (H2O/LiBr) and ammonia/water (NH3/H2O) are the most commonly employed absorption chillerrefrigerant-absorbent working fluid pairs. H2O/LiBr absorptionchillers were selected in this study on the basis of their highercoefficient of performance (COP) relative to NH3/H2O systems, andthe non-toxicity of H2O/LiBr. The COP of an absorption chiller,which is typically employed to evaluate its thermodynamicperformance, is defined as [21]:
COP ¼ Qe�QHS þ Ppump
� (2)
Pumping power, PPump, is neglected in this study due to itsrelatively small value compared to the heat source duty, QHS. Theoperating principles of single- and double-effect H2O/LiBr absorp-tion chillers are described in Herold et al. [22]. Single-effectabsorption cycles have COPs of typically 0.7 [22], which impliesthat the amount of cooling provided represents approximately 70%of the heat input. Double-effect absorption cycles have COPs ofapproximately 1e1.2 [22]. Implementation of a double-effect chillerwould therefore bemore energy efficient than a single-effect chillerfor the present application. However, while single-effect H2O/LiBrabsorption chillers can utilize hot gas streams at temperatures
higher than 110 �C, double-effect H2O/LiBr absorption chillersrequire gas temperatures of typically 180 �C [22].
Three candidate absorption chiller configurations are consid-ered here for GT exhaust gas waste heat recovery, which areschematically represented in Fig. 5. These configurations consist ofa single-effect chiller (Fig. 5a), double-effect chiller (Fig. 5b) andcascaded double- and single-effect chillers (Fig. 5c). Dependingupon the chiller configuration, two minimum GT exhaust gas wasteheat utilization temperature scenarios are envisaged, either 200 �Cor 110 �C. The former (i.e., 200 �C) meets the minimum waste heattemperature requirement (i.e., 180 �C) of the double-effect chiller ineither the double-effect (Fig. 5b) or cascaded (Fig. 5c) configuration,while the second meets the requirement of the single-effect chillerin either the single-effect (Fig. 5a) or cascaded (Fig. 5c) configura-tion. As previously outlined, according to Eq. (1), for a single-effectabsorption chiller, the minimum waste heat utilization tempera-ture of 110 �C would result in higher waste heat recovery, henceabsorption chiller cooling capacity, than for a minimumwaste heatutilization temperature of 200 �C. In the cascaded configuration,the available waste heat resulting from cooling GT exhaust gases to180 �C is utilized by the double-effect absorption chiller, while theavailable waste heat resulting from cooling exhaust gases from180 �C to 110 �C is used by the single-effect chiller. The coolingproduced by the absorption chiller system is employed either forsubcooling the propane after the condenser (Fig. 4a), or reducingpropane cycle condenser pressure by pre-cooling the condensercooling water (Fig. 4b).
2.1. Subcooling propane after the condenser
Providing additional subcooling after the condenser willincrease both the efficiency and cooling capacity of the propanecycle. As propane at a lower temperature enters the expansionvalve, its vapor quality reduces, which results in a larger amount ofliquid for evaporation, and therefore, higher cooling capacity. The
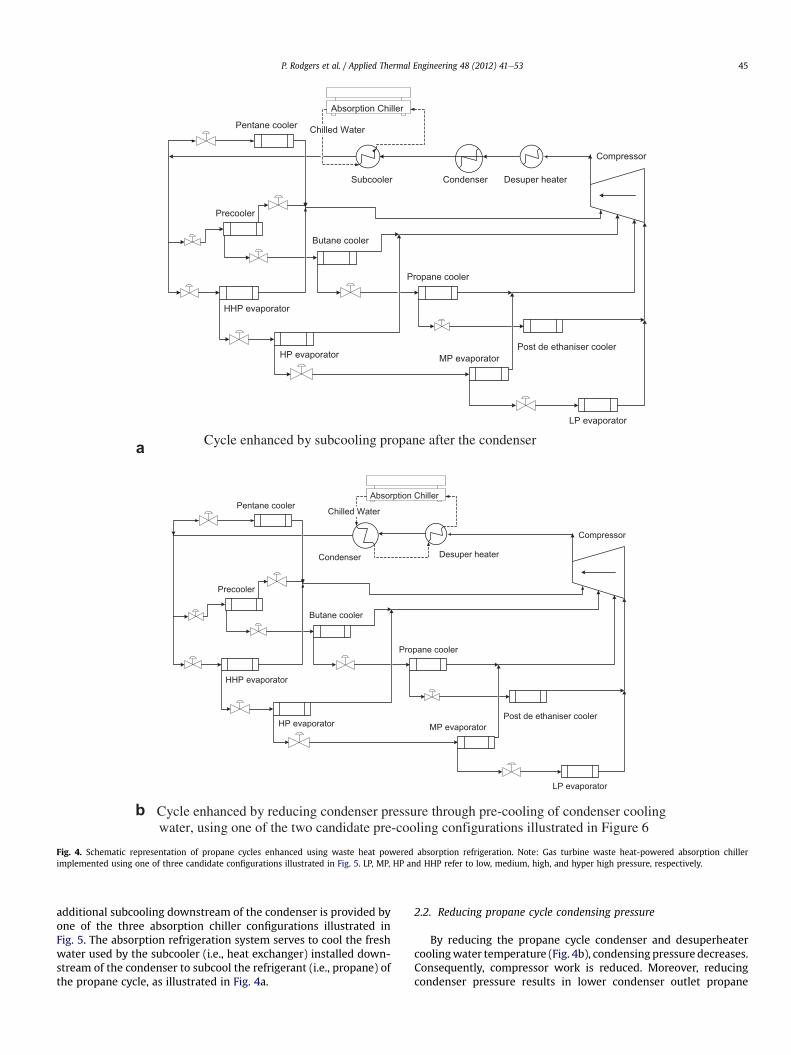
Cycle enhanced by subcooling propane after the condenser
Desuper heaterCondenser
HHP evaporator
Butane cooler
Precooler
Post de ethaniser coolerHP evaporator MP evaporator
Propane cooler
LP evaporator
Compressor
Pentane coolerAbsorption Chiller
Chilled Water
Cycle enhanced by reducing condenser pressure through pre-cooling of condenser cooling water, using one of the two candidate pre-cooling configurations illustrated in Figure 6
Desuper heaterCondenser
HHP evaporator
Butane cooler
Precooler
Post de ethaniser coolerHP evaporator MP evaporator
Propane cooler
LP evaporator
Compressor
Pentane cooler
Subcooler
Absorption Chiller
Chilled Water
a
b
Fig. 4. Schematic representation of propane cycles enhanced using waste heat powered absorption refrigeration. Note: Gas turbine waste heat-powered absorption chillerimplemented using one of three candidate configurations illustrated in Fig. 5. LP, MP, HP and HHP refer to low, medium, high, and hyper high pressure, respectively.
P. Rodgers et al. / Applied Thermal Engineering 48 (2012) 41e53 45
additional subcooling downstream of the condenser is provided byone of the three absorption chiller configurations illustrated inFig. 5. The absorption refrigeration system serves to cool the freshwater used by the subcooler (i.e., heat exchanger) installed down-stream of the condenser to subcool the refrigerant (i.e., propane) ofthe propane cycle, as illustrated in Fig. 4a.
2.2. Reducing propane cycle condensing pressure
By reducing the propane cycle condenser and desuperheatercoolingwater temperature (Fig. 4b), condensing pressure decreases.Consequently, compressor work is reduced. Moreover, reducingcondenser pressure results in lower condenser outlet propane
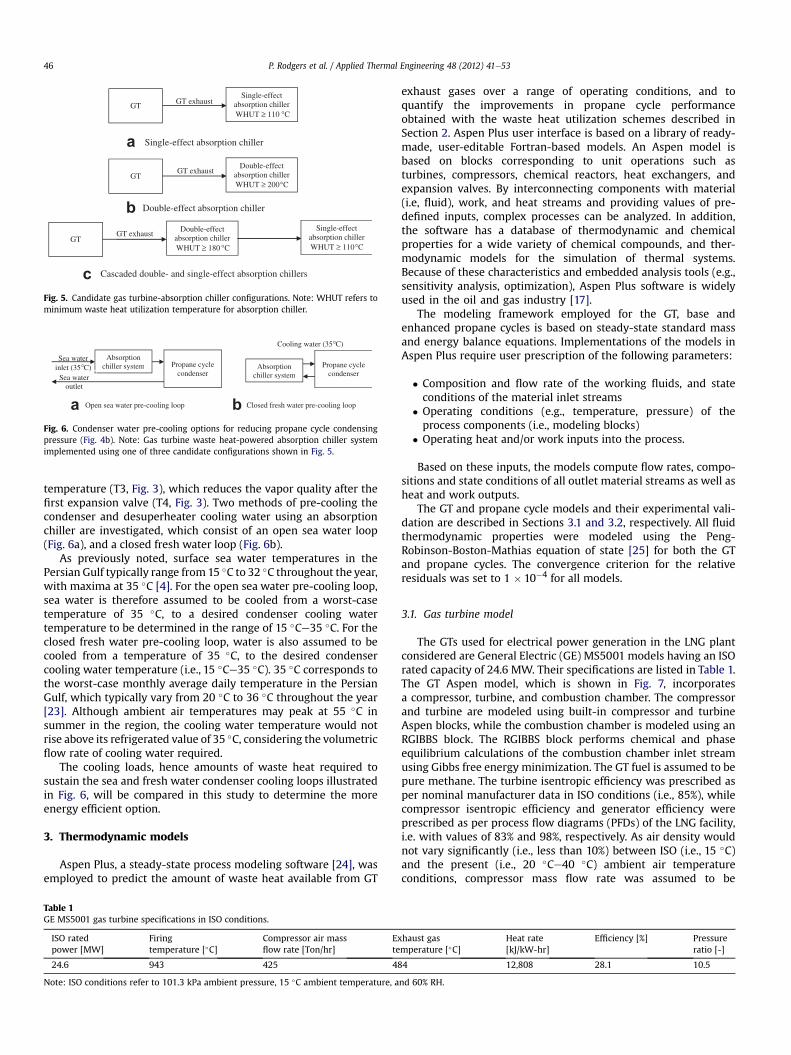
Open sea water pre-cooling loop Closed fresh water pre-cooling loop
Propane cycle condenser
Sea water inlet (35 C)
Absorption chiller system Propane cycle
condenser Absorption
chiller systemSea water outlet
Cooling water (35 C)
a b
°
°
Fig. 6. Condenser water pre-cooling options for reducing propane cycle condensingpressure (Fig. 4b). Note: Gas turbine waste heat-powered absorption chiller systemimplemented using one of three candidate configurations shown in Fig. 5.
Single-effect absorption chiller
Double-effect absorption chiller
Cascaded double- and single-effect absorption chillers
GT Single-effect
absorption chiller WHUT ≥ 110 °C
GT exhaust
GT Double-effect
absorption chiller WHUT ≥ 200°C
GT exhaust
GT Double-effect
absorption chiller WHUT ≥ 180 °C
GT exhaust Single-effect
absorption chiller WHUT ≥ 110°C
a
b
c
Fig. 5. Candidate gas turbine-absorption chiller configurations. Note: WHUT refers tominimum waste heat utilization temperature for absorption chiller.
P. Rodgers et al. / Applied Thermal Engineering 48 (2012) 41e5346
temperature (T3, Fig. 3), which reduces the vapor quality after thefirst expansion valve (T4, Fig. 3). Two methods of pre-cooling thecondenser and desuperheater cooling water using an absorptionchiller are investigated, which consist of an open sea water loop(Fig. 6a), and a closed fresh water loop (Fig. 6b).
As previously noted, surface sea water temperatures in thePersian Gulf typically range from15 �C to 32 �C throughout the year,with maxima at 35 �C [4]. For the open sea water pre-cooling loop,sea water is therefore assumed to be cooled from a worst-casetemperature of 35 �C, to a desired condenser cooling watertemperature to be determined in the range of 15 �Ce35 �C. For theclosed fresh water pre-cooling loop, water is also assumed to becooled from a temperature of 35 �C, to the desired condensercooling water temperature (i.e., 15 �Ce35 �C). 35 �C corresponds tothe worst-case monthly average daily temperature in the PersianGulf, which typically vary from 20 �C to 36 �C throughout the year[23]. Although ambient air temperatures may peak at 55 �C insummer in the region, the cooling water temperature would notrise above its refrigerated value of 35 �C, considering the volumetricflow rate of cooling water required.
The cooling loads, hence amounts of waste heat required tosustain the sea and fresh water condenser cooling loops illustratedin Fig. 6, will be compared in this study to determine the moreenergy efficient option.
3. Thermodynamic models
Aspen Plus, a steady-state process modeling software [24], wasemployed to predict the amount of waste heat available from GT
Table 1GE MS5001 gas turbine specifications in ISO conditions.
ISO ratedpower [MW]
Firingtemperature [�C]
Compressor air massflow rate [Ton/hr]
Exte
24.6 943 425 48
Note: ISO conditions refer to 101.3 kPa ambient pressure, 15 �C ambient temperature, a
exhaust gases over a range of operating conditions, and toquantify the improvements in propane cycle performanceobtained with the waste heat utilization schemes described inSection 2. Aspen Plus user interface is based on a library of ready-made, user-editable Fortran-based models. An Aspen model isbased on blocks corresponding to unit operations such asturbines, compressors, chemical reactors, heat exchangers, andexpansion valves. By interconnecting components with material(i.e, fluid), work, and heat streams and providing values of pre-defined inputs, complex processes can be analyzed. In addition,the software has a database of thermodynamic and chemicalproperties for a wide variety of chemical compounds, and ther-modynamic models for the simulation of thermal systems.Because of these characteristics and embedded analysis tools (e.g.,sensitivity analysis, optimization), Aspen Plus software is widelyused in the oil and gas industry [17].
The modeling framework employed for the GT, base andenhanced propane cycles is based on steady-state standard massand energy balance equations. Implementations of the models inAspen Plus require user prescription of the following parameters:
� Composition and flow rate of the working fluids, and stateconditions of the material inlet streams
� Operating conditions (e.g., temperature, pressure) of theprocess components (i.e., modeling blocks)
� Operating heat and/or work inputs into the process.
Based on these inputs, the models compute flow rates, compo-sitions and state conditions of all outlet material streams as well asheat and work outputs.
The GT and propane cycle models and their experimental vali-dation are described in Sections 3.1 and 3.2, respectively. All fluidthermodynamic properties were modeled using the Peng-Robinson-Boston-Mathias equation of state [25] for both the GTand propane cycles. The convergence criterion for the relativeresiduals was set to 1 � 10�4 for all models.
3.1. Gas turbine model
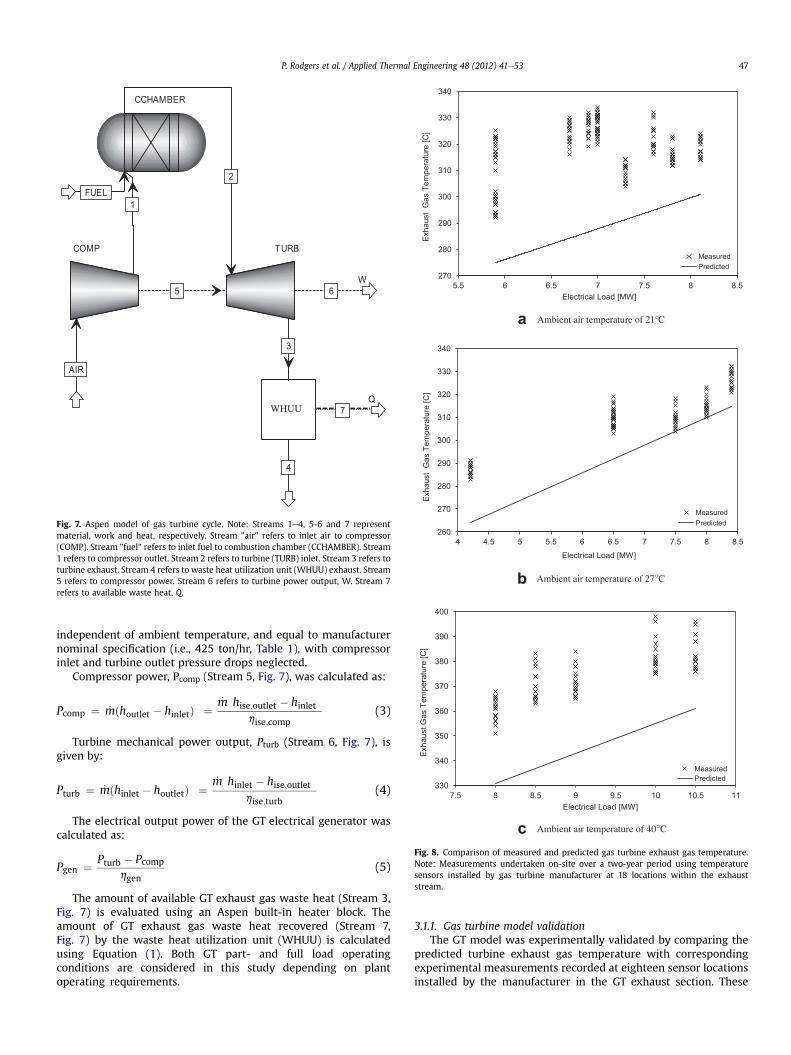
The GTs used for electrical power generation in the LNG plantconsidered are General Electric (GE) MS5001 models having an ISOrated capacity of 24.6 MW. Their specifications are listed in Table 1.The GT Aspen model, which is shown in Fig. 7, incorporatesa compressor, turbine, and combustion chamber. The compressorand turbine are modeled using built-in compressor and turbineAspen blocks, while the combustion chamber is modeled using anRGIBBS block. The RGIBBS block performs chemical and phaseequilibrium calculations of the combustion chamber inlet streamusing Gibbs free energy minimization. The GT fuel is assumed to bepure methane. The turbine isentropic efficiency was prescribed asper nominal manufacturer data in ISO conditions (i.e., 85%), whilecompressor isentropic efficiency and generator efficiency wereprescribed as per process flow diagrams (PFDs) of the LNG facility,i.e. with values of 83% and 98%, respectively. As air density wouldnot vary significantly (i.e., less than 10%) between ISO (i.e., 15 �C)and the present (i.e., 20 �Ce40 �C) ambient air temperatureconditions, compressor mass flow rate was assumed to be
haust gasmperature [�C]
Heat rate[kJ/kW-hr]
Efficiency [%] Pressureratio [-]
4 12,808 28.1 10.5
nd 60% RH.
COMP TURB
CCHAMBER
AIR
1FUEL
2
3
6W
5
4
7Q
WHUU
Fig. 7. Aspen model of gas turbine cycle. Note: Streams 1e4, 5-6 and 7 representmaterial, work and heat, respectively. Stream "air" refers to inlet air to compressor(COMP). Stream "fuel" refers to inlet fuel to combustion chamber (CCHAMBER). Stream1 refers to compressor outlet. Stream 2 refers to turbine (TURB) inlet. Stream 3 refers toturbine exhaust. Stream 4 refers to waste heat utilization unit (WHUU) exhaust. Stream5 refers to compressor power. Stream 6 refers to turbine power output, W. Stream 7refers to available waste heat, Q.
Ambient air temperature of 21°C
Ambient air temperature of 27 C
270
280
290
300
310
320
330
340
5.5 6 6.5 7 7.5 8 8.5
Exha
ust
Gas
Tem
pera
ture
[C]
Electrical Load [MW]
MeasuredPredicted
260
270
280
290
300
310
320
330
340
4 4.5 5 5.5 6 6.5 7 7.5 8 8.5
Exha
ust
Gas
Tem
pera
ture
[C]
Electrical Load [MW]
MeasuredPredicted
Ambient air temperature of 40 C
330
340
350
360
370
380
390
400
7.5 8 8.5 9 9.5 10 10.5 11
Exha
ust G
as T
empe
ratu
re [C
]
Electrical Load [MW]
MeasuredPredicted
°
°
a
b
c
Fig. 8. Comparison of measured and predicted gas turbine exhaust gas temperature.Note: Measurements undertaken on-site over a two-year period using temperaturesensors installed by gas turbine manufacturer at 18 locations within the exhauststream.
P. Rodgers et al. / Applied Thermal Engineering 48 (2012) 41e53 47
independent of ambient temperature, and equal to manufacturernominal specification (i.e., 425 ton/hr, Table 1), with compressorinlet and turbine outlet pressure drops neglected.
Compressor power, Pcomp (Stream 5, Fig. 7), was calculated as:
Pcomp ¼ _mðhoutlet � hinletÞ ¼_m�hise;outlet � hinlet
�
hise;comp(3)
Turbine mechanical power output, Pturb (Stream 6, Fig. 7), isgiven by:
Pturb ¼ _mðhinlet � houtletÞ ¼_m�hinlet � hise;outlet
�
hise;turb(4)
The electrical output power of the GT electrical generator wascalculated as:
Pgen ¼ Pturb � Pcomp
hgen(5)
The amount of available GT exhaust gas waste heat (Stream 3,Fig. 7) is evaluated using an Aspen built-in heater block. Theamount of GT exhaust gas waste heat recovered (Stream 7,Fig. 7) by the waste heat utilization unit (WHUU) is calculatedusing Equation (1). Both GT part- and full load operatingconditions are considered in this study depending on plantoperating requirements.
3.1.1. Gas turbine model validationThe GT model was experimentally validated by comparing the
predicted turbine exhaust gas temperature with correspondingexperimental measurements recorded at eighteen sensor locationsinstalled by the manufacturer in the GT exhaust section. These
320
330
340
350
360
370
380
390
400
7.5 8 8.5 9 9.5 10 10.5 11
Exha
ust G
as T
empe
ratu
re [C
]
Electrical Load [MW]
Measured
Nominal model
Compressor efficiency = 0.81
Turbine efficiency = 0.83
Generator efficeincy = 0.96
Combination of effects
MeasuredNominal modelηcomp = 81%ηturb = 83%ηgen = 96%Combined deviation
Fig. 9. Prediction sensitivity of gas turbine exhaust gas temperature to compressor,turbine and generator efficiencies. Note: Ambient temperature ¼ 40 �C. Nominalmodel refers to compressor, turbine, and generator efficiencies (h) of 83%, 85% and 98%,respectively. Combined deviation refers to the combined impact of deviation ofcompressor (hcomp ¼ 81%), turbine (hturb ¼ 83%) and generator (hgen ¼ 96%) efficienciesfrom nominal values.
P. Rodgers et al. / Applied Thermal Engineering 48 (2012) 41e5348
measurements were performed on-site over a two-year period.Measured and predicted exhaust gas temperatures are compared inFig. 8 as a function of electrical load at three different ambient airtemperatures between 20 �C and 40 �C. At a given electrical load,the predicted exhaust gas temperatures are in almost all instanceslower than corresponding measurements, which may be attribut-able to the following two factors. The performance of the GT underanalysis may have degraded over its past 30 years of service.Consequently, its efficiency may be lower than its nominal value,which would result in higher exhaust gas temperature. For thesame reason, generator efficiency may be lower than its manufac-turer specification. Hence for a given electrical load, a higheramount of mechanical work may be required than for nominalconditions, resulting in higher exhaust gas temperature for a givenelectrical output.
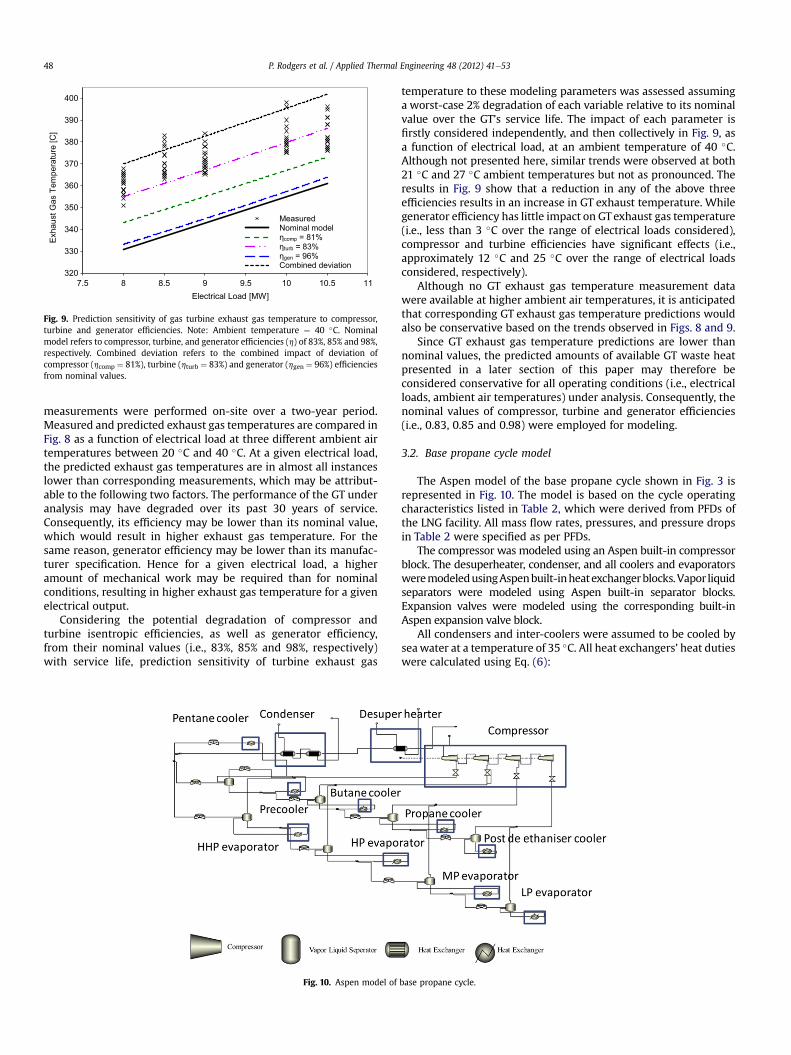
Considering the potential degradation of compressor andturbine isentropic efficiencies, as well as generator efficiency,from their nominal values (i.e., 83%, 85% and 98%, respectively)with service life, prediction sensitivity of turbine exhaust gas
Fig. 10. Aspen model of
temperature to these modeling parameters was assessed assuminga worst-case 2% degradation of each variable relative to its nominalvalue over the GT’s service life. The impact of each parameter isfirstly considered independently, and then collectively in Fig. 9, asa function of electrical load, at an ambient temperature of 40 �C.Although not presented here, similar trends were observed at both21 �C and 27 �C ambient temperatures but not as pronounced. Theresults in Fig. 9 show that a reduction in any of the above threeefficiencies results in an increase in GT exhaust temperature. Whilegenerator efficiency has little impact on GTexhaust gas temperature(i.e., less than 3 �C over the range of electrical loads considered),compressor and turbine efficiencies have significant effects (i.e.,approximately 12 �C and 25 �C over the range of electrical loadsconsidered, respectively).
Although no GT exhaust gas temperature measurement datawere available at higher ambient air temperatures, it is anticipatedthat corresponding GT exhaust gas temperature predictions wouldalso be conservative based on the trends observed in Figs. 8 and 9.
Since GT exhaust gas temperature predictions are lower thannominal values, the predicted amounts of available GT waste heatpresented in a later section of this paper may therefore beconsidered conservative for all operating conditions (i.e., electricalloads, ambient air temperatures) under analysis. Consequently, thenominal values of compressor, turbine and generator efficiencies(i.e., 0.83, 0.85 and 0.98) were employed for modeling.
3.2. Base propane cycle model
The Aspen model of the base propane cycle shown in Fig. 3 isrepresented in Fig. 10. The model is based on the cycle operatingcharacteristics listed in Table 2, which were derived from PFDs ofthe LNG facility. All mass flow rates, pressures, and pressure dropsin Table 2 were specified as per PFDs.
The compressor was modeled using an Aspen built-in compressorblock. The desuperheater, condenser, and all coolers and evaporatorsweremodeledusingAspenbuilt-inheatexchangerblocks.Vapor liquidseparators were modeled using Aspen built-in separator blocks.Expansion valves were modeled using the corresponding built-inAspen expansion valve block.
All condensers and inter-coolers were assumed to be cooled byseawater at a temperature of 35 �C. All heat exchangers’ heat dutieswere calculated using Eq. (6):
base propane cycle.
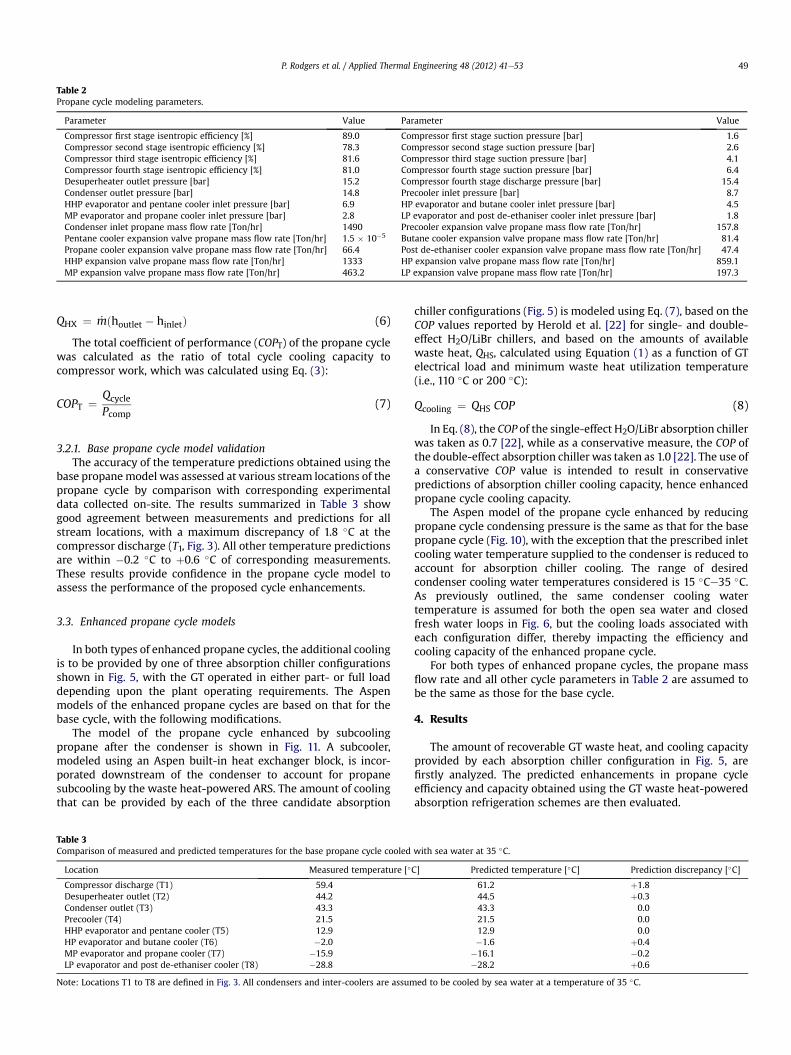
Table 2Propane cycle modeling parameters.
Parameter Value Parameter Value
Compressor first stage isentropic efficiency [%] 89.0 Compressor first stage suction pressure [bar] 1.6Compressor second stage isentropic efficiency [%] 78.3 Compressor second stage suction pressure [bar] 2.6Compressor third stage isentropic efficiency [%] 81.6 Compressor third stage suction pressure [bar] 4.1Compressor fourth stage isentropic efficiency [%] 81.0 Compressor fourth stage suction pressure [bar] 6.4Desuperheater outlet pressure [bar] 15.2 Compressor fourth stage discharge pressure [bar] 15.4Condenser outlet pressure [bar] 14.8 Precooler inlet pressure [bar] 8.7HHP evaporator and pentane cooler inlet pressure [bar] 6.9 HP evaporator and butane cooler inlet pressure [bar] 4.5MP evaporator and propane cooler inlet pressure [bar] 2.8 LP evaporator and post de-ethaniser cooler inlet pressure [bar] 1.8Condenser inlet propane mass flow rate [Ton/hr] 1490 Precooler expansion valve propane mass flow rate [Ton/hr] 157.8Pentane cooler expansion valve propane mass flow rate [Ton/hr] 1.5 � 10�5 Butane cooler expansion valve propane mass flow rate [Ton/hr] 81.4Propane cooler expansion valve propane mass flow rate [Ton/hr] 66.4 Post de-ethaniser cooler expansion valve propane mass flow rate [Ton/hr] 47.4HHP expansion valve propane mass flow rate [Ton/hr] 1333 HP expansion valve propane mass flow rate [Ton/hr] 859.1MP expansion valve propane mass flow rate [Ton/hr] 463.2 LP expansion valve propane mass flow rate [Ton/hr] 197.3
P. Rodgers et al. / Applied Thermal Engineering 48 (2012) 41e53 49
QHX ¼ _mðhoutlet � hinletÞ (6)
The total coefficient of performance (COPT) of the propane cyclewas calculated as the ratio of total cycle cooling capacity tocompressor work, which was calculated using Eq. (3):
COPT ¼ Qcycle
Pcomp(7)
3.2.1. Base propane cycle model validationThe accuracy of the temperature predictions obtained using the
base propanemodel was assessed at various stream locations of thepropane cycle by comparison with corresponding experimentaldata collected on-site. The results summarized in Table 3 showgood agreement between measurements and predictions for allstream locations, with a maximum discrepancy of 1.8 �C at thecompressor discharge (T1, Fig. 3). All other temperature predictionsare within �0.2 �C to þ0.6 �C of corresponding measurements.These results provide confidence in the propane cycle model toassess the performance of the proposed cycle enhancements.
3.3. Enhanced propane cycle models
In both types of enhanced propane cycles, the additional coolingis to be provided by one of three absorption chiller configurationsshown in Fig. 5, with the GT operated in either part- or full loaddepending upon the plant operating requirements. The Aspenmodels of the enhanced propane cycles are based on that for thebase cycle, with the following modifications.
The model of the propane cycle enhanced by subcoolingpropane after the condenser is shown in Fig. 11. A subcooler,modeled using an Aspen built-in heat exchanger block, is incor-porated downstream of the condenser to account for propanesubcooling by the waste heat-powered ARS. The amount of coolingthat can be provided by each of the three candidate absorption
Table 3Comparison of measured and predicted temperatures for the base propane cycle cooled
Location Measured temperature [�
Compressor discharge (T1) 59.4Desuperheater outlet (T2) 44.2Condenser outlet (T3) 43.3Precooler (T4) 21.5HHP evaporator and pentane cooler (T5) 12.9HP evaporator and butane cooler (T6) �2.0MP evaporator and propane cooler (T7) �15.9LP evaporator and post de-ethaniser cooler (T8) �28.8
Note: Locations T1 to T8 are defined in Fig. 3. All condensers and inter-coolers are assum
chiller configurations (Fig. 5) is modeled using Eq. (7), based on theCOP values reported by Herold et al. [22] for single- and double-effect H2O/LiBr chillers, and based on the amounts of availablewaste heat, QHS, calculated using Equation (1) as a function of GTelectrical load and minimum waste heat utilization temperature(i.e., 110 �C or 200 �C):
Qcooling ¼ QHS COP (8)
In Eq. (8), the COP of the single-effect H2O/LiBr absorption chillerwas taken as 0.7 [22], while as a conservative measure, the COP ofthe double-effect absorption chiller was taken as 1.0 [22]. The use ofa conservative COP value is intended to result in conservativepredictions of absorption chiller cooling capacity, hence enhancedpropane cycle cooling capacity.
The Aspen model of the propane cycle enhanced by reducingpropane cycle condensing pressure is the same as that for the basepropane cycle (Fig. 10), with the exception that the prescribed inletcooling water temperature supplied to the condenser is reduced toaccount for absorption chiller cooling. The range of desiredcondenser cooling water temperatures considered is 15 �Ce35 �C.As previously outlined, the same condenser cooling watertemperature is assumed for both the open sea water and closedfresh water loops in Fig. 6, but the cooling loads associated witheach configuration differ, thereby impacting the efficiency andcooling capacity of the enhanced propane cycle.
For both types of enhanced propane cycles, the propane massflow rate and all other cycle parameters in Table 2 are assumed tobe the same as those for the base cycle.
4. Results
The amount of recoverable GT waste heat, and cooling capacityprovided by each absorption chiller configuration in Fig. 5, arefirstly analyzed. The predicted enhancements in propane cycleefficiency and capacity obtained using the GT waste heat-poweredabsorption refrigeration schemes are then evaluated.
with sea water at 35 �C.
C] Predicted temperature [�C] Prediction discrepancy [�C]
61.2 þ1.844.5 þ0.343.3 0.021.5 0.012.9 0.0�1.6 þ0.4
�16.1 �0.2�28.2 þ0.6
ed to be cooled by sea water at a temperature of 35 �C.
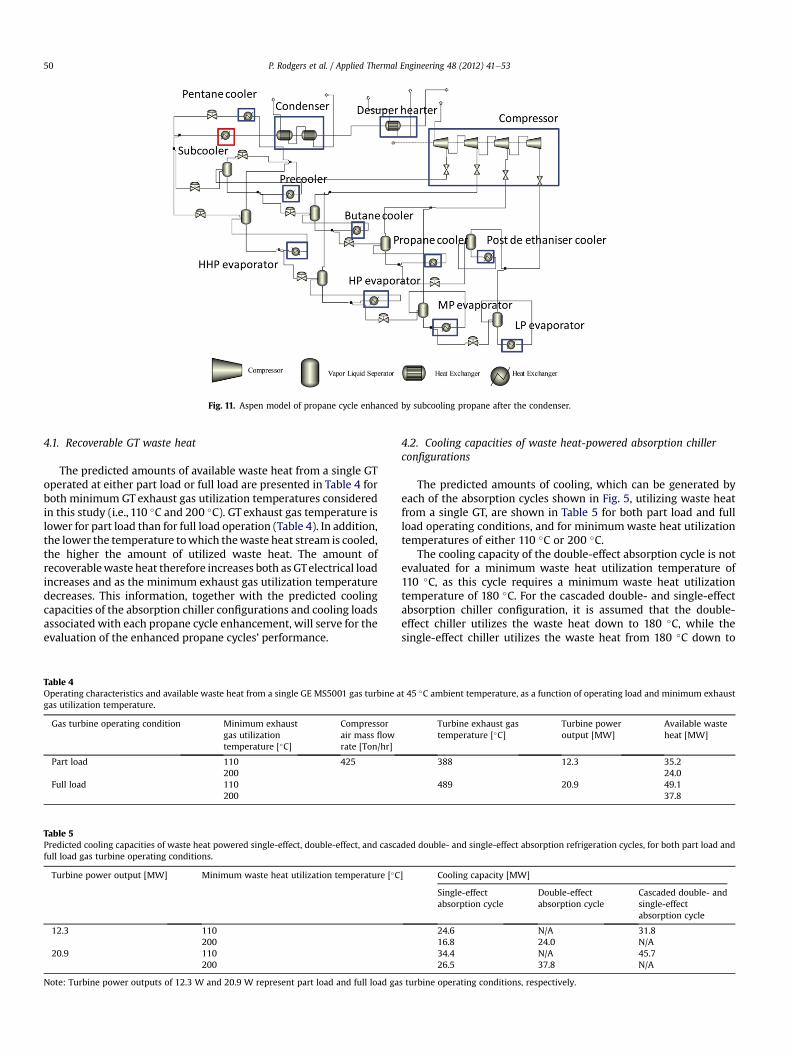
Fig. 11. Aspen model of propane cycle enhanced by subcooling propane after the condenser.
P. Rodgers et al. / Applied Thermal Engineering 48 (2012) 41e5350
4.1. Recoverable GT waste heat
The predicted amounts of available waste heat from a single GToperated at either part load or full load are presented in Table 4 forboth minimum GT exhaust gas utilization temperatures consideredin this study (i.e., 110 �C and 200 �C). GT exhaust gas temperature islower for part load than for full load operation (Table 4). In addition,the lower the temperature towhich thewaste heat stream is cooled,the higher the amount of utilized waste heat. The amount ofrecoverablewaste heat therefore increases both as GTelectrical loadincreases and as the minimum exhaust gas utilization temperaturedecreases. This information, together with the predicted coolingcapacities of the absorption chiller configurations and cooling loadsassociated with each propane cycle enhancement, will serve for theevaluation of the enhanced propane cycles’ performance.
Table 4Operating characteristics and available waste heat from a single GE MS5001 gas turbine agas utilization temperature.
Gas turbine operating condition Minimum exhaustgas utilizationtemperature [�C]
Compressorair mass flowrate [Ton/hr]
Part load 110 425200
Full load 110200
Table 5Predicted cooling capacities of waste heat powered single-effect, double-effect, and cascafull load gas turbine operating conditions.
Turbine power output [MW] Minimum waste heat utilization temperature [�C
12.3 110200
20.9 110200
Note: Turbine power outputs of 12.3 W and 20.9 W represent part load and full load ga
4.2. Cooling capacities of waste heat-powered absorption chillerconfigurations
The predicted amounts of cooling, which can be generated byeach of the absorption cycles shown in Fig. 5, utilizing waste heatfrom a single GT, are shown in Table 5 for both part load and fullload operating conditions, and for minimumwaste heat utilizationtemperatures of either 110 �C or 200 �C.
The cooling capacity of the double-effect absorption cycle is notevaluated for a minimum waste heat utilization temperature of110 �C, as this cycle requires a minimum waste heat utilizationtemperature of 180 �C. For the cascaded double- and single-effectabsorption chiller configuration, it is assumed that the double-effect chiller utilizes the waste heat down to 180 �C, while thesingle-effect chiller utilizes the waste heat from 180 �C down to
t 45 �C ambient temperature, as a function of operating load and minimum exhaust
Turbine exhaust gastemperature [�C]
Turbine poweroutput [MW]
Available wasteheat [MW]
388 12.3 35.224.0
489 20.9 49.137.8
ded double- and single-effect absorption refrigeration cycles, for both part load and
] Cooling capacity [MW]
Single-effectabsorption cycle
Double-effectabsorption cycle
Cascaded double- andsingle-effectabsorption cycle
24.6 N/A 31.816.8 24.0 N/A34.4 N/A 45.726.5 37.8 N/A
s turbine operating conditions, respectively.
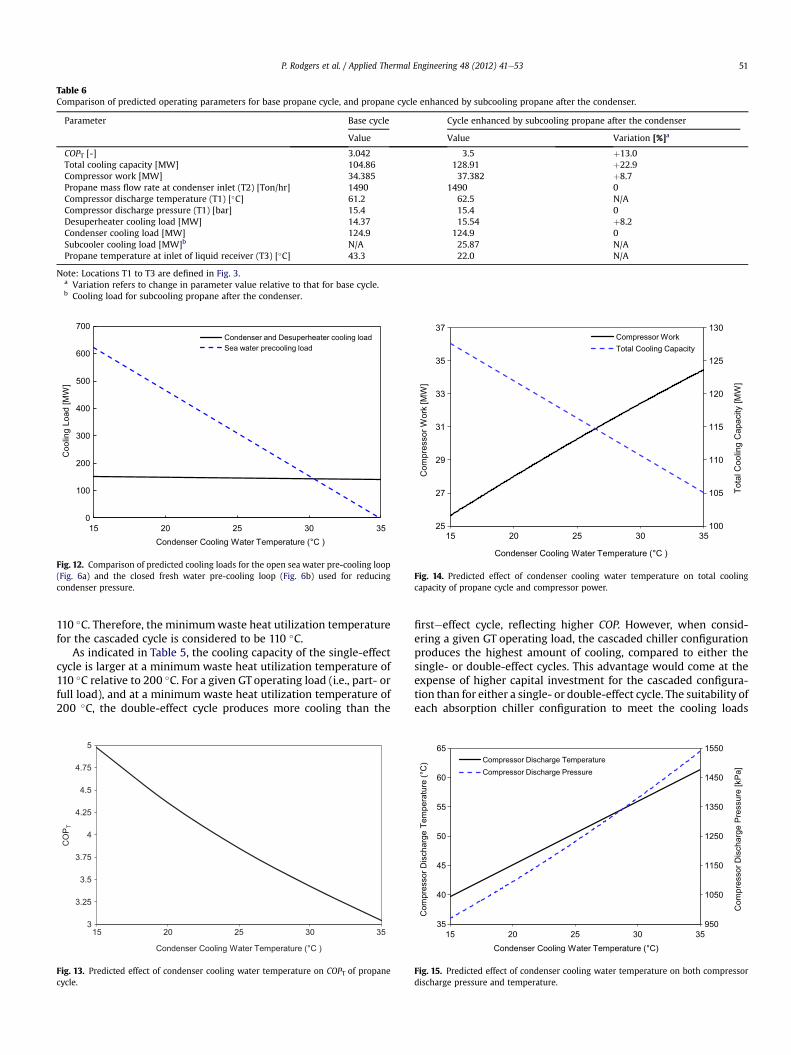
Table 6Comparison of predicted operating parameters for base propane cycle, and propane cycle enhanced by subcooling propane after the condenser.
Parameter Base cycle Cycle enhanced by subcooling propane after the condenser
Value Value Variation [%]a
COPT [-] 3.042 3.5 þ13.0Total cooling capacity [MW] 104.86 128.91 þ22.9Compressor work [MW] 34.385 37.382 þ8.7Propane mass flow rate at condenser inlet (T2) [Ton/hr] 1490 1490 0Compressor discharge temperature (T1) [�C] 61.2 62.5 N/ACompressor discharge pressure (T1) [bar] 15.4 15.4 0Desuperheater cooling load [MW] 14.37 15.54 þ8.2Condenser cooling load [MW] 124.9 124.9 0Subcooler cooling load [MW]b N/A 25.87 N/APropane temperature at inlet of liquid receiver (T3) [�C] 43.3 22.0 N/A
Note: Locations T1 to T3 are defined in Fig. 3.a Variation refers to change in parameter value relative to that for base cycle.b Cooling load for subcooling propane after the condenser.
0
100
200
300
400
500
600
700
15 20 25 30 35
Coo
ling
Load
[MW
]
Condenser Cooling Water Temperature (°C )
Condenser and Desuperheater cooling loadSea water precooling load
Fig. 12. Comparison of predicted cooling loads for the open sea water pre-cooling loop(Fig. 6a) and the closed fresh water pre-cooling loop (Fig. 6b) used for reducingcondenser pressure.
100
105
110
115
120
125
130
25
27
29
31
33
35
37
15 20 25 30 35
Tota
l Coo
ling
Cap
acity
[MW
]
Com
pres
sor W
ork
[MW
]
Condenser Cooling Water Temperature (°C )
Compressor WorkTotal Cooling Capacity
Fig. 14. Predicted effect of condenser cooling water temperature on total coolingcapacity of propane cycle and compressor power.
P. Rodgers et al. / Applied Thermal Engineering 48 (2012) 41e53 51
110 �C. Therefore, the minimumwaste heat utilization temperaturefor the cascaded cycle is considered to be 110 �C.
As indicated in Table 5, the cooling capacity of the single-effectcycle is larger at a minimum waste heat utilization temperature of110 �C relative to 200 �C. For a given GT operating load (i.e., part- orfull load), and at a minimum waste heat utilization temperature of200 �C, the double-effect cycle produces more cooling than the
3
3.25
3.5
3.75
4
4.25
4.5
4.75
5
15 20 25 30 35
CO
P T
Condenser Cooling Water Temperature (°C )
Fig. 13. Predicted effect of condenser cooling water temperature on COPT of propanecycle.
firsteeffect cycle, reflecting higher COP. However, when consid-ering a given GT operating load, the cascaded chiller configurationproduces the highest amount of cooling, compared to either thesingle- or double-effect cycles. This advantage would come at theexpense of higher capital investment for the cascaded configura-tion than for either a single- or double-effect cycle. The suitability ofeach absorption chiller configuration to meet the cooling loads
950
1050
1150
1250
1350
1450
1550
35
40
45
50
55
60
65
15 20 25 30 35
Com
pres
sor D
isch
arge
Pre
ssur
e [k
Pa]
Com
pres
sor D
isch
arge
Tem
pera
ture
(°C
)
Condenser Cooling Water Temperature (°C)
Compressor Discharge Temperature Compressor Discharge Pressure
Fig. 15. Predicted effect of condenser cooling water temperature on both compressordischarge pressure and temperature.
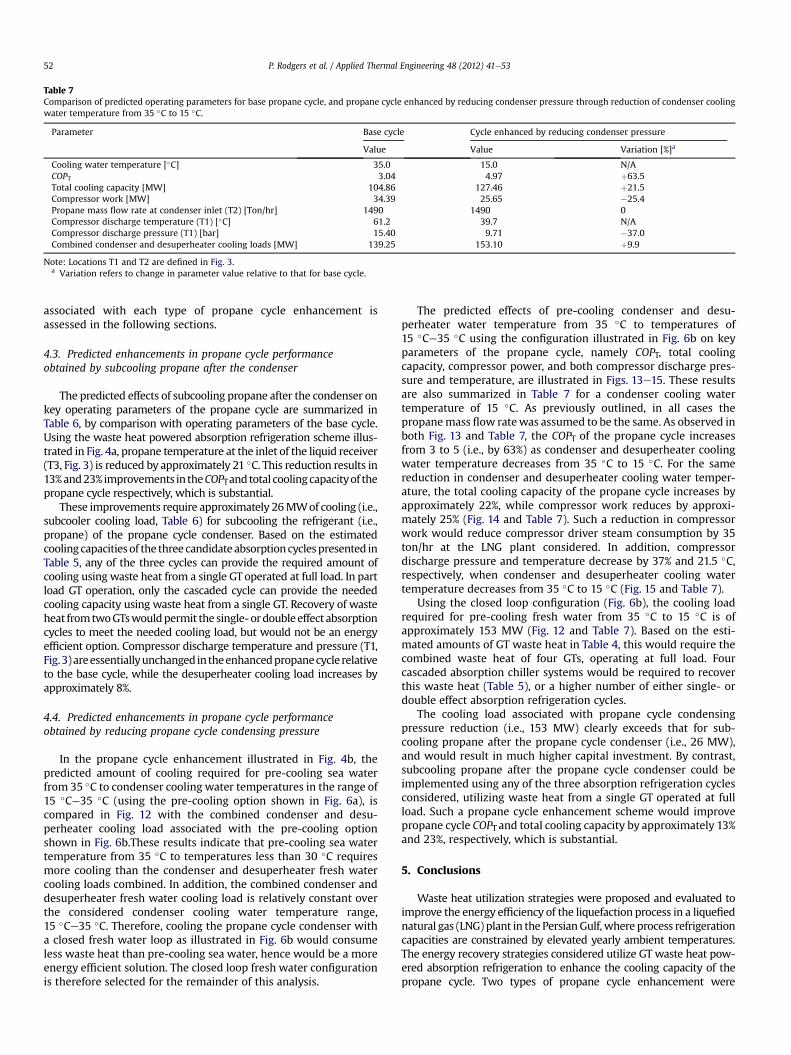
Table 7Comparison of predicted operating parameters for base propane cycle, and propane cycle enhanced by reducing condenser pressure through reduction of condenser coolingwater temperature from 35 �C to 15 �C.
Parameter Base cycle Cycle enhanced by reducing condenser pressure
Value Value Variation [%]a
Cooling water temperature [�C] 35.0 15.0 N/ACOPT 3.04 4.97 þ63.5Total cooling capacity [MW] 104.86 127.46 þ21.5Compressor work [MW] 34.39 25.65 �25.4Propane mass flow rate at condenser inlet (T2) [Ton/hr] 1490 1490 0Compressor discharge temperature (T1) [�C] 61.2 39.7 N/ACompressor discharge pressure (T1) [bar] 15.40 9.71 �37.0Combined condenser and desuperheater cooling loads [MW] 139.25 153.10 þ9.9
Note: Locations T1 and T2 are defined in Fig. 3.a Variation refers to change in parameter value relative to that for base cycle.
P. Rodgers et al. / Applied Thermal Engineering 48 (2012) 41e5352
associated with each type of propane cycle enhancement isassessed in the following sections.
4.3. Predicted enhancements in propane cycle performanceobtained by subcooling propane after the condenser
The predicted effects of subcooling propane after the condenser onkey operating parameters of the propane cycle are summarized inTable 6, by comparison with operating parameters of the base cycle.Using the waste heat powered absorption refrigeration scheme illus-trated in Fig. 4a, propane temperature at the inlet of the liquid receiver(T3, Fig. 3) is reduced by approximately 21 �C. This reduction results in13%and23% improvements in theCOPTandtotal coolingcapacityof thepropane cycle respectively, which is substantial.
These improvements require approximately 26MWof cooling (i.e.,subcooler cooling load, Table 6) for subcooling the refrigerant (i.e.,propane) of the propane cycle condenser. Based on the estimatedcooling capacitiesof the three candidate absorptioncyclespresented inTable 5, any of the three cycles can provide the required amount ofcooling using waste heat from a single GToperated at full load. In partload GT operation, only the cascaded cycle can provide the neededcooling capacity using waste heat from a single GT. Recovery of wasteheat fromtwoGTswouldpermit the single-ordoubleeffect absorptioncycles to meet the needed cooling load, but would not be an energyefficient option. Compressor discharge temperature and pressure (T1,Fig.3)areessentiallyunchangedintheenhancedpropanecycle relativeto the base cycle, while the desuperheater cooling load increases byapproximately 8%.
4.4. Predicted enhancements in propane cycle performanceobtained by reducing propane cycle condensing pressure
In the propane cycle enhancement illustrated in Fig. 4b, thepredicted amount of cooling required for pre-cooling sea waterfrom 35 �C to condenser cooling water temperatures in the range of15 �Ce35 �C (using the pre-cooling option shown in Fig. 6a), iscompared in Fig. 12 with the combined condenser and desu-perheater cooling load associated with the pre-cooling optionshown in Fig. 6b.These results indicate that pre-cooling sea watertemperature from 35 �C to temperatures less than 30 �C requiresmore cooling than the condenser and desuperheater fresh watercooling loads combined. In addition, the combined condenser anddesuperheater fresh water cooling load is relatively constant overthe considered condenser cooling water temperature range,15 �Ce35 �C. Therefore, cooling the propane cycle condenser witha closed fresh water loop as illustrated in Fig. 6b would consumeless waste heat than pre-cooling sea water, hence would be a moreenergy efficient solution. The closed loop fresh water configurationis therefore selected for the remainder of this analysis.
The predicted effects of pre-cooling condenser and desu-perheater water temperature from 35 �C to temperatures of15 �Ce35 �C using the configuration illustrated in Fig. 6b on keyparameters of the propane cycle, namely COPT, total coolingcapacity, compressor power, and both compressor discharge pres-sure and temperature, are illustrated in Figs. 13e15. These resultsare also summarized in Table 7 for a condenser cooling watertemperature of 15 �C. As previously outlined, in all cases thepropanemass flow ratewas assumed to be the same. As observed inboth Fig. 13 and Table 7, the COPT of the propane cycle increasesfrom 3 to 5 (i.e., by 63%) as condenser and desuperheater coolingwater temperature decreases from 35 �C to 15 �C. For the samereduction in condenser and desuperheater cooling water temper-ature, the total cooling capacity of the propane cycle increases byapproximately 22%, while compressor work reduces by approxi-mately 25% (Fig. 14 and Table 7). Such a reduction in compressorwork would reduce compressor driver steam consumption by 35ton/hr at the LNG plant considered. In addition, compressordischarge pressure and temperature decrease by 37% and 21.5 �C,respectively, when condenser and desuperheater cooling watertemperature decreases from 35 �C to 15 �C (Fig. 15 and Table 7).
Using the closed loop configuration (Fig. 6b), the cooling loadrequired for pre-cooling fresh water from 35 �C to 15 �C is ofapproximately 153 MW (Fig. 12 and Table 7). Based on the esti-mated amounts of GT waste heat in Table 4, this would require thecombined waste heat of four GTs, operating at full load. Fourcascaded absorption chiller systems would be required to recoverthis waste heat (Table 5), or a higher number of either single- ordouble effect absorption refrigeration cycles.
The cooling load associated with propane cycle condensingpressure reduction (i.e., 153 MW) clearly exceeds that for sub-cooling propane after the propane cycle condenser (i.e., 26 MW),and would result in much higher capital investment. By contrast,subcooling propane after the propane cycle condenser could beimplemented using any of the three absorption refrigeration cyclesconsidered, utilizing waste heat from a single GT operated at fullload. Such a propane cycle enhancement scheme would improvepropane cycle COPT and total cooling capacity by approximately 13%and 23%, respectively, which is substantial.
5. Conclusions
Waste heat utilization strategies were proposed and evaluated toimprove the energy efficiency of the liquefaction process in a liquefiednatural gas (LNG) plant in the PersianGulf, where process refrigerationcapacities are constrained by elevated yearly ambient temperatures.The energy recovery strategies considered utilize GT waste heat pow-ered absorption refrigeration to enhance the cooling capacity of thepropane cycle. Two types of propane cycle enhancement were
P. Rodgers et al. / Applied Thermal Engineering 48 (2012) 41e53 53
investigated, namely i) subcooling the propane cooling cycle after thecondenser, and ii) reducing thepropane cycle condensingpressure. Forthe latter option, both an open sea water and a closed fresh watercooling loops were considered. For all configurations, the coolingcapacities of single-, double-effect and cascaded double- and single-effect absorption refrigeration cycles were compared as a function ofgas turbine load and minimumwaste heat utilization temperature.
Subcooling propane after the condenser by approximately 21 �Crelative to the base cycle was found to enhance the propane cycleCOPT and total cooling capacity by 13% and 23%, respectively. Thenecessary cooling load could be provided by either a single-effect,double-effect or cascaded and single- and double-effect absorp-tion refrigeration cycle recovering waste heat from a single gasturbine operated at full load. In part load GT operation, only thecascaded cycle would provide the needed cooling capacity, unlesswaste heat from two gas turbines was provided.
Reducing propane cycle condensing pressure by reducingcondenser cooling water temperature from 35 �C to 15 �C, resultedin enhancements in propane cycle COPT and total cooling capacityof 63% and 22%, respectively. However, the cooling load requiredusing a closed fresh water loop was found to be almost six timeshigher than for subcooling propane after the condenser. Sucha cooling load would require the combined waste from at least fourgas turbines operating at full load. The cooling load associated withan open sea water pre-cooling loop was found to be even higherthan for subcooling propane after the condenser.
Since subcooling propane after the propane cycle condenserrequires less cooling and thus waste heat than reducing propanecycle condensing pressure, the former would therefore be a finan-cially more attractive option to implement. Considering the gasindustry’s present trend for short process enhancement paybackperiods, this study therefore suggests that subcooling propane afterthe propane cycle condenser may be the preferred option to boostpropane cycle performance, with substantial improvementsobtained in total cycle cooling capacity.
Acknowledgements
The work presented is this paper was undertaken at andfinancially funded by The Petroleum Institute, Abu Dhabi, UAE.
References
[1] P. Bosma, R. K. Nagelvoort, Liquefaction Technology; Developments throughHistory, Proceedings of the First Annual Gas Processing Symposium,ProcEedings of the first annual gas processing Symposium, January, 10-12,2009, Doha, Qatar, pp. 1e13.
[2] A. Finn, G. Johnson, T. Tomlinson, Developments in natural gas liquefaction,Hydrocarbon Processing 78 (April 1999) 47.
[3] C. Spilsbury, Y. Liu, J. Petrowski, W. Kennington, Evolution of LiquefactionTechnology for Today’s LNG business, 7� Journees Scientifiques et Techniques(November 2006) (Oran, Algeria).
[4] J. Kampf, M. Sadrinasab, The circulation of the Persian Gulf: a numerical study,Ocean Science 2 (2006) 27e41 last accessed September 2011, http://www.ocean-sci.net/2/27/2006.
[5] S. Vaidyaraman, C.D. Maranas, Synthesis of mixed refrigerant cascade cycles,Chemical Engineering Communications 189 (2002) 1057e1078.
[6] G.C. Lee, R. Smith, X.X. Zhu, Optimal synthesis of mixed refrigerant systems forlow temperature processes, Industrial and Engineering Chemistry Research 41(2002) 5016e5028.
[7] H. Paradowski, M. Bamba, C. Bladanet, Propane Precooling Cycles for IncreasedLNG Train Capacity, in: Proceedings of the 14th International Conference andExhibition on Liquefied Natural Gas (2004), pp. 107e124.
[8] F. Del Nogal, J. Kim, S. Perry, R. Smith, Optimal design of mixed-refrigerantcycles, Industrial and Engineering Chemistry Research 47 (22) (2008)8724e8740.
[9] A. Alabdulkarem, A. Mortazavi, Y. Hwang, R. Radermacher, P. Rodgers, Opti-mization of propane pre-cooled mixed refrigerant LNG plant, Applied ThermalEngineering 31 (2011) 1091e1098.
[10] R.N. DiNapoli, Gas turbine prove effective as drivers for LNG plants, Oil andGas Journal 78 (31) (1980) 47e52.
[11] L.L. Johnson, G. Renaudin, and S. Oronzo. Improvement of Natural GasLiquefaction Processes by Using Liquid Turbines. Proceedings of the EleventhInternational Conference on Liquefied Natural Gas, Birmingham, UK, July 3-6,1995.
[12] M. Kano�glu, Cryogenic turbine efficiencies, Exergy International Journal 1 (3)(2001) 202e208.
[13] A. Mortazavi, C. Somers, Y. Hwang, R. Radermacher, S. Al-Hashimi, P. Rodgers,Performance Enhancement of Propane Precooled Mixed Refrigerant LNG Plant(November, 2008) Energy 2030 conference, Abu Dhabi, UAE.
[14] B. Brant, New waste-heat refrigeration unit cuts flaring, reduces pollution, Oiland Gas Journal 96 (20) (1998) 61e65.
[15] G. Kowalski, Improving turbine performance by cooling inlet air using a wasteheat powered ejector refrigerator, Proceedings of the ASME Advanced EnergySystems Division 36 (1996) 501e508.
[16] T.H. Kuehn, J.W. Ramsey, J. Threlkeld, Thermal Environmental Engineering,Prentice Hall, NJ, USA, 1998.
[17] C. Somers, A. Mortazavi, Y. Hwang, R. Radermacher, P. Rodgers, and S. Al-Hashimi, “Modeling Water/Lithium bromide absorption chillers in AspenPlus, ” Applied Energy, Vol. 88, No. 7, pp. 4197e4205.
[18] P. Kalinowski, Y. Hwang, R. Radermacher, S. Al Hashimi, P. Rodgers, Appli-cation of waste heat powered absorption refrigeration system to the LNGrecovery process, International Journal of Refrigeration 32 (4) (2009)687e694.
[19] A. Mortazavi, C. Somers, A. Alabdulkarem, Y. Hwang, R. Radermacher,Enhancement of APCI cycle efficiency with absorption chillers, Energy 35 (9)(September 2010) 3877e3882.
[20] Y. Hwang, Potential energy benefits of integrated refrigeration system withmicroturbine and absorption chiller, International Journal of Refrigeration 27(8) (2004) 816e829.
[21] P. Srikhirin, S. Aphornratana, S. Chungpaibulpatana, A review of absorptionrefrigeration technologies, Renewable and Sustainable Energy Reviews 5 (4)(2001) 343e372.
[22] K. Herold, R. Radermacher, S.A. Klein, Absorption Chillers and Heat Pumps,CRC Press, Boca Raton, FL, 1996.
[23] M.D. Islam, I. Kubo, M. Ohadi, A.A. Alili, Measurement of solar energy radiationin Abu Dhabi, UAE, Applied Energy 86 (2009) 511e515.
[24] Aspen Plus, Version 2006, Aspen Technology Inc, Wheeler Road Burlington,MA, USA, 2006.
[25] J.F. Boston, P.M. Mathias, Phase equilibria in a third-generation processsimulator, in: Proceedings of the 2nd International Conference on PhaseEquilibria and Fluid Properties in the Chemical Process Industries, West Ber-lin, Germany (March 17-21, 1980), pp. 823e849.