Embed Size (px)
Citation preview
APPLICATION FOR ENVIRONMENTAL CLEARANCE
PRE-FEASIBILITY REPORT
For
ENHANCEMENT OF CAMPHOR AND ITSDERIVATIVES PRODUCTION & INCREASE
IN TOTAL LAND AREA
By
M/s KANCHI KARPOORAM LIMITED
At
Sy.No. 669, 672, 670/2, 676/1 &674/1,667/1,668/1,668/2A,667/2,668/2,667/2A, 668/2A&670/1
VILLAGE: ENADURTEHSIL: KANCHEEPURAM
DISTRICT: KANCHEEPURAMSTATE: TAMILNADU
EIA Consultant:HUBERT ENVIRO CARE SYSTEMS (P) LTD, CHENNAI
(NABET Accredited vide Certificate No. NABET/EIA/1619/RA0083)
April 2019
Page 2 of 71
Table of Contents
1 EXECUTIVE SUMMARY ............................................................................................... 8
1.1 Project Summary.....................................................................................................................9
1.3 Project Chronology: ..............................................................................................................11
2 INTRODUCTION OF THE PROJECT ............................................................................. 16
2.1 Identification of the Project and Project Proponent ............................................................16
2.2 Brief Description of Nature of the Project ............................................................................16
2.3 Need for the Project and its importance ..............................................................................17
2.4 Demand-Supply Gap .............................................................................................................17
2.5 Import Possibility ..................................................................................................................17
2.6 Domestic/Export Markets.....................................................................................................18
2.7 Employment Generation.......................................................................................................18
3 PROJECT DISCRIPTION ............................................................................................. 19
3.1 Project Location ....................................................................................................................19
3.2 Details of Alternate sites considered ....................................................................................24
3.3 Magnitude of Operation .......................................................................................................31
3.4 Process Description...............................................................................................................32
3.5 Raw Materials Requirement .................................................................................................33
3.6 Storage Facility for Raw Materials and Products ..................................................................34
3.7 Mode of Transportation........................................................................................................34
3.8 Resource optimization ..........................................................................................................34
3.9 Recycling /Reuse of Solvents ................................................................................................34
3.10 Power Requirements ............................................................................................................35
3.11 Fuel Requirements ................................................................................................................35
3.12 Manpower.............................................................................................................................35
3.13 Water Requirement ..............................................................................................................36
3.13.1 Existing Water Requirement: ........................................................................................36
3.13.2 Water requirement for Proposed Expansion................................................................38
3.14 Liquid waste management....................................................................................................39
3.14.1 Industrial Effluent Treatment: ......................................................................................39
3.14.2 Existing: .........................................................................................................................40
3.14.3 Proposed: ......................................................................................................................40
3.14.4 Domestic Wastewater Treatment.................................................................................42
3.14.5 Process Discription of Package Sewage Treatment Plant: ............................................43
Page 3 of 71
3.15 Air Pollution Control Measures.............................................................................................44
3.16 Waste Management and Disposal Method ..........................................................................45
3.16.1 Municipal Solid Waste Management............................................................................45
3.16.1.1 Construction Phase ...............................................................................................45
3.16.1.2 Operation Phase....................................................................................................45
3.16.2 Hazardous Waste Management ...................................................................................45
4 SITE ANALYSIS ......................................................................................................... 47
4.1 Connectivity ..........................................................................................................................47
4.2 Land Form, Land use & Land ownership...............................................................................47
4.3 Topography of the District ....................................................................................................48
4.3.1 Geomorphology of PIA District .....................................................................................50
4.4 Existing Land use Pattern......................................................................................................50
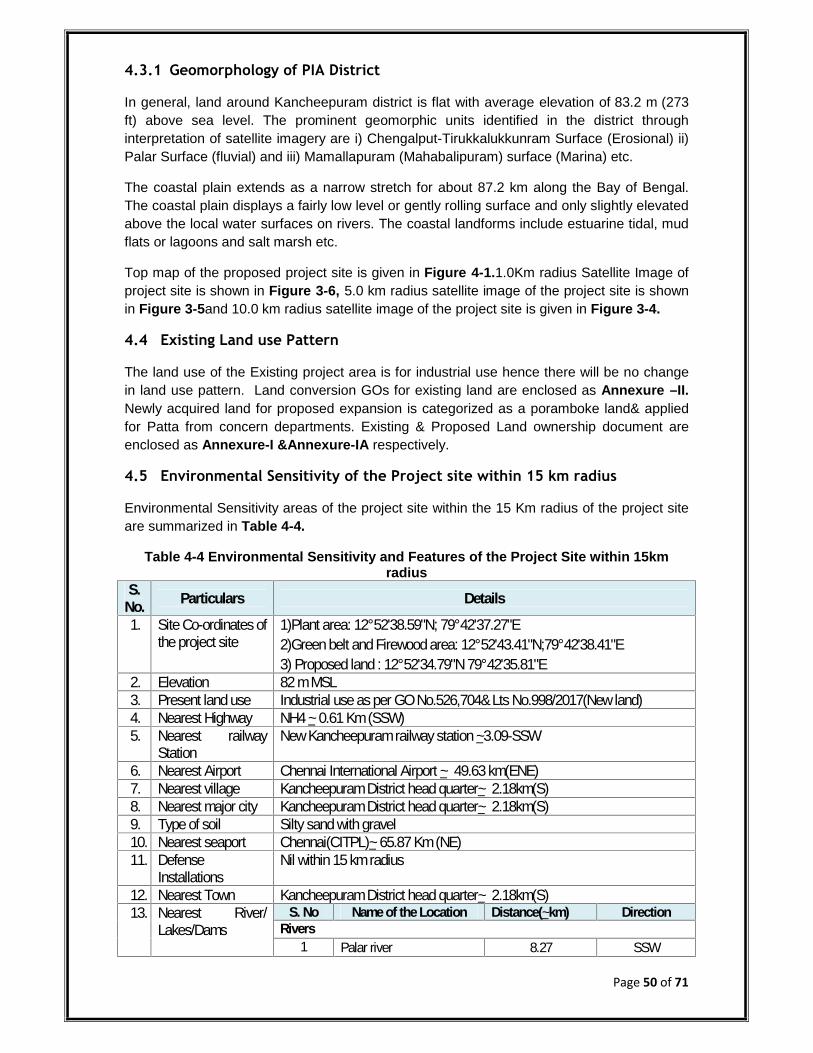
4.5 Environmental Sensitivity of the Project site within 15 km radius .......................................50
4.6 Land use pattern of the Study Area ......................................................................................54
4.7 Existing infrastructure...........................................................................................................56
4.7.1 Land...............................................................................................................................56
4.7.2 Buildings........................................................................................................................56
4.7.3 Plant Machinery & Utilities ...........................................................................................57
4.7.4 Fire &Safety System ......................................................................................................58
4.7.5 Rain water harvestingand ground water recharging ....................................................58
4.8 Soil Classification...................................................................................................................59
4.9 Climatic data from Secondary sources .................................................................................59
4.10 Social Infrastructure available ..............................................................................................59
5 PLANNING BRIEF...................................................................................................... 63
5.1 Planning concept...................................................................................................................63
5.2 Transportation ......................................................................................................................64
5.3 Population Projection ...........................................................................................................64
5.4 Land use Planning & Break up ..............................................................................................64
5.5 Assessment of Infrastructure Demand .................................................................................64
5.6 Amenities/Facilities...............................................................................................................64
6 PROPOSED INFRASTRUCTURE .................................................................................. 65
6.1 Industrial Area.......................................................................................................................65
6.2 Residential Area ....................................................................................................................65
6.3 Green belt .............................................................................................................................65
6.4 Social Infrastructure..............................................................................................................65
Page 4 of 71
6.5 Connectivity ..........................................................................................................................66
6.6 Drinking Water Management ...............................................................................................66
6.7 Sewerage system ..................................................................................................................66
6.8 Industrial Waste& Emissions management: .........................................................................66
6.9 Municipal Solid Waste Management....................................................................................67
6.10 Power Requirements and Supply/ Source ............................................................................67
7 REHABILITATION AND RESETTLEMENT (R &R) PLAN ................................................. 68
7.1 Policy to be adopted (Central/ State) ...................................................................................68
8 PROJECT SCHEDULE AND COST ESTIMATE ................................................................ 69
8.1 Likely date of start of construction and likely date of completion .......................................69
8.2 Project Schedule and Cost Estimate .....................................................................................69
8.3 Cost Estimate for Environment Management Plan (EMP)....................................................69
9 ANALYSIS OF PROPOSAL .......................................................................................... 70
9.1 Financial and social benefits .................................................................................................70
9.2 Social Benefit: .......................................................................................................................70
9.3 CSR benefit to local community:...........................................................................................70
9.4 Benefits to the environment:................................................................................................70
10 CONCLUSION ........................................................................................................... 71
Page 5 of 71
Table of Contents
Table 1-1Project Summary......................................................................................................................9Table 2-1Man power of the project......................................................................................................18Table 3-1List of Industries within 15km radius of the Project Site .......................................................24Table 3-2 Environmental Sensitivity and Features of the Project Site within 15km radius..................24Table 3-3Product details of the Project for Existing and after Expansion ............................................31Table 3-4List of raw material for Existing & Expansion ........................................................................33Table 3-5 Details of Storage Facilities ...................................................................................................34Table 3-6Solvent Storage ......................................................................................................................34Table 3-7Power requirement details (Existing and after Expansion) ...................................................35Table 3-8Fuel Requirement Details (Existing &Proposed Expansion) ..................................................35Table 3-9Man power of the project......................................................................................................35Table 3-10 Existing water Requirement................................................................................................36Table 3-11 Water requirement and breakup for proposed expansion ................................................38Table 3-12Details of Sewage/Wastewater Treatment and Disposal ....................................................40Table 3-13 Domestic Wastewater Generation and Management........................................................42Table 3-14 Package STP Inlet&outlet characteristics of domestic wastewater....................................42Table 3-15Air Pollution Control Measures (Existing and Proposed Expansion) ...................................44Table 3-16Fugitive & Noise Emission....................................................................................................44Table 3-17Solid Waste Generation and Management (Existing &Proposed Expansion) .....................45Table 3-18Hazardous Waste Generation and Management ................................................................46Table 4-1Connectivity of the project site..............................................................................................47Table 4-2Geographical Locations of the Existing Project Site...............................................................47Table 4-3Land use/ Break up details.....................................................................................................48Table 4-4 Environmental Sensitivity and Features of the Project Site within 15km radius..................50Table 4-5Land Use/Land Cover statistics of 10 km radius of the Study Area .......................................54Table 4-6Land use/ Break up Details ....................................................................................................56Table 4-7List of Machinery & Equipments............................................................................................57Table 4-8Process-Resource Conservation Systems for Proposed Expansion .......................................57Table 4-9 Fire &Safety Systems for Existing and Proposed ..................................................................58Table 4-10 Meteorological Observations (Annual) ...............................................................................59Table 4-11Religious Places ....................................................................................................................59Table 4-12Schools and Colleges............................................................................................................60Table 4-13Common Places....................................................................................................................61Table 4-14List of Hospitals ....................................................................................................................61Table 4-15List of Industries within 15km radius of the Project Site .....................................................62Table5-1Existing & Proposed Production Details .................................................................................63Table 5-2Manpower Details (Existing and Proposed)...........................................................................64Table 6-1 Connectivity of the project site.............................................................................................66Table 6-2 Solid Waste Generation and Management (Existing &Proposed Expansion).......................67Table 6-3 Power requirement details (Existing and after Proposed Expansion) ..................................67Table 8-1 Capital Investment for proposed expansion Project ............................................................69Table 8-2 EMP of the existing and proposed ........................................................................................69
Page 6 of 71
List of Figures
Figure 3-1Project Location Index map ..................................................................................................20Figure 3-2Satellite Imagery of the Project Site .....................................................................................20Figure 3-3 Photo graphs of the TamaraiTangal lake and Canal Passing between Plant area boundaryand Green belt boundary......................................................................................................................21Figure 3-4Satellite Imagery (10 km radius) of the project site .............................................................21Figure 3-5 Satellite Imagery (5.0 km radius) of the project site ...........................................................22Figure 3-6Satellite imagery (1.0 km radius) of the project site ............................................................22Figure 3-7Environmental Sensitive areas within 15 Km of the Project Site .........................................23Figure 3-8 Industries demarcated on Google imagery within 15 Km of the Project Site .....................23Figure 3-9 Existing Project Site Layout..................................................................................................29Figure 3-10 Existing and Proposed Project Site Layout ........................................................................30Figure 3-11 Photographs of the factory...............................................................................................31Figure 3-12 Manufacturing Process Flow Chart....................................................................................32Figure 3-13 Water balance chart for the Existing facility.....................................................................37Figure 3-14 Water balance chart for the proposed expansion.............................................................39Figure 3-15Process flow diagram of Effluent Treatment Plant ............................................................41Figure 3-16Sectional View of Package Sewage Treatment Plant..........................................................43Figure 3-17Process explanation of Package STP...................................................................................43Figure 4-1Topo Map of the study area .................................................................................................49Figure 4-2 Land use Land Pattern of the Project Study Area................................................................54Figure 4-3 Land use Land Cover map of the study area .......................................................................55Figure 4-4 Existing Fire Hydrant System ...............................................................................................58Figure 6-1 Green belt photographs of the project................................................................................65

Page 7 of 71
LIST OF ANNEXURE
S. No Annexure Name of the Annexure Page Nos1 I Existing Land ownership documents 12 IA Proposed Land ownership documents 413 II Land Conversion GOs 1444 III First Consent Orders(1992) 1525 IV First Expansion Consent Orders (1997) 1726 V Second Expansion Consent Orders (2007) 1977 VI Product MSDS 2208 VII Raw Materials MSDS 2669 VIII Existing Water Balance 357
10 IX Proposed Water Balance 35811 X TNEB Agreement 35912 XI Hazardous Waste Disposal Agreement from TSDF 36513 XII Existing Project Site Layout 42914 XIIA Existing & Proposed Project Site Layout 43015 XIII Topo map of the Project Site 43116 XIV Soil Investigation Report 43217 XV Manufacturing Process flow chart 45818 XVI Photographs of the Canal 45919 XVII Existing Consent Orders (valid up to 2019) 46020 XVIII Environmental Test Reports 46721 XIX Existing Wastewater test reports from TNPCB 47022 XX Ground Water NOC from GCW 47623 XXI PESO Explosive License 49324 XXII Fee receipt indicates that payment has been made in 2005 49525 XXIII Certification of incorporation 49826 XXIV Approval from Factories department 49927 XXV Withdrawn EC application 50128 XXVI Proposed STP Layout 51229 XXVII Existing ETP Layout 52030 XXVIII Existing OHS Policy 52131 XXIX Existing Environment Policy 52232 XXX Existing employee Health Test Reports 523Note: Annexure are given as Separate Book

Page 8 of 71
1 EXECUTIVE SUMMARY
Kanchi Karpooram Limited (KKL) a Public Limited Company is engaged in the manufactureof Camphor and Derivative Products, is located at Sy.No.669,672,670/2,676/1,674/1,667/1,668/1,668/2A, 667/2,668/2,667/2A, 668/2A&670/1. KKL is in this arena for morethan two decades with a proven track record for quality, competitive price and timely supplyof its products. The main product is Camphor which has been well accepted in the market.Besides Camphor and its Derivatives, KKL’s other products such as Gum rosin and RosinDerivatives also enjoy an enviable share in the market including Corporate Clientele.
KanchiKarpooram Limited was incorporated on 31st January 1992 as Public LimitedCompany under the Companies Act, 1956 and received the certificate of commencement ofbusiness on 27th February 1992.
Consent orders (Air &Water for camphor production capacity is 75.0 Tone/Month) obtainedfrom vide Order No.6362, proceedings letterNo. T1/CPM(S)/A/F-2185/18490/92-1, dated;09.06.1992 &order No. 9026 proceedings No. T1/CPM(S)/W/F-2185/20430/92-1, dated;09.06.1992 with Camphor production capacity is 75.0 T/Month, consent orders enclosed asAnnexure-III.
1stExpansion (Camphor production: 15.66 MT/Month) consent orders obtained from TNPCBfor water and Air vide Order No.9026, proceedings No. R2/TNPCB/F.2185/KPM/W/97 dated;19.09.1997 & Order No.6362, proceedings No. R2/TNPCB/F-2185/KPM/A/97 dated;19.09.1997 consent orders of 1st expansion is enclosed as Annexure-IV.
2nd Expansion for amplification of Camphor production from 15.66 MT/Month to 110.0MT/Month applied on 01.08.2005, consent orders obtained from TNPCB for Air and Watervide Order No.17158, proceedings No. T11/TNPCB/CHEM/F28572/RL/KPM/07/A dated;08.10.2007&Order No.21121, proceedings No. T11/TNPCB/CHEM/F28572/RL/KPM/07/Wdated; 08.10.2007 consent orders of 2ndexpansion are enclosed as Annexure-V.
Now, the proponent proposed expansion for amplification of Camphor production from 110MT/Month to 550 MT/Month.
KKL’s (ISO 9001:2008 Certified Company) unit is situated near (~2.18Km-S) Kancheepuramjust 70 Km from Chennai, on Chennai – Bangalore highway, thus geographically wellconnected. KKL’s turnover is around 600Million INR and well planned to augment the salesin a phased manner in the years to come.
KKL has a manufacturing unit in the outskirts of Kancheepuram Town with adequate modernequipments and machinery for manufacturing of Camphor and Gum Rosins. KKL has a HighProfile technical team to carry out manufacturing activities with quality and quantity products.
KKL has adequate quality control measures manned by qualified and experienced personnelfor online process and other quality control checks for incoming raw materials and finishedgoods. Quality control tests are being carried out meticulously. KanchiKarpooram Limitedlaboratory is fully equipped with the latest equipments.
KKL has been certified with ISO: 9001:2008 by the certified body of TUVSud South AsiaPrivate Limited. KKL enjoys the patronage of various clients including corporate for itsvarious products.
Page 9 of 71
KKL are South India’s first and largest producer of a variety of Terpene and Paperchemicals. Our Products range from Turpentine-based chemicals like Camphor, Dipentine,IsoBornyl Acetate, Sodium Acetate Trihydrate etc. To Gum rosin and its derivates such asfortified Rosin, Ester Gum, Phenolic / Maleic Resins and many others. We are keen todevelop and expand our customer base to provide industries with a stable, continuoussupply of raw materials from a totally new source. We are committed to product qualityassurance so as to be the innovative and reliable supplier you need.
Main product namely Camphor finds usage in religious purposes and minuscule quantity inPharma and Fragrance industries.
By products like Dipentene, Pine Tar and Sodium acetate trihydrate find usage in Paints,Tyre and Textile Industry. Due to industrial growth in the above sector, the requirement ofproduct/ by-product demand reach considerable high level which results in expansion of thisunit only by additional of vessels/equipments with higher capacity by replacing the old lowcapacity equipment without increasing pollution load.
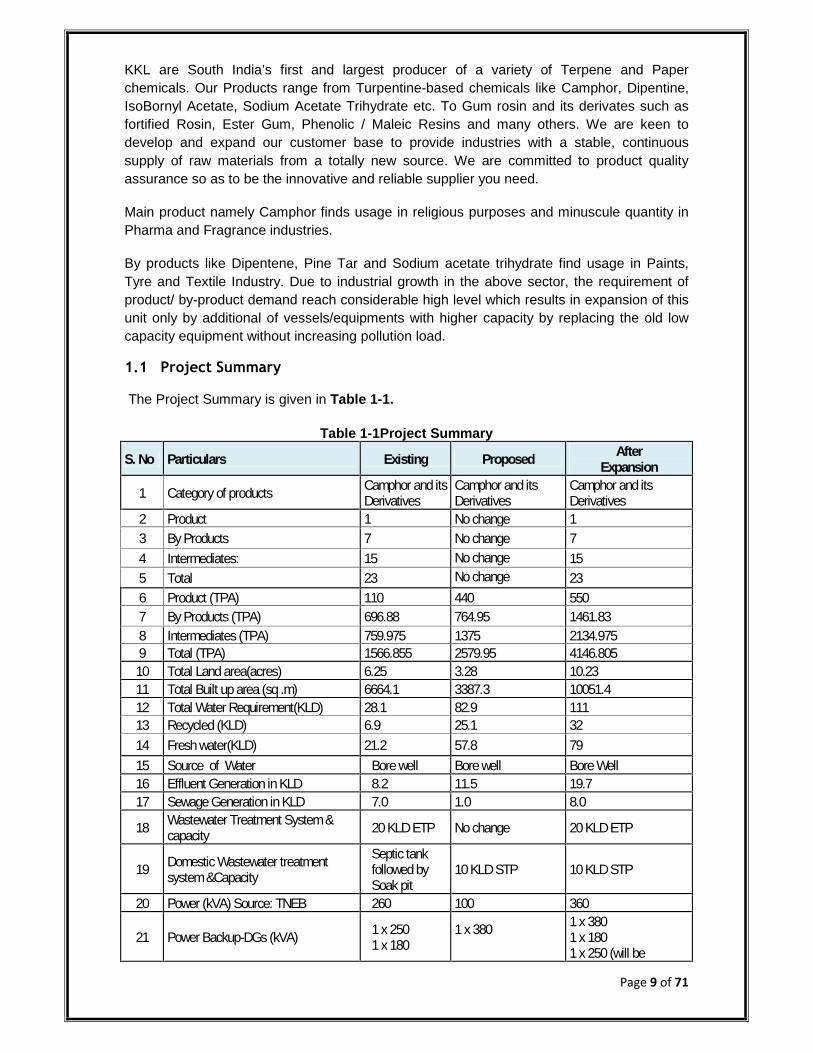
1.1 Project Summary
The Project Summary is given in Table 1-1.
Table 1-1Project Summary
S. No Particulars Existing Proposed AfterExpansion
1 Category of products Camphor and itsDerivatives
Camphor and itsDerivatives
Camphor and itsDerivatives
2 Product 1 No change 13 By Products 7 No change 74 Intermediates: 15 No change 155 Total 23 No change 236 Product (TPA) 110 440 5507 By Products (TPA) 696.88 764.95 1461.838 Intermediates (TPA) 759.975 1375 2134.9759 Total (TPA) 1566.855 2579.95 4146.805
10 Total Land area(acres) 6.25 3.28 10.2311 Total Built up area (sq .m) 6664.1 3387.3 10051.412 Total Water Requirement(KLD) 28.1 82.9 11113 Recycled (KLD) 6.9 25.1 3214 Fresh water(KLD) 21.2 57.8 7915 Source of Water Bore well Bore well Bore Well16 Effluent Generation in KLD 8.2 11.5 19.717 Sewage Generation in KLD 7.0 1.0 8.0
18 Wastewater Treatment System &capacity 20 KLD ETP No change 20 KLD ETP
19 Domestic Wastewater treatmentsystem &Capacity
Septic tankfollowed bySoak pit
10 KLD STP 10 KLD STP
20 Power (kVA) Source: TNEB 260 100 360
21 Power Backup-DGs (kVA) 1 x 2501 x 180
1 x 380 1 x 3801 x 1801 x 250 (will be
Page 10 of 71
removed duringexpansion)
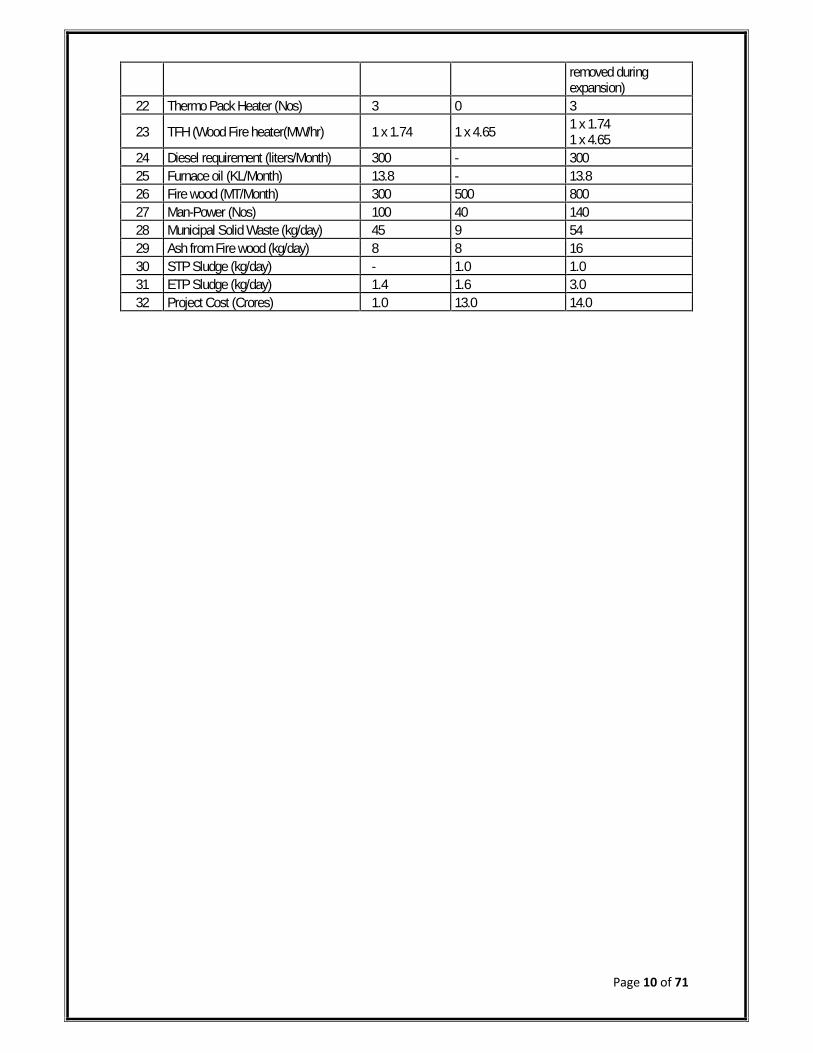
22 Thermo Pack Heater (Nos) 3 0 3
23 TFH (Wood Fire heater(MW/hr) 1 x 1.74 1 x 4.65 1 x 1.741 x 4.65
24 Diesel requirement (liters/Month) 300 - 30025 Furnace oil (KL/Month) 13.8 - 13.826 Fire wood (MT/Month) 300 500 80027 Man-Power (Nos) 100 40 14028 Municipal Solid Waste (kg/day) 45 9 5429 Ash from Fire wood (kg/day) 8 8 1630 STP Sludge (kg/day) - 1.0 1.031 ETP Sludge (kg/day) 1.4 1.6 3.032 Project Cost (Crores) 1.0 13.0 14.0
Page 11 of 71
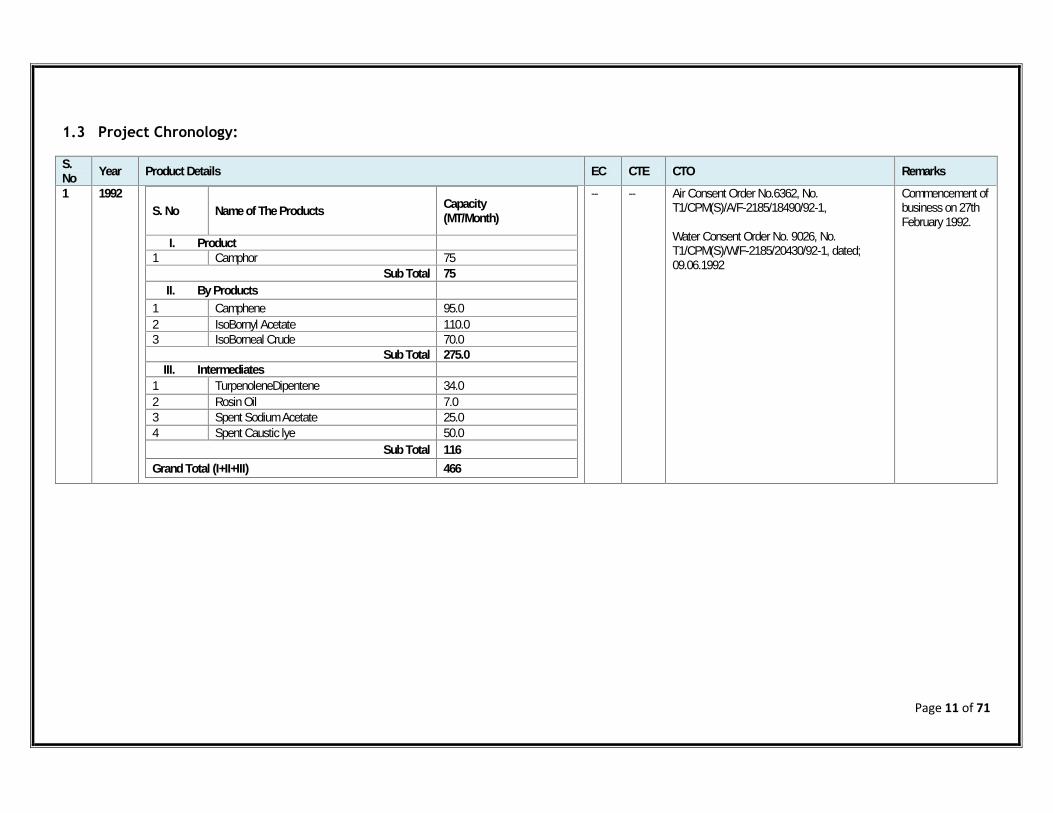
1.3 Project Chronology:
S.No Year Product Details EC CTE CTO Remarks
1 1992S. No Name of The Products Capacity
(MT/Month)
I. Product1 Camphor 75
Sub Total 75II. By Products
1 Camphene 95.02 IsoBornyl Acetate 110.03 IsoBorneal Crude 70.0
Sub Total 275.0III. Intermediates
1 TurpenoleneDipentene 34.02 Rosin Oil 7.03 Spent Sodium Acetate 25.04 Spent Caustic lye 50.0
Sub Total 116Grand Total (I+II+III) 466
-- -- Air Consent Order No.6362, No.T1/CPM(S)/A/F-2185/18490/92-1,
Water Consent Order No. 9026, No.T1/CPM(S)/W/F-2185/20430/92-1, dated;09.06.1992
Commencement ofbusiness on 27thFebruary 1992.
Page 12 of 71
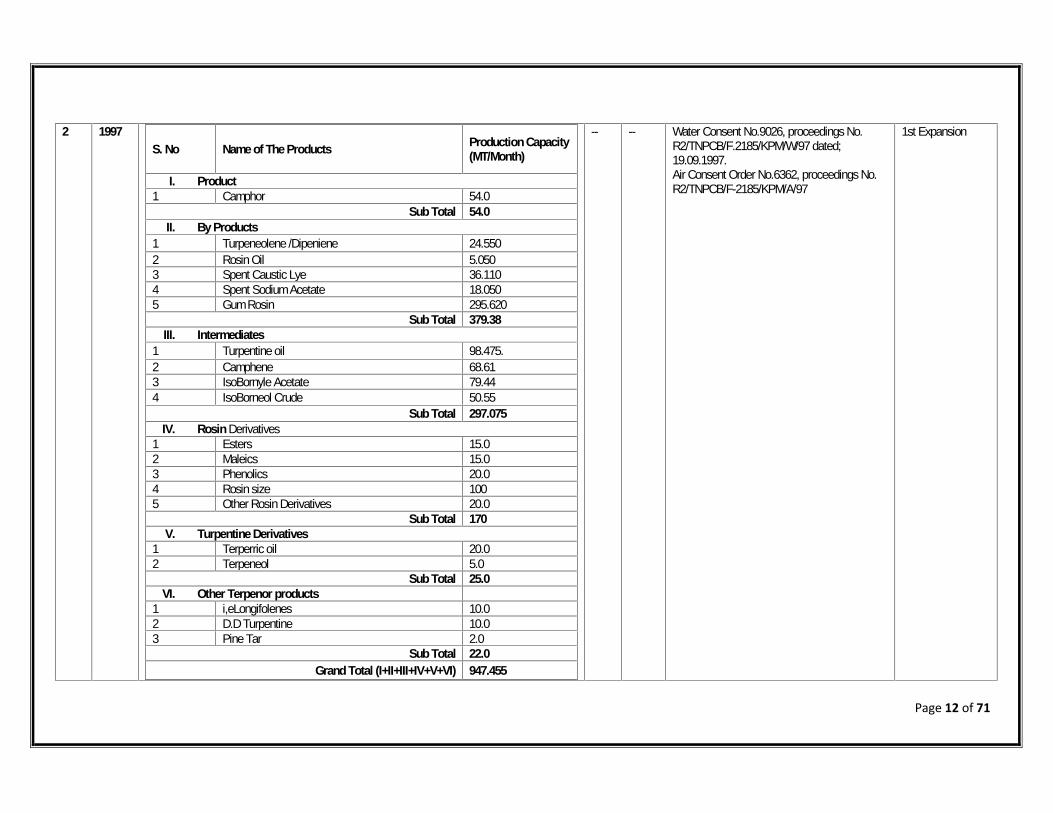
2 1997S. No Name of The Products Production Capacity
(MT/Month)
I. Product1 Camphor 54.0
Sub Total 54.0II. By Products
1 Turpeneolene /Dipeniene 24.5502 Rosin Oil 5.0503 Spent Caustic Lye 36.1104 Spent Sodium Acetate 18.0505 Gum Rosin 295.620
Sub Total 379.38III. Intermediates
1 Turpentine oil 98.475.2 Camphene 68.613 IsoBornyle Acetate 79.444 IsoBorneol Crude 50.55
Sub Total 297.075IV. Rosin Derivatives
1 Esters 15.02 Maleics 15.03 Phenolics 20.04 Rosin size 1005 Other Rosin Derivatives 20.0
Sub Total 170V. Turpentine Derivatives
1 Terperric oil 20.02 Terpeneol 5.0
Sub Total 25.0VI. Other Terpenor products
1 i,eLongifolenes 10.02 D.D Turpentine 10.03 Pine Tar 2.0
Sub Total 22.0Grand Total (I+II+III+IV+V+VI) 947.455
-- -- Water Consent No.9026, proceedings No.R2/TNPCB/F.2185/KPM/W/97 dated;19.09.1997.Air Consent Order No.6362, proceedings No.R2/TNPCB/F-2185/KPM/A/97
1st Expansion

Page 13 of 71
3 2007S. No Units Existing Capacity
(MT/Month)
I. Product1 Camphor 110
Sub Total 110II. By Products
1 Terpeneolene /Dipentene 49.62 Rosin Oil 5.053 Spent Caustic lye 36.114 Sodium Acetate Tri Hydrate 115.5
5 Sodium Acetate as liquor/Alternate to Solid trihydrate) 193
6 Gum Rosin 295.627 Camphor Oil 2
Sub Total 696.88III. Intermediates
1 Turpentine oil(Turpentine KATEL) 98.4752 Camphene 1103 IsoBornyl Acetate 1704 Esters 155 Maleics 156 Phenolics 207 Rosin Size 1008 Other Rosin Derivatives 209 Terpenic Oil 2010 Pine Oil (Terpenol) 4011 Longifoluences 1012 Double Distilled Turpentine 1013 Pine Tar 1514 Pine Pitch 6.515 IsoBornyl Crude 110
Sub Total 759.975
-- -- Air Order No.17158, proceedings No. No.T11/TNPCB/CHEM/F28572/RL/KPM/07/Adated; 08.10.2007
Water Order No.21121, proceedings No. No.T11/TNPCB/CHEM/F28572/RL/KPM/07/Wdated; 08.10.2007
2nd Expansionapplied on01.08.2005
Consents receivedon 08.10.2007.
Fee receiptindicates thatpayment has beenmade in 2005 isenclosed asAnnexure-XXII

Page 14 of 71
Grand Total (I+II+III) 1566.855
4 2019S. No Units
ExistingCapacity
(MT/Month)
ProposedExpansion(MT/Month)
After Expansion(MT/Month)
I. Product1 Camphor 110 440 550
Sub Total 110 440 550II. By Products1 Terpeneolene/Dipentene 49.6 300 349.62 Rosin Oil 5.05 4.95 103 Spent Caustic lye 36.11 0 36.11
4 Sodium Acetate TriHydrate 115.5 460 575.5
5Sodium Acetate asliquor/Alternate to Solid trihydrate)
193 0 193
6 Gum Rosin 295.62 0 295.627 Camphor Oil 2 0 2
Sub Total 696.88 764.95 1461.83III. Intermediates
1 Turpentine oil(TurpentineKATEL) 98.475 - 98.475
2 Camphene 110 440 5503 Iso Bornyl Acetate 170 340 5104 Esters 15 0 155 Maleics 15 0 156 Phenolics 20 0 207 Rosin Size 100 0 1008 Other Rosin Derivatives 20 0 209 Terpenic Oil 20 0 2010 Pine Oil (Terpenol) 40 60 10011 Longifoluences 10 0 1012 Double Distilled Turpentine 10 20 3013 Pine Tar 15 45 60
-- -- Proposal for Enhancement ofCamphor(Karpooram) and its Derivatives
3rd Expansion

Page 15 of 71
14 Pine Pitch 6.5 30 36.515 Iso Bornyl Crude 110 440 550
Sub Total 759.975 1375 2134.975Grand Total (I+II+III) 1566.855 2579.95 4146.805
Page 16 of 71
2 INTRODUCTION OF THE PROJECT
2.1 Identification of the Project and Project Proponent
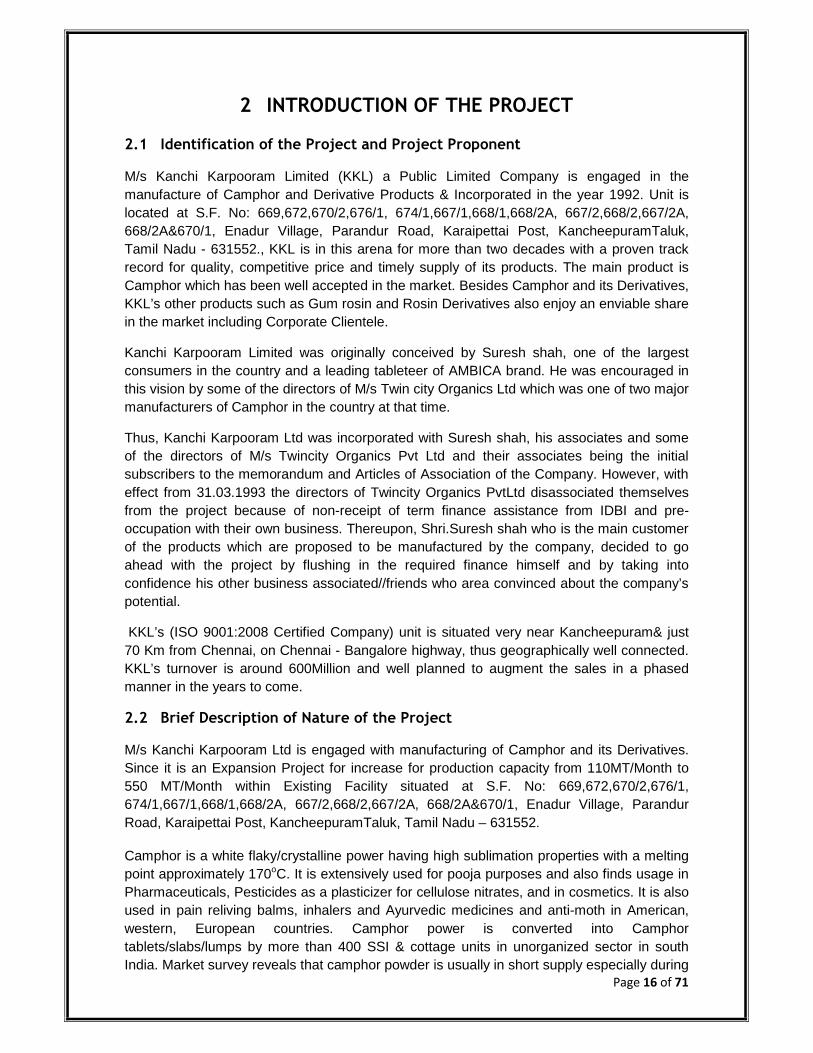
M/s Kanchi Karpooram Limited (KKL) a Public Limited Company is engaged in themanufacture of Camphor and Derivative Products & Incorporated in the year 1992. Unit islocated at S.F. No: 669,672,670/2,676/1, 674/1,667/1,668/1,668/2A, 667/2,668/2,667/2A,668/2A&670/1, Enadur Village, Parandur Road, Karaipettai Post, KancheepuramTaluk,Tamil Nadu - 631552., KKL is in this arena for more than two decades with a proven trackrecord for quality, competitive price and timely supply of its products. The main product isCamphor which has been well accepted in the market. Besides Camphor and its Derivatives,KKL’s other products such as Gum rosin and Rosin Derivatives also enjoy an enviable sharein the market including Corporate Clientele.
Kanchi Karpooram Limited was originally conceived by Suresh shah, one of the largestconsumers in the country and a leading tableteer of AMBICA brand. He was encouraged inthis vision by some of the directors of M/s Twin city Organics Ltd which was one of two majormanufacturers of Camphor in the country at that time.
Thus, Kanchi Karpooram Ltd was incorporated with Suresh shah, his associates and someof the directors of M/s Twincity Organics Pvt Ltd and their associates being the initialsubscribers to the memorandum and Articles of Association of the Company. However, witheffect from 31.03.1993 the directors of Twincity Organics PvtLtd disassociated themselvesfrom the project because of non-receipt of term finance assistance from IDBI and pre-occupation with their own business. Thereupon, Shri.Suresh shah who is the main customerof the products which are proposed to be manufactured by the company, decided to goahead with the project by flushing in the required finance himself and by taking intoconfidence his other business associated//friends who area convinced about the company’spotential.
KKL’s (ISO 9001:2008 Certified Company) unit is situated very near Kancheepuram& just70 Km from Chennai, on Chennai - Bangalore highway, thus geographically well connected.KKL’s turnover is around 600Million and well planned to augment the sales in a phasedmanner in the years to come.
2.2 Brief Description of Nature of the Project
M/s Kanchi Karpooram Ltd is engaged with manufacturing of Camphor and its Derivatives.Since it is an Expansion Project for increase for production capacity from 110MT/Month to550 MT/Month within Existing Facility situated at S.F. No: 669,672,670/2,676/1,674/1,667/1,668/1,668/2A, 667/2,668/2,667/2A, 668/2A&670/1, Enadur Village, ParandurRoad, Karaipettai Post, KancheepuramTaluk, Tamil Nadu – 631552.
Camphor is a white flaky/crystalline power having high sublimation properties with a meltingpoint approximately 170oC. It is extensively used for pooja purposes and also finds usage inPharmaceuticals, Pesticides as a plasticizer for cellulose nitrates, and in cosmetics. It is alsoused in pain reliving balms, inhalers and Ayurvedic medicines and anti-moth in American,western, European countries. Camphor power is converted into Camphortablets/slabs/lumps by more than 400 SSI & cottage units in unorganized sector in southIndia. Market survey reveals that camphor powder is usually in short supply especially during
Page 17 of 71
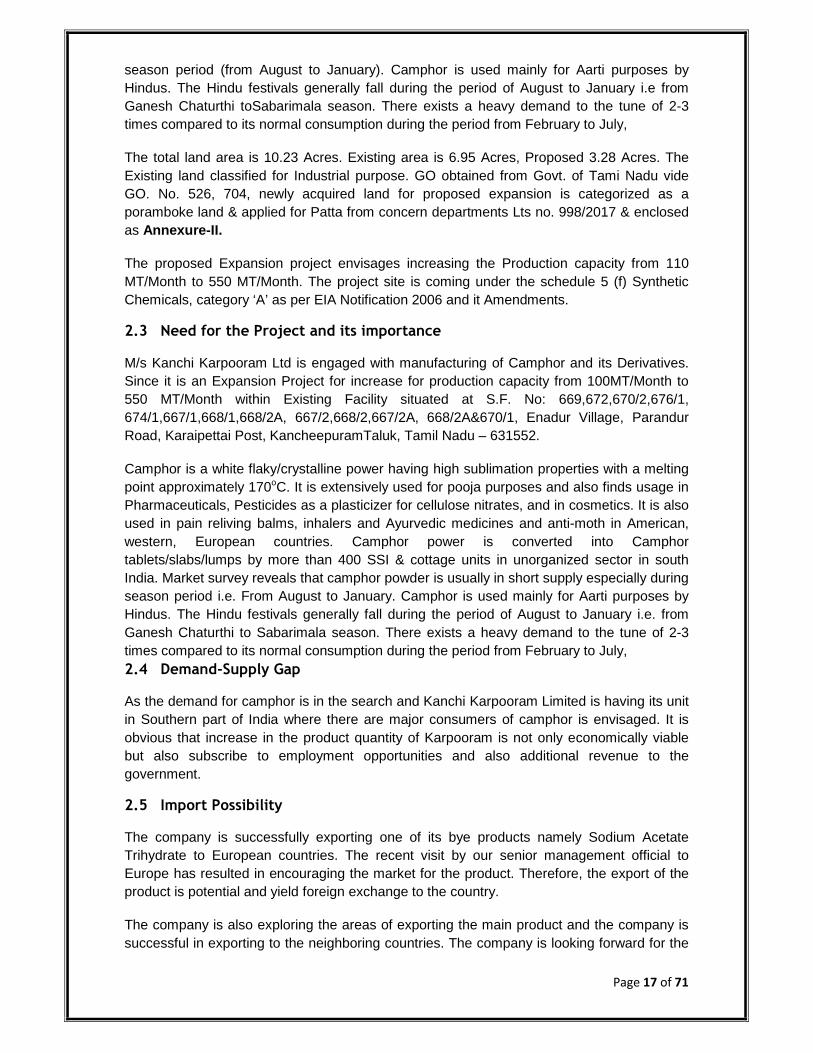
season period (from August to January). Camphor is used mainly for Aarti purposes byHindus. The Hindu festivals generally fall during the period of August to January i.e fromGanesh Chaturthi toSabarimala season. There exists a heavy demand to the tune of 2-3times compared to its normal consumption during the period from February to July,
The total land area is 10.23 Acres. Existing area is 6.95 Acres, Proposed 3.28 Acres. TheExisting land classified for Industrial purpose. GO obtained from Govt. of Tami Nadu videGO. No. 526, 704, newly acquired land for proposed expansion is categorized as aporamboke land & applied for Patta from concern departments Lts no. 998/2017 & enclosedas Annexure-II.
The proposed Expansion project envisages increasing the Production capacity from 110MT/Month to 550 MT/Month. The project site is coming under the schedule 5 (f) SyntheticChemicals, category ‘A’ as per EIA Notification 2006 and it Amendments.
2.3 Need for the Project and its importance
M/s Kanchi Karpooram Ltd is engaged with manufacturing of Camphor and its Derivatives.Since it is an Expansion Project for increase for production capacity from 100MT/Month to550 MT/Month within Existing Facility situated at S.F. No: 669,672,670/2,676/1,674/1,667/1,668/1,668/2A, 667/2,668/2,667/2A, 668/2A&670/1, Enadur Village, ParandurRoad, Karaipettai Post, KancheepuramTaluk, Tamil Nadu – 631552.
Camphor is a white flaky/crystalline power having high sublimation properties with a meltingpoint approximately 170oC. It is extensively used for pooja purposes and also finds usage inPharmaceuticals, Pesticides as a plasticizer for cellulose nitrates, and in cosmetics. It is alsoused in pain reliving balms, inhalers and Ayurvedic medicines and anti-moth in American,western, European countries. Camphor power is converted into Camphortablets/slabs/lumps by more than 400 SSI & cottage units in unorganized sector in southIndia. Market survey reveals that camphor powder is usually in short supply especially duringseason period i.e. From August to January. Camphor is used mainly for Aarti purposes byHindus. The Hindu festivals generally fall during the period of August to January i.e. fromGanesh Chaturthi to Sabarimala season. There exists a heavy demand to the tune of 2-3times compared to its normal consumption during the period from February to July,2.4 Demand-Supply Gap
As the demand for camphor is in the search and Kanchi Karpooram Limited is having its unitin Southern part of India where there are major consumers of camphor is envisaged. It isobvious that increase in the product quantity of Karpooram is not only economically viablebut also subscribe to employment opportunities and also additional revenue to thegovernment.
2.5 Import Possibility
The company is successfully exporting one of its bye products namely Sodium AcetateTrihydrate to European countries. The recent visit by our senior management official toEurope has resulted in encouraging the market for the product. Therefore, the export of theproduct is potential and yield foreign exchange to the country.
The company is also exploring the areas of exporting the main product and the company issuccessful in exporting to the neighboring countries. The company is looking forward for the

Page 18 of 71
increase in the exports in the years to come. As regards to import of raw materials, thecompany exercises a minimum street in imports and exports.
2.6 Domestic/Export Markets
The manufacturing unit of the company is located in an area accessible for ports and surfacetransport. The company is well identified with a proven market record of quality product oncompetitive price. The company has edge over the competitors because of the proximity inthe location of the unit which results a better competitive price. Therefore, the company cantake a lion share for the increased demand. As regards to the other products of the companyvis-à-vis dipentene, pine tar, the company has experienced the demand because ofconsumers of these products are very high either in Tamil Nadu or in the proximity closuresof Tamil Nadu. Thus, the market strength of the company is increased thereby the demandhas increased in the production regularly.
2.7 Employment Generation
The Total employment in the existing facility is 100 persons as direct employment and afterexpansion it is envisaged up to 140 persons. Manpower requirement for construction phaseis about 20 Nos. Manpower details are given in Table 2-1.
Table 2-1Man power of the projectDescription Permanent Contractual After Expansion
Existing (Nos) 100 0 100
Proposed (Nos) 20 20 40
Total(Nos) 120 20 140Note: Construction phase: 20 Nos
Page 19 of 71
3 PROJECT DISCRIPTION
To cater the needs of the market, KKL proposes to increase production capacity of theproposed product (Camphor) at its existing unit. The proposed project falls under Category‘A’, Schedule 5(f), Synthetic Organic Chemicals Industry as per the EIA notification datedSeptember 14, 2006 and its amendments. There are no interlinked projects.
M/s Kanchi Karpooram Limited (KKL) a Public Limited Company is engaged in themanufacture of Camphor and Derivative Products & Incorporated in the year 1992. ProjectSituated at S.F. No: 669,672,670/2,676/1, 674/1,667/1,668/1,668/2A, 667/2,668/2,667/2A,668/2A&670/1, Enadur Village, Parandur Road, Karaipettai Post, KancheepuramTaluk,Tamil Nadu - 631552., KKL is in this arena for more than two decades with a proven trackrecord for quality, competitive price and timely supply of its products. The main product isCamphor which has been well accepted in the market. Besides Camphor and its Derivatives,KKL’s other products such as Gum rosin and Rosin Derivatives also enjoy an enviable sharein the market including Corporate Clientele.
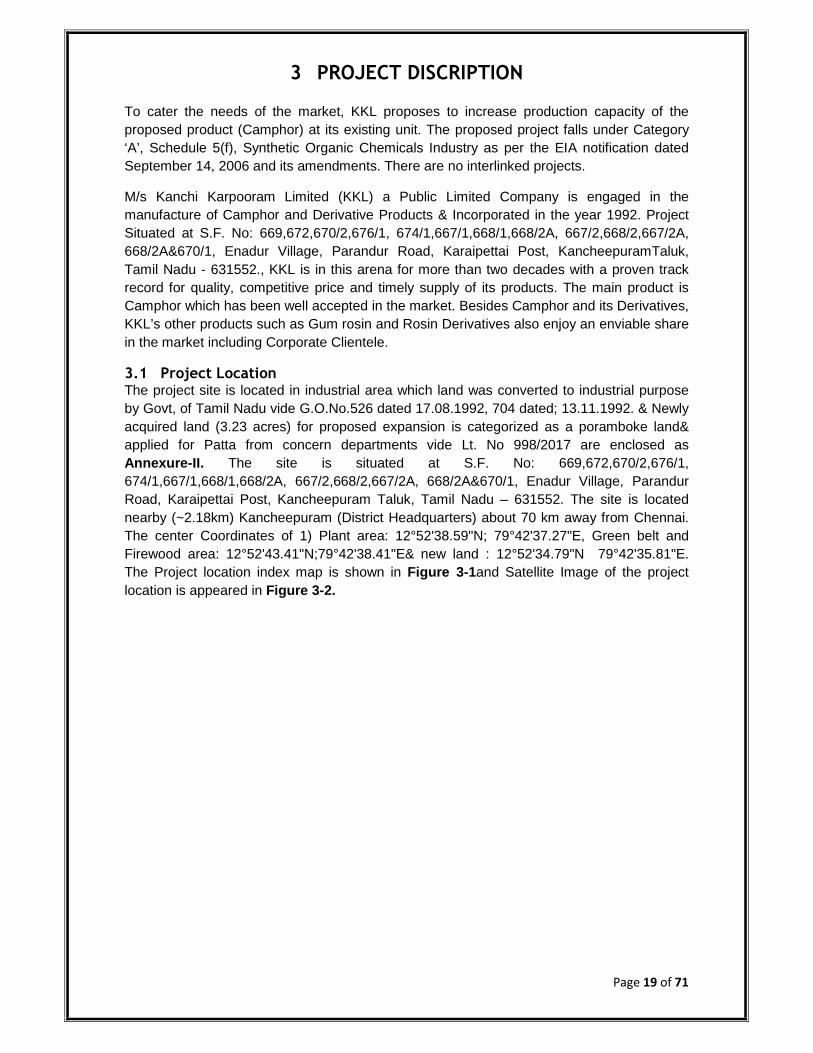
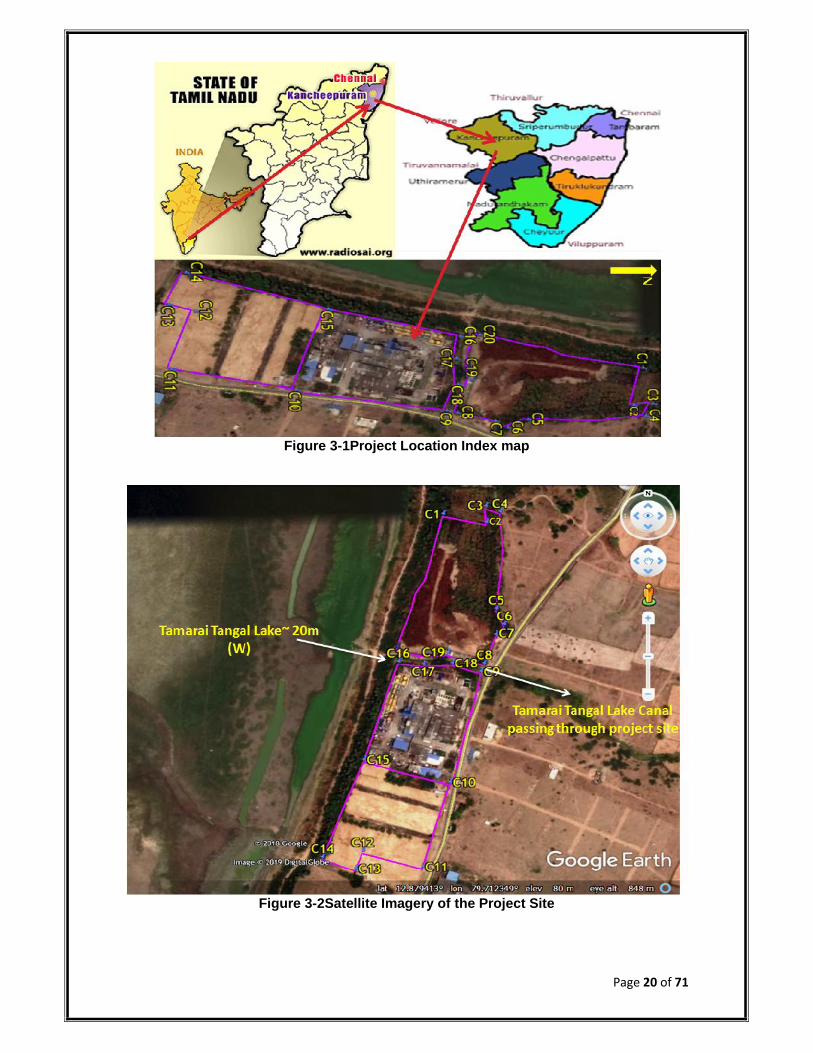
3.1 Project LocationThe project site is located in industrial area which land was converted to industrial purposeby Govt, of Tamil Nadu vide G.O.No.526 dated 17.08.1992, 704 dated; 13.11.1992. & Newlyacquired land (3.23 acres) for proposed expansion is categorized as a poramboke land&applied for Patta from concern departments vide Lt. No 998/2017 are enclosed asAnnexure-II. The site is situated at S.F. No: 669,672,670/2,676/1,674/1,667/1,668/1,668/2A, 667/2,668/2,667/2A, 668/2A&670/1, Enadur Village, ParandurRoad, Karaipettai Post, Kancheepuram Taluk, Tamil Nadu – 631552. The site is locatednearby (~2.18km) Kancheepuram (District Headquarters) about 70 km away from Chennai.The center Coordinates of 1) Plant area: 12°52'38.59"N; 79°42'37.27"E, Green belt andFirewood area: 12°52'43.41"N;79°42'38.41"E& new land : 12°52'34.79"N 79°42'35.81"E.The Project location index map is shown in Figure 3-1and Satellite Image of the projectlocation is appeared in Figure 3-2.
Page 20 of 71
Figure 3-1Project Location Index map
Figure 3-2Satellite Imagery of the Project Site
Page 21 of 71
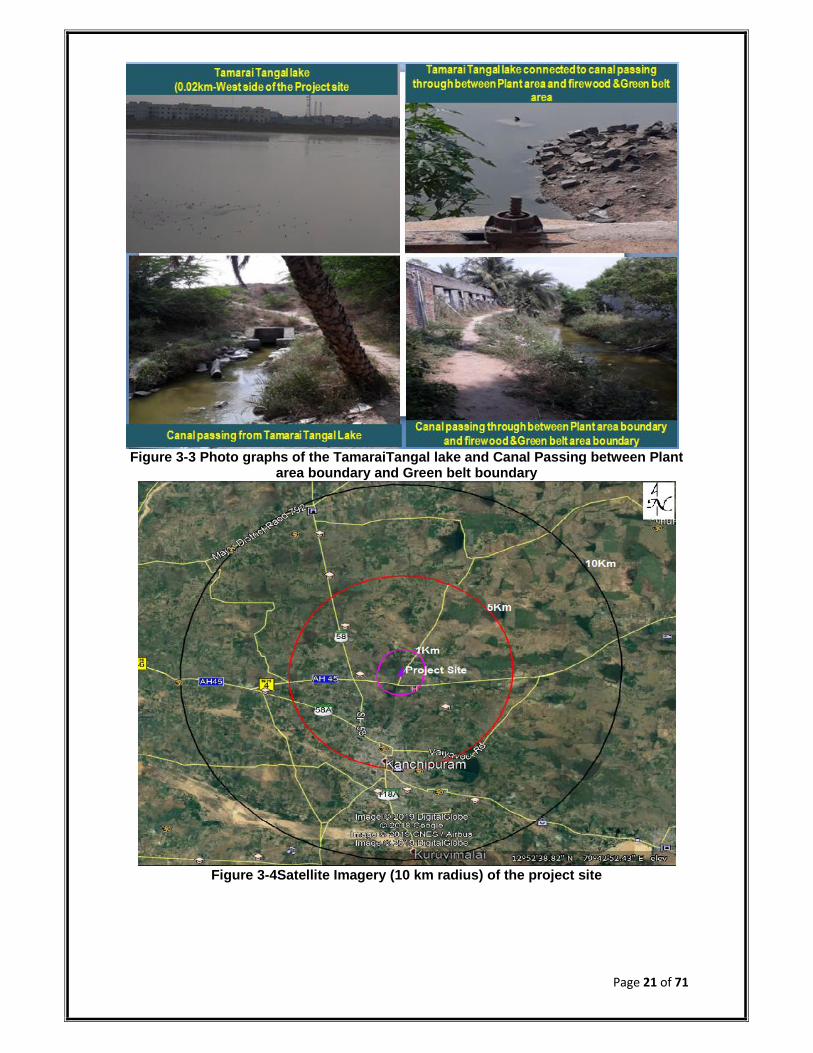
Figure 3-3 Photo graphs of the TamaraiTangal lake and Canal Passing between Plantarea boundary and Green belt boundary
Figure 3-4Satellite Imagery (10 km radius) of the project site
Page 22 of 71
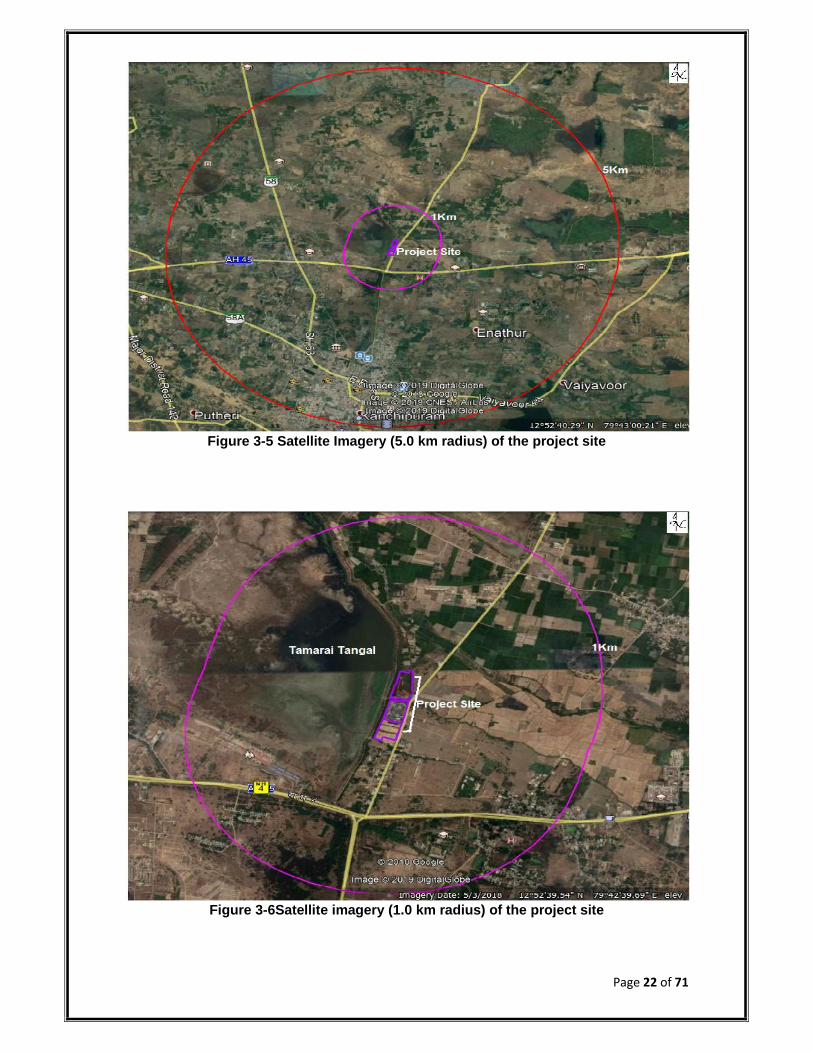
Figure 3-5 Satellite Imagery (5.0 km radius) of the project site
Figure 3-6Satellite imagery (1.0 km radius) of the project site
Page 23 of 71
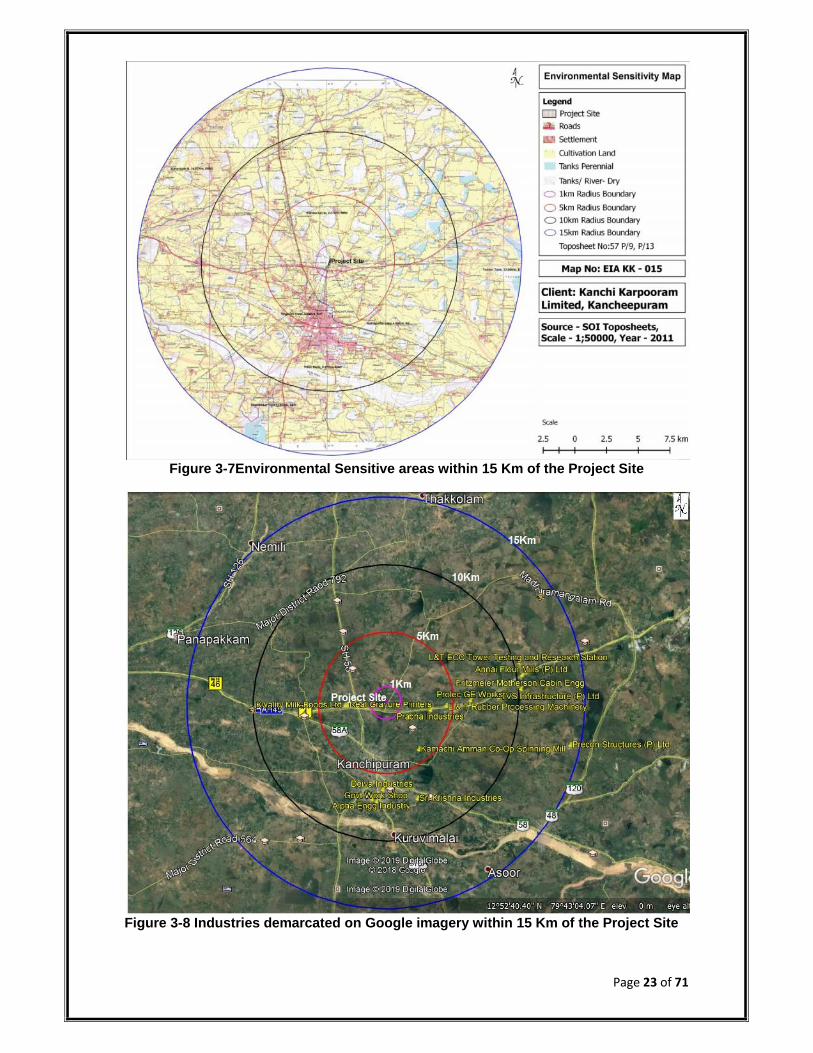
Figure 3-7Environmental Sensitive areas within 15 Km of the Project Site
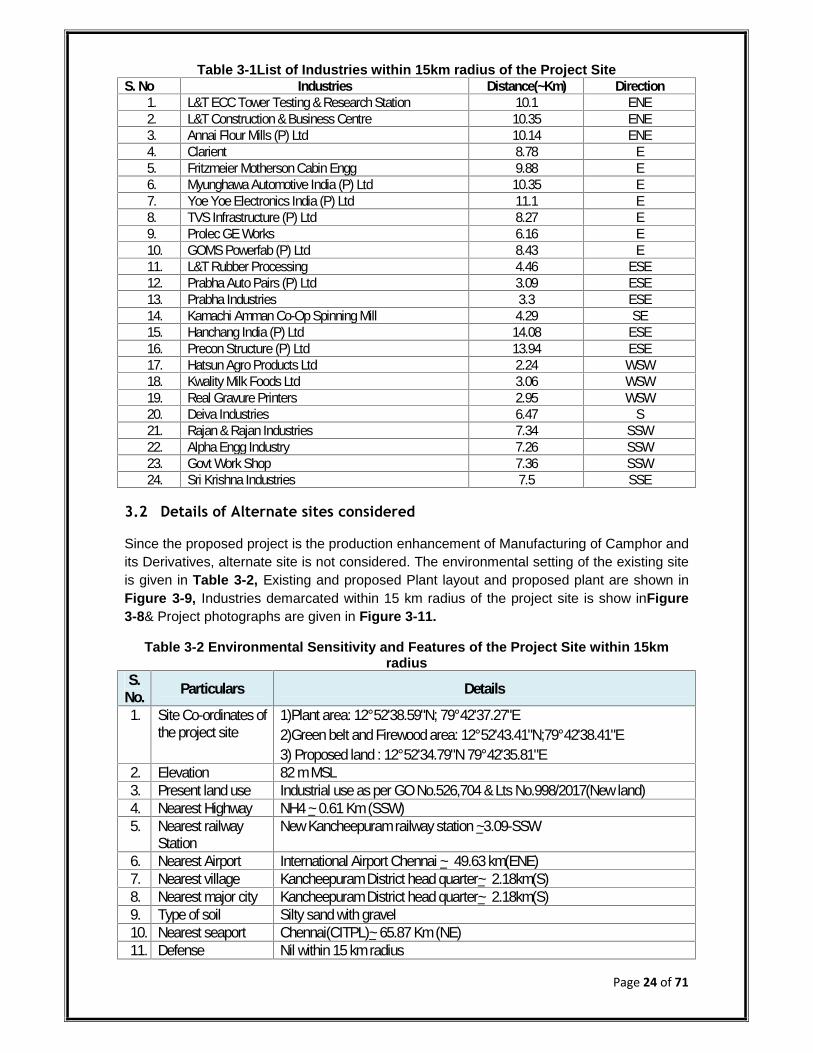
Figure 3-8 Industries demarcated on Google imagery within 15 Km of the Project Site
Page 24 of 71
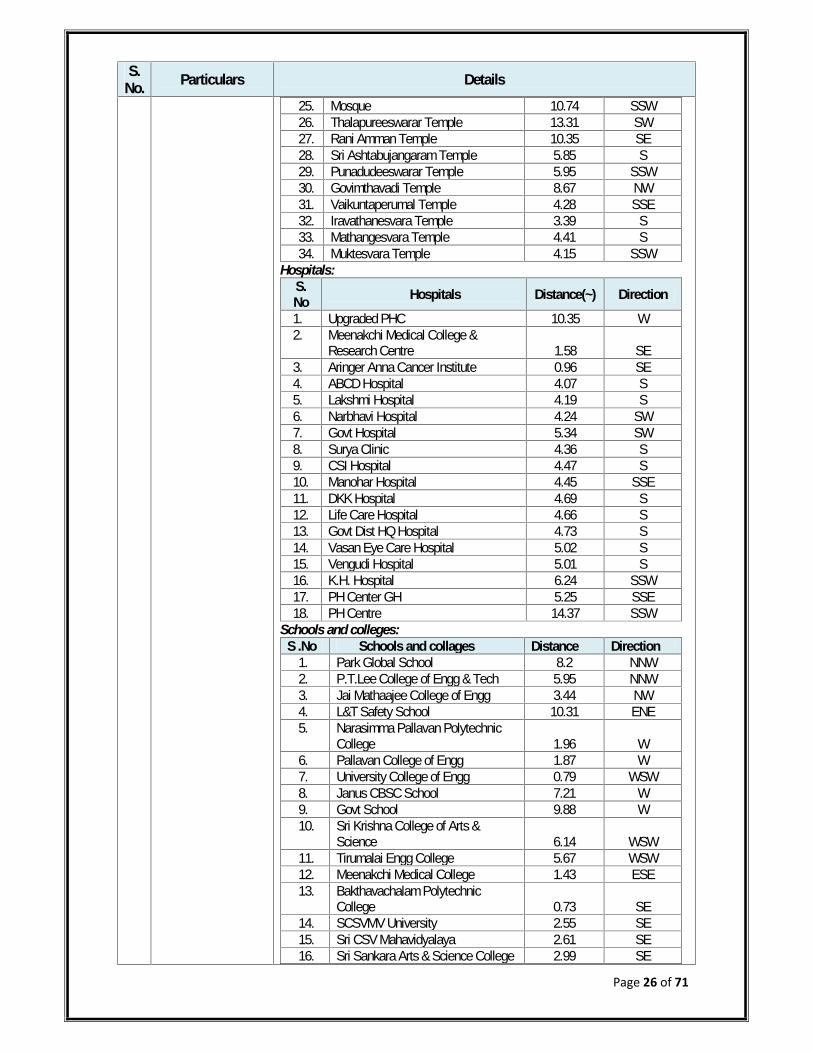
Table 3-1List of Industries within 15km radius of the Project SiteS. No Industries Distance(~Km) Direction
1. L&T ECC Tower Testing & Research Station 10.1 ENE2. L&T Construction & Business Centre 10.35 ENE3. Annai Flour Mills (P) Ltd 10.14 ENE4. Clarient 8.78 E5. Fritzmeier Motherson Cabin Engg 9.88 E6. Myunghawa Automotive India (P) Ltd 10.35 E7. Yoe Yoe Electronics India (P) Ltd 11.1 E8. TVS Infrastructure (P) Ltd 8.27 E9. Prolec GE Works 6.16 E10. GOMS Powerfab (P) Ltd 8.43 E11. L&T Rubber Processing 4.46 ESE12. Prabha Auto Pairs (P) Ltd 3.09 ESE13. Prabha Industries 3.3 ESE14. Kamachi Amman Co-Op Spinning Mill 4.29 SE15. Hanchang India (P) Ltd 14.08 ESE16. Precon Structure (P) Ltd 13.94 ESE17. Hatsun Agro Products Ltd 2.24 WSW18. Kwality Milk Foods Ltd 3.06 WSW19. Real Gravure Printers 2.95 WSW20. Deiva Industries 6.47 S21. Rajan & Rajan Industries 7.34 SSW22. Alpha Engg Industry 7.26 SSW23. Govt Work Shop 7.36 SSW24. Sri Krishna Industries 7.5 SSE
3.2 Details of Alternate sites considered
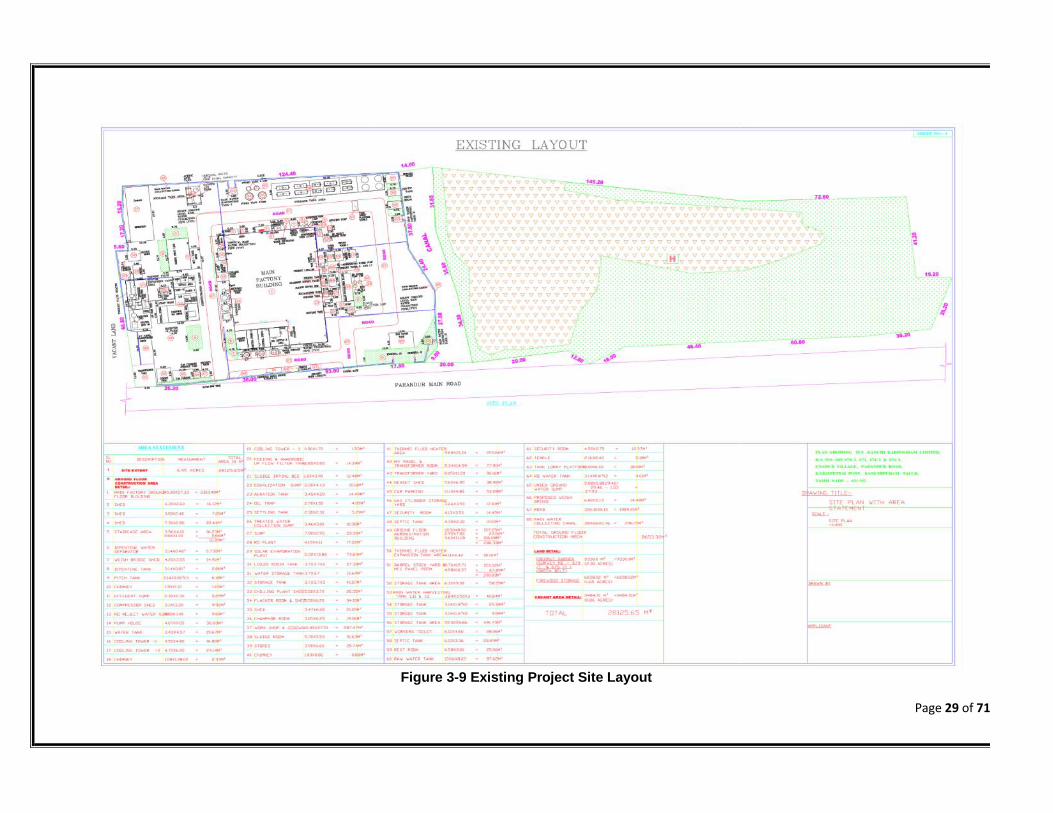
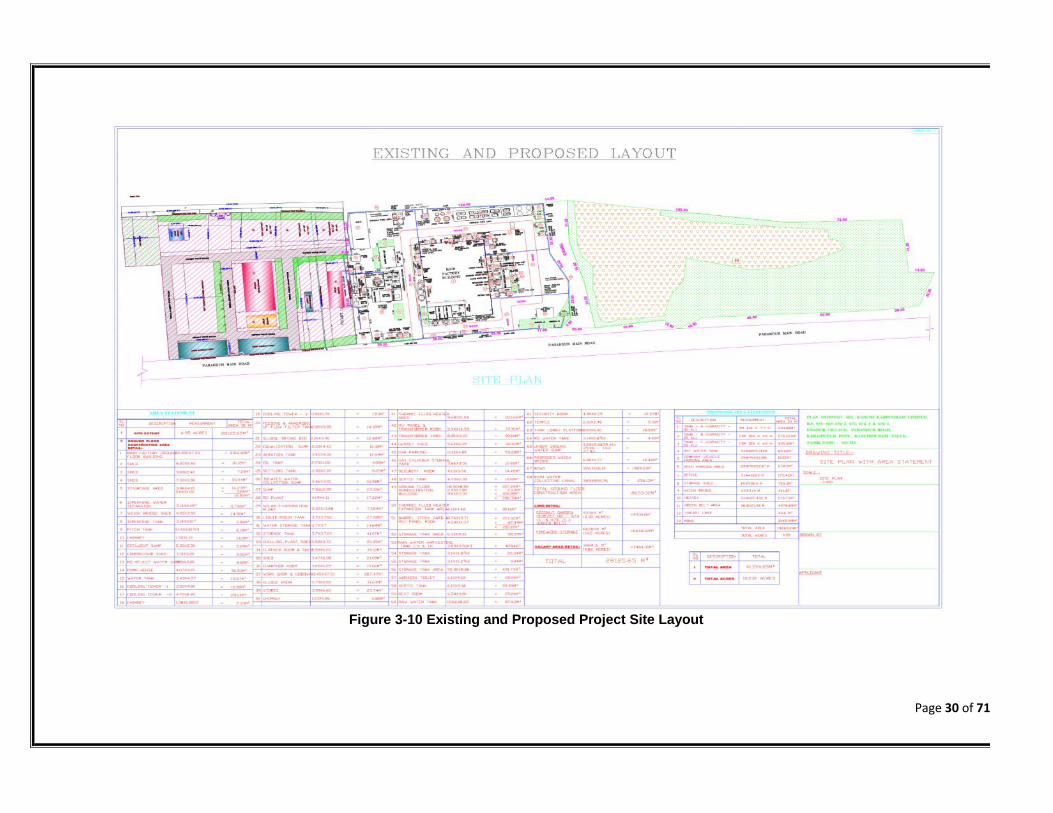
Since the proposed project is the production enhancement of Manufacturing of Camphor andits Derivatives, alternate site is not considered. The environmental setting of the existing siteis given in Table 3-2, Existing and proposed Plant layout and proposed plant are shown inFigure 3-9, Industries demarcated within 15 km radius of the project site is show inFigure3-8& Project photographs are given in Figure 3-11.
Table 3-2 Environmental Sensitivity and Features of the Project Site within 15kmradius
S.No. Particulars Details1. Site Co-ordinates of
the project site1)Plant area: 12°52'38.59"N; 79°42'37.27"E2)Green belt and Firewood area: 12°52'43.41"N;79°42'38.41"E3) Proposed land : 12°52'34.79"N 79°42'35.81"E
2. Elevation 82 m MSL3. Present land use Industrial use as per GO No.526,704 & Lts No.998/2017(New land)4. Nearest Highway NH4 ~ 0.61 Km (SSW)5. Nearest railway
StationNew Kancheepuram railway station ~3.09-SSW
6. Nearest Airport International Airport Chennai ~ 49.63 km(ENE)7. Nearest village Kancheepuram District head quarter~ 2.18km(S)8. Nearest major city Kancheepuram District head quarter~ 2.18km(S)9. Type of soil Silty sand with gravel10. Nearest seaport Chennai(CITPL)~ 65.87 Km (NE)11. Defense Nil within 15 km radius

Page 25 of 71
S.No. Particulars Details
Installations12. Nearest Town Kancheepuram District head quarter~ 2.18km(S)13. Nearest River/
Lakes/DamsS. No Name of the Location Distance(~km) Direction
Rivers1 Palar river 8.27 SSW2 Vegavati river 5.39 SW
Lakes1. Tamarai Tangal 0.02 W2. Tonneri Tank 12.06 E3. Kaveripak N 14.47 WSW4. Pamba Kalvai 4.07 NNW5. Nathapettai lake 4.92 SE6. Mamandur Tank 12.62 SSW
14. Hills & valleys Nil within 15 Km radius of the project15. Routes or facilities
used by the publicfor access torecreation or othertourist, pilgrimareas &ArcheologicallyImportant Places/Tourist/Religiousimportance
Monuments:
S. No Name of the Monuments Distance (~km) Direction1. Kailasanathar Temple 4.25 SW2. Vaikuntaperumal Temple 4.28 SSE3. Piravathanesvara Temple 3.37 S4. Iravathanesvara Temple 3.39 S5. Muktesvara Temple 4.15 SSW6. Mathangesvara Temple 4.41 S
1. Areas occupied bysensitive man-made land uses(hospitals, schools,places of worship,communityfacilities)
Places of worships :S. No Places of worships (~)Distance Direction
1. Sri Manikandeswara Swamy Temple 9.95 NW2. Najma - Masjid 10.12 W3. Sri Vijaya Raghava Perumal temple 9.98 W4. Ekambareswarar Temple 3.18 SSW5. Sri Pachai Vanna Perumal Temple 3.49 S6. Sri Pavala Vanna Perumal Temple 3.53 S7. Kailasanathar Temple 4.25 SW8. Pandavar Perumal Temple 3.87 SSW9. Jurahareswar Temple 3.87 SSW10. Kamachi Amman Temple 3.84 S11. Ulagalantha Perumal Temple 4.05 S12. Kachabeswarar Temple 4.21 S13. TMN Temple 4.89 SSW14. Perinba Prayer House 5.55 SW15. Bodhidharma Temple 4.42 SSE16. Sathyanateswarar Temple 5.21 SSE17. Perumal Temple 5.63 S18. Jerusalem Workship 6.31 SSW19. Panadudeeswarar Temple 5.97 S20. Thiruvelakai Temple 5.91 S21. Manikandeswar Temple 5.95 SSE22. Narashima Temple 7.85 SSW23. Sri Varadharaja Perumal Temple 6.37 SSE24. Punniyakodeswarar Temple 6.57 SSE
Page 26 of 71
S.No. Particulars Details
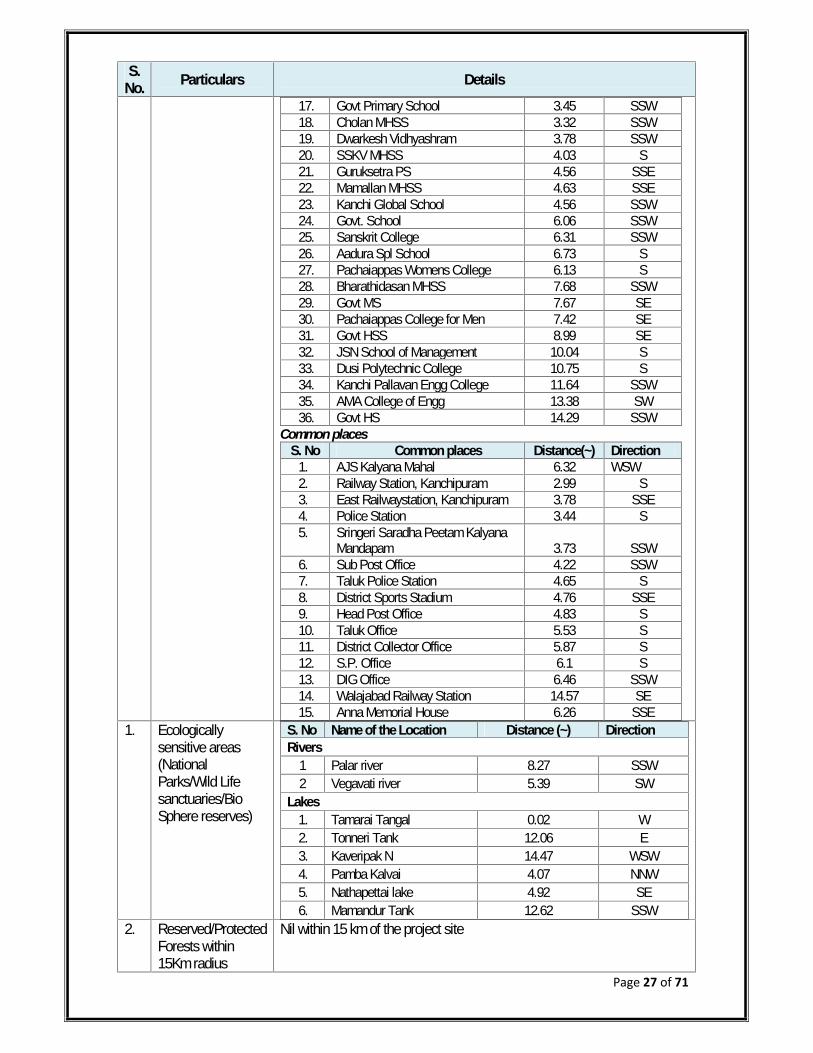
25. Mosque 10.74 SSW26. Thalapureeswarar Temple 13.31 SW27. Rani Amman Temple 10.35 SE28. Sri Ashtabujangaram Temple 5.85 S29. Punadudeeswarar Temple 5.95 SSW30. Govimthavadi Temple 8.67 NW31. Vaikuntaperumal Temple 4.28 SSE32. Iravathanesvara Temple 3.39 S33. Mathangesvara Temple 4.41 S34. Muktesvara Temple 4.15 SSW
Hospitals:S.No Hospitals Distance(~) Direction1. Upgraded PHC 10.35 W2. Meenakchi Medical College &
Research Centre 1.58 SE3. Aringer Anna Cancer Institute 0.96 SE4. ABCD Hospital 4.07 S5. Lakshmi Hospital 4.19 S6. Narbhavi Hospital 4.24 SW7. Govt Hospital 5.34 SW8. Surya Clinic 4.36 S9. CSI Hospital 4.47 S10. Manohar Hospital 4.45 SSE11. DKK Hospital 4.69 S12. Life Care Hospital 4.66 S13. Govt Dist HQ Hospital 4.73 S14. Vasan Eye Care Hospital 5.02 S15. Vengudi Hospital 5.01 S16. K.H. Hospital 6.24 SSW17. PH Center GH 5.25 SSE18. PH Centre 14.37 SSW
Schools and colleges:S .No Schools and collages Distance Direction
1. Park Global School 8.2 NNW2. P.T.Lee College of Engg & Tech 5.95 NNW3. Jai Mathaajee College of Engg 3.44 NW4. L&T Safety School 10.31 ENE5. Narasimma Pallavan Polytechnic
College 1.96 W6. Pallavan College of Engg 1.87 W7. University College of Engg 0.79 WSW8. Janus CBSC School 7.21 W9. Govt School 9.88 W10. Sri Krishna College of Arts &
Science 6.14 WSW11. Tirumalai Engg College 5.67 WSW12. Meenakchi Medical College 1.43 ESE13. Bakthavachalam Polytechnic
College 0.73 SE14. SCSVMV University 2.55 SE15. Sri CSV Mahavidyalaya 2.61 SE16. Sri Sankara Arts & Science College 2.99 SE
Page 27 of 71
S.No. Particulars Details
17. Govt Primary School 3.45 SSW18. Cholan MHSS 3.32 SSW19. Dwarkesh Vidhyashram 3.78 SSW20. SSKV MHSS 4.03 S21. Guruksetra PS 4.56 SSE22. Mamallan MHSS 4.63 SSE23. Kanchi Global School 4.56 SSW24. Govt. School 6.06 SSW25. Sanskrit College 6.31 SSW26. Aadura Spl School 6.73 S27. Pachaiappas Womens College 6.13 S28. Bharathidasan MHSS 7.68 SSW29. Govt MS 7.67 SE30. Pachaiappas College for Men 7.42 SE31. Govt HSS 8.99 SE32. JSN School of Management 10.04 S33. Dusi Polytechnic College 10.75 S34. Kanchi Pallavan Engg College 11.64 SSW35. AMA College of Engg 13.38 SW36. Govt HS 14.29 SSW
Common placesS. No Common places Distance(~) Direction
1. AJS Kalyana Mahal 6.32 WSW2. Railway Station, Kanchipuram 2.99 S3. East Railwaystation, Kanchipuram 3.78 SSE4. Police Station 3.44 S5. Sringeri Saradha Peetam Kalyana
Mandapam 3.73 SSW6. Sub Post Office 4.22 SSW7. Taluk Police Station 4.65 S8. District Sports Stadium 4.76 SSE9. Head Post Office 4.83 S10. Taluk Office 5.53 S11. District Collector Office 5.87 S12. S.P. Office 6.1 S13. DIG Office 6.46 SSW14. Walajabad Railway Station 14.57 SE15. Anna Memorial House 6.26 SSE
1. Ecologicallysensitive areas(NationalParks/Wild Lifesanctuaries/BioSphere reserves)
S. No Name of the Location Distance (~) DirectionRivers
1 Palar river 8.27 SSW2 Vegavati river 5.39 SW
Lakes1. Tamarai Tangal 0.02 W2. Tonneri Tank 12.06 E3. Kaveripak N 14.47 WSW4. Pamba Kalvai 4.07 NNW5. Nathapettai lake 4.92 SE6. Mamandur Tank 12.62 SSW
2. Reserved/ProtectedForests within15Km radius
Nil within 15 km of the project site
Page 28 of 71
S.No. Particulars Details3. Areas susceptible
to natural hazardwhich could causethe project topresentenvironmentalproblems(earthquakes,subsidence,landslides,erosion, flooding
or extreme oradverse climaticconditions)
The area comes under seismic Zone-III (Moderate Risk). There is nosusceptible to natural hazards like subsidence, landslides, erosion,flooding or extreme or adverse climatic conditions.Note :Seismic Zone-II : Low riskSeismic Zone-III : Moderate RiskSeismic Zone-IV : High RiskSeismic Zone-V Very high Risk
Page 29 of 71
Figure 3-9 Existing Project Site Layout
Page 29 of 71
Figure 3-9 Existing Project Site Layout
Page 29 of 71
Figure 3-9 Existing Project Site Layout
Page 30 of 71
Figure 3-10 Existing and Proposed Project Site Layout
Page 30 of 71
Figure 3-10 Existing and Proposed Project Site Layout
Page 30 of 71
Figure 3-10 Existing and Proposed Project Site Layout
Page 31 of 71
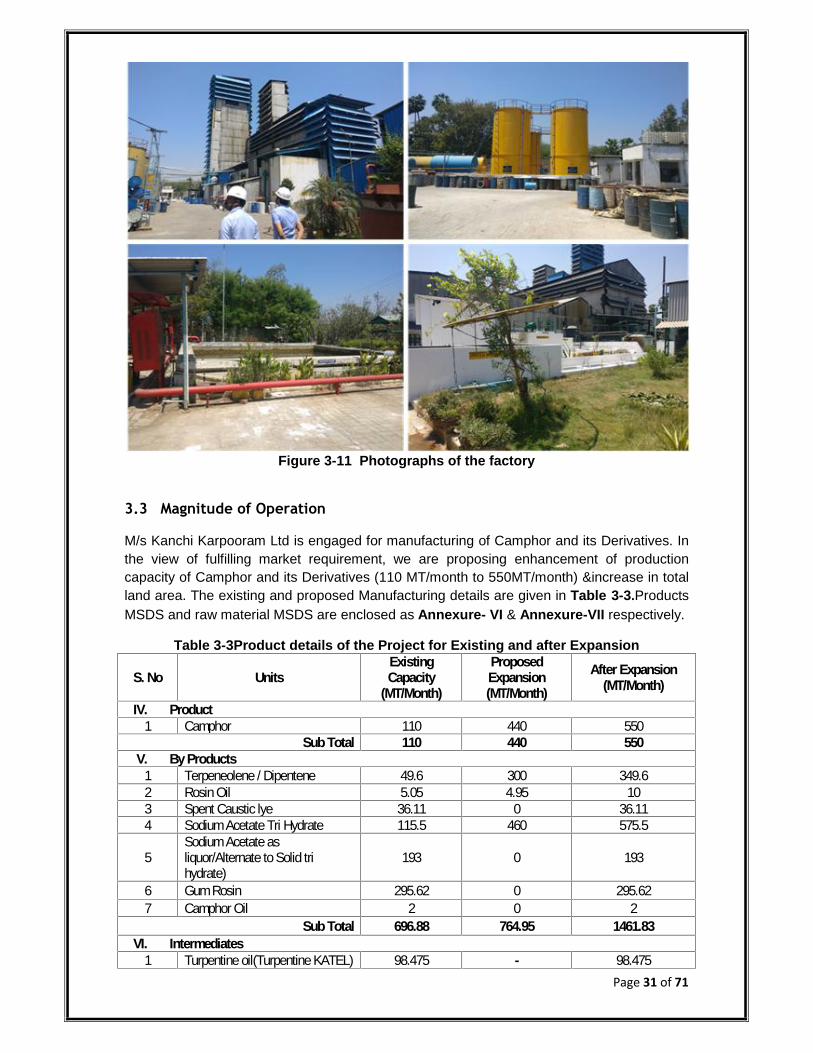
Figure 3-11 Photographs of the factory
3.3 Magnitude of Operation
M/s Kanchi Karpooram Ltd is engaged for manufacturing of Camphor and its Derivatives. Inthe view of fulfilling market requirement, we are proposing enhancement of productioncapacity of Camphor and its Derivatives (110 MT/month to 550MT/month) &increase in totalland area. The existing and proposed Manufacturing details are given in Table 3-3.ProductsMSDS and raw material MSDS are enclosed as Annexure- VI & Annexure-VII respectively.
Table 3-3Product details of the Project for Existing and after Expansion
S. No UnitsExistingCapacity
(MT/Month)
ProposedExpansion(MT/Month)
After Expansion(MT/Month)
IV. Product1 Camphor 110 440 550
Sub Total 110 440 550V. By Products
1 Terpeneolene / Dipentene 49.6 300 349.62 Rosin Oil 5.05 4.95 103 Spent Caustic lye 36.11 0 36.114 Sodium Acetate Tri Hydrate 115.5 460 575.5
5Sodium Acetate asliquor/Alternate to Solid trihydrate)
193 0 193
6 Gum Rosin 295.62 0 295.627 Camphor Oil 2 0 2
Sub Total 696.88 764.95 1461.83VI. Intermediates
1 Turpentine oil(Turpentine KATEL) 98.475 - 98.475

Page 32 of 71
2 Camphene 110 440 5503 Iso Bornyl Acetate 170 340 5104 Esters 15 0 155 Maleics 15 0 156 Phenolics 20 0 207 Rosin Size 100 0 1008 Other Rosin Derivatives 20 0 209 Terpenic Oil 20 0 20
10 Pine Oil (Terpenol) 40 60 10011 Longifoluences 10 0 1012 Double Distilled Turpentine 10 20 3013 Pine Tar 15 45 6014 Pine Pitch 6.5 30 36.515 Iso Bornyl Crude 110 440 550
Sub Total 759.975 1375 2134.975Grand Total (I+II+III) 1566.855 2579.95 4146.805
3.4 Process Description
Since, it is an Expansion project within the existing facility. The project was designed formanufacturing of Camphor and its Derivatives. The Proposed project is for Expansion ofproduction capacity from 110 MT/Month to 550 MT/month. The process flow diagram isshown in Figure 3-12.The manufacturing Process enclosed as Annexure-XV.
Figure 3-12 Manufacturing Process Flow Chart
Page 33 of 71
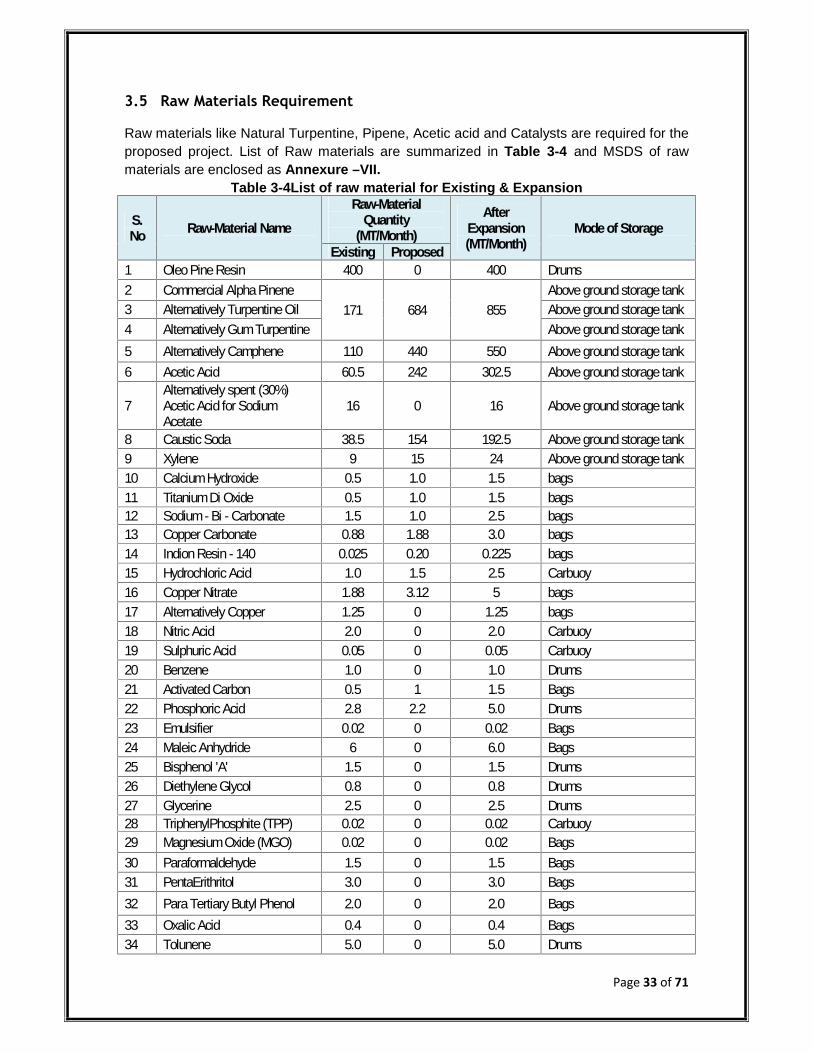
3.5 Raw Materials Requirement
Raw materials like Natural Turpentine, Pipene, Acetic acid and Catalysts are required for theproposed project. List of Raw materials are summarized in Table 3-4 and MSDS of rawmaterials are enclosed as Annexure –VII.
Table 3-4List of raw material for Existing & Expansion
S.No Raw-Material Name
Raw-MaterialQuantity
(MT/Month)After
Expansion(MT/Month)
Mode of StorageExisting Proposed
1 Oleo Pine Resin 400 0 400 Drums2 Commercial Alpha Pinene
171 684 855Above ground storage tank
3 Alternatively Turpentine Oil Above ground storage tank4 Alternatively Gum Turpentine Above ground storage tank5 Alternatively Camphene 110 440 550 Above ground storage tank6 Acetic Acid 60.5 242 302.5 Above ground storage tank
7Alternatively spent (30%)Acetic Acid for SodiumAcetate
16 0 16 Above ground storage tank
8 Caustic Soda 38.5 154 192.5 Above ground storage tank9 Xylene 9 15 24 Above ground storage tank10 Calcium Hydroxide 0.5 1.0 1.5 bags11 Titanium Di Oxide 0.5 1.0 1.5 bags12 Sodium - Bi - Carbonate 1.5 1.0 2.5 bags13 Copper Carbonate 0.88 1.88 3.0 bags14 Indion Resin - 140 0.025 0.20 0.225 bags15 Hydrochloric Acid 1.0 1.5 2.5 Carbuoy16 Copper Nitrate 1.88 3.12 5 bags17 Alternatively Copper 1.25 0 1.25 bags18 Nitric Acid 2.0 0 2.0 Carbuoy19 Sulphuric Acid 0.05 0 0.05 Carbuoy20 Benzene 1.0 0 1.0 Drums21 Activated Carbon 0.5 1 1.5 Bags22 Phosphoric Acid 2.8 2.2 5.0 Drums23 Emulsifier 0.02 0 0.02 Bags24 Maleic Anhydride 6 0 6.0 Bags25 Bisphenol 'A' 1.5 0 1.5 Drums26 Diethylene Glycol 0.8 0 0.8 Drums27 Glycerine 2.5 0 2.5 Drums28 TriphenylPhosphite (TPP) 0.02 0 0.02 Carbuoy29 Magnesium Oxide (MGO) 0.02 0 0.02 Bags30 Paraformaldehyde 1.5 0 1.5 Bags31 PentaErithritol 3.0 0 3.0 Bags32 Para Tertiary Butyl Phenol 2.0 0 2.0 Bags33 Oxalic Acid 0.4 0 0.4 Bags34 Tolunene 5.0 0 5.0 Drums

Page 34 of 71
35 Fumaric Acid 0.5 0 0.5 Bags36 Mineral Turpentine Oil (MTO) 7.5 0 7.5 Drums
Total 849.645 1548.14 2397.785
3.6 Storage Facility for Raw Materials and Products
Adequate storage facilities with optimum inventories are provided for the raw materials andproducts. The raw materials, products and others storage capacities are detailed in Table3-5.
Table 3-5 Details of Storage Facilities
S. No Item Proposed Storage Capacity (MTPM)Existing Proposed After Expansion
1. Raw materials 350 350 7002. Solvents(Xylene) 20 10 303. Products Storage 500 - 500
Total 870 360 1230
3.7 Mode of Transportation
Raw materials and finished products are transported thru trucks by road. The workforce is sourced locally who come to the factory in their own transport
arrangements by road. Fire wood is transported through trucks by road.
3.8 Resource optimization
Wastewater generated in the Cooling Tower is recycled back at source. Saponification washwater is used for green belt after treatment.
3.9 Recycling /Reuse of Solvents
Solvents play an essential role in chemical processing for controlling the reaction rate,facilitating heat and mass transfer and enabling product separation and purification, whichcannot be replaced easily with other alternatives.Various Chemicals are proposed to beused during the process of manufacture of the proposed products. There is no recoveredand recycled process are involved. The solvents storage (Existing &Proposed) is detailed inTable 3-6.
Table 3-6Solvent StorageS.No
ProposedChemical Name
StorageMode
Petroleumclassification
Quantity(No of tanks in KL)Existing Proposed After expansion
1 NaturalTurpentine Oil Above
GroundLeveltank
B 5Nos *X 27 2 Nos X 805 Nos X 90
2 Nos X 805 Nos X 90
2 Xylene B 1 Nos X 20 1 Nos X 10 1 Nos X 201 Nos X 10
3 Acetic Acid - 1 Nos X 40 1 Nos X 40 1 Nos X 401 Nos X 40
4 Caustic soda KL - 30 - 30Note: Existing 5Nos *X 27 KL tanks will be removed during the ExpansionExplosive Licenses from PESO are enclosed as Annexure-XXI.
Page 35 of 71
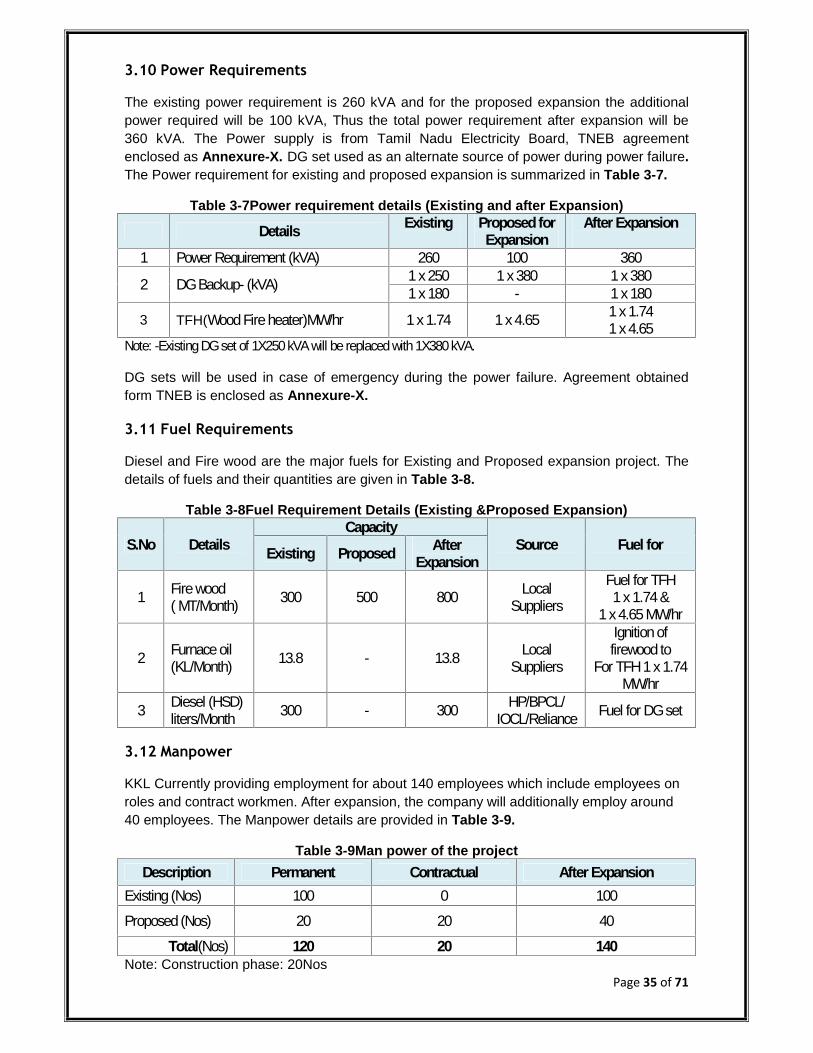
3.10 Power Requirements
The existing power requirement is 260 kVA and for the proposed expansion the additionalpower required will be 100 kVA, Thus the total power requirement after expansion will be360 kVA. The Power supply is from Tamil Nadu Electricity Board, TNEB agreementenclosed as Annexure-X. DG set used as an alternate source of power during power failure.The Power requirement for existing and proposed expansion is summarized in Table 3-7.
Table 3-7Power requirement details (Existing and after Expansion)
Details Existing Proposed forExpansion
After Expansion
1 Power Requirement (kVA) 260 100 360
2 DG Backup- (kVA) 1 x 250 1 x 380 1 x 3801 x 180 - 1 x 180
3 TFH(Wood Fire heater)MW/hr 1 x 1.74 1 x 4.65 1 x 1.741 x 4.65
Note: -Existing DG set of 1X250 kVA will be replaced with 1X380 kVA.
DG sets will be used in case of emergency during the power failure. Agreement obtainedform TNEB is enclosed as Annexure-X.
3.11 Fuel Requirements
Diesel and Fire wood are the major fuels for Existing and Proposed expansion project. Thedetails of fuels and their quantities are given in Table 3-8.
Table 3-8Fuel Requirement Details (Existing &Proposed Expansion)
S.No DetailsCapacity
Source Fuel forExisting Proposed AfterExpansion
1 Fire wood( MT/Month) 300 500 800 Local
SuppliersFuel for TFH
1 x 1.74 &1 x 4.65 MW/hr
2 Furnace oil(KL/Month) 13.8 - 13.8 Local
Suppliers
Ignition offirewood to
For TFH 1 x 1.74MW/hr
3 Diesel (HSD)liters/Month 300 - 300 HP/BPCL/
IOCL/Reliance Fuel for DG set
3.12 Manpower
KKL Currently providing employment for about 140 employees which include employees onroles and contract workmen. After expansion, the company will additionally employ around40 employees. The Manpower details are provided in Table 3-9.
Table 3-9Man power of the projectDescription Permanent Contractual After Expansion
Existing (Nos) 100 0 100Proposed (Nos) 20 20 40
Total(Nos) 120 20 140Note: Construction phase: 20Nos
Page 36 of 71
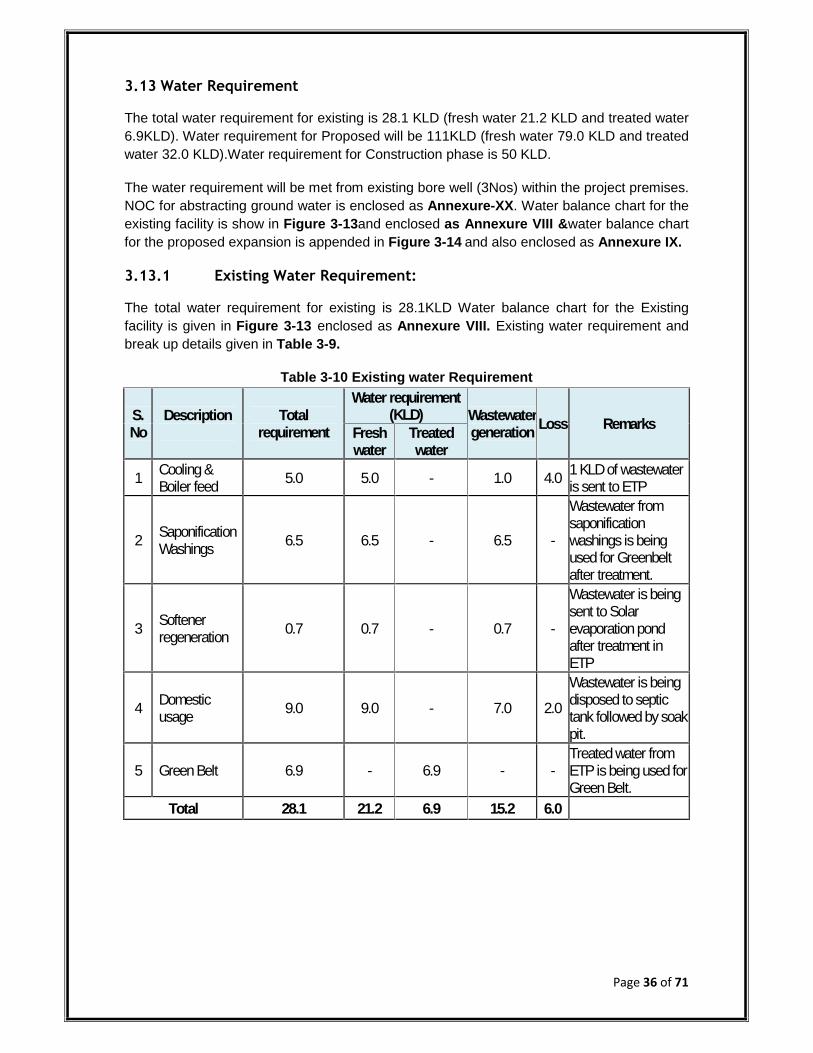
3.13 Water Requirement
The total water requirement for existing is 28.1 KLD (fresh water 21.2 KLD and treated water6.9KLD). Water requirement for Proposed will be 111KLD (fresh water 79.0 KLD and treatedwater 32.0 KLD).Water requirement for Construction phase is 50 KLD.
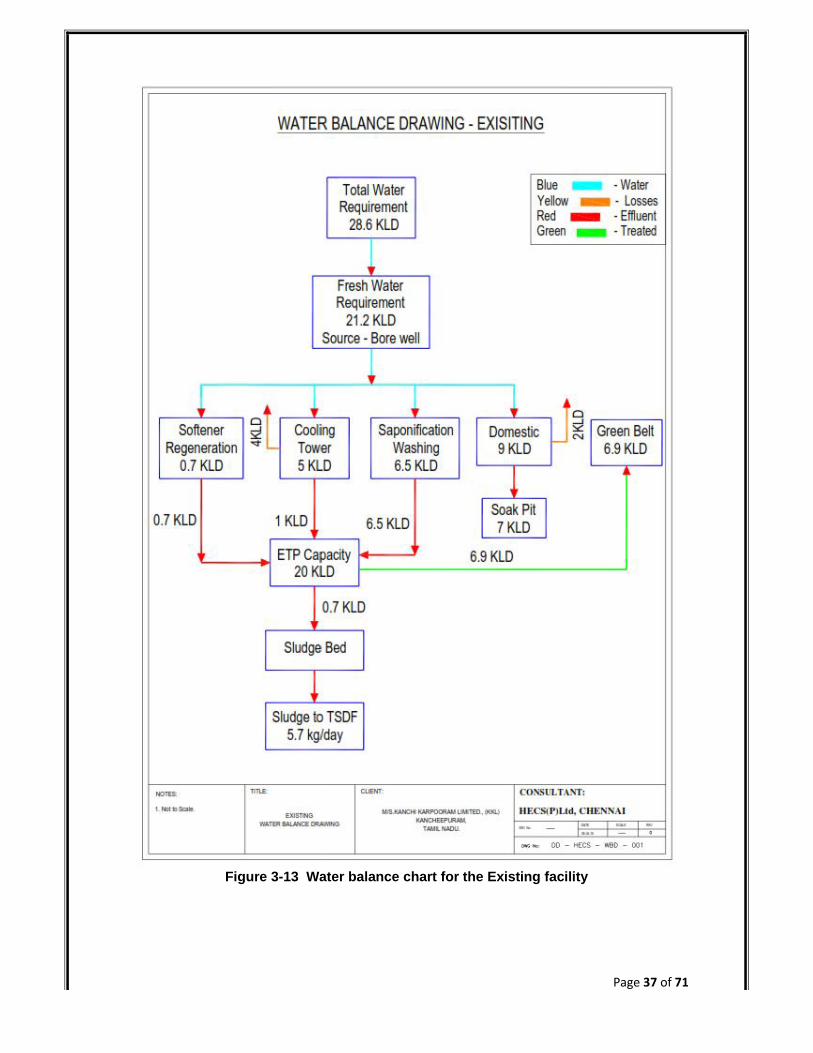
The water requirement will be met from existing bore well (3Nos) within the project premises.NOC for abstracting ground water is enclosed as Annexure-XX. Water balance chart for theexisting facility is show in Figure 3-13and enclosed as Annexure VIII &water balance chartfor the proposed expansion is appended in Figure 3-14 and also enclosed as Annexure IX.
3.13.1 Existing Water Requirement:
The total water requirement for existing is 28.1KLD Water balance chart for the Existingfacility is given in Figure 3-13 enclosed as Annexure VIII. Existing water requirement andbreak up details given in Table 3-9.
Table 3-10 Existing water Requirement
S.No
Description Totalrequirement
Water requirement(KLD) Wastewater
generation Loss RemarksFreshwater
Treatedwater
1 Cooling &Boiler feed 5.0 5.0 - 1.0 4.0 1 KLD of wastewater
is sent to ETP
2 SaponificationWashings 6.5 6.5 - 6.5 -
Wastewater fromsaponificationwashings is beingused for Greenbeltafter treatment.
3 Softenerregeneration 0.7 0.7 - 0.7 -
Wastewater is beingsent to Solarevaporation pondafter treatment inETP
4 Domesticusage 9.0 9.0 - 7.0 2.0
Wastewater is beingdisposed to septictank followed by soakpit.
5 Green Belt 6.9 - 6.9 - -Treated water fromETP is being used forGreen Belt.
Total 28.1 21.2 6.9 15.2 6.0
Page 37 of 71
Figure 3-13 Water balance chart for the Existing facility
Page 37 of 71
Figure 3-13 Water balance chart for the Existing facility
Page 37 of 71
Figure 3-13 Water balance chart for the Existing facility
Page 38 of 71
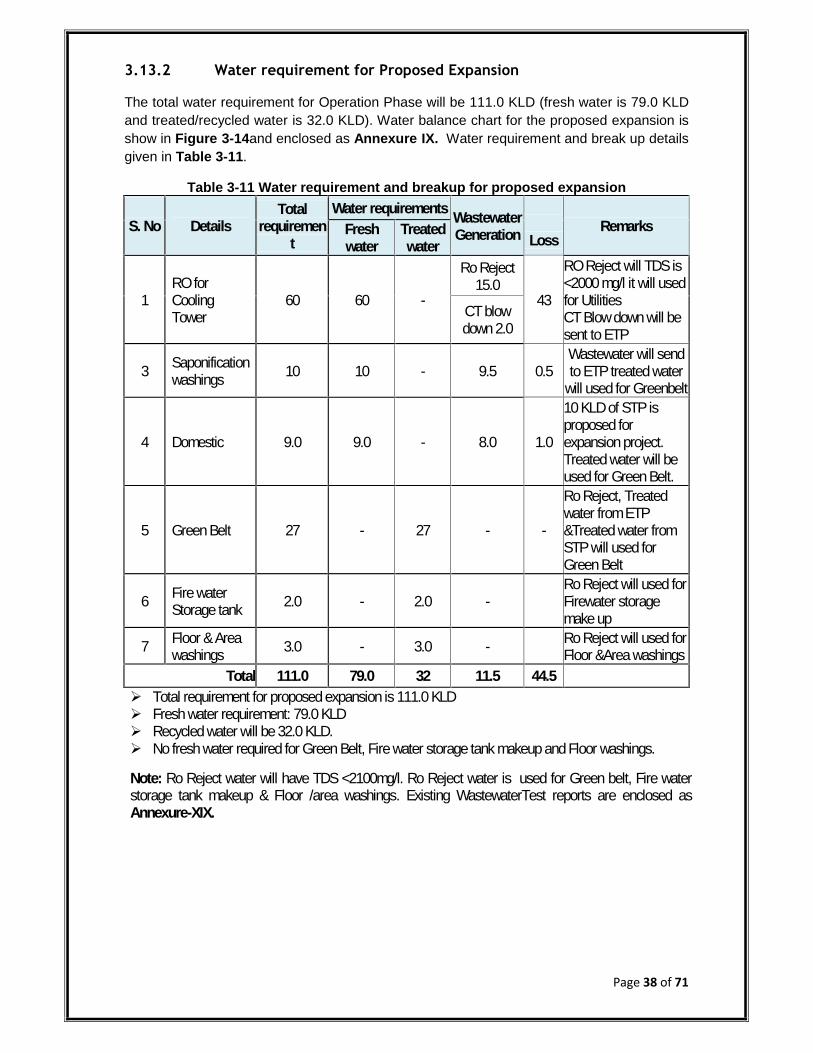
3.13.2 Water requirement for Proposed Expansion
The total water requirement for Operation Phase will be 111.0 KLD (fresh water is 79.0 KLDand treated/recycled water is 32.0 KLD). Water balance chart for the proposed expansion isshow in Figure 3-14and enclosed as Annexure IX. Water requirement and break up detailsgiven in Table 3-11.
Table 3-11 Water requirement and breakup for proposed expansion
S. No DetailsTotal
requirement
Water requirements WastewaterGeneration Loss
RemarksFreshwater
Treatedwater
1RO forCoolingTower
60 60 -
Ro Reject15.0
43
RO Reject will TDS is<2000 mg/l it will usedfor UtilitiesCT Blow down will besent to ETP
CT blowdown 2.0
3 Saponificationwashings 10 10 - 9.5 0.5
Wastewater will sendto ETP treated water
will used for Greenbelt
4 Domestic 9.0 9.0 - 8.0 1.0
10 KLD of STP isproposed forexpansion project.Treated water will beused for Green Belt.
5 Green Belt 27 - 27 - -
Ro Reject, Treatedwater from ETP&Treated water fromSTP will used forGreen Belt
6 Fire waterStorage tank 2.0 - 2.0 -
Ro Reject will used forFirewater storagemake up
7 Floor & Areawashings 3.0 - 3.0 - Ro Reject will used for
Floor &Area washingsTotal 111.0 79.0 32 11.5 44.5
Total requirement for proposed expansion is 111.0 KLD Fresh water requirement: 79.0 KLD Recycled water will be 32.0 KLD. No fresh water required for Green Belt, Fire water storage tank makeup and Floor washings.
Note: Ro Reject water will have TDS <2100mg/l. Ro Reject water is used for Green belt, Fire waterstorage tank makeup & Floor /area washings. Existing WastewaterTest reports are enclosed asAnnexure-XIX.

Page 39 of 71
Figure 3-14 Water balance chart for the proposed expansion
3.14 Liquid waste management
3.14.1 Industrial Effluent Treatment:
Industrial Effluent generation and ETP details are given in Table 3-12.
Page 39 of 71
Figure 3-14 Water balance chart for the proposed expansion
3.14 Liquid waste management
3.14.1 Industrial Effluent Treatment:
Industrial Effluent generation and ETP details are given in Table 3-12.
Page 39 of 71
Figure 3-14 Water balance chart for the proposed expansion
3.14 Liquid waste management
3.14.1 Industrial Effluent Treatment:
Industrial Effluent generation and ETP details are given in Table 3-12.

Page 40 of 71
Table 3-12Details of Sewage/Wastewater Treatment and DisposalS.No Description
Effluent (KLD) TreatmentRemarks
Existing Proposed Existing Proposed
1 Domestic 7.0 8.0 Septic TankPackage STP(10 KLDCapacity)
Treated Sewage will be used forGreen Belt
2 Ind. effluentgeneration 8.2 11.5
ETP(Capacity 40KLD)
ETP(Capacity 40KLD)
6.5 KLD is used for Green belt1.7 KLD is disposed atETP(Solar pans)
3.14.2 Existing:
o Total water requirement for existing is 28.1 KLD, sourced from existing bore wells withinthe project site.
o Cooling tower feed is 5.0 KLD. Blow down is 1.0 is being sent to dedicated EffluentTreatment Plant.
o Process washings: Saponification washings (6.5KLD)is being used for Green belt.o Softener regeneration 0.7 KLD is being sent to Solar Evaporation Ponds.o Sludge disposed as per TNPCB norms.o A domestic use is 7.0 KLD is being disposed to septic tank followed by soak pit.
3.14.3 Proposed:
o Total water requirement for Expansion is 111.0 KLD, sourced from existing bore wellwithin project premises.
o RO System feed is 60 KLDo RO Permeate water is 45 KLD it will be used for cooling tower, blow down is 2.0 KLD.RO
Reject is 15 KLD will be used for Green belt, Road/area washings& Fire water storage.o Saponification washings is 9.5 KLD will send to dedicated Effluent Treatment Plant.o 10 KLD of Packed STP is proposed for expansion project.
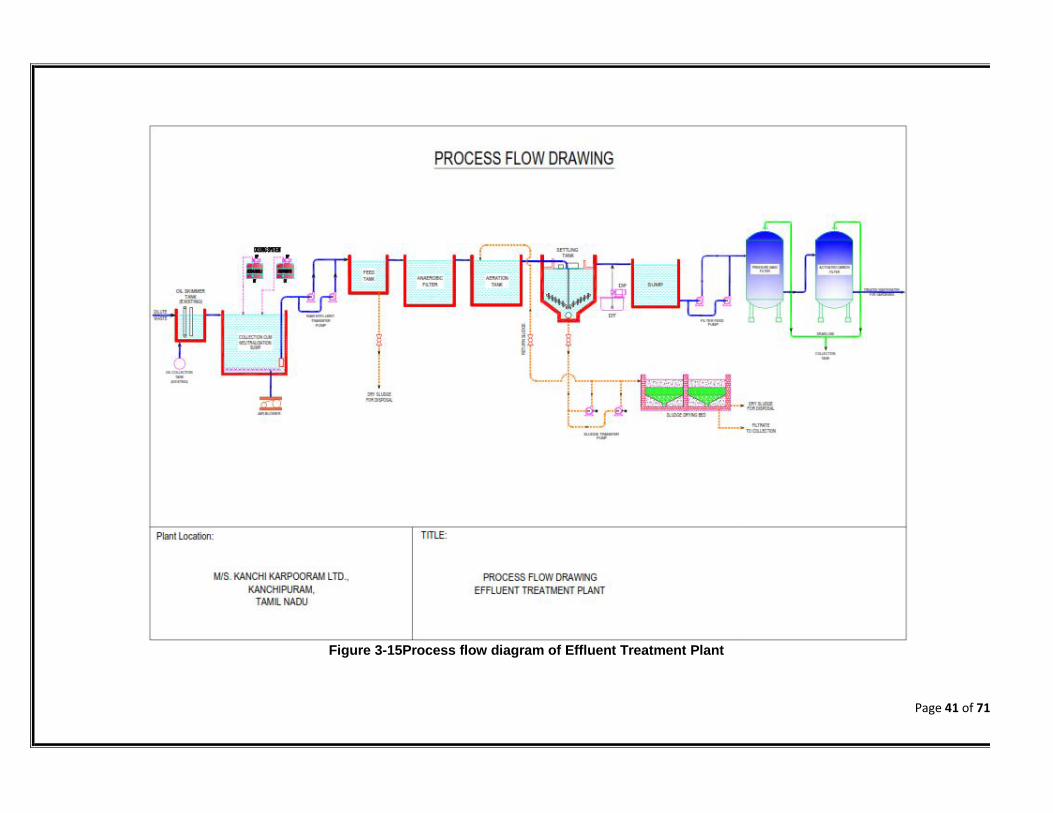
Flow diagram of Effluent Treatment Plant of the Project is shown in Figure 3-15.
Page 41 of 71
Figure 3-15Process flow diagram of Effluent Treatment Plant
Page 41 of 71
Figure 3-15Process flow diagram of Effluent Treatment Plant
Page 41 of 71
Figure 3-15Process flow diagram of Effluent Treatment Plant

Page 42 of 71
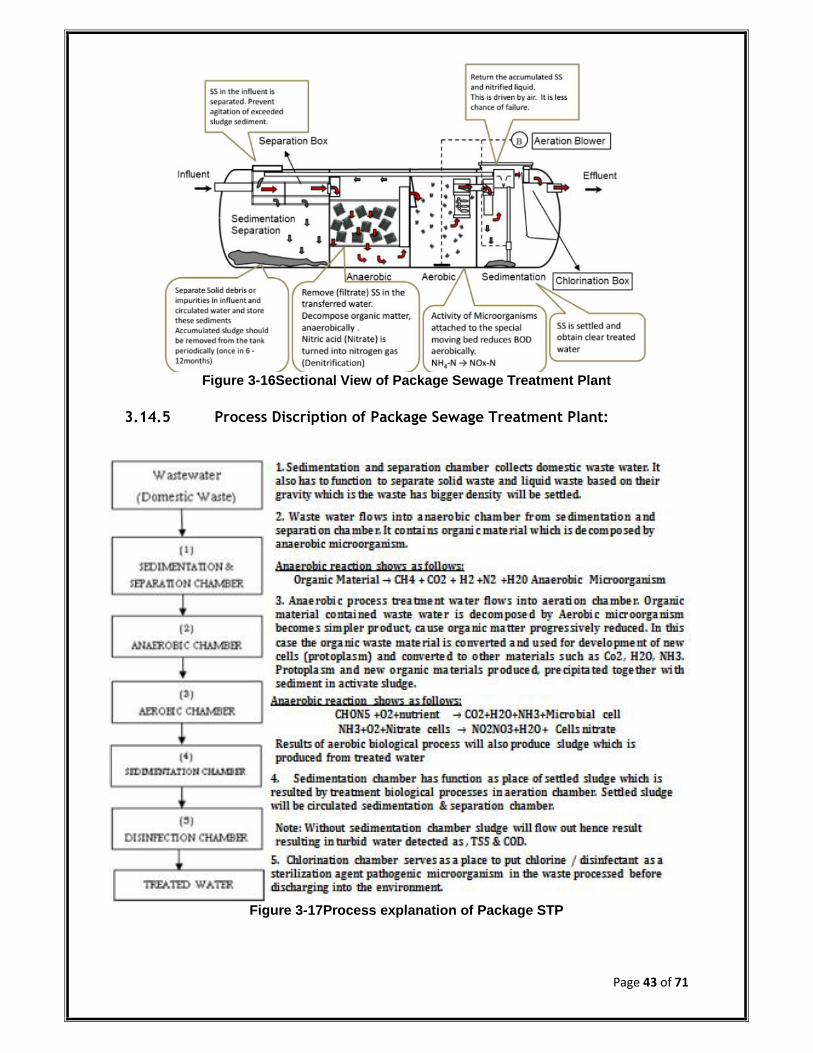
3.14.4 Domestic Wastewater Treatment
Existing domestic wastewater is being sent to septic tank fallowed by soak pit. The existingand proposed Domestic wastewater disposal details are given in Table 3-13. 10 KLDPackage STP for Proposed Expansion is summarized in Sectional view of Package SewageTreatment Plant is given in Figure 3-16.Process Description of Package Sewage TreatmentPlant is shown in Figure 3-17.
Table 3-13 Domestic Wastewater Generation and Management
S. No Description
Waterrequired forDomestic
use
WastewaterGeneration
Recycledquantity Treatment
Units Disposal
1 Existing(KLD) 9.0 7.0 -
Septic Tankfollowed by
soak pitDisposed into septic tankfollowed by soak pit
2 Proposed(KLD) 9.0 8.0 7.0 STP
Treated sewage will be usedfor green belt1.0 kg/day sludge generatedfrom STP will be used asManure for Green belt
Table 3-14 Package STP Inlet & outlet characteristics of domestic wastewater
S. No Parameter HECS-Daiki STPInlet
HECS-Daiki STPOutlet
MoEF &CCStandard
1 pH 3.0-8.0 6.0-8.0 6.5-9.02 BOD (mg/l) 300 20 <203 COD (mg/l) 500 <50 -4 TSS (mg/l) 240 <30 <505 Oil & Grease (mg/l) 40 <10 -6 T-N (mg/l) 50 <45 -
F. Coliform (MPN/100ml) 600 <100 <1000
Page 43 of 71
Figure 3-16Sectional View of Package Sewage Treatment Plant
3.14.5 Process Discription of Package Sewage Treatment Plant:
Figure 3-17Process explanation of Package STP

Page 44 of 71
3.15 Air Pollution Control Measures
1. The emissions will be SO2 and NOx where adequate stack height is provided as per theTNPCB Norms to ensure proper dispersion of these pollutants and also inbuilt acousticenclosure is provided in order to meet the National Ambient Air Quality standardsprescribed by CPCB.
2. 3.39 acres (33.14%) land is allocated for Green Belt& 68% of Green belt is beingdeveloped & maintained remaining 32% of Green Belt will be developed duringexpansion. This will mitigate the emissions.
3. Ash generation from fire wood is 8 kg/day in existing &16 kg/day after expansion. Ashfrom fire wood is also being taken by farmers to be used in their fields. Partial quantityis being used to Green belt within project.
4. The discharge of emissions from the additional air pollution sources will be passedthrough the air pollution control equipment (Stack) and discharged through stack.
5. Ambient Air quality of the premises conforms to the national ambient air qualitystandards specified in environmental (protection) rules. Existing Environmental Testreports enclosed as Annexure-XIX.
The Air Pollution Control measures are summarized in Table 3-15.
Table 3-15Air Pollution Control Measures (Existing and Proposed Expansion)
S.No Details
Capacity
APC
StackHeight
inmeters(AGL)
GaseousDischarg
e(Nm3/h)Existing Proposed After
expansion
1 DG Power Backup(kVA)
1 x 250*1 x 180
1 x 380-
1 x 3801 x 180
Stack 12 2239
Stack 7.5 1707
2 Steam Boiler(Not in Use)* T/Hr 1 x 1* - - Stack 20 6997
3 TFH (Wood FireHeater)MW/Hr
1 x 1.74 1 x 4.651 x 1.74 Stack
with Dustcollector
306997
69971 x 4.65Note: * Steam Boiler (Not in Use) will be discarded during expansion& *1x 250 DG Set(Not in Use) willbe removed during expansion
Table 3-16Fugitive & Noise Emission
S. No.Fugitive or
NoiseEmissionSources
Type ofEmission Existing Proposed After
expansionControl
measuresProposed
Stackheight inm(AGL)
1Reactors(distillationcolumns)-Nos
Acidfumes/VOC
30 0 30 Individualcondenser 30
2 DG 1(kVA) Noise 1 x 250* 1 x 380 1 x 380 Acousticenclosures 12
3 DG 2 (kVA) Noise 1 x 180 - 1 x 180 Acousticenclosures 7.5
Note: *1 x 250(Not in Use) will be removed during expansion
Page 45 of 71
3.16 Waste Management and Disposal Method
3.16.1 Municipal Solid Waste Management
3.16.1.1 Construction Phase
1. Construction waste: Reuse of construction wastes such as sand, brick, gravel, cement fordeveloping internal road and project structures.
2. Municipal waste generation during construction phase will be 9 kg/day& will be disposedas per norms.
3. No Demolitions activities are involved in this proposed project.
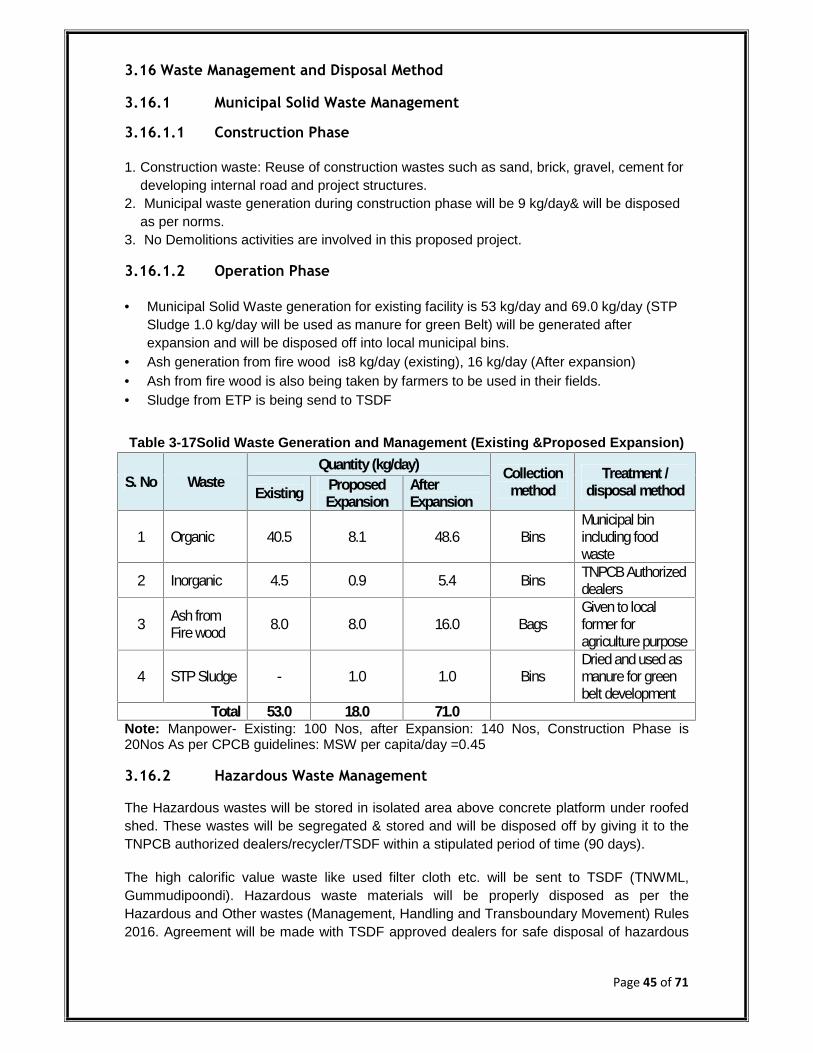
3.16.1.2 Operation Phase
Municipal Solid Waste generation for existing facility is 53 kg/day and 69.0 kg/day (STPSludge 1.0 kg/day will be used as manure for green Belt) will be generated afterexpansion and will be disposed off into local municipal bins.
Ash generation from fire wood is8 kg/day (existing), 16 kg/day (After expansion) Ash from fire wood is also being taken by farmers to be used in their fields. Sludge from ETP is being send to TSDF
Table 3-17Solid Waste Generation and Management (Existing &Proposed Expansion)
S. No WasteQuantity (kg/day) Collection
methodTreatment /
disposal methodExisting ProposedExpansion
AfterExpansion
1 Organic 40.5 8.1 48.6 BinsMunicipal binincluding foodwaste
2 Inorganic 4.5 0.9 5.4 Bins TNPCB Authorizeddealers
3 Ash fromFire wood 8.0 8.0 16.0 Bags
Given to localformer foragriculture purpose
4 STP Sludge - 1.0 1.0 BinsDried and used asmanure for greenbelt development
Total 53.0 18.0 71.0Note: Manpower- Existing: 100 Nos, after Expansion: 140 Nos, Construction Phase is20Nos As per CPCB guidelines: MSW per capita/day =0.45
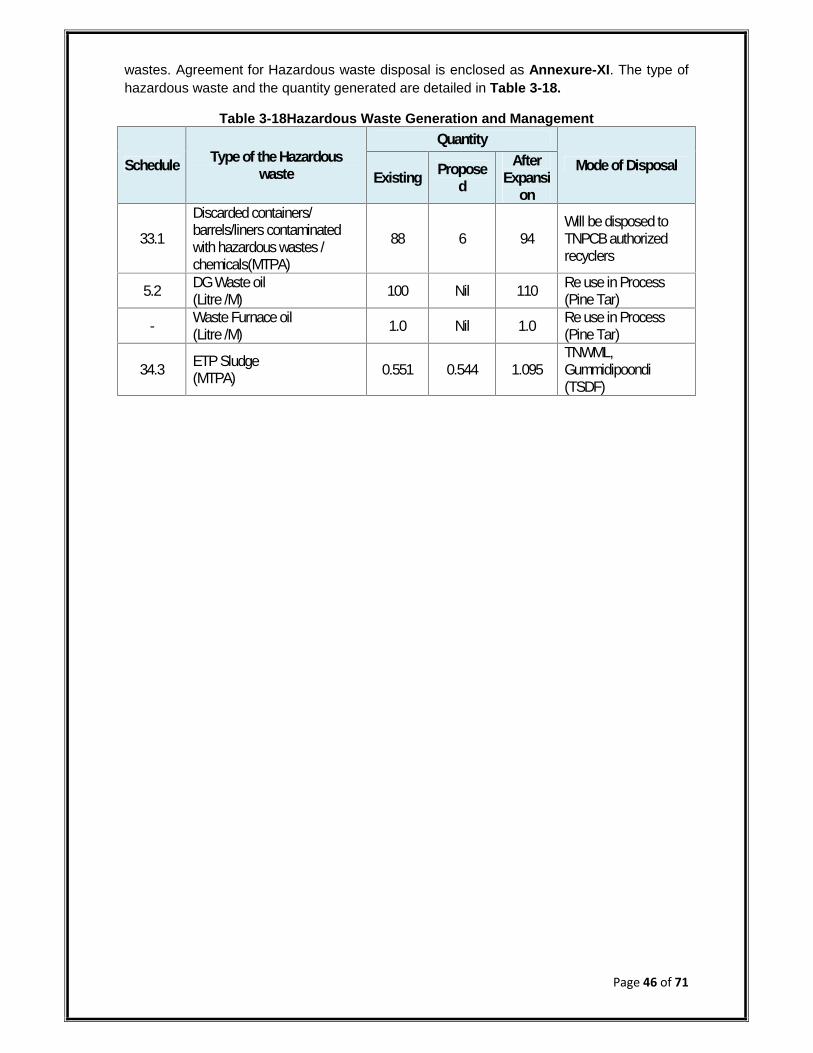
3.16.2 Hazardous Waste Management
The Hazardous wastes will be stored in isolated area above concrete platform under roofedshed. These wastes will be segregated & stored and will be disposed off by giving it to theTNPCB authorized dealers/recycler/TSDF within a stipulated period of time (90 days).
The high calorific value waste like used filter cloth etc. will be sent to TSDF (TNWML,Gummudipoondi). Hazardous waste materials will be properly disposed as per theHazardous and Other wastes (Management, Handling and Transboundary Movement) Rules2016. Agreement will be made with TSDF approved dealers for safe disposal of hazardous
Page 46 of 71
wastes. Agreement for Hazardous waste disposal is enclosed as Annexure-XI. The type ofhazardous waste and the quantity generated are detailed in Table 3-18.
Table 3-18Hazardous Waste Generation and Management
Schedule Type of the Hazardouswaste
QuantityMode of Disposal
Existing Proposed
AfterExpansi
on
33.1Discarded containers/barrels/liners contaminatedwith hazardous wastes /chemicals(MTPA)
88 6 94Will be disposed toTNPCB authorizedrecyclers
5.2 DG Waste oil(Litre /M) 100 Nil 110 Re use in Process
(Pine Tar)
- Waste Furnace oil(Litre /M) 1.0 Nil 1.0 Re use in Process
(Pine Tar)
34.3 ETP Sludge(MTPA) 0.551 0.544 1.095
TNWML,Gummidipoondi(TSDF)
Page 47 of 71
4 SITE ANALYSIS
4.1 Connectivity
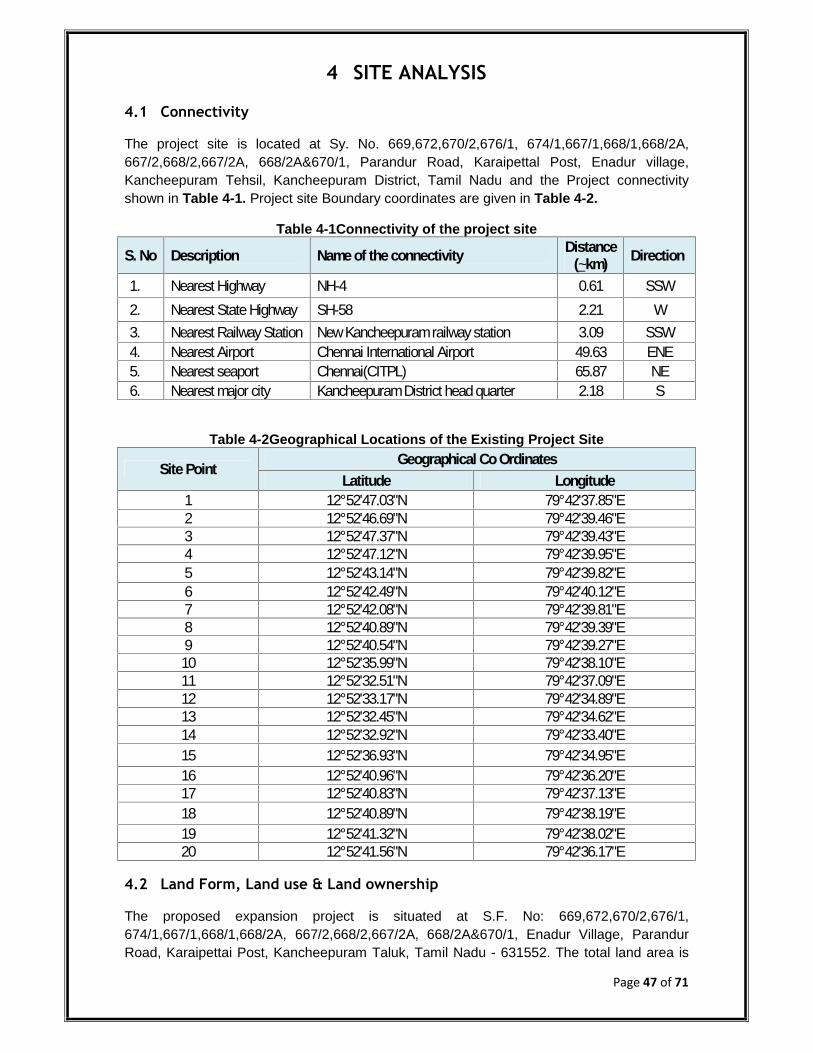
The project site is located at Sy. No. 669,672,670/2,676/1, 674/1,667/1,668/1,668/2A,667/2,668/2,667/2A, 668/2A&670/1, Parandur Road, Karaipettal Post, Enadur village,Kancheepuram Tehsil, Kancheepuram District, Tamil Nadu and the Project connectivityshown in Table 4-1. Project site Boundary coordinates are given in Table 4-2.
Table 4-1Connectivity of the project site
S. No Description Name of the connectivity Distance(~km) Direction
1. Nearest Highway NH-4 0.61 SSW2. Nearest State Highway SH-58 2.21 W3. Nearest Railway Station New Kancheepuram railway station 3.09 SSW4. Nearest Airport Chennai International Airport 49.63 ENE5. Nearest seaport Chennai(CITPL) 65.87 NE6. Nearest major city Kancheepuram District head quarter 2.18 S
Table 4-2Geographical Locations of the Existing Project Site
Site Point Geographical Co OrdinatesLatitude Longitude
1 12°52'47.03"N 79°42'37.85"E2 12°52'46.69"N 79°42'39.46"E3 12°52'47.37"N 79°42'39.43"E4 12°52'47.12"N 79°42'39.95"E5 12°52'43.14"N 79°42'39.82"E6 12°52'42.49"N 79°42'40.12"E7 12°52'42.08"N 79°42'39.81"E8 12°52'40.89"N 79°42'39.39"E9 12°52'40.54"N 79°42'39.27"E10 12°52'35.99"N 79°42'38.10"E11 12°52'32.51"N 79°42'37.09"E12 12°52'33.17"N 79°42'34.89"E13 12°52'32.45"N 79°42'34.62"E14 12°52'32.92"N 79°42'33.40"E15 12°52'36.93"N 79°42'34.95"E16 12°52'40.96"N 79°42'36.20"E17 12°52'40.83"N 79°42'37.13"E18 12°52'40.89"N 79°42'38.19"E19 12°52'41.32"N 79°42'38.02"E20 12°52'41.56"N 79°42'36.17"E
4.2 Land Form, Land use & Land ownership
The proposed expansion project is situated at S.F. No: 669,672,670/2,676/1,674/1,667/1,668/1,668/2A, 667/2,668/2,667/2A, 668/2A&670/1, Enadur Village, ParandurRoad, Karaipettai Post, Kancheepuram Taluk, Tamil Nadu - 631552. The total land area is
Page 48 of 71
6.95 acres located at ~2.18 km (South) away from District headquarter is Kancheepuram.Land ownership documents enclosed as Annexure I. The project site area is allotted forindustrial use GOs (GO. No 526, 704& Lt No.998/2017) obtained from Govt. of Tamil Naduis enclosed as Annexure II. Land conversion GOs for existing land are enclosed asAnnexure –II. Newly acquired land for proposed expansion is categorized as a porambokeland& applied for Patta from concern departments. Existing & Proposed Land ownershipdocument are enclosed as Annexure-I &Annexure-IA respectively.
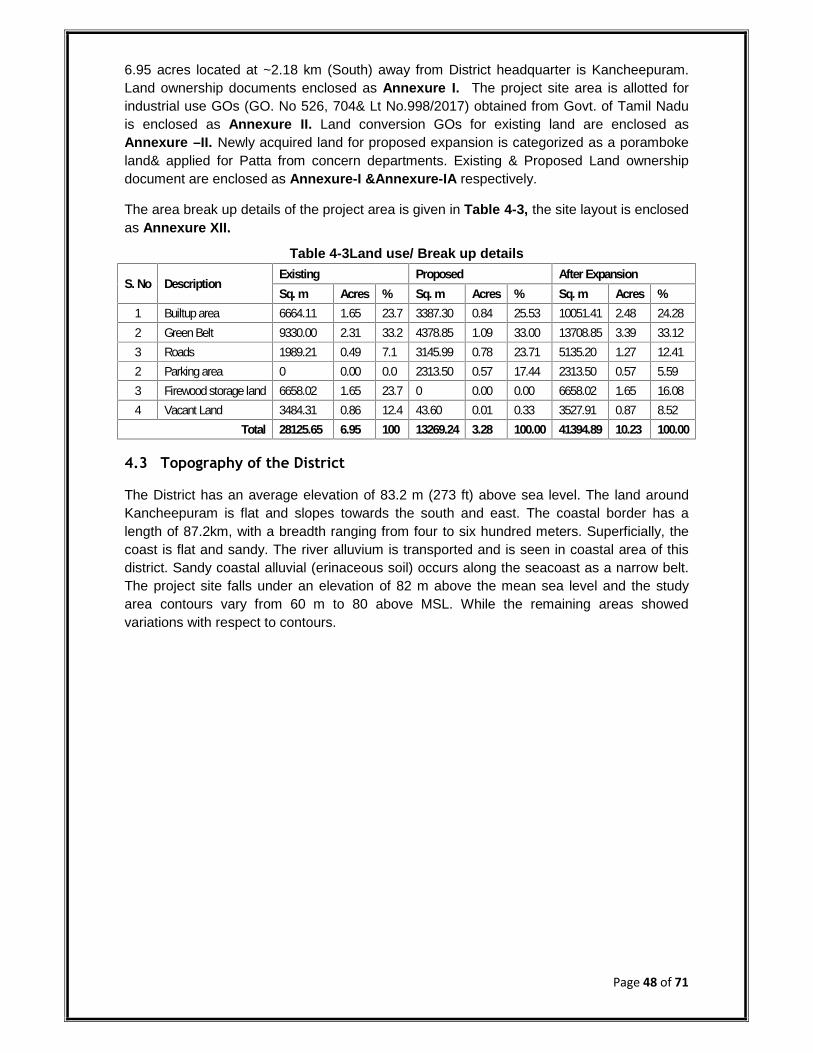
The area break up details of the project area is given in Table 4-3, the site layout is enclosedas Annexure XII.
Table 4-3Land use/ Break up details
S. No DescriptionExisting Proposed After ExpansionSq. m Acres % Sq. m Acres % Sq. m Acres %
1 Builtup area 6664.11 1.65 23.7 3387.30 0.84 25.53 10051.41 2.48 24.282 Green Belt 9330.00 2.31 33.2 4378.85 1.09 33.00 13708.85 3.39 33.123 Roads 1989.21 0.49 7.1 3145.99 0.78 23.71 5135.20 1.27 12.412 Parking area 0 0.00 0.0 2313.50 0.57 17.44 2313.50 0.57 5.593 Firewood storage land 6658.02 1.65 23.7 0 0.00 0.00 6658.02 1.65 16.084 Vacant Land 3484.31 0.86 12.4 43.60 0.01 0.33 3527.91 0.87 8.52
Total 28125.65 6.95 100 13269.24 3.28 100.00 41394.89 10.23 100.00
4.3 Topography of the District
The District has an average elevation of 83.2 m (273 ft) above sea level. The land aroundKancheepuram is flat and slopes towards the south and east. The coastal border has alength of 87.2km, with a breadth ranging from four to six hundred meters. Superficially, thecoast is flat and sandy. The river alluvium is transported and is seen in coastal area of thisdistrict. Sandy coastal alluvial (erinaceous soil) occurs along the seacoast as a narrow belt.The project site falls under an elevation of 82 m above the mean sea level and the studyarea contours vary from 60 m to 80 above MSL. While the remaining areas showedvariations with respect to contours.
Page 49 of 71
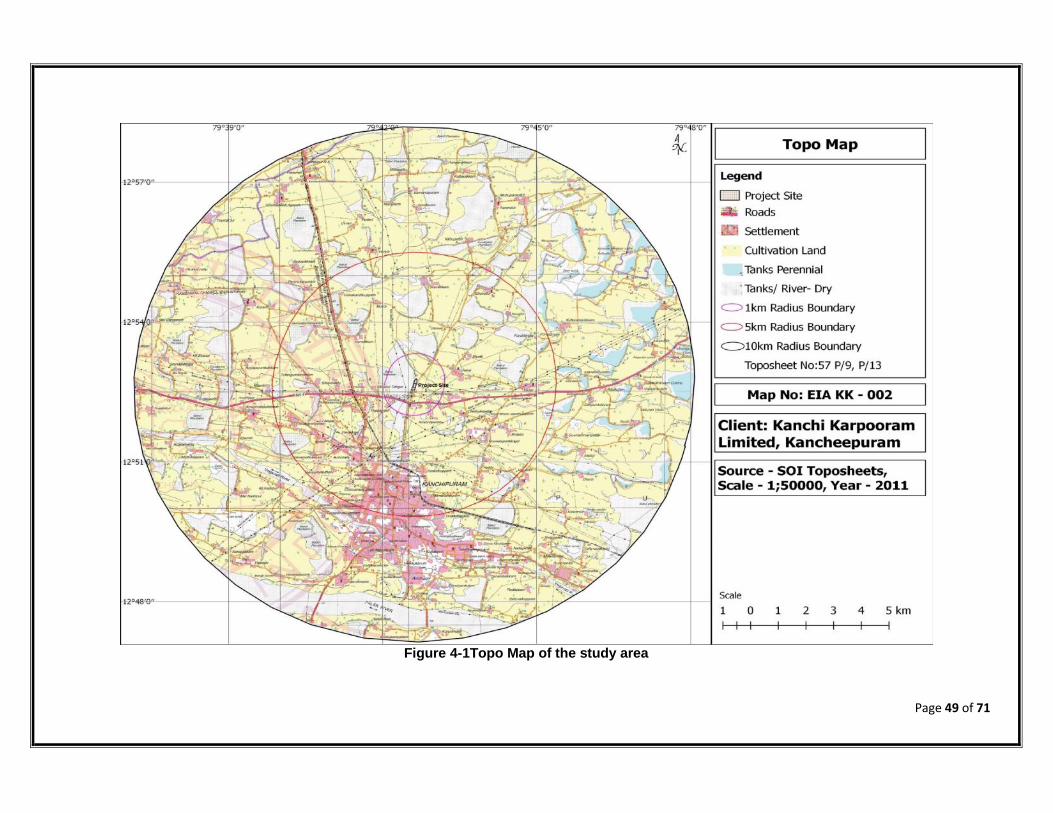
Figure 4-1Topo Map of the study area
Page 50 of 71
4.3.1 Geomorphology of PIA District
In general, land around Kancheepuram district is flat with average elevation of 83.2 m (273ft) above sea level. The prominent geomorphic units identified in the district throughinterpretation of satellite imagery are i) Chengalput-Tirukkalukkunram Surface (Erosional) ii)Palar Surface (fluvial) and iii) Mamallapuram (Mahabalipuram) surface (Marina) etc.
The coastal plain extends as a narrow stretch for about 87.2 km along the Bay of Bengal.The coastal plain displays a fairly low level or gently rolling surface and only slightly elevatedabove the local water surfaces on rivers. The coastal landforms include estuarine tidal, mudflats or lagoons and salt marsh etc.
Top map of the proposed project site is given in Figure 4-1.1.0Km radius Satellite Image ofproject site is shown in Figure 3-6, 5.0 km radius satellite image of the project site is shownin Figure 3-5and 10.0 km radius satellite image of the project site is given in Figure 3-4.
4.4 Existing Land use Pattern
The land use of the Existing project area is for industrial use hence there will be no changein land use pattern. Land conversion GOs for existing land are enclosed as Annexure –II.Newly acquired land for proposed expansion is categorized as a poramboke land& appliedfor Patta from concern departments. Existing & Proposed Land ownership document areenclosed as Annexure-I &Annexure-IA respectively.
4.5 Environmental Sensitivity of the Project site within 15 km radius
Environmental Sensitivity areas of the project site within the 15 Km radius of the project siteare summarized in Table 4-4.
Table 4-4 Environmental Sensitivity and Features of the Project Site within 15kmradius
S.No. Particulars Details1. Site Co-ordinates of
the project site1)Plant area: 12°52'38.59"N; 79°42'37.27"E2)Green belt and Firewood area: 12°52'43.41"N;79°42'38.41"E3) Proposed land : 12°52'34.79"N 79°42'35.81"E
2. Elevation 82 m MSL3. Present land use Industrial use as per GO No.526,704& Lts No.998/2017(New land)4. Nearest Highway NH4 ~ 0.61 Km (SSW)5. Nearest railway
StationNew Kancheepuram railway station ~3.09-SSW
6. Nearest Airport Chennai International Airport ~ 49.63 km(ENE)7. Nearest village Kancheepuram District head quarter~ 2.18km(S)8. Nearest major city Kancheepuram District head quarter~ 2.18km(S)9. Type of soil Silty sand with gravel10. Nearest seaport Chennai(CITPL)~ 65.87 Km (NE)11. Defense
InstallationsNil within 15 km radius
12. Nearest Town Kancheepuram District head quarter~ 2.18km(S)13. Nearest River/
Lakes/DamsS. No Name of the Location Distance(~km) Direction
Rivers1 Palar river 8.27 SSW

Page 51 of 71
S.No. Particulars Details
2 Vegavati river 5.39 SWLakes
1. Tamarai Tangal 0.02 W2. Tonneri Tank 12.06 E3. Kaveripak N 14.47 WSW4. Pamba Kalvai 4.07 NNW5. Nathapettai lake 4.92 SE6. Mamandur Tank 12.62 SSW
14. Hills & valleys Nil within 15 Km radius of the project15. Routes or facilities
used by the publicfor access torecreation or othertourist, pilgrimareas &ArcheologicallyImportant Places/Tourist/Religiousimportance
Monuments:
S. No Name of the Monuments Distance (~km) Direction1. Kailasanathar Temple 4.25 SW2. Vaikuntaperumal Temple 4.28 SSE3. Piravathanesvara Temple 3.37 S4. Iravathanesvara Temple 3.39 S5. Muktesvara Temple 4.15 SSW6. Mathangesvara Temple 4.41 S
2. Areas occupied bysensitive man-made land uses(hospitals, schools,places of worship,communityfacilities)
Places of worships :S. No Places of worships (~)Distance Direction
1. Sri Manikandeswara Swamy Temple 9.95 NW2. Najma - Masjid 10.12 W3. Sri Vijaya Raghava Perumal temple 9.98 W4. Ekambareswarar Temple 3.18 SSW5. Sri Pachai Vanna Perumal Temple 3.49 S6. Sri Pavala Vanna Perumal Temple 3.53 S7. Kailasanathar Temple 4.25 SW8. Pandavar Perumal Temple 3.87 SSW9. Jurahareswar Temple 3.87 SSW10. Kamachi Amman Temple 3.84 S11. Ulagalantha Perumal Temple 4.05 S12. Kachabeswarar Temple 4.21 S13. TMN Temple 4.89 SSW14. Perinba Prayer House 5.55 SW15. Bodhidharma Temple 4.42 SSE16. Sathyanateswarar Temple 5.21 SSE17. Perumal Temple 5.63 S18. Jerusalem Workship 6.31 SSW19. Panadudeeswarar Temple 5.97 S20. Thiruvelakai Temple 5.91 S21. Manikandeswar Temple 5.95 SSE22. Narashima Temple 7.85 SSW23. Sri Varadharaja Perumal Temple 6.37 SSE24. Punniyakodeswarar Temple 6.57 SSE25. Mosque 10.74 SSW26. Thalapureeswarar Temple 13.31 SW27. Rani Amman Temple 10.35 SE28. Sri Ashtabujangaram Temple 5.85 S29. Punadudeeswarar Temple 5.95 SSW30. Govimthavadi Temple 8.67 NW
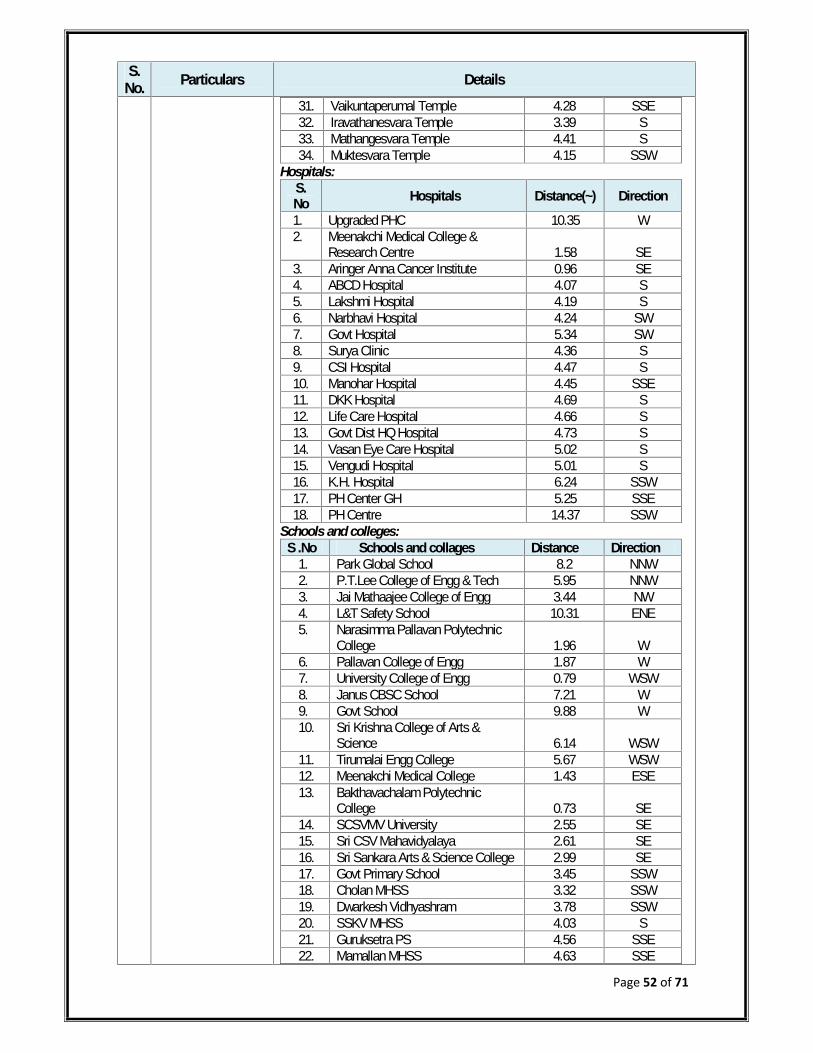
Page 52 of 71
S.No. Particulars Details
31. Vaikuntaperumal Temple 4.28 SSE32. Iravathanesvara Temple 3.39 S33. Mathangesvara Temple 4.41 S34. Muktesvara Temple 4.15 SSW
Hospitals:S.No Hospitals Distance(~) Direction1. Upgraded PHC 10.35 W2. Meenakchi Medical College &
Research Centre 1.58 SE3. Aringer Anna Cancer Institute 0.96 SE4. ABCD Hospital 4.07 S5. Lakshmi Hospital 4.19 S6. Narbhavi Hospital 4.24 SW7. Govt Hospital 5.34 SW8. Surya Clinic 4.36 S9. CSI Hospital 4.47 S10. Manohar Hospital 4.45 SSE11. DKK Hospital 4.69 S12. Life Care Hospital 4.66 S13. Govt Dist HQ Hospital 4.73 S14. Vasan Eye Care Hospital 5.02 S15. Vengudi Hospital 5.01 S16. K.H. Hospital 6.24 SSW17. PH Center GH 5.25 SSE18. PH Centre 14.37 SSW
Schools and colleges:S .No Schools and collages Distance Direction
1. Park Global School 8.2 NNW2. P.T.Lee College of Engg & Tech 5.95 NNW3. Jai Mathaajee College of Engg 3.44 NW4. L&T Safety School 10.31 ENE5. Narasimma Pallavan Polytechnic
College 1.96 W6. Pallavan College of Engg 1.87 W7. University College of Engg 0.79 WSW8. Janus CBSC School 7.21 W9. Govt School 9.88 W10. Sri Krishna College of Arts &
Science 6.14 WSW11. Tirumalai Engg College 5.67 WSW12. Meenakchi Medical College 1.43 ESE13. Bakthavachalam Polytechnic
College 0.73 SE14. SCSVMV University 2.55 SE15. Sri CSV Mahavidyalaya 2.61 SE16. Sri Sankara Arts & Science College 2.99 SE17. Govt Primary School 3.45 SSW18. Cholan MHSS 3.32 SSW19. Dwarkesh Vidhyashram 3.78 SSW20. SSKV MHSS 4.03 S21. Guruksetra PS 4.56 SSE22. Mamallan MHSS 4.63 SSE

Page 53 of 71
S.No. Particulars Details
23. Kanchi Global School 4.56 SSW24. Govt. School 6.06 SSW25. Sanskrit College 6.31 SSW26. Aadura Spl School 6.73 S27. Pachaiappas Womens College 6.13 S28. Bharathidasan MHSS 7.68 SSW29. Govt MS 7.67 SE30. Pachaiappas College for Men 7.42 SE31. Govt HSS 8.99 SE32. JSN School of Management 10.04 S33. Dusi Polytechnic College 10.75 S34. Kanchi Pallavan Engg College 11.64 SSW35. AMA College of Engg 13.38 SW36. Govt HS 14.29 SSW
Common placesS. No Common places Distance(~) Direction
1. AJS Kalyana Mahal 6.32 WSW2. Railway Station, Kanchipuram 2.99 S3. East Railwaystation, Kanchipuram 3.78 SSE4. Police Station 3.44 S5. Sringeri Saradha Peetam Kalyana
Mandapam 3.73 SSW6. Sub Post Office 4.22 SSW7. Taluk Police Station 4.65 S8. District Sports Stadium 4.76 SSE9. Head Post Office 4.83 S10. Taluk Office 5.53 S11. District Collector Office 5.87 S12. S.P. Office 6.1 S13. DIG Office 6.46 SSW14. Walajabad Railway Station 14.57 SE15. Anna Memorial House 6.26 SSE
4. Ecologicallysensitive areas(NationalParks/Wild Lifesanctuaries/BioSphere reserves)
S. No Name of the Location Distance (~) DirectionRivers
1 Palar river 8.27 SSW2 Vegavati river 5.39 SW
Lakes1. Tamarai Tangal 0.02 W2. Tonneri Tank 12.06 E3. Kaveripak N 14.47 WSW4. Pamba Kalvai 4.07 NNW5. Nathapettai lake 4.92 SE6. Mamandur Tank 12.62 SSW
5. Reserved/ProtectedForests within15Km radius
Nil within 15 km of the project site
6. Areas susceptibleto natural hazardwhich could causethe project topresent
The area comes under seismic Zone-III (Moderate Risk). There is nosusceptible to natural hazards like subsidence, landslides, erosion,flooding or extreme or adverse climatic conditions.Note :Seismic Zone-II : Low risk

Page 54 of 71
S.No. Particulars Details
environmentalproblems(earthquakes,subsidence,landslides,erosion, flooding
or extreme oradverse climaticconditions)
Seismic Zone-III : Moderate RiskSeismic Zone-IV : High RiskSeismic Zone-V Very high Risk
4.6 Land use pattern of the Study Area
Total project study Area is 324.8 Sq.km. Land Use /Land Cover statistics of 10km radius ofthe Study Area is given in Table 4-5. Land use Land Pattern of the Project Study Areashown in Figure 4-2.LULC map of the Study area is given in Figure 4-3.
Table 4-5Land Use/Land Cover statistics of 10 km radius of the Study Area
Description Total Project Study Area: 324.8 Sq.Km% Sq. Km Acre Ha.
Cropland 44.25 143.71 35511.46 14371Fallow land 24.18 78.55 19410.10 7855Reservoirs/ Lakes/ Ponds 20.71 67.27 16622.75 6727River/ Stream/ Canals 3.30 10.73 2651.44 1073Urban 3.49 11.34 2802.17 1134Rural 2.13 6.91 1707.50 691Scrub land 0.82 2.66 657.30 266Salt affected land 0.33 1.07 264.40 107Plantation 0.18 0.59 145.79 59Sandy Area 0.14 0.47 116.14 47Mining 0.46 0.15 370.66 150
Total 100 324.8 80259.704 32480
Figure 4-2 Land use Land Pattern of the Project Study Area
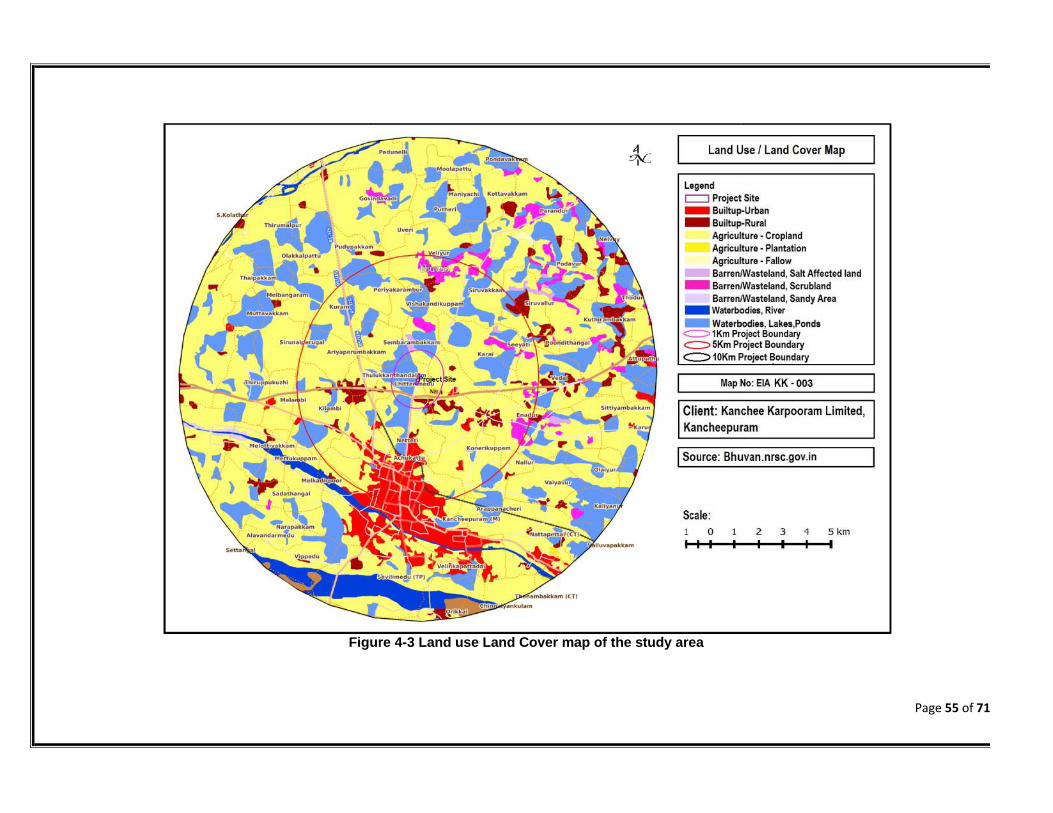
Page 55 of 71
Figure 4-3 Land use Land Cover map of the study area
Page 55 of 71
Figure 4-3 Land use Land Cover map of the study area
Page 55 of 71
Figure 4-3 Land use Land Cover map of the study area
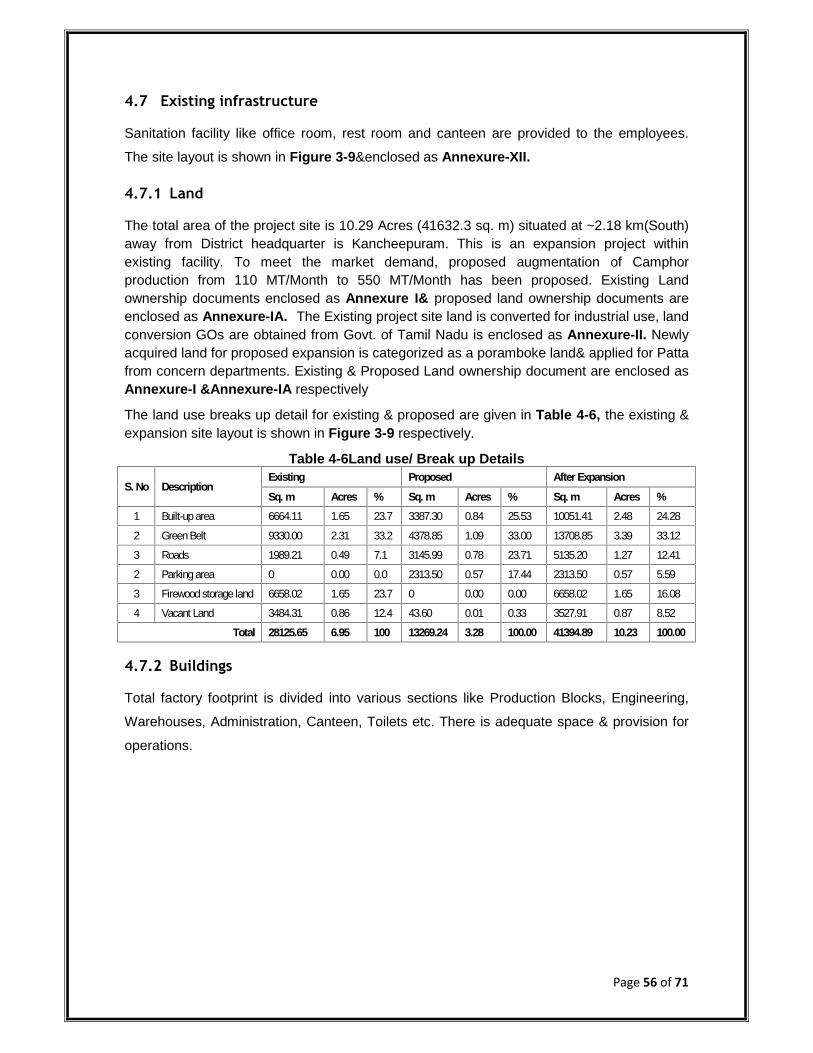
Page 56 of 71
4.7 Existing infrastructure
Sanitation facility like office room, rest room and canteen are provided to the employees.
The site layout is shown in Figure 3-9&enclosed as Annexure-XII.
4.7.1 Land
The total area of the project site is 10.29 Acres (41632.3 sq. m) situated at ~2.18 km(South)away from District headquarter is Kancheepuram. This is an expansion project withinexisting facility. To meet the market demand, proposed augmentation of Camphorproduction from 110 MT/Month to 550 MT/Month has been proposed. Existing Landownership documents enclosed as Annexure I& proposed land ownership documents areenclosed as Annexure-IA. The Existing project site land is converted for industrial use, landconversion GOs are obtained from Govt. of Tamil Nadu is enclosed as Annexure-II. Newlyacquired land for proposed expansion is categorized as a poramboke land& applied for Pattafrom concern departments. Existing & Proposed Land ownership document are enclosed asAnnexure-I &Annexure-IA respectively
The land use breaks up detail for existing & proposed are given in Table 4-6, the existing &expansion site layout is shown in Figure 3-9 respectively.
Table 4-6Land use/ Break up Details
S. No DescriptionExisting Proposed After ExpansionSq. m Acres % Sq. m Acres % Sq. m Acres %
1 Built-up area 6664.11 1.65 23.7 3387.30 0.84 25.53 10051.41 2.48 24.282 Green Belt 9330.00 2.31 33.2 4378.85 1.09 33.00 13708.85 3.39 33.123 Roads 1989.21 0.49 7.1 3145.99 0.78 23.71 5135.20 1.27 12.412 Parking area 0 0.00 0.0 2313.50 0.57 17.44 2313.50 0.57 5.593 Firewood storage land 6658.02 1.65 23.7 0 0.00 0.00 6658.02 1.65 16.084 Vacant Land 3484.31 0.86 12.4 43.60 0.01 0.33 3527.91 0.87 8.52
Total 28125.65 6.95 100 13269.24 3.28 100.00 41394.89 10.23 100.00
4.7.2 Buildings
Total factory footprint is divided into various sections like Production Blocks, Engineering,
Warehouses, Administration, Canteen, Toilets etc. There is adequate space & provision for
operations.
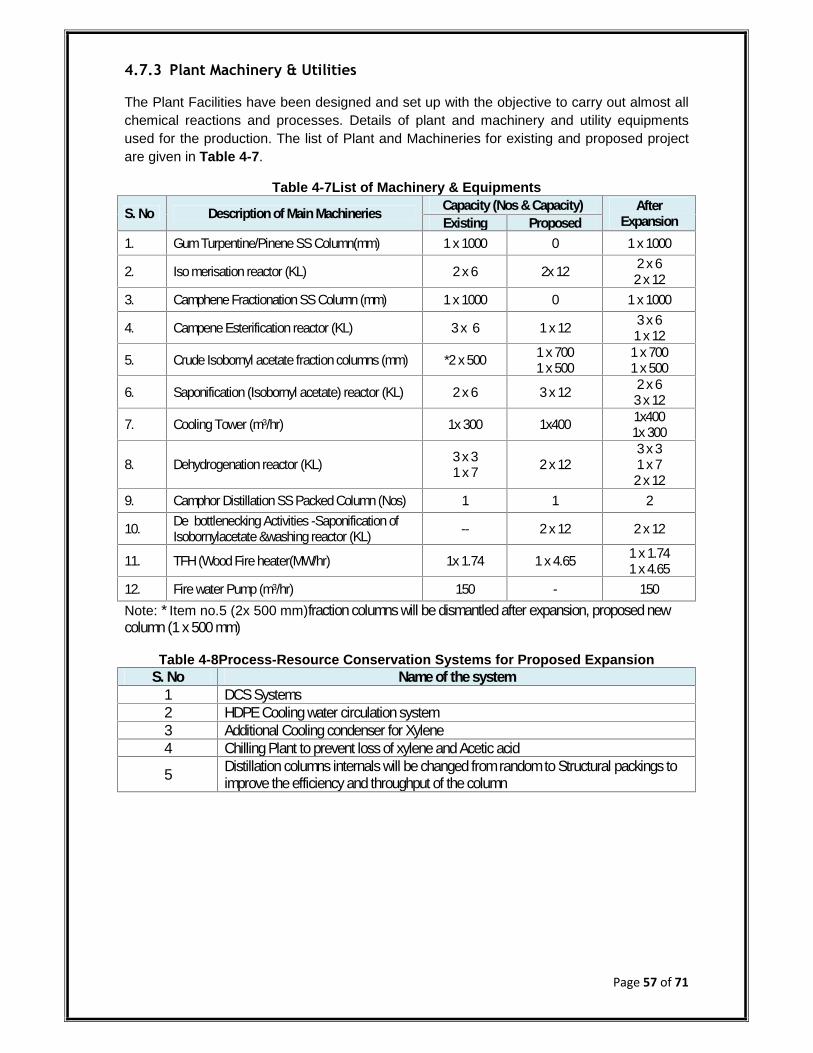
Page 57 of 71
4.7.3 Plant Machinery & Utilities
The Plant Facilities have been designed and set up with the objective to carry out almost allchemical reactions and processes. Details of plant and machinery and utility equipmentsused for the production. The list of Plant and Machineries for existing and proposed projectare given in Table 4-7.
Table 4-7List of Machinery & Equipments
S. No Description of Main Machineries Capacity (Nos & Capacity) AfterExpansionExisting Proposed
1. Gum Turpentine/Pinene SS Column(mm) 1 x 1000 0 1 x 1000
2. Iso merisation reactor (KL) 2 x 6 2x 12 2 x 62 x 12
3. Camphene Fractionation SS Column (mm) 1 x 1000 0 1 x 1000
4. Campene Esterification reactor (KL) 3 x 6 1 x 12 3 x 61 x 12
5. Crude Isobornyl acetate fraction columns (mm) *2 x 500 1 x 7001 x 500
1 x 7001 x 500
6. Saponification (Isobornyl acetate) reactor (KL) 2 x 6 3 x 12 2 x 63 x 12
7. Cooling Tower (m3/hr) 1x 300 1x400 1x4001x 300
8. Dehydrogenation reactor (KL) 3 x 31 x 7 2 x 12
3 x 31 x 7
2 x 129. Camphor Distillation SS Packed Column (Nos) 1 1 2
10. 1De bottlenecking Activities -Saponification ofIsobornylacetate &washing reactor (KL) -- 2 x 12 2 x 12
11. TFH (Wood Fire heater(MW/hr) 1x 1.74 1 x 4.65 1 x 1.741 x 4.65
12. Fire water Pump (m3/hr) 150 - 150Note: * Item no.5 (2x 500 mm)fraction columns will be dismantled after expansion, proposed newcolumn (1 x 500 mm)
Table 4-8Process-Resource Conservation Systems for Proposed ExpansionS. No Name of the system
1 DCS Systems2 HDPE Cooling water circulation system3 Additional Cooling condenser for Xylene4 Chilling Plant to prevent loss of xylene and Acetic acid
5 Distillation columns internals will be changed from random to Structural packings toimprove the efficiency and throughput of the column

Page 58 of 71
4.7.4 Fire &Safety System
Table 4-9 Fire &Safety Systems for Existing and ProposedS. No Name of the equipment Qty(Nos)
1 Fire Extinguishers 502 Sand Buckets 1003 Sand pits 5.04 Fire Hydrant Points 105 Fire Hydrant Pumps 150m3/hr6 Fire Hose(30M) REEL 107 First Aid 28 Fire siren alarm(Electrical) 29 Fire Alarm(Manual Bell) 110 Water storage tank 1 150m3 underground sump11 Water storage tank 2 30 m3 underground sump
Figure 4-4 Existing Fire Hydrant System
4.7.5 Rain water harvestingand ground water recharging
The rain water harvesting was developed and maintained as per norms. 3 Nos of Rainwaterharvesting tanks are constructed in 40.84 m2 of area within the project site. Plant layout isshown in Figure 3-9.Rainwater harvesting is an important component of wise resource useand environmental management. The total amount/quantity of water i.e., received in the formof rainfall over an area is called the rain water endowment of that area, out of which theamount of water that can be effectively harvested is called the rain water harvesting

Page 59 of 71
potential. The collection efficiency accounts for the fact that all the rain water falling over anarea cannot be effectively harvested due to losses on account of evaporation, spillage or runoff etc.,
4.8 Soil Classification
Soils have been classified into 1) clayey soil, 2) red sandy or red loamy soil 3) Red sandybrown clayey soil and 4) Alluvial soil. Of the above soils, brown clayey soil is the mostpredominant, covering more than 71 percent of the areal extent of Kancheepuram district.Alluvial soils are found on the banks of Palar, Cheyyar and other rivers. The river alluvium istransported and is seen in coastal area of this district. Sandy coastal alluvial (arenacioussoil) occurs along the seacoast as a narrow belt)
4.9 Climatic data from Secondary sources
Kancheepuram is located in coastal area the climate here is warm and humid all through theyear. The summer temperature ranges between 23.5° to 38.0°Cwith dry and clear blue sky.The summer season of Kancheepuram is generally expected from March to May and it is themost predominant season. Kancheepuram district receive little rainfall from South westmonsoon between June to August and Heavy rainfall from North East monsoon fromOctober to December. The average annual rainfall is about 1442 mm. winter inKancheepuram is heavily influenced by the north-east monsoons.(Source: IMD_Chennai (Minambakkam)(A) 1971-2000)
Table 4-10 Meteorological Observations (Annual)S. No Parameter Observation
1 Wind Direction SW to NE2 Mean wind Speed 3.43 m/sec3 Annual Average Rainfall 1442 mm5 Temperature Range Max. Temp: 23.5°C; Min. Temp: 38.0°C6 Average Temperature 38°C7 Humidity Range (24hr) 70-85 %8 Cloud cover Partly cloudy
4.10 Social Infrastructure available
Social infrastructure available like religious places, schools and colleges and commonplaces within 15 km radius of the project are given in Table 4-11, Table 4-12, Table 4-13,Table 4-14&Table 4-15respectively.
Table 4-11Religious PlacesS. No Places of worships (~)Distance Direction
1. Sri Manikandeswara Swamy Temple 9.95 NW2. Najma - Masjid 10.12 W3. Sri Vijaya Raghava Perumal temple 9.98 W4. Ekambareswarar Temple 3.18 SSW5. Sri Pachai Vanna Perumal Temple 3.49 S6. Sri Pavala Vanna Perumal Temple 3.53 S7. Kailasanathar Temple 4.25 SW8. Pandavar Perumal Temple 3.87 SSW9. Jurahareswar Temple 3.87 SSW
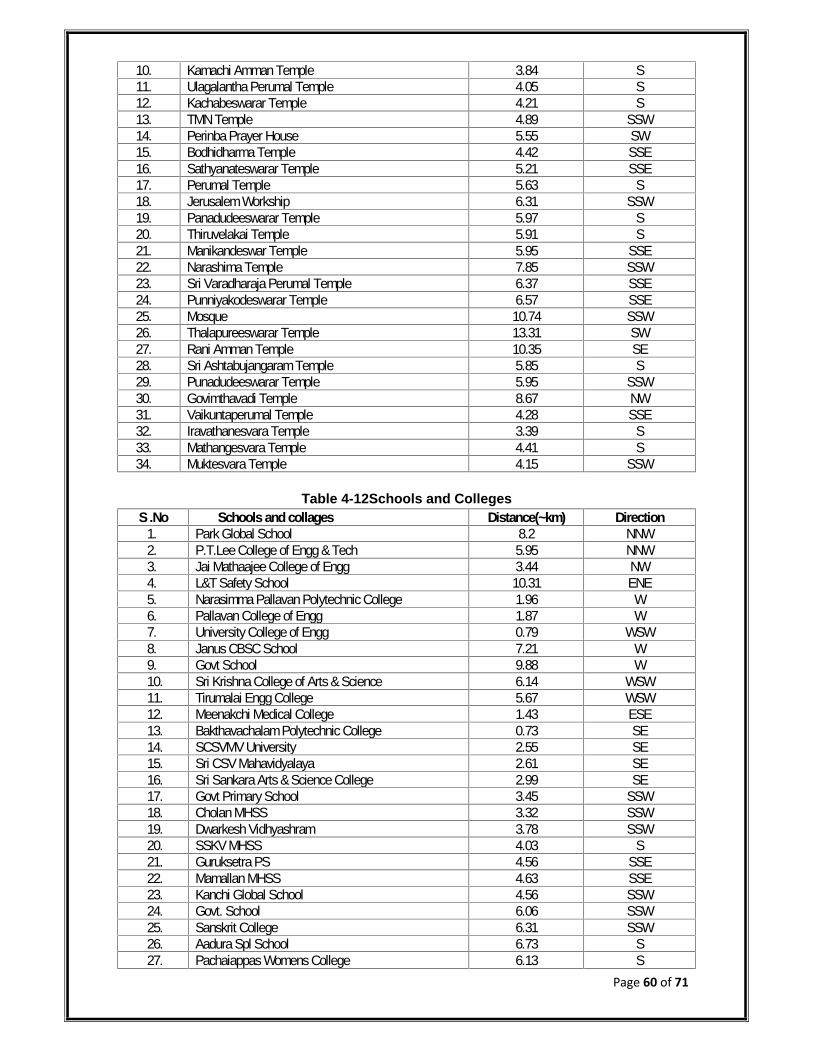
Page 60 of 71
10. Kamachi Amman Temple 3.84 S11. Ulagalantha Perumal Temple 4.05 S12. Kachabeswarar Temple 4.21 S13. TMN Temple 4.89 SSW14. Perinba Prayer House 5.55 SW15. Bodhidharma Temple 4.42 SSE16. Sathyanateswarar Temple 5.21 SSE17. Perumal Temple 5.63 S18. Jerusalem Workship 6.31 SSW19. Panadudeeswarar Temple 5.97 S20. Thiruvelakai Temple 5.91 S21. Manikandeswar Temple 5.95 SSE22. Narashima Temple 7.85 SSW23. Sri Varadharaja Perumal Temple 6.37 SSE24. Punniyakodeswarar Temple 6.57 SSE25. Mosque 10.74 SSW26. Thalapureeswarar Temple 13.31 SW27. Rani Amman Temple 10.35 SE28. Sri Ashtabujangaram Temple 5.85 S29. Punadudeeswarar Temple 5.95 SSW30. Govimthavadi Temple 8.67 NW31. Vaikuntaperumal Temple 4.28 SSE32. Iravathanesvara Temple 3.39 S33. Mathangesvara Temple 4.41 S34. Muktesvara Temple 4.15 SSW
Table 4-12Schools and CollegesS .No Schools and collages Distance(~km) Direction
1. Park Global School 8.2 NNW2. P.T.Lee College of Engg & Tech 5.95 NNW3. Jai Mathaajee College of Engg 3.44 NW4. L&T Safety School 10.31 ENE5. Narasimma Pallavan Polytechnic College 1.96 W6. Pallavan College of Engg 1.87 W7. University College of Engg 0.79 WSW8. Janus CBSC School 7.21 W9. Govt School 9.88 W10. Sri Krishna College of Arts & Science 6.14 WSW11. Tirumalai Engg College 5.67 WSW12. Meenakchi Medical College 1.43 ESE13. Bakthavachalam Polytechnic College 0.73 SE14. SCSVMV University 2.55 SE15. Sri CSV Mahavidyalaya 2.61 SE16. Sri Sankara Arts & Science College 2.99 SE17. Govt Primary School 3.45 SSW18. Cholan MHSS 3.32 SSW19. Dwarkesh Vidhyashram 3.78 SSW20. SSKV MHSS 4.03 S21. Guruksetra PS 4.56 SSE22. Mamallan MHSS 4.63 SSE23. Kanchi Global School 4.56 SSW24. Govt. School 6.06 SSW25. Sanskrit College 6.31 SSW26. Aadura Spl School 6.73 S27. Pachaiappas Womens College 6.13 S
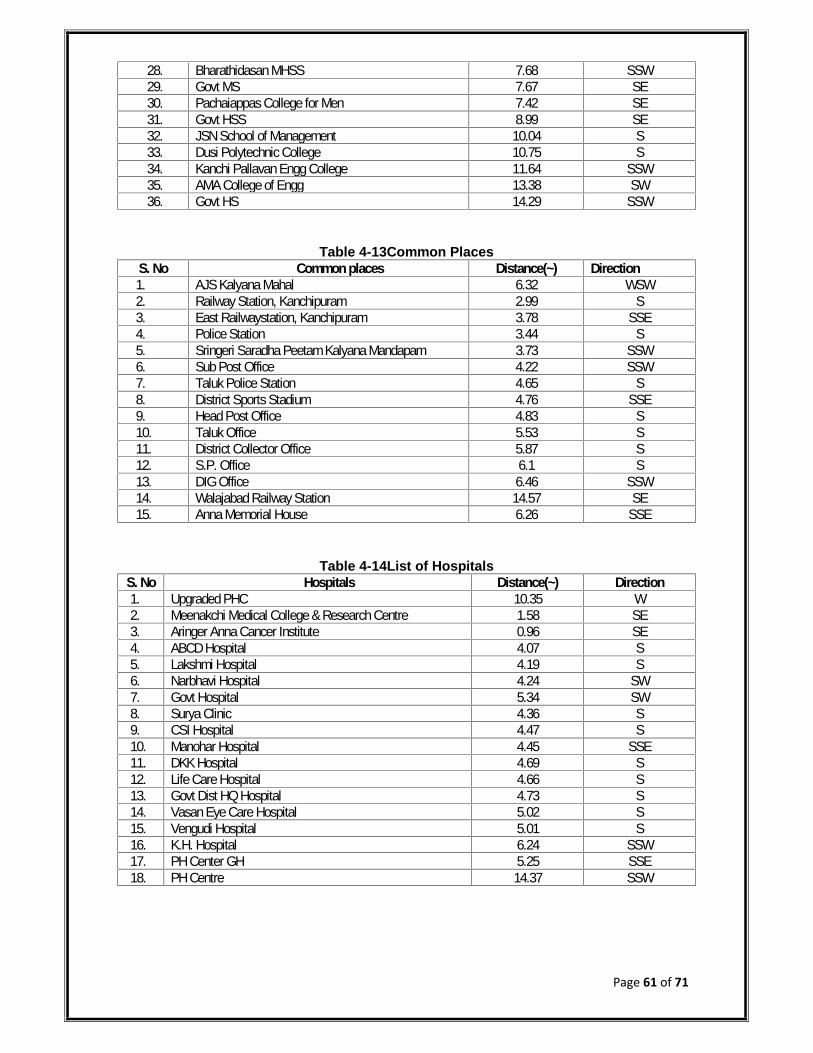
Page 61 of 71
28. Bharathidasan MHSS 7.68 SSW29. Govt MS 7.67 SE30. Pachaiappas College for Men 7.42 SE31. Govt HSS 8.99 SE32. JSN School of Management 10.04 S33. Dusi Polytechnic College 10.75 S34. Kanchi Pallavan Engg College 11.64 SSW35. AMA College of Engg 13.38 SW36. Govt HS 14.29 SSW
Table 4-13Common PlacesS. No Common places Distance(~) Direction1. AJS Kalyana Mahal 6.32 WSW2. Railway Station, Kanchipuram 2.99 S3. East Railwaystation, Kanchipuram 3.78 SSE4. Police Station 3.44 S5. Sringeri Saradha Peetam Kalyana Mandapam 3.73 SSW6. Sub Post Office 4.22 SSW7. Taluk Police Station 4.65 S8. District Sports Stadium 4.76 SSE9. Head Post Office 4.83 S10. Taluk Office 5.53 S11. District Collector Office 5.87 S12. S.P. Office 6.1 S13. DIG Office 6.46 SSW14. Walajabad Railway Station 14.57 SE15. Anna Memorial House 6.26 SSE
Table 4-14List of HospitalsS. No Hospitals Distance(~) Direction1. Upgraded PHC 10.35 W2. Meenakchi Medical College & Research Centre 1.58 SE3. Aringer Anna Cancer Institute 0.96 SE4. ABCD Hospital 4.07 S5. Lakshmi Hospital 4.19 S6. Narbhavi Hospital 4.24 SW7. Govt Hospital 5.34 SW8. Surya Clinic 4.36 S9. CSI Hospital 4.47 S10. Manohar Hospital 4.45 SSE11. DKK Hospital 4.69 S12. Life Care Hospital 4.66 S13. Govt Dist HQ Hospital 4.73 S14. Vasan Eye Care Hospital 5.02 S15. Vengudi Hospital 5.01 S16. K.H. Hospital 6.24 SSW17. PH Center GH 5.25 SSE18. PH Centre 14.37 SSW
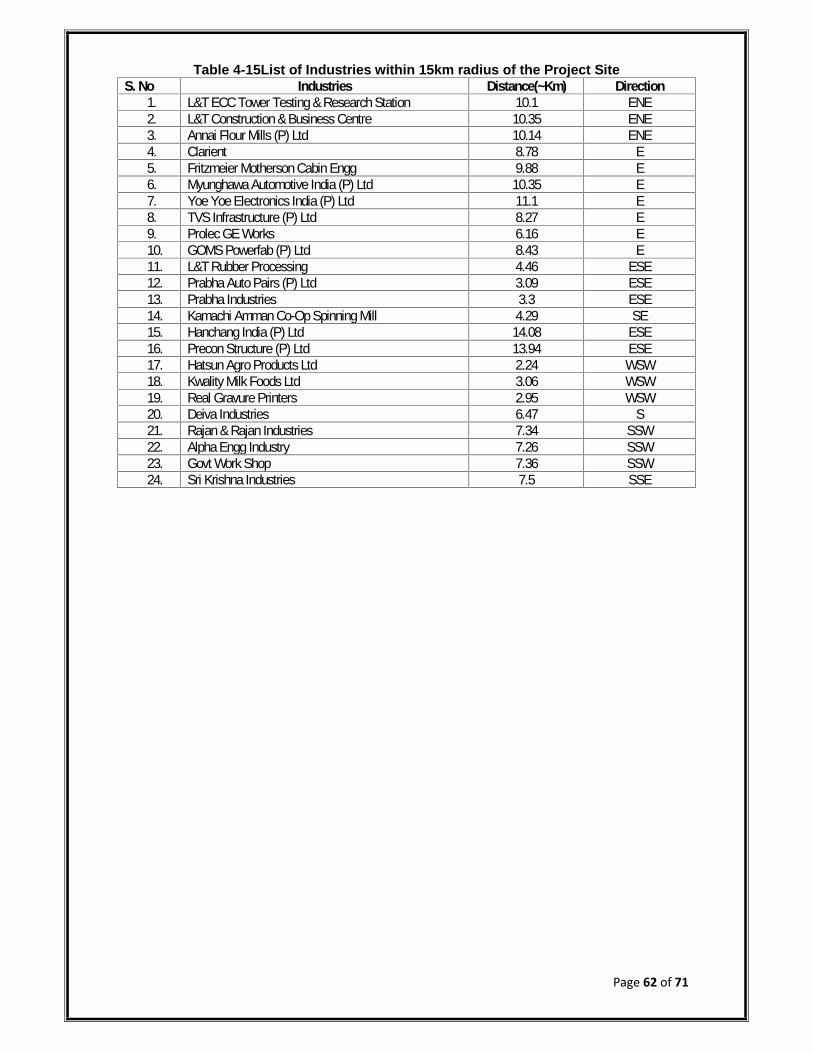
Page 62 of 71
Table 4-15List of Industries within 15km radius of the Project SiteS. No Industries Distance(~Km) Direction
1. L&T ECC Tower Testing & Research Station 10.1 ENE2. L&T Construction & Business Centre 10.35 ENE3. Annai Flour Mills (P) Ltd 10.14 ENE4. Clarient 8.78 E5. Fritzmeier Motherson Cabin Engg 9.88 E6. Myunghawa Automotive India (P) Ltd 10.35 E7. Yoe Yoe Electronics India (P) Ltd 11.1 E8. TVS Infrastructure (P) Ltd 8.27 E9. Prolec GE Works 6.16 E10. GOMS Powerfab (P) Ltd 8.43 E11. L&T Rubber Processing 4.46 ESE12. Prabha Auto Pairs (P) Ltd 3.09 ESE13. Prabha Industries 3.3 ESE14. Kamachi Amman Co-Op Spinning Mill 4.29 SE15. Hanchang India (P) Ltd 14.08 ESE16. Precon Structure (P) Ltd 13.94 ESE17. Hatsun Agro Products Ltd 2.24 WSW18. Kwality Milk Foods Ltd 3.06 WSW19. Real Gravure Printers 2.95 WSW20. Deiva Industries 6.47 S21. Rajan & Rajan Industries 7.34 SSW22. Alpha Engg Industry 7.26 SSW23. Govt Work Shop 7.36 SSW24. Sri Krishna Industries 7.5 SSE
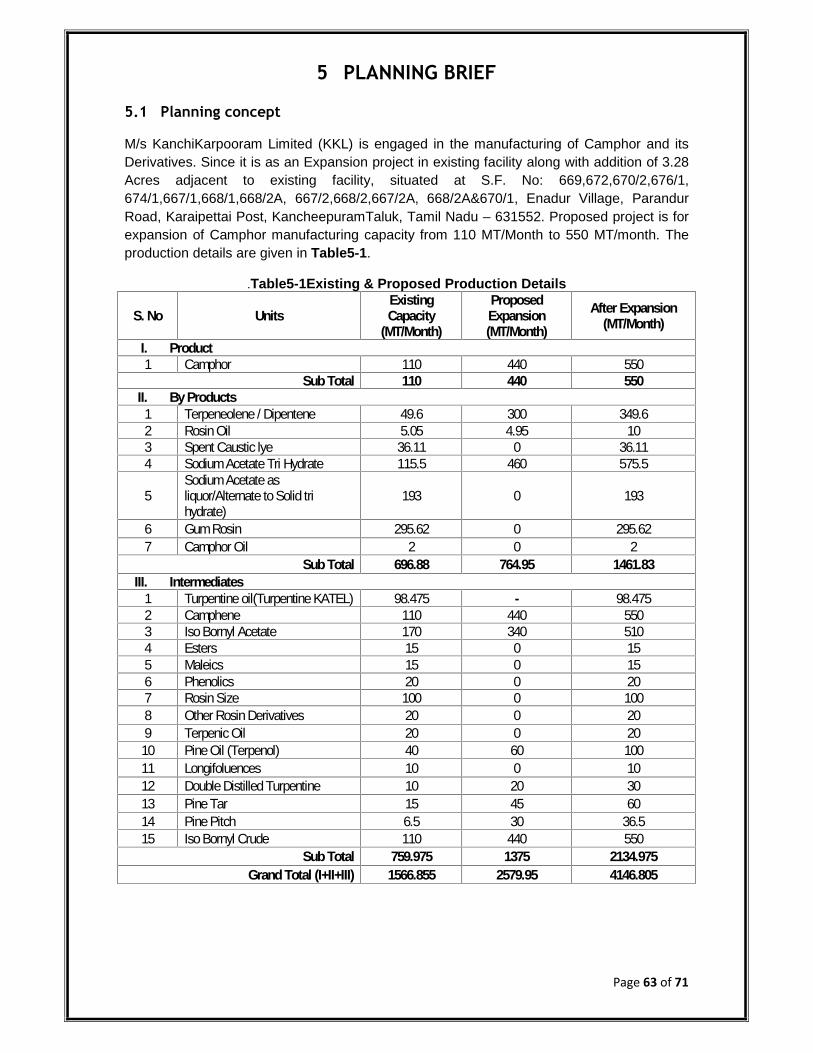
Page 63 of 71
5 PLANNING BRIEF
5.1 Planning concept
M/s KanchiKarpooram Limited (KKL) is engaged in the manufacturing of Camphor and itsDerivatives. Since it is as an Expansion project in existing facility along with addition of 3.28Acres adjacent to existing facility, situated at S.F. No: 669,672,670/2,676/1,674/1,667/1,668/1,668/2A, 667/2,668/2,667/2A, 668/2A&670/1, Enadur Village, ParandurRoad, Karaipettai Post, KancheepuramTaluk, Tamil Nadu – 631552. Proposed project is forexpansion of Camphor manufacturing capacity from 110 MT/Month to 550 MT/month. Theproduction details are given in Table5-1.
.Table5-1Existing & Proposed Production Details
S. No UnitsExistingCapacity
(MT/Month)
ProposedExpansion(MT/Month)
After Expansion(MT/Month)
I. Product1 Camphor 110 440 550
Sub Total 110 440 550II. By Products
1 Terpeneolene / Dipentene 49.6 300 349.62 Rosin Oil 5.05 4.95 103 Spent Caustic lye 36.11 0 36.114 Sodium Acetate Tri Hydrate 115.5 460 575.5
5Sodium Acetate asliquor/Alternate to Solid trihydrate)
193 0 193
6 Gum Rosin 295.62 0 295.627 Camphor Oil 2 0 2
Sub Total 696.88 764.95 1461.83III. Intermediates
1 Turpentine oil(Turpentine KATEL) 98.475 - 98.4752 Camphene 110 440 5503 Iso Bornyl Acetate 170 340 5104 Esters 15 0 155 Maleics 15 0 156 Phenolics 20 0 207 Rosin Size 100 0 1008 Other Rosin Derivatives 20 0 209 Terpenic Oil 20 0 20
10 Pine Oil (Terpenol) 40 60 10011 Longifoluences 10 0 1012 Double Distilled Turpentine 10 20 3013 Pine Tar 15 45 6014 Pine Pitch 6.5 30 36.515 Iso Bornyl Crude 110 440 550
Sub Total 759.975 1375 2134.975Grand Total (I+II+III) 1566.855 2579.95 4146.805
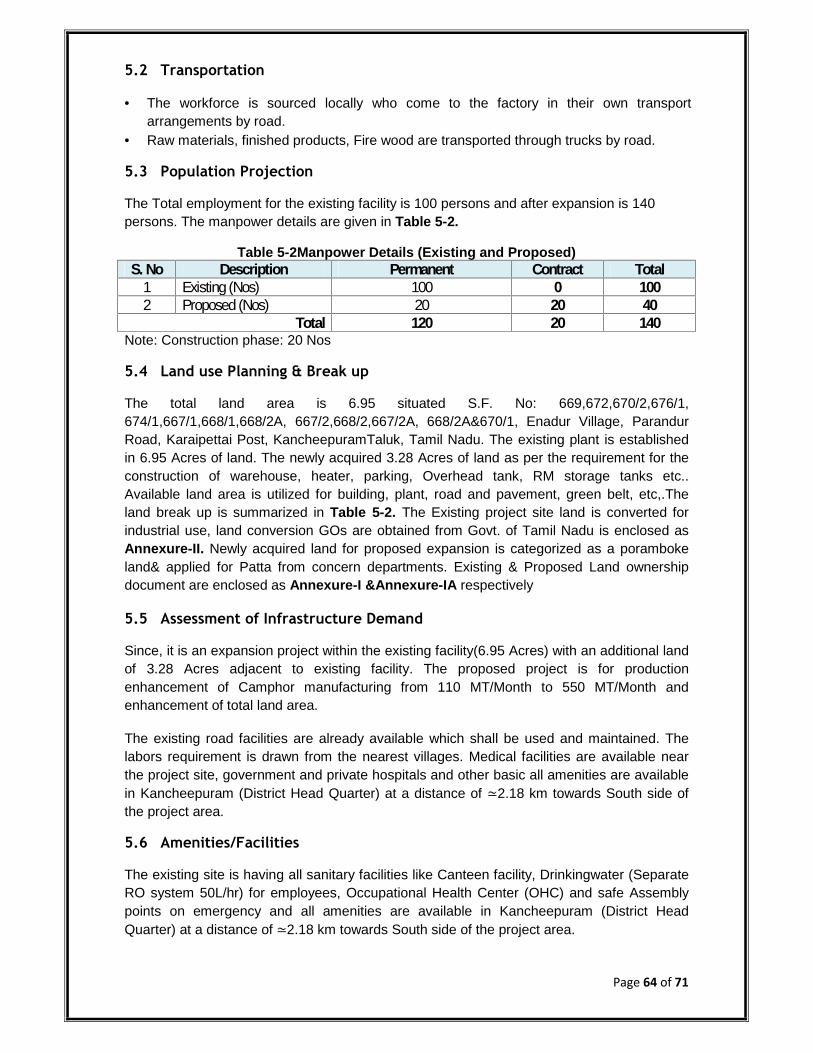
Page 64 of 71
5.2 Transportation
The workforce is sourced locally who come to the factory in their own transportarrangements by road.
Raw materials, finished products, Fire wood are transported through trucks by road.
5.3 Population Projection
The Total employment for the existing facility is 100 persons and after expansion is 140persons. The manpower details are given in Table 5-2.
Table 5-2Manpower Details (Existing and Proposed)S. No Description Permanent Contract Total
1 Existing (Nos) 100 0 1002 Proposed (Nos) 20 20 40
Total 120 20 140Note: Construction phase: 20 Nos
5.4 Land use Planning & Break up
The total land area is 6.95 situated S.F. No: 669,672,670/2,676/1,674/1,667/1,668/1,668/2A, 667/2,668/2,667/2A, 668/2A&670/1, Enadur Village, ParandurRoad, Karaipettai Post, KancheepuramTaluk, Tamil Nadu. The existing plant is establishedin 6.95 Acres of land. The newly acquired 3.28 Acres of land as per the requirement for theconstruction of warehouse, heater, parking, Overhead tank, RM storage tanks etc..Available land area is utilized for building, plant, road and pavement, green belt, etc,.Theland break up is summarized in Table 5-2. The Existing project site land is converted forindustrial use, land conversion GOs are obtained from Govt. of Tamil Nadu is enclosed asAnnexure-II. Newly acquired land for proposed expansion is categorized as a porambokeland& applied for Patta from concern departments. Existing & Proposed Land ownershipdocument are enclosed as Annexure-I &Annexure-IA respectively
5.5 Assessment of Infrastructure Demand
Since, it is an expansion project within the existing facility(6.95 Acres) with an additional landof 3.28 Acres adjacent to existing facility. The proposed project is for productionenhancement of Camphor manufacturing from 110 MT/Month to 550 MT/Month andenhancement of total land area.
The existing road facilities are already available which shall be used and maintained. Thelabors requirement is drawn from the nearest villages. Medical facilities are available nearthe project site, government and private hospitals and other basic all amenities are availablein Kancheepuram (District Head Quarter) at a distance of ≃2.18 km towards South side ofthe project area.
5.6 Amenities/Facilities
The existing site is having all sanitary facilities like Canteen facility, Drinkingwater (SeparateRO system 50L/hr) for employees, Occupational Health Center (OHC) and safe Assemblypoints on emergency and all amenities are available in Kancheepuram (District HeadQuarter) at a distance of ≃2.18 km towards South side of the project area.
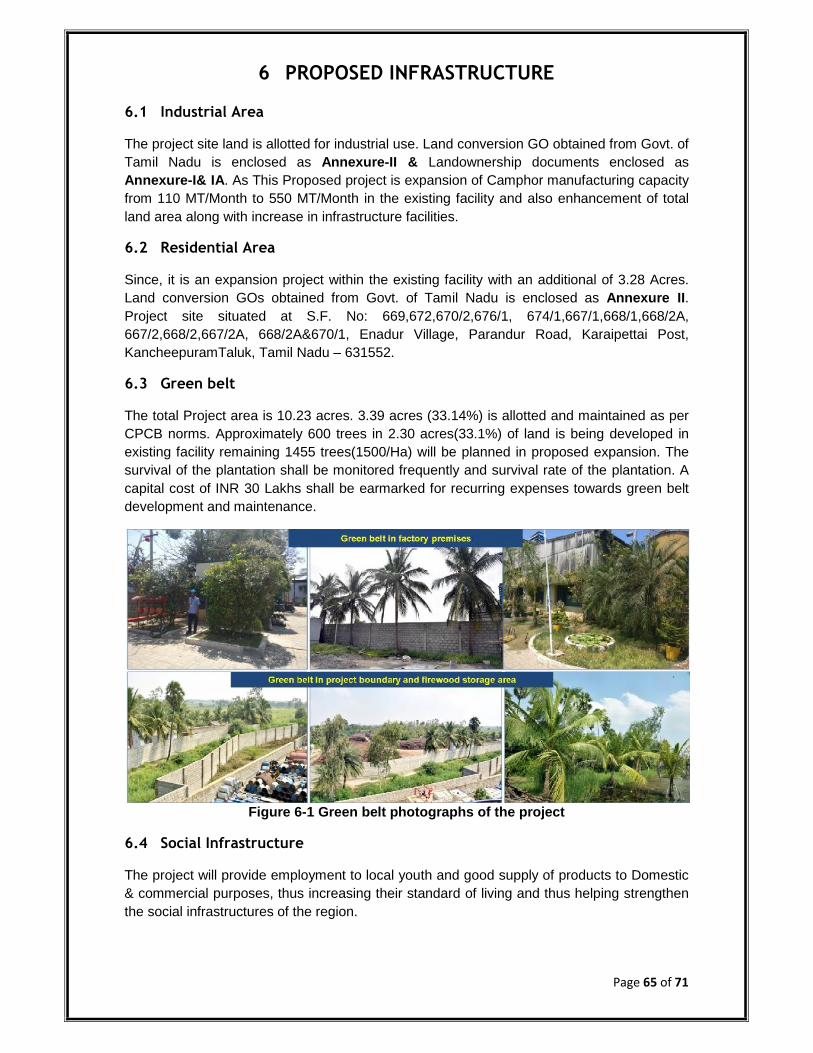
Page 65 of 71
6 PROPOSED INFRASTRUCTURE
6.1 Industrial Area
The project site land is allotted for industrial use. Land conversion GO obtained from Govt. ofTamil Nadu is enclosed as Annexure-II & Landownership documents enclosed asAnnexure-I& IA. As This Proposed project is expansion of Camphor manufacturing capacityfrom 110 MT/Month to 550 MT/Month in the existing facility and also enhancement of totalland area along with increase in infrastructure facilities.
6.2 Residential Area
Since, it is an expansion project within the existing facility with an additional of 3.28 Acres.Land conversion GOs obtained from Govt. of Tamil Nadu is enclosed as Annexure II.Project site situated at S.F. No: 669,672,670/2,676/1, 674/1,667/1,668/1,668/2A,667/2,668/2,667/2A, 668/2A&670/1, Enadur Village, Parandur Road, Karaipettai Post,KancheepuramTaluk, Tamil Nadu – 631552.
6.3 Green belt
The total Project area is 10.23 acres. 3.39 acres (33.14%) is allotted and maintained as perCPCB norms. Approximately 600 trees in 2.30 acres(33.1%) of land is being developed inexisting facility remaining 1455 trees(1500/Ha) will be planned in proposed expansion. Thesurvival of the plantation shall be monitored frequently and survival rate of the plantation. Acapital cost of INR 30 Lakhs shall be earmarked for recurring expenses towards green beltdevelopment and maintenance.
Figure 6-1 Green belt photographs of the project
6.4 Social Infrastructure
The project will provide employment to local youth and good supply of products to Domestic& commercial purposes, thus increasing their standard of living and thus helping strengthenthe social infrastructures of the region.
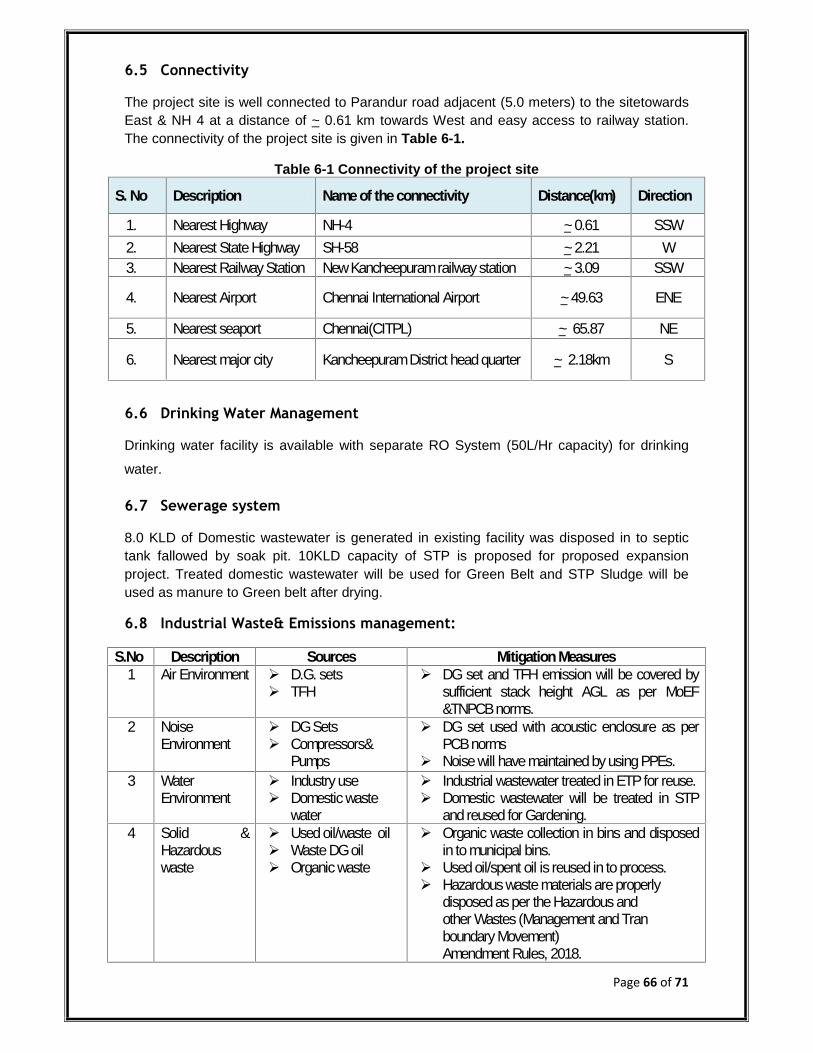
Page 66 of 71
6.5 Connectivity
The project site is well connected to Parandur road adjacent (5.0 meters) to the sitetowardsEast & NH 4 at a distance of ~ 0.61 km towards West and easy access to railway station.The connectivity of the project site is given in Table 6-1.
Table 6-1 Connectivity of the project site
S. No Description Name of the connectivity Distance(km) Direction
1. Nearest Highway NH-4 ~ 0.61 SSW2. Nearest State Highway SH-58 ~ 2.21 W3. Nearest Railway Station New Kancheepuram railway station ~ 3.09 SSW
4. Nearest Airport Chennai International Airport ~ 49.63 ENE
5. Nearest seaport Chennai(CITPL) ~ 65.87 NE
6. Nearest major city Kancheepuram District head quarter ~ 2.18km S
6.6 Drinking Water Management
Drinking water facility is available with separate RO System (50L/Hr capacity) for drinking
water.
6.7 Sewerage system
8.0 KLD of Domestic wastewater is generated in existing facility was disposed in to septictank fallowed by soak pit. 10KLD capacity of STP is proposed for proposed expansionproject. Treated domestic wastewater will be used for Green Belt and STP Sludge will beused as manure to Green belt after drying.
6.8 Industrial Waste& Emissions management:
S.No Description Sources Mitigation Measures1 Air Environment D.G. sets
TFH DG set and TFH emission will be covered by
sufficient stack height AGL as per MoEF&TNPCB norms.
2 NoiseEnvironment
DG Sets Compressors&
Pumps
DG set used with acoustic enclosure as perPCB norms
Noise will have maintained by using PPEs.3 Water
Environment Industry use Domestic waste
water
Industrial wastewater treated in ETP for reuse. Domestic wastewater will be treated in STP
and reused for Gardening.4 Solid &
Hazardouswaste
Used oil/waste oil Waste DG oil Organic waste
Organic waste collection in bins and disposedin to municipal bins.
Used oil/spent oil is reused in to process. Hazardous waste materials are properly
disposed as per the Hazardous andother Wastes (Management and Tranboundary Movement)Amendment Rules, 2018.

Page 67 of 71
Hazardous waste collection, storage &disposal to authorized recyclers.
5 ChemicalSludge/ETPSludge
ETP Sludge/Solar pond Will be collected in HDPE Barrels and storedin Hazardous waste storage area and handedover to TSDF(TNWML)
6.9 Municipal Solid Waste Management
The Solid Waste generation and Management isgiven in Table 6-2.
Table 6-2 Solid Waste Generation and Management (Existing &Proposed Expansion)
S. No WasteQuantity (kg/day) Collection
methodTreatment / disposal
methodExisting ProposedExpansion
AfterExpansion
1 Organic 40.5 8.1 48.6 Bins Municipal bin includingfood waste
2 Inorganic 4.5 0.9 5.4 Bins TNPCB Authorizeddealers
3 Ash fromFire wood 8.0 8.0 16.0 Bags Given to local former
for agriculture purpose
4 STP Sludge - 1.0 1.0 BinsDried and used asmanure for green beltdevelopment withinthe existing facility
Total 53.0 18.0 71.0
Municipal Solid Waste generation for Existing is 53 kg/day and 69 kg/day will begenerated after expansion and will be disposed off into local municipal bins.
Ash generation from fire wood is 8 kg/day (existing), 16 kg/day (After expansion) Ash from fire wood is also being taken by farmers to be used in their fields. Sludge from ETP is send to TSDF 10KLD of STP is proposed for expansion project. STP Sludge (1.0 kg/day) will be used
as manure for Green belt.
6.10 Power Requirements and Supply/ Source
The existing power requirement is 260 kVA and for the proposed expansion the additionalpower required will be 100 kVA. The Power supply is from Tamil Nadu Electricity Board,TNEB agreement enclosed as Annexure-X. DG set used as an alternate source of powerduring power failure. The Power requirement for existing and proposed expansion issummarized in Table 6-3.
Table 6-3 Power requirement details (Existing and after Proposed Expansion)S.NO Details Existing Proposed After Expansion
1 PowerRequirement (kVA) 260 100 360
2 DG Backup- (kVA) 1 x 250 1 x 380 1 x 3801 x 180 - 1 x 180
3 TFH(Wood Fire heater)MW/hr 1 x 1.74 1 x 4.65 1 x 1.741 x 4.65
Note:- Existing 1X250 kVA DG set will be replaced with 1X380 kVADG sets will be used as power back up in case of emergency during the power failure. Agreement obtained formTNEB is enclosed as Annexure-X.

Page 68 of 71
7 REHABILITATION AND RESETTLEMENT (R &R) PLAN
7.1 Policy to be adopted (Central/ State)
Not applicable as proposed project is expansion of production capacity along with addition of3.28 Acres land adjacent to existing facility with few additions of infrastructure facilities. Theexisting project land converted to industrial use, existing land conversions GO s are obtainedfrom Govt. of Tamil Nadu are enclosed as Annexure- II. Newly acquired land for proposedexpansion is categorized as a poramboke land& applied for Patta from concerndepartments. Existing land ownership documents are enclosed as Annexure-I and proposedland is enclosed as Annexure-IA.
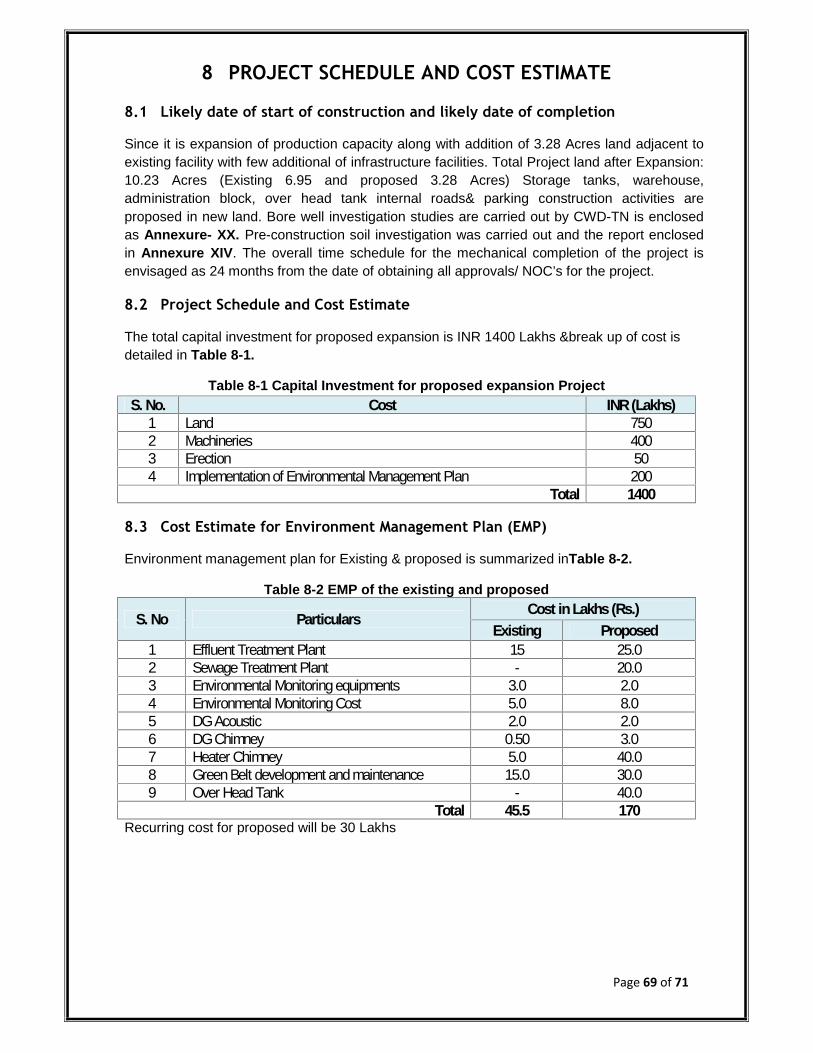
Page 69 of 71
8 PROJECT SCHEDULE AND COST ESTIMATE
8.1 Likely date of start of construction and likely date of completion
Since it is expansion of production capacity along with addition of 3.28 Acres land adjacent toexisting facility with few additional of infrastructure facilities. Total Project land after Expansion:10.23 Acres (Existing 6.95 and proposed 3.28 Acres) Storage tanks, warehouse,administration block, over head tank internal roads& parking construction activities areproposed in new land. Bore well investigation studies are carried out by CWD-TN is enclosedas Annexure- XX. Pre-construction soil investigation was carried out and the report enclosedin Annexure XIV. The overall time schedule for the mechanical completion of the project isenvisaged as 24 months from the date of obtaining all approvals/ NOC’s for the project.
8.2 Project Schedule and Cost Estimate
The total capital investment for proposed expansion is INR 1400 Lakhs &break up of cost isdetailed in Table 8-1.
Table 8-1 Capital Investment for proposed expansion ProjectS. No. Cost INR (Lakhs)
1 Land 7502 Machineries 4003 Erection 504 Implementation of Environmental Management Plan 200
Total 1400
8.3 Cost Estimate for Environment Management Plan (EMP)
Environment management plan for Existing & proposed is summarized inTable 8-2.
Table 8-2 EMP of the existing and proposed
S. No Particulars Cost in Lakhs (Rs.)Existing Proposed
1 Effluent Treatment Plant 15 25.02 Sewage Treatment Plant - 20.03 Environmental Monitoring equipments 3.0 2.04 Environmental Monitoring Cost 5.0 8.05 DG Acoustic 2.0 2.06 DG Chimney 0.50 3.07 Heater Chimney 5.0 40.08 Green Belt development and maintenance 15.0 30.09 Over Head Tank - 40.0
Total 45.5 170Recurring cost for proposed will be 30 Lakhs
Page 70 of 71
9 ANALYSIS OF PROPOSAL
9.1 Financial and social benefits
Existing Annual Turnover: INR 55.0 Cr
Proposed Projected Annual Turnover: INR 150 Cr
9.2 Social Benefit:
The project will provide employment to local youth and good supply of products toDomestic & commercial purposes, thus increasing their standard of living and thushelping strengthen the social infrastructures of the region.
9.3 CSR benefit to local community:
Promotion of education and possible infrastructure development in nearby villageswill be undertaken possibly.
9.4 Benefits to the environment:
Plantation/Green belt is beingdone around factory site.Green belt will enhance thegreen coverage in the area & aesthetics.
Rain water harvesting will enhance the ground water table. As seen above there is marginal impacts on air, noise, water & soil environments. The marginal impact due to the proposed assignment will be fully mitigated by the
proper Environmental Management Plan (EMP). There is no demolished activities involved in this proposed project ESR will provide the well-being of the society and the protection of the environment
will help in conserving the ecosystem. It will also provide employment opportunities tolarger population.
Thus, the proposed expansion project will benefit both the local as well as Indian economy.
Page 71 of 71
10 CONCLUSION
Since the proposed project is expansion of production capacity along with addition of3.28 Acres land adjacent to existing facility with few addition of infrastructurefacilities.
There are demolished activities involved in this proposed project. Rain water harvesting system is adapted and the company is water positive. Socio-economic benefit to the local people as it would provide both direct
employment and indirect employment. Increase in supply of products for commercial purposes, will improve the standard of
living and thus help strengthen the social infrastructures of the region. The marginal impact due to the proposed assignment will be fully mitigated by the
proper Environmental Management Plan (EMP).


![1,3‐Diamine‐Derived Bifunctional Organocatalyst Prepared ... · 1,3-Diamine-Derived Bifunctional Organocatalyst Prepared from Camphor ... [12f] Camphor is one of ... These are](https://img.pdfslide.us/doc/110x75/5b0406ee7f8b9a89208d0264/13diaminederived-bifunctional-organocatalyst-prepared-3-diamine-derived.jpg)