Embed Size (px)
Citation preview
Integrated Systems and Technologies
Enhanced Sonographic Imaging to Diagnose Lymph NodeMetastasis: Importance of Blood Vessel Volume and Density
Li Li1,2,4, Shiro Mori5, Mizuho Kodama5, Maya Sakamoto3, Shoki Takahashi2,4, and Tetsuya Kodama1
AbstractLymph node size is an important variable in ultrasound diagnosis of lymph nodemetastasis. However, the size
criterion often leads to oversight of tumor-positive lymph nodes within the range of "normal" size, such thatmoreaccurate diagnostic criteria for lymph node metastasis are required. In this study, we show how diagnosis oflymph node metastasis can be improved by evaluating changes in blood vessel volume and density using a novelcontrast-enhanced high-frequency ultrasound (CE-HFUS) systemwith Sonazoid. AnMRL/MpJ-lpr/lpr (MRL/lpr)mousemodel of lymph nodemetastasis was used in which lymph nodes are similar in size to humans. Metastasisvia lymphatic vessels to proper axillary lymph nodes (proper ALN) was induced by injection of tumor cells intothe subiliac lymph nodes.Within 21 days of injection, significant increases in blood vessel volume and density, butno increases in the size of the proper ALNs, were observed. The increase in blood vessel density was confirmedwith immunohistochemical analysis and was positively related to tumor cell proliferation as measured usingbioluminescence imaging. Together, our results showed that alterations in blood vessel volume and densityprecede alterations in lymph node size in the early stages of lymph nodemetastasis. Detection of these changes byultrasonography may offer new criteria for early diagnosis of lymph node metastasis. Cancer Res; 73(7); 2082–92.�2013 AACR.
IntroductionMetastasis, a characteristic of many tumor types, is estimat-
ed to be responsible for the death of 90% of all patients withcancer (1). Early detection of metastasis in tumor-draininglymph nodes, that is, sentinel lymph nodes, during the man-agement of skin, breast, colon, head andneck, and other cancersshould improve assessment of the stage of cancer and facilitateselection of the most appropriate treatment (2). Several non-invasive imagingmodalities are currently used for the detectionof metastasis in tumor-draining lymph nodes, including com-puted tomography (CT), magnetic resonance imaging (MRI),positron emission tomography (PET), single photon emissioncomputed tomography (SPECT), and ultrasound (3–7).
Among these imaging modalities, CT and MRI are used todetermine nodal size, which is used to define the status ofregional lymph nodes. A nodal size greater than 10 mm in theshort-axis diameter is the most widely accepted criterion forthe diagnosis of cancer involvement (8). However, this size-based characterization of lymph node metastasis frequently
leads to misdiagnosis as metastatic lymph nodes may be ofnormal size, whereas nonmetastatic lymph nodesmay becomeabnormally enlarged due to reactive swelling (defined patho-logically as reactive lymphadenopathy; ref. 9). Recently, Zhangand colleagues (10) have reported that both diffusion-weightedand superparamagnetic iron oxide-enhanced MRI can distin-guish tumor metastatic lymph nodes from reactive lymphnodes. However, both methods have limited value in detectingmicroscopic tumor metastasis to the draining lymph nodes atthe early stages.
PET using 2-[18F]fluoro-2-deoxy-D-glucose (FDG; a glucoseanalog radiolabeled with fluorine-18) is a functional methodfor tumor detection, based on the increased glucose metabo-lismofmalignant tumors. Investigators in a previous study (11)have evaluated the role of FDG-PET for the detection of lymphnode metastasis in patients with melanoma by comparing itsresults with those of postoperative histopathology. FDG-PETwas reported to be capable of detecting 100% of metastasespresent in lymph nodes that were 10 mm or greater in theirshort-axis diameter, 83% of metastases that were 6 to 10 mm,and 23% of metastases that were 5 mm or less. However, FDG-PET was found to be highly sensitive (93%) only for thedetection of metastases with more than 50% lymph nodeinvolvement or with capsular infiltration.
Current clinical ultrasound systems use a frequency of 3 to15 MHz (12). The criteria used for diagnosing lymph nodemetastasis with gray-scale sonography are lymph node size(short-axis diameter/long-axis diameter), cortical thickness,shape, nodal borders, central necrosis, absence of echo-richhilar structures, and extracapsular spread (13–15). Amongthese criteria, nodal size and depiction of necrosis are the
Authors' Affiliations: 1Department of Biomedical Engineering, GraduateSchool of Biomedical Engineering; 2Department of Diagnostic Radiology,Graduate School of Medicine; 3Department of Oral Diagnosis, GraduateSchool of Dentistry, Tohoku University; Departments of 4Diagnostic Radi-ology, and 5Oral and Maxillofacial Surgery, Tohoku University Hospital,Sendai, Miyagi, Japan
CorrespondingAuthor: Tetsuya Kodama, Graduate School of BiomedicalEngineering, Tohoku University, 4-1 Seiryo, Aoba Ward, Sendai, Miyagi980-8575, Japan. Phone: 81-22-717-7583; Fax: 81-22-717-7583; E-mail:[email protected]
doi: 10.1158/0008-5472.CAN-12-4200
�2013 American Association for Cancer Research.
CancerResearch
Cancer Res; 73(7) April 1, 20132082
on April 15, 2013. © 2013 American Association for Cancer Research. cancerres.aacrjournals.org Downloaded from
Published OnlineFirst January 18, 2013; DOI: 10.1158/0008-5472.CAN-12-4200
most important sonographic criteria (16). As technology hasdeveloped and with the introduction of power Doppler sonog-raphy, it has become possible to evaluate the pattern ofintranodal vessels and measure blood flow velocity and vas-cular resistance with spectral Doppler gates (15, 17). Kagawaand colleagues (18) have reported that blood flow signalsbecome scattered and that the scattering index increases asthe metastatic lymph node size increases.However, among the current ultrasound techniques avail-
able, even high-resolution ultrasound (6–11 MHz) combinedwith power Doppler sonography is unable to detect metastaticdeposits smaller than 4.5 mm in diameter in positive sentinellymph nodes (19, 20); in fact, it can detect only 22.2% ofmetastatic deposits larger than 4.5 mm (20). This is due tolimitations in spatial resolution, operator dependence, theshort time window available for imaging, and the limited fieldof view. Another limiting factor in the development of diag-nostic ultrasound imaging has been a lack of appropriateanimal models for studying lymph node metastasis (21).Because the lymph node size of conventional mice is 1 to 2mm, changes in the internal structure of murine lymph nodesfrom the onset of metastasis cannot be detected using currentultrasound systems. To overcome the limitations imposed bythe use of traditional mouse models and sonography, thepresent study used 3-dimensional (3D) contrast-enhancedhigh-frequency ultrasound (CE-HFUS) in combination withthe contrast medium, Sonazoid, to examine a mouse model oflymph node metastasis established by our previous research(22). Specifically, a CE-HFUS system set at a frequency of 35MHz, was used to examine tumor development from the onsetof metastasis in MRL/lpr mice, which have lymph nodes thatare enlarged to approximately 8mm indiameter (similar in sizeto human lymph nodes). The injection of tumor cells into thesubiliac lymph nodes (SiLN) of these mice was used to inducemetastasis through a single lymphatic vessel to the properaxillary lymph nodes (proper ALN), the anatomic name givento these lymph nodes in a previous article (23).
Materials and MethodsAll in vivo studies were carried out in strict accordance with
the recommendations in the Guide for the Proper Conduct ofAnimal Experiments and Related Activities in AcademicResearch and Technology, 2006. The protocol was approvedby the Institutional Animal Care and Use Committee ofTohoku University (Sendai, Japan; Permit Number:2010BeLMO-76-20-255, 2009BeA-6, 2010BeA-7).
Cell cultureKM-Luc/GFP cells (22), which stably express a fusion of the
luciferase (Luc) and enhanced-GFP (EGFP) genes, were pre-pared by transfection of MRL/MpTn-gld/gldmalignant fibroushistiocytoma-like (MRL/N-1) cells (refs. 24, 25; obtained fromM. Ono, Tohoku University on January 24, 2007), using pEGF-PLuc (BD Biosciences) with Lipofectin Transfection Reagent(Invitrogen).MRL/N-1 cells were established from the spleen ofan MRL/gld mouse in 1997 (24). Expression of mutant Fasantigen on the cell surface had been confirmed using flow-cytometric analyses (24). KM-Luc/GFP cells had characteris-
tics of malignant fibrous histiocytoma-like cells, which wereconfirmed using histopathologic assessment (22). KM-Luc/GFP cells were cultured in Dulbecco's Modified Eagle's Medi-um supplemented with 10% FBS containing 1% L-glutamine–penicillin–streptomycin (Sigma-Aldrich) and 1% GeneticinG418 (Wako Pure Chemical Industries, Ltd.). Before conduct-ing the metastasis experiments, a Mycoplasma detection kit(R&D Systems Inc.) was used to ensure the absence of Myco-plasma contamination of the cell cultures.
Induction of metastasis in the proper ALNMRL/lpr mice, which develop systemic lymphadenopathy
(26), were purchased from the Jackson Laboratory and subse-quently bred and maintained at the Institute for AnimalExperimentation, Graduate School of Medicine, Tohoku Uni-versity. Twelve mice were used (weights 35–45 g; 14- to 18-weeks old). The mean longitudinal diameters of the SiLN andproper ALN of the 12 mice, measured using a digital caliper,were 7.7� 1.7 mm (mean� SD; n¼ 12) and 7.4� 1.5 mm (n¼12), respectively. Lymph node metastasis was induced in theproper ALN ofmice in themetastasis group (n¼ 6) by injectionof 1 � 105 KM-Luc/GFP cells, suspended in 30 mL of PBS, intothe SiLNofmice anesthetizedwith 2% isoflurane (Abbott JapanCo., Ltd.) in oxygen. PBS (30 mL) was injected into the SiLN ofmice in the negative control group (n ¼ 5). The day ofinoculation was defined as day 0.
To visualize the lymphatic vessel between the proper ALNand the SiLN, indocyanine green (ICG; excitation wave-length, 805 nm; emission wavelength, 840 nm; Daiichi San-kyo) was injected into the SiLN of 1 mouse, and its flow tothe proper ALN was visualized with a Photo Dynamic Eye IRphotodynamic camera (Hamamatsu Photonics), which emit-ted light at 760 nm and detected light at wavelengths greaterthan 820 nm.
Detection of metastasis in the proper ALN by in vivobioluminescence imaging
Metastasis to the proper ALN was assessed using an in vivoimaging system (IVIS; Xenogen; ref. 27). Each mouse wasanesthetized with 2.0% isoflurane in oxygen before intraper-itoneal injection with 150 mg/kg of luciferin (Promega Co.).After 10 minutes, luciferase bioluminescence activity wasmeasured for 30 seconds using the IVIS. This procedure wascarried out on days 0, 4, 9, 14, and 21 postinoculation.
Evaluation of time-dependent changes in signal intensityin the proper ALN
Sonazoid (Daiichi Sankyo), a lipid-stabilized suspension ofperfluorocarbon microbubbles, was used as an ultrasoundcontrast agent (28). A z potential and particle size analyzer(ELSZ-2; Otsuka Electronics) revealed that Sonazoid had amedian diameter of 2.46 � 0.12 mm (n ¼ 3; mean � SD) and amean z potential of�37.0� 1.1 mV (n¼ 3). To investigate thein vivo stability of Sonazoid, 2-dimensional (2D) dynamiccontrast-enhanced imaging was conducted using a CE-HFUSsystem (VEVO770; VisualSonics Inc.) with a 35MHz transducer(RMV-703; axial resolution 50 mm, focal length 10 mm; Visual-Sonics Inc.) set at 50% transmission power. For these
Early Diagnosis of Lymph Node Metastasis Using CE-HFUS
www.aacrjournals.org Cancer Res; 73(7) April 1, 2013 2083
on April 15, 2013. © 2013 American Association for Cancer Research. cancerres.aacrjournals.org Downloaded from
Published OnlineFirst January 18, 2013; DOI: 10.1158/0008-5472.CAN-12-4200
experiments, an additional group of mice was used that hadreceived no tumor cells (n ¼ 5). Mice were anesthetized with2% isoflurane in oxygen and placed onto a stage maintained at38�C (TM150, VisualSonics Inc.). While the transducerremained in a stable position, 2D contrast-enhanced imagesof the center of the proper ALN were taken serially, until 12minutes after slow injection of 100 mL Sonazoid into the tailvein; respiration gating was used to suppress imaging artifactsdue to respiration. A region of interest was subsequently drawnaround the proper ALN and a time–intensity curvewas createdfor determination of the optimal diagnostic window.
Three-dimensional reconstruction of themicrovasculature in the proper ALN using CE-HFUSwithSonazoid
A 3D image of the microvasculature within the proper ALNwas reconstructed and time-dependent blood vessel develop-ment in the proper ALNwas evaluated on days 0, 4, 9, 14, and 21postinoculation, using a CE-HFUS system with a 35 MHztransducer fixed to a 3D stage control system (Mark-204-MS;SigmaKoki Co., Ltd.). Before and 180 seconds after intravenousbolus injection of 100 mL Sonazoid into the tail vein, conse-cutive B-mode images with a slice thickness of 100 mm werecaptured throughout the entire proper ALN for 3D imagingduring the diagnostic window. The difference in the videointensity between the preinjection and postinjection imageframes was highlighted as a green overlay in the B-modeanatomic images using the accompanying software (Visual-Sonics). The highlighted green areas were considered to be theextracted blood vessel images. Blood vessel densities andvolumes in the proper ALN (whose boundaries were manuallytraced using sequential, parallel ultrasound scans, according tothe anatomic and acoustic characteristics) were calculatedusing analysis software (VisualSonics Inc.). Values on day 0were set at 100%. Changes in each individual animal, measuredon days 4, 9, 14, and 21, were calculated and expressed aspercentage changes. Throughout the imaging session, miceremained anesthetized, while resting on a heated stage byadministration of 1 L/min of 2% isoflurane in oxygen, inaccordance with the manufacturer's protocol. Respiratorygating was used to synchronize data acquisition with themouse respiratory cycle to reduce motion artifacts duringimage analysis. A 2D image of the maximum cross-section ofthe proper ALN was extracted from the 3D image.
Immunohistochemical analysisAfter IVIS and ultrasound imaging had been conducted
on day 21 postinoculation, metastatic lymph nodes wereexcised in a manner that allowed the researcher to remainblind about whether they had been excised from mice in thecontrol (4 of 5 mice) or metastasis (4 of 6 mice) group. Lymphnodes were fixed overnight in 18.5% formaldehyde in PBSat 4�C (Rapid Fixative; Kojima Chemical Industry, Inc.), dehy-drated, and then embedded in paraffin. The embedded speci-menswere cut into 2-mmserial sections and either stainedwithhematoxylin and eosin or immunostained for detection ofLYVE-1–positive and CD31-positive cells using a DiscoveryXT automated staining processor (Ventana Medical Systems,
Inc.). Immunostaining of lymphatic endothelial cells was car-ried out using a polyclonal rabbit anti-mouse LYVE-1 antibody(4 mg/mL; 103-PA50AG; Cosmo Bio Co. Ltd.) for 2 hours atroom temperature, an anti-rabbit immunoglobulin G (IgG)Histofine MAX-PO (R) Kit (Nichirei Biosciences Inc.) for 16minutes at room temperature, and 3,30-diaminobenzidine(DAB). Immunostaining of vascular endothelial cells was car-ried out using a prediluted polyclonal rabbit anti-CD31 anti-body (1/100 dilution; sc-1506-R; Santa Cruz Biotechnology,Inc.) for 2 hours at room temperature, in combination withan anti-rabbit IgG Histofine MAX-PO (R) kit for 16 minutes atroom temperature.
To obtain themean blood vessel density of themacrovessels,defined as vessels with a diameter greater than or equal to 30mm, the total macrovessel area was measured and the valueobtained was divided by the total area of the specimen. Thespecimen boundary was measured under low magnification(�40 or �100) using a microscope (BX51; Olympus Co.) anddigital camera (DP72; Olympus). The hot-spot method wasused to calculate the mean blood vessel density of the micro-vessels, defined as vessels with a diameter less than 30 mm (29).Specifically, 5 hot-spot fields with the highest microvesseldensity were selected under low magnification (�40 or�100) and the blood vessel density was calculated by dividingthe total microvessel area, consisting of vasculature with aminor axis of 5 to 30 mm (�200) by the CD31-positive hot-spotarea (523mm� 695mm).Measurements of blood vessel densitywere made by 2 researchers to reduce the measurement error.
Statistical analysisAll measurements are presented as either mean � SD or
mean � SEM values. Differences between groups were deter-mined by two-way ANOVA followed by the Tukey–Kramer test(Figs. 1D, 4B, and Fig. 5A) or Student t test (Fig. 6B). Measure-ment of the correlation between luciferase activity (biolumi-nescence imaging) and blood vessel density (ultrasound imag-ing) in metastatic lymph nodes was determined using theSpearman rank correlation coefficient test (Fig. 5B). A P valueof less than 0.05 was considered to represent a statisticallysignificant result. Statistical analyses were conducted usingExcel 2007 (Microsoft) with Statcel2 software.
ResultsMetastasis in the proper ALN
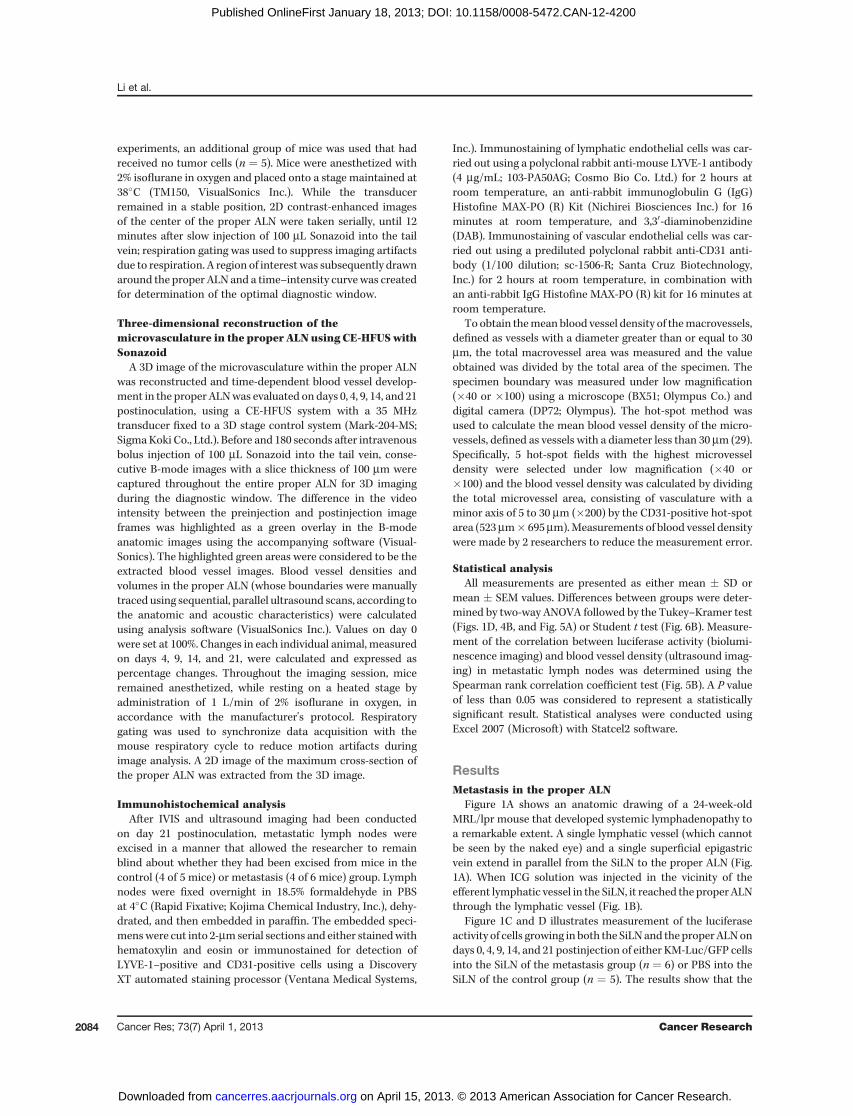
Figure 1A shows an anatomic drawing of a 24-week-oldMRL/lpr mouse that developed systemic lymphadenopathy toa remarkable extent. A single lymphatic vessel (which cannotbe seen by the naked eye) and a single superficial epigastricvein extend in parallel from the SiLN to the proper ALN (Fig.1A). When ICG solution was injected in the vicinity of theefferent lymphatic vessel in the SiLN, it reached the proper ALNthrough the lymphatic vessel (Fig. 1B).
Figure 1C and D illustrates measurement of the luciferaseactivity of cells growing in both the SiLNand the proper ALNondays 0, 4, 9, 14, and 21 postinjection of either KM-Luc/GFP cellsinto the SiLN of the metastasis group (n ¼ 6) or PBS into theSiLN of the control group (n ¼ 5). The results show that the
Li et al.
Cancer Res; 73(7) April 1, 2013 Cancer Research2084
on April 15, 2013. © 2013 American Association for Cancer Research. cancerres.aacrjournals.org Downloaded from
Published OnlineFirst January 18, 2013; DOI: 10.1158/0008-5472.CAN-12-4200
luciferase activities in both the SiLN and the proper ALNincreased over time in the metastasis group. In the SiLN, therewas a steep increase in luciferase activity on day 4, which wasfollowed by a further slight increase up to day 21 (P < 0.01 onday 21, control-SiLN vs. treated-SiLN); in the proper ALN, agradual increase up to day 21 was observed (P < 0.05 on day 21,control-proper-ALN vs. treated-proper-ALN). In the controlgroup, the luciferase activities of both the SiLN and the properALN remained at baseline levels over the course of the exper-imental period.
Determination of the diagnostic windowTo determine the optimal diagnostic window in which the
blood vessel imaging in the presence of Sonazoid was con-
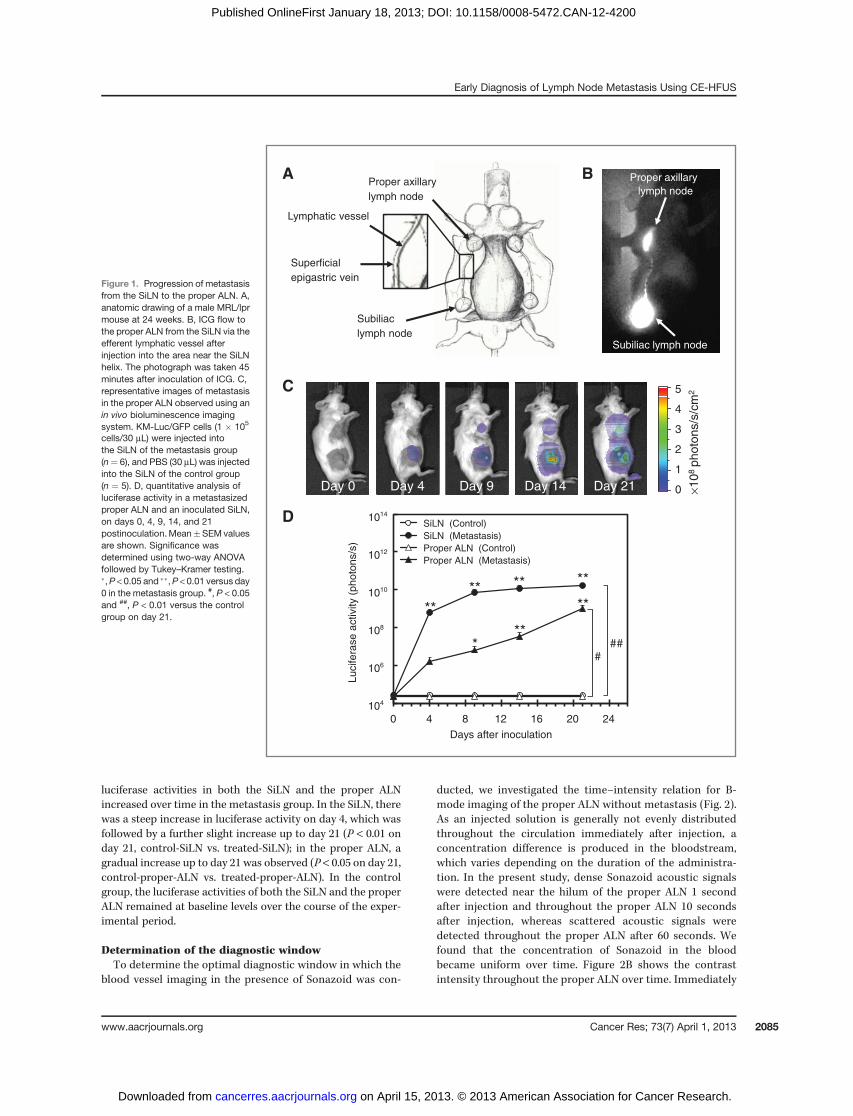
ducted, we investigated the time–intensity relation for B-mode imaging of the proper ALN without metastasis (Fig. 2).As an injected solution is generally not evenly distributedthroughout the circulation immediately after injection, aconcentration difference is produced in the bloodstream,which varies depending on the duration of the administra-tion. In the present study, dense Sonazoid acoustic signalswere detected near the hilum of the proper ALN 1 secondafter injection and throughout the proper ALN 10 secondsafter injection, whereas scattered acoustic signals weredetected throughout the proper ALN after 60 seconds. Wefound that the concentration of Sonazoid in the bloodbecame uniform over time. Figure 2B shows the contrastintensity throughout the proper ALN over time. Immediately
Figure 1. Progression of metastasisfrom the SiLN to the proper ALN. A,anatomic drawing of a male MRL/lprmouse at 24 weeks. B, ICG flow tothe proper ALN from the SiLN via theefferent lymphatic vessel afterinjection into the area near the SiLNhelix. The photograph was taken 45minutes after inoculation of ICG. C,representative images of metastasisin the proper ALN observed using anin vivo bioluminescence imagingsystem. KM-Luc/GFP cells (1 � 105
cells/30 mL) were injected intothe SiLN of the metastasis group(n¼ 6), and PBS (30 mL) was injectedinto the SiLN of the control group(n ¼ 5). D, quantitative analysis ofluciferase activity in a metastasizedproper ALN and an inoculated SiLN,on days 0, 4, 9, 14, and 21postinoculation.Mean�SEMvaluesare shown. Significance wasdetermined using two-way ANOVAfollowed by Tukey–Kramer testing.�,P < 0.05 and ��,P < 0.01 versus day0 in the metastasis group. #, P < 0.05and ##, P < 0.01 versus the controlgroup on day 21.
Lymphatic vessel
Superficial
epigastric vein
Subiliac
lymph node
Proper axillary
lymph node
0 4 8 12 16 20 24
Days after inoculation
SiLN (Control)
SiLN (Metastasis)
Proper ALN (Control)
Proper ALN (Metastasis)
1014
108
1012
1010
106
104
Lucifera
se a
ctivity (
photo
ns/s
)
****
**
**
###
**
***
Day 0 Day 4 Day 9 Day 21Day 14 ×10
8 p
hoto
ns/s
/cm
2 5
4
3
2
1
0
A Proper axillary
lymph node
Subiliac lymph node
B
C
D
Early Diagnosis of Lymph Node Metastasis Using CE-HFUS
www.aacrjournals.org Cancer Res; 73(7) April 1, 2013 2085
on April 15, 2013. © 2013 American Association for Cancer Research. cancerres.aacrjournals.org Downloaded from
Published OnlineFirst January 18, 2013; DOI: 10.1158/0008-5472.CAN-12-4200
after tail-vein injection of Sonazoid, the mean gray-scalevalue initially increased dramatically but then decreasedgradually until 168.0 � 13.7 seconds postinoculation (n ¼5; mean � SD); subsequently, it remained at this decreas-ed level. On the basis of this determination of the optimaldiagnostic window, all ultrasound imaging was conductedbetween 180 and 420 seconds.
Evaluation of the changes in blood vessel volume andlymph node size in the proper ALN
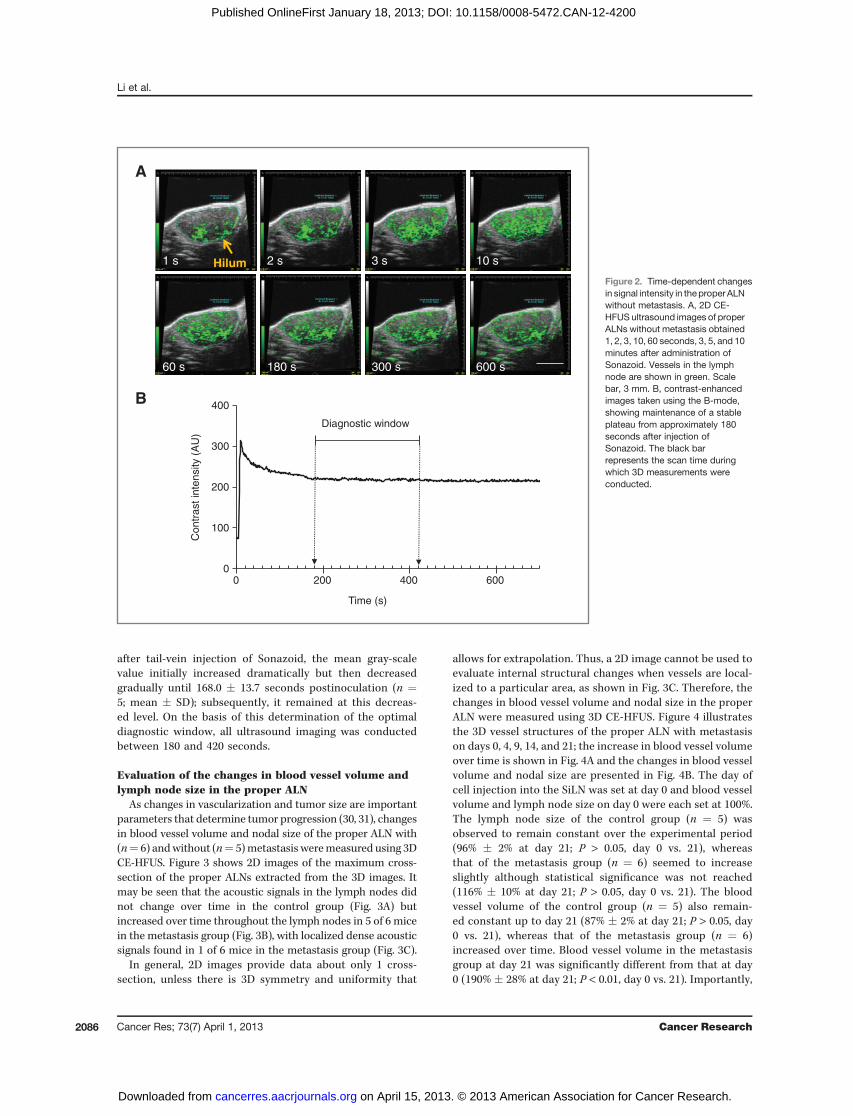
As changes in vascularization and tumor size are importantparameters that determine tumor progression (30, 31), changesin blood vessel volume and nodal size of the proper ALN with(n¼ 6) andwithout (n¼ 5)metastasis weremeasured using 3DCE-HFUS. Figure 3 shows 2D images of the maximum cross-section of the proper ALNs extracted from the 3D images. Itmay be seen that the acoustic signals in the lymph nodes didnot change over time in the control group (Fig. 3A) butincreased over time throughout the lymph nodes in 5 of 6 micein the metastasis group (Fig. 3B), with localized dense acousticsignals found in 1 of 6 mice in the metastasis group (Fig. 3C).
In general, 2D images provide data about only 1 cross-section, unless there is 3D symmetry and uniformity that
allows for extrapolation. Thus, a 2D image cannot be used toevaluate internal structural changes when vessels are local-ized to a particular area, as shown in Fig. 3C. Therefore, thechanges in blood vessel volume and nodal size in the properALN were measured using 3D CE-HFUS. Figure 4 illustratesthe 3D vessel structures of the proper ALN with metastasison days 0, 4, 9, 14, and 21; the increase in blood vessel volumeover time is shown in Fig. 4A and the changes in blood vesselvolume and nodal size are presented in Fig. 4B. The day ofcell injection into the SiLN was set at day 0 and blood vesselvolume and lymph node size on day 0 were each set at 100%.The lymph node size of the control group (n ¼ 5) wasobserved to remain constant over the experimental period(96% � 2% at day 21; P > 0.05, day 0 vs. 21), whereasthat of the metastasis group (n ¼ 6) seemed to increaseslightly although statistical significance was not reached(116% � 10% at day 21; P > 0.05, day 0 vs. 21). The bloodvessel volume of the control group (n ¼ 5) also remain-ed constant up to day 21 (87% � 2% at day 21; P > 0.05, day0 vs. 21), whereas that of the metastasis group (n ¼ 6)increased over time. Blood vessel volume in the metastasisgroup at day 21 was significantly different from that at day0 (190% � 28% at day 21; P < 0.01, day 0 vs. 21). Importantly,
0
100
200
300
400
0 200 400 600
Co
ntr
ast
inte
nsity (
AU
)
Time (s)
Diagnostic window
A
B
1 s 2 s 3 s 10 s
60 s 180 s 300 s 600 s
HilumFigure 2. Time-dependent changesin signal intensity in theproper ALNwithout metastasis. A, 2D CE-HFUS ultrasound images of properALNs without metastasis obtained1, 2, 3, 10, 60 seconds, 3, 5, and 10minutes after administration ofSonazoid. Vessels in the lymphnode are shown in green. Scalebar, 3 mm. B, contrast-enhancedimages taken using the B-mode,showing maintenance of a stableplateau from approximately 180seconds after injection ofSonazoid. The black barrepresents the scan time duringwhich 3D measurements wereconducted.
Li et al.
Cancer Res; 73(7) April 1, 2013 Cancer Research2086
on April 15, 2013. © 2013 American Association for Cancer Research. cancerres.aacrjournals.org Downloaded from
Published OnlineFirst January 18, 2013; DOI: 10.1158/0008-5472.CAN-12-4200

the magnitude of the change in blood vessel volume in themetastasis group at day 21 was found to be significantlydifferent from the magnitude of the change in lymph nodesize (P < 0.05). This finding suggests that angiogenesis is amore important parameter than nodal size for evaluating theprogression of lymph node metastasis in the early stages.
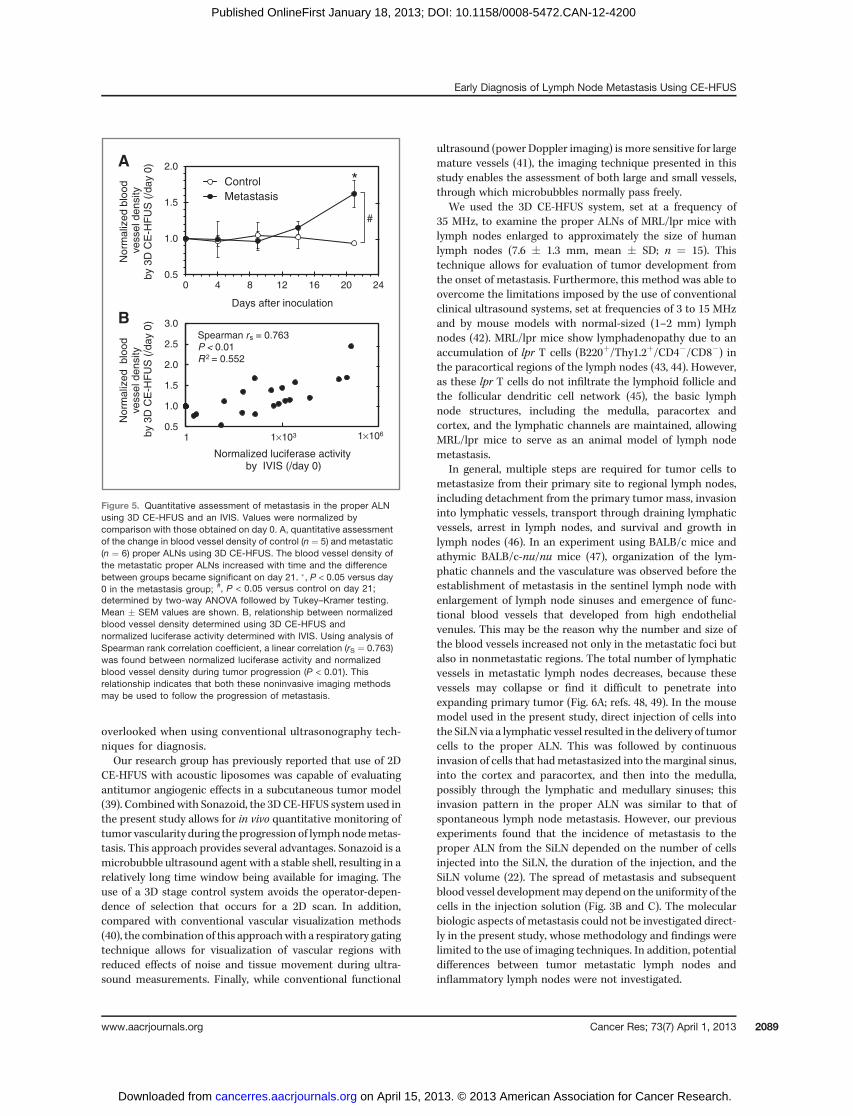
Quantitative analysis of blood vessel density in theproper ALN with metastasisBlood vessel density in the proper ALN was investigated
using 3D CE-HFUS, with vessel density normalized to thedensity measured on day 0. Figure 5A shows that there wasno significant change in normalized blood vessel densityover time in the control group (n ¼ 5) but a 1.62-foldincrease on day 21 compared with day 0 in the metastasisgroup (n ¼ 6; P < 0.05, day 0 vs. 21). In addition, thenormalized blood vessel density of the metastasis groupwas found to be 1.72-fold greater than that of the controlgroup on day 21 (P < 0.05, control vs. metastasis). Figure 5Bshows the correlation between the normalized blood vesseldensity measured using 3D CE-HFUS and the normalizedluciferase activity reflecting the proliferation of tumor cellsas measured using IVIS. There was a positive correlation
between the 2 factors [Spearman rank correlation coefficient(rS) ¼ 0.763, n ¼ 28].
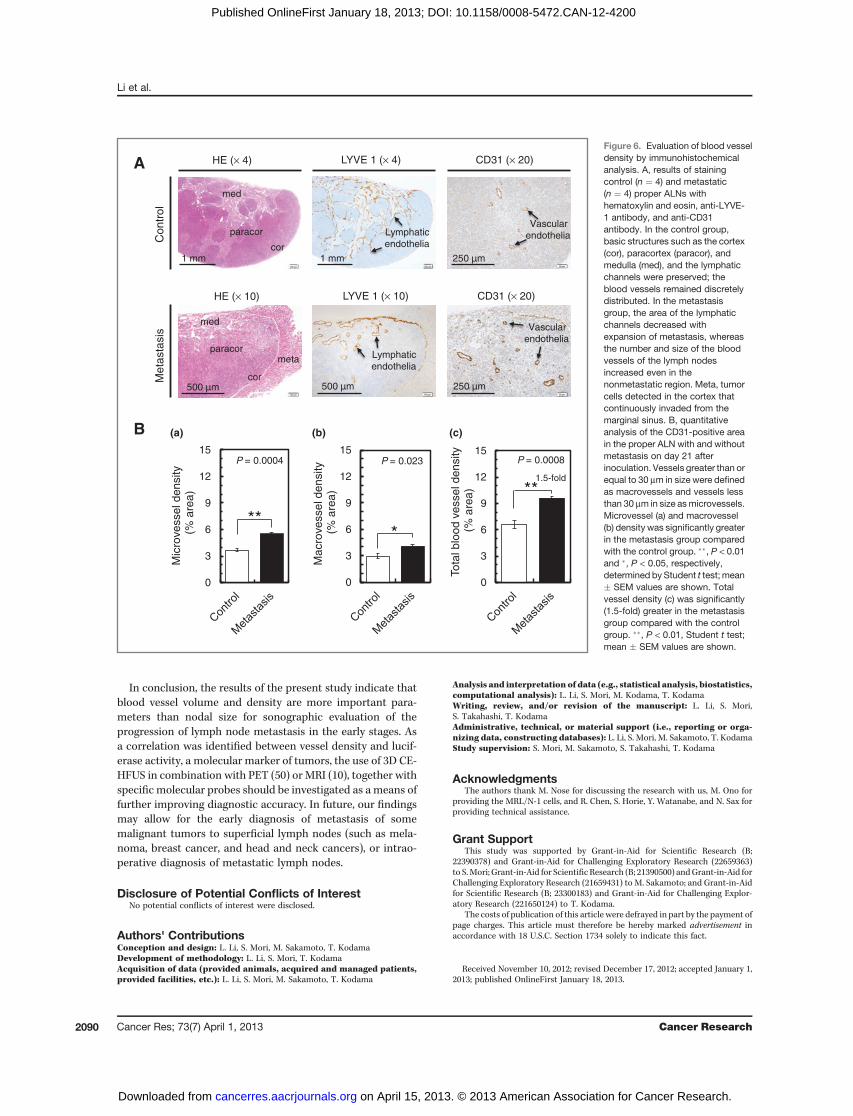
Evaluation of blood vessel density byimmunohistochemical analysis
Analysis of structural changes in the proper ALNs, withand without metastasis, revealed that the basic structures ofthe lymph nodes, such as the medulla, paracortex, andcortex, and the lymphatic channels had been preserved inthe control group. Figure 6 shows that blood vessels could bediscretely observed in the control group. In contrast, con-tinuous invasion of tumor cells from the marginal sinus wasdetected in the cortex of the metastasis group, as well as areduction in the size of LYVE-1–positive regions by theexpansion of metastasis and an increase in the number andsize of the blood vessels of the lymph node, even in non-metastatic regions. Quantification of blood vessel density(measured as blood vessels per unit area) in the properALNs, with and without metastasis, on day 21 revealed thatthe densities of both the microvessels (vessels with a width <30 mm) and macrovessels (vessels with a width � 30 mm) ofthe metastasis group were greater than those of the controlgroup. Specifically, the total vessel density of both
Figure 3. Temporal changes in thevessel structures of control (n ¼ 5)and metastatic (n ¼ 6) lymph nodesassessed using 2D CE-HFUS.Single-slice reconstructed vesselimages with a thickness of 100 mmare presented. Vessels in the properALN are highlighted in green and redcircles indicate the boundaries of thelymph node. In the metastasis group(B and C), no obvious changes invessel structure were observed untilday 9. On day 21, the vesselstructure showed different patterns,with B showing diffusely scatteredblood vessels (n¼ 5) and C showinglocalized dense blood vessels (n¼ 1;blue circle).
Day 0 Day 9 Day 21
B Diffusely-scattered intensity increase (n = 5)
C Localized intensity increase (n = 1)
Day 0 Day 9 Day 21
Meta
sta
sis
Contr
ol
A Almost stable intensity (n = 5)
Day 0 Day 9 Day 21
Hilum
Hilum
Hilum
Early Diagnosis of Lymph Node Metastasis Using CE-HFUS
www.aacrjournals.org Cancer Res; 73(7) April 1, 2013 2087
on April 15, 2013. © 2013 American Association for Cancer Research. cancerres.aacrjournals.org Downloaded from
Published OnlineFirst January 18, 2013; DOI: 10.1158/0008-5472.CAN-12-4200
microvessels and macrovessels in the metastatic properALNs was found to be 1.5-fold greater than that ofthe control proper ALNs (P < 0.01). These changes corre-spond well with the 1.72-fold increase in the metastasisgroup compared with the control group, as shown in Fig. 5A.
DiscussionThe present study is the first to show, using a 3D CE-HFUS
system in combination with Sonazoid that in lymph nodesundergoing metastasis, increases in blood vessel volume anddensity precede changes in nodal size. Despite the fact thatmicroscopic lymph node metastases may be present thatcannot be observed macroscopically and that there may besmall lesions that cannot be detected even by current ultra-sonography techniques, it is nonetheless very important to useultrasonography before treatment to assess lymph nodes lessthan 10 mm in diameter that cannot be detected by CT orMRI, as a diagnostic procedure for lymph node metastasis(32). In this study, using a 3D CE-HFUS system with Sona-zoid, the increases in blood vessel volume and density on day21 were found to be 1.9- and 1.6-fold greater, respectively,than values on day 0, and the increase in blood vessel densitywas positively related to tumor cell proliferation. In contrast,no significant difference was found between the nodal size ofthe proper ALN on day 0 and that on day 21, most likelybecause the normal lymph node tissue had been partially
replaced by infiltrating tumor cells, causing only a slightincrease in nodal size. In addition, neither the emergence ofan echogenic region due to central necrosis (33) nor theabsence of hilum (16) was detected in metastatic lymphnodes until the last day of the experiment (day 21). Theseresults indicate that blood vessel volume and density may beused as ultrasound parameters for diagnosis of early lymphnode metastasis.
In general, normal tissue is invaded and replaced by tumorcells at an early stage of metastasis, resulting in changes inthe microenvironment. These changes include release ofmetalloproteinases that degrade the extracellular matrix,secretion of growth factors to promote neovascularization(34), and development of sinus hyperplasia (35). In thediagnosis of lymph node metastasis by B-scan sonography,the clinical criteria currently used are increases in nodalsize and cortical thickness, changes in nodal shape, infiltra-tion of surrounding structures, presence of inhomogeneousinternal echo patterns (including necrosis), absence of echo-rich hilar structures, and extracapsular spread (14, 36).However, these changes only become pronounced once thetumor has already grown to some extent. In fact, otherstudies have found that the size and shape of lymph nodeswith small metastatic tumors are within the reference rangefor their anatomic positions (37) or only slightly larger thanthose of tumor-free lymph nodes (38). Anticipatory changesin blood vessel volume and density at earlier stages may be
A
B
Day 0 Day 14 Day 21
0 4 8 12 16 20 24 28
Ch
an
ge
in
blo
od
ve
sse
l vo
lum
e
an
d lym
ph
no
de
siz
e
in the p
roper
ALN
(%
)
Days after inoculation
Vessel (Control)
Vessel (Metastasis)
Size (Control)
Size (Metastasis)
60
100
140
180
220
260
##
NS
**
Figure 4. Changes in blood vesselvolume and nodal size of properALNs determined using 3D CE-HFUS. A, 3D images of the bloodvessel structure of the proper ALNwithmetastasis obtained ondays0,14, and 21. The vessels arehighlighted in green. B, changes inblood vessel volume and lymphnode size. Metastasis refers to aproper ALN with metastasis(1 � 105 cells/min; n ¼ 6) andControl to a proper ALN withoutmetastasis (n ¼ 5). Open andclosed circles represent the bloodvessel volumes within the properALNs of the control and metastasisgroups, respectively. Open andclosed triangles represent the sizesof the proper ALNs of the controland metastasis groups,respectively. Values at differenttime points were normalized bycomparison with those on day 0.On day 21, the magnitude of thechange in blood vessel volumewaslarger than the magnitude of thechange in lymph node size.�, temporal change within eachgroup; #, comparison betweengroups. � or #, P < 0.05; �� or ##,P < 0.01; calculated using two-wayANOVA followed by Tukey–Kramertesting. Error bars indicate theSEM.
Li et al.
Cancer Res; 73(7) April 1, 2013 Cancer Research2088
on April 15, 2013. © 2013 American Association for Cancer Research. cancerres.aacrjournals.org Downloaded from
Published OnlineFirst January 18, 2013; DOI: 10.1158/0008-5472.CAN-12-4200
overlooked when using conventional ultrasonography tech-niques for diagnosis.Our research group has previously reported that use of 2D
CE-HFUS with acoustic liposomes was capable of evaluatingantitumor angiogenic effects in a subcutaneous tumor model(39). Combinedwith Sonazoid, the 3DCE-HFUS system used inthe present study allows for in vivo quantitative monitoring oftumor vascularity during the progression of lymphnodemetas-tasis. This approach provides several advantages. Sonazoid is amicrobubble ultrasound agent with a stable shell, resulting in arelatively long time window being available for imaging. Theuse of a 3D stage control system avoids the operator-depen-dence of selection that occurs for a 2D scan. In addition,compared with conventional vascular visualization methods(40), the combination of this approachwith a respiratory gatingtechnique allows for visualization of vascular regions withreduced effects of noise and tissue movement during ultra-sound measurements. Finally, while conventional functional
ultrasound (power Doppler imaging) is more sensitive for largemature vessels (41), the imaging technique presented in thisstudy enables the assessment of both large and small vessels,through which microbubbles normally pass freely.
We used the 3D CE-HFUS system, set at a frequency of35 MHz, to examine the proper ALNs of MRL/lpr mice withlymph nodes enlarged to approximately the size of humanlymph nodes (7.6 � 1.3 mm, mean � SD; n ¼ 15). Thistechnique allows for evaluation of tumor development fromthe onset of metastasis. Furthermore, this method was able toovercome the limitations imposed by the use of conventionalclinical ultrasound systems, set at frequencies of 3 to 15 MHzand by mouse models with normal-sized (1–2 mm) lymphnodes (42). MRL/lpr mice show lymphadenopathy due to anaccumulation of lpr T cells (B220þ/Thy1.2þ/CD4�/CD8�) inthe paracortical regions of the lymph nodes (43, 44). However,as these lpr T cells do not infiltrate the lymphoid follicle andthe follicular dendritic cell network (45), the basic lymphnode structures, including the medulla, paracortex andcortex, and the lymphatic channels are maintained, allowingMRL/lpr mice to serve as an animal model of lymph nodemetastasis.
In general, multiple steps are required for tumor cells tometastasize from their primary site to regional lymph nodes,including detachment from the primary tumor mass, invasioninto lymphatic vessels, transport through draining lymphaticvessels, arrest in lymph nodes, and survival and growth inlymph nodes (46). In an experiment using BALB/c mice andathymic BALB/c-nu/nu mice (47), organization of the lym-phatic channels and the vasculature was observed before theestablishment of metastasis in the sentinel lymph node withenlargement of lymph node sinuses and emergence of func-tional blood vessels that developed from high endothelialvenules. This may be the reason why the number and size ofthe blood vessels increased not only in the metastatic foci butalso in nonmetastatic regions. The total number of lymphaticvessels in metastatic lymph nodes decreases, because thesevessels may collapse or find it difficult to penetrate intoexpanding primary tumor (Fig. 6A; refs. 48, 49). In the mousemodel used in the present study, direct injection of cells intothe SiLN via a lymphatic vessel resulted in the delivery of tumorcells to the proper ALN. This was followed by continuousinvasion of cells that hadmetastasized into themarginal sinus,into the cortex and paracortex, and then into the medulla,possibly through the lymphatic and medullary sinuses; thisinvasion pattern in the proper ALN was similar to that ofspontaneous lymph node metastasis. However, our previousexperiments found that the incidence of metastasis to theproper ALN from the SiLN depended on the number of cellsinjected into the SiLN, the duration of the injection, and theSiLN volume (22). The spread of metastasis and subsequentblood vessel developmentmay depend on the uniformity of thecells in the injection solution (Fig. 3B and C). The molecularbiologic aspects of metastasis could not be investigated direct-ly in the present study, whose methodology and findings werelimited to the use of imaging techniques. In addition, potentialdifferences between tumor metastatic lymph nodes andinflammatory lymph nodes were not investigated.
0.5
1.0
1.5
2.0
2.5
3.0
No
rma
lize
d b
loo
d
ve
sse
l d
en
sity
by 3
D C
E-H
FU
S (
/day 0
)
Normalized luciferase activityby IVIS (/day 0)
1 1×10³ 1×10⁶
Spearman rs = 0.763P < 0.01R2 = 0.552
0.5
1.0
1.5
2.0
0 4 8 12 16 20 24
No
rma
lize
d b
loo
dve
sse
l d
en
sity
by 3
D C
E-H
FU
S (
/day 0
)
Days after inoculation
Control
Metastasis
#
*
B
A
Figure 5. Quantitative assessment of metastasis in the proper ALNusing 3D CE-HFUS and an IVIS. Values were normalized bycomparison with those obtained on day 0. A, quantitative assessmentof the change in blood vessel density of control (n ¼ 5) and metastatic(n ¼ 6) proper ALNs using 3D CE-HFUS. The blood vessel density ofthe metastatic proper ALNs increased with time and the differencebetween groups became significant on day 21. �, P < 0.05 versus day0 in the metastasis group; #, P < 0.05 versus control on day 21;determined by two-way ANOVA followed by Tukey–Kramer testing.Mean � SEM values are shown. B, relationship between normalizedblood vessel density determined using 3D CE-HFUS andnormalized luciferase activity determined with IVIS. Using analysis ofSpearman rank correlation coefficient, a linear correlation (rS ¼ 0.763)was found between normalized luciferase activity and normalizedblood vessel density during tumor progression (P < 0.01). Thisrelationship indicates that both these noninvasive imaging methodsmay be used to follow the progression of metastasis.
Early Diagnosis of Lymph Node Metastasis Using CE-HFUS
www.aacrjournals.org Cancer Res; 73(7) April 1, 2013 2089
on April 15, 2013. © 2013 American Association for Cancer Research. cancerres.aacrjournals.org Downloaded from
Published OnlineFirst January 18, 2013; DOI: 10.1158/0008-5472.CAN-12-4200
In conclusion, the results of the present study indicate thatblood vessel volume and density are more important para-meters than nodal size for sonographic evaluation of theprogression of lymph node metastasis in the early stages. Asa correlation was identified between vessel density and lucif-erase activity, a molecular marker of tumors, the use of 3D CE-HFUS in combination with PET (50) or MRI (10), together withspecific molecular probes should be investigated as ameans offurther improving diagnostic accuracy. In future, our findingsmay allow for the early diagnosis of metastasis of somemalignant tumors to superficial lymph nodes (such as mela-noma, breast cancer, and head and neck cancers), or intrao-perative diagnosis of metastatic lymph nodes.
Disclosure of Potential Conflicts of InterestNo potential conflicts of interest were disclosed.
Authors' ContributionsConception and design: L. Li, S. Mori, M. Sakamoto, T. KodamaDevelopment of methodology: L. Li, S. Mori, T. KodamaAcquisition of data (provided animals, acquired and managed patients,provided facilities, etc.): L. Li, S. Mori, M. Sakamoto, T. Kodama
Analysis and interpretation of data (e.g., statistical analysis, biostatistics,computational analysis): L. Li, S. Mori, M. Kodama, T. KodamaWriting, review, and/or revision of the manuscript: L. Li, S. Mori,S. Takahashi, T. KodamaAdministrative, technical, or material support (i.e., reporting or orga-nizing data, constructing databases): L. Li, S. Mori, M. Sakamoto, T. KodamaStudy supervision: S. Mori, M. Sakamoto, S. Takahashi, T. Kodama
AcknowledgmentsThe authors thank M. Nose for discussing the research with us, M. Ono for
providing the MRL/N-1 cells, and R. Chen, S. Horie, Y. Watanabe, and N. Sax forproviding technical assistance.
Grant SupportThis study was supported by Grant-in-Aid for Scientific Research (B;
22390378) and Grant-in-Aid for Challenging Exploratory Research (22659363)to S.Mori; Grant-in-Aid for Scientific Research (B; 21390500) andGrant-in-Aid forChallenging Exploratory Research (21659431) to M. Sakamoto; and Grant-in-Aidfor Scientific Research (B; 23300183) and Grant-in-Aid for Challenging Explor-atory Research (221650124) to T. Kodama.
The costs of publication of this article were defrayed in part by the payment ofpage charges. This article must therefore be hereby marked advertisement inaccordance with 18 U.S.C. Section 1734 solely to indicate this fact.
Received November 10, 2012; revised December 17, 2012; accepted January 1,2013; published OnlineFirst January 18, 2013.
0
3
6
9
12
15
Mic
rove
sse
ld
en
sity
(% a
rea
)
P = 0.0004
**
500 µm
0
3
6
9
12
15To
tal b
loo
d v
esse
l d
en
sity
(% a
rea
) **1.5-fold
P = 0.0008
(a) (c)(b)
Contr
ol
Me
tasta
sis
A
B
HE (× 10) LYVE 1 (× 10) CD31 (× 20)
HE (× 4) LYVE 1 (× 4) CD31 (× 20)
cor
paracor
med
meta
cor
paracor
med
1 mm
500 µm
1 mm 250 µm
250 µm
Lymphatic
endothelia
Lymphatic
endothelia
Vascular
endothelia
Vascular
endothelia
0
3
6
9
12
15
Ma
cro
ve
sse
l de
nsity
(% a
rea
)
*
P = 0.023
Figure 6. Evaluation of blood vesseldensity by immunohistochemicalanalysis. A, results of stainingcontrol (n ¼ 4) and metastatic(n ¼ 4) proper ALNs withhematoxylin and eosin, anti-LYVE-1 antibody, and anti-CD31antibody. In the control group,basic structures such as the cortex(cor), paracortex (paracor), andmedulla (med), and the lymphaticchannels were preserved; theblood vessels remained discretelydistributed. In the metastasisgroup, the area of the lymphaticchannels decreased withexpansion of metastasis, whereasthe number and size of the bloodvessels of the lymph nodesincreased even in thenonmetastatic region. Meta, tumorcells detected in the cortex thatcontinuously invaded from themarginal sinus. B, quantitativeanalysis of the CD31-positive areain the proper ALN with and withoutmetastasis on day 21 afterinoculation. Vessels greater than orequal to 30 mm in size were definedas macrovessels and vessels lessthan 30 mm in size asmicrovessels.Microvessel (a) and macrovessel(b) density was significantly greaterin the metastasis group comparedwith the control group. ��, P < 0.01and �, P < 0.05, respectively,determined by Student t test; mean� SEM values are shown. Totalvessel density (c) was significantly(1.5-fold) greater in the metastasisgroup compared with the controlgroup. ��, P < 0.01, Student t test;mean � SEM values are shown.
Li et al.
Cancer Res; 73(7) April 1, 2013 Cancer Research2090
on April 15, 2013. © 2013 American Association for Cancer Research. cancerres.aacrjournals.org Downloaded from
Published OnlineFirst January 18, 2013; DOI: 10.1158/0008-5472.CAN-12-4200
References1. Hanahan D, Weinberg RA. The hallmarks of cancer. Cell 2000;100:
57–70.2. Swartz MA, Lund AW. Lymphatic and interstitial flow in the tumour
microenvironment: linking mechanobiology with immunity. Nat RevCancer 2012;12:210–9.
3. Jain R, Dandekar P, Patravale V. Diagnostic nanocarriers for sentinellymph node imaging. J Control Release 2009;138:90–102.
4. Jaffer FA, Weissleder R. Molecular imaging in the clinical arena. JAMA2005;293:855–62.
5. SeverAR,Mills P, JonesSE,CoxK,Weeks J, FishD, et al. Preoperativesentinel node identification with ultrasound using microbubbles inpatients with breast cancer. AJR Am J Roentgenol 2011;196:251–6.
6. Yoon JH, Kim JY, Moon HJ, Youk JH, Son EJ, Kim EK, et al. Contri-bution of computed tomography to ultrasound in predicting laterallymph node metastasis in patients with papillary thyroid carcinoma.Ann Surg Oncol 2011;18:1734–41.
7. Harnan SE, Cooper KL, Meng Y, Ward SE, Fitzgerald P, PapaioannouD, et al. Magnetic resonance for assessment of axillary lymph nodestatus in early breast cancer: a systematic review and meta-analysis.Eur J Surg Oncol 2011;37:928–36.
8. Sironi S, Buda A, Picchio M, Perego P, Moreni R, Pellegrino A, et al.Lymph node metastasis in patients with clinical early-stage cervicalcancer: detection with integrated FDG PET/CT. Radiology 2006;238:272–9.
9. Kim HY, Yi CA, Lee KS, Chung MJ, Kim YK, Choi BK, et al. Nodalmetastasis in non–small cell lung cancer: accuracy of 3.0-T MRimaging. Radiology 2008;246:596–604.
10. Zhang F, Zhu L, Huang X, Niu G, Chen X. Differentiation of reactive andtumor metastatic lymph nodes with diffusion-weighted and SPIO-enhanced MRI. Mol Imaging Biol 2013;15:40–7.
11. Crippa F, Leutner M, Belli F, Gallino F, Greco M, Pilotti S, et al. Whichkinds of lymph nodemetastases can FDG PET detect? A clinical studyin melanoma. J Nucl Med 2000;41:1491–4.
12. Sharan S, Grigg JR, Higgins RA. Nanophthalmos: ultrasound biomi-croscopy and Pentacam assessment of angle structures before andafter cataract surgery. J Cataract Refract Surg 2006;32:1052–5.
13. Giancarlo T, Palmieri A, Giacomarra V, Russolo M. Pre-operativeevaluation of cervical adenopathies in tumours of the upper aerodi-gestive tract. Anticancer Res 1998;18:2805–9.
14. De Swarte M, Alexander K, Rannou B, D'Anjou MA, Blond L, Beau-champ G. Comparison of sonographic features of benign and neo-plastic deep lymph nodes in dogs. Vet Radiol Ultrasound 2011;52:451–6.
15. Esen G. Ultrasound of superficial lymph nodes. Eur J Radiol 2006;58:345–59.
16. van den Brekel MW, Castelijns JA, Snow GB. The size of lymph nodesin the neck on sonograms as a radiologic criterion for metastasis: howreliable is it? AJNR Am J Neuroradiol 1998;19:695–700.
17. YingM,AhujaA,BrookF.Accuracy of sonographic vascular features indifferentiating different causes of cervical lymphadenopathy. Ultra-sound Med Biol 2004;30:441–7.
18. Kagawa T, Yuasa K, Fukunari F, Shiraishi T, Miwa K. Quantitativeevaluation of vascularity within cervical lymph nodes using Dopplerultrasound in patients with oral cancer: relation to lymph node size.Dentomaxillofac Radiol 2011;40:415–21.
19. SibonC,ChagnonS, Tchakerian A, BafountaML, LongvertC,Clerici T,et al. The contribution of high-resolution ultrasonography in preoper-atively detecting sentinel-node metastases in melanoma patients.Melanoma Res 2007;17:233–7.
20. Hinz T,Wilsmann-Theis D, Buchner A,Wenzel J,Wendtner CM, BieberT, et al. High-resolution ultrasound combined with power Dopplersonography can reduce the number of sentinel lymph node biopsies incutaneous melanoma. Dermatology 2011;222:180–8.
21. Servais EL, ColovosC, Bograd AJ,White J, SadelainM, Adusumilli PS.Animal models andmolecular imaging tools to investigate lymph nodemetastases. J Mol Med (Berl) 2011;89:753–69.
22. Li L, Mori S, Sakamoto M, Takahashi S, Kodama T. Mouse model oflymph nodemetastasis via afferent lymphatic vessels for developmentof imaging modalities. PLoS one. 2013;8:e55797.
23. Van den Broeck W, Derore A, Simoens P. Anatomy and nomenclatureof murine lymph nodes: descriptive study and nomenclatory stan-dardization in BALB/cAnNCrl mice. J Immunol Methods 2006;312:12–9.
24. Ito MR, Terasaki S, Itoh J, Katoh H, Yonehara S, Nose M. Rheumaticdiseases in an MRL strain of mice with a deficit in the functional Fasligand. Arthritis Rheum 1997;40:1054–63.
25. Furukawa H, Kitazawa H, Kaneko I, Kikuchi K, Tohma S, NoseM, et al.Mast cells inhibit CD8þTcell-mediated rejection of amalignant fibroushistiocytoma-like tumor: involvement of Fas-Fas ligand axis. AmJ Immunol 2009;5:89–97.
26. Murphy ED, Roths JB. Autoimmunity and lymphoproliferation: induc-tion by mutant gene lpr, and acceleration by a male-associated factorin strain BXSB mice. In:Rose NR, Bigazzi PE, Warner LN, editors.Developments in immunology, vol. 1. New York: Elsevier/North-Hol-land; 1978. p. 207–21.
27. Dickson PV, Hamner B, NgCY, Hall MM, Zhou J, Hargrove PW, et al. Invivo bioluminescence imaging for early detection and monitoring ofdisease progression in a murine model of neuroblastoma. J PediatrSurg 2007;42:1172–9.
28. Sontum PC. Physicochemical characteristics of Sonazoid, a newcontrast agent for ultrasound imaging. Ultrasound Med Biol 2008;34:824–33.
29. de Jong JS, van Diest PJ, Baak JP. Hot spot microvessel densityand the mitotic activity index are strong additional prognosticindicators in invasive breast cancer. Histopathology 2000;36:306–12.
30. Xuan JW, Bygrave M, Jiang H, Valiyeva F, Dunmore-Buyze J, Holds-worth DW, et al. Functional neoangiogenesis imaging of geneticallyengineered mouse prostate cancer using three-dimensional powerDoppler ultrasound. Cancer Res 2007;67:2830–9.
31. Jugold M, Palmowski M, Huppert J, Woenne EC, Mueller MM, Semm-ler W, et al. Volumetric high-frequency Doppler ultrasound enables theassessment of early antiangiogenic therapy effects on tumor xeno-grafts in nude mice. Eur Radiol 2008;18:753–8.
32. Furukawa MK, Furukawa M. Diagnosis of lymph node metastases ofhead and neck cancer and evaluation of effects of chemoradiotherapyusing ultrasonography. Int J Clin Oncol 2010;15:23–32.
33. Catalano MF, Sivak MV Jr, Rice T, Gragg LA, Van Dam J. Endosono-graphic features predictive of lymph node metastasis. GastrointestEndosc 1994;40:442–6.
34. YoongKF, Afford SC,RandhawaS,Hubscher SG,AdamsDH. Fas/Fasligand interaction in human colorectal hepatic metastases: a mecha-nism of hepatocyte destruction to facilitate local tumor invasion. AmJ Pathol 1999;154:693–703.
35. Gannon PO, Alam Fahmy M, Begin LR, Djoukhadjian A, Filali-Mou-him A, Lapointe R, et al. Presence of prostate cancer metastasiscorrelates with lower lymph node reactivity. Prostate 2006;66:1710–20.
36. Zenk J, Bozzato A, Hornung J, Gottwald F, Rabe C, Gill S, et al. Necklymph nodes: prediction by computer-assisted contrast medium ana-lysis? Ultrasound Med Biol 2007;33:246–53.
37. Woolgar JA. Micrometastasis in oral/oropharyngeal squamous cellcarcinoma: incidence, histopathological features and clinical implica-tions. Br J Oral Maxillofac Surg 1999;37:181–6.
38. Moll R, Ramaswamy A. In:Werner JA, Davis RK, editors. Metastases inhead and neck cancer. Berlin, Heidelberg, New York: Springer; 2004.Chapter 3, p. 70–2.
39. KodamaT, TomitaN,YagishitaY,HorieS, FunamotoK,HayaseT, et al.Volumetric and angiogenic evaluation of antitumor effects with acous-tic liposome and high-frequency ultrasound. Cancer Res 2011;71:6957–64.
40. Pysz MA, Foygel K, Panje CM, Needles A, Tian L, Willmann JK.Assessment andmonitoring tumor vascularitywith contrast-enhancedultrasound maximum intensity persistence imaging. Invest Radiol2011;46:187–95.
41. Turkbey B, Kobayashi H, Ogawa M, Bernardo M, Choyke PL. Imagingof tumor angiogenesis: functional or targeted? AJR Am J Roentgenol2009;193:304–13.
Early Diagnosis of Lymph Node Metastasis Using CE-HFUS
www.aacrjournals.org Cancer Res; 73(7) April 1, 2013 2091
on April 15, 2013. © 2013 American Association for Cancer Research. cancerres.aacrjournals.org Downloaded from
Published OnlineFirst January 18, 2013; DOI: 10.1158/0008-5472.CAN-12-4200
42. Economopoulos V, Noad JC, Krishnamoorthy S, Rutt BK, Foster PJ.Comparing theMRI appearanceof the lymphnodes and spleen inwild-type and immuno-deficient mouse strains. PLoS ONE 2011;6:e27508.
43. Morse HC III, DavidsonWF, Yetter RA,Murphy ED, Roths JB, CoffmanRL. Abnormalities induced by the mutant gene Ipr: expansion of aunique lymphocyte subset. J Immunol 1982;129:2612–5.
44. Davidson WF, Dumont FJ, Bedigian HG, Fowlkes BJ, Morse HC III.Phenotypic, functional, and molecular genetic comparisons of theabnormal lymphoid cells of C3H-lpr/lpr and C3H-gld/gld mice.J Immunol 1986;136:4075–84.
45. Masuda A, Kasajima T. Follicular dendritic cell dysfunction and dis-organization of lymphoid structures in MRL/lpr mice. Lab Invest1999;79:849–57.
46. Hoshida T, IsakaN, Hagendoorn J, di Tomaso E, Chen YL, Pytowski B,et al. Imaging steps of lymphatic metastasis reveals that vascularendothelial growth factor-C increases metastasis by increasing deliv-
ery of cancer cells to lymph nodes: therapeutic implications. CancerRes 2006;66:8065–75.
47. Qiao J, Kottke T, Willmon C, Galivo F, Wongthida P, Diaz RM, et al.Purging metastases in lymphoid organs using a combination of anti-gen-nonspecific adoptive T cell therapy, oncolytic virotherapy andimmunotherapy. Nat Med 2008;14:37–44.
48. Stacker SA, Achen MG, Jussila L, Baldwin ME, Alitalo K. Lymphan-giogenesis and cancer metastasis. Nat Rev Cancer 2002;2:573–83.
49. Bono P, Wasenius VM, Heikkila P, Lundin J, Jackson DG, JoensuuH. High LYVE-1-positive lymphatic vessel numbers are associatedwith poor outcome in breast cancer. Clin Cancer Res 2004;10:7144–9.
50. Mumprecht V, Honer M, Vigl B, Proulx ST, Trachsel E, Kaspar M, et al.In vivo imaging of inflammation- and tumor-induced lymph nodelymphangiogenesis by immuno-positron emission tomography.Cancer Res 2010;70:8842–51.
Li et al.
Cancer Res; 73(7) April 1, 2013 Cancer Research2092
on April 15, 2013. © 2013 American Association for Cancer Research. cancerres.aacrjournals.org Downloaded from
Published OnlineFirst January 18, 2013; DOI: 10.1158/0008-5472.CAN-12-4200