Embed Size (px)
Citation preview
Enhanced Narrowband Signal Detection and Estimation with a Synthetic Antenna
Array for Location Applications
Ali BroumandanPosition, Location And Navigation (PLAN) Group
University of Calgary2 October, 2009
ION Alberta Lunch Meeting
Enhanced Narrowband Signal Detection and Estimation with a Synthetic Antenna2 / 18
Outline• Motivation and applications of antenna array
systems• Signal detection challenges in fading environments• Signal detection performance by using a static
antenna • Signal detection performance by utilizing a moving
antenna• Analysis of processing gain in uncorrelated Channel• Analysis of processing gain in correlated Channel
• Data collection and performance verification• Conclusions
Enhanced Narrowband Signal Detection and Estimation with a Synthetic Antenna3 / 18
21
54
(10 ) 9.5 10
(10 ) 8.2 10
P dB
P dB
−
−
= ×
= × 1 2 3 4 5 6 7 8 9 10-20
-10
0
10
20
30
40
time (s)
SNR
(dB
)
Antenna 1Antenna 2
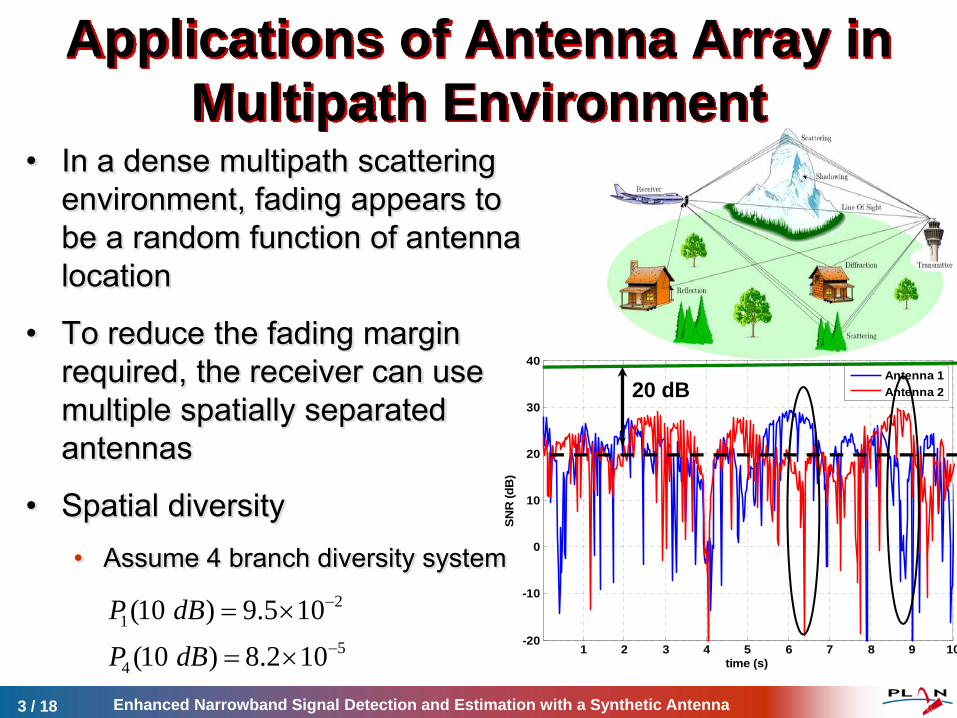
• In a dense multipath scattering environment, fading appears to be a random function of antenna location
• To reduce the fading margin required, the receiver can use multiple spatially separated antennas
• Spatial diversity• Assume 4 branch diversity system
Applications of Antenna Array in Multipath Environment
20 dB
Enhanced Narrowband Signal Detection and Estimation with a Synthetic Antenna4 / 18
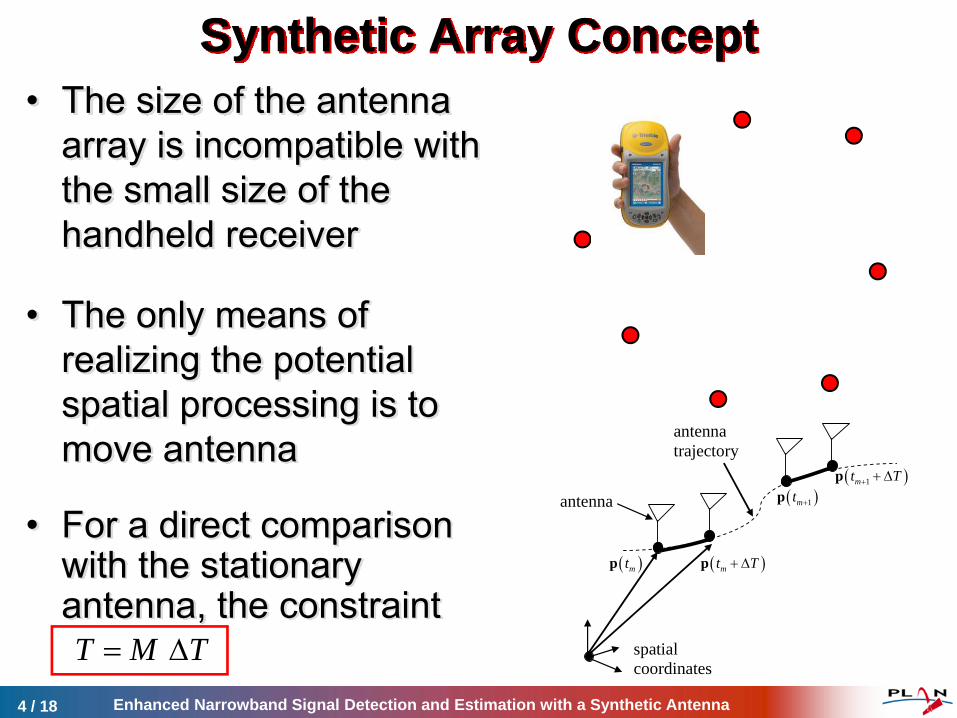
Synthetic Array Concept • The size of the antenna
array is incompatible with the small size of the handheld receiver
• The only means of realizing the potential spatial processing is to move antenna
• For a direct comparison with the stationary antenna, the constraint
antenna
( )mt T+ Δp ( )mtp
( )1mt +p ( )1mt T+ + Δp
antenna trajectory
spatial coordinates
T M T= Δ
Enhanced Narrowband Signal Detection and Estimation with a Synthetic Antenna5 / 18
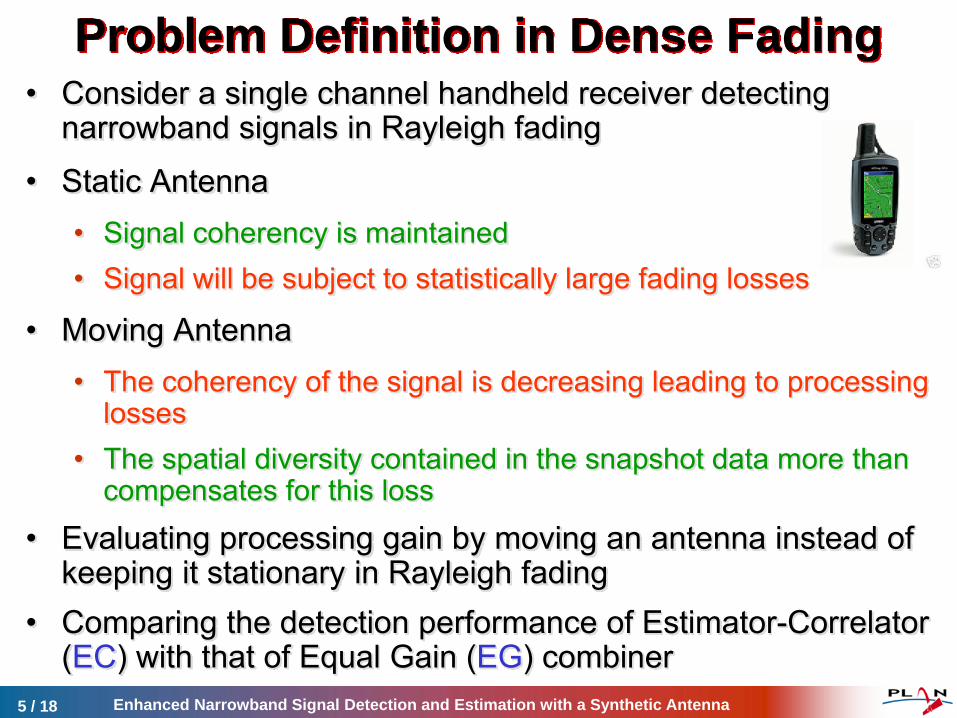
Problem Definition in Dense Fading• Consider a single channel handheld receiver detecting
narrowband signals in Rayleigh fading
• Static Antenna• Signal coherency is maintained• Signal will be subject to statistically large fading losses
• Moving Antenna• The coherency of the signal is decreasing leading to processing
losses• The spatial diversity contained in the snapshot data more than
compensates for this loss• Evaluating processing gain by moving an antenna instead of
keeping it stationary in Rayleigh fading• Comparing the detection performance of Estimator-Correlator
(EC) with that of Equal Gain (EG) combiner
Signal Detection Performance in Fading Environments with a Moving Antenna 6 / 18
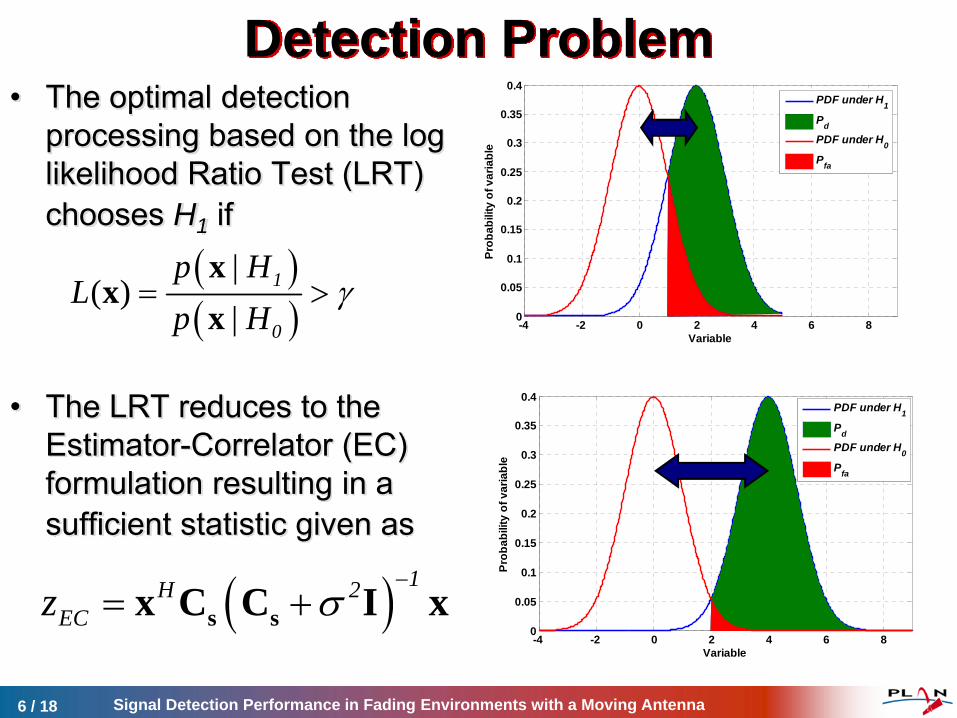
Detection Problem• The optimal detection
processing based on the log likelihood Ratio Test (LRT) chooses H1 if
• The LRT reduces to the Estimator-Correlator (EC) formulation resulting in a sufficient statistic given as
( )( )
|( )
|1
0
p HL
p Hγ= >
xx
x
( ) 1H 2ECz σ
−= +s sx C C I x
-4 -2 0 2 4 6 80
0.05
0.1
0.15
0.2
0.25
0.3
0.35
0.4
Variable
Prob
abili
ty o
f var
iabl
e
PDF under H1
Pd
PDF under H0
Pfa
-4 -2 0 2 4 6 80
0.05
0.1
0.15
0.2
0.25
0.3
0.35
0.4
Variable
Prob
abili
ty o
f var
iabl
e
PDF under H1
Pd
PDF under H0
Pfa
Signal Detection Performance in Fading Environments with a Moving Antenna 7 / 18
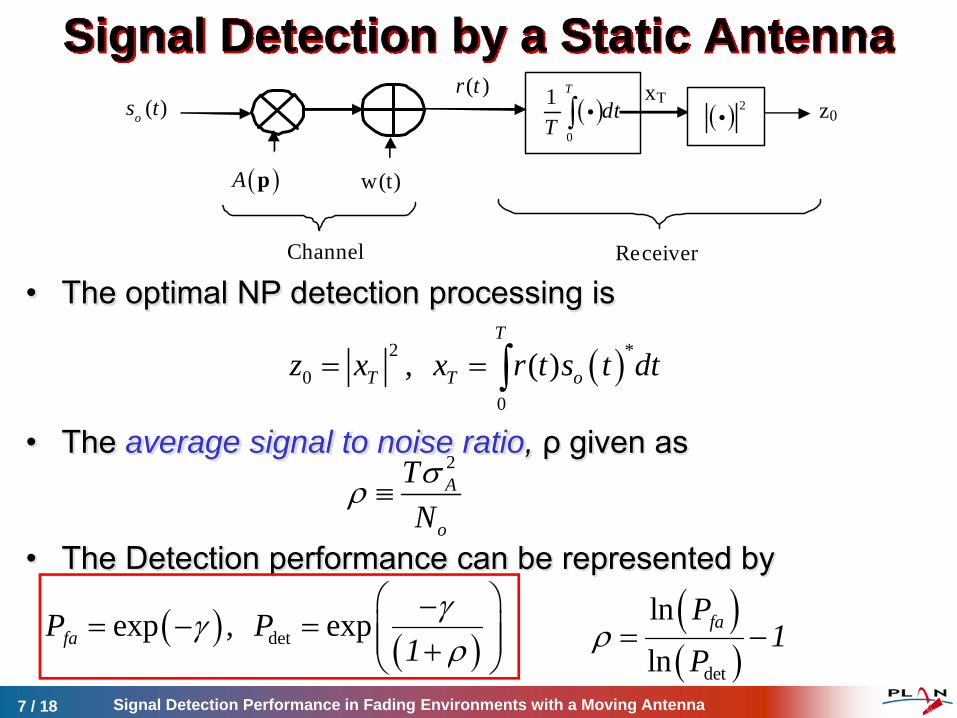
Signal Detection by a Static Antenna
• The optimal NP detection processing is
• The average signal to noise ratio, ρ given as
• The Detection performance can be represented by
( )os t ( )0
1 T
dtT ∫ i
w(t)
z0
Channel
( )A p
Receiver
( )r t( ) 2i
xT
( )2 *0
0
, ( )T
T T oz x x r t s t dt= = ∫
( ) ( )detexp , expfaP P1γγρ
⎛ ⎞−= − = ⎜ ⎟⎜ ⎟+⎝ ⎠
2A
o
TNσρ ≡
( )( )det
lnln
faP1
Pρ = −
Enhanced Narrowband Signal Detection and Estimation with a Synthetic Antenna8 / 18
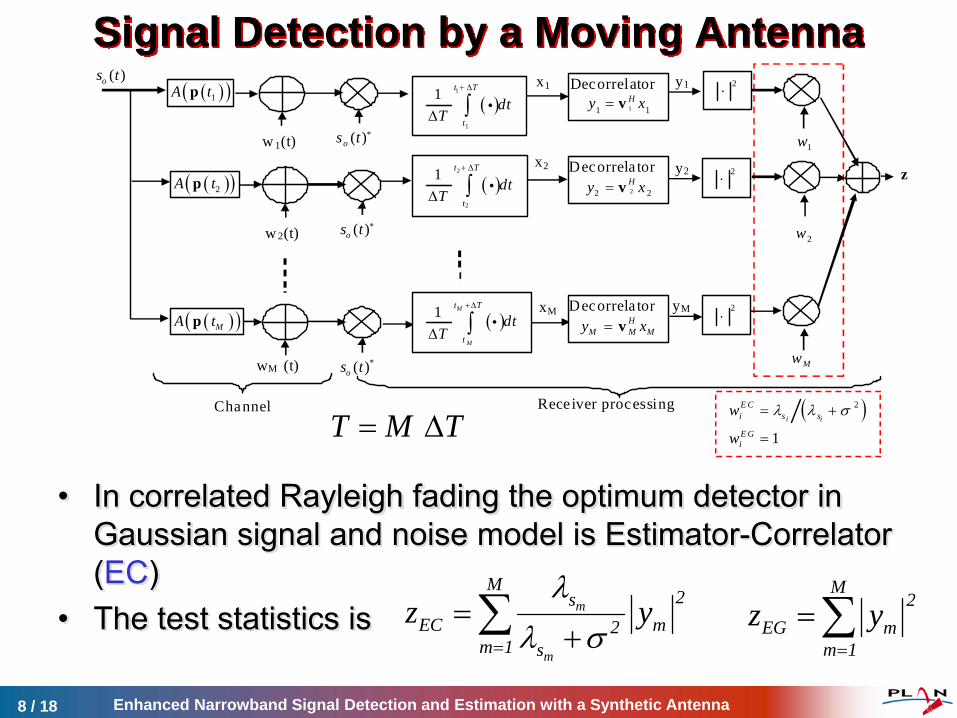
Signal Detection by a Moving Antenna
• In correlated Rayleigh fading the optimum detector in Gaussian signal and noise model is Estimator-Correlator(EC)
• The test statistics is
x1
x2
xM
Channel
( )os t
w 1(t)
( )( )1A tp
( )os t ∗
w 2(t)
( )( )2A tp
( )os t ∗
wM (t)
( )( )MA tp
( )os t ∗
( )1
1
1 t T
t
dtT
+ Δ
Δ ∫ i
( )2
2
1 t T
t
dtT
+ Δ
Δ ∫ i
( )1 M
M
t T
t
dtT
+Δ
Δ ∫ i
Rece iver processing
Decorrelator 11 1Hy x= v
Decorrela tor H
M M My x= v
Decorrela tor 22 2Hy x= v
y1
y2
yM
2⋅
2⋅
2⋅
1w
( )2
1i i
E Ci s s
E Gi
w
w
λ λ σ= +
=
2w
Mw
z
m
m
M2s
EC m2m 1 s
z yλ
λ σ=
=+∑
M2
EG mm 1
z y=
=∑
T M T= Δ
Signal Detection and Estimation Utilizing the Synthetic Array9 / 18
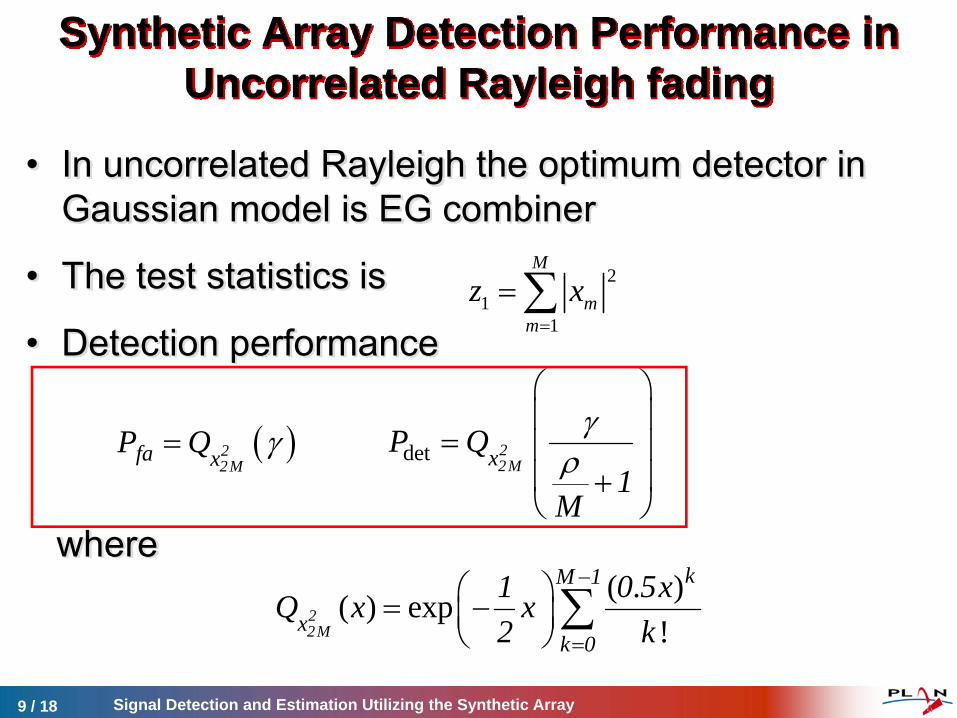
Synthetic Array Detection Performance in Uncorrelated Rayleigh fading
• In uncorrelated Rayleigh the optimum detector in Gaussian model is EG combiner
• The test statistics is
• Detection performance
where
21
1
M
mm
z x=
= ∑
( )22M
fa xP Q γ= det 22MxP Q
1M
γρ
⎛ ⎞⎜ ⎟
= ⎜ ⎟⎜ ⎟+⎝ ⎠
( . )( ) exp!
22M
kM 1
xk 0
1 0 5xQ x x2 k
−
=
⎛ ⎞= −⎜ ⎟⎝ ⎠
∑
Enhanced Narrowband Signal Detection and Estimation with a Synthetic Antenna10 / 18
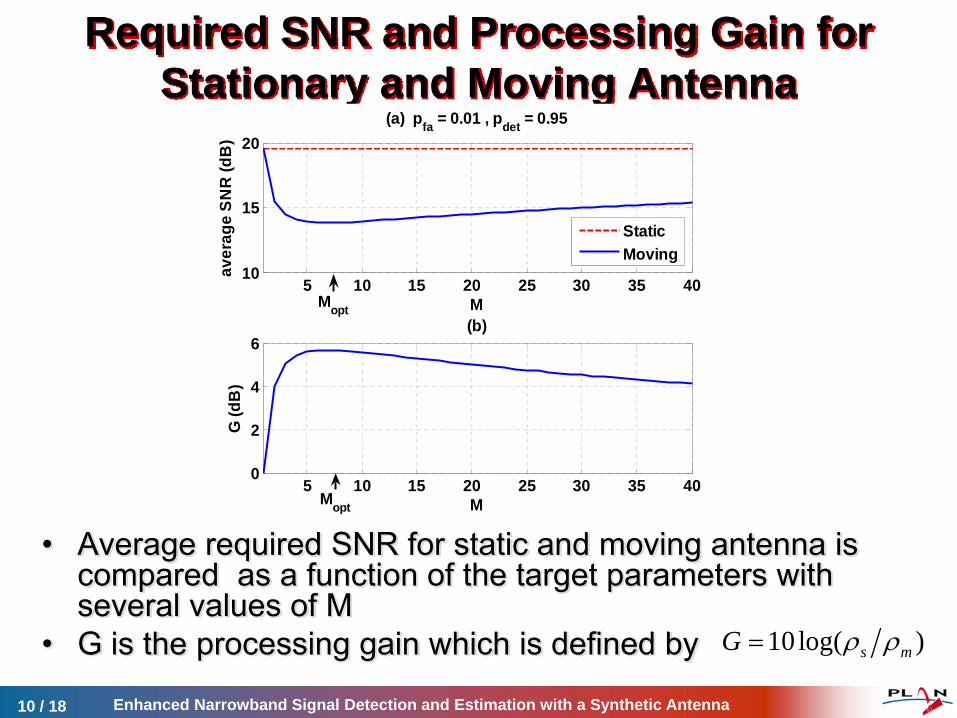
Required SNR and Processing Gain for Stationary and Moving Antenna
• Average required SNR for static and moving antenna is compared as a function of the target parameters with several values of M
• G is the processing gain which is defined by
5 10 15 20 25 30 35 4010
15
20
M
aver
age
SNR
(dB
)
(a) pfa = 0.01 , pdet = 0.95
5 10 15 20 25 30 35 400
2
4
6
M
G (d
B)
(b)
StaticMoving
Mopt
Mopt
10log( )s mG ρ ρ=
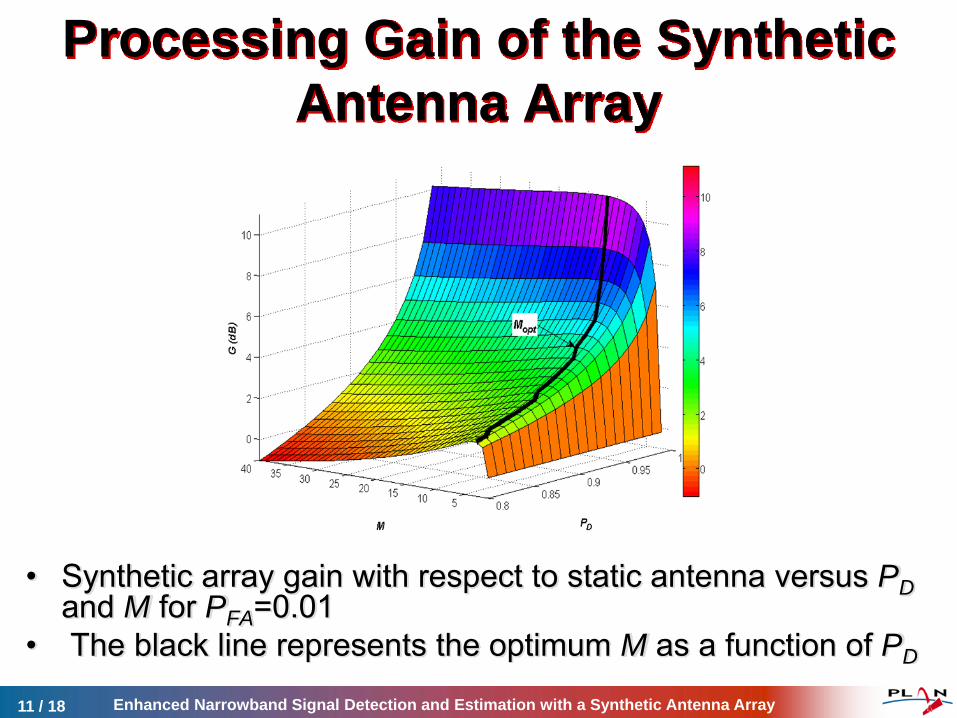
Processing Gain of the Synthetic Antenna Array
Enhanced Narrowband Signal Detection and Estimation with a Synthetic Antenna Array 11 / 18
• Synthetic array gain with respect to static antenna versus PDand M for PFA=0.01
• The black line represents the optimum M as a function of PD
Signal Detection Performance in Fading Environments with a Moving Antenna 12 / 18
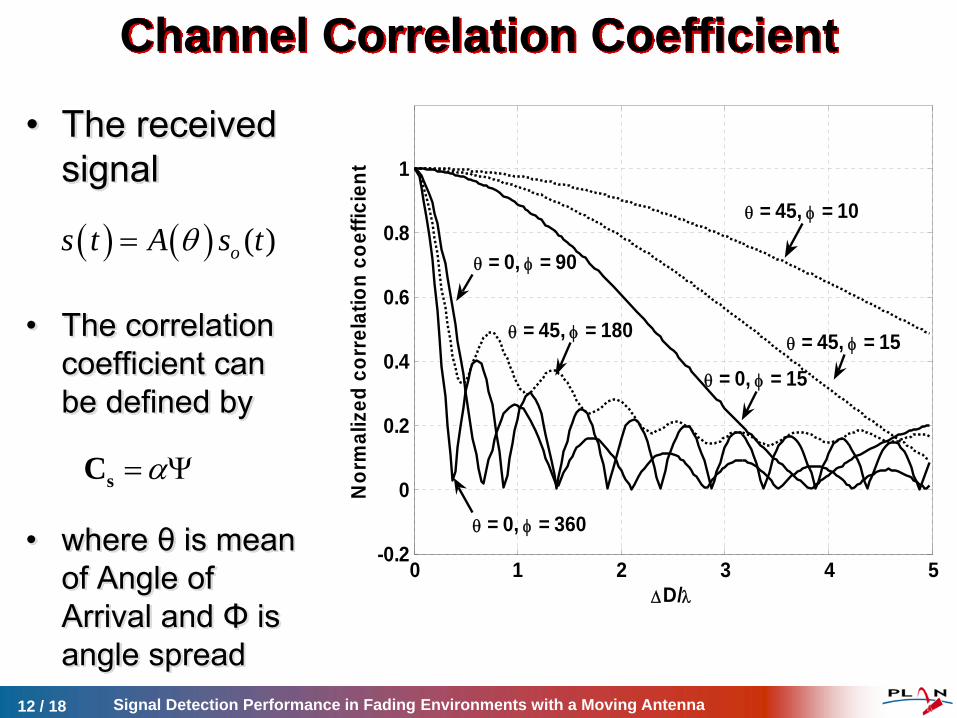
Channel Correlation Coefficient
• The received signal
• The correlation coefficient can be defined by
• where θ is mean of Angle of Arrival and Φ is angle spread
( ) ( ) ( )os t A s tθ=
0 1 2 3 4 5-0.2
0
0.2
0.4
0.6
0.8
1
ΔD/λ
Nor
mal
ized
cor
rela
tion
coef
ficie
nt
θ = 0, φ = 360
θ = 0, φ = 90
θ = 0, φ = 15
θ = 45, φ = 180θ = 45, φ = 15
θ = 45, φ = 10
α= ΨsC
( ) ( ) ( )os t A s tθ=
Enhanced Narrowband Signal Detection and Estimation with a Synthetic Antenna13 / 18
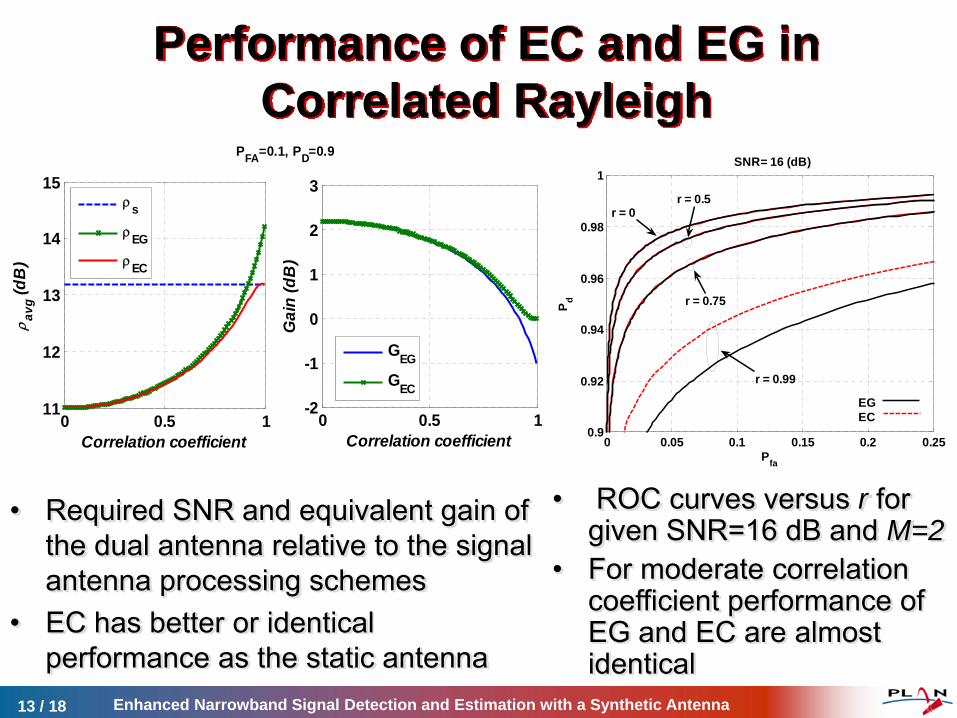
• Required SNR and equivalent gain of the dual antenna relative to the signal antenna processing schemes
• EC has better or identical performance as the static antenna
0 0.5 111
12
13
14
15
Correlation coefficient
ρ avg (d
B)
PFA=0.1, PD=0.9
0 0.5 1-2
-1
0
1
2
3
Correlation coefficient
Gai
n (d
B)
ρs
ρEG
ρEC
GEG
GEC
0 0.05 0.1 0.15 0.2 0.250.9
0.92
0.94
0.96
0.98
1
Pfa
P d
SNR= 16 (dB)
r = 0r = 0.5
r = 0.75
r = 0.99
EGEC
Performance of EC and EG in Correlated Rayleigh
• ROC curves versus r for given SNR=16 dB and M=2
• For moderate correlation coefficient performance of EG and EC are almost identical
Enhanced Narrowband Signal Detection and Estimation with a Synthetic Antenna14 / 18
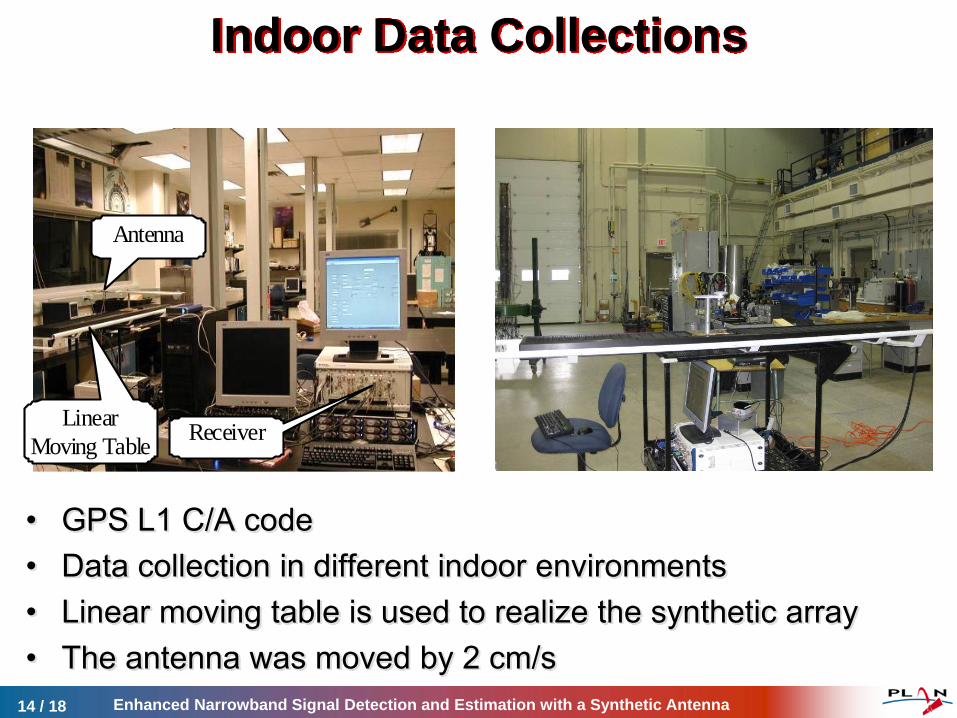
Indoor Data Collections
• GPS L1 C/A code• Data collection in different indoor environments• Linear moving table is used to realize the synthetic array• The antenna was moved by 2 cm/s
Antenna
Receiver Linear Moving Table
Enhanced Narrowband Signal Detection and Estimation with a Synthetic Antenna15 / 18
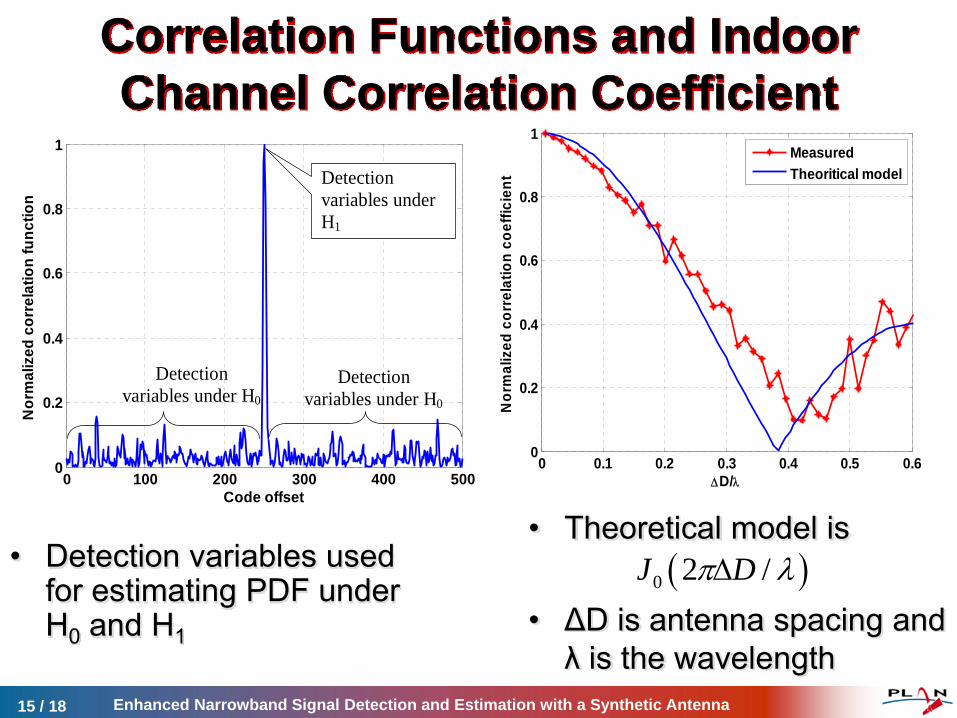
• Detection variables used for estimating PDF under H0 and H1
0 100 200 300 400 5000
0.2
0.4
0.6
0.8
1
Code offset
Nor
mal
ized
cor
rela
tion
func
tion
Detection variables under H0
Detection variables under H1
Detection variables under H0
0 0.1 0.2 0.3 0.4 0.5 0.60
0.2
0.4
0.6
0.8
1
ΔD/λN
orm
aliz
ed c
orre
latio
n co
effic
ient
MeasuredTheoritical model
• Theoretical model is
• ΔD is antenna spacing and λ is the wavelength
( )0 2 /J Dπ λΔ
Correlation Functions and Indoor Channel Correlation Coefficient
Enhanced Narrowband Signal Detection and Estimation with a Synthetic Antenna16 / 18
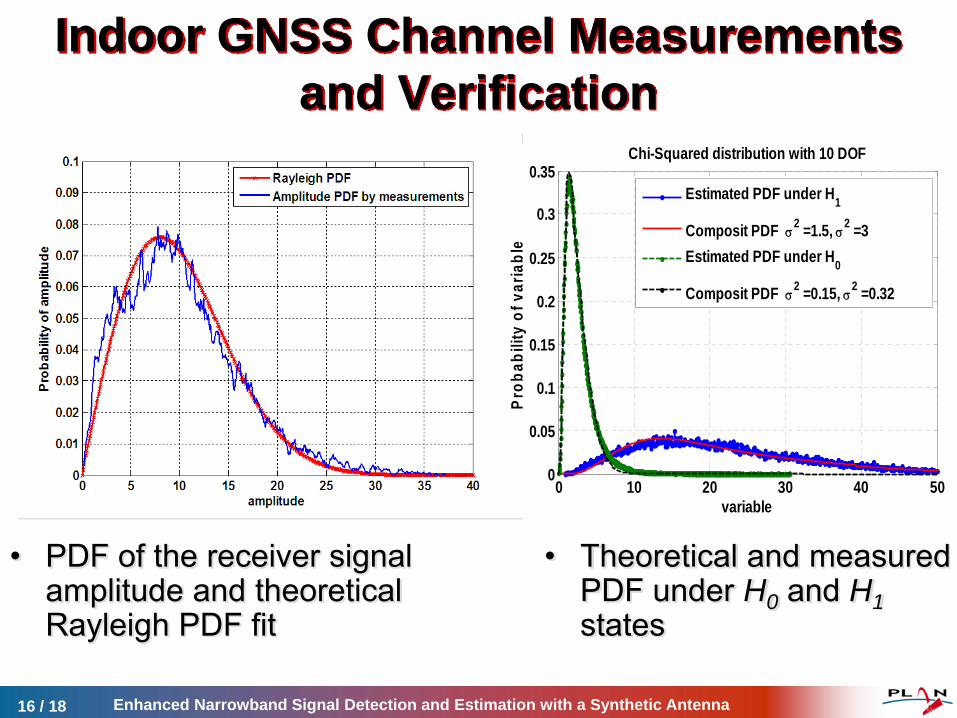
Indoor GNSS Channel Measurements and Verification
0 10 20 30 40 500
0.05
0.1
0.15
0.2
0.25
0.3
0.35
variablePr
obab
ility
of v
aria
ble
Chi-Squared distribution with 10 DOF
Estimated PDF under H1
Composit PDF σ2 =1.5, σ2 =3Estimated PDF under H0
Composit PDF σ2 =0.15, σ2 =0.32
• PDF of the receiver signal amplitude and theoretical Rayleigh PDF fit
• Theoretical and measured PDF under H0 and H1states
Enhanced Narrowband Signal Detection and Estimation with a Synthetic Antenna17 /18
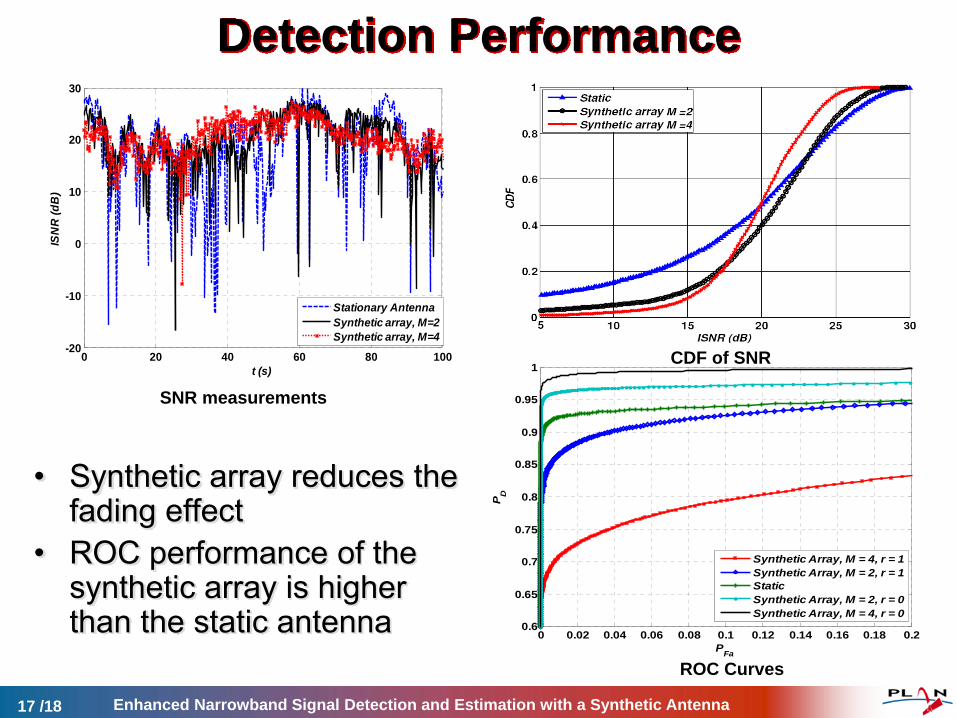
Detection Performance
SNR measurements
0 0.02 0.04 0.06 0.08 0.1 0.12 0.14 0.16 0.18 0.20.6
0.65
0.7
0.75
0.8
0.85
0.9
0.95
1
PFa
P D
Synthetic Array, M = 4, r = 1Synthetic Array, M = 2, r = 1StaticSynthetic Array, M = 2, r = 0Synthetic Array, M = 4, r = 0
ROC Curves
CDF of SNR0 20 40 60 80 100-20
-10
0
10
20
30
t (s)
ISN
R (d
B)
Stationary AntennaSynthetic array, M=2Synthetic array, M=4
• Synthetic array reduces the fading effect
• ROC performance of the synthetic array is higher than the static antenna
Enhanced Narrowband Signal Detection and Estimation with a Synthetic Antenna18 / 18
Conclusions• The detection performance of a narrow bandwidth wireless
signal subjected to Rayleigh fading has been considered for a single antenna handheld receiver
• Of specific interest was to determine the merits of moving the antenna while capturing the signal that provides diversity gain
• It was shown that substantial processing gains are possible by moving the antenna
• Substantial processing gains are possible by moving the antenna
• Experimental measurements were done to verify the assumption of the Rayleigh fading and also to verify the calculated processing gain
• Good agreement between the experimental and theoretical results was obtained