Embed Size (px)
Citation preview
ENHANCED CUSTOMER SATISFACTION THROUGH RETAIL SERVICE QUALITY (RSQ): A STUDY OF IN-STORE AND ONLINE SHOPPERS IN THE RETAIL CLOTHING INDUSTRY
NITA SUKDEO
School of Mechanical and Industrial Engineering Department of Quality and Operations Management
Faculty of Engineering and the Built Environment University of Johannesburg
Gauteng, South Africa 2006
ANDRE VERMEULEN School of Engineering Management
Faculty of Engineering and the Built Environment University of Johannesburg
Gauteng, South Africa 2006
ABSTRACT
With the aim to augment the number of customers in the retail sector, organisations attempt to assess
customer satisfaction and loyalty level achieved in their sector. Retail service quality (RSQ) is a
fundamental factor in determining the success of service organisations. The study aims at
investigating in-store shoppers’ as well as online shoppers’ level of satisfaction. This paper’s purpose
is to correlate the quality of retail service to customer satisfaction as well as loyalty in the framework
of the retail industry in Johannesburg. The literature review enabled the identification of key elements
of loyalty of customer, the quality of service and the satisfaction of customer. Literature has shown
that the quality of service is significantly correlated with customer loyalty customer satisfaction. With
the end goal of this investigation in mind, in-store shoppers were carefully chosen, as these customers
prefer to frequent the stores due an enriched shopping experience. A structured mall intercept
questionnaire was administered to 500 in-store retail shoppers in selected shopping malls, in the
greater Johannesburg area. Simple random sampling was conducted in order to obtain a conducive
sample size. A response rate of 476 out of 500, which equates to 95%, was obtained. Online shoppers
also form part of the basis of the study, since organisations are progressing toward a digital era,
shoppers can purchase item within the comfort of their homes and take advantage of products beings
delivered to their door. In this regard, an online questionnaire was administered to 200 online retail
shoppers. A response rate of 187 out of 200, which equates to 93%, was obtained. A proposed
research framework and research hypotheses were developed through the information derived from
existing researches and literature reviews, and thereafter the relevant hypotheses were tested
through multiple regression analysis. Cronbach’s Alpha Coefficient and exploratory factor analysis
were employed to verify the reliability and validity of the measuring instrument, respectively. The
results of the study empirically indicated a strong positive link between customer loyalty and service
quality including the quality of service and customer satisfaction with regard to in-store and online
shoppers. This indicated that clients are happy with the quality of service supplied by retailer stores,
leading to the loyalty of customer and repeat purchases, eventually.
Keywords
Retail service quality (RSQ), Customer loyalty, Customer satisfaction, Retail industry
1. INTRODUCTION
Due to the current business environment becoming increasingly competitive, customers tend to
become excessively demanding (Wong and Sohal, 2003). Loyalty of customers are a critical factor for
service organisations. An effective and efficient technique to guarantee that the purchases by
customers are repeated, is to supply a service that meets or exceeds the customer’s expectations
(Miller et al., 2000). The fundamental factor of success in a demanding competitive environment, is
determined by the delivery of quality services, which will grow customer satisfaction and retention
level (Spreng and Mackoy, 1996). The subject related to the satisfaction as well as the quality of
service is critical for research initiatives, as organisations attempt to enhance the quality of service,
they provide to enhance the satisfaction of their customers (Gilbert and Veloutsou, 2006). In order for
organisations to accelerate the number of their customers, enhance their loyalty, and increased
competition advantage, they endeavour to evaluate and assess customer satisfaction levels as well as
repurchase behaviour for positive business results (Gilaninia, Taleghani and Talemi, 2013).
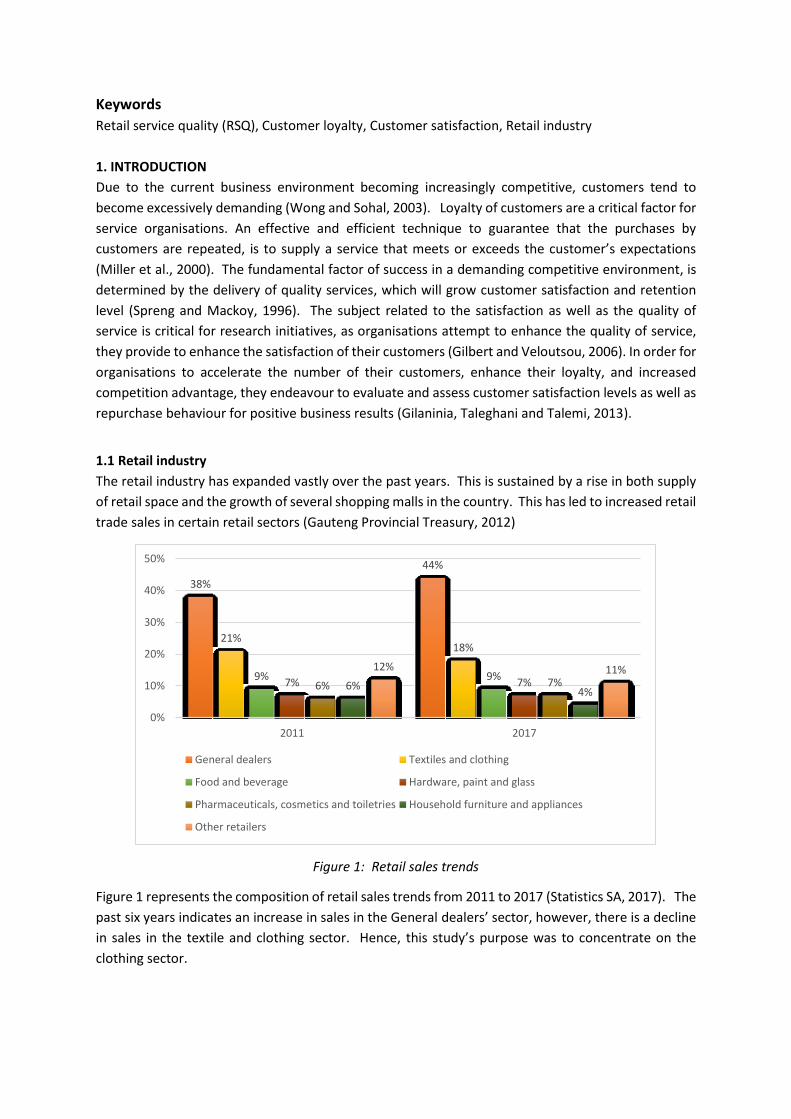
1.1 Retail industry
The retail industry has expanded vastly over the past years. This is sustained by a rise in both supply
of retail space and the growth of several shopping malls in the country. This has led to increased retail
trade sales in certain retail sectors (Gauteng Provincial Treasury, 2012)
Figure 1: Retail sales trends
Figure 1 represents the composition of retail sales trends from 2011 to 2017 (Statistics SA, 2017). The
past six years indicates an increase in sales in the General dealers’ sector, however, there is a decline
in sales in the textile and clothing sector. Hence, this study’s purpose was to concentrate on the
clothing sector.
38%
44%
21%18%
9% 9%7% 7%6% 7%6%
4%
12% 11%
0%
10%
20%
30%
40%
50%
2011 2017
General dealers Textiles and clothing
Food and beverage Hardware, paint and glass
Pharmaceuticals, cosmetics and toiletries Household furniture and appliances
Other retailers
1.2 Problem statement
From a management perspective, the South African retail clothing industry has witnessed a growth
that is gradual for the previous few years. The abundance of retail clothing stores and the intense
nature of competition has led these organisations to enhance the satisfaction and loyalty of their
customers. Hence, it is imperative for management to ensure that they retain customer base as well
as increase their clientele. Losing clients to rivals may not only highlight quality issues but could also
translate to loss of sales, low organisational profitability which ultimately impacts on overall
organisational performance. Therefore, there is a need to measure and evaluate customer
satisfaction and loyalty.
1.3 Objectives of the study
i. To identify the dimensions of retail service quality that influences the loyalty as well as
satisfaction of customers.
ii. To develop a hypothesis to examine the correlation existing between the quality of service
and the loyalty shown by customers.
iii. To develop a hypothesis to examine the correlation existing between the quality of service
and the satisfaction of customers.
iv. To determine the impact of demographics (age) on shopping experience.
2. LITERATURE REVIEW
2.1 Quality of service vs Retail service quality (RSQ)
As stated by Parasuraman, Zeitaml and Berry (1988) the quality of service is understood as the holistic
evaluation of an organisations service offering. This evaluation is conducted by comparing customers’
perceptions against customers’ expectations. Through this evaluation, service organisations can
significantly enhance their competitiveness through greater market share and higher level of customer
satisfaction (Cronin and Taylor, 1992). In a study by Parasuraman et al. (1988) it is recommended that
the five dimensions of the quality of service: assurance, reliability, tangibles, responsiveness, and
empathy, are utilised to estimate the gap that exists between the expectations as well as perceptions
of service quality. It is well documented that to study the quality of service in various sectors,
researchers widely made use of the SERVQUAL scale. Oliver (1981) postulates that retail customers
react well the experience associated to purchases made in-store in a similar way as they respond to
the decisions related to their consumption of product. However, Carman (1990) indicates that the
SERVQUAL model was too basic in computing the quality of service provided by retailers and should
be adjusted based on the distincts services provided.
In order to evaluate the retail sector service quality, Dabholkar, Thorpe and Rentz (1996) established
a better all-inclusive scale called the Retail Service Quality (RSQ) scale. Preceding 1996, no validated
scale to compute RSQ ever existed (Dabholkar et al., 1996; Siu and Chow, 2003). The following five
RQS dimensions make up the scale:
i. Aspects that are physical (PA): the layout as well as appearance of the store.
ii. Reliability (RE): being able to keep promises and to do things right the first time.
iii. Interaction that is personal in nature (PI): courteous employees, ready to help and inspiring
within customers the trust and the confidence.
iv. To be able to solve problems (PS): trained staff who are able to solve possible issues, such as
complaints laid by customers, items being returned and/or being exchanged.
v. Policy (P): business working hours, different options available for payment, and available
space to park cars.
The dimensions of RSQ then serves as predecessors to the complete evaluation of RSQ, which in turn
effects the strength of their customer relationship. Consequently, enhanced retail service quality is
crucial to the formation of strong customer relationships. Therefore the following hypotheses were
developed:
H1 : The five RSQ dimensions and customer loyalty are strongly correlated.
H2 : The five RSQ dimensions and customer satisfaction are strongly correlated.
2.2 Loyalty of Customers (CL)
The loyalty of customers refers to the opportunity for customers to recurrently purchase detailed
products (shops, service, product, brand, etc.) irrespective of the changing business environment.
Customer loyalty is the fundamental purpose of relationship marketing and is meticulously correlated
to organisational profitability (Heskett et al., 1994; Rust and Zahorik, 1993). The main reason behind
the pursuit for developing and maintaining a strong loyal customer base includes the ability to expand
business and acquire a greater market share as this will lead to long term profitability for the
organisation.
2.3 Satisfaction of Customer (CS)
The satisfaction of customer points to the complete expectation of clients toward a service or product
following the acquisition and consumption of the service or product by the customer (Malhotra; 1999).
Throughout and following the purchase process, clients will foster satisfaction or dissatisfaction
moods. The level of dissatisfaction or satisfaction is the distinction between recognised expectations
and performance of a service or product (Kotler and Armstrong, 1996; Stahl, 1999).
2.4 The relationship between Customer satisfaction (CS) and Customer loyalty (CL)
With regard to several studies conducted in order to explore the liaison of customer satisfaction and
customer loyalty, the following dimensions of service quality and customers satisfaction are
considered significant precursors for organisations to retain valuable, loyal customers. Therefore the
following hypothesis was developed:
H3 : Customer loyalty and customer satisfaction are strongly correlated.
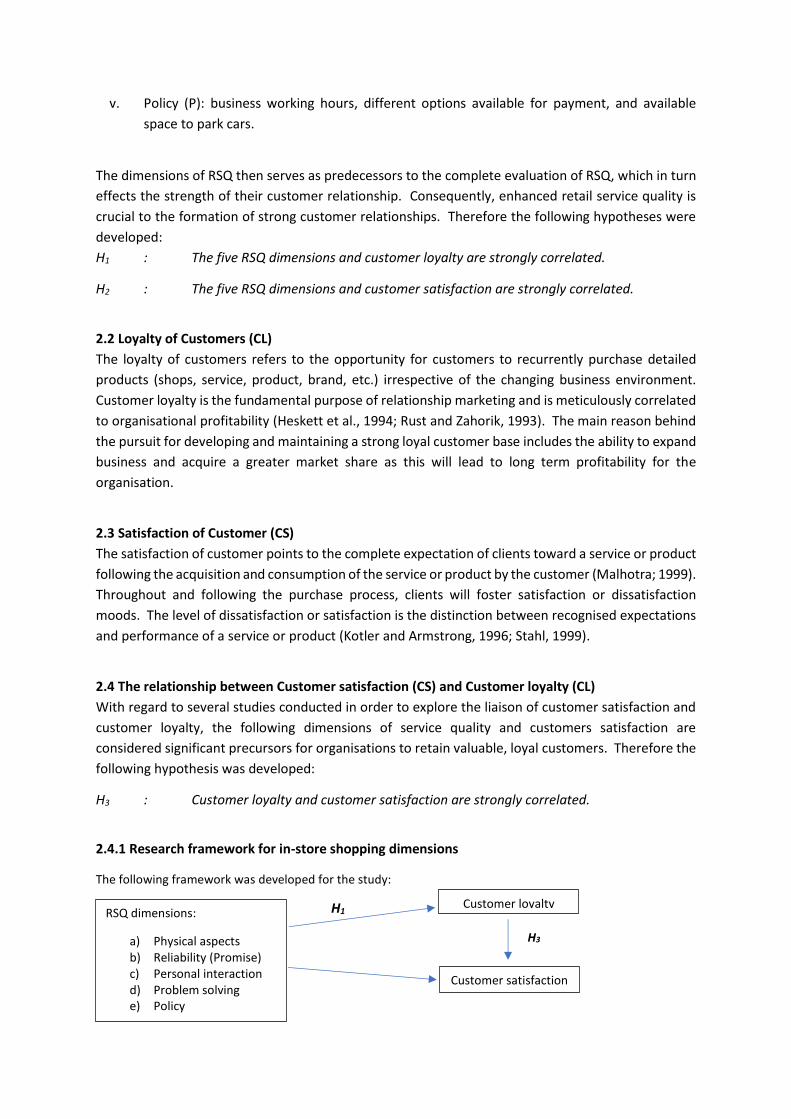
2.4.1 Research framework for in-store shopping dimensions
The following framework was developed for the study:
H1
H3
RSQ dimensions:
a) Physical aspects b) Reliability (Promise) c) Personal interaction d) Problem solving e) Policy
Customer loyalty
Customer satisfaction
H2
Figure 2. Proposed research framework for in-store shoppers
2.5 Online shopping
The subject of customer satisfaction has been discussed extensively in retail literature. However, recently, some researchers have investigated the influence of websites and online shopping attributes on customer satisfaction and loyalty. There have been several initiatives to develop a framework in order to identify dominant factors which impact on customer satisfaction of online shopping from a perspective of website users (Ranganathan and Ganapathy, 2002). Literature on online service quality has identified several service convenience factors which are unique to the virtual shopping experience (Wolfinbarger and Gilly, 2003; Yang and Peterson, 2004; Yang, 2005). Colwell (2008) have developed a multi-item scale, based on the work of Berry (2002), which measures the five dimensions of service convenience for online shoppers.
In the context of retailing. Seiders (2000) Jiang, Yang and Jun, (2013) propose the following
dimensions for providing convenience:
i. Access – Customers can reach a retailers therefore making the service accessible. ii. Search – Customers can identify and select products / services which they purchase.
iii. Evaluation – Customers makes a judgement on the product’s value and assess the product’s details before purchase.
iv. Transaction – Customers can affect or make amendments to transactions. v. Possession – Customers can obtain the desired product which has been ordered.
The hypothesis, therefore, proposed in this research is as follows: H4 : Online shopping dimensions and customer satisfaction are strongly correlated.
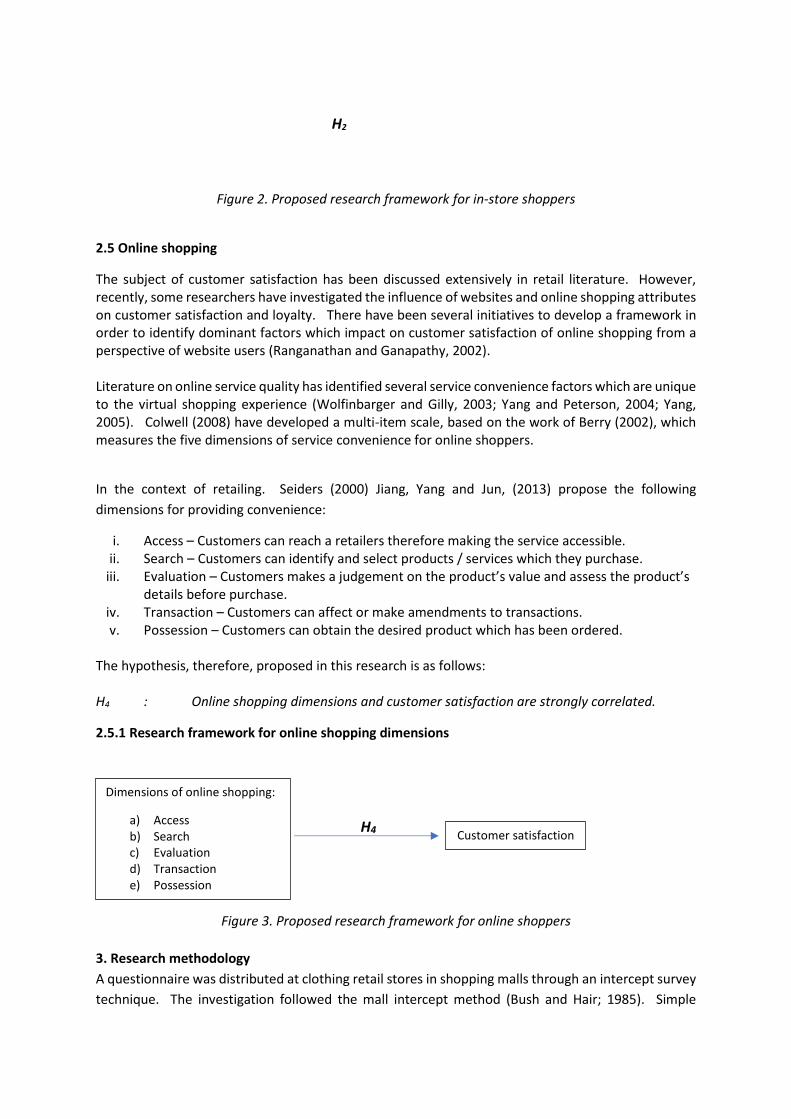
2.5.1 Research framework for online shopping dimensions
H4
Figure 3. Proposed research framework for online shoppers
3. Research methodology
A questionnaire was distributed at clothing retail stores in shopping malls through an intercept survey
technique. The investigation followed the mall intercept method (Bush and Hair; 1985). Simple
Dimensions of online shopping:
a) Access b) Search c) Evaluation d) Transaction e) Possession
Customer satisfaction
random sampling was adopted and this ensured a large sample size. Respondents were contacted
randomly at retail stores as they visited the store for their shopping experience. Mall intercept
technique have been utilized in other research as a method for collecting data and is considered free
of bias (Griffin et al, 2000; Keng et al, 2007; Wang et al, 2010)
3.1 Reliability analysis
Cronbach’s Alpha Coefficient is the variable related to reliability of a research instrument and it is
grounded on the existing correlation amongst items of the research instrument (Cronbach, 1951).
The following guidelines for Cronbach’s Alpha Coefficient have been presented by Maree (2007): 0.90 – Reliability is high 0.80 – Reliability is moderate 0.70 – Reliability is low A research instrument is considered to be satisfactory when the value of the Cronbach’s coefficient is
at least 0.7. With this in mind, each variable’s coefficient of reliability has been presented in Table 1.
3.2 Validity analysis
The validity of each construct will be evaluated through Confirmatory Factor Analysis. Factor analysis
will be applied to the measurement dimensions with regard to every construct. Construct validity is
crucial for the perceived overall validity of the test (Tiku and Pecht, 2010).
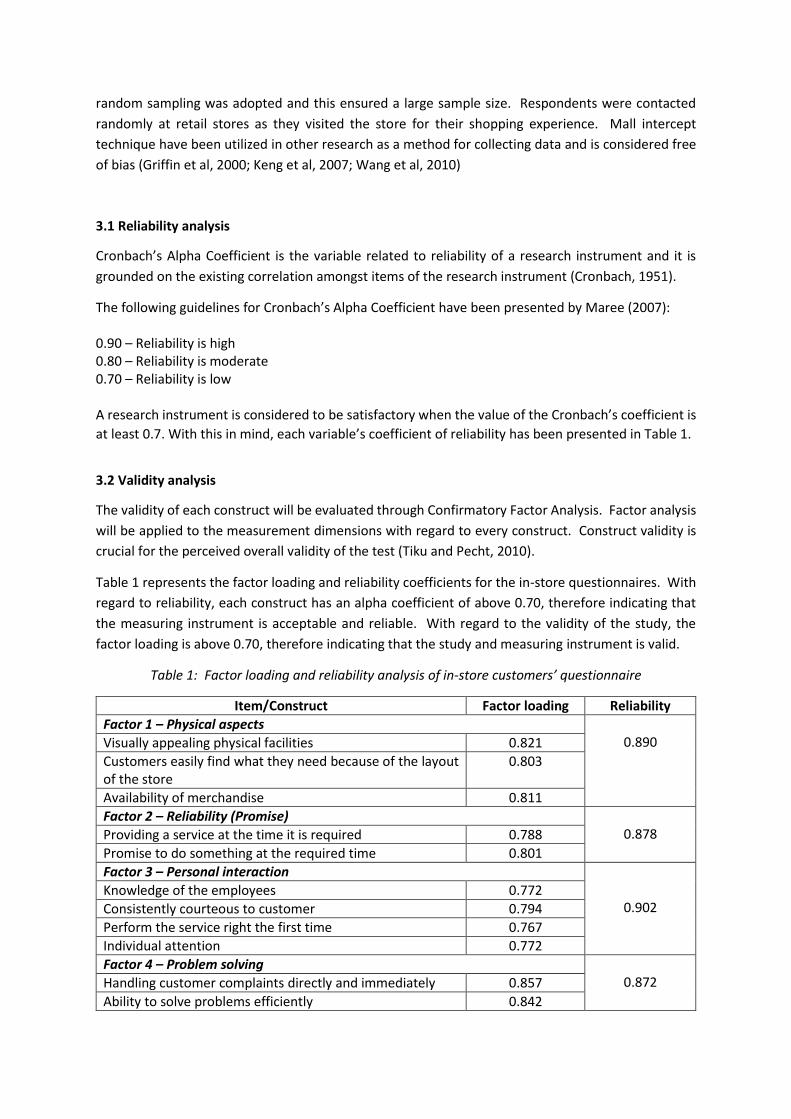
Table 1 represents the factor loading and reliability coefficients for the in-store questionnaires. With
regard to reliability, each construct has an alpha coefficient of above 0.70, therefore indicating that
the measuring instrument is acceptable and reliable. With regard to the validity of the study, the
factor loading is above 0.70, therefore indicating that the study and measuring instrument is valid.
Table 1: Factor loading and reliability analysis of in-store customers’ questionnaire
Item/Construct Factor loading Reliability
Factor 1 – Physical aspects 0.890 Visually appealing physical facilities 0.821
Customers easily find what they need because of the layout of the store
0.803
Availability of merchandise 0.811
Factor 2 – Reliability (Promise) 0.878 Providing a service at the time it is required 0.788
Promise to do something at the required time 0.801
Factor 3 – Personal interaction
0.902 Knowledge of the employees 0.772
Consistently courteous to customer 0.794
Perform the service right the first time 0.767
Individual attention 0.772
Factor 4 – Problem solving 0.872 Handling customer complaints directly and immediately 0.857
Ability to solve problems efficiently 0.842
Factor 5 - Policy
0.853 Quality of merchandise 0.875
Error free sales transactions and records 0.821
Willingly handle returns and exchanges 0.801
Convenient operating hours 0.798
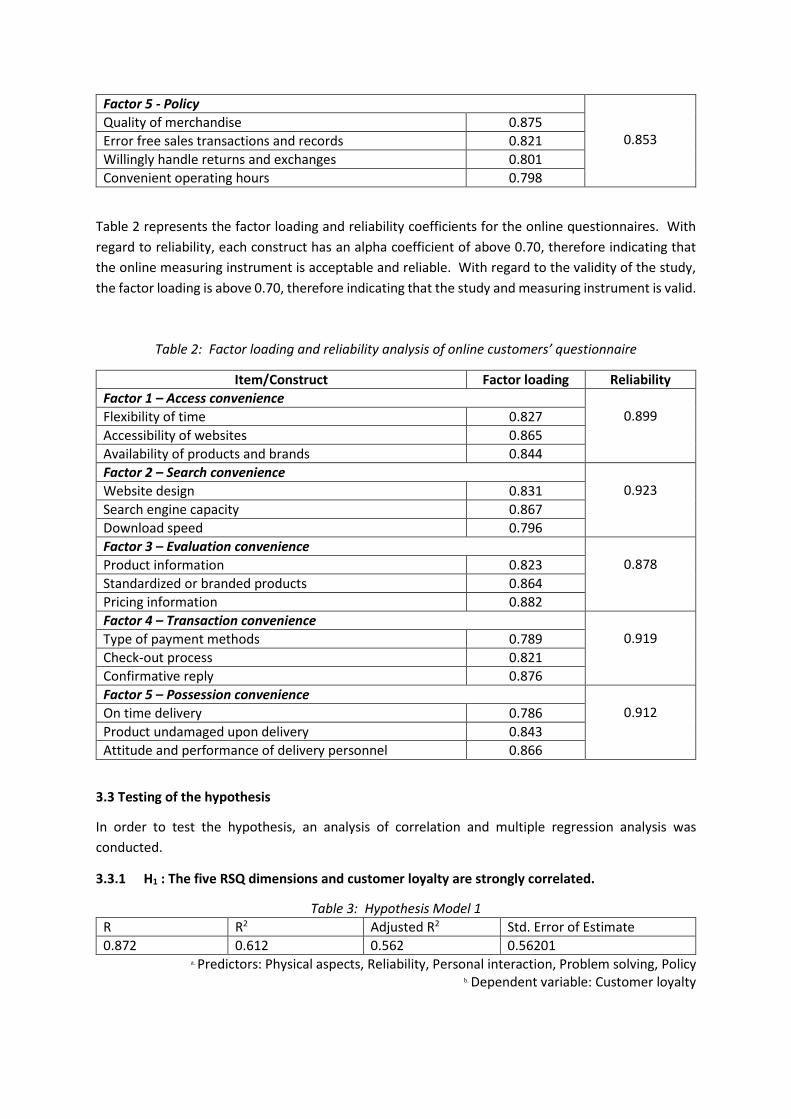
Table 2 represents the factor loading and reliability coefficients for the online questionnaires. With
regard to reliability, each construct has an alpha coefficient of above 0.70, therefore indicating that
the online measuring instrument is acceptable and reliable. With regard to the validity of the study,
the factor loading is above 0.70, therefore indicating that the study and measuring instrument is valid.
Table 2: Factor loading and reliability analysis of online customers’ questionnaire
Item/Construct Factor loading Reliability
Factor 1 – Access convenience 0.899 Flexibility of time 0.827
Accessibility of websites 0.865
Availability of products and brands 0.844
Factor 2 – Search convenience 0.923 Website design 0.831
Search engine capacity 0.867
Download speed 0.796
Factor 3 – Evaluation convenience 0.878 Product information 0.823
Standardized or branded products 0.864
Pricing information 0.882
Factor 4 – Transaction convenience 0.919 Type of payment methods 0.789
Check-out process 0.821
Confirmative reply 0.876
Factor 5 – Possession convenience 0.912 On time delivery 0.786
Product undamaged upon delivery 0.843
Attitude and performance of delivery personnel 0.866
3.3 Testing of the hypothesis
In order to test the hypothesis, an analysis of correlation and multiple regression analysis was
conducted.
3.3.1 H1 : The five RSQ dimensions and customer loyalty are strongly correlated.
Table 3: Hypothesis Model 1
R R2 Adjusted R2 Std. Error of Estimate
0.872 0.612 0.562 0.56201 a. Predictors: Physical aspects, Reliability, Personal interaction, Problem solving, Policy
b. Dependent variable: Customer loyalty
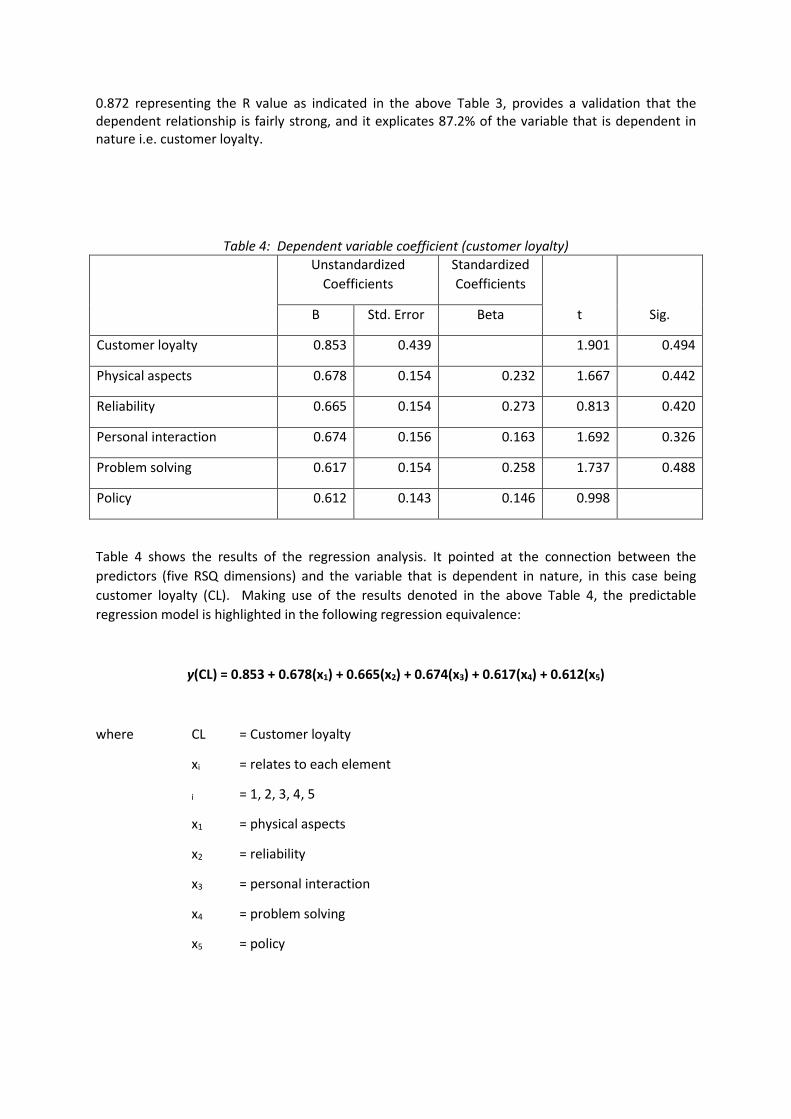
0.872 representing the R value as indicated in the above Table 3, provides a validation that the dependent relationship is fairly strong, and it explicates 87.2% of the variable that is dependent in nature i.e. customer loyalty.
Table 4: Dependent variable coefficient (customer loyalty)
Unstandardized
Coefficients
Standardized
Coefficients
t Sig. B Std. Error Beta
Customer loyalty 0.853 0.439 1.901 0.494
Physical aspects 0.678 0.154 0.232 1.667 0.442
Reliability 0.665 0.154 0.273 0.813 0.420
Personal interaction 0.674 0.156 0.163 1.692 0.326
Problem solving 0.617 0.154 0.258 1.737 0.488
Policy 0.612 0.143 0.146 0.998
Table 4 shows the results of the regression analysis. It pointed at the connection between the
predictors (five RSQ dimensions) and the variable that is dependent in nature, in this case being
customer loyalty (CL). Making use of the results denoted in the above Table 4, the predictable
regression model is highlighted in the following regression equivalence:
y(CL) = 0.853 + 0.678(x1) + 0.665(x2) + 0.674(x3) + 0.617(x4) + 0.612(x5)
where CL = Customer loyalty
xi = relates to each element
i = 1, 2, 3, 4, 5
x1 = physical aspects
x2 = reliability
x3 = personal interaction
x4 = problem solving
x5 = policy
The coefficient of determination (R2) indicates the extent to which the model related to multiple
regression fits the set of data. A coefficient with value that is near zero indicates a weaker fit while a
coefficient with value that is near one indicates a good fit. The value of 0.612, in Table 3, representing
R2, shows that 61.2% of the difference in CL can be elucidated by the five predictor variables singled
out in the equation related to the regression analysis. 0.678 is the larger beta (β) coefficient, which
corresponds to physical aspects, meaning that one distinct standard deviation augmentation in
physical aspects succeeded by 0.678 standard deviation augmentation in CL. It is obvious that physical
aspects (t = 1.901) as well as problem solving (t = 1.737) both have a considerable bearing on the
loyalty of customers. Consequently, grounded on the multiple regression analysis referred to above,
the first premise (H1), is maintained.
3.3.2 H2 : The five RSQ dimensions and customer satisfaction are strongly correlated.
Table 5: Hypothesis Model 2
R R2 Adjusted R2 Std. Error of Estimate
0.817 0.614 0.562 0.56201 c. Predictors: Policy, Problem solving, Personal interaction, Reliability, Physical aspects
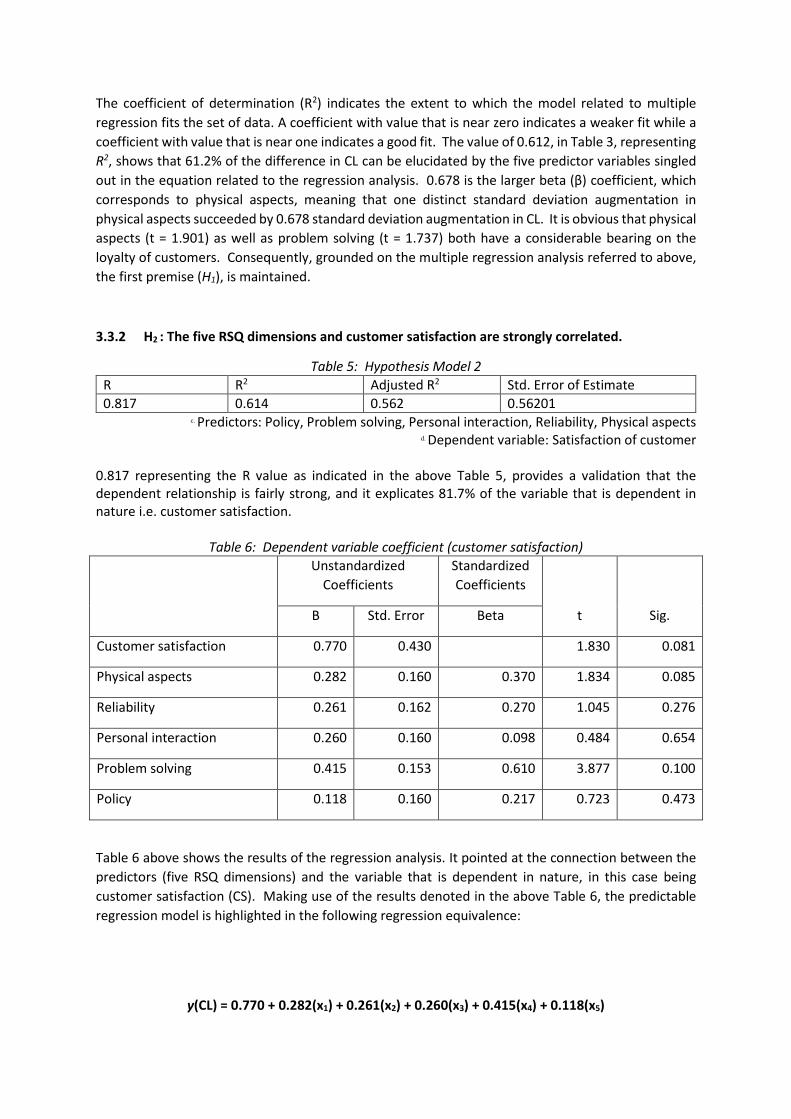
d. Dependent variable: Satisfaction of customer 0.817 representing the R value as indicated in the above Table 5, provides a validation that the dependent relationship is fairly strong, and it explicates 81.7% of the variable that is dependent in nature i.e. customer satisfaction.
Table 6: Dependent variable coefficient (customer satisfaction)
Unstandardized
Coefficients
Standardized
Coefficients
t Sig. B Std. Error Beta
Customer satisfaction 0.770 0.430 1.830 0.081
Physical aspects 0.282 0.160 0.370 1.834 0.085
Reliability 0.261 0.162 0.270 1.045 0.276
Personal interaction 0.260 0.160 0.098 0.484 0.654
Problem solving 0.415 0.153 0.610 3.877 0.100
Policy 0.118 0.160 0.217 0.723 0.473
Table 6 above shows the results of the regression analysis. It pointed at the connection between the
predictors (five RSQ dimensions) and the variable that is dependent in nature, in this case being
customer satisfaction (CS). Making use of the results denoted in the above Table 6, the predictable
regression model is highlighted in the following regression equivalence:
y(CL) = 0.770 + 0.282(x1) + 0.261(x2) + 0.260(x3) + 0.415(x4) + 0.118(x5)
where CS = Customer satisfaction
xi = relates to each element
i = 1, 2, 3, 4, 5
x1 = physical aspects
x2 = reliability
x3 = personal interaction
x4 = problem solving
x5 = policy
The coefficient of determination (R2) indicates the extent to which the model related to multiple
regression fits the set of data. A coefficient with value that is near zero indicates a poorer fit while a
coefficient with value that is near one indicates a good fit. The value of 0.614, in Table 3, representing
R2, shows that 61.4% of the difference in CS can be elucidated by the five predictor variables singled
out in the equation related to the regression analysis. 0.415 is the larger beta (β) coefficient, which
corresponds to problem solving, meaning that one distinct standard deviation augmentation in
problem solving succeeded by 0.415 standard deviation augmentation in CS. It is obvious that
problem solving (t = 3.877) as well as physical aspects (t = 1.830) both have a considerable bearing on
the satisfaction of customers. Consequently, grounded on the multiple regression analysis referred
to above, the first premise (H2), is maintained.
3.3.3 H3 : Customer loyalty and customer satisfaction are strongly correlated.
Table 7: Hypothesis Model 3
R R2 Adjusted R2 Std. Error of Estimate
0.798 0.634 0.455 0.58019 e. Predictors: Loyalty of customer
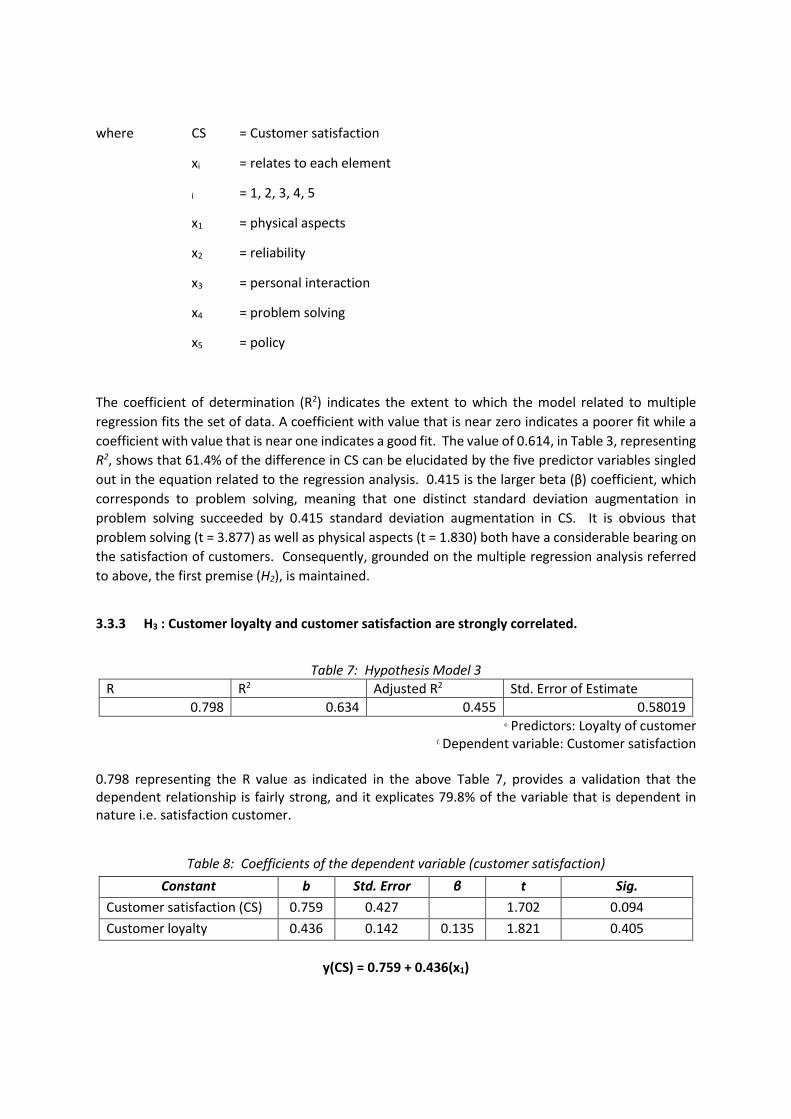
f. Dependent variable: Customer satisfaction 0.798 representing the R value as indicated in the above Table 7, provides a validation that the dependent relationship is fairly strong, and it explicates 79.8% of the variable that is dependent in nature i.e. satisfaction customer.
Table 8: Coefficients of the dependent variable (customer satisfaction)
Constant b Std. Error β t Sig.
Customer satisfaction (CS) 0.759 0.427 1.702 0.094
Customer loyalty 0.436 0.142 0.135 1.821 0.405
y(CS) = 0.759 + 0.436(x1)
where CS = Customer Satisfaction
xi = relates to each element
i = 1
x1 = customer loyalty
The value of 0.634, in Table 7, representing R2, shows that 63.4% of the difference in CS can be
elucidated by the five predictor variables singled out in the equation related to the regression analysis.
0.415 is the larger beta (β) coefficient shown in Table 8, which corresponds to satisfaction of
customers, meaning that one distinct standard deviation augmentation in the satisfaction of
customers, succeeded by 0.436 standard deviation augmentation in CS. It is obvious that the loyalty
of clients (t = 1.821) has a considerable bearing on the satisfaction of customers. Consequently,
grounded on the multiple regression analysis referred to above, the first premise (H3), is maintained.
3.3.4 H4 : Online shopping dimensions and customer satisfaction are strongly correlated.
Table 9: Model of Hypothesis 4
R R Square Adjusted R Square Std. Error of Estimate
0.822 0.631 0.553 0.55301 g. Predictors: Access, Search, Evaluation, Transaction, Possession
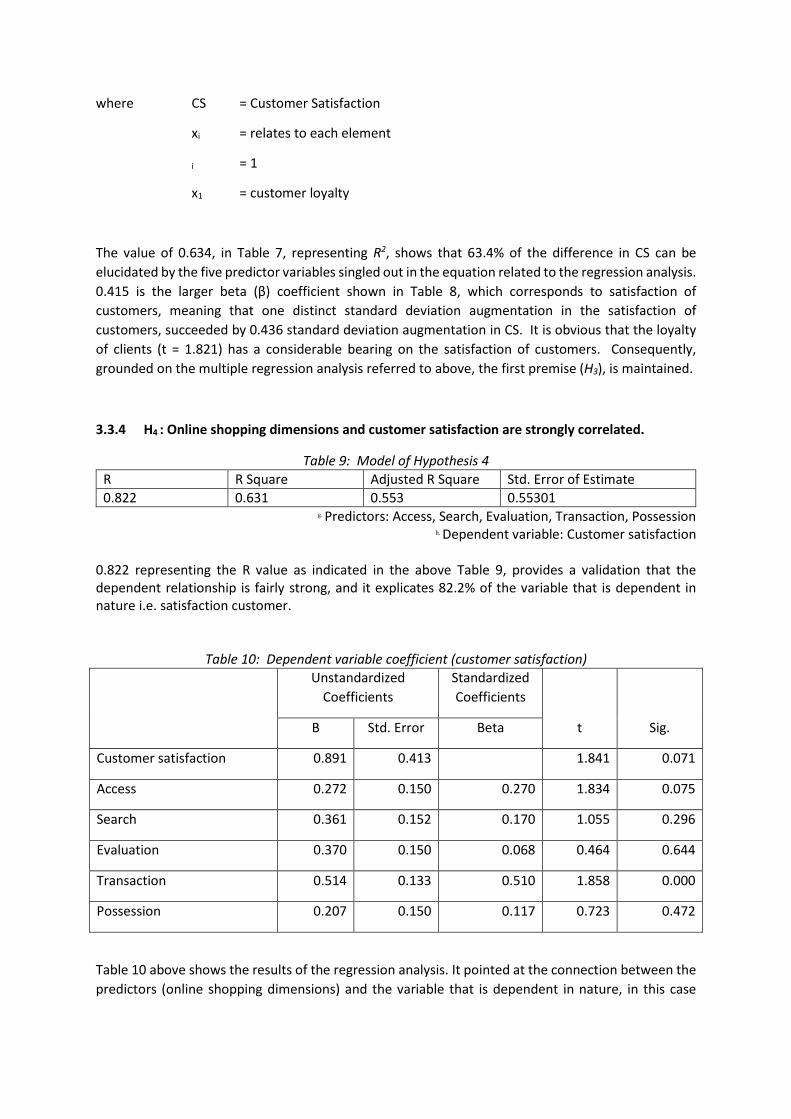
h. Dependent variable: Customer satisfaction 0.822 representing the R value as indicated in the above Table 9, provides a validation that the dependent relationship is fairly strong, and it explicates 82.2% of the variable that is dependent in nature i.e. satisfaction customer.
Table 10: Dependent variable coefficient (customer satisfaction)
Unstandardized
Coefficients
Standardized
Coefficients
t Sig. B Std. Error Beta
Customer satisfaction 0.891 0.413 1.841 0.071
Access 0.272 0.150 0.270 1.834 0.075
Search 0.361 0.152 0.170 1.055 0.296
Evaluation 0.370 0.150 0.068 0.464 0.644
Transaction 0.514 0.133 0.510 1.858 0.000
Possession 0.207 0.150 0.117 0.723 0.472
Table 10 above shows the results of the regression analysis. It pointed at the connection between the
predictors (online shopping dimensions) and the variable that is dependent in nature, in this case
being customer satisfaction (CS). Making use of the results denoted in the above Table 1, the
predictable regression model is highlighted in the following regression equivalence:
y(CS) = 0.891 + 0.272(x1) + 0.361(x2) + 0.370(x3) + 0.514(x4) + 0.20(x5)
where CS = Customer satisfaction
xi = relates to each element
i = 1, 2, 3, 4, 5
x1 = access
x2 = search
x3 = evaluation
x4 = transaction
x5 = possession
The coefficient of determination (R2) indicates the extent to which the model related to multiple
regression fits the set of data. A coefficient with value that is near zero indicates a poorer fit while a
coefficient with value that is near one indicates a good fit. The value of 0.631, in Table 3, representing
R2, shows that 63.1% of the difference in CS can be elucidated by the five predictor variables singled
out in the equation related to the regression analysis. 0.514 is the larger beta (β) coefficient, which
corresponds to transaction convenience (independent variable), meaning that one distinct standard
deviation augmentation in transaction convenience succeeded by 0.514 standard deviation
augmentation in CS. It is obvious that transaction convenience (t = 1.858) as well as access
convenience (t = 1.834) both have a considerable bearing on the satisfaction of customers.
Consequently, grounded on the multiple regression analysis referred to above, the first premise (H4),
is maintained.
In summary, it is evident from the in-store questionnaire analysis that customers strongly correlate
physical aspects and problem solving as predictor variables of the loyalty of customer and satisfaction
of customer. With regard to the online questionnaire, the analysis indicates that customers strongly
correlate transaction convenience and convenience of access as predictor variables of customer
satisfaction.
4. DESCRIPTIVE ANALYSIS FOR IN-STORE CUSTOMER RESPONSES
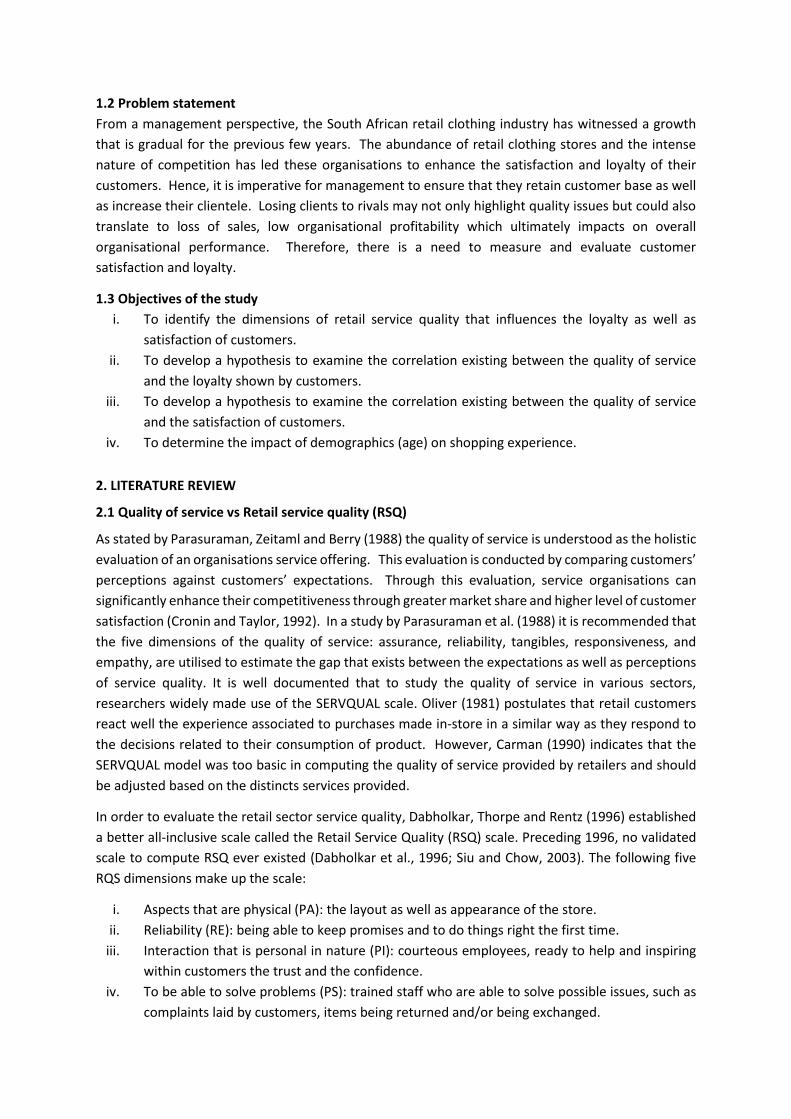
4.1 Demographics of in-store shoppers
Table 11: Age of in-store shoppers
Age group Responses % of responses
Under 30 152 32
30 - 40 101 21
Over 40 222 47 476
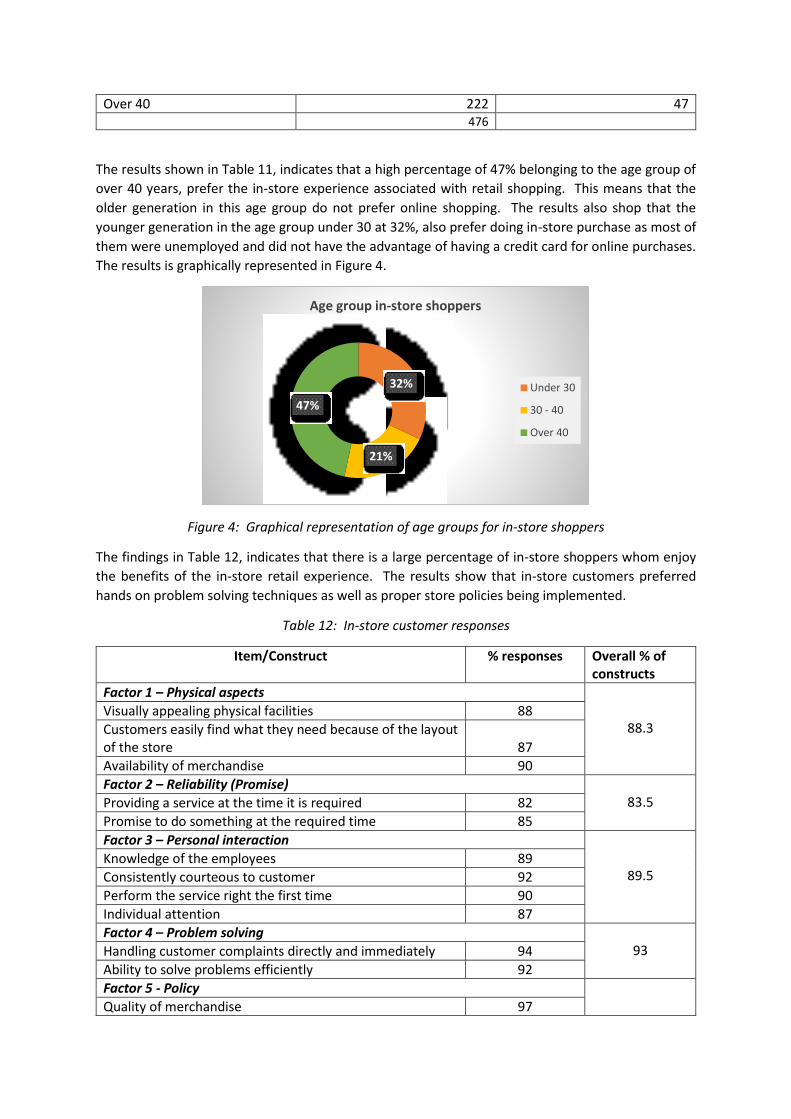
The results shown in Table 11, indicates that a high percentage of 47% belonging to the age group of
over 40 years, prefer the in-store experience associated with retail shopping. This means that the
older generation in this age group do not prefer online shopping. The results also shop that the
younger generation in the age group under 30 at 32%, also prefer doing in-store purchase as most of
them were unemployed and did not have the advantage of having a credit card for online purchases.
The results is graphically represented in Figure 4.
Figure 4: Graphical representation of age groups for in-store shoppers
The findings in Table 12, indicates that there is a large percentage of in-store shoppers whom enjoy
the benefits of the in-store retail experience. The results show that in-store customers preferred
hands on problem solving techniques as well as proper store policies being implemented.
Table 12: In-store customer responses
Item/Construct % responses Overall % of constructs
Factor 1 – Physical aspects
88.3 Visually appealing physical facilities 88
Customers easily find what they need because of the layout of the store 87
Availability of merchandise 90
Factor 2 – Reliability (Promise) 83.5 Providing a service at the time it is required 82
Promise to do something at the required time 85
Factor 3 – Personal interaction
89.5 Knowledge of the employees 89
Consistently courteous to customer 92
Perform the service right the first time 90
Individual attention 87
Factor 4 – Problem solving 93 Handling customer complaints directly and immediately 94
Ability to solve problems efficiently 92
Factor 5 - Policy Quality of merchandise 97
32%
21%
47%
Age group in-store shoppers
Under 30
30 - 40
Over 40
Error free sales transactions and records 96 95.75
Willingly handle returns and exchanges 92
Convenient operating hours 98
4.2 Demographics of online shoppers
Table 13: Age of online shoppers
Age group Responses % of responses
Under 30 93 49
30 - 40 54 29
Over 40 40 22 187
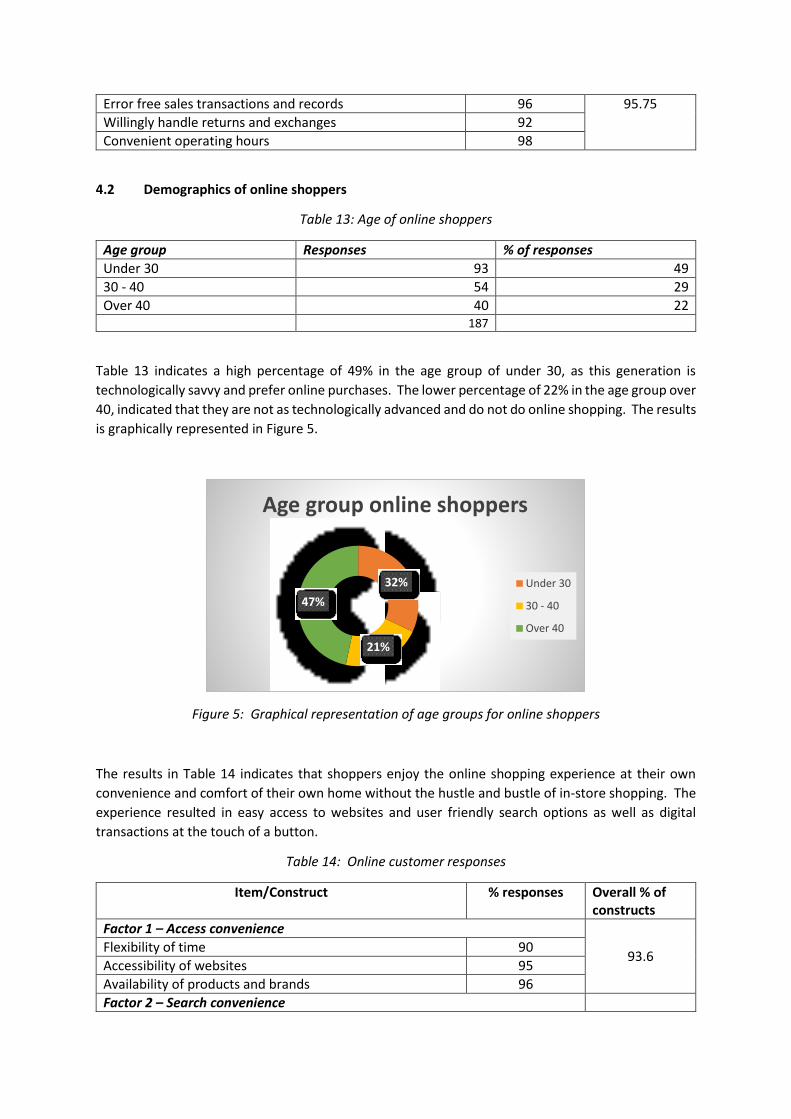
Table 13 indicates a high percentage of 49% in the age group of under 30, as this generation is
technologically savvy and prefer online purchases. The lower percentage of 22% in the age group over
40, indicated that they are not as technologically advanced and do not do online shopping. The results
is graphically represented in Figure 5.
Figure 5: Graphical representation of age groups for online shoppers
The results in Table 14 indicates that shoppers enjoy the online shopping experience at their own
convenience and comfort of their own home without the hustle and bustle of in-store shopping. The
experience resulted in easy access to websites and user friendly search options as well as digital
transactions at the touch of a button.
Table 14: Online customer responses
Item/Construct % responses Overall % of constructs
Factor 1 – Access convenience
93.6 Flexibility of time 90
Accessibility of websites 95
Availability of products and brands 96
Factor 2 – Search convenience
32%
21%
47%
Age group online shoppers
Under 30
30 - 40
Over 40
Website design 97 95.6
Search engine capacity 98
Download speed 92
Factor 3 – Evaluation convenience 91.7 Product information 90
Standardized or branded products 94
Pricing information 91
Factor 4 – Transaction convenience 89.6 Type of payment methods 90
Check-out process 90
Confirmative reply 89
Factor 5 – Possession convenience 88
On time delivery 85
Product undamaged upon delivery 89
Attitude and performance of delivery personnel 90
References
Berry, L.L., Seiders, K. and Grewal, D. (2002), “Understanding service convenience”, Journal of Marketing, Vol. 66(3), pp. 1-17.
Bush, A.J and Hair, J.F (1985) “An Assessment of the Mall Intercept as a Data Collection Method”,
Journal of Marketing Research, Vol. 22(2), pp. 158-167
Carman, J.M. (1990), “Consumer perceptions of service quality: an assessment of the SERVQUAL dimensions”, Journal of Retailing, Vol. 66, Spring, pp. 55-68. Colwell, S.R., Aung, M., Kanetkar, V. and Holden, A.L. (2008), “Toward a measure of service convenience: multiple-item scale development and empirical test”, Journal of Services Marketing, Vol. 22(2), pp. 160-169. Cronbach, L.J. (1951), “Coefficient alpha and the internal structure of tests”, Psychometrika, Vol. 16 No. 3, pp. 297-334. Cronin, J.J. Jr and Taylor, S.A. (1992), “Measuring service quality: a re-examination and extension”, Journal of Marketing, Vol. 56(3), pp. 55-68. Dabholkar, P.A., Thorpe, D.I. and Rentz, J.O. (1996), “A measure of service quality for retail stories: scale development and validation”, Journal of the Academy of Marketing Research, Vol. 24 No. 1, pp. 3-16. Gauteng Province (2012) “The retail industry in the rise in South Africa”, Gauteng Provincial Treasury Quarterly Bulletin Gilbert, G.R and Veloutsou, C. "A cross‐industry comparison of customer satisfaction," Journal of Services Marketing, 20(5), pp.298-308, 2006. Gilaninia, S. Taleghani, M and Talemi, M. R. K (2013) “The impact of service quality on customer satisfaction,” Journal of Research and Development, 1(4), pp 1-7, 2013.
Griffin, M., Babin, B. and Modianos, D. (2000), “Shopping values of Russian consumers: the impact of habituation in a developing economy”, Journal of Retailing, Vol. 76(1), p. 33.
Heskett, J.L., Jones, T.O., Loveman, G.W., Sasser, W.E. and Schlesinger, L (1994) “Putting the service
profit chain to work”, Harvard Business Review, March –April 1994, pp.105-111
Keng, C.-J., Huang, T.-L., Zheng, L.-J. and Hsu, M.K. (2007), “Modeling service encounters and customer experiential value in retailing: an empirical investigation of shopping mall customers in Taiwan”, International Journal of Service Industry Management, Vol. 18(4), pp. 349-67. Kotler. P and Armstrong. G (1996) Principles of marketing. 7th edition. New York: Prentice Hall Stahl. M.S (1999) Perspectives in Total Quality. Milwaukee: Blackwell Publishers Lehohla, P.J (2017) “Retail Trade Industry”, Statistics South Africa Bulletin, pp.56 Ling (Alice) Jiang, Zhilin Yang, Minjoon Jun, (2013) "Measuring consumer perceptions of online shopping convenience", Journal of Service Management, Vol. 24(2), pp.191-214, Malhotra. N.K (1999) Marketing Research on Applied Orientation. New York: Prentice Hall Maree, K (2007) First steps in Research. 1st edition. South Africa: Van Schaik Publishers Miller, J.L, Craighead, C.W and Karwan, K.R (2000) “Service recovery: a framework and empirical
investigation”, Journal of Operations Management, Vol 18(4), pp.387-400
Oliver, R.L. (1981), “Measurement and evaluation of satisfaction processes in retail settings”, Journal of Retailing, Vol. 57 No. 3, pp. 25-48. Parasuraman, A., Zeithaml, V. and Berry, L. (1988) “SERVQUAL: a multiple-item scale for measuring consumer perceptions for service quality”, Journal of Retailing, Vol. 64(1), pp.12–40. Ranganathan, C. and Ganapathy, S. (2002), “Key dimensions of business-to-consumer web site”, Information and Management, Vol. 39(6), pp. 457-65. Rust, R.T and Zahorik, A.J (1993) “Customer satisfaction, customer retention and market share”,
Journal of Retailing, Vol 69(2), pp. 193-215
Seiders, K., Berry, L.L. and Gresham, L. (2000), “Attention retailers: how convenient is your convenience strategy?” Sloan Management Review, Vol. 49(3), pp. 79-90. Siu, N.Y.M. and Chow, D.K.H. (2003), “Service quality in grocery retailing: the study of a Japanese supermarket in Hong Kong”, Journal of International Consumer Marketing, Vol. 16(1), pp. 71-85. Spreng, R.A and Mackoy, R.D (1996) “An empirical examination of a model of perceived service quality and satisfaction,” Journal of Retailing, 72(2), pp 201-214, 1996. Tiku, S and Pecht, M (2010) “Validation of reliability capability evaluation model using quantitative assessment process” International Journal of Quality and Reliability Management 27(8) : 938-952
Wang, Y.J., Doss, S.K., Guo, C. and Li, W. (2010), “An investigation of Chinese consumers’ out-shopping motives from a culture perspective: implications for retail and distribution”, International Journal of Retail & Distribution Management, Vol. 38(6), pp. 423-42. Wolfinbargerhe, M. and Gilly Mary, C. (2003), “E-tail Q: Dimensionalising, measuring and predicting e-tail quality”, Journal of Retailing, Vol. 79(3), pp. 183-98. Wong, A and Sohal, A. (2003) "Service quality and customer loyalty perspectives on two levels of retail relationships", Journal of Services Marketing, Vol. 17 Issue: 5, pp.495-513 Yang, Z. and Peterson, R.T. (2004), “Customer perceived value, satisfaction, and loyalty: the role of switching costs”, Psychology & Marketing, Vol. 21(10), pp. 799-822. Yang, Z., Cai, S., Zhou, Z. and Zhou, N. (2005), “Development and validation of an instrument to measure user perceived service quality of information presenting web portals”, Information & Management, Vol. 42(4), pp. 575-589.