Embed Size (px)
Citation preview

This thesis has been submitted in fulfilment of the requirements for a postgraduate degree
(e.g. PhD, MPhil, DClinPsychol) at the University of Edinburgh. Please note the following
terms and conditions of use:
This work is protected by copyright and other intellectual property rights, which are
retained by the thesis author, unless otherwise stated.
A copy can be downloaded for personal non-commercial research or study, without
prior permission or charge.
This thesis cannot be reproduced or quoted extensively from without first obtaining
permission in writing from the author.
The content must not be changed in any way or sold commercially in any format or
medium without the formal permission of the author.
When referring to this work, full bibliographic details including the author, title,
awarding institution and date of the thesis must be given.
Enhanced Carrierless Amplitude and
Phase Modulation for Optical
Communication Systems
Kabiru Oluwaseun Akande
A thesis submitted for the degree of
Doctor of Philosophy
The University of Edinburgh
2018

Dedication
To my dear parents,
for their immeasurable care and support.
To my dearest love, Aa’ishah,
for all her endless prayers, sacrifice and love.
And to the triple M’s,
for the boundless joy they brought to our lives.
ii
Abstract
This thesis develops and investigates enhanced techniques for carrierless amplitude and phase
modulation (CAP) in optical communication systems. The CAP scheme is studied as the
physical layer modulation technique due to its implementation simplicity and versatility, that
enables its implementation as a single carrier (CAP) or multi-carrier technique (m-CAP).
The effect of timing jitter on the error performance of CAP is first investigated. The
investigation indicates that synchronization is a critical requirement for CAP receiver and as
a result, a novel low-complexity synchronization algorithm is developed with experimental
demonstration for CAP-based visible light communication (VLC) systems. To further reduce
the overall link complexity, a fractionally-spaced equalizer (FSE) is considered to mitigate the
effects of inter-symbol interference (ISI) and timing jitter. The FSE implementation, which
eliminates the need for a separate synchronization block, is shown through simulation and
VLC experimental demonstration to outperform symbol-spaced equalizers (SSE) that are
reported in literature for CAP-based VLC systems.
Furthermore, in this thesis, spectrally-efficient index modulation techniques are developed for
CAP. The proposed techniques can be divided into two broad groups, namely spatial index CAP
(S-CAP) and subband index CAP (SI-CAP). The proposed spatial index techniques leverage
the fact that in VLC, multiple optical sources are often required. The spatial CAP (S-CAP)
transmits CAP signal through one of Nt available LEDs. It is developed to reduce equalization
requirement and improve the spectral efficiency of the conventional CAP. In addition to the bits
transmitted through the CAP symbol, the S-CAP encodes additional bits on the indexing/spatial
location of the LEDs. The generalised S-CAP (GS-CAP) is further developed to relax the
S-CAP limitation of using a single LED per symbol duration. In addition to the S-CAP scheme,
multiple-input multiple-output (MIMO) techniques of repetitive-coded CAP (RC-CAP) and
spatial multiplexing CAP (SMux-CAP) are investigated for CAP. Low-complexity detectors
are also developed for the MIMO schemes. A key challenge of the MIMO schemes is that they
suffer power penalty when channel gains are similar, which occur when the optical sources are
iii
Abstract
closely located. The use of multiple receivers and power factor imbalance (PFI) techniques
are proposed to mitigate this power penalty. The techniques result in significant improvement
in the power efficiency of the MIMO schemes and ensure that the spectral efficiency gain is
obtained with little power penalty.
Finally, subband index CAP (SI-CAP) is developed to improve the spectral efficiency of
m-CAP and reduce its peak-to-average power ratio (PAPR). The SI-CAP encodes additional
information bits on the selection of ‘active’ subbands of m-CAP and only modulate data
symbols on these ‘active’ subbands. The error performance of the proposed SI-CAP is
evaluated analytically and verified with computer-based simulations. The SI-CAP technique is
also experimented for both VLC and step-index plastic optical fibre (SI-POF) communication
links. The experimental results show that for a fixed power efficiency, SI-CAP achieves higher
data rate compared tom-CAP. For example, at a representative bit error rate (BER) of 10−5, the
SI-CAP achieves a data rate and power efficiency gain of 26.5 Mb/s and 2.5 dB, respectively
when compared to m-CAP. In addition, an enhanced SI-CAP (eSI-CAP) is developed to
address the complexity that arises in SI-CAP at higher modulation order. The results of the
experimental demonstrations in VLC and 10 m SI-POF link shows that when compared with
m-CAP, eSI-CAP consistently yields a data rate improvement of between 7% and 13% for
varying values of the SNR.
iv
Lay Summary
Carrierless amplitude and phase modulation (CAP) is a high-dimensional modulation
technique that is employed for improving the throughput in optical communication systems.
However, the CAP technique has many challenges that need to be addressed in order to
realize its full potential. The first of the challenges that is addressed in this thesis is the
CAP sensitivity to timing variation. A novel technique is developed that suitably correct for
the effect of timing variation experienced by CAP in optical communication. In addition,
a technique that addresses the distortive effects of both the limited bandwidth and timing
variation is implemented to reduce the system complexity. Furthermore, spatial index
techniques are developed for the CAP scheme to improve its power and spectral efficiency.
The spatial index technique carry additional information, in addition to the information carried
by the conventional CAP symbol, on the indices of the multiple LEDs that are employed in
optical wireless communication. The spatial index technique is shown through theoretical
analysis and computer simulations to substantially improve the power and spectral efficiency
of CAP. Similarly, the subband index technique is developed for the multiband version of
CAP (m-CAP) by modulating extra information bits on the indices of the m-CAP’s subbands.
This increases the achievable data rates of the conventional m-CAP and improves its energy
efficiency. Using theoretical analyses, computer simulations and proof of concept experiments
in both optical fibre and wireless communications, the advantages of the subband index
technique are demonstrated. It is shown that between 7% and 13% improvement is achieved in
the data rate of m-CAP when the subband index technique is implemented. Finally, this thesis
presents a comprehensive development and experimental validation of multiple techniques
that enhance the performance of CAP-based optical communication systems.
v

Acknowledgements
I sincerely acknowledge the special favour bestowed upon me by Almighty Allah that enables
me to finish this thesis, despite the circumstances.
My appreciation goes to the school of engineering, university of Edinburgh for funding my
PhD program.
I am grateful to my supervisor, Dr W. O. Popoola, for his constant support and guidance as well
as his infectious, seemingly boundless enthusiasm. Indeed, several technical contributions in
this thesis emanate from his insightful comments and many of the chapters only saw completion
due to his drive. I also thank him for granting me the opportunity to carry out my research under
his tutelage and as a result, benefit from his knowledge.
I appreciate the entire LiFi team and the immediate members of our research group. Their
helpful dispositions create learning opportunities from many difficult moments.
I wish to extend my gratitude to my dear wife, Aa’ishah, for her love and sacrifice, especially
during those difficult times when our twins were born. And to the triple M’s, we all
acknowledge the joy and motivation you brought to our lives.
vi

Declaration
I declare that this thesis has been composed solely by myself and that it has not been submitted,
either in whole or in part, in any previous application for a degree. Except where otherwise
acknowledged, the work presented is entirely my own.
Kabiru O. Akande
vii
Contents
Dedication . . . . . . . . . . . . . . . . . . . . . . . . . . . . . . . . . . . . . . . . ii
Abstract . . . . . . . . . . . . . . . . . . . . . . . . . . . . . . . . . . . . . . . . . iv
Lay Summary . . . . . . . . . . . . . . . . . . . . . . . . . . . . . . . . . . . . . . v
Acknowledgements . . . . . . . . . . . . . . . . . . . . . . . . . . . . . . . . . . . vi
Declaration . . . . . . . . . . . . . . . . . . . . . . . . . . . . . . . . . . . . . . . vii
Contents . . . . . . . . . . . . . . . . . . . . . . . . . . . . . . . . . . . . . . . . . xi
List of Tables . . . . . . . . . . . . . . . . . . . . . . . . . . . . . . . . . . . . . . xii
List of Figures . . . . . . . . . . . . . . . . . . . . . . . . . . . . . . . . . . . . . . xix
List of Abbreviations . . . . . . . . . . . . . . . . . . . . . . . . . . . . . . . . . . xxiii
List of Mathematical Symbols . . . . . . . . . . . . . . . . . . . . . . . . . . . . . xxv
1 Introduction 1
1.1 Background . . . . . . . . . . . . . . . . . . . . . . . . . . . . . . . . . . . . 1
1.2 Research Motivation and Justification . . . . . . . . . . . . . . . . . . . . . . 3
1.3 Research Objectives . . . . . . . . . . . . . . . . . . . . . . . . . . . . . . . . 4
1.4 Thesis Contributions . . . . . . . . . . . . . . . . . . . . . . . . . . . . . . . 5
1.5 Thesis Organization . . . . . . . . . . . . . . . . . . . . . . . . . . . . . . . . 8
2 Review of the State of the Art 10
2.1 VLC System Model . . . . . . . . . . . . . . . . . . . . . . . . . . . . . . . . 10
2.1.1 Optical Sources/Transmitters for VLC Systems . . . . . . . . . . . . . 13
2.1.2 Optical Detector/Receiver for VLC Systems . . . . . . . . . . . . . . . 16
2.1.3 Modelling of VLC Channels . . . . . . . . . . . . . . . . . . . . . . . 17
2.1.4 Signal Processing Techniques for Impairments in VLC systems . . . . 22
2.2 Description of Step-Index Plastic Optical Fibre (SI-POF) . . . . . . . . . . . . 25
2.2.1 Transmitters/Receivers for SI-POF . . . . . . . . . . . . . . . . . . . . 26
2.2.2 Modelling of SI-POF channel . . . . . . . . . . . . . . . . . . . . . . 27
2.2.3 Impairments and Signal Processing Techniques in SI-POF . . . . . . . 28
viii
Contents
2.3 Modulation Techniques for Optical Communication . . . . . . . . . . . . . . . 29
2.4 Description of CAP Modulation Scheme . . . . . . . . . . . . . . . . . . . . . 30
2.4.1 Fundamentals of CAP Implementation . . . . . . . . . . . . . . . . . . 31
2.4.2 Design of Digital Pulse-shaping Filters for CAP . . . . . . . . . . . . . 32
2.4.3 Multiband CAP (m-CAP) . . . . . . . . . . . . . . . . . . . . . . . . 35
2.4.4 Comparison of CAP with other Modulation Schemes . . . . . . . . . . 36
2.5 CAP Implementation Challenges . . . . . . . . . . . . . . . . . . . . . . . . . 38
2.5.1 CAP Sensitivity to Timing Jitter . . . . . . . . . . . . . . . . . . . . . 38
2.5.2 CAP Performance under Limited LED Modulation Bandwidth . . . . . 39
2.5.3 m-CAP Power Requirement . . . . . . . . . . . . . . . . . . . . . . . 40
2.5.4 m-CAP Computational Complexity . . . . . . . . . . . . . . . . . . . 42
2.6 Summary of Chapter 2 . . . . . . . . . . . . . . . . . . . . . . . . . . . . . . 44
3 Synchronization and Equalization for CAP Implementation Challenges 45
3.1 Description of the CAP Mitigation Techniques . . . . . . . . . . . . . . . . . . 45
3.1.1 Mitigating Timing Jitter with the ‘CAP Filter’ Synchronization
Technique . . . . . . . . . . . . . . . . . . . . . . . . . . . . . . . . . 45
3.1.2 Mitigating the Effect of Limited Bandwidth and Timing Jitter with a
Fractionally-Spaced Equalizer (FSE) . . . . . . . . . . . . . . . . . . 49
3.2 Results and Discussions on the Performance of CAP Mitigation Techniques . . 52
3.2.1 Results and Discussions on the Performance of ‘CAP Filter’
Synchronization Technique . . . . . . . . . . . . . . . . . . . . . . . . 53
3.2.2 Results and Discussions on the Performance of FSE . . . . . . . . . . 57
3.3 Summary of Chapter 3 . . . . . . . . . . . . . . . . . . . . . . . . . . . . . . 63
4 Spatial-Multiplexing with CAP (SMux-CAP) in VLC Systems 64
4.1 Model Description . . . . . . . . . . . . . . . . . . . . . . . . . . . . . . . . 65
4.1.1 Description of SMux-CAP Model . . . . . . . . . . . . . . . . . . . . 65
4.1.2 Description of RC-CAP Model . . . . . . . . . . . . . . . . . . . . . . 66
4.2 BER Performance Analysis . . . . . . . . . . . . . . . . . . . . . . . . . . . . 66
4.2.1 BER Expression for SMux-CAP . . . . . . . . . . . . . . . . . . . . . 66
4.2.2 BER Expression for RC-CAP . . . . . . . . . . . . . . . . . . . . . . 68
ix
Contents
4.3 Low Complexity Detection Algorithms for SMux-CAP . . . . . . . . . . . . . 69
4.3.1 Zero Forcing (ZF) Detector . . . . . . . . . . . . . . . . . . . . . . . 69
4.3.2 Minimium Mean Square Error (MMSE) Detector . . . . . . . . . . . . 70
4.3.3 Optimally-Ordered Successive Interference Cancellation (OSIC) . . . . 71
4.4 Simulation Results and Discussions . . . . . . . . . . . . . . . . . . . . . . . 72
4.4.1 Performance Comparison of SMux-CAP and RC-CAP . . . . . . . . . 72
4.4.2 Performance Comparison of the Detection Algorithms . . . . . . . . . 76
4.5 Summary of Chapter 4 . . . . . . . . . . . . . . . . . . . . . . . . . . . . . . 80
5 Spatial-CAP (S-CAP) in VLC Systems 81
5.1 System Model Description . . . . . . . . . . . . . . . . . . . . . . . . . . . . 82
5.1.1 S-CAP System Model . . . . . . . . . . . . . . . . . . . . . . . . . . 82
5.1.2 Generalised S-CAP (GS-CAP) System Model . . . . . . . . . . . . . . 84
5.2 BER Performance Analysis . . . . . . . . . . . . . . . . . . . . . . . . . . . . 85
5.2.1 BER Expression for S-CAP . . . . . . . . . . . . . . . . . . . . . . . 85
5.2.2 BER Expression for GS-CAP . . . . . . . . . . . . . . . . . . . . . . 87
5.3 Simulation Results and Discussions . . . . . . . . . . . . . . . . . . . . . . . 89
5.3.1 Performance of S-CAP in Line-of-Sight (LOS) Channel . . . . . . . . 89
5.3.2 Performance of S-CAP in Non-LOS (Multipath) Channel . . . . . . . . 97
5.3.3 Performance of GS-CAP in LOS Channel . . . . . . . . . . . . . . . . 103
5.4 Summary of Chapter 5 . . . . . . . . . . . . . . . . . . . . . . . . . . . . . . 109
6 Subband Index CAP Modulation (SI-CAP) 110
6.1 Model Description of SI-CAP . . . . . . . . . . . . . . . . . . . . . . . . . . 111
6.2 Performance Analysis of Detection Schemes for SI-CAP . . . . . . . . . . . . 113
6.2.1 BER Derivation for Maximum Likelihood Detector (MLD) . . . . . . . 114
6.2.2 SI-CAP with Log-Likelihood Ratio Detector (LLR) . . . . . . . . . . . 115
6.2.3 SI-CAP with Low Complexity Detector (LCD) . . . . . . . . . . . . . 116
6.3 Simulation Results and Discussions . . . . . . . . . . . . . . . . . . . . . . . 117
6.4 Experimental Validation of SI-CAP Performance . . . . . . . . . . . . . . . . 120
6.4.1 Experimental Validation of SI-CAP in VLC . . . . . . . . . . . . . . . 123
6.4.2 Experimental Validation of SI-CAP in SI-POF . . . . . . . . . . . . . 123
x
Contents
6.5 Summary of Chapter 6 . . . . . . . . . . . . . . . . . . . . . . . . . . . . . . 125
7 Enhanced SI-CAP (eSI-CAP) for Optical Communications Systems 126
7.1 Model Description of eSI-CAP . . . . . . . . . . . . . . . . . . . . . . . . . . 126
7.2 Analysis of eSI-CAP Scheme . . . . . . . . . . . . . . . . . . . . . . . . . . . 129
7.2.1 Transmission efficiency of eSI-CAP . . . . . . . . . . . . . . . . . . . 129
7.2.2 Power efficiency of eSI-CAP . . . . . . . . . . . . . . . . . . . . . . . 129
7.2.3 Analysis of eSI-CAP BER performance with MLD . . . . . . . . . . . 131
7.2.4 Analysis of eSI-CAP BER performance with LLR . . . . . . . . . . . 132
7.2.5 Analysis of eSI-CAP BER performance with LCD . . . . . . . . . . . 133
7.3 Simulation Results and Discussions . . . . . . . . . . . . . . . . . . . . . . . 133
7.4 Experimental Validation of eSI-CAP Performance . . . . . . . . . . . . . . . . 138
7.4.1 Experimental validation of eSI-CAP performance in VLC . . . . . . . 139
7.4.2 Experimental validation of eSI-CAP performance in SI-POF . . . . . . 142
7.5 Summary of Chapter 7 . . . . . . . . . . . . . . . . . . . . . . . . . . . . . . 145
8 Conclusions 146
8.1 Summary of Key Results . . . . . . . . . . . . . . . . . . . . . . . . . . . . . 146
8.2 Limitation . . . . . . . . . . . . . . . . . . . . . . . . . . . . . . . . . . . . . 150
8.3 Future Direction . . . . . . . . . . . . . . . . . . . . . . . . . . . . . . . . . . 150
References 152
xi
List of Tables
2.1 Summary of the results of CAP performances in optical experimental
demonstrations. . . . . . . . . . . . . . . . . . . . . . . . . . . . . . . . . . . 37
4.1 Simulation parameters for the channel configuration. . . . . . . . . . . . . . . 72
4.2 Computational complexity of SMux-CAP detectors. . . . . . . . . . . . . . . . 79
5.1 S-CAP mapping illustration, Nt = 2 and M = 4. . . . . . . . . . . . . . . . . 83
5.2 GS-CAP constellation mapping process for Ω =⟨41
⟩42
. . . . . . . . . . . . . . 86
5.3 Configuration parameters for S-CAP channel modelling. . . . . . . . . . . . . 89
5.4 Coordinates of the PDs and LEDs employed in the simulations with the datum
or origin chosen as the room corner shown in Fig. 5.7. . . . . . . . . . . . . . . 90
5.5 System configuration for GS-CAP channel modelling. . . . . . . . . . . . . . . 103
5.6 Channel gains for different constellation points. . . . . . . . . . . . . . . . . . 108
6.1 SI-CAP mapping process for Ω =⟨42
⟩1.54
. . . . . . . . . . . . . . . . . . . . 112
7.1 Mapping process for the proposed eSI-CAP WITH N = 4, Na = 2 AND M = 4 128
7.2 The data rate achieved by each scheme below the FEC BER limit of 3×10⁻³ in
10 m SI-POF link with a measured 3 dB bandwidth of 100 MHz using different
modulation index (β), N = 16 and Na = 15. . . . . . . . . . . . . . . . . . . 144
xii
List of Figures
1.1 A synopsis of the thesis contribution . . . . . . . . . . . . . . . . . . . . . . . 6
2.1 The electromagnetic spectrum showing that VLC bandwidth is ≈ ×10, 000
larger than that of RF . . . . . . . . . . . . . . . . . . . . . . . . . . . . . . . 11
2.2 The VLC components. . . . . . . . . . . . . . . . . . . . . . . . . . . . . . . 13
2.3 The baseband linear system model of VLC channel. . . . . . . . . . . . . . . . 18
2.4 The path profile for the ray tracing indoor optical wireless channel model. . . . 19
2.5 The current-power output curve of an LED with the swinging current ISP . . . 22
2.6 An SI-POF system model for data transmission. . . . . . . . . . . . . . . . . . 26
2.7 Schematic block diagram of the CAP modulation scheme. . . . . . . . . . . . 31
2.8 Magnitude response of the combined in-phase transmit and receive CAP filters
for varying values of the filter span, Rs = 1 MHz, excess bandwidth, α = 0.15
and samples/symbol, L = 4. . . . . . . . . . . . . . . . . . . . . . . . . . . . 33
2.9 The impulse response of the I and Q transmit filters for CAP with a span of 10,
α = 0.15, L = 20, fs = 20 MSa/s. . . . . . . . . . . . . . . . . . . . . . . . . 34
2.10 Frequency responses of the subbands for different configurations of m-CAP . . 35
2.11 (a) In-phase arm of the matched filter output of CAP. (b) The desired part; (c)
The interference part. . . . . . . . . . . . . . . . . . . . . . . . . . . . . . . . 40
2.12 The quadrature transmit filters of an m-CAP scheme and their additions for
m = 3. . . . . . . . . . . . . . . . . . . . . . . . . . . . . . . . . . . . . . . 41
2.13 The CCDF of PAPR of m-CAP for different number of subbands using CAP-64. 42
2.14 Complexity dynamics of an m-CAP system showing the filter length and the
required number of computations as a function of the number of subbands, N . . 43
3.1 Schematic block diagram of a simplified CAP receiver showing the location of
the synchronizer and its components. . . . . . . . . . . . . . . . . . . . . . . . 46
3.2 Schematic block diagram of a simplified CAP transceiver showing the location
of the equalizer component. . . . . . . . . . . . . . . . . . . . . . . . . . . . . 53
3.3 BER performance of CAP for a range of timing jitter, SNR = 20 dB. . . . . . . 54
xiii
List of Figures
3.4 Probability of missed detection for the ‘CAP filter’ synchronization technique
for different sequence length. . . . . . . . . . . . . . . . . . . . . . . . . . . . 55
3.5 Comparison of BER performance of CAP with no jitter, with and without
synchronization for different constellation sizes in VLC system, τ = 0.25T
and P = 11. . . . . . . . . . . . . . . . . . . . . . . . . . . . . . . . . . . . 55
3.6 Constellation diagrams and EVM of the experimental demonstration in VLC
for both the ‘greedy’ and the ‘CAP-filter’ synchronization algorithm. . . . . . . 56
3.7 The normalized frequency response of the overall measured VLC channel with
a line through the -3 dB point. . . . . . . . . . . . . . . . . . . . . . . . . . . 57
3.8 Sensitivity of the performance of the equalizers to varying step sizes and
number of taps, SNR = 15 dB and Rb = 30 Mb/s. . . . . . . . . . . . . . . . . 58
3.9 Performance of FSE with increasing number of taps/symbol for a high data rate
of 700 Mb/s, equalizer length of 100 and link bandwidth of 16 MHz. . . . . . . 58
3.10 BER performance of CAP-16 for different data rates at SNR of 15 dB and 20 dB. 59
3.11 BER performance of CAP-64 for different data rates at SNR of 20 dB. . . . . . 60
3.12 MSE convergence rate of FSE and SSE for CAP-16 at Rb = 30 Mb/s and
SNR=20 dB. . . . . . . . . . . . . . . . . . . . . . . . . . . . . . . . . . . . . 60
3.13 Comparison of timing jitter mitigation by FSE and SSE using CAP-16 at Rb =
10 Mb/s and SNR = 10 dB. . . . . . . . . . . . . . . . . . . . . . . . . . . . . 61
3.14 Experimental demonstration of the BER performance comparison of FSE and
SSE using CAP-16 with an OSRAM OSTAR LED that has a -3 dB bandwidth
of 6.5 MHz. . . . . . . . . . . . . . . . . . . . . . . . . . . . . . . . . . . . . 62
4.1 The schematic block diagram of the MIMO CAP transceiver. . . . . . . . . . . 65
4.2 BER performance comparison of SMux-CAP (M = 4 and η = 8 bits/s/Hz)
and RC-CAP (M = 256 and η = 8 bits/s/Hz) using channel matrix H1. Sim :
Simulation; Thr: Theory; UbThr: Upper bound Theory . . . . . . . . . . . . . 73
4.3 BER performance comparison of SMux-CAP (M = 4 and η = 8 bits/s/Hz)
and RC-CAP (M = 256 and η = 8 bits/s/Hz) using channel matrix H2. Sim :
Simulation; Thr: Theory; UbThr: Upper bound Theory . . . . . . . . . . . . . 75
4.4 Improving the power efficiency of SMux-CAP using PFI precoding technique
when channel gains are highly similar or the transmitters are co-located. . . . . 75
xiv
List of Figures
4.5 Performance comparison of ML and the linear receivers for a 4×8 SMux-CAP
with M = 4 and η = 8 bits/s/Hz. Sim: Simulation; Thr: Theoretical Analysis . 77
4.6 Performance improvement of the linear detectors using ordered successive
interference cancellation for a 4 × 8 SMux-CAP with M = 16 and η =
16 bits/s/Hz. . . . . . . . . . . . . . . . . . . . . . . . . . . . . . . . . . . . . 78
4.7 Comparison of the required γb to achieve BER of 10−4 for all SMux-CAP
detectors at varying spectral efficiency with Nr = 8 and M = 4. . . . . . . . . 79
5.1 The schematic block diagram of the proposed S-CAP transceiver for VLC link. 83
5.2 The schematic block diagram of the proposed GS-CAP system. . . . . . . . . . 84
5.3 Spectral efficiency improvement of S-CAP over the conventional CAP scheme
for different number of LEDs and constellation sizes. . . . . . . . . . . . . . . 90
5.4 Spectral/power efficiency trade-off of S-CAP compared to CAP for the same
constellation order using two transmitting LEDs and one PD. . . . . . . . . . . 91
5.5 BER performance comparison of S-CAP using simulation and the derived
analytical expression for multiple LEDs and one PD with LOS channel gain.
Sim: Simulation and Thr: Analysis . . . . . . . . . . . . . . . . . . . . . . . . 92
5.6 BER performance comparison of S-CAP16 using simulation and the derived
analytical expression for four LEDs and varying number of PDs with LOS
channel gain. Sim: Simulation and Thr: Analysis . . . . . . . . . . . . . . . . 93
5.7 The required γb for S-CAP16 LOS propagation to achieve BER of 10−4 at each
PD location across the room using LED1 and LED4 whose positions are shown
by the red stars. The white region shows area of BER > 10−4. . . . . . . . . . 93
5.8 Distribution of hmin across the room for S-CAP16 considering LED1 and LED4
whose positions are shown by the white stars. . . . . . . . . . . . . . . . . . . 94
5.9 SNR per bit penalty for S-CAP16 LOS propagation using LED1 and LED4
by considering a fixed location on x-axis (x = 0.8 m) and varying the PD’s
location across the y-axis overlaid by the corresponding hmin values. . . . . . . 95
5.10 Improving the BER performance of S-CAP16 through power redistribution
with PFI and the use of multiple PDs at Location A in Fig. 5.9. . . . . . . . . . 96
5.11 Improving the BER performance of S-CAP16 through power redistribution
with PFI and the use of multiple PDs at location B in Fig. 5.9. . . . . . . . . . 96
xv
List of Figures
5.12 Comparison of the BER performance of S-CAP16 in LOS and multipath indoor
optical communication. . . . . . . . . . . . . . . . . . . . . . . . . . . . . . . 98
5.13 The γb penalty incurred by S-CAP16 to achieve the FEC BER limit of 3 ×
10−3 in an optical indoor multipath propagation with second-order reflections
in comparison to LOS propagation. The white regions indicate region where
BER > 3× 10⁻³. . . . . . . . . . . . . . . . . . . . . . . . . . . . . . . . . . 98
5.14 Comparison of the BER performance trend of S-CAP16 in multipath and LOS
propagation across the room for a fixed location on x-axis (x = 2.2 m) and at
the FEC BER limit of 3× 10⁻³. . . . . . . . . . . . . . . . . . . . . . . . . . 99
5.15 Comparison of the trend followed by τrms and hmin across the room for a fixed
location on x-axis (x = 2.2 m). . . . . . . . . . . . . . . . . . . . . . . . . . . 100
5.16 BER performance improvement for S-CAP16 using PFI in a multipath
propagation with second-order reflections at a location dominated by τrms. . . . 101
5.17 BER performance improvement for S-CAP16 using PFI in multipath
propagation with second-order reflections at a location dominated by hmin. . . . 101
5.18 BER performance improvement for S-CAP16 using multiple PDs in multipath
propagation with second-order reflections. . . . . . . . . . . . . . . . . . . . . 102
5.19 BER performance of GS-CAP with system configuration Ω = 〈5〉M2 for M =
4, 16 and 64. Sim: Simulation results; Thr: Theoretical results. . . . . . . . . . 104
5.20 BER performance of GS-CAP with system configuration Ω =⟨5Nr
⟩162
forNr =
2, 3, 4 and 5. Sim: Simulation results; Thr: Theoretical results. . . . . . . . . . 105
5.21 BER performance of GS-CAP with system configuration Ω = 〈5〉16Nafor Na =
2, 3 and 4. Sim: Simulation results; Thr: Theoretical results. . . . . . . . . . . 105
5.22 Choosing the number of active LEDs, Na, for a target spectral efficiency, η in
a GS-CAP system. . . . . . . . . . . . . . . . . . . . . . . . . . . . . . . . . 106
5.23 Impact of channel gain similarity of the BER performance of GS-CAP and the
use of PFI to restore dissimilarity. . . . . . . . . . . . . . . . . . . . . . . . . 107
5.24 BER performance of GS-CAP using the optimal (Soptu ) and sub-optimal (Ssub
u )
constellation set with Ω =⟨41
⟩162
. . . . . . . . . . . . . . . . . . . . . . . . . 108
6.1 The schematic block diagram of the proposed SI-CAP transceiver for VLC link. 111
xvi
List of Figures
6.2 The maximum transmission efficiency, T , in bpcu achievable by SI-CAP and
m-CAP as number of subbands, N , increases. . . . . . . . . . . . . . . . . . . 113
6.3 Comparison of the performance of SI-CAP detectors and validation
of the derived analysis using different system configurations.
Sim: Simulation; Thr: Theoretical analysis . . . . . . . . . . . . . . . . . . . . 117
6.4 The BER performance comparison of SI-CAP and m-CAP in AWGN channel,
T = 2 bpcu. . . . . . . . . . . . . . . . . . . . . . . . . . . . . . . . . . . . . 118
6.5 Comparison of the γb required by SI-CAP andm-CAP to achieve BER of 10−5
at varying Rb in a VLC system modelled using a first-order low pass filter with
a 10 MHz 3 dB cut-off frequency, T = 2 and 4 bpcu. . . . . . . . . . . . . . 119
6.6 The CCDF of the PAPR of SI-CAP and m-CAP for different number of
subbands and transmission efficiencies. . . . . . . . . . . . . . . . . . . . . . 120
6.7 Illustration of the experimental demonstration set-up for SI-CAP. . . . . . . . . 121
6.8 A pictorial representation of the experimental demonstration set-up in Fig. 6.7. 121
6.9 The measured normalized frequency responses of the Blue and RC-LED
employed for VLC and SI-POF experimental demonstration. . . . . . . . . . . 122
6.10 Experimental demonstration of the performance of SI-CAP and m-CAP over a
VLC link with a bandwidth of 10.9 MHz and β of 0.39. . . . . . . . . . . . . . 122
6.11 Experimental demonstration of SI-CAP and m-CAP over a 10 m SI-POF link
employing RCLED with a bandwidth of 100 MHz and β of 0.13 (i.e. low SNR
regime). . . . . . . . . . . . . . . . . . . . . . . . . . . . . . . . . . . . . . . 123
6.12 Experimental demonstration of SI-CAP and m-CAP over a 10 m SI-POF link
employing RCLED with a bandwidth of 100 MHz and β of 0.39 (i.e. high SNR
regime). . . . . . . . . . . . . . . . . . . . . . . . . . . . . . . . . . . . . . . 124
6.13 Constellation plots of the proposed SI-CAP and the conventional m−CAP
before and after equalization in SI-POF link, T = 2 bpcu, Rb = 420 Mb/s
and β = 0.39. . . . . . . . . . . . . . . . . . . . . . . . . . . . . . . . . . . . 125
7.1 The schematic block diagram of the proposed eSI-CAP transceiver for VLC link.127
7.2 The constellation symbols of eSI-CAP showing the dual distinguishable
constellation modeMA andMB . . . . . . . . . . . . . . . . . . . . . . . . . 128
xvii
List of Figures
7.3 The comparison of the maximum possible transmission efficiency of eSI-CAP,
SI-CAP and m-CAP for a given N and M . . . . . . . . . . . . . . . . . . . . 130
7.4 A demonstration of the optimum power-efficient eSI-CAP configuration and
comparison of its detection schemes showing excellent agreement with the
derived theoretical analysis. . . . . . . . . . . . . . . . . . . . . . . . . . . . . 134
7.5 Performance comparison of eSI-CAP, SI-CAP andm-CAP schemes in AWGN
channel. . . . . . . . . . . . . . . . . . . . . . . . . . . . . . . . . . . . . . . 135
7.6 The comparison of the SNR per bit (γb) required by eSI-CAP and m-CAP
schemes to achieve BER of 10−4 at varying Rb in VLC channel modelled as
first-order low-pass filter with a 10 MHz 3 dB cut-off frequency. . . . . . . . . 136
7.7 The comparison of the SNR per bit (γb) required by eSI-CAP and SI-CAP
schemes to achieve BER of 10−4 at varying Rb in VLC channel modelled as
first-order low-pass filter with a 10 MHz 3 dB cut-off frequency. . . . . . . . . 136
7.8 The comparison of the complimentary cumulative distribution function
(CCDF) of the peak-to-average power ratio (PAPR) of eSI-CAP, SI-CAP and
m-CAP for N = 4, 16 and 32. . . . . . . . . . . . . . . . . . . . . . . . . . . 137
7.9 Illustration of the set-up for the experimental demonstration with SI-POF link. . 138
7.10 The measured normalized frequency response of the overall link fitted with a
4th-order low-pass butterworth filter. . . . . . . . . . . . . . . . . . . . . . . . 139
7.11 Experimental validation of the optimum power-efficient configuration for
eSI-CAP in a VLC link with a 3 dB bandwidth of 10.9 MHz at varying β and Rb.140
7.12 Experimental validation of the superior BER performance of eSI-CAP in VLC
when compared to m-CAP at varying modulation index, β and data rates, Rb
using a commercially available LED with a link bandwidth of 10.9 MHz. . . . 140
7.13 Experimental validation of the superior BER performance of eSI-CAP in VLC
when compared to SI-CAP at varying modulation index, β and data rates, Rb
using a commercially available LED with a link bandwidth of 10.9 MHz. . . . 141
7.14 Optimum power-efficient configuration for enhanced subband index CAP
(eSI-CAP) in a 10 m SI-POF link with a measured 3 dB bandwidth of
100 MHz using different modulation index, β = [0.48, 0.36], N = 16,
Na = [1, 15] and M = 4. . . . . . . . . . . . . . . . . . . . . . . . . . . . . . 142
xviii
List of Figures
7.15 Performance comparison of the subband index schemes and m-CAP at
different modulation index, β using N = 16 and Na = 15 in 10 m SI-POF
link with a measured 3 dB bandwidth of 100 MHz. . . . . . . . . . . . . . . . 143
7.16 Performance comparison of the subband index schemes and m-CAP with β =
0.48, N = 16 and Na = 15 in 60 m SI-POF link with a measured 3 dB
bandwidth of 40 MHz. . . . . . . . . . . . . . . . . . . . . . . . . . . . . . . 144
xix
List of Abbreviations
2D . . . . . . . . two dimensional
ADSL . . . . . . asynchronous digital subscriber line
APD . . . . . . . avalanche PD
ATM . . . . . . asynchronous transfer mode
AWG . . . . . . arbitrary waveform generator
AWGN . . . . . additive white Gaussian noise
BER . . . . . . . bit error rate
CAP . . . . . . . carrierless amplitude and phase modulation
CIR . . . . . . . channel impulse response
CMOS . . . . . complementary metal-oxide-semiconductor
CPC . . . . . . . compound parabolic concentrator
DCO-OFDM . . direct current biased optical OFDM
DFE . . . . . . . decision feedback equalizer
DMT . . . . . . discrete multitone
E/O . . . . . . . electrical to optical
EMI . . . . . . . electromagnetic interference
eSI-CAP . . . . enhanced SI-CAP
EVM . . . . . . error vector magnitude
FD . . . . . . . frequency domain
FEC . . . . . . . forward error correction
FFE . . . . . . . feedforward equalizer
FFT . . . . . . . fast Fourier transform
FIR . . . . . . . finite impulse response
xx
List of Abbreviations
FSE . . . . . . . fractionally-spaced equalizer
GaN . . . . . . . gallium nitride
GS-CAP . . . . generalised S-CAP
HPF . . . . . . . high pass filter
IFFT . . . . . . inverse fast Fourier transform
IM/DD . . . . . intensity modulated and direct detection
IoT . . . . . . . internet of things
ISI . . . . . . . intersymbol interference
LD . . . . . . . laser diode
LED . . . . . . . light emitting diode
LO . . . . . . . local oscillator
LOS . . . . . . . line of sight
LPF . . . . . . . low pass filter
MED . . . . . . minimum Euclidean distance
m-CAP . . . . . multiple band CAP
MIMO . . . . . multiple input multiple output
µ-LED . . . . . micro LED
MLD . . . . . . maximum likelihood detector
MSB . . . . . . most significant bit
MSE . . . . . . mean square error
MSM . . . . . . metal semiconductor metal
NLOS . . . . . . non LOS
NRZ . . . . . . non return to zero
OFC . . . . . . optical fibre communication
OFDM . . . . . orthogonal frequency division multiplexing
OLED . . . . . . organic LED
xxi
List of Abbreviations
OOK . . . . . . on-off keying
OWC . . . . . . optical wireless communication
PAM . . . . . . pulse amplitude modulation
PAPR . . . . . . peak to average power factor
PC-LED . . . . phosphor converted LED
PD . . . . . . . photodetector
PDF . . . . . . . probability density function
PEP . . . . . . . pairwise error probability
PFI . . . . . . . power factor induced
PIN PD . . . . . p-type n-type intrinsic PD
PLL . . . . . . . phase locked loop
PMD . . . . . . probability of missed detection
POF . . . . . . . plastic optical fibre
PPM . . . . . . pulse position modulation
PWM . . . . . . pulse width modulation
QAM . . . . . . quadrature amplitude modulation
RC-CAP . . . . repetitive coding with CAP
RC-LED . . . . resonant cavity LED
RF . . . . . . . radio frequency
RGBY . . . . . red, green, blue and yellow
RLS . . . . . . . recursive least square
RMS . . . . . . root-mean-square
RRC . . . . . . raised cosine filter
S-CAP . . . . . spatial modulation with CAP
SCP . . . . . . . signal constellation points
SI-CAP . . . . . subband index CAP
xxii
List of Abbreviations
SI-POF . . . . . step index plastic optical fibre
SIR . . . . . . . signal-to-interference ratio
SMux-CAP . . . spatial multiplexing with CAP
SNR . . . . . . . signal-to-noise ratio
SSE . . . . . . . symbol-spaced equalizer
SSL . . . . . . . solid state lighting
TIA . . . . . . . transimpedance amplifier
VLC . . . . . . visible light communication
WDM . . . . . . wavelength division multiplexing
xxiii

List of Mathematical Symbols
b . . . . . . . . . number of bits to be transmitted
bm . . . . . . . . number of symbol bits
bs . . . . . . . . number of index bits
Na . . . . . . . . number of active LEDs
Nt . . . . . . . . number of transmitting LEDs
N0 . . . . . . . . variance of the AWGN
Nr . . . . . . . . number of receiving PDs
Nu . . . . . . . . number of index constellation points used
fs . . . . . . . . sampling rate of the system
h(t) . . . . . . . channel impulse response
hmin . . . . . . . minimum of the channel gains
L . . . . . . . . number of samples per symbol
Rb . . . . . . . . bit rate
Rs . . . . . . . . symbol rate
T . . . . . . . . symbol duration
Tb . . . . . . . . bit duration
w(t) . . . . . . . AWGN
x(t) . . . . . . . transmitted signal
y(t) . . . . . . . received signal
NCNa . . . . . . N combination Na
b·c . . . . . . . . floor function
‖ · ‖F . . . . . . Frobenius norm
NH(bm, bm) . . . Hamming distance between bm and bm) bits
xxiv
List of Mathematical Symbols
D(·) . . . . . . . minimum Euclidean distance metric
dk . . . . . . . . path traced out by the optical radiation from the source to the receiver
φk . . . . . . . . angle of incidence
θk . . . . . . . . angle of irradiance
S . . . . . . . . available index constellation
τrms . . . . . . . channel rms delay spread
K . . . . . . . . electrical to optical conversion coefficient
Φ1/2 . . . . . . . half-power LED semiangle
β . . . . . . . . optical modulation index
O . . . . . . . . order of computational complexity
δnt . . . . . . . . PFI weighting factor for ntht LED
ρ . . . . . . . . . reflectivity coefficient
R . . . . . . . . responsivity of the PD
ξ . . . . . . . . . scaling factor to maintain unity power for subband indexing techniques
Su . . . . . . . . selected/used index constellation
M . . . . . . . . set of constellation points
∆γ . . . . . . . . SNR per bit penalty
η . . . . . . . . . spectral efficiency
Ω . . . . . . . . system configuration
T . . . . . . . . transmission efficiency
xxv
Chapter 1
Introduction
1.1 Background
There has been an exponential increase in the number of devices requiring and assessing
wireless connectivity, especially with the growing popularity of Internet of Things (IoT) and
ubiquitous connectivity of smart devices [1, 2]. This is coupled with the current trend to
enhance mobile broadband experience with innovative data applications and services. This
rapid growth in broadband communication and unprecedented demand for high data rate
is stretching the limit of the existing network of communication infrastructure. Therefore,
supporting this rapid growth requires communication technology with ability to complement
the already crowded radio frequency (RF) spectrum. The technologies that are currently being
considered as candidate solutions to the spectrum crunch in RF are those utilizing the higher
frequency spectrum, such as mm-wave and visible light communications (VLC) [3].
The VLC, which occupies the nano-meter ( v 380 nm - 780 nm) wavelength region of
the electromagnetic spectrum (EM), is attracting lots of research interest as a suitable
technology to augment the RF. It has a unique feature which enables it to combine illumination
with high-speed wireless data communication. The main advantages of VLC over RF
communication are the availability of huge unused and unlicensed spectrum, its use of
inexpensive devices, high security and immunity to electromagnetic interference, among
many others [2, 4]. In addition, VLC technology also offers a range of specialized innovative
applications and services such as indoor localization and positioning, e-commerce and
vehicle-to-vehicle communication [5, 6].
1
Chapter 1. Introduction
The rapid advancement in the field of solid state light emitting diode (LED) and its wide
adoption for lighting purposes are at the core of the heightened interest in VLC . In comparison
to the traditional incandescent and fluorescent lighting devices, LEDs are cost effective,
long-lasting, energy efficient and can be electronically programmed [2]. Moreover, the fast
switching speed of LED enables the possibility of modulating data on its radiated intensity at a
rate that is imperceptible to human eye [2]. This gives rise to the combined usage of LEDs for
both illumination and VLC. The white LEDs employed in VLC are mainly obtained through
two methods. The light from three different chips each emitting red, green and blue light can
be mixed together to achieve a single white RGB LED [4, 7]. Alternatively, a blue LED with
a yellow phosphor coating can also be employed to realise a white phosphor-converted LED
(PC-LED) [7]. The yellow phosphor coating in the PC-LED absorbs part of the emitted blue
light to produce a yellow light. The yellow light then combines with the remaining un-absorbed
blue light to produce a white PC-LED. However, while the PC-LED is less complex, more
cost-effective, energy efficient and offers better colour rendering than the RGB white LED,
the use of phosphor coating severely limits the modulation bandwidth of the LED to a few
MHz [8,9]. This is as a result of the slow time response of the phosphor coating in comparison
to the blue chip in the LED. Hence, a number of signal processing techniques are employed
in improving the bandwidth of PC-LED to achieve a high data rate VLC system. One of the
techniques employed in improving the bandwidth of PC-LED is the use of blue filter at the
receiver to extract the blue component in the received signal and block the yellow component
[10, 11]. This approach results in power penalty as the energy in the yellow component are
lost to the filtering process [12]. Other techniques are pre- and post-equalization and the use of
advanced modulation techniques [13].
In addition to the VLC technique, step-index plastic optical fibre (SI-POF) is also attracting
lots of attention for applications in data communication [14–16]. The use of SI-POF is due
to its mechanical flexibility that allows ease of handling and results in fast and inexpensive
installation. In addition, it provides immunity to electromagnetic interference (EMI) and offers
high data rates [16]. However, SI-POF has implementation challenges such as its limited
bandwidth-length product (45 MHz ×100 m) and high attenuation (0.15 dB/m at 650 nm
wavelength) [17, 18]. These challenges require adequate solutions in order to fully realise
the benefits of SI-POF. The use of advanced modulation techniques is one of the methods that
2
Chapter 1. Introduction
are adopted to improve the achievable data rate and overcome the challenges encountered in
SI-POF implementation [17].
1.2 Research Motivation and Justification
The CAP modulation technique has been widely investigated for optical communication
systems [7, 19–22]. This is due to the combination of its high spectral efficiency and
implementation simplicity [23]. The CAP modulation scheme also has a special feature in
that it can be implemented as a single band or a multi-band scheme [24, 25]. This special
feature provides design flexibility as it is easily adaptable to a single or multi-band scenarios.
The CAP scheme has previously been adopted by asynchronous transfer mode (ATM)
standardization body, ATM Forum, as the standard for ATM LAN physical layer interface
and was an early candidate for asymmetric digital subscriber line (ADSL) [26, 27]. It was
later discontinued in favour of discrete multitone (DMT) due to its required equalization
resources at high throughputs [28]. However, CAP modulation is currently enjoying a
resurgence as a result of its special properties that lead to implementation advantages in optical
communication. Among these properties is that CAP, as a single carrier modulation, has a
low peak-to-average power ratio (PAPR) in comparison to discrete multitone (DMT) whose
high PAPR is one of its major issues [29]. The low PAPR factor of CAP modulation is well
suited to optical communication since there is a considerable optical power constraint in the
transmitter front-end imposed by both the eye safety regulations and design requirements [29].
In addition, the CAP signal is real-valued and as such is suitable for the intensity modulated
and direct detection (IM/DD) approach that is employed in optical communication [30, 31].
Furthermore, the CAP transceiver is relatively easy to implement as it uses digital finite
impulse response (FIR) filter and avoids the need for carrier modulation and recovery in
comparison to its QAM counterpart [23].
However, the CAP modulation scheme is not devoid of challenges. The use of orthogonal filters
for pulse-shaping and matched filtering operations in the CAP transceiver significantly increase
its sensitivity to timing jitter [22, 23]. Furthermore, CAP performance degrades in channels
with a non-flat frequency response, which is typical of VLC systems employing PC-LEDs as
the transmitter. Similarly, PC-LEDs suffer from small modulation bandwidth which results in
3
Chapter 1. Introduction
severe inter-symbol interference (ISI) for systems operating at high throughputs. In addition,
just like the DMT approach, the multiband version of CAP (m-CAP) also suffers from high
PAPR. When adopted in plastic optical fibre (POF), the limited bandwidth-length product and
power attenuation results in performance degradation at high bit rates [30]. These challenges
require the development of novel techniques to benefit from the advantages of CAP modulation.
Hence, novel techniques are developed for enhancing the performance of CAP in this thesis.
The focus is on developing techniques that have high spectral and energy efficiency coupled
with low computational complexity. The developed techniques, which are validated through
theoretical analysis, simulations and experimental demonstrations, show that the enhanced
CAP is a suitable modulation technique for optical communication systems.
1.3 Research Objectives
This thesis aim to improve the performance of optical systems employing VLC and SI-POF
by developing an enhanced CAP modulation schemes. Novel techniques that address the
challenges of CAP-based optical communication systems are to be developed and their
performances validated through theoretical analysis, simulations and proof-of-concept
experimental demonstrations. Fair comparisons with the state-of-the-art techniques are to
be performed to quantify the performance gains of the developed techniques. Performance
criteria such as bit-error-rate (BER), error vector magnitude (EVM), spectral efficiency (η)
and energy efficiency are to be assessed for the developed techniques. In order to achieve the
aforementioned goals, the thesis objectives are set as follows:
• To conduct a comprehensive review of the fundamentals of CAP modulation scheme, that
leads to firm understanding of the impact of its parameters on the systems performance.
• To investigate the impact of timing jitter on the performance of CAP with a view to
developing suitable synchronization algorithm that addresses the jitter effect.
• To investigate multiple-input multiple-output (MIMO) techniques (including spatial
modulation and spatial multiplexing) for CAP-based VLC systems as means of
improving its spectral efficiency.
• To develop signal processing techniques that improve the performance degradation of
4
Chapter 1. Introduction
the MIMO CAP-based VLC systems, due to co-located optical sources and non-line of
sight (NLOS) propagation.
• To improve the spectral and energy efficiency ofm-CAP based VLC and SI-POF systems
with subband indexing techniques.
• To ensure low complexity implementation of all the proposed techniques and their
validation, where possible, through combination of theoretical analysis, simulations and
experimental demonstrations.
1.4 Thesis Contributions
This thesis has made original contributions by:
1. Showing the impact of timing jitter on CAP-based VLC systems, developing a novel
synchronization algorithm to address the jitter problem, deriving the theoretical analysis
for the algorithm and validating its performance through simulation and experimental
demonstration.
2. Achieving low complexity implementation through the use of fractionally spaced
equalizer (FSE) for combined equalization and synchronization of CAP-based VLC
systems.
3. Enhancing the spectral efficiency of the CAP-based VLC systems through the
implementation of spatial modulated and spatial multiplexed CAP (S-CAP and
SMux-CAP), deriving the BER analysis of the resulting systems and investigating the
performance in LOS and NLOS propagation.
4. Employing signal processing techniques to improve the performance degradation of the
S-CAP schemes due to co-located optical sources.
5. Developing low complexity detection algorithms for SMux-CAP, comparing the BER
performance of the algorithms and evaluating their computational complexities.
6. Developing spectrally-efficient novel subband index CAP (SI-CAP) schemes and
validating their superior spectral efficiencies compared to m-CAP through theoretical
analysis, simulation and experimental demonstration.
A synopsis of the thesis contributions, spanning both optical fiber and optical wireless
5
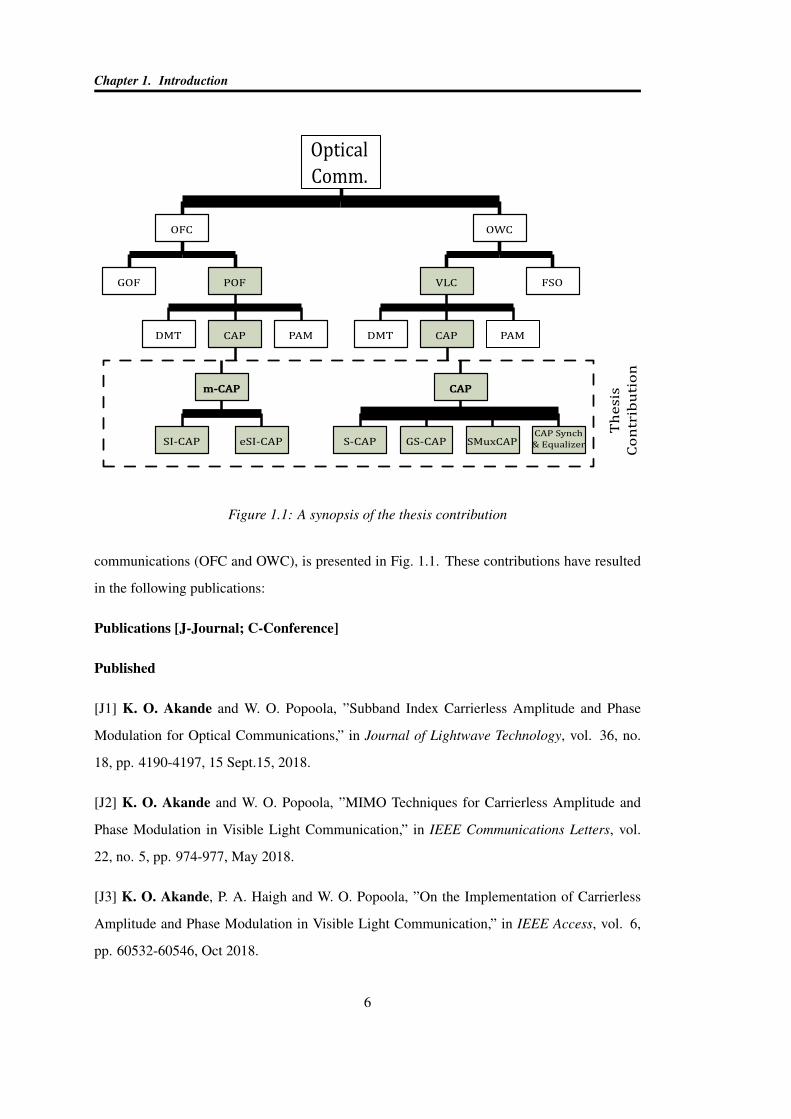
Chapter 1. Introduction
Optical
Comm.
OFC OWC
GOF POF VLC FSO
CAP PAMDMT CAP PAMDMT
m-CAP
SMuxCAPCAP Synch
& EqualizerGS-CAPS-CAPeSI-CAPSI-CAP
Th
esis
Co
ntr
ibu
tio
n
CAP
Figure 1.1: A synopsis of the thesis contribution
communications (OFC and OWC), is presented in Fig. 1.1. These contributions have resulted
in the following publications:
Publications [J-Journal; C-Conference]
Published
[J1] K. O. Akande and W. O. Popoola, ”Subband Index Carrierless Amplitude and Phase
Modulation for Optical Communications,” in Journal of Lightwave Technology, vol. 36, no.
18, pp. 4190-4197, 15 Sept.15, 2018.
[J2] K. O. Akande and W. O. Popoola, ”MIMO Techniques for Carrierless Amplitude and
Phase Modulation in Visible Light Communication,” in IEEE Communications Letters, vol.
22, no. 5, pp. 974-977, May 2018.
[J3] K. O. Akande, P. A. Haigh and W. O. Popoola, ”On the Implementation of Carrierless
Amplitude and Phase Modulation in Visible Light Communication,” in IEEE Access, vol. 6,
pp. 60532-60546, Oct 2018.
6
Chapter 1. Introduction
[J4] K. O. Akande and W. O. Popoola, ” Experimental Demonstration of Subband Index
Techniques for m-CAP in Short Range SI-POF Links,” in IEEE Photonics Technology Letters,
vol. 30, no. 24, pp. 2155-2158, 15 Dec.15, 2018.
[J5] K. O. Akande and W. O. Popoola, ” Spatial Carrierless Amplitude and Phase Modulation
Technique for Visible Light Communication Systems,” in IEEE Systems Journal, Jan 2019.
Under review
[J6] K. O. Akande and W. O. Popoola, ” Enhanced Subband Index Carrierless Amplitude and
Phase Modulation in Visible Light Communications,” in Journal of Lightwave Technology, Feb
2019.
Papers in conference proceedings
[C1] K. O. Akande and W. O. Popoola, ”Generalised Spatial Carrierless Amplitude and
Phase Modulation in Visible Light Communication,” 2018 IEEE International Conference on
Communications (ICC), Kansas City, MO, USA, 2018, pp. 1-6.
[C2] K. O. Akande, F. B. Offiong, H. Alrakah and W. O. Popoola, ”Performance Comparison
of MIMO CAP Receivers in Visible Light Communication,” 2018 11th International
Symposium on Communication Systems, Networks and Digital Signal Processing (CSNDSP),
Budapest, July 18-20, 2018.
[C3] G. Egecan, K. O. Akande, P. A. Haigh, and W. O. Popoola, ”Frequency Response
Modelling of Cool and Warm White LEDs in VLC Systems,” 2018 The First West Asian
Colloquium on Optical Wireless Communications. Irfan. Iran, 25 April 2018.
[C4] K. O. Akande, P. A. Haigh and W. O. Popoola, ”Joint equalization and synchronization
for carrierless amplitude and phase modulation in visible light communication,” 2017 13th
International Wireless Communications and Mobile Computing Conference (IWCMC),
Valencia, 2017, pp. 876-881.
[C5] K. O. Akande and W. O. Popoola, ”Synchronization of carrierless amplitude and
phase modulation in visible light communication,” 2017 IEEE International Conference on
Communications Workshops (ICC Workshops), Paris, 2017, pp. 156-161.
7
Chapter 1. Introduction
[C6] K. O. Akande and W. O. Popoola, ”Impact of timing jitter on the performance of carrier
amplitude and phase modulation,” 2016 International Conference for Students on Applied
Engineering (ICSAE), Newcastle upon Tyne, 2016, pp. 259-263.
Awards
[1.] Best poster award at the first IEEE International Conference for Students on Applied
Engineering (ICSAE 2016), Newcastle upon Tyne, UK.
[2.] Recipient of the IEEE Communication Society (COMSOC) Student Travel Grant for
the IEEE ICC 2018, Kansas City, USA.
1.5 Thesis Organization
Following the introductory part contained in this chapter, chapter 1, the remainder of the
thesis is organized into seven chapters. Chapter 2 reviews the state-of-the-art by discussing
the transmitters and receivers in VLC and SI-POF as well as their pre/post signal processing
techniques. In addition, the fundamentals of CAP modulation including its filter parameters,
multiband version and challenges are discussed.
The techniques that are employed to mitigate the challenges of CAP-based systems are
discussed in chapter 3. Specifically, a low complexity novel synchronization technique
is presented along with experimental validation and comparison with the state-of-the-art
technique. Furthermore, FSE is shown to be capable of joint synchronization and equalization
of CAP signals and its superior performance compared to SSE is experimentally validated.
The S-CAP and its generalised version as well as their BER analytical derivations are presented
in chapter 4. The chapter also include the study of their performances in LOS and NLOS
conditions along with the performance-enhancing techniques that are developed to improve
performance degradation due to closely-spaced optical sources and receivers.
The system model of SMux-CAP, its BER analytical derivation and performance comparison
with repetitive-coded CAP (RC-CAP) are presented in chapter 5. Four low-complexity
detection algorithms for SMux-CAP, along with their BER performance comparisons and
computational complexity analysis, are also detailed in the chapter. Furthermore, it is shown
8
Chapter 1. Introduction
in chapter 5 how signal processing technique can be employed to improve the performance
degradation of SMux-CAP when the optical sources are co-located.
The spectral efficiency of m-CAP is significantly improved by the SI-CAP developed and
presented in chapter 6. In addition to the bits transmitted on the signal constellation, the
SI-CAP modulates extra bits on the subband indexing ofm-CAP, thereby improving its spectral
efficiency. Low complexity detection algorithms that ensure the gains of SI-CAP are obtained
at comparable complexity with m-CAP are also presented in the chapter. In addition, the
chapter contains analytical, simulation and experimental results that validate the gains of
SI-CAP compared to m-CAP in both VLC and SI-POF channels.
Enhanced SI-CAP (eSI-CAP) is presented in chapter 7 to solve the complexity challenge in
SI-CAP. The complexity arises from the fact that to maintain the same spectral efficiency as
m-CAP, the SI-CAP requires increasing number of subbands as constellation size increases.
The eSI-CAP developed in chapter 7 resolves this complexity as well as improves the spectral
efficiency gain of SI-CAP. The performance gain of eSI-CAP is also validated in the chapter
with theoretical analysis, simulations and experimental demonstrations. Furthermore, novel
detection algorithm that significantly reduces the detection complexity of eSI-CAP while
maintaining the same BER performance as the maximum likelihood detector (MLD) is
presented.
Finally, the thesis is concluded in chapter 8 by highlighting the summary of the main
contributions in each chapter and their implications. A list of future work that are
recommended to improve on the various techniques developed in this thesis is also presented.
9
Chapter 2
Review of the State of the Art
The background concepts underlining the thesis, such as VLC technology, SI-POF system and
the CAP modulation scheme, are covered in this chapter. The state of the art regarding these
concepts in the literature are presented to lay a solid background for the performance-enhancing
techniques that are later developed in the thesis. The review include the working principles
of the optical sources and receivers, modelling of the optical wireless and plastic optical
fibre communication channels, signal processing techniques that are adopted for performance
improvement, the fundamentals of CAP modulation scheme and its implementation challenges.
2.1 VLC System Model
The first historical reference regarding transmitting information using the visible light medium
can be traced back to the demonstration made by Alexander Graham Bell and his assistant
Charles Sumner Tainter in 1880 [32]. With their ”Photophone” invention, they demonstrated
wireless transmission of voice message over a distance of 200 m using the sunbeam as the
carrier. However, the intermittent nature of the sunlight coupled with weather conditions such
as fog and wind stunted the advancement of Bell’s breakthrough and prevents its practical
implementation. Subsequent advancement in radio communication further inhibits research in
light communication. A combination of several factors is now contributing to a renaissance
of communicating using the light beam as conceived by Bell. The radio communication is
currently experiencing a spectrum crunch due to bandwidth bottleneck. The overcrowded radio
spectrum results from the information revolution and proliferation of smart devices that are
accessing the wireless network. Simply put, the demand for bandwidth is far outstripping the
network service providers’ ability to supply. In addition, the need for higher speed connection
10
Chapter 2. Review of the State of the Art
has never been greater due to the current trend of enhancing broadband mobile experience
with innovative data applications and services. The combination of all the aforementioned
factors has made it imperative to seek alternative and/or complementary technologies with
higher capacity than the existing communication network infrastructure. The visible light
communication (VLC), which combines illumination with high speed data communication,
is one of such technologies with its spectrum ranging from 400 THz to 800 THz (380 nm -
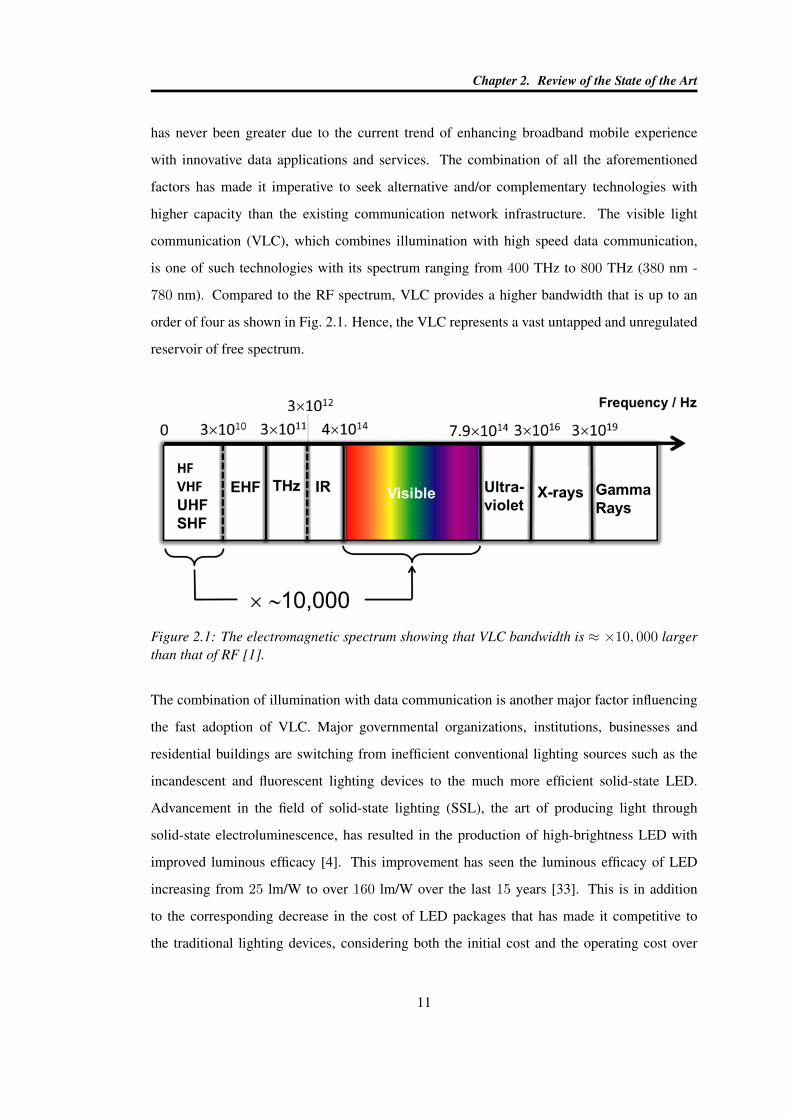
780 nm). Compared to the RF spectrum, VLC provides a higher bandwidth that is up to an
order of four as shown in Fig. 2.1. Hence, the VLC represents a vast untapped and unregulated
reservoir of free spectrum.
Figure 2.1: The electromagnetic spectrum showing that VLC bandwidth is ≈ ×10, 000 largerthan that of RF [1].
The combination of illumination with data communication is another major factor influencing
the fast adoption of VLC. Major governmental organizations, institutions, businesses and
residential buildings are switching from inefficient conventional lighting sources such as the
incandescent and fluorescent lighting devices to the much more efficient solid-state LED.
Advancement in the field of solid-state lighting (SSL), the art of producing light through
solid-state electroluminescence, has resulted in the production of high-brightness LED with
improved luminous efficacy [4]. This improvement has seen the luminous efficacy of LED
increasing from 25 lm/W to over 160 lm/W over the last 15 years [33]. This is in addition
to the corresponding decrease in the cost of LED packages that has made it competitive to
the traditional lighting devices, considering both the initial cost and the operating cost over
11
Chapter 2. Review of the State of the Art
the LED life cycle. Furthermore, the best performing conventional lighting devices with the
highest luminous efficacy is the high-intensity discharge lamps with around 100 lm/W and
usable life of 15, 000 h. This is in comparison to about 100, 000 h operating life cycle of LEDs
with up to 250 lm/W. Thus, in comparison to the conventional lighting technologies, SSL offers
significant advantage in the energy usage and the associated cost savings. Other advantages
of LEDs over the conventional lighting devices include lower heat generation, lower power
consumption, smaller and compact size, mercury free and higher tolerance to humidity [2].
While LEDs are steadily gaining popularity due to their associated energy and cost savings
properties, their most important property for enabling the widespread of VLC is their
fast-switching speed [2, 4]. This property allows data information to be impressed on the
LED radiated output by rapid, steady flickering of its intensity and without it being perceived
by the human eye. This high frequency switching, which is not available with other lighting
technologies, enables the VLC to perform the dual functionality of providing the general
illumination and delivering high-speed data communication, simultaneously.
The first reported adoption of LED as a VLC device in the literature is by Pang et al [34]
who demonstrated the modulation of audio messages on the visible beam of light that is
emitted from an LED traffic light. However, full research into VLC for indoor and home
network only took-off with the pioneering work of Tanaka et al in [35] who proposed the
use of high-brighteness LED for wireless home networking. The RONJA (Reasonable Optical
Near Joint Access) system later used beam of visible light to established a 10 Mb/s full duplex
Ethernet point-to-point free space link that extends up to 1.4 km in 2001 [36]. In 2003, the
Visible Light Communication Consortium (VLCC) was established to provide standardization
for the now rapidly developing VLC technology and promote its adoption. Following the
VLCC establishment, governments, industries and research agencies all provide funds to
further the rapid development of VLC technology [2]. Since then, different research groups
have reported world record data rates from VLC experimental demonstrations. High-speed
VLC links exceeding 10 Gb/s have been established with off-the-shelf LEDs [19].
Apart from the huge bandwidth available in the visible light spectrum, there are other
numerous advantages of VLC when compared with RF. Unlike RF, the VLC is unaffected by
electromagnetic interference (EMI) which makes it suitable for communication in sensitive
12
Chapter 2. Review of the State of the Art
places such as hospitals, military installations, aeroplanes and so on [2, 3]. The inability of the
VLC to penetrate opaque objects gives it an inherent security towards eavesdropping/snooping
and enables the possibility of spatial reuse. Furthermore, VLC makes use of a relatively
simple intensity modulation and direct detection technique as well as inexpensive devices
to establish its communication link. Similarly, VLC can easily be incorporated into existing
infrastructure at very low cost due to the already wide adoption of energy-efficient LEDs for
illumination [37].
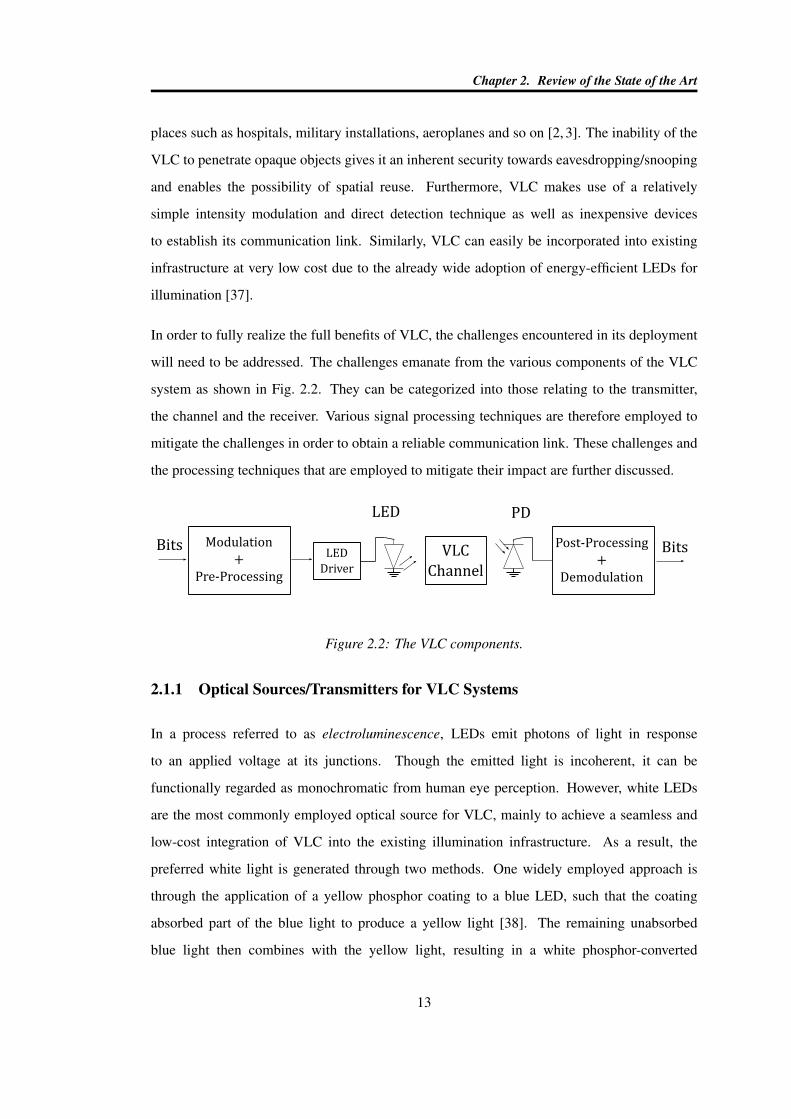
In order to fully realize the full benefits of VLC, the challenges encountered in its deployment
will need to be addressed. The challenges emanate from the various components of the VLC
system as shown in Fig. 2.2. They can be categorized into those relating to the transmitter,
the channel and the receiver. Various signal processing techniques are therefore employed to
mitigate the challenges in order to obtain a reliable communication link. These challenges and
the processing techniques that are employed to mitigate their impact are further discussed.
VLC
Channel
LED PD
LED
Driver
Modulation
+
Pre-Processing
Post-Processing
+
Demodulation
Bits Bits
Figure 2.2: The VLC components.
2.1.1 Optical Sources/Transmitters for VLC Systems
In a process referred to as electroluminescence, LEDs emit photons of light in response
to an applied voltage at its junctions. Though the emitted light is incoherent, it can be
functionally regarded as monochromatic from human eye perception. However, white LEDs
are the most commonly employed optical source for VLC, mainly to achieve a seamless and
low-cost integration of VLC into the existing illumination infrastructure. As a result, the
preferred white light is generated through two methods. One widely employed approach is
through the application of a yellow phosphor coating to a blue LED, such that the coating
absorbed part of the blue light to produce a yellow light [38]. The remaining unabsorbed
blue light then combines with the yellow light, resulting in a white phosphor-converted
13
Chapter 2. Review of the State of the Art
LED (PC-LED). Though the PC-LED is cost-effective, energy efficient, has low-complexity
and good colour rendering index (CRI), it has a low modulation bandwidth due to its slow
yellow phosphorescent component. The low modulation bandwidth represents a bottleneck in
achieving high speed VLC system.
Another approach to achieving white LED is through the use of multi-chips LED namely red,
green and blue LED (RGB LED). The combination of these three colours result in the emission
of white light with higher modulation bandwidth than that of PC-LED. However, due to its high
cost, relatively complex circuitry and poor quality colour rendering capability, the RGB LED
is seldom employed for commercial illumination purposes requiring white lighting [2, 39].
There are other types of LEDs that have been developed. Organic LEDs (OLEDs) are fabricated
by using an organic compound as the emissive layer of the LED [38, 40–42]. The resulting
LED is suitable for display purposes due to its low-cost and flexible display, wide viewing
angle and low driving voltage. However, when compared to inorganic LEDs, it has lower
bandwidth on the order of 100’s of kHz and has a shorter life span, approximately 50, 000 h.
This makes it unsuitable for high-speed data communication and the general illumination
purposes. Micro LEDs (µ-LEDs) are another type of LEDs with high bandwidth on the order
of 100’s of MHz [43–45]. They can be manufactured by reducing LED active area with a
corresponding reduction in capacitance and an increase in the current density. With an area
of about 100 × 100 µm2, they are usually deploy in arrays and thus, very suitable for MIMO
systems. There are also resonant cavity LEDs (RC-LEDs) that employed distributed Bragg
reflectors to improve the light extraction efficiency of the conventional LEDs and enhance its
emitted light [46]. The RC-LEDs have better spectral purity and higher bandwidth than the
conventional LEDs [2, 14].
In light of the limited bandwidth of the optical transmitting sources, there have been various
experimental and theoretical reports of light sources that can support high speed data
communication in the literature. Over 200 Mb/s data rate was first reported by [47] using
a single white LED with DMT. This was followed by data rates in the range of Gb/s using
CAP and OFDM modulation schemes [48, 49]. Recently, there has been demonstration of
2-Gb/s over a single commercial phosphorescent white LED using OFDM with adaptive bit
loading [50]. On the other hand, 10 Gb/s has been demonstrated for RGB LEDs employing a
14
Chapter 2. Review of the State of the Art
rate adaptive OFDM with wavelength division multiplexing (WDM) [51, 52]. Using WDM,
CAP modulation and equalizers, the use of a commercially available LED having four
channels namely red, blue, green and yellow (RGBY LED) has also been experimentally
demonstrated to achieve a data rate of 8 Gb/s over a distance of 1 m indoor free space [19].
Similarly, a commercially available RGBY LED has been shown to achieve greater than
5 Gb/s for downlink distance of up to 4 m [53].
For systems employing µ-LED, a high data rate of 1 Gb/s has been experimentally
demonstrated in a free space VLC link using on-off keying (OOK) without equalization [45].
Recent demonstrations show an increased data rate of 3 Gb/s and 5 Gb/s with the use of
DCO-OFDM and a single blue µ-LED [44, 54]. Despite their low bandwdiths, demonstrations
involving organic LEDs including polymer LEDs have reported data rates of more than
50 Mb/s with the use of artificial neuron equalizer and DMT [38, 42].
There have been a number of high data rate experimental demonstrations involving the use of
laser diodes (LD) as optical source for free space VLC. The use of an integrated waveguide
modulator - laser diode (IWM-LD) with low power consumption was shown to achieve the
data rate of 1 Gb/s in [55]. The authors of [56] also demonstrated a high data rate of 9 Gb/s
with the use of Gallium Nitride (GaN) blue LD employing OFDM over a 5 m free space
link. Furthermore, an off the shelf RGB LD has been experimentally shown to achieve up to
14 Gb/s [57].
To tackle the effect of the slow phosphorescent converter, many experimental demonstrations
have employed organic semiconductor colour-converters to improve the limited bandwidth of
the PC-LEDs. A novel fast colour-converter using a blend of conjugated polymers has been
shown to result in a bandwidth of 200 MHz which is more than 40 times higher than that obtain
with the commercially available phosphor colour-converter [58]. Recent work has shown a
higher modulation bandwidth of 470 MHz resulting in 140 times improvement in bandwidth
and 55 times increase in data rate when compared with that of commercially available phosphor
colour converters [59].
15
Chapter 2. Review of the State of the Art
2.1.2 Optical Detector/Receiver for VLC Systems
The optical detector/receiver convert the received beam of light into a photocurrent signal. To
ensure an efficient conversion, the receiver must have high bandwidth and be highly sensitive at
the wavelength of the received signal [60]. The VLC receiver does not need sophisticated and
complex circuitry as it directly detects the received optical power. In addition, the area of the
optical detector is up to a million times the square of the optical signal wavelength. Because the
fluctuation (fading) of the received optical signal occurs at the wavelength scale, this detector
size provides ‘spatial diversity’ and cancels the effect of the fading through averaging [4, 61].
As a result, VLC receivers are broadly based on silicon photodiodes (PDs) and image sensors
[62, 63]. The reported high data rates for VLC have been mainly achieved using silicon PDs.
For the silicon PD-based receiver, the two most commonly used are the PIN PD and avalanche
PD (APD) [19, 64]. The PIN PD has a lower gain but is more widely adopted due to its
low cost and relative stable performance when receiving high intensity photons. There
has been experimental demonstrations with data rates of Gb/s for PIN PDs reported in
the literature [19, 20, 49, 65]. On the other hand, the APD has a higher gain but requires
complex circuitry and is prone to excessive shot noise and thermal runway due to excessive
photocurrent produced in response to high intensity photons [62, 66, 67]. The complementary
metal-oxide-semiconductor (CMOS) based image sensors that are widely embedded in
common devices such as smartphones and laptop can be employed as VLC optical receivers,
but their frame rate limits the achievable data rate to less than kb/s [68]. However, a novel
CMOS based image sensor capable of receiving high speed optical signals has been reported
in a field trial with a data rate of 10 Mb/s [69]. Recent results have also achieved data rate
beyond the frame rate by implementing novel demodulation schemes resulting in up to
5.76 kb/s [70, 71].
Optical concentrators are usually employed to enhance the PD receiver collection area, as
direct increase of the PD area not only results in high cost but also reduces the electrical
bandwidth. However, the field of view (FOV) and gain of the conventional compound parabolic
concentrator (CPC) are limited by the conservation of ‘Entendue’ [72]. This limitation has
been addressed with the recent proposed fluorescent optical concentrators that exceed the limit
16
Chapter 2. Review of the State of the Art
of entendue and achieve gain of up to 50 times that of an entendue conserving concentrator
[72–75]. There are also various VLC receiver configurations proposed to improve performance.
The simplest and most commonly adopted is the single element PD that has been reported in
many demonstrations. Apart from this, selection/diversity combiners are reported in [76] as a
way to improve performance. However, some of the results only show marginal improvement
in spite of the significant increase in complexity. Imaging receiver is another configuration
that has been reported in [77–79]. The configuration uses multiple optical lens to decompose
received signal based on their sources and focus each on separate photodetector. This removes
interference and is very useful for MIMO scenarios [79]. Angle diversity receiver have also
been reported in [77]. This receiver configuration uses a wide FOV to improve the area covered
by the PD.
2.1.3 Modelling of VLC Channels
The power that is radiated by the VLC optical source is not coherent which makes it impossible
to employ a coherent receiver. As a result, intensity modulation (IM), where the modulating
waveform (x(t)) is impressed upon the instantaneous radiated intensity of the optical source,
is mostly adopted in VLC systems. The radiated intensity is then directly detected (DD) to
generate a proportional photocurrent with the aid of a photodetector. Thus, the VLC channel is
referred to as intensity modulation and direct detection (IM/DD) channel.
Figure 2.3 shows a baseband linear system model of the VLC channel where s(t) and y(t)
represent the channel input and output waveforms. The s(t) and y(t) correspond to the
instantaneous optical radiated power by the optical source and the instantaneous generated
photocurrent by the receiving PD, respectively. The y(t) is obtained by integrating the
received instantaneous power all over the surface of the PD. Since the PD area is million
of square of the optical wavelength, the integration over the PD surface provides spatial
diversity that eliminates multipath fading effect [61]. However, the receiver still experiences
multipath-induced distortion, especially in a NLOS medium where the radiated power
propagates over different paths with varying lengths.
The VLC baseband model in Fig. 2.3 can be expressed as
y(t) = Rh(t)⊗ s(t) + w(t) (2.1)
17
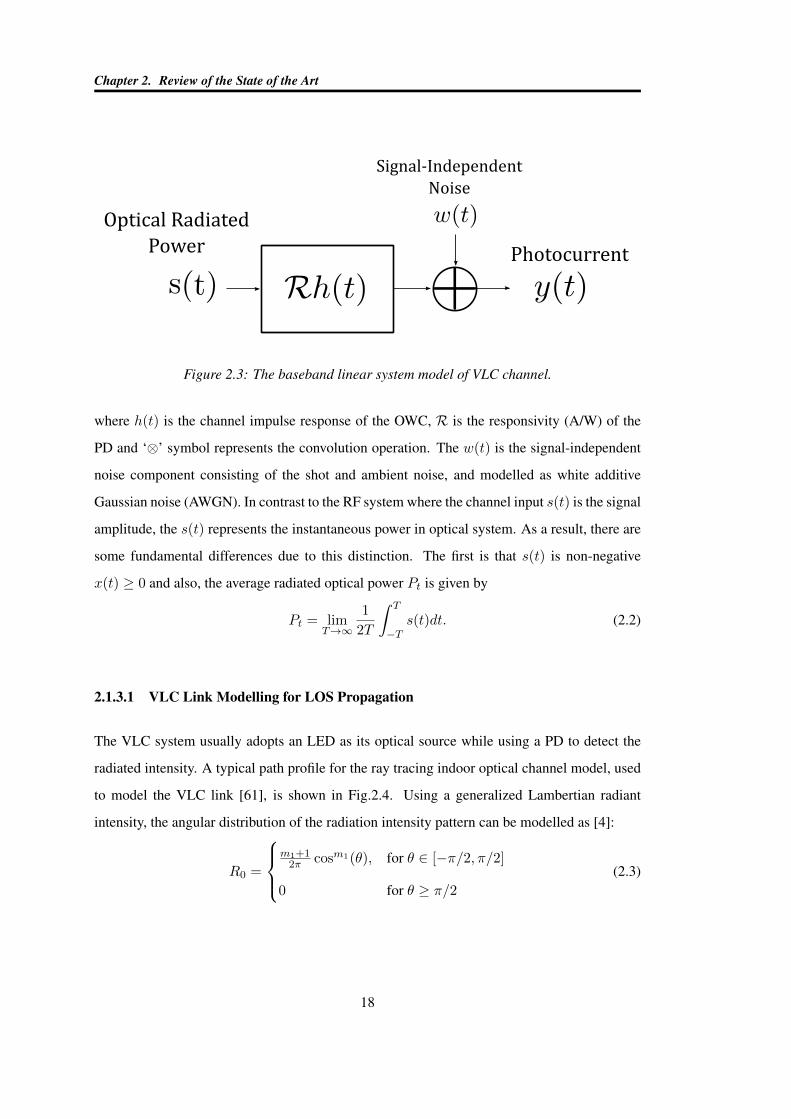
Chapter 2. Review of the State of the Art
Signal-Independent
Noise
Optical Radiated
Power Photocurrent
Figure 2.3: The baseband linear system model of VLC channel.
where h(t) is the channel impulse response of the OWC, R is the responsivity (A/W) of the
PD and ‘⊗’ symbol represents the convolution operation. The w(t) is the signal-independent
noise component consisting of the shot and ambient noise, and modelled as white additive
Gaussian noise (AWGN). In contrast to the RF system where the channel input s(t) is the signal
amplitude, the s(t) represents the instantaneous power in optical system. As a result, there are
some fundamental differences due to this distinction. The first is that s(t) is non-negative
x(t) ≥ 0 and also, the average radiated optical power Pt is given by
Pt = limT→∞
1
2T
∫ T
−Ts(t)dt. (2.2)
2.1.3.1 VLC Link Modelling for LOS Propagation
The VLC system usually adopts an LED as its optical source while using a PD to detect the
radiated intensity. A typical path profile for the ray tracing indoor optical channel model, used
to model the VLC link [61], is shown in Fig.2.4. Using a generalized Lambertian radiant
intensity, the angular distribution of the radiation intensity pattern can be modelled as [4]:
R0 =
m1+12π cosm1(θ), for θ ∈ [−π/2, π/2]
0 for θ ≥ π/2(2.3)
18
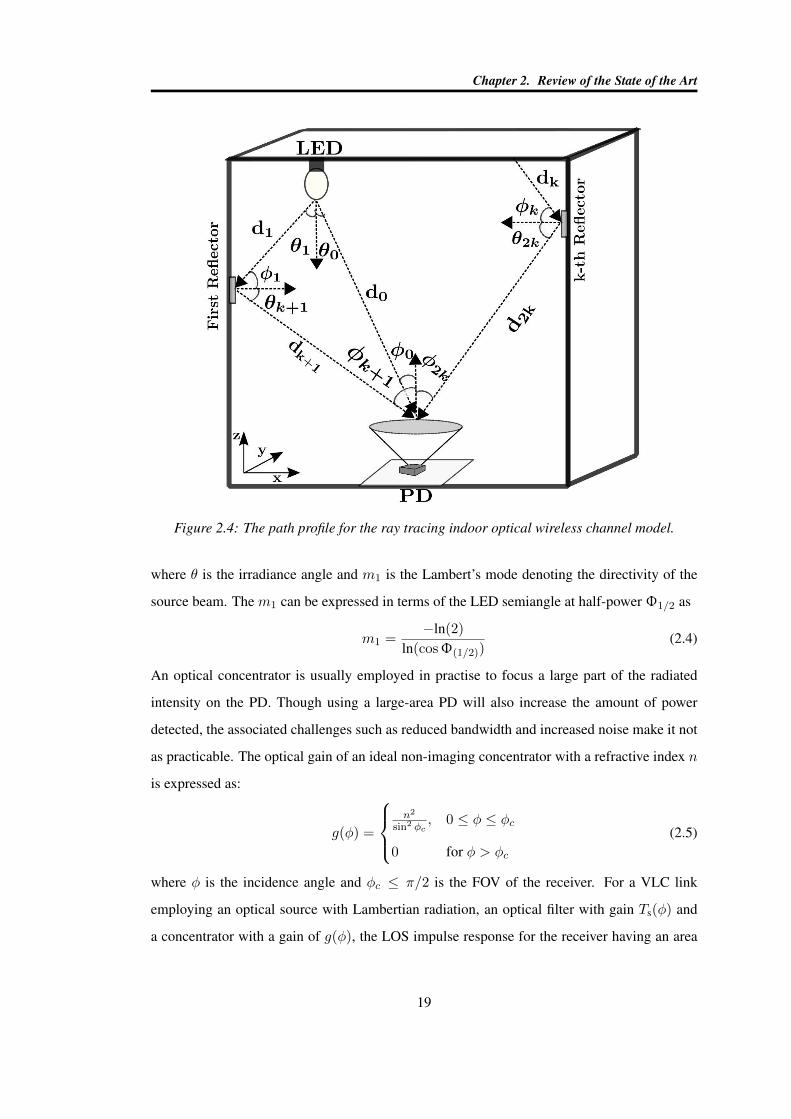
Chapter 2. Review of the State of the Art
Figure 2.4: The path profile for the ray tracing indoor optical wireless channel model.
where θ is the irradiance angle and m1 is the Lambert’s mode denoting the directivity of the
source beam. The m1 can be expressed in terms of the LED semiangle at half-power Φ1/2 as
m1 =−ln(2)
ln(cosΦ(1/2))(2.4)
An optical concentrator is usually employed in practise to focus a large part of the radiated
intensity on the PD. Though using a large-area PD will also increase the amount of power
detected, the associated challenges such as reduced bandwidth and increased noise make it not
as practicable. The optical gain of an ideal non-imaging concentrator with a refractive index n
is expressed as:
g(φ) =
n2
sin2 φc, 0 ≤ φ ≤ φc
0 for φ > φc
(2.5)
where φ is the incidence angle and φc ≤ π/2 is the FOV of the receiver. For a VLC link
employing an optical source with Lambertian radiation, an optical filter with gain Ts(φ) and
a concentrator with a gain of g(φ), the LOS impulse response for the receiver having an area
19
Chapter 2. Review of the State of the Art
A(PD) and located at distance d is given as
hLOS(t) =A(m1 + 1)
2πd2cosm1(θ)Ts(φ)g(φ)cos(φ)δ
(t− d
c
)(2.6)
where δ(·) is the dirac delta function, δ(t− d
c
)represents the propagation delay while c is the
speed of light in free space. The expression in (2.6) assumes that θ < 90, φ < FOV and that
d√A.
Alternatively, the VLC channel can be characterized in frequency domain by taking the Fourier
transform (FT) of the channel impulse response to obtain the frequency response of the channel,
H(f). The H(f) can be expressed as:
H(f) =
∫ ∞−∞
h(t)e(−j2πft)dt. (2.7)
From (2.7), the channel DC gain can be obtained as
H(0) =
∫ ∞−∞
h(t)dt. (2.8)
while the DC gain for the LOS configuration can be approximated as:
HLOS(0) =
A(m1+1)
2πd2cosm1(θ)Ts(φ)g(φ)cos(φ) 0 ≤ φ ≤ φc
0 elsewhere(2.9)
Using (2.9), the received power for an LOS channel can be expressed as:
Pr−LOS = HLOS(0)Pt (2.10)
2.1.3.2 VLC Link Modelling for Non-LOS (NLOS) Propagation
The optical channel modelling for NLOS link is more complex as it depends on many factors
such as the room dimensions, the reflectivity of the ceiling, floor and walls of the room as well
as those of the various objects in the room, the relative placement of the optical source and
detector, the window size and so on [4]. In general, the received optical power for non-LOS
(NLOS) link can be expressed as [4]:
Pr−NLOS = (HLOS(0) +HNLOS(0))Pt (2.11)
=
HLOS(0) +∑refl
Hrefl(0)
Pt (2.12)
20
Chapter 2. Review of the State of the Art
where∑
reflHrefl(0) represents the gain of the reflected path. The radiated intensity that passes
through NLOS link arrive at the receiver through multiple paths, at varying time and with
different gains. As a result, the impulse response is obtained by integrating the power of all
the components that propagate through the different paths (multipath) and are received by the
detector. The received optical power distribution for NLOS link has been investigated in [80]
using a single reflection only. However, the power associated with higher order reflections can
not be ignored as they arrive at the receiver much later than the first order reflection. In order
to incorporate the effect of higher order reflections in the channel modelling of NLOS link,
Barry et al. [61] developed a framework for evaluating the path loss and time delay of every
components arriving at the receiver for a given number of reflections. These are then added
together to get the impulse response. The Barry et al. recursive algorithm for evaluating the
impulse response h(k)(t;S,R), for a given source S, receiverR and small jth elemental surface
of area ∆A, after k reflections is given by [4, 61]
hnlos(t;S,R) =m1 + 1
2π
K∑j=1
ρj cosm1(θj)cos(φ)
d2Sjrect
(2φ
π
)(2.13)
× h(k−1)nlos
(t−
dSjc
;S,R
)∆A
where ρj is the reflectivity of the jth reflecting surface given for indoor VLC in [81]. The dSj
represents the distance from S to the jth reflecting surface while
rect(x) =
1, for ‖x‖ ≤ 1
0 for ‖x‖ > 1.
(2.14)
The time-dispersive property of multipath propagation is quantified using the RMS channel
delay spread, τrms defined as [4, p. 85]:
τrms =
[∫(t− µ)2h2(t)dt∫
h2(t)dt
]1/2(2.15)
where µ is the mean delay spread given by :
µ =
∫th2(t)dt∫h2(t)dt
(2.16)
21
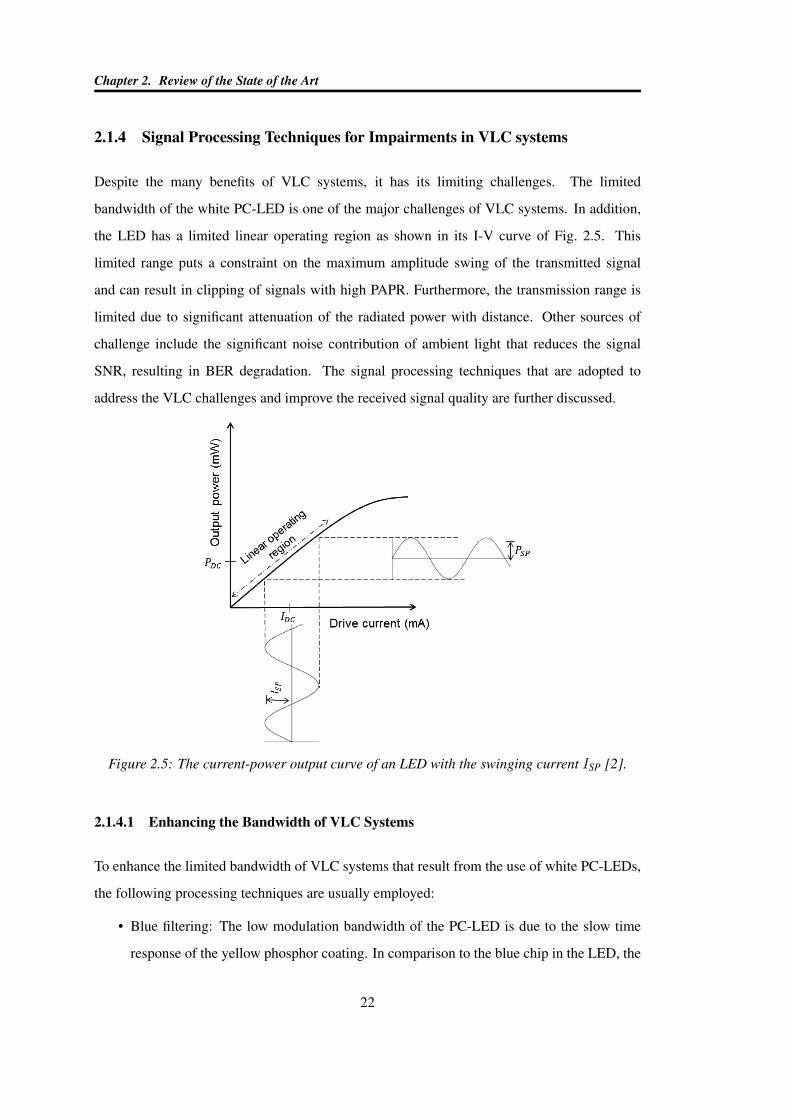
Chapter 2. Review of the State of the Art
2.1.4 Signal Processing Techniques for Impairments in VLC systems
Despite the many benefits of VLC systems, it has its limiting challenges. The limited
bandwidth of the white PC-LED is one of the major challenges of VLC systems. In addition,
the LED has a limited linear operating region as shown in its I-V curve of Fig. 2.5. This
limited range puts a constraint on the maximum amplitude swing of the transmitted signal
and can result in clipping of signals with high PAPR. Furthermore, the transmission range is
limited due to significant attenuation of the radiated power with distance. Other sources of
challenge include the significant noise contribution of ambient light that reduces the signal
SNR, resulting in BER degradation. The signal processing techniques that are adopted to
address the VLC challenges and improve the received signal quality are further discussed.
Figure 2.5: The current-power output curve of an LED with the swinging current ISP [2].
2.1.4.1 Enhancing the Bandwidth of VLC Systems
To enhance the limited bandwidth of VLC systems that result from the use of white PC-LEDs,
the following processing techniques are usually employed:
• Blue filtering: The low modulation bandwidth of the PC-LED is due to the slow time
response of the yellow phosphor coating. In comparison to the blue chip in the LED, the
22
Chapter 2. Review of the State of the Art
yellow phosphor is very slow at high frequency and becomes a bottleneck to achieving
high speed data communication. This bottleneck can be removed by the use of blue filter
at the receiver. The blue filter is used to extract the blue component of the received signal
while the yellow component is blocked [10, 11]. Though, this filtering out results in
power penalty due to the lost energy of the yellow component, the approach substantially
improve the available bandwidth from less than 5 MHz to ∼ 20 MHz.
• Pre-Equalization: Analog RLC circuit have been employed at the transmitter to provide
frequency response equalization [82]. The multiple-resonant equalization, implemented
at the transmitter, are reported in [10, 82] to result in up to 25 MHz bandwidth
improvement. The pre-equalization approach requires an initial measurement of the
LED frequency response followed by designing adequate resonant frequencies for the
equalization. A pre-equalization approach reported in [10] uses a driving technique
that utilizes a group of LEDs to form a single link. It achieves an improved aggregate
bandwidth by independently tuning the frequency response of each LED using a
resonant driving technique. Employing 16 LEDs, the technique successfully improve
bandwidth from 2.5 MHz to 25 MHz. In addition to the analog pre-equalization, optimal
power and bit loading have also been implemented for optical systems employing
multicarrier modulation schemes at the transmitter. To achieve a specified BER, the
subcarriers of a multicarrier technique like OFDM are adaptively allocated power and
loaded with bits under the constraints of the channel state information (CSI) [83, 84].
In this way, the optimum QAM symbol level and power are allocated to subcarriers in
order to achieve a specified aggregate BER performance [84].
• Post-Equalization: Analog post-equalization has also been considered for indoor VLC
systems in [85]. The proposed system uses a first-order equalizer followed by an
amplifier and improved the bandwidth of the VLC system from 3 MHz to 50 MHz [85].
However, this technique is prone to noise enhancement at the amplification stage. In
contrast, adaptive equalizers are not prone to noise amplification and generally have
better performance, especially for high-speed VLC systems. Adaptive equalizers employ
stochastic gradient descent algorithms such as recursive least squares (RLS) and least
mean squares (LMS) to automatically adapts to the time-varying properties of the VLC
channel. Decision feedback and feedforward equalizers (DFE and FFE) are examples of
23
Chapter 2. Review of the State of the Art
adaptive equalizers that have been implemented to achieve high data rate in VLC systems
[20, 86]. As adaptive equalizers use training symbols for their weights adaptation, this
lead to spectral efficiency loss especially for mobile terminals requiring frequent training.
It also leads to high computational complexity for channels with large delay spread that
require long training sequences for adequate performance. Hence, there is a trade-off
between the performance gain of the adaptive equalizers and the associated spectral loss
and/or computational complexity.
2.1.4.2 Compensating LED-Nonlinearity
The I-V characteristics of the LED, shown in Fig.2.5, places a constraint on the amplitude
swing of the signal that can be used to modulate the LED radiated power. An LED with low
dynamic range will have a non-linear output when the modulating signal have a large negative
swing that goes below its turn on voltage (TOV) or a large positive swing that extends to
its saturation region [2]. This is a problem with multicarrier techniques such as OFDM and
m-CAP as the symbols modulated on their subcarriers have high probability of adding up to
a large peak [87]. This increases intercarrier interference and results in BER degradation. As
a result, it is imperative to employ an LED with a large dynamic range and operate the device
within its linear region and around an optimum bias point. The most common method to
deal with LED non-linearity is through signal clipping [88–90]. Other techniques have been
proposed in the literature with the aim of achieving good balance between BER improvement
and computational complexity [29].
2.1.4.3 Mitigating Interference from Optical Background Noise in VLC
There are multiple sources of optical noise that degrades the performance of VLC receiver.
Shot noise arises from the random/fluctuating arrival of photons at the receiver and the
flow of dark current in the PD even when no input photons is received [4]. In receiver
employing APD, there is an additional gain-dependent excess noise that emanates from the
cascaded flow of electrons as a result of the APD internal random multiplicative process [64].
Furthermore, background/ambient noise exists in VLC receiver due to the excited electrons
by the photons received from surrounding optical sources such as fluorescent light and sun
radiation. Additionally, the resistive element of the receiver circuit generates heat which
24
Chapter 2. Review of the State of the Art
causes thermal fluctuation of electrons that results in thermal noise [4]. The use of Manchester
coding to mitigate optical background noise has been investigated in [91] using theoretical
analysis and experimental demonstrations. The experimental results shows that Manchester
coding can significantly reduce the optical noise with frequency below 500 kHz and those
from fluorescent light. The use of adaptive filtering to improve the signal-to-interference ratio
(SIR) that are contributed by light sources of different wavelengths have also been investigated
in [92], resulting in an improved performance.
2.2 Description of Step-Index Plastic Optical Fibre (SI-POF)
The first demonstration of a low-loss optical fibre in 1970, by engineers at the Corning
Glass Company, heralded the era of optical fibre communication [93, 94]. The engineers
demonstrated an optical fibre with attenuation of 20 dB/km in comparison to the approximately
1000 dB/km attenuation existing at the time. Despite the development of the low-loss fibre, the
first set of fibres had bandwidth limitation resulting from multi-mode dispersion. This was later
overcome by the development of single-mode fibres [14]. Further advancement in optical fibre
necessitates improvement in electronics which has become the system limiting factor at high
frequency transmission. As a result, technologies such as WDM, optical amplifiers, coherent
detection, polarization multiplexing and spatial division multiplexing were all developed to
achieve high frequency data transmission through optical fibre [14].
The use of optical fibre for data communication has revolutionized the communication
landscape as they are deployed in virtually all the core and metro networks and serve as the
backbone for high-speed switching in large networks [16]. They are also increasingly being
used closer to the end user due to the proliferation of fibre-to-the-home (FTTH) technologies.
The optical fibre technology has replace the traditional copper transmissions due to many of
its advantages. It is immune to electromagnetic interference (EMI), has lower attenuation,
possesses higher bandwidth and data rates [14]. In home networks, the plastic optical fibre
(POF) represents an attractive medium of communication due to its ease of installation and
lower cost [15].
The first available POF had very high attenuation of up to 1000 dB/km and was later reduced
to 125 dB/km. Despite the advancement, the use of POF for data communication only started
25
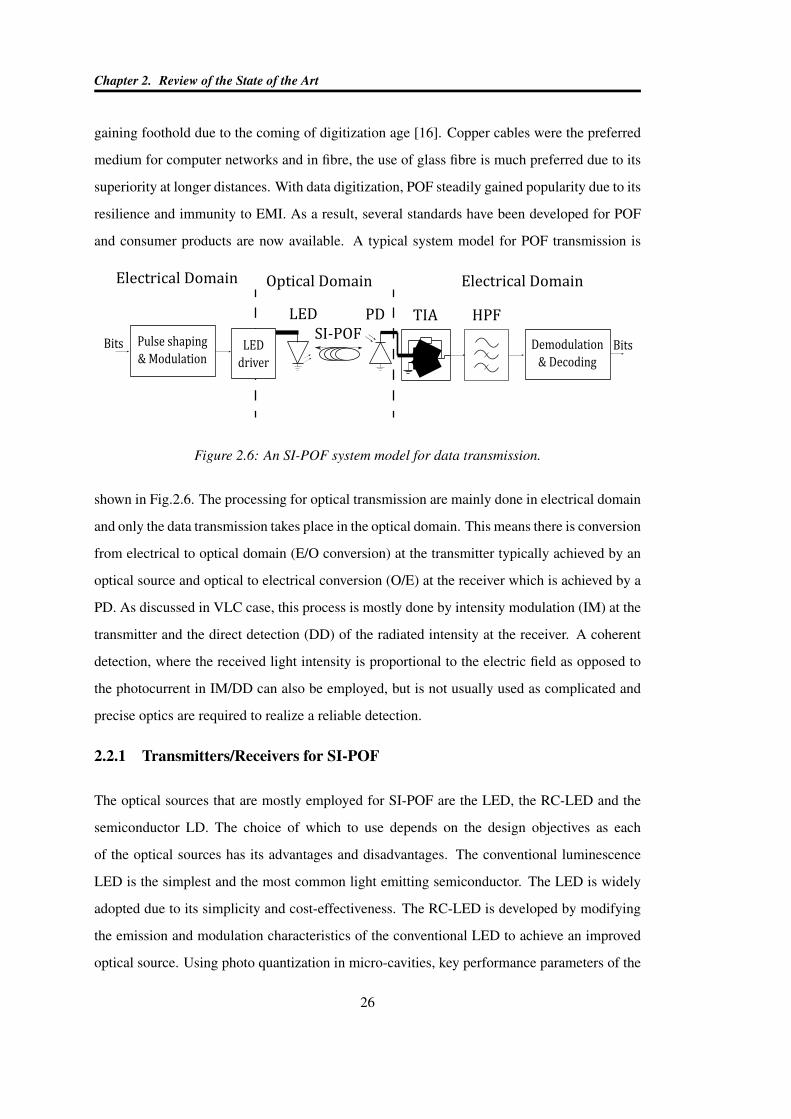
Chapter 2. Review of the State of the Art
gaining foothold due to the coming of digitization age [16]. Copper cables were the preferred
medium for computer networks and in fibre, the use of glass fibre is much preferred due to its
superiority at longer distances. With data digitization, POF steadily gained popularity due to its
resilience and immunity to EMI. As a result, several standards have been developed for POF
and consumer products are now available. A typical system model for POF transmission is
LED
LED
driver
PD TIA HPF
SI-POFDemodulation
& Decoding
Pulse shaping
& ModulationBits Bits
Optical DomainElectrical Domain Electrical Domain
Figure 2.6: An SI-POF system model for data transmission.
shown in Fig.2.6. The processing for optical transmission are mainly done in electrical domain
and only the data transmission takes place in the optical domain. This means there is conversion
from electrical to optical domain (E/O conversion) at the transmitter typically achieved by an
optical source and optical to electrical conversion (O/E) at the receiver which is achieved by a
PD. As discussed in VLC case, this process is mostly done by intensity modulation (IM) at the
transmitter and the direct detection (DD) of the radiated intensity at the receiver. A coherent
detection, where the received light intensity is proportional to the electric field as opposed to
the photocurrent in IM/DD can also be employed, but is not usually used as complicated and
precise optics are required to realize a reliable detection.
2.2.1 Transmitters/Receivers for SI-POF
The optical sources that are mostly employed for SI-POF are the LED, the RC-LED and the
semiconductor LD. The choice of which to use depends on the design objectives as each
of the optical sources has its advantages and disadvantages. The conventional luminescence
LED is the simplest and the most common light emitting semiconductor. The LED is widely
adopted due to its simplicity and cost-effectiveness. The RC-LED is developed by modifying
the emission and modulation characteristics of the conventional LED to achieve an improved
optical source. Using photo quantization in micro-cavities, key performance parameters of the
26
Chapter 2. Review of the State of the Art
conventional LED such as spontaneous emission properties, directionality, intensity and purity
are enhanced in RC-LED [46]. Specifically, the enhancement by the RC effect may shorten
the spontaneous emission lifetime and results in a higher modulation bandwidth for RC-LED
compared to the regular LEDs [14, 95]. RED RC-LED are very important as SI-POF exhibit
minimal absorption for optical sources operating at the 650 nm wavelength [16].
In contrast to the LED which operates on the principle of spontaneous emission, the
semiconductor LD uses stimulated emission. Though the LD results in higher modulation
bandwidth which translates to high data rate transmission, it requires more complex circuitry
than the LEDs. The use of a green LD operating at 520 nm has been shown to offer lower
attenuation than the traditional 650 nm red LD in [96].
As with the optical sources, there are mainly three types of optical receivers for the SI-POF
system. The PIN PD is the most commonly employed receiver for POF systems [97]. The
APD contains an extra highly doped layer, in comparison to PIN PD, which gives it ability to
generate high number of electrons in response to the impinging photons [98]. The electrons
produced in the APD doped layer are multiplied and rapidly accelerated by a local electrical
field. This gives the APD higher sensitivity and faster response when compared with the PIN
PD [14,16]. Metal-semiconductor-metal (MSM) PD is a type of PD which has no p-n junction
like the APD and PIN PD [99, 100]. It offers a large photo-detecting area with low device
capacitance per area [101]. Its large area makes it useful for characterization of large-core POF
and its low capacitance per area ensures high bandwidth. High data rate of≥ 10 Gb/s has been
reported in [100] for large area MSM-based photo receivers.
2.2.2 Modelling of SI-POF channel
The SI-POF transmission channel can be approximated by combining the optical transmitter,
SI-POF and optical receiver models using the approach in [102]. In developing the models, the
transmission channel is assumed to be linear and any non-linearities are neglected. The optical
transmitter is modelled as a first-order low-pass filter (LPF) with a frequency response given
as [102]:
HPOFtx(f) =
(1 + j
f
fPOFtx
)−1(2.17)
27
Chapter 2. Review of the State of the Art
where fPOFtx is the −3 dB bandwdith of the SI-POF transmitter.
The SI-POF effect can be modelled as a first-order Butterworth LPF with a frequency response
[102]:
HPOF(f) =
(1 + j
f
fPOF
)−1(2.18)
where the fPOF is the −3 dB bandwidth of the POF and is given as the bandwidth-length
product divided by the length of the POF link.
The receiver is a photodetector followed by a TIA and can be designed as a two-stage amplifier.
The amplifier can be modelled as a second-order LPF with frequency response [102]:
HPOFrx(f) =
(1 + j
f
fPOFrx
√√2− 1
)(2.19)
where the −3 dB of the receiver is given as [14]:
fPOFrx =fs√
8(2.20)
with fs being the sampling rate of the system. Therefore the effective SI-POF transmission
channel can be realised by combining the models of the transmitter, POF and the receiver as:
HPOFeff(f) = HPOFtx(f).HPOF(f).HPOFrx(f) (2.21)
2.2.3 Impairments and Signal Processing Techniques in SI-POF
The major impairments in SI-POF transmission can be categorized as attenuation, dispersion,
system noise and non-linearity. The non-linearity is encountered mainly at the transmitter when
the dynamic range of the optical source is exceeded by the modulating signal [17,18]. It is less
often experienced both during transmission through the fibre and at the receiver.
The signal transmitted through the POF experiences loss of optical power which reduces the
received signal SNR as the receiver noise power remains constant. The power attenuation is an
exponential function of the fiber length, L and can be expressed as:
PPOFrx = 10−γLPPOFtx (2.22)
where PPOFrx and PPOFtx are the received and transmitted power, respectively. The γ is the
attenuation coefficient of the POF. Other than the POF attenuation, the signal power can also
be attenuated due to the use of splitters and connectors [103].
28
Chapter 2. Review of the State of the Art
The different paths or modes that are available in SI-POF create differing path lengths for
a propagating signal. As a result, the propagating signal suffers from modal dispersion which
leads to broadening of the received signal. The dispersion effect is more pronounced in SI-POF
as modal path lengths are directly related to the propagation angle. The maximum delay that is
introduced in SI-POF can be calculated as [14]:
δtPOF =Ln21cn22
(n1 − n2n1
)(2.23)
where n1 and n2 are the refractive indices of the core and the cladding.
The shot and thermal noise are the two main sources of noise which degrades system
performance at the SI-POF receiver. The shot noise arises from the random generation of
photoelectrons when the photons impinge on the receiver while thermal noise is due to the
temperature of the receiver.
Different equalization techniques have been proposed in [17, 18, 104] to compensate for the
transmitter non-linearity, link attenuation, distortion and modal dispersion in SI-POF system.
Multilayer perceptron (MLP) based equalizer has been shown in [17] to provide the best
performance for nonlinearity and dispersion compensation in SI-POF systems when compared
with Volterra and transversal equalizer. It has been experimentally demonstrated in [18] that
data rate of more than 10 Gb/s can be achieved using a 10 m SI-POF and an MLP equalizer.
2.3 Modulation Techniques for Optical Communication
The modulation technique employed to impress information on the radiated light intensity, for
the purpose of data transmission, depends on several factors such as the intrinsic characteristics
of optical sources, the nature of the data-carrying optical signal and the envisioned application.
With regards to the characteristics of the optical sources, the non-linear intensity/voltage
response must be considered to ensure that the time-domain signal generated by the applied
modulation technique lies within the limited dynamic range of the sources. Since the IM/DD
approach is adopted in optical communication considered in this thesis, the modulating signal
needs to be both real-valued and unipolar non-negative. Due to these factors/constraints, the
well-researched traditional modulation schemes from the field of RF communications must be
adapted to make them suitable for optical communication.
29
Chapter 2. Review of the State of the Art
Single carrier modulation techniques such as OOK, pulse position modulation (PPM), pulse
width modulation (PWM), and pulse amplitude modulation (PAM) are typically used for
low-to-moderate data rate applications. An OOK scheme for VLC using organic LED with
a 93 kHz bandwidth to achieve a data rate of 2.2 Mb/s is demonstrated in [40]. Using an OOK
non-return-to-zero (NRZ) modulation with post-equalization and blue filtering, data rates of
100 Mb/s and 340 Mb/s were achieved in [8] and [105], respectively. Pulse position modulation
(PPM) based scheme has been shown to require less average power than OOK but is more
complex and has higher bandwdith requirement [4, 106].
Multilevel modulations such as PAM can offer high spectral efficiency for VLC applications.
The use of multiple intensity levels means that the PAM scheme could be affected by the LED’s
non-linear characteristics and colour temperature (chromaticity) shift because of variation in
drive current [107]. With PAM-4 modulation and use of pre-equalization, a 2 Gb/s data rate
has been experimentally demonstrated in [108] over a 0.6 m VLC link employing µ-LED and
APD. In [109], bit rates of 5 and 5.4 Gb/s over 20 m SI-POF have been achieved using PAM-4
and PAM-8, respectively. Furthermore, with the use of LED and APD in [110], a 5 Gb/s data
rate has been achieved over 25 m SI-POF link.
Typically, the performance of single carrier modulation techniques deteriorates as the data
rates increase due to the increase in ISI. Hence, complex equalization techniques are applied
to achieve good error performance at high data rates. On the contrary, multicarrier modulation
techniques such as OFDM or DMT utilizes multiple orthogonal sub-carriers to send parallel
data streams concurrently, thereby reducing ISI and avoiding the use of complex equalizers
[111]. A 10 Gb/s data rate has been experimentally demonstrated for OFDM based VLC
system in [43] using a micro-LED. Similarly, [112] achieved 10 Gb/s bit rate over a 2.5 mm
DMT-based SI-POF system.
2.4 Description of CAP Modulation Scheme
This section explores the details of the CAP modulation scheme, including its generation, the
design of its digital filters, comparison to other modulation techniques, reported performance
in experimental demonstrations and its implementation challenges.
30
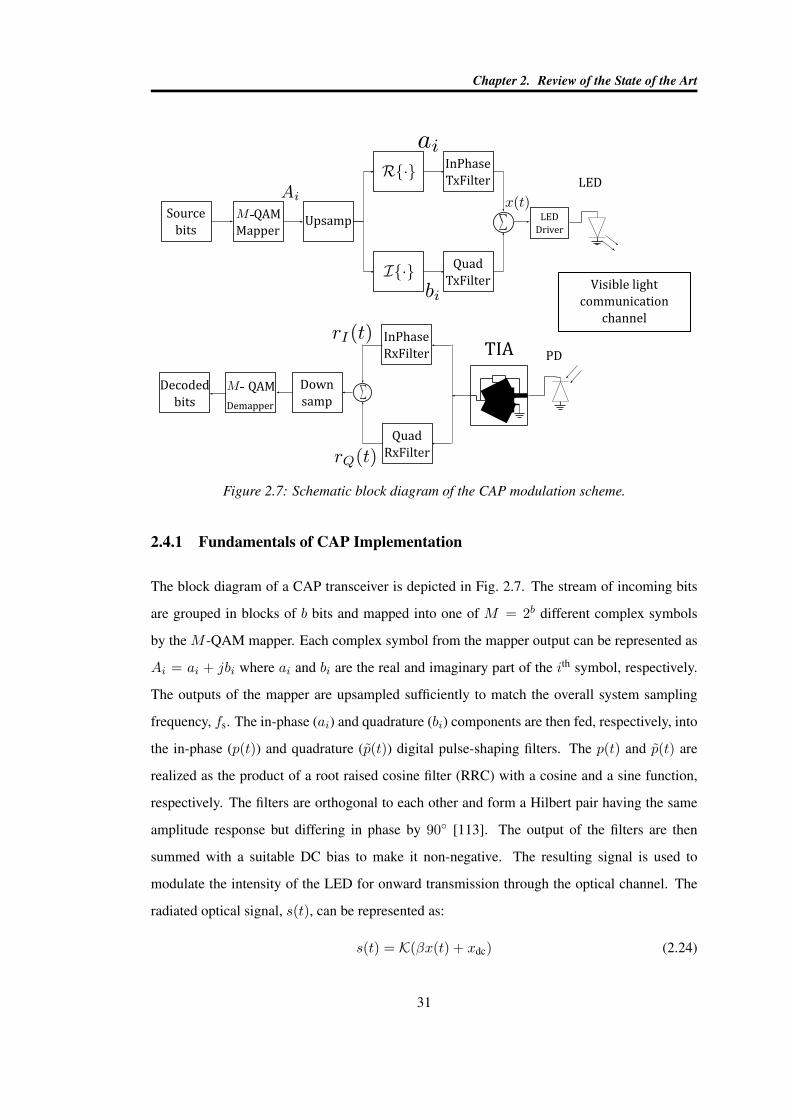
Chapter 2. Review of the State of the Art
Source
bits
QAM
MapperUpsamp
InPhase
TxFilter
Quad
TxFilter
LED
LED
Driver
InPhase
RxFilter
Quad
RxFilter
Down
samp
Decoded
bits
PDTIA
QAM
Demapper
Visible light
communication
channel
Figure 2.7: Schematic block diagram of the CAP modulation scheme.
2.4.1 Fundamentals of CAP Implementation
The block diagram of a CAP transceiver is depicted in Fig. 2.7. The stream of incoming bits
are grouped in blocks of b bits and mapped into one of M = 2b different complex symbols
by the M -QAM mapper. Each complex symbol from the mapper output can be represented as
Ai = ai + jbi where ai and bi are the real and imaginary part of the ith symbol, respectively.
The outputs of the mapper are upsampled sufficiently to match the overall system sampling
frequency, fs. The in-phase (ai) and quadrature (bi) components are then fed, respectively, into
the in-phase (p(t)) and quadrature (p(t)) digital pulse-shaping filters. The p(t) and p(t) are
realized as the product of a root raised cosine filter (RRC) with a cosine and a sine function,
respectively. The filters are orthogonal to each other and form a Hilbert pair having the same
amplitude response but differing in phase by 90 [113]. The output of the filters are then
summed with a suitable DC bias to make it non-negative. The resulting signal is used to
modulate the intensity of the LED for onward transmission through the optical channel. The
radiated optical signal, s(t), can be represented as:
s(t) = K(βx(t) + xdc) (2.24)
31
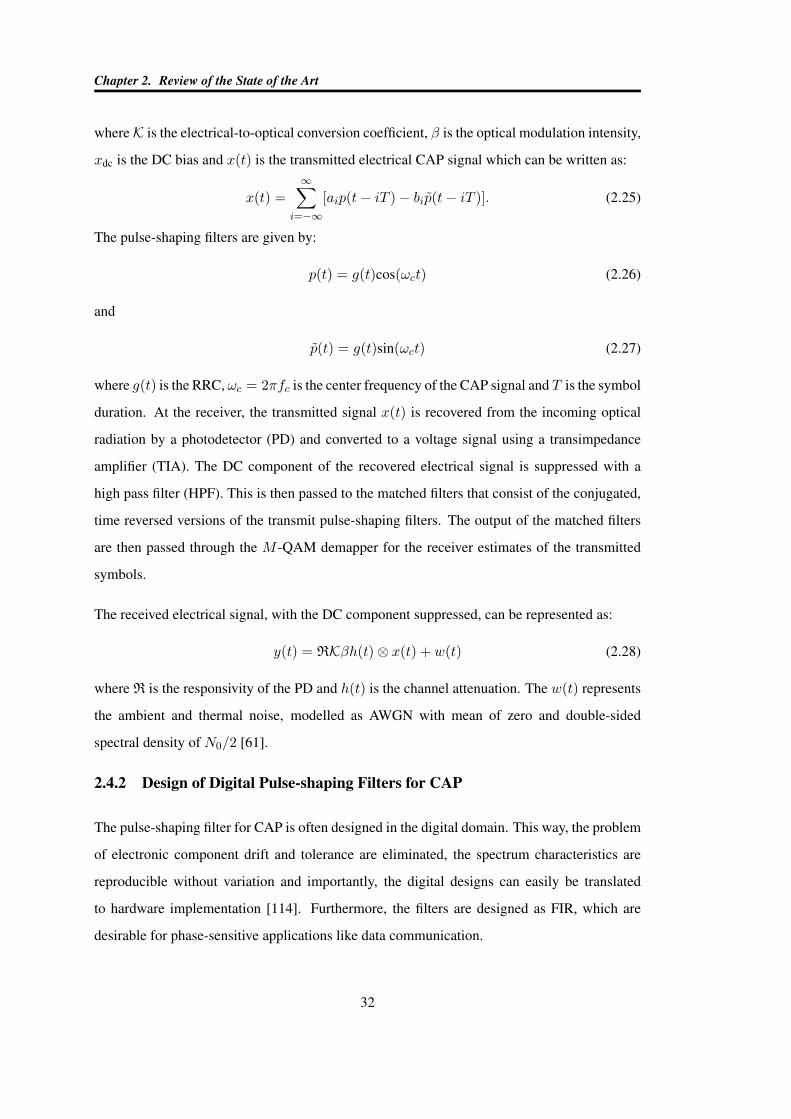
Chapter 2. Review of the State of the Art
whereK is the electrical-to-optical conversion coefficient, β is the optical modulation intensity,
xdc is the DC bias and x(t) is the transmitted electrical CAP signal which can be written as:
x(t) =∞∑
i=−∞[aip(t− iT )− bip(t− iT )]. (2.25)
The pulse-shaping filters are given by:
p(t) = g(t)cos(ωct) (2.26)
and
p(t) = g(t)sin(ωct) (2.27)
where g(t) is the RRC, ωc = 2πfc is the center frequency of the CAP signal and T is the symbol
duration. At the receiver, the transmitted signal x(t) is recovered from the incoming optical
radiation by a photodetector (PD) and converted to a voltage signal using a transimpedance
amplifier (TIA). The DC component of the recovered electrical signal is suppressed with a
high pass filter (HPF). This is then passed to the matched filters that consist of the conjugated,
time reversed versions of the transmit pulse-shaping filters. The output of the matched filters
are then passed through the M -QAM demapper for the receiver estimates of the transmitted
symbols.
The received electrical signal, with the DC component suppressed, can be represented as:
y(t) = RKβh(t)⊗ x(t) + w(t) (2.28)
where R is the responsivity of the PD and h(t) is the channel attenuation. The w(t) represents
the ambient and thermal noise, modelled as AWGN with mean of zero and double-sided
spectral density of N0/2 [61].
2.4.2 Design of Digital Pulse-shaping Filters for CAP
The pulse-shaping filter for CAP is often designed in the digital domain. This way, the problem
of electronic component drift and tolerance are eliminated, the spectrum characteristics are
reproducible without variation and importantly, the digital designs can easily be translated
to hardware implementation [114]. Furthermore, the filters are designed as FIR, which are
desirable for phase-sensitive applications like data communication.
32
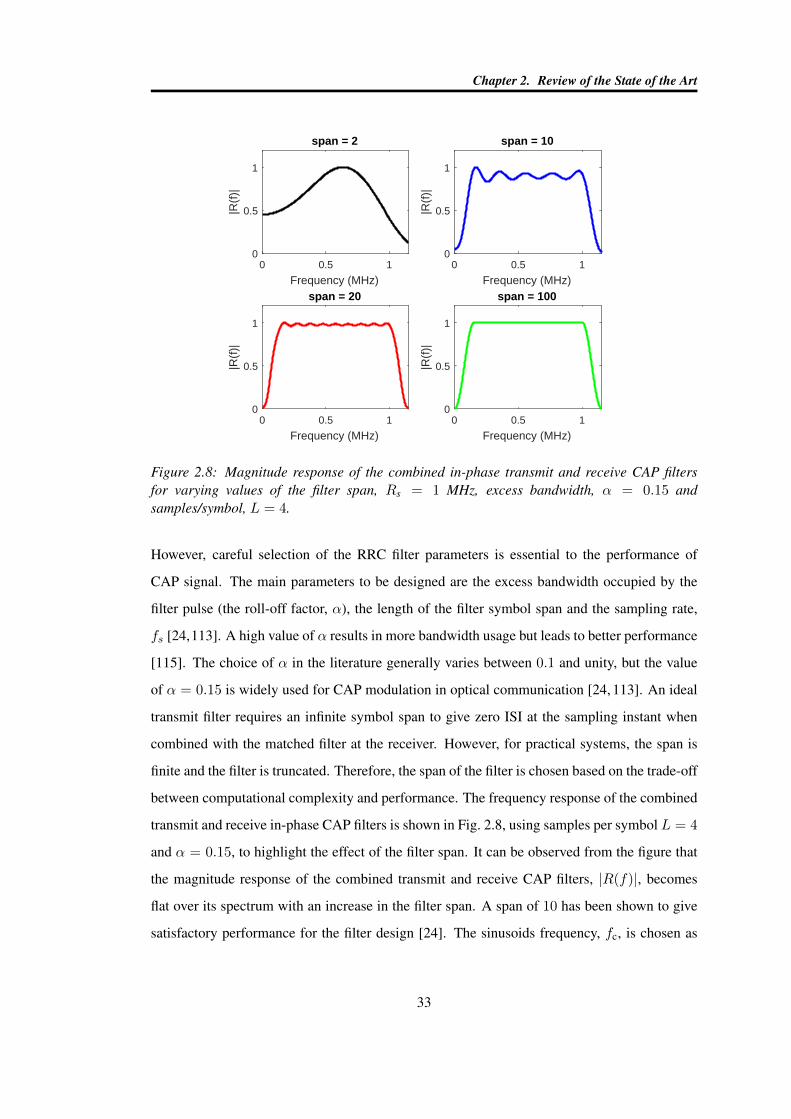
Chapter 2. Review of the State of the Art
0 0.5 1
Frequency (MHz)
0
0.5
1
|R(f
)|
span = 2
0 0.5 1
Frequency (MHz)
0
0.5
1
|R(f
)|
span = 10
0 0.5 1
Frequency (MHz)
0
0.5
1
|R(f
)|
span = 20
0 0.5 1
Frequency (MHz)
0
0.5
1
|R(f
)|
span = 100
Figure 2.8: Magnitude response of the combined in-phase transmit and receive CAP filtersfor varying values of the filter span, Rs = 1 MHz, excess bandwidth, α = 0.15 andsamples/symbol, L = 4.
However, careful selection of the RRC filter parameters is essential to the performance of
CAP signal. The main parameters to be designed are the excess bandwidth occupied by the
filter pulse (the roll-off factor, α), the length of the filter symbol span and the sampling rate,
fs [24,113]. A high value of α results in more bandwidth usage but leads to better performance
[115]. The choice of α in the literature generally varies between 0.1 and unity, but the value
of α = 0.15 is widely used for CAP modulation in optical communication [24, 113]. An ideal
transmit filter requires an infinite symbol span to give zero ISI at the sampling instant when
combined with the matched filter at the receiver. However, for practical systems, the span is
finite and the filter is truncated. Therefore, the span of the filter is chosen based on the trade-off
between computational complexity and performance. The frequency response of the combined
transmit and receive in-phase CAP filters is shown in Fig. 2.8, using samples per symbol L = 4
and α = 0.15, to highlight the effect of the filter span. It can be observed from the figure that
the magnitude response of the combined transmit and receive CAP filters, |R(f)|, becomes
flat over its spectrum with an increase in the filter span. A span of 10 has been shown to give
satisfactory performance for the filter design [24]. The sinusoids frequency, fc, is chosen as
33
Chapter 2. Review of the State of the Art
-5 0 5Filter span
-1
-0.8
-0.6
-0.4
-0.2
0
0.2
0.4
0.6
0.8
1
Am
plitu
de
In-phase TxFilter
Cosfc
RRC
I-TxFilter
-5 0 5Filter span
-1
-0.8
-0.6
-0.4
-0.2
0
0.2
0.4
0.6
0.8
1
Am
plitu
de
Quadrature TxFilter
Sinfc
RRC
Q-TxFilter
Figure 2.9: The impulse response of the I and Q transmit filters for CAP with a span of 10,α = 0.15, L = 20, fs = 20 MSa/s.
the center frequency of the transmitted spectrum and is given as:
fc =1 + α
2T. (2.29)
From (2.29), the upper and lower boundary of the transmitted spectrum can be written as:
fu = fc +(1 + α)Rs
2(2.30)
and
fl = fc −(1 + α)Rs
2(2.31)
respectively where Rs is the symbol rate. In line with the Nyquist sampling requirement, the
sampling rate, fs, has to be chosen as:
fs ≥ 2fu. (2.32)
It can be deduced from (2.32) that the sampling rate is a function of α. As α increases from
0 to 1, fs goes from a minimum of 2Rs to 4Rs. The in-phase and quadrature transmit filters
together with their corresponding sinusoids and RRC are presented in Fig. 2.9 for illustration
purposes.
34
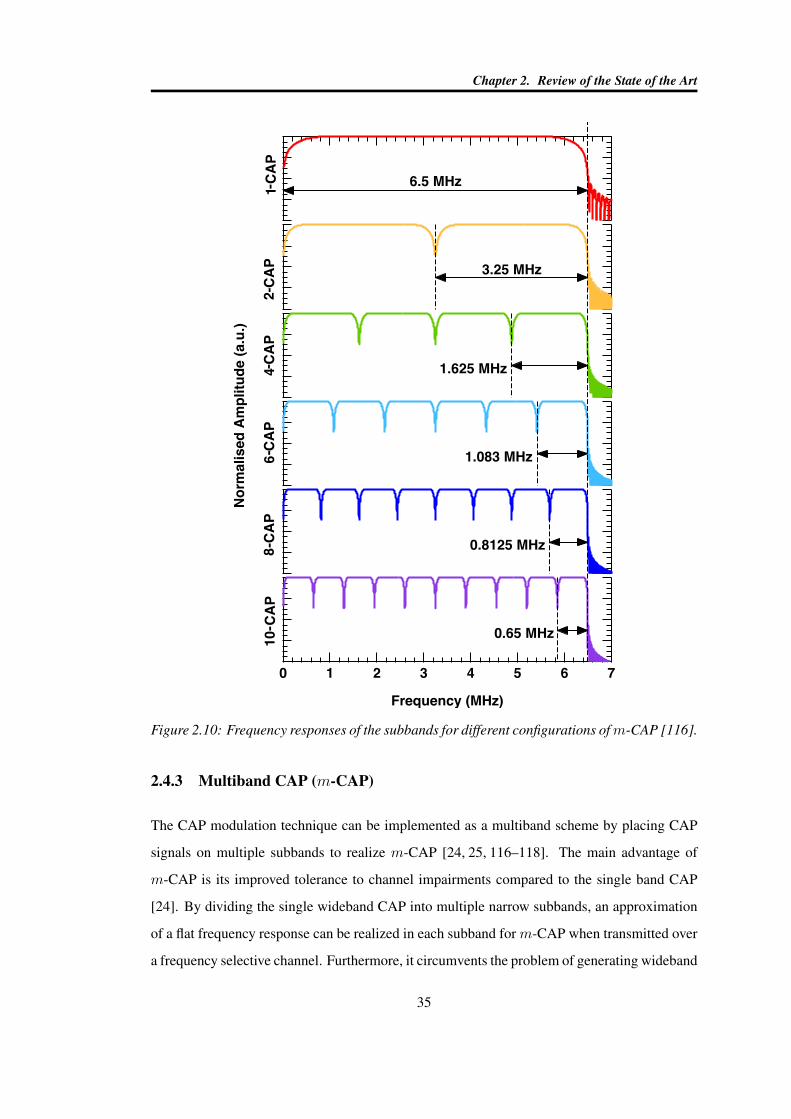
Chapter 2. Review of the State of the Art
Figure 2.10: Frequency responses of the subbands for different configurations ofm-CAP [116].
2.4.3 Multiband CAP (m-CAP)
The CAP modulation technique can be implemented as a multiband scheme by placing CAP
signals on multiple subbands to realize m-CAP [24, 25, 116–118]. The main advantage of
m-CAP is its improved tolerance to channel impairments compared to the single band CAP
[24]. By dividing the single wideband CAP into multiple narrow subbands, an approximation
of a flat frequency response can be realized in each subband for m-CAP when transmitted over
a frequency selective channel. Furthermore, it circumvents the problem of generating wideband
35
Chapter 2. Review of the State of the Art
filters and leads to improved bit error rate (BER) performance [24]. The center frequency of
the nth subband can be expressed as:
fc,n = (2n− 1)fc n = 1, 2, · · · , N (2.33)
where the fc,n are chosen to prevent overlap between the subbands and are harmonics of
the fundamental subband fc. This observation is very important as it explains the increasing
PAPR of m-CAP that is discussed in Section 2.5.3. The frequency responses of the subbands
for different configurations of m-CAP are shown in Fig. 2.10 [116]. Other benefits of m-CAP
include the possibility of achieving the Nyquist sampling rate as shown in [24].
2.4.4 Comparison of CAP with other Modulation Schemes
The simplicity of the physical implementation of CAP is derived from its use of digital
FIR filters to realize orthogonal channels, which eliminate the need for explicit modulation
and demodulation blocks. This is unlike its passband QAM counterpart that requires a
local oscillator (LO) to generate the sine and cosine functions needed for its modulation
and demodulation blocks. In addition, the LO signal at the QAM coherent receiver must
be aligned with that of the transmitter, both in phase and frequency, using a phase-locked
loop (PLL) to ensure a successful carrier recovery. Failure to do this results in lack of
synchronization in the QAM transceiver and leads to BER performance degradation. However,
as shown in Fig. 2.7, the modulation/demodulation blocks have been integrated into the
pulse-shaping/match filtering blocks in the CAP transceiver. This removes the necessity of
having to modulate the CAP baseband signal onto quadrature carriers, hence eliminating the
need for carrier recovery, LO and PLL at the receiver. In addition, since the symbol rate
and carrier frequency are usually of the same order, the CAP filters can be realised with a
reasonably small number of taps [119]. Hence, the main advantage of CAP over QAM is its
simpler implementation [23, 60].
The PAPR of CAP has been compared to that of PAM and DMT in the literature [13, 30, 115,
120]. It is shown that the PAPR of CAP is lower when compared with that of DMT but higher in
comparison to PAM. This results in advantage when LED non-linearity and the effect of signal
clipping are taken into consideration, especially at high modulation orders. Furthermore, the
BER performance of CAP has also been compared to that of DMT and PAM [121–124]. Apart
36
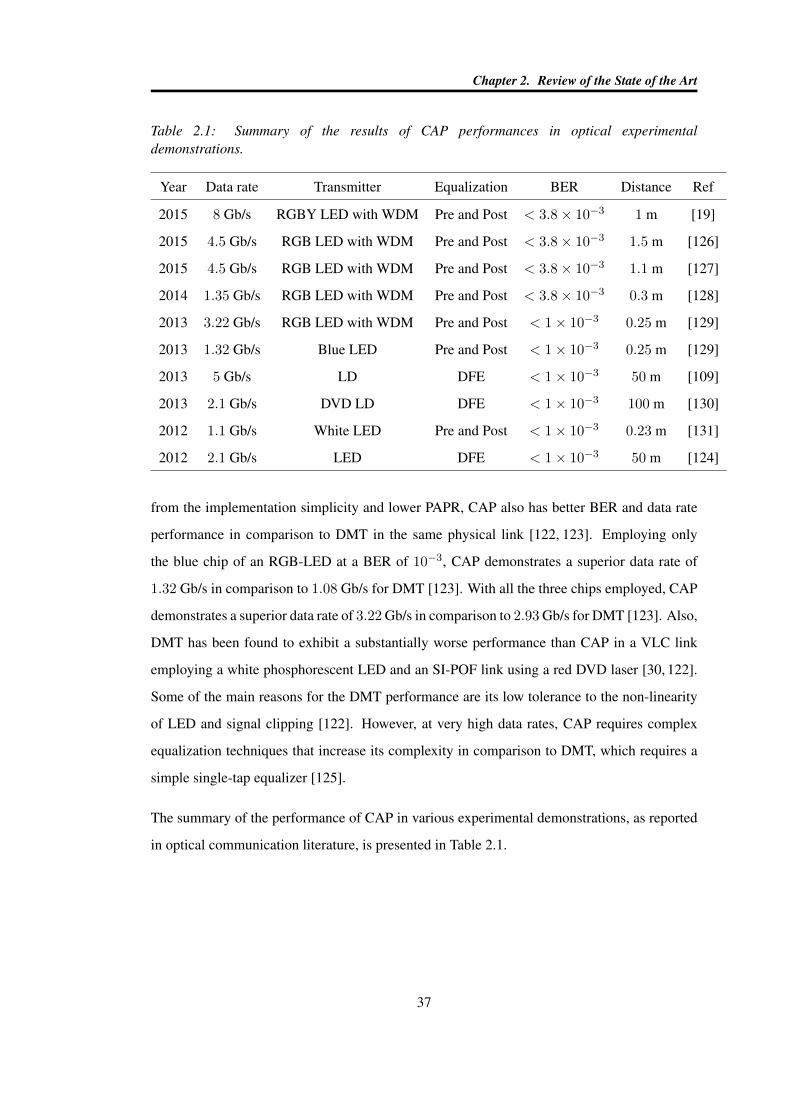
Chapter 2. Review of the State of the Art
Table 2.1: Summary of the results of CAP performances in optical experimentaldemonstrations.
Year Data rate Transmitter Equalization BER Distance Ref
2015 8 Gb/s RGBY LED with WDM Pre and Post < 3.8× 10⁻³ 1 m [19]
2015 4.5 Gb/s RGB LED with WDM Pre and Post < 3.8× 10⁻³ 1.5 m [126]
2015 4.5 Gb/s RGB LED with WDM Pre and Post < 3.8× 10⁻³ 1.1 m [127]
2014 1.35 Gb/s RGB LED with WDM Pre and Post < 3.8× 10⁻³ 0.3 m [128]
2013 3.22 Gb/s RGB LED with WDM Pre and Post < 1× 10⁻³ 0.25 m [129]
2013 1.32 Gb/s Blue LED Pre and Post < 1× 10⁻³ 0.25 m [129]
2013 5 Gb/s LD DFE < 1× 10⁻³ 50 m [109]
2013 2.1 Gb/s DVD LD DFE < 1× 10⁻³ 100 m [130]
2012 1.1 Gb/s White LED Pre and Post < 1× 10⁻³ 0.23 m [131]
2012 2.1 Gb/s LED DFE < 1× 10⁻³ 50 m [124]
from the implementation simplicity and lower PAPR, CAP also has better BER and data rate
performance in comparison to DMT in the same physical link [122, 123]. Employing only
the blue chip of an RGB-LED at a BER of 10−3, CAP demonstrates a superior data rate of
1.32 Gb/s in comparison to 1.08 Gb/s for DMT [123]. With all the three chips employed, CAP
demonstrates a superior data rate of 3.22 Gb/s in comparison to 2.93 Gb/s for DMT [123]. Also,
DMT has been found to exhibit a substantially worse performance than CAP in a VLC link
employing a white phosphorescent LED and an SI-POF link using a red DVD laser [30, 122].
Some of the main reasons for the DMT performance are its low tolerance to the non-linearity
of LED and signal clipping [122]. However, at very high data rates, CAP requires complex
equalization techniques that increase its complexity in comparison to DMT, which requires a
simple single-tap equalizer [125].
The summary of the performance of CAP in various experimental demonstrations, as reported
in optical communication literature, is presented in Table 2.1.
37
Chapter 2. Review of the State of the Art
2.5 CAP Implementation Challenges
The challenges that are encountered in the implementation of CAP modulation technique
are discussed in this section. The focus is directed at four major aspects of the modulation
technique. These are: (i) sensitivity to timing jitter, (ii) effect of limited modulation bandwidth
of the LED, (iii) power requirement and (iv) computational complexity.
2.5.1 CAP Sensitivity to Timing Jitter
Timing jitter, one of the challenges of CAP modulation, has been identified as a major
impediment to achieving high data rates in optical systems [132–135]. It can be defined
as the deviation of the receiver clock from the ideal sampling instant. The reasons for the
jitter sensitivity exhibited by the CAP modulation technique can be found in the analysis of its
receiver architecture [23, 136]. The matched filter output at the receiver has two components
corresponding to the in-phase (in-phase Rx filter) and the quadrature (quadrature Rx filter)
arms. In the absence of noise and link attenuation, referring to Fig. 2.7, the in-phase arm of the
matched filter output can be expressed as follows [23]:
rI(t) = x(t)⊗ q(t) (2.34)
where
q(t) = p(T − t). (2.35)
Then, it follows that:
rI(t) =∞∑
i=−∞airII(t− iT ) +
∞∑i=−∞
birIQ(t− iT ) (2.36)
where the desired and the interference parts are respectively given as:
rII(t) = p(t)⊗ p(T − t) and rIQ(t) = p(t)⊗ p(T − t). (2.37)
38
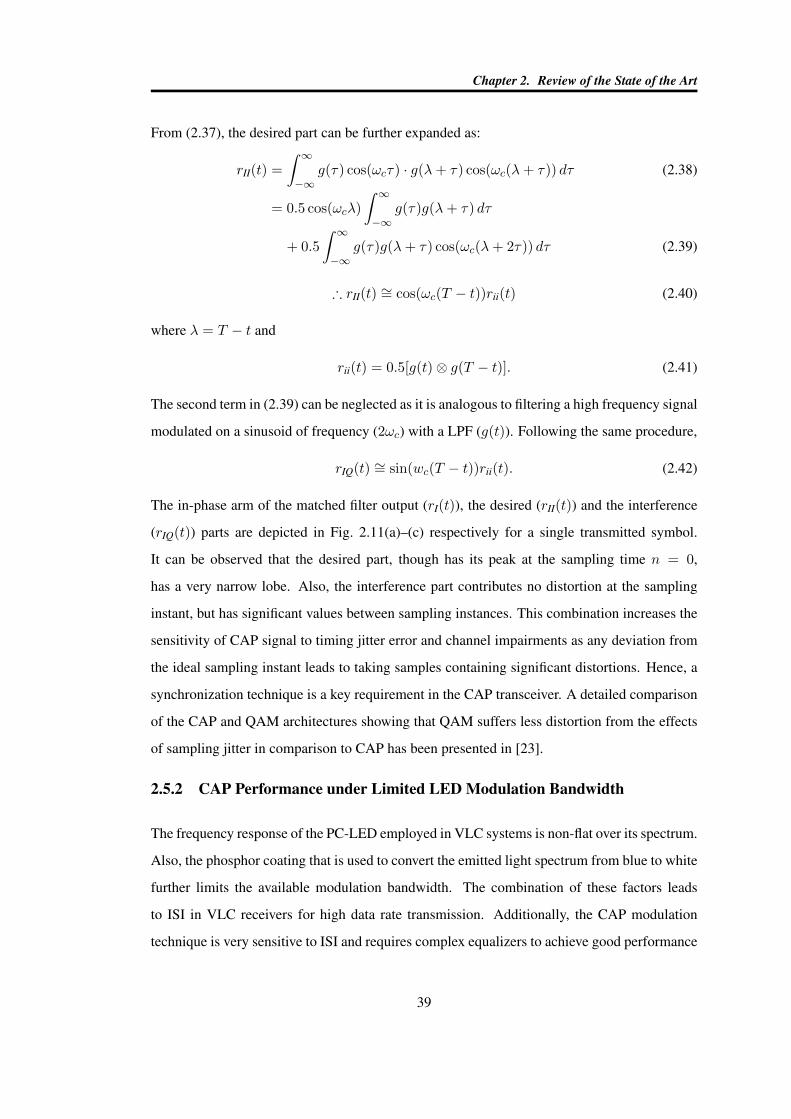
Chapter 2. Review of the State of the Art
From (2.37), the desired part can be further expanded as:
rII(t) =
∫ ∞−∞
g(τ) cos(ωcτ) · g(λ+ τ) cos(ωc(λ+ τ)) dτ (2.38)
= 0.5 cos(ωcλ)
∫ ∞−∞
g(τ)g(λ+ τ) dτ
+ 0.5
∫ ∞−∞
g(τ)g(λ+ τ) cos(ωc(λ+ 2τ)) dτ (2.39)
∴ rII(t) ∼= cos(ωc(T − t))rii(t) (2.40)
where λ = T − t and
rii(t) = 0.5[g(t)⊗ g(T − t)]. (2.41)
The second term in (2.39) can be neglected as it is analogous to filtering a high frequency signal
modulated on a sinusoid of frequency (2ωc) with a LPF (g(t)). Following the same procedure,
rIQ(t) ∼= sin(wc(T − t))rii(t). (2.42)
The in-phase arm of the matched filter output (rI(t)), the desired (rII(t)) and the interference
(rIQ(t)) parts are depicted in Fig. 2.11(a)–(c) respectively for a single transmitted symbol.
It can be observed that the desired part, though has its peak at the sampling time n = 0,
has a very narrow lobe. Also, the interference part contributes no distortion at the sampling
instant, but has significant values between sampling instances. This combination increases the
sensitivity of CAP signal to timing jitter error and channel impairments as any deviation from
the ideal sampling instant leads to taking samples containing significant distortions. Hence, a
synchronization technique is a key requirement in the CAP transceiver. A detailed comparison
of the CAP and QAM architectures showing that QAM suffers less distortion from the effects
of sampling jitter in comparison to CAP has been presented in [23].
2.5.2 CAP Performance under Limited LED Modulation Bandwidth
The frequency response of the PC-LED employed in VLC systems is non-flat over its spectrum.
Also, the phosphor coating that is used to convert the emitted light spectrum from blue to white
further limits the available modulation bandwidth. The combination of these factors leads
to ISI in VLC receivers for high data rate transmission. Additionally, the CAP modulation
technique is very sensitive to ISI and requires complex equalizers to achieve good performance
39
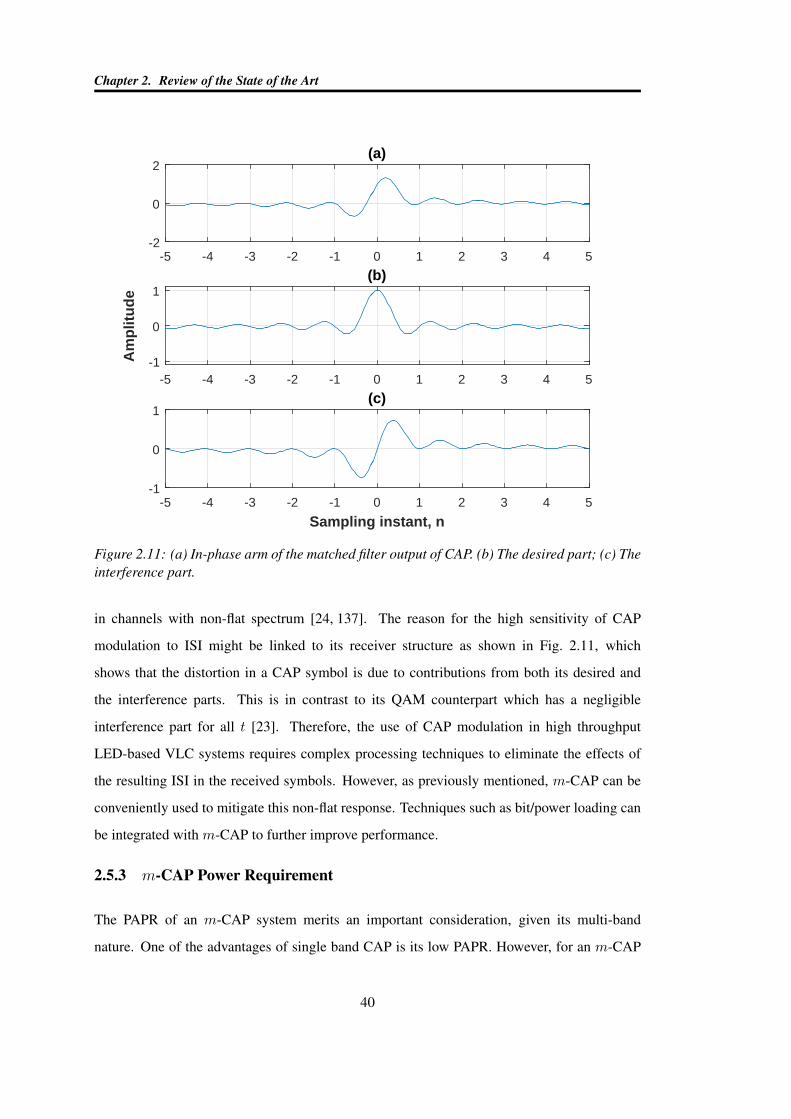
Chapter 2. Review of the State of the Art
-5 -4 -3 -2 -1 0 1 2 3 4 5-1
0
1
Am
plit
ud
e
(b)
-5 -4 -3 -2 -1 0 1 2 3 4 5
Sampling instant, n
-1
0
1(c)
-5 -4 -3 -2 -1 0 1 2 3 4 5-2
0
2(a)
Figure 2.11: (a) In-phase arm of the matched filter output of CAP. (b) The desired part; (c) Theinterference part.
in channels with non-flat spectrum [24, 137]. The reason for the high sensitivity of CAP
modulation to ISI might be linked to its receiver structure as shown in Fig. 2.11, which
shows that the distortion in a CAP symbol is due to contributions from both its desired and
the interference parts. This is in contrast to its QAM counterpart which has a negligible
interference part for all t [23]. Therefore, the use of CAP modulation in high throughput
LED-based VLC systems requires complex processing techniques to eliminate the effects of
the resulting ISI in the received symbols. However, as previously mentioned, m-CAP can be
conveniently used to mitigate this non-flat response. Techniques such as bit/power loading can
be integrated with m-CAP to further improve performance.
2.5.3 m-CAP Power Requirement
The PAPR of an m-CAP system merits an important consideration, given its multi-band
nature. One of the advantages of single band CAP is its low PAPR. However, for an m-CAP
40
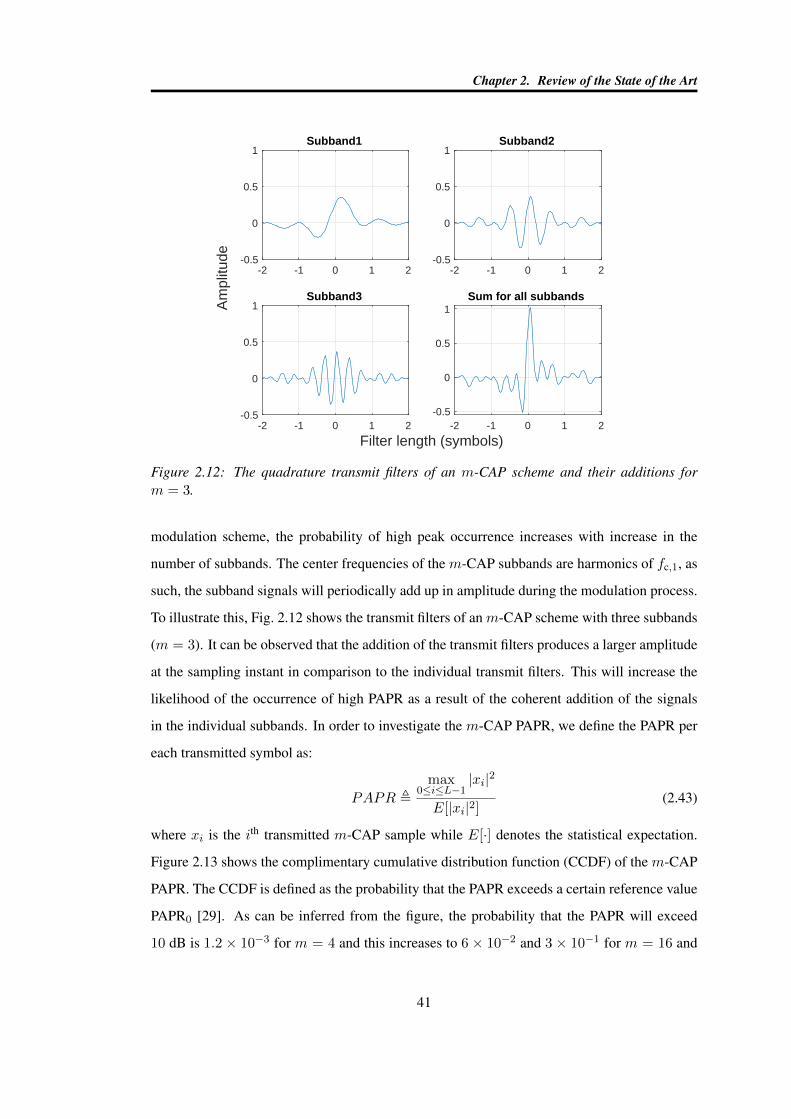
Chapter 2. Review of the State of the Art
-2 -1 0 1 2-0.5
0
0.5
1
Am
plitu
de
Subband1
-2 -1 0 1 2-0.5
0
0.5
1Subband2
-2 -1 0 1 2-0.5
0
0.5
1Subband3
-2 -1 0 1 2
Filter length (symbols)
-0.5
0
0.5
1Sum for all subbands
Figure 2.12: The quadrature transmit filters of an m-CAP scheme and their additions form = 3.
modulation scheme, the probability of high peak occurrence increases with increase in the
number of subbands. The center frequencies of the m-CAP subbands are harmonics of fc,1, as
such, the subband signals will periodically add up in amplitude during the modulation process.
To illustrate this, Fig. 2.12 shows the transmit filters of an m-CAP scheme with three subbands
(m = 3). It can be observed that the addition of the transmit filters produces a larger amplitude
at the sampling instant in comparison to the individual transmit filters. This will increase the
likelihood of the occurrence of high PAPR as a result of the coherent addition of the signals
in the individual subbands. In order to investigate the m-CAP PAPR, we define the PAPR per
each transmitted symbol as:
PAPR ,max
0≤i≤L−1|xi|2
E[|xi|2](2.43)
where xi is the ith transmitted m-CAP sample while E[·] denotes the statistical expectation.
Figure 2.13 shows the complimentary cumulative distribution function (CCDF) of the m-CAP
PAPR. The CCDF is defined as the probability that the PAPR exceeds a certain reference value
PAPR0 [29]. As can be inferred from the figure, the probability that the PAPR will exceed
10 dB is 1.2 × 10⁻³ for m = 4 and this increases to 6 × 10⁻² and 3 × 10⁻¹ for m = 16 and
41
Chapter 2. Review of the State of the Art
0 2 4 6 8 10 12 14 16PAPR0(dB)
10-4
10-3
10-2
10-1
100
Pr[
PA
PR
> P
AP
R0]
Figure 2.13: The CCDF of PAPR of m-CAP for different number of subbands using CAP-64.
64, respectively. This means that out of every 1000 symbols, only 15 are likely to have their
PAPR exceeding 10 dB for m = 4 as compared to 40 and 700 for m = 16 and 64, respectively.
Expectedly, the PAPR of the m-CAP increases with increasing number of subbands. Thus, the
PAPR of m-CAP will be an important factor to monitor given the power and dynamic range
constraints in VLC systems.
2.5.4 m-CAP Computational Complexity
The CAP modulation scheme uses 4 FIR filters in its transceiver (FIR filter ‘quads’), a pair each
for pulse-shaping at the transmitter and matched filtering at the receiver [138, 139]. So there
is a need to consider the number of computations involved in a CAP transceiver, especially
considering the growing popularity of m-CAP. For a CAP system using a filter of lengthG, the
number of real multiplications require for its implementation per each transmitted symbol can
be calculated from (2.25), (2.26), (2.27) and Fig. 2.7 as follows:
• The evaluation of either (2.26) and (2.27) requiresG real multiplications since it involves
element-wise multiplication.
• The pulse-shaping convolution operation of either of the terms on the right hand side of
42
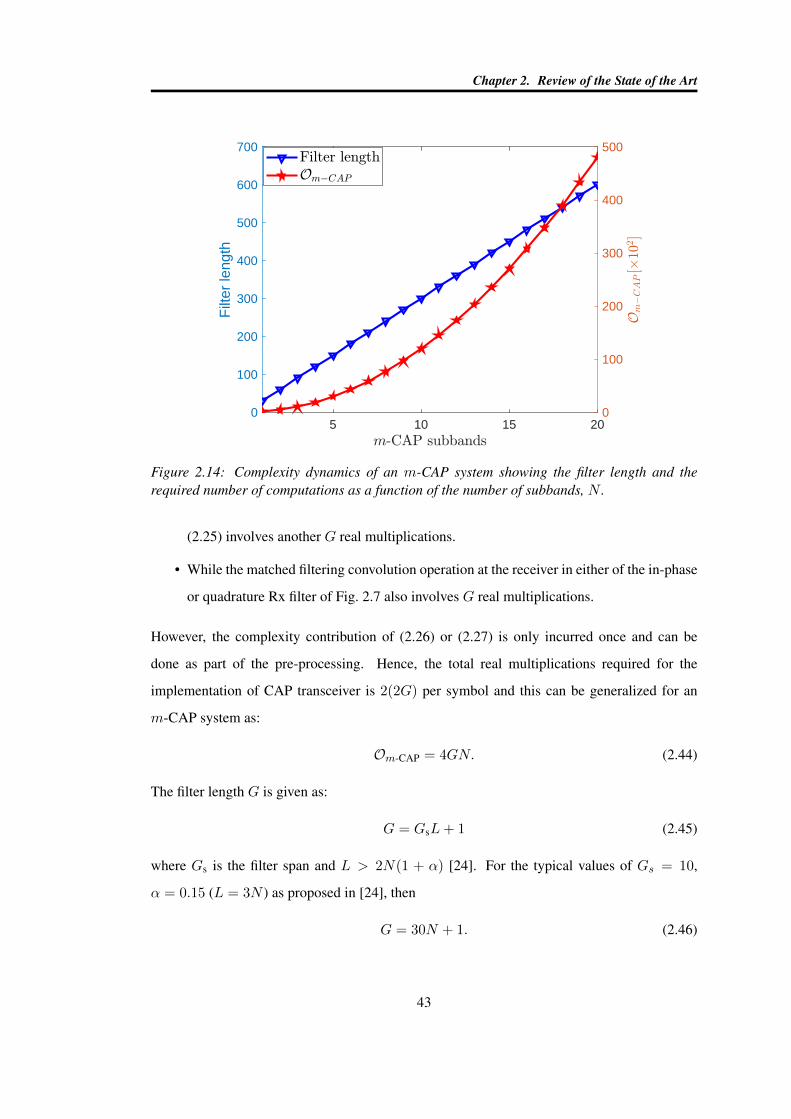
Chapter 2. Review of the State of the Art
5 10 15 200
100
200
300
400
500
600
700
Filt
er le
ngth
0
100
200
300
400
500
Figure 2.14: Complexity dynamics of an m-CAP system showing the filter length and therequired number of computations as a function of the number of subbands, N .
(2.25) involves another G real multiplications.
• While the matched filtering convolution operation at the receiver in either of the in-phase
or quadrature Rx filter of Fig. 2.7 also involves G real multiplications.
However, the complexity contribution of (2.26) or (2.27) is only incurred once and can be
done as part of the pre-processing. Hence, the total real multiplications required for the
implementation of CAP transceiver is 2(2G) per symbol and this can be generalized for an
m-CAP system as:
Om-CAP = 4GN. (2.44)
The filter length G is given as:
G = GsL+ 1 (2.45)
where Gs is the filter span and L > 2N(1 + α) [24]. For the typical values of Gs = 10,
α = 0.15 (L = 3N ) as proposed in [24], then
G = 30N + 1. (2.46)
43
Chapter 2. Review of the State of the Art
Substituting (2.46) for G in (2.44), the required computational cost per symbol in an m-CAP
system can be expressed in terms of m as:
Om-CAP = 120N2 + 4N. (2.47)
Therefore, for a fixed value of Gs and α, (2.46) and (2.47) respectively provide insight into
the complexity dynamics of anm-CAP system with regards to the filter length and the required
number of computations as more subbands are added. The complexity dynamics is presented in
Fig. 2.14 using (2.46) and (2.47). While (2.46) shows that the filter length of m-CAP increases
as a linear function of N , (2.47) shows that theOm-CAP increases as a quadratic function of N .
This means that Om-CAP will quickly ramp up as more subbands are added. It follows from
(2.47) that asN increases from 2 to 4 and 16, theOm-CAP increases in order of magnitude from
3 to 4 and 5, respectively. A compromise is thus needed between increasing the subbands to
improve performance and the resulting system complexity.
2.6 Summary of Chapter 2
A detailed review of the state of the art in VLC and OFC has been conducted in this chapter.
The review covers the varieties of optical sources and receivers that are employed along with
their characteristics. It also include the channel modelling, link impairments as well as the
signal processing techniques that are deployed to improve performance. Furthermore, different
modulation techniques are also discussed with a focus on CAP modulation technique. The
chapter is concluded by identifying the challenges that are experienced in a CAP-based optical
communication system.
The performance enhancing techniques that are developed for CAP scheme, including their
theoretical analyses, simulation results and experimental demonstrations, will now be discussed
in the rest of the thesis.
44
Chapter 3
Synchronization and Equalization for CAP
Implementation Challenges
Novel techniques that are developed to mitigate the highlighted challenges of CAP modulation
are discussed in this chapter along with their analytical, simulation and experimental
performances. The main design consideration in developing the mitigation techniques is to
ensure that the implementation simplicity of the CAP modulation scheme is maintained.
3.1 Description of the CAP Mitigation Techniques
Two novel techniques are developed to mitigate the timing jitter and improve the limited
bandwidth effect encountered by CAP modulation scheme in optical communication systems.
3.1.1 Mitigating Timing Jitter with the ‘CAP Filter’ Synchronization Technique
There are two broad categories of solutions for addressing the timing jitter challenge in CAP
modulation. One way is to modify the filter structure of CAP while the other maintains the
structure and creates a separate synchronization block. The modified receiver structures from
the first set are less-sensitive to timing jitter but results in higher complexity. Examples of this
are the sets of two-dimensional (2D) CAP pulses and a set of frequency domain (FD) 3D CAP
pulses that are proposed in [22]. The proposed 2D pulses result in improved tolerance to timing
jitter but the corresponding BER is worse in the absence of timing jitter. In addition, the FD 3D
pulses are more sensitive to timing jitter than the existing CAP pulses. Furthermore, the timing
sensitivity solution demonstrated in [140] considered a modified QAM receiver. The receiver,
though has low timing sensitivity, results in the loss of the simple linear CAP receiver.
45
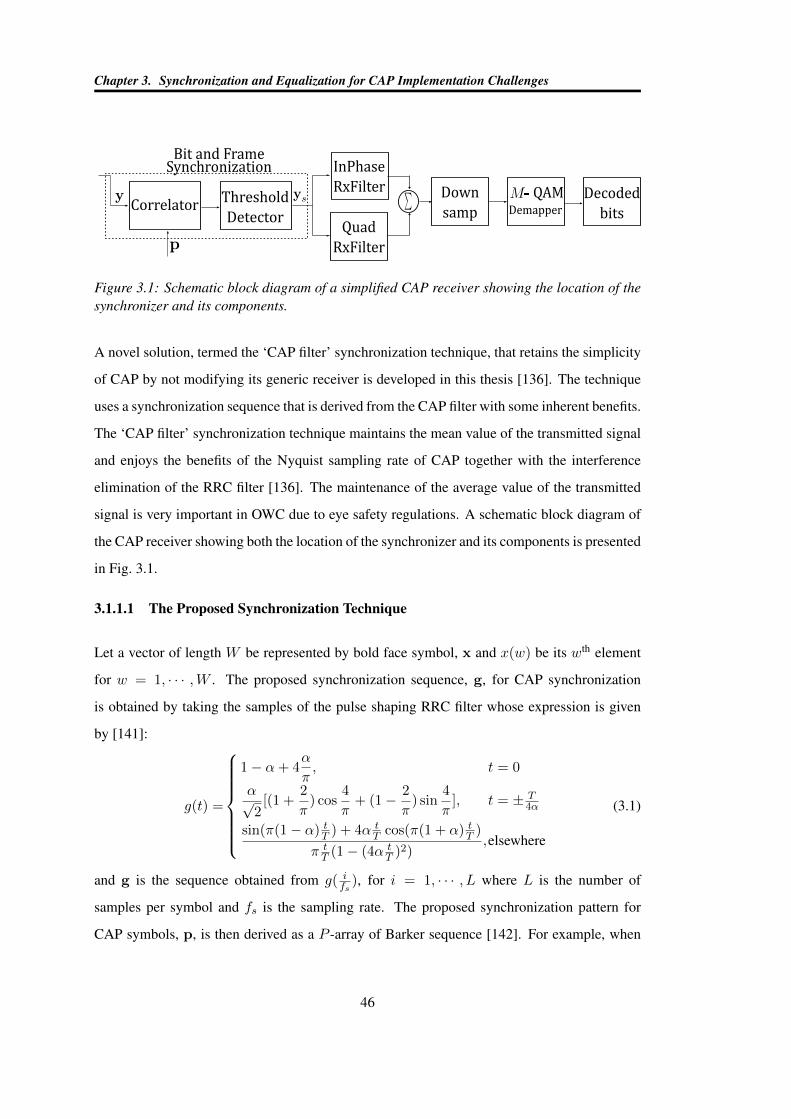
Chapter 3. Synchronization and Equalization for CAP Implementation Challenges
InPhase
RxFilter
Quad
RxFilter
Down
samp
Decoded
bits
QAMDemapper
Bit and FrameSynchronization
Threshold
DetectorCorrelator
Figure 3.1: Schematic block diagram of a simplified CAP receiver showing the location of thesynchronizer and its components.
A novel solution, termed the ‘CAP filter’ synchronization technique, that retains the simplicity
of CAP by not modifying its generic receiver is developed in this thesis [136]. The technique
uses a synchronization sequence that is derived from the CAP filter with some inherent benefits.
The ‘CAP filter’ synchronization technique maintains the mean value of the transmitted signal
and enjoys the benefits of the Nyquist sampling rate of CAP together with the interference
elimination of the RRC filter [136]. The maintenance of the average value of the transmitted
signal is very important in OWC due to eye safety regulations. A schematic block diagram of
the CAP receiver showing both the location of the synchronizer and its components is presented
in Fig. 3.1.
3.1.1.1 The Proposed Synchronization Technique
Let a vector of length W be represented by bold face symbol, x and x(w) be its wth element
for w = 1, · · · ,W . The proposed synchronization sequence, g, for CAP synchronization
is obtained by taking the samples of the pulse shaping RRC filter whose expression is given
by [141]:
g(t) =
1− α+ 4α
π, t = 0
α√2
[(1 +2
π) cos
4
π+ (1− 2
π) sin
4
π], t = ± T
4α
sin(π(1− α) tT ) + 4α tT cos(π(1 + α) tT )
π tT (1− (4α t
T )2),elsewhere
(3.1)
and g is the sequence obtained from g( ifs
), for i = 1, · · · , L where L is the number of
samples per symbol and fs is the sampling rate. The proposed synchronization pattern for
CAP symbols, p, is then derived as a P -array of Barker sequence [142]. For example, when
46
Chapter 3. Synchronization and Equalization for CAP Implementation Challenges
P = 3;
p = χ[g g −g
](3.2)
where χ is a design parameter defined as:
χ =
max0≤m<M
|c(m)|
max0≤l≤L−1
|g(l)|(3.3)
and c(m) is from the M -QAM constellation:
c(m) =−(M − 1) + 2m√
(M2 − 1)/3(3.4)
Therefore, the length of p becomes PL. A typical single frame can be defined as f = [p, s]
where s contains the sequence of transmitted data with length S and f has lengthK = PL+S.
The received sequence can be written as:
y = f + w (3.5)
where the elements of w are statistically independent and identically distributed (i.i.d.) AWGN
samples. The sliding correlator output at the receiver is:
v(k) =PL−1∑i=0
p(i) · y(i+ k − (PL− 1)) (3.6)
=
PL−1∑i=0
p(i) · f(i+ k − (PL− 1))
+PL−1∑i=0
p(i) · w(i+ k − (PL− 1)) (3.7)
= vf (k) + vw(k), k = 0, 1, · · · ,K − 1 (3.8)
The correlator output, v, has its maximum value at index k = kp which means that
max0≤k≤K−1
v(k) = v(kp). Hence, the maximum value v(kp) occurs at the index kp. It is
worthy of mention that since the system parameters are usually known at the receiver, p can
easily be generated. Therefore, the objective now is to locate the peak of the correlator output
and obtain a clock signal which is in alignment with it.
3.1.1.2 Performance Analysis of the Proposed Synchronization Technique
A good correlation sequence should have high autocorrelation value only at the zero lag point
and small autocorrelation values at the non-zero lag points. Therefore, an intrinsic measure
47
Chapter 3. Synchronization and Equalization for CAP Implementation Challenges
of performance can be defined based on the peak-to-sidelobe distance of the correlator output.
Consequently, it is desired that vf (kp) > max∀k<kp
vf (k) and a threshold γ can be set which
satisfy the following condition:
vf (kp) > γ > max∀k<kp
vf (k) (3.9)
The expression in (3.9) seeks to determine an optimum threshold value that is set between
the peak and its nearest value. Also, the correlator output sequence in (3.8), v, is a Gaussian
random variable since vw is an additive Gaussian noise vector with variance of Kσ2vw where
σ2vw = ‖p‖2 · σ2 and ‖·‖ is the Euclidean norm.
Probability of missed detection (PMD) is defined as the probability that the synchronization
sequence is not flagged as detected at the expected instant, and this definition is adopted in this
study for the performance evaluation of the proposed technique [143]. To derive the PMD for
the proposed scheme, in the presence of AWGN, recall that the expected detection instant is
kp = PL− 1. From (3.8),
v(kp) = vf (kp) + vw(kp) (3.10)
where v(kp) ∼ N (vf (kp), σ2vw). The PDF of v(kp) can then be expressed as:
f(v(kp) | vf (kp), σ2vw) =
1√2σ2vwπ
e−
(v(kp)−vf (kp))2
2σ2vw (3.11)
The threshold detector in Fig. 3.1 flags synchronization whenever the correlator output
sequence exceeds the threshold level, γ. Since elements of v are i.i.d. and it is desired that
(3.9) is satisfied, the optimum threshold γ is therefore:
γ = (vf (kp)− max∀k<kp
vf (k))/2. (3.12)
The PMD is then obtained by evaluating (3.11) for the region below γ. Therefore,
PMD =1√
2σ2vwπ
∫ γ
−∞e−
(v(kp)−vf (kp))2
2σ2vw dv(kp). (3.13)
48
Chapter 3. Synchronization and Equalization for CAP Implementation Challenges
Using a change of variable, (3.13) can be evaluated as:
PMD =1√2π
∫ γ−vf (kp)σvw
−∞e−
(x)2
2 dx (3.14)
=1√2π
∫ −(vf (kp)−γ)σvw
−∞e−
(x)2
2 dx (3.15)
=1√2π
∫ ∞(vf (kp)−γ)
σvw
e−(x)2
2 dx (3.16)
= Q
(D
‖p‖ · σ
), (3.17)
where the peak-to-sidelobe mid-point, D, is expressed as:
D = (vf (kp) + max∀k<kp
vf (k))/2 (3.18)
It can be observed from (3.17) that the performance of the correlator receiver improves as the
system SNR increases because this reduces the effect of the noise contribution, σ and increases
the detection distance, D.
3.1.2 Mitigating the Effect of Limited Bandwidth and Timing Jitter with a
Fractionally-Spaced Equalizer (FSE)
The majority of the work reported in CAP modulation literature are based on the use
of equalization techniques for improving the achievable data rate in LED-based VLC
systems [19, 144, 145]. The reported works have concentrated on using symbol-spaced
equalizer (SSE) which samples the equalizer inputs at symbol rate and thus have
symbol-spaced taps. The SSE is susceptible to the effect of timing jitter which causes
spectrum nulls that result in noise enhancement and potential performance degradation [146].
In contrast, fractionally-spaced equalizers (FSE) circumvent the potential noise enhancement
and the resulting performance degradation in SSE by sampling its input at a higher rate of
T′
= T/Q for Q > 1 [146]. Hence, considering the high sensitivity of CAP to timing jitter,
SSE is not the best equalization technique to adopt. Therefore, a comparative performance
evaluation of FSE and SSE in joint mitigation of the effects of timing jitter and limited
bandwidth on CAP in LED-based VLC system is investigated [147].
It is shown that FSE implementation not only results in a higher achievable data rate and
spectral efficiency, but also reduces the complexity of the overall system by eliminating
the need for a separate synchronization block, such as the one considered in section 3.1.1.
49
Chapter 3. Synchronization and Equalization for CAP Implementation Challenges
Furthermore, as a proof of concept, an experimental LED-based VLC demonstration is
performed to show the advantage of FSE over SSE.
The main difference between FSE and SSE is that the input sampling rate of SSE is the same
as the symbol rate while that of FSE is at least the Nyquist rate. This results in the summation
of aliased components in SSE. In the event of cancellation of aliased components with similar
phase delay, this could lead to occurrence of null in the frequency spectrum of the SSE inputs.
Consequently, SSE results in a high gain to compensate for this null which could result in noise
enhancement and subsequent degradation in performance [148]. However, FSE avoids this
potential pitfall by using no less than the Nyquist sampling frequency to avoid aliasing [146].
Thus, FSE is able to compensate directly for channel distortion before aliasing and mitigate the
effect of any phase error in the equalizer input. As such, it is well suited to address the severe
ISI and timing jitter sensitivity of the CAP modulation technique in VLC systems.
3.1.2.1 Fractionally Spaced Equalizer (FSE)
An optimum receiver for a signal corrupted by AWGN is a filter matched to that signal and
whose output are sampled periodically at the symbol rate. If the channel introduces ISI then
an equalizer is required to remove the ISI effect from the samples of the matched filter output.
An SSE is designed by taking the samples of the matched filter output at the symbol rate while
FSE samples its inputs faster than the symbol rate. The usual choice for FSE in the literature is
twice the sampling rate resulting in T/2-spaced equalizer taps. The equalizer’s output is then
taken at the symbol rate which makes the FSE a decimating filter [146, 149–151].
The frequency response of an SSE equalizer can be expressed as [146]:
WT (f) =K−1∑k=0
wke−j2πfkT (3.19)
where wk are the weights of the equalizer and K is the number of equalizer taps. The
equalized spectrum can then be expressed as [146]:
HT (f) = WT (f)∑i
Y
(f − i
T
)ej2π(f−i/T )τ (3.20)
where Y (f) is the spectrum of the received corrupted signal and τ is a timing delay. The
transmitter and receiver clock frequencies should be perfectly synchronized ideally but there
50
Chapter 3. Synchronization and Equalization for CAP Implementation Challenges
is usually some offset τ in practice due to mismatch in the transceiver clock rate. It can be
observed that the summation term in (3.20) is a folded spectrum consisting of the sum of
the aliased components and that the presence of a phase factor can result in potential noise
enhancement due to spectral nulls.
However, FSE circumvents this potential noise enhancement in SSE by sampling its input at a
higher rate of T′
= T/Q. Hence, (3.19) and (3.20) can be expressed for FSE as:
WT ′ (f) =K−1∑k=0
wke−j2πfkT ′ (3.21)
and
HT ′ = WT ′ (f)∑i
Y
(f − i
T ′
)ej2π(f−i/T
′)τ (3.22)
respectively. IfQ is chosen appropriately to prevent aliasing in the folded spectrum, then (3.22)
becomes [148]:
HT ′ (f) = WT ′ (f)Y (f)ej2π(f)τ , |f | ≤ 1
2T ′(3.23)
and the spectrum of FSE output can be expressed as:
HT ′ (f) =∑i
WT ′
(f − i
T
)Y
(f − i
T
)ej2π(f−i/T )τ (3.24)
since the output is sampled at the symbol rate (because the decisions on the received data are
made at T -interval) and wk are adjusted only once for every Q inputs (Q/T rate adjustment
does not result in faster convergence [146]).
The main difference in the performance of SSE and FSE can be seen by comparing their outputs
given by (3.20) and (3.24), respectively. It is seen that while (3.20) is the equalization of sum
of aliased components, (3.24) is the aliased sum of equalized components. Therefore, the
FSE is able to compensate directly for the received signal spectrum and any resulting timing
jitter before aliasing due to symbol rate sampling at the equalizer output. This characteristic
enables the FSE to avoid potential noise enhancement due to occurrence of null in the received
spectrum and thus the possibility of performance degradation resulting from timing jitter error.
Another intuitive explanation is that since the SSE takes one sample for every symbol, the
sampling requirement is very strict such that the sampling clock needs to be adjusted to ensure
the samples are taken at the peak, the “top dead center” [149], of the received pulses. FSE
51
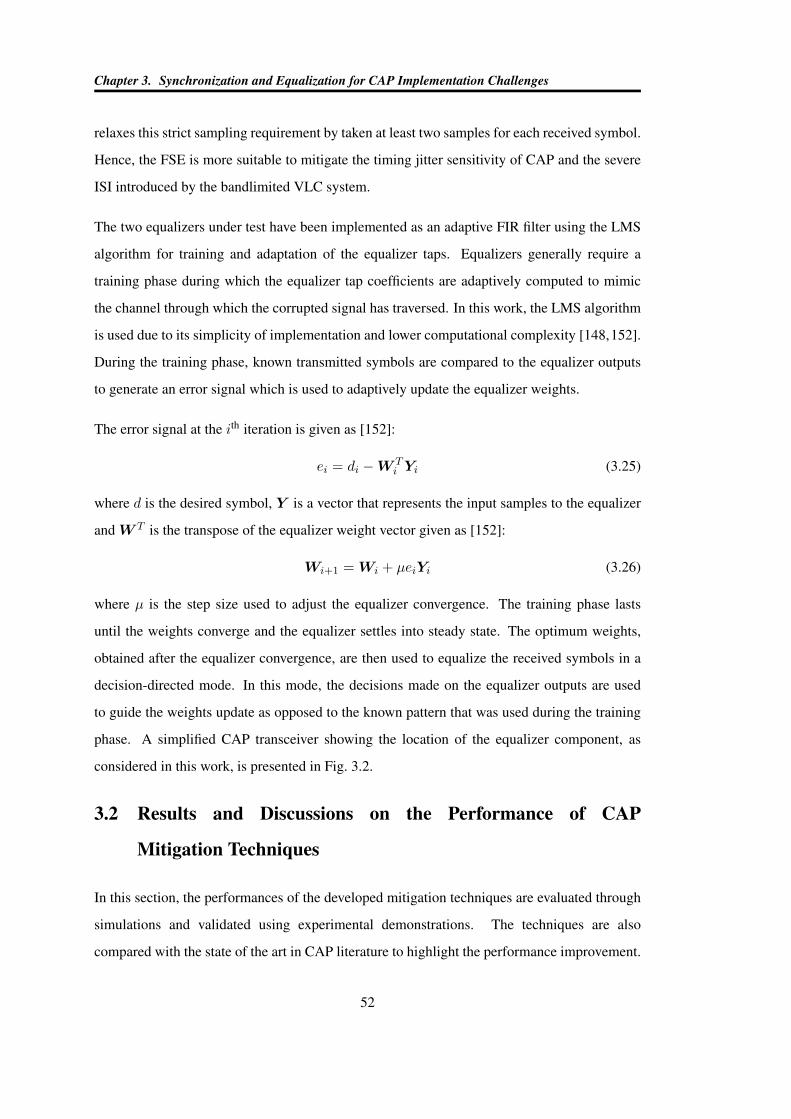
Chapter 3. Synchronization and Equalization for CAP Implementation Challenges
relaxes this strict sampling requirement by taken at least two samples for each received symbol.
Hence, the FSE is more suitable to mitigate the timing jitter sensitivity of CAP and the severe
ISI introduced by the bandlimited VLC system.
The two equalizers under test have been implemented as an adaptive FIR filter using the LMS
algorithm for training and adaptation of the equalizer taps. Equalizers generally require a
training phase during which the equalizer tap coefficients are adaptively computed to mimic
the channel through which the corrupted signal has traversed. In this work, the LMS algorithm
is used due to its simplicity of implementation and lower computational complexity [148,152].
During the training phase, known transmitted symbols are compared to the equalizer outputs
to generate an error signal which is used to adaptively update the equalizer weights.
The error signal at the ith iteration is given as [152]:
ei = di −W Ti Yi (3.25)
where d is the desired symbol, Y is a vector that represents the input samples to the equalizer
andW T is the transpose of the equalizer weight vector given as [152]:
Wi+1 = Wi + µeiYi (3.26)
where µ is the step size used to adjust the equalizer convergence. The training phase lasts
until the weights converge and the equalizer settles into steady state. The optimum weights,
obtained after the equalizer convergence, are then used to equalize the received symbols in a
decision-directed mode. In this mode, the decisions made on the equalizer outputs are used
to guide the weights update as opposed to the known pattern that was used during the training
phase. A simplified CAP transceiver showing the location of the equalizer component, as
considered in this work, is presented in Fig. 3.2.
3.2 Results and Discussions on the Performance of CAP
Mitigation Techniques
In this section, the performances of the developed mitigation techniques are evaluated through
simulations and validated using experimental demonstrations. The techniques are also
compared with the state of the art in CAP literature to highlight the performance improvement.
52
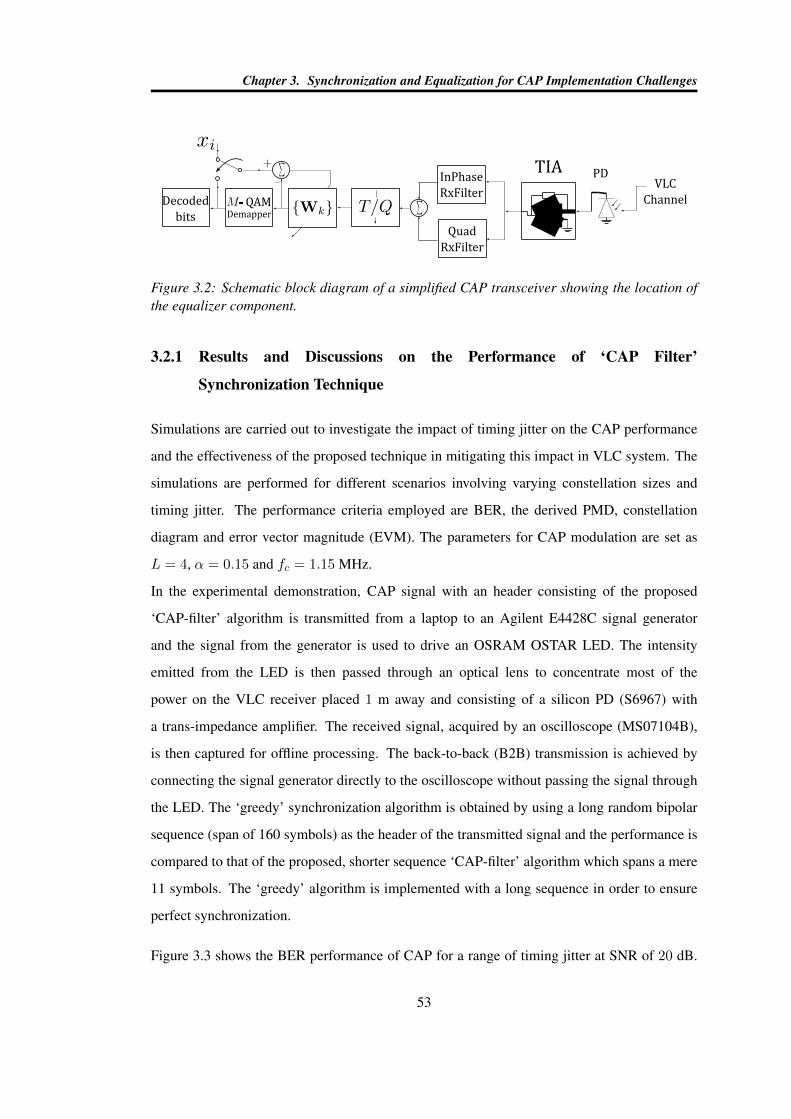
Chapter 3. Synchronization and Equalization for CAP Implementation Challenges
InPhase
RxFilter
Quad
RxFilter
Decoded
bits
VLC
Channel
PDTIA
QAMDemapper
Figure 3.2: Schematic block diagram of a simplified CAP transceiver showing the location ofthe equalizer component.
3.2.1 Results and Discussions on the Performance of ‘CAP Filter’
Synchronization Technique
Simulations are carried out to investigate the impact of timing jitter on the CAP performance
and the effectiveness of the proposed technique in mitigating this impact in VLC system. The
simulations are performed for different scenarios involving varying constellation sizes and
timing jitter. The performance criteria employed are BER, the derived PMD, constellation
diagram and error vector magnitude (EVM). The parameters for CAP modulation are set as
L = 4, α = 0.15 and fc = 1.15 MHz.
In the experimental demonstration, CAP signal with an header consisting of the proposed
‘CAP-filter’ algorithm is transmitted from a laptop to an Agilent E4428C signal generator
and the signal from the generator is used to drive an OSRAM OSTAR LED. The intensity
emitted from the LED is then passed through an optical lens to concentrate most of the
power on the VLC receiver placed 1 m away and consisting of a silicon PD (S6967) with
a trans-impedance amplifier. The received signal, acquired by an oscilloscope (MS07104B),
is then captured for offline processing. The back-to-back (B2B) transmission is achieved by
connecting the signal generator directly to the oscilloscope without passing the signal through
the LED. The ‘greedy’ synchronization algorithm is obtained by using a long random bipolar
sequence (span of 160 symbols) as the header of the transmitted signal and the performance is
compared to that of the proposed, shorter sequence ‘CAP-filter’ algorithm which spans a mere
11 symbols. The ‘greedy’ algorithm is implemented with a long sequence in order to ensure
perfect synchronization.
Figure 3.3 shows the BER performance of CAP for a range of timing jitter at SNR of 20 dB.
53
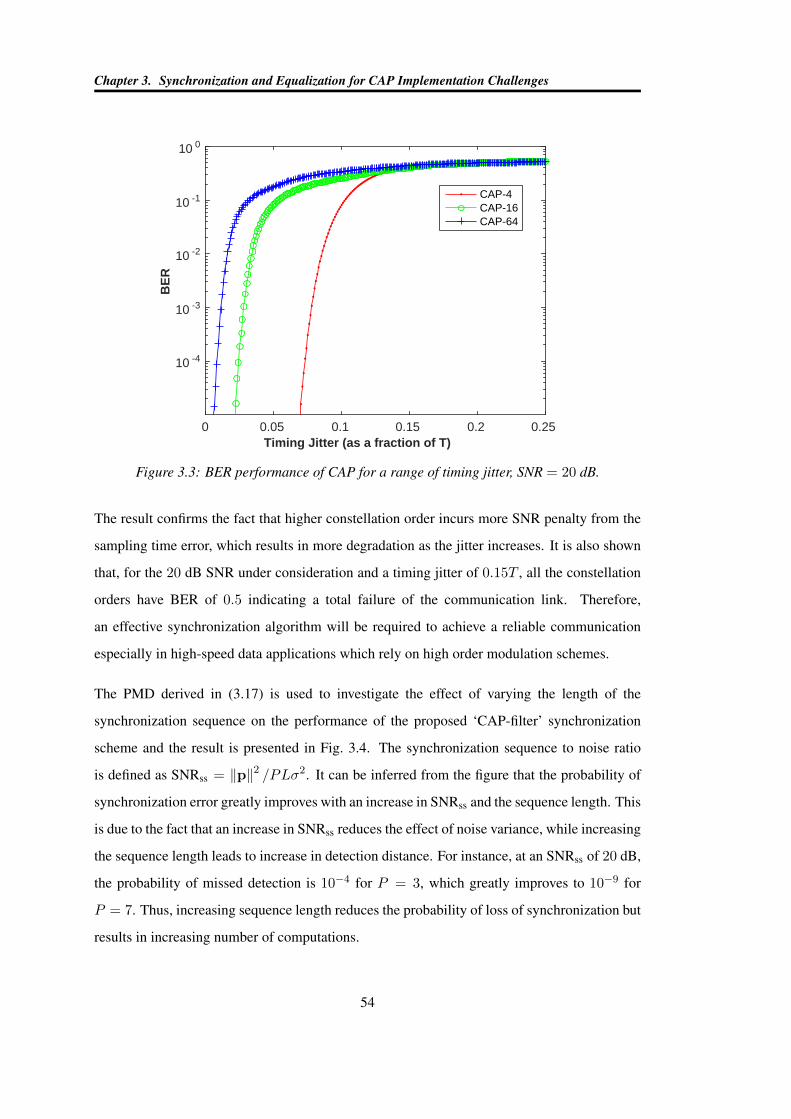
Chapter 3. Synchronization and Equalization for CAP Implementation Challenges
Timing Jitter (as a fraction of T)0 0.05 0.1 0.15 0.2 0.25
BE
R
10 -4
10 -3
10 -2
10 -1
10 0
CAP-4CAP-16CAP-64
Figure 3.3: BER performance of CAP for a range of timing jitter, SNR = 20 dB.
The result confirms the fact that higher constellation order incurs more SNR penalty from the
sampling time error, which results in more degradation as the jitter increases. It is also shown
that, for the 20 dB SNR under consideration and a timing jitter of 0.15T , all the constellation
orders have BER of 0.5 indicating a total failure of the communication link. Therefore,
an effective synchronization algorithm will be required to achieve a reliable communication
especially in high-speed data applications which rely on high order modulation schemes.
The PMD derived in (3.17) is used to investigate the effect of varying the length of the
synchronization sequence on the performance of the proposed ‘CAP-filter’ synchronization
scheme and the result is presented in Fig. 3.4. The synchronization sequence to noise ratio
is defined as SNRss = ‖p‖2 /PLσ2. It can be inferred from the figure that the probability of
synchronization error greatly improves with an increase in SNRss and the sequence length. This
is due to the fact that an increase in SNRss reduces the effect of noise variance, while increasing
the sequence length leads to increase in detection distance. For instance, at an SNRss of 20 dB,
the probability of missed detection is 10−4 for P = 3, which greatly improves to 10−9 for
P = 7. Thus, increasing sequence length reduces the probability of loss of synchronization but
results in increasing number of computations.
54
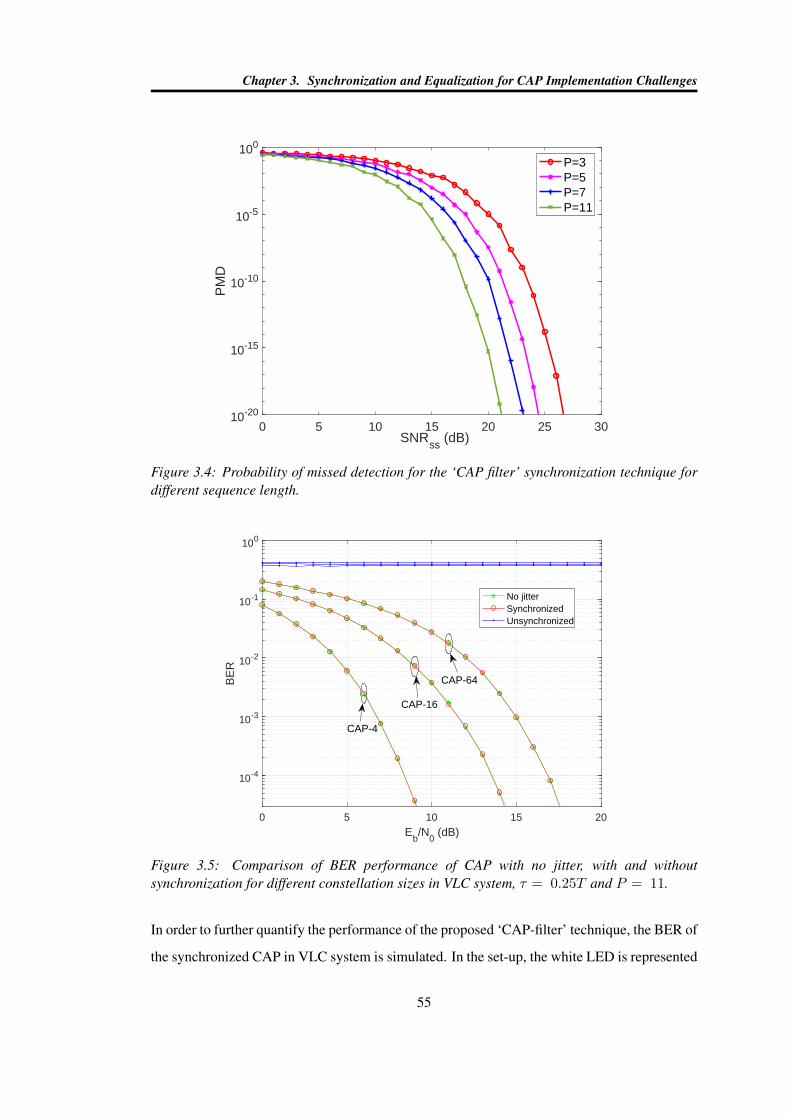
Chapter 3. Synchronization and Equalization for CAP Implementation Challenges
0 5 10 15 20 25 30SNR
ss (dB)
10-20
10-15
10-10
10-5
100
PM
D
P=3P=5P=7P=11
Figure 3.4: Probability of missed detection for the ‘CAP filter’ synchronization technique fordifferent sequence length.
0 5 10 15 20
Eb/N
0 (dB)
10-4
10-3
10-2
10-1
100
BE
R
No jitterSynchronizedUnsynchronized
CAP-64
CAP-16
CAP-4
Figure 3.5: Comparison of BER performance of CAP with no jitter, with and withoutsynchronization for different constellation sizes in VLC system, τ = 0.25T and P = 11.
In order to further quantify the performance of the proposed ‘CAP-filter’ technique, the BER of
the synchronized CAP in VLC system is simulated. In the set-up, the white LED is represented
55
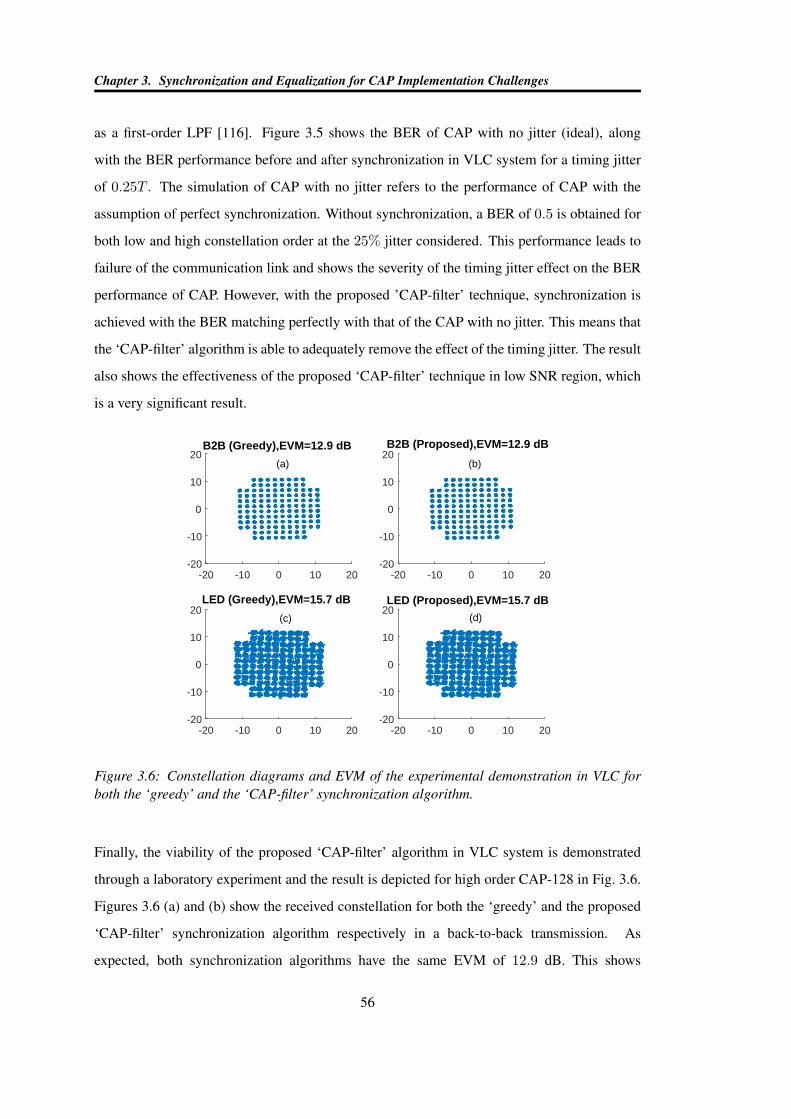
Chapter 3. Synchronization and Equalization for CAP Implementation Challenges
as a first-order LPF [116]. Figure 3.5 shows the BER of CAP with no jitter (ideal), along
with the BER performance before and after synchronization in VLC system for a timing jitter
of 0.25T . The simulation of CAP with no jitter refers to the performance of CAP with the
assumption of perfect synchronization. Without synchronization, a BER of 0.5 is obtained for
both low and high constellation order at the 25% jitter considered. This performance leads to
failure of the communication link and shows the severity of the timing jitter effect on the BER
performance of CAP. However, with the proposed ’CAP-filter’ technique, synchronization is
achieved with the BER matching perfectly with that of the CAP with no jitter. This means that
the ‘CAP-filter’ algorithm is able to adequately remove the effect of the timing jitter. The result
also shows the effectiveness of the proposed ‘CAP-filter’ technique in low SNR region, which
is a very significant result.
-20 -10 0 10 20-20
-10
0
10
20B2B (Greedy),EVM=12.9 dB
-20 -10 0 10 20-20
-10
0
10
20B2B (Proposed),EVM=12.9 dB
-20 -10 0 10 20-20
-10
0
10
20LED (Greedy),EVM=15.7 dB
-20 -10 0 10 20-20
-10
0
10
20LED (Proposed),EVM=15.7 dB
(d)
(b)
(c)
(a)
Figure 3.6: Constellation diagrams and EVM of the experimental demonstration in VLC forboth the ‘greedy’ and the ‘CAP-filter’ synchronization algorithm.
Finally, the viability of the proposed ‘CAP-filter’ algorithm in VLC system is demonstrated
through a laboratory experiment and the result is depicted for high order CAP-128 in Fig. 3.6.
Figures 3.6 (a) and (b) show the received constellation for both the ‘greedy’ and the proposed
‘CAP-filter’ synchronization algorithm respectively in a back-to-back transmission. As
expected, both synchronization algorithms have the same EVM of 12.9 dB. This shows
56
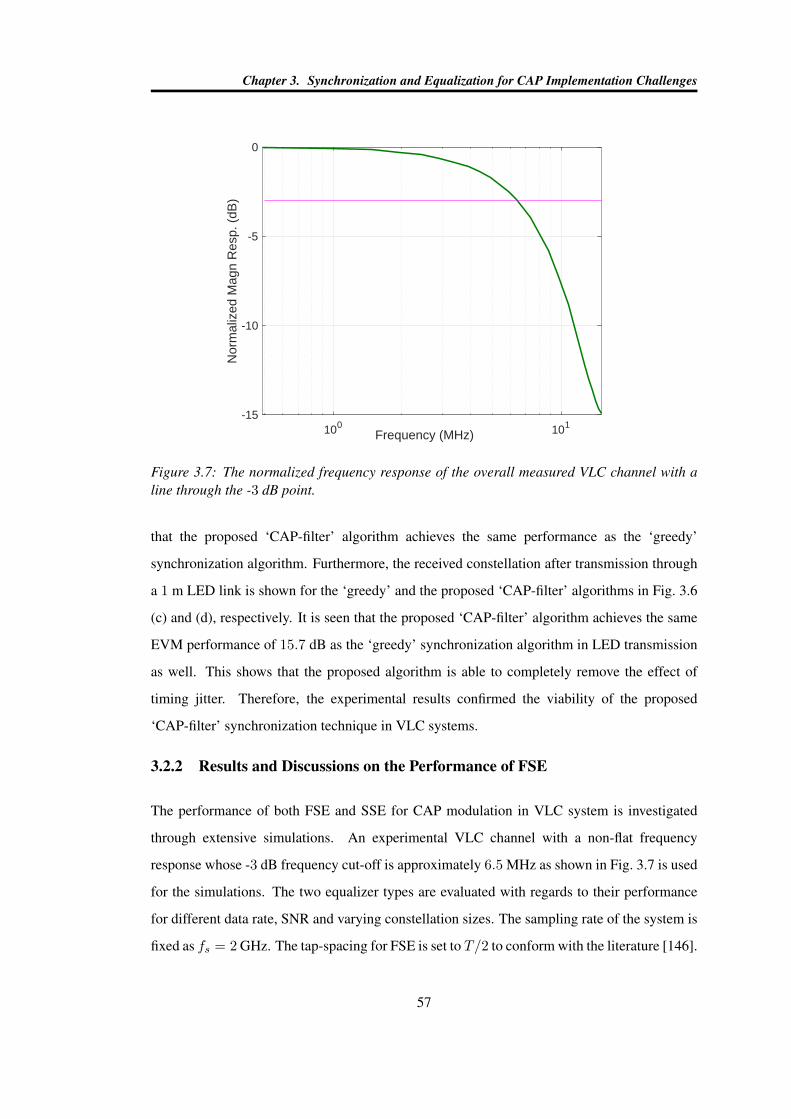
Chapter 3. Synchronization and Equalization for CAP Implementation Challenges
100 101Frequency (MHz)
-15
-10
-5
0
Nor
mal
ized
Mag
n R
esp.
(dB
)
Figure 3.7: The normalized frequency response of the overall measured VLC channel with aline through the -3 dB point.
that the proposed ‘CAP-filter’ algorithm achieves the same performance as the ‘greedy’
synchronization algorithm. Furthermore, the received constellation after transmission through
a 1 m LED link is shown for the ‘greedy’ and the proposed ‘CAP-filter’ algorithms in Fig. 3.6
(c) and (d), respectively. It is seen that the proposed ‘CAP-filter’ algorithm achieves the same
EVM performance of 15.7 dB as the ‘greedy’ synchronization algorithm in LED transmission
as well. This shows that the proposed algorithm is able to completely remove the effect of
timing jitter. Therefore, the experimental results confirmed the viability of the proposed
‘CAP-filter’ synchronization technique in VLC systems.
3.2.2 Results and Discussions on the Performance of FSE
The performance of both FSE and SSE for CAP modulation in VLC system is investigated
through extensive simulations. An experimental VLC channel with a non-flat frequency
response whose -3 dB frequency cut-off is approximately 6.5 MHz as shown in Fig. 3.7 is used
for the simulations. The two equalizer types are evaluated with regards to their performance
for different data rate, SNR and varying constellation sizes. The sampling rate of the system is
fixed as fs = 2 GHz. The tap-spacing for FSE is set to T/2 to conform with the literature [146].
57
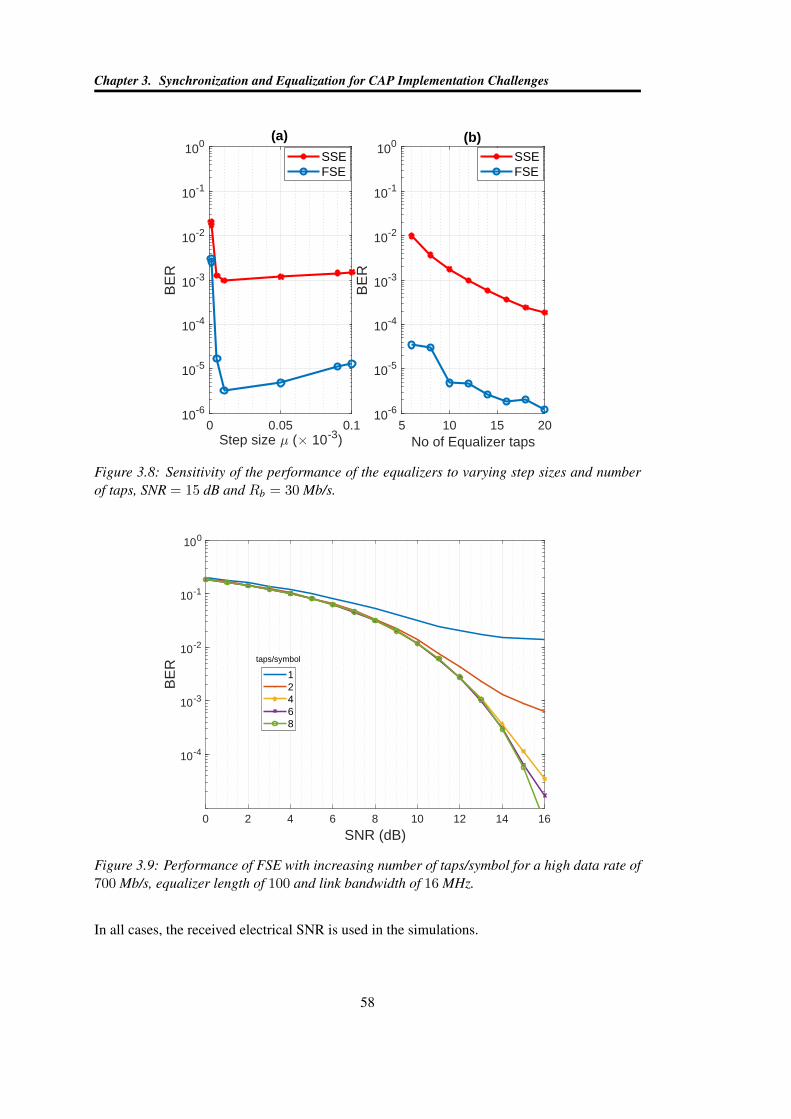
Chapter 3. Synchronization and Equalization for CAP Implementation Challenges
0 0.05 0.1Step size ( 10-3)
10-6
10-5
10-4
10-3
10-2
10-1
100
BE
R
(a)
SSEFSE
5 10 15 20No of Equalizer taps
10-6
10-5
10-4
10-3
10-2
10-1
100
BE
R
(b)SSEFSE
Figure 3.8: Sensitivity of the performance of the equalizers to varying step sizes and numberof taps, SNR = 15 dB and Rb = 30 Mb/s.
0 2 4 6 8 10 12 14 16
SNR (dB)
10-4
10-3
10-2
10-1
100
BE
R
12468
taps/symbol
Figure 3.9: Performance of FSE with increasing number of taps/symbol for a high data rate of700 Mb/s, equalizer length of 100 and link bandwidth of 16 MHz.
In all cases, the received electrical SNR is used in the simulations.
58
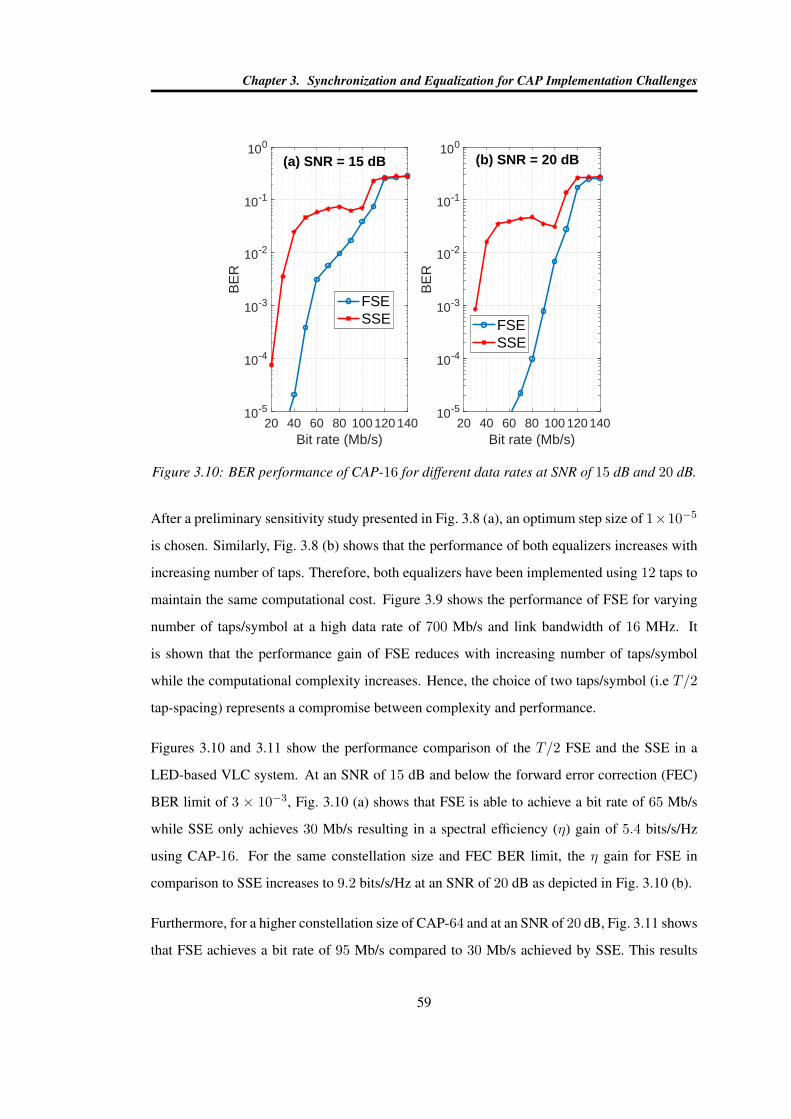
Chapter 3. Synchronization and Equalization for CAP Implementation Challenges
20 40 60 80 100 120 140Bit rate (Mb/s)
10-5
10-4
10-3
10-2
10-1
100
BE
R
(a) SNR = 15 dB
FSESSE
20 40 60 80 100 120 140Bit rate (Mb/s)
10-5
10-4
10-3
10-2
10-1
100
BE
R
(b) SNR = 20 dB
FSESSE
Figure 3.10: BER performance of CAP-16 for different data rates at SNR of 15 dB and 20 dB.
After a preliminary sensitivity study presented in Fig. 3.8 (a), an optimum step size of 1×10⁻⁵
is chosen. Similarly, Fig. 3.8 (b) shows that the performance of both equalizers increases with
increasing number of taps. Therefore, both equalizers have been implemented using 12 taps to
maintain the same computational cost. Figure 3.9 shows the performance of FSE for varying
number of taps/symbol at a high data rate of 700 Mb/s and link bandwidth of 16 MHz. It
is shown that the performance gain of FSE reduces with increasing number of taps/symbol
while the computational complexity increases. Hence, the choice of two taps/symbol (i.e T/2
tap-spacing) represents a compromise between complexity and performance.
Figures 3.10 and 3.11 show the performance comparison of the T/2 FSE and the SSE in a
LED-based VLC system. At an SNR of 15 dB and below the forward error correction (FEC)
BER limit of 3 × 10⁻³, Fig. 3.10 (a) shows that FSE is able to achieve a bit rate of 65 Mb/s
while SSE only achieves 30 Mb/s resulting in a spectral efficiency (η) gain of 5.4 bits/s/Hz
using CAP-16. For the same constellation size and FEC BER limit, the η gain for FSE in
comparison to SSE increases to 9.2 bits/s/Hz at an SNR of 20 dB as depicted in Fig. 3.10 (b).
Furthermore, for a higher constellation size of CAP-64 and at an SNR of 20 dB, Fig. 3.11 shows
that FSE achieves a bit rate of 95 Mb/s compared to 30 Mb/s achieved by SSE. This results
59
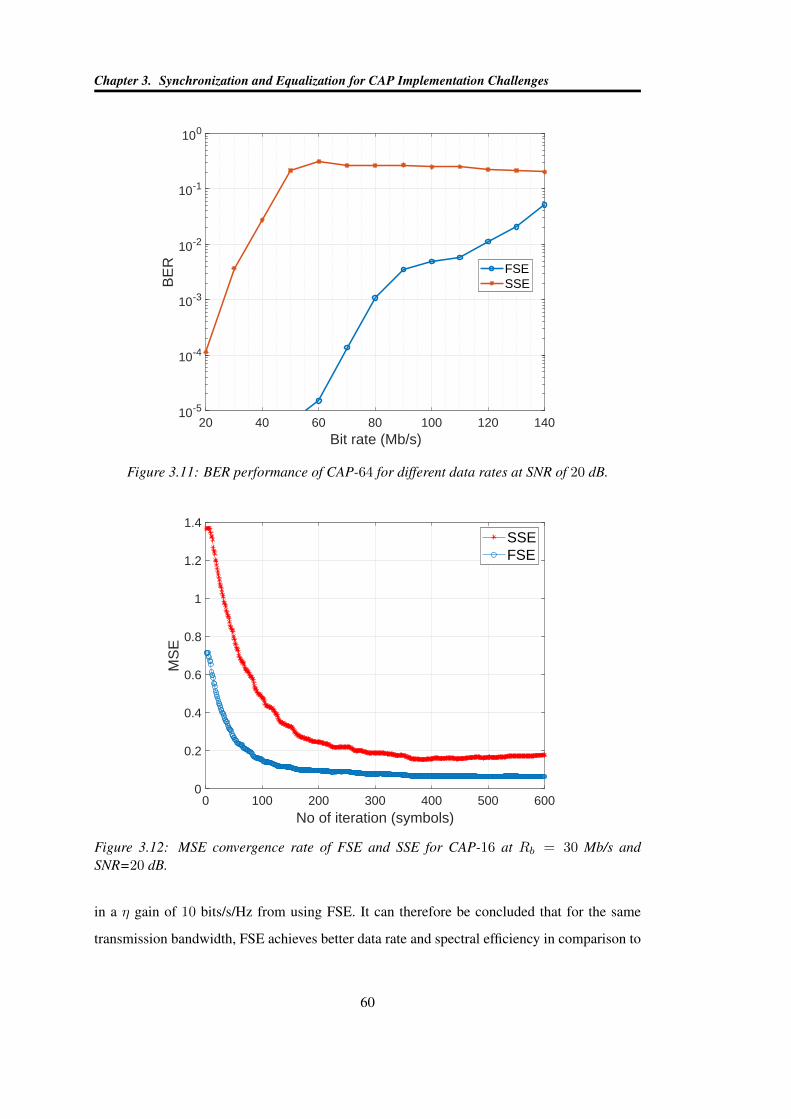
Chapter 3. Synchronization and Equalization for CAP Implementation Challenges
20 40 60 80 100 120 140Bit rate (Mb/s)
10-5
10-4
10-3
10-2
10-1
100
BE
R FSESSE
Figure 3.11: BER performance of CAP-64 for different data rates at SNR of 20 dB.
0 100 200 300 400 500 600No of iteration (symbols)
0
0.2
0.4
0.6
0.8
1
1.2
1.4
MS
E
SSEFSE
Figure 3.12: MSE convergence rate of FSE and SSE for CAP-16 at Rb = 30 Mb/s andSNR=20 dB.
in a η gain of 10 bits/s/Hz from using FSE. It can therefore be concluded that for the same
transmission bandwidth, FSE achieves better data rate and spectral efficiency in comparison to
60
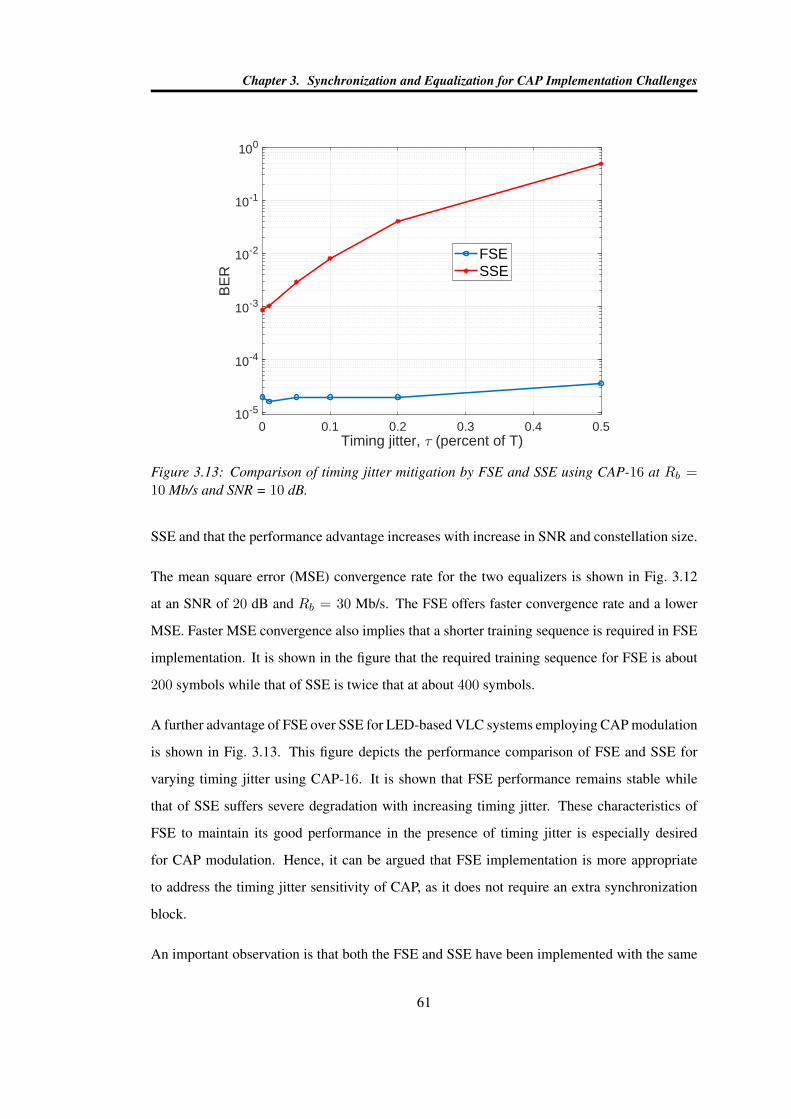
Chapter 3. Synchronization and Equalization for CAP Implementation Challenges
0 0.1 0.2 0.3 0.4 0.5Timing jitter, (percent of T)
10-5
10-4
10-3
10-2
10-1
100
BE
R
FSESSE
Figure 3.13: Comparison of timing jitter mitigation by FSE and SSE using CAP-16 at Rb =10 Mb/s and SNR = 10 dB.
SSE and that the performance advantage increases with increase in SNR and constellation size.
The mean square error (MSE) convergence rate for the two equalizers is shown in Fig. 3.12
at an SNR of 20 dB and Rb = 30 Mb/s. The FSE offers faster convergence rate and a lower
MSE. Faster MSE convergence also implies that a shorter training sequence is required in FSE
implementation. It is shown in the figure that the required training sequence for FSE is about
200 symbols while that of SSE is twice that at about 400 symbols.
A further advantage of FSE over SSE for LED-based VLC systems employing CAP modulation
is shown in Fig. 3.13. This figure depicts the performance comparison of FSE and SSE for
varying timing jitter using CAP-16. It is shown that FSE performance remains stable while
that of SSE suffers severe degradation with increasing timing jitter. These characteristics of
FSE to maintain its good performance in the presence of timing jitter is especially desired
for CAP modulation. Hence, it can be argued that FSE implementation is more appropriate
to address the timing jitter sensitivity of CAP, as it does not require an extra synchronization
block.
An important observation is that both the FSE and SSE have been implemented with the same
61
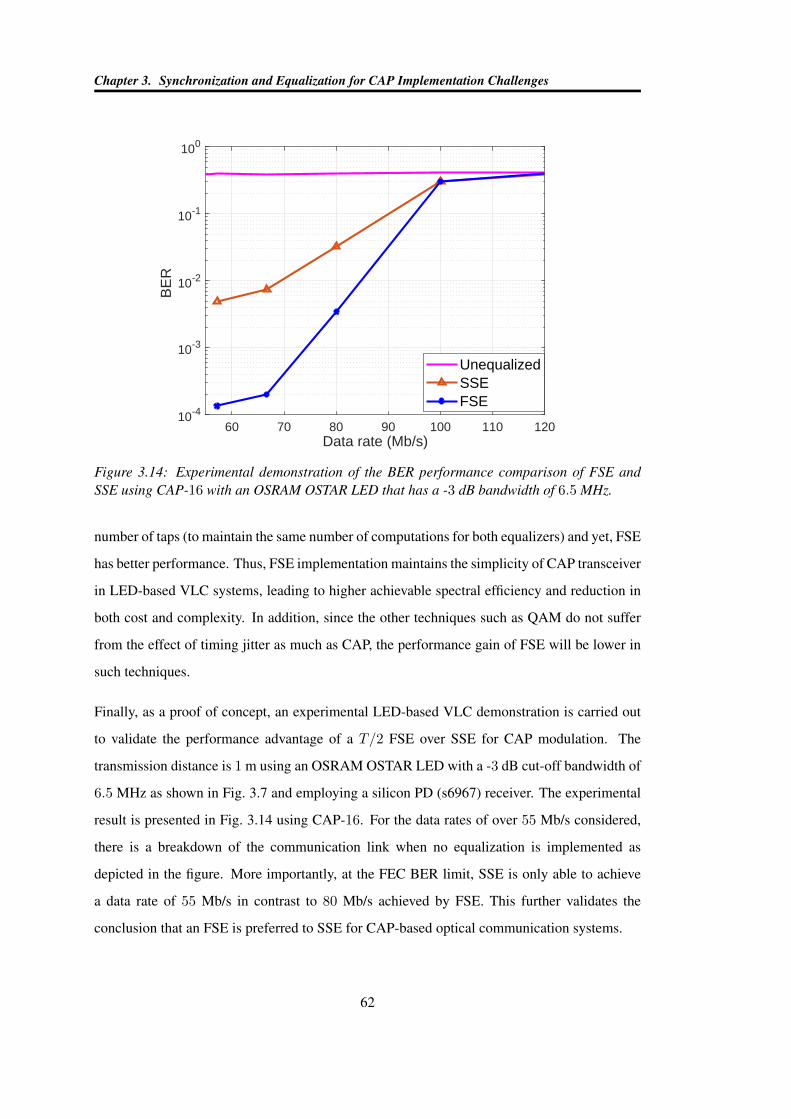
Chapter 3. Synchronization and Equalization for CAP Implementation Challenges
60 70 80 90 100 110 120Data rate (Mb/s)
10-4
10-3
10-2
10-1
100
BE
R
UnequalizedSSEFSE
Figure 3.14: Experimental demonstration of the BER performance comparison of FSE andSSE using CAP-16 with an OSRAM OSTAR LED that has a -3 dB bandwidth of 6.5 MHz.
number of taps (to maintain the same number of computations for both equalizers) and yet, FSE
has better performance. Thus, FSE implementation maintains the simplicity of CAP transceiver
in LED-based VLC systems, leading to higher achievable spectral efficiency and reduction in
both cost and complexity. In addition, since the other techniques such as QAM do not suffer
from the effect of timing jitter as much as CAP, the performance gain of FSE will be lower in
such techniques.
Finally, as a proof of concept, an experimental LED-based VLC demonstration is carried out
to validate the performance advantage of a T/2 FSE over SSE for CAP modulation. The
transmission distance is 1 m using an OSRAM OSTAR LED with a -3 dB cut-off bandwidth of
6.5 MHz as shown in Fig. 3.7 and employing a silicon PD (s6967) receiver. The experimental
result is presented in Fig. 3.14 using CAP-16. For the data rates of over 55 Mb/s considered,
there is a breakdown of the communication link when no equalization is implemented as
depicted in the figure. More importantly, at the FEC BER limit, SSE is only able to achieve
a data rate of 55 Mb/s in contrast to 80 Mb/s achieved by FSE. This further validates the
conclusion that an FSE is preferred to SSE for CAP-based optical communication systems.
62
Chapter 3. Synchronization and Equalization for CAP Implementation Challenges
3.3 Summary of Chapter 3
Two novel techniques that address the effects of timing jitter and limited LED bandwidth,
encountered by CAP-based optical communication systems, have been presented along with
evaluation of their performances. It is shown that the ‘CAP filter’ synchronization technique
is able to correct for the effect of timing jitter suffered by the CAP modulation scheme. For
the 25% timing jitter considered in the simulation, the ‘CAP filter’ synchronization technique
is shown to completely correct for the effect of the timing jitter. To reduce complexity, it is
shown that both the timing jitter and the limited LED bandwidth effects can be addressed with
the use of FSE thereby eliminating the need for a separate synchronization block. At the FEC
BER limit of 3×10⁻³, it is experimentally demonstrated that the FSE achieves a 45% data rate
improvement when compared to the SSE. Furthermore, it is shown that the performance of FSE
remain constant while that of SSE suffers degradation as the timing jitter increases. Additional
techniques that improve on the spectral and energy efficiency of the CAP modulation scheme
are developed and presented in subsequent chapters of the thesis.
63
Chapter 4
Spatial-Multiplexing with CAP (SMux-CAP) in
VLC Systems
Due to the implementation challenges of CAP, the main focus in the literature is the designing
of various equalization techniques to improve its throughput in VLC applications [21, 126–
128, 145]. However, these equalization techniques significantly increase the complexity of
the resulting system. Therefore, a novel approach is proposed in this chapter that exploits
the spatial domain to improve the spectral efficiency and BER performance of CAP, while
maintaining its low-complexity transceiver.
Multiple LEDs are often deployed to achieve sufficient illumination in VLC, due to the limited
luminous flux of the individual LED. The availability of these multiple LEDs have been
exploited in the literature to achieve improved throughput using MIMO techniques [153].
Therefore, this chapter exploits the use of spatial domain to realise diversity and multiplexing
gain for CAP modulation scheme in VLC applications. Spatial multiplexed CAP (SMux-CAP),
which simultaneously transmit streams of independent CAP signals through multiple LEDs, is
developed to realise significant improvement in the data rate of conventional CAP. Repetitive
coded CAP (RC-CAP), with parallel transmission of the same CAP signal over multiple LEDs,
is also proposed to improve the BER performance of CAP through spatial diversity. The
proposed techniques are novel implementations of CAP in MIMO systems and demonstrate
its potential as a suitable modulation technique for VLC applications.
The BER performance analysis of the proposed schemes are derived based on the optimum
maximum likelihood (ML) detector. However, the complexity of ML detection scheme
increases exponentially with increase in the number of transmitter, Nt and symbol modulation
64
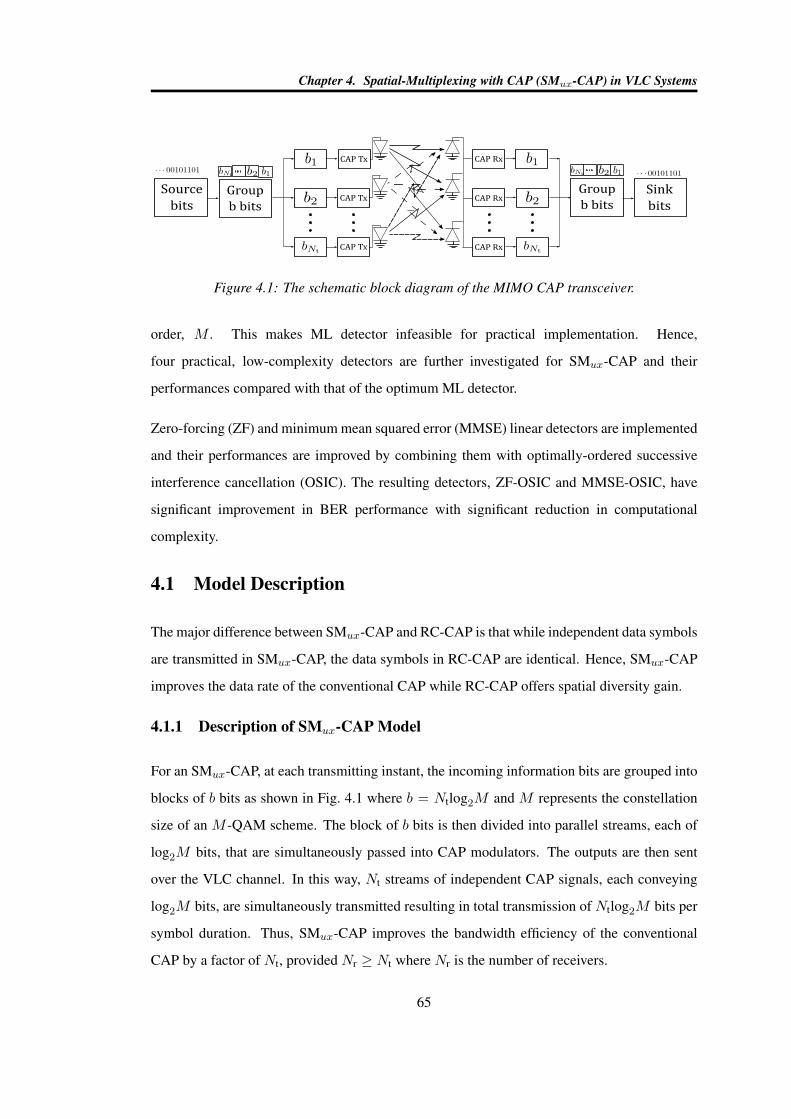
Chapter 4. Spatial-Multiplexing with CAP (SMux-CAP) in VLC Systems
Source
bits
Group
b bits
Group
b bits
Sink
bits
CAP Tx CAP Rx
CAP Rx
CAP Rx
CAP Tx
CAP Tx
Figure 4.1: The schematic block diagram of the MIMO CAP transceiver.
order, M . This makes ML detector infeasible for practical implementation. Hence,
four practical, low-complexity detectors are further investigated for SMux-CAP and their
performances compared with that of the optimum ML detector.
Zero-forcing (ZF) and minimum mean squared error (MMSE) linear detectors are implemented
and their performances are improved by combining them with optimally-ordered successive
interference cancellation (OSIC). The resulting detectors, ZF-OSIC and MMSE-OSIC, have
significant improvement in BER performance with significant reduction in computational
complexity.
4.1 Model Description
The major difference between SMux-CAP and RC-CAP is that while independent data symbols
are transmitted in SMux-CAP, the data symbols in RC-CAP are identical. Hence, SMux-CAP
improves the data rate of the conventional CAP while RC-CAP offers spatial diversity gain.
4.1.1 Description of SMux-CAP Model
For an SMux-CAP, at each transmitting instant, the incoming information bits are grouped into
blocks of b bits as shown in Fig. 4.1 where b = Ntlog2M and M represents the constellation
size of an M -QAM scheme. The block of b bits is then divided into parallel streams, each of
log2M bits, that are simultaneously passed into CAP modulators. The outputs are then sent
over the VLC channel. In this way, Nt streams of independent CAP signals, each conveying
log2M bits, are simultaneously transmitted resulting in total transmission of Ntlog2M bits per
symbol duration. Thus, SMux-CAP improves the bandwidth efficiency of the conventional
CAP by a factor of Nt, provided Nr ≥ Nt where Nr is the number of receivers.
65
Chapter 4. Spatial-Multiplexing with CAP (SMux-CAP) in VLC Systems
4.1.2 Description of RC-CAP Model
Repetitive coding (RC) is a MIMO technique in which the same symbol is simultaneously
transmitted over multiple LEDs. This results in full transmit diversity of Nt in optical MIMO
systems employing IM/DD approach [154]. For RC-CAP, identical CAP signals are transmitted
through the Nt LEDs which significantly improve the BER of the conventional CAP. Due to
the transmission of identical symbols in RC-CAP, its detection is simpler compared to that of
SMux-CAP. As will be shown, its BER expression can be derived as a scaled version of that of
the conventional CAP.
4.2 BER Performance Analysis
The received electrical signal can be written, for an Nr × Nt MIMO configuration shown in
Fig. 4.1, as:
y = RKβHx + w (4.1)
where y is an Nr × 1 received signal vector, H is an arbitrary Nr × Nt channel matrix with
component hnr representing the column vector of channel gains at the nthr receiver, x is anNt×1
transmitted vector and w is an Nr × 1 noise components with each component having zero
mean and double-sided power spectral density, N0/2. Both Nt and Nr represent the number of
transmitting LEDs and the number of receiving PDs, respectively. The task of the detector is to
recover the multiple transmitted symbols from the received multiplexed signal at each PD. The
BER performance of the detectors have been derived by considering LOS propagation under
the assumption that channel state information (CSI) is perfectly known at the receiver. The CSI
can be acquired with the aid of a training sequence [155].
4.2.1 BER Expression for SMux-CAP
At the nthr receiver, given that symbol xm has been transmitted, the received electrical signal
can be expressed as:
ynr(t) = rmnr(t) + wnr(t) nr = 1, 2, · · · , Nr (4.2)
66
Chapter 4. Spatial-Multiplexing with CAP (SMux-CAP) in VLC Systems
where rmnr(t) = RKβhTnr
xm(t). Hence, the output of SMux-CAP demodulators is written as:
y = rm + w (4.3)
where ynr , rmnr
and wnr are the components of vectors y, rm and w, respectively.
The optimum SMux-CAP detector decides on the estimated symbol using ML detection
criterion [156, p. 242–247]. This is because the xmMNt
m=1 are equiprobable with p(xm) =
1/MNt . Thus, the SMux-CAP optimum detector decides on the xm that maximizes the
probability of y conditioned on rm as:
xm = arg maxm
p(y, rm) (4.4)
where the conditional PDF, given the AWGN corrupted channel, is expressed as:
p(y, rm) =1
(2πN0)Nr/2exp
[−
Nr∑nr=1
∣∣ynr − rmnr
∣∣22N0
]
=1
(2πN0)Nr/2exp
[−1
2N0||y − rm||2F
](4.5)
where ‖ · ‖F is the Frobenius norm. The ML detection criterion reduces to finding the xm that
results in the minimum Euclidean distance (MED), i.e.
xm = arg minm
D(y, rm) (4.6)
and the distance metrics is given by:
D(y, rm) = ||y − rm||2F (4.7)
In the case of correct decision, the decision metrics is given as
D(y, rm) = ||w||2F (4.8)
otherwise,
D(y, rm) = ||rm − rm + w||2F (4.9)
Therefore, the pairwise error probability (PEP) of SMux-CAP, which is defined as the
probability that the SMux-CAP detector decides in favour of vector x given that x has actually
67
Chapter 4. Spatial-Multiplexing with CAP (SMux-CAP) in VLC Systems
BERSMux-CAP ≤1
MNt log2(MNt)
MNt∑m=1
MNt∑m=1
NH(bm, bm)
Q
√(RKβ)2
2N0||H (xm − xm)||2F
. (4.11)
BERRC-CAP ≤1
M log2(M)
M∑m=1
M∑m=1
NH(bm, bm)
Q
√√√√√(RKβ)2
2N0
Nr∑nr=1
(Nt∑nt=1
hnrnt
)2
|xm − xm|
. (4.12)
been transmitted, can be obtained as:
PEPSMux-CAP = p(x→ x|H)
= p(D(y, rm) > D(y, rm))
= Q
√(RKβ)2
2N0||H (xm − xm)||2F
. (4.10)
An upper bound BER expression, shown in (4.11), is then derived for SMux-CAP from (4.10)
by considering all possible MNt signal combinations using the union bound technique [156,
p. 261–262], [157]. The NH(bm, bm) in (4.11) represents the number of bit in error when the
receiver decides for the symbol xm instead of the transmitted symbol xm.
4.2.2 BER Expression for RC-CAP
For RC-CAP, since x1 = x2 = · · · = xNt , (xm − xm) = (xm − xm)1Nt×1 where 1Nt×1
is an Nt × 1 vector that has all its entries to be unity. Thus, an upper bound for the BER of
RC-CAP can be obtained from (4.11) as shown in (4.12).
However, the upper bound expression in (4.12) can be reduced to an approximation by noting
that the argument of the Q-function is the transmitted SNR of a single-input single-output
(SISO) system scaled by the summation of the channel gains. Therefore, substituting for the
SNR (γ) in the BER expression for a SISO M -ary square QAM shown in (4.13) [158], an
approximation for the BER of RC-CAP can be obtained as expressed in (4.14). The erfc(·) is
68
Chapter 4. Spatial-Multiplexing with CAP (SMux-CAP) in VLC Systems
the cumulative error function and is related to the Q-function by Q(x) = erfc( x√2).
BER ∼=√M − 1√
M log2√M
erfc
√3log2√M · γ
2(M − 1)
. (4.13)
BERRC-CAP ∼=2(√M − 1)√
M log2√MQ
√√√√√ 3(RKβ)2
(M − 1)N0
Nr∑nr=1
(Nt∑nt=1
hnrnt
)2 . (4.14)
4.3 Low Complexity Detection Algorithms for SMux-CAP
The ML detector (MLD) derived in section 4.2.1 is the optimum detector for SMux-CAP.
However, the MLD computes the MED between each received symbol and all the possible
MNt symbols in order to make a decision. Thus, its computational complexity is exponential
of the order MNt which makes it infeasible for large number of transmitting LEDs or high
constellation orders. Hence, four alternative low-complexity detection schemes are presented
in this section.
4.3.1 Zero Forcing (ZF) Detector
Zero forcing (ZF) is a linear detection scheme that seeks to suppress the ISI between the
received multiplexed symbols by forcing the ISI to zero. If the effect of noise is ignored, the
linear detection problem represented by (4.1) is solved by the ZF scheme. The ZF solution is
realized by using the Moore-Penrose pseudo inverse of the channel matrix which is represented
as [159]:
GZF = H† = (HTH)−1HT (4.15)
where (·)† represents the Moore-Penrose pseudo-inverse operation. Using (4.15), the output of
the ZF detector can be expressed as:
x = Gy = αx + w (4.16)
where α is one and w = Gw. A decision can then be made on x by mapping it to the nearest
level in the M -ary QAM constellation set. The post-detection SNR of each symbol at the
69
Chapter 4. Spatial-Multiplexing with CAP (SMux-CAP) in VLC Systems
output of the ZF detector is obtained from (4.16) as:
γZF,nt =E[xxT
]ntnt
E [wwT ]ntnt
=Es/N0Nt
[HTH]−1ntnt
, nt = 1, 2, . . . , Nt (4.17)
where [·]ntntdenotes the (nt, nt) element of [·] and Es is the average transmitted electrical
energy per symbol. Therefore, an approximate BER expression can be obtained for SMux-CAP
with ZF detector by substituting (4.17) for the SNR in the AWGN BER expression of CAP.
Hence, using (4.13), the approximate BER expression for SMux-CAP with ZF detector is
derived as:
BERZF ∼=2(√M − 1)
Nt√M log2
√M
Nt∑nt=1
Q
(√3γZF,nt
(M − 1)
). (4.18)
The performance of ZF is impacted in cases where the channel matrix is ill-conditioned. It is
clear from (4.17) that small eigenvalues of HTH will reduce the post-detection SNR due to
noise amplification. This will lead to error in the detection process. Therefore, the MMSE
detection scheme addresses this ZF shortcoming by including the noise term in its design
criteria.
4.3.2 Minimium Mean Square Error (MMSE) Detector
The MMSE detection scheme minimizes the error between the output of the linear detector
and the actually transmitted symbol [160]. It seeks to improve on the performance of ZF by
including the noise variance in its design. Thus, similar to ZF, (4.15), (4.17) and (4.18) can be
respectively expressed for MMSE as :
GMMSE = (HTH + γ−1s INt)−1HT , (4.19)
γMMSE,nt =γ−1s[
HTH + γ−1s INt
]−1ntnt
− 1, nt = 1, 2, . . . , Nt (4.20)
and
BERMMSE ∼=2(√M − 1)
Nt√M log2
√M
Nt∑nt=1
Q
(√3γMMSE,nt
(M − 1)
). (4.21)
where γs = Es/N0Nt.
70
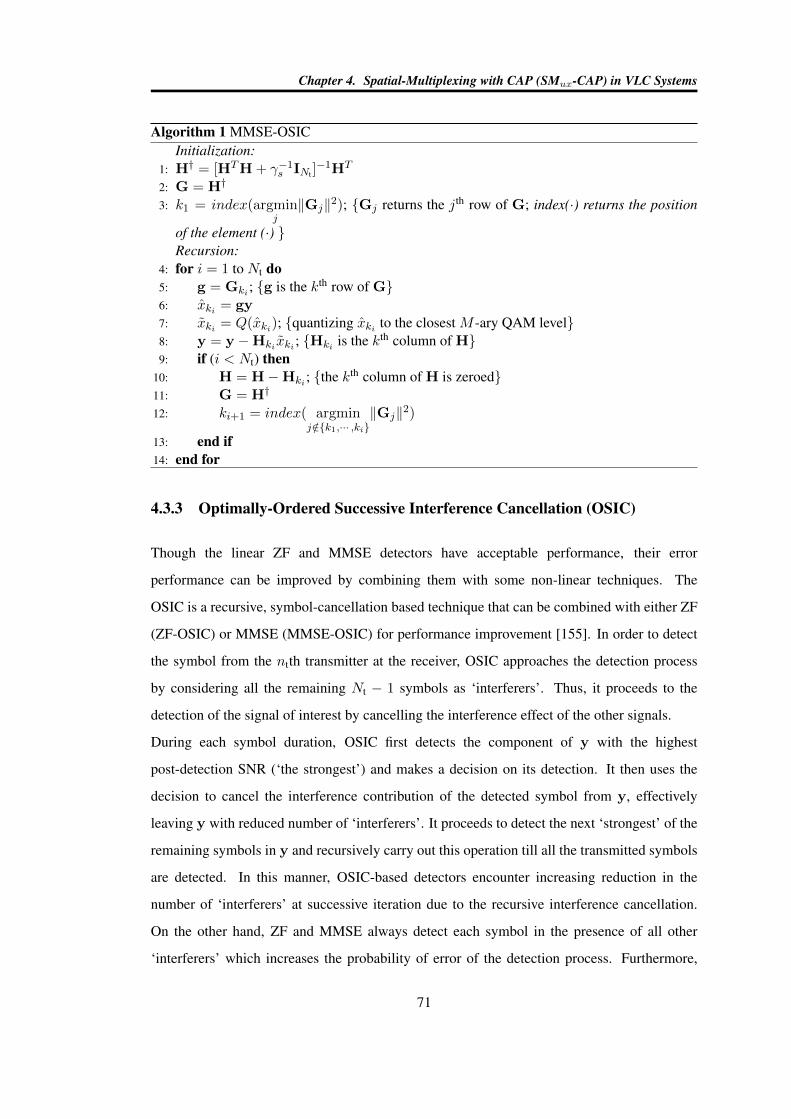
Chapter 4. Spatial-Multiplexing with CAP (SMux-CAP) in VLC Systems
Algorithm 1 MMSE-OSICInitialization:
1: H† = [HTH + γ−1s INt ]−1HT
2: G = H†
3: k1 = index(argminj‖Gj‖2); Gj returns the jth row of G; index(·) returns the position
of the element (·) Recursion:
4: for i = 1 to Nt do5: g = Gki ; g is the kth row of G6: xki = gy7: xki = Q(xki); quantizing xki to the closest M -ary QAM level8: y = y −Hki xki ; Hki is the kth column of H9: if (i < Nt) then
10: H = H−Hki ; the kth column of H is zeroed11: G = H†
12: ki+1 = index( argminj /∈k1,··· ,ki
‖Gj‖2)
13: end if14: end for
4.3.3 Optimally-Ordered Successive Interference Cancellation (OSIC)
Though the linear ZF and MMSE detectors have acceptable performance, their error
performance can be improved by combining them with some non-linear techniques. The
OSIC is a recursive, symbol-cancellation based technique that can be combined with either ZF
(ZF-OSIC) or MMSE (MMSE-OSIC) for performance improvement [155]. In order to detect
the symbol from the ntth transmitter at the receiver, OSIC approaches the detection process
by considering all the remaining Nt − 1 symbols as ‘interferers’. Thus, it proceeds to the
detection of the signal of interest by cancelling the interference effect of the other signals.
During each symbol duration, OSIC first detects the component of y with the highest
post-detection SNR (‘the strongest’) and makes a decision on its detection. It then uses the
decision to cancel the interference contribution of the detected symbol from y, effectively
leaving y with reduced number of ‘interferers’. It proceeds to detect the next ‘strongest’ of the
remaining symbols in y and recursively carry out this operation till all the transmitted symbols
are detected. In this manner, OSIC-based detectors encounter increasing reduction in the
number of ‘interferers’ at successive iteration due to the recursive interference cancellation.
On the other hand, ZF and MMSE always detect each symbol in the presence of all other
‘interferers’ which increases the probability of error of the detection process. Furthermore,
71
Chapter 4. Spatial-Multiplexing with CAP (SMux-CAP) in VLC Systems
Table 4.1: Simulation parameters for the channel configuration.
TX coordinates (m)LED1 - (1.25,1.25,3), LED2 - (1.25,3.75,3),LED3 - (3.75,1.25,3), LED4 - (3.75,3.75,3)
H1 coordinates (m)PD1 - (2.4,2.4,0), PD2 - (2.4,2.6,0),PD3 - (2.6,2.4,0), PD4 - (2.6,2.6,0)
H2 coordinates (m)PD1 - (1.2,1.2,0), PD2 - (1.2,3.8,0),PD3 - (3.8,1.2,0), PD4 - (3.8,3.8,0)
OSIC avoids error propagation by ensuring the symbol with the highest probability of being
correctly detected (symbol with the highest post-detection SNR) is detected at each iteration.
The MMSE-OSIC algorithm is given in algorithm 1 from which its ZF version can easily be
derived by discarding the noise term.
4.4 Simulation Results and Discussions
In the results presented in this section, the electrical SNR per bit is defined as γb = (RKβ)2ηN0
where (RKβ)2 denotes the average received electrical energy per symbol, Es and
E∀tx2(t) = 1. The spectral efficiency, η, is log2(M
Nt) and log2M for SMux-CAP and
RC-CAP, respectively. For a fair comparison, the emitted intensity from each transmitting
LEDs has been scaled by a factor Nt to preserve the total transmit power for the two schemes,
irrespective of the number of LEDs employed.
4.4.1 Performance Comparison of SMux-CAP and RC-CAP
Two receiver position arrays are investigated for the proposed MIMO techniques. The first
array, H1, is realised by symmetrical arrangement of the PDs at the centre of the room. The
second array is realised by direct placement of the PDs under the LEDs to maximize the
received LOS signal. The channel gains corresponding to the two arrays are obtained using
the ray tracing channel modelling technique in a room that is 3 m in height and 5 m in length
and width [161]. The LED half angle, ϕ1/2 is 60, the Field of view of PD is 85 while the
PD area, APD is given as 1 cm2. Other configuration parameters are given in Table 4.1. The
72
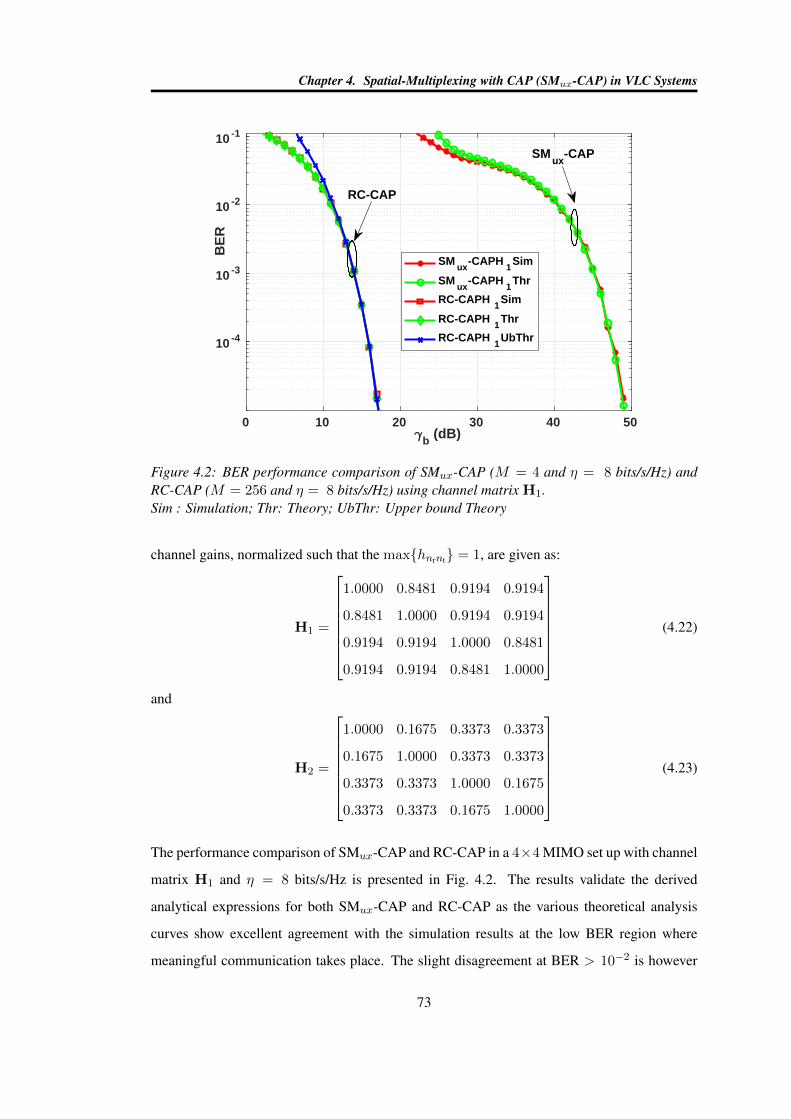
Chapter 4. Spatial-Multiplexing with CAP (SMux-CAP) in VLC Systems
0 10 20 30 40 50b (dB)
10 -4
10 -3
10 -2
10 -1
BE
R
SMux
-CAPH1Sim
SMux
-CAPH1Thr
RC-CAPH1Sim
RC-CAPH1Thr
RC-CAPH1UbThr
SMux
-CAP
RC-CAP
Figure 4.2: BER performance comparison of SMux-CAP (M = 4 and η = 8 bits/s/Hz) andRC-CAP (M = 256 and η = 8 bits/s/Hz) using channel matrix H1.Sim : Simulation; Thr: Theory; UbThr: Upper bound Theory
channel gains, normalized such that the maxhnrnt = 1, are given as:
H1 =
1.0000 0.8481 0.9194 0.9194
0.8481 1.0000 0.9194 0.9194
0.9194 0.9194 1.0000 0.8481
0.9194 0.9194 0.8481 1.0000
(4.22)
and
H2 =
1.0000 0.1675 0.3373 0.3373
0.1675 1.0000 0.3373 0.3373
0.3373 0.3373 1.0000 0.1675
0.3373 0.3373 0.1675 1.0000
(4.23)
The performance comparison of SMux-CAP and RC-CAP in a 4×4 MIMO set up with channel
matrix H1 and η = 8 bits/s/Hz is presented in Fig. 4.2. The results validate the derived
analytical expressions for both SMux-CAP and RC-CAP as the various theoretical analysis
curves show excellent agreement with the simulation results at the low BER region where
meaningful communication takes place. The slight disagreement at BER > 10−2 is however
73
Chapter 4. Spatial-Multiplexing with CAP (SMux-CAP) in VLC Systems
due to the union bound technique adopted in the analytical derivation. The SNR required for
SMux-CAP to achieve the spectral efficiency of 8 bits/s/Hz, at a representative BER of 10−4, is
48.5 dB for the channel configuration considered. This high SNR is due to the high similarity
of the channel gains at this receiver position as evident from (4.22). Thus, SMux-CAP suffers
BER degradation since it requires sufficient channel gain dissimilarity to separate the received
signals.
On the other hand, RC-CAP benefits from spatial diversity due to the high channel gains
similarity. It achieves a representative BER of 10−4 at an SNR of 16 dB. The RC-CAP BER
performance improvement due to similarity in the channel gains can be explained by the factor∑Ntnt=1 hnrnt in (4.14). This factor increases with increasing channel gain similarity. This
in turn increases the argument of the Q-function leading to a reduction in BER. Also, the
RC-CAP performance gain can be viewed from the fact that it assigns the total transmit power
to the transmitted symbol while SMuxCAP equally divide the power among all the transmitted
symbols. Hence, it can be concluded that RC-CAP is a better choice than SMux-CAP in highly
correlated channels. However, to achieve the same spectral efficiency as SMux-CAP with M =
4, RC-CAP requires a much higher constellation order of M = 256 which translates to higher
PAPR at the transmitter [122]. The foregoing depicts the trade-off between multiplexing and
diversity techniques for MIMO CAP in VLC applications in terms of BER performance, power
penalty and spectral efficiency.
When the PDs are directly placed under the LEDs, the LOS gains become pronounced leading
to highly dissimilar channel gains and a nearly diagonal channel matrix as shown in (4.23).
Thus in Fig. 4.3, RC-CAP loses some of its diversity gain as it achieves the representative
BER of 10−4 at an SNR of 22 dB. This is a power penalty of 6 dB in comparison to the
performance in H1 and is due to the channel dissimilarity as previously discussed. However,
SMux-CAP benefits from the channel dissimilarity to improve its performance by achieving
the representative BER of 10−4 at an SNR of 14.5 dB. Thus, while still maintaining its
spectral efficiency, SMux-CAP achieves a substantial SNR gain of 34 dB in comparison to its
performance in H1. Thus, it can be inferred that SMux-CAP should be deployed in channels
with dissimilar gains.
It is not always possible to achieve a dissimilar channel gains due to receiver mobility.
74
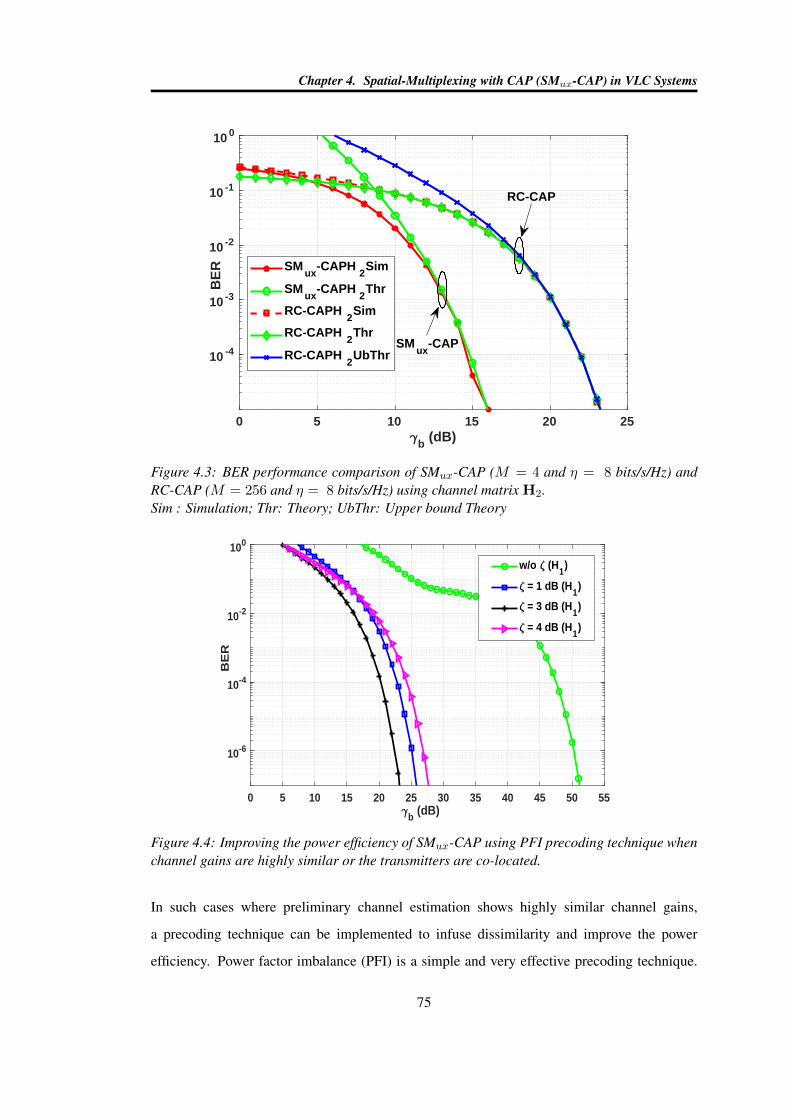
Chapter 4. Spatial-Multiplexing with CAP (SMux-CAP) in VLC Systems
0 5 10 15 20 25
b (dB)
10 -4
10 -3
10 -2
10 -1
10 0
BE
R SMux
-CAPH2Sim
SMux
-CAPH2Thr
RC-CAPH2Sim
RC-CAPH2Thr
RC-CAPH2UbThr
SMux
-CAP
RC-CAP
Figure 4.3: BER performance comparison of SMux-CAP (M = 4 and η = 8 bits/s/Hz) andRC-CAP (M = 256 and η = 8 bits/s/Hz) using channel matrix H2.Sim : Simulation; Thr: Theory; UbThr: Upper bound Theory
0 5 10 15 20 25 30 35 40 45 50 55
b (dB)
10-6
10-4
10-2
100
BE
R
w/o (H1)
= 1 dB (H1)
= 3 dB (H1)
= 4 dB (H1)
Figure 4.4: Improving the power efficiency of SMux-CAP using PFI precoding technique whenchannel gains are highly similar or the transmitters are co-located.
In such cases where preliminary channel estimation shows highly similar channel gains,
a precoding technique can be implemented to infuse dissimilarity and improve the power
efficiency. Power factor imbalance (PFI) is a simple and very effective precoding technique.
75
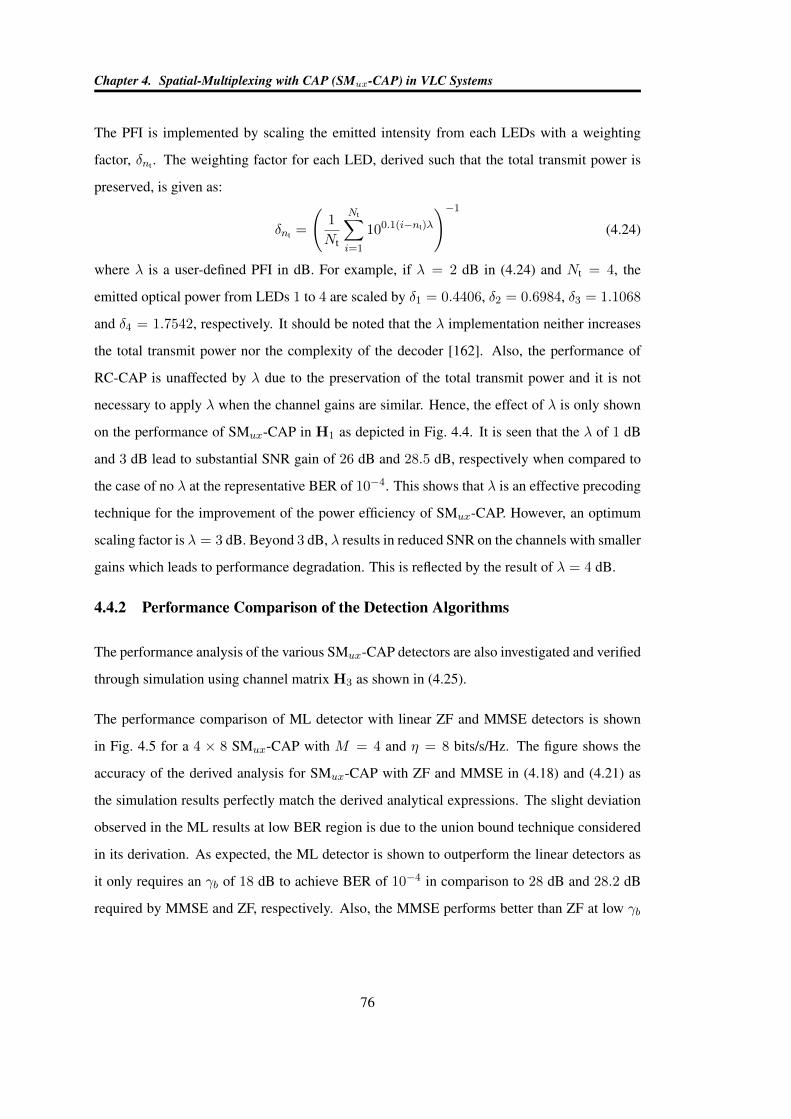
Chapter 4. Spatial-Multiplexing with CAP (SMux-CAP) in VLC Systems
The PFI is implemented by scaling the emitted intensity from each LEDs with a weighting
factor, δnt . The weighting factor for each LED, derived such that the total transmit power is
preserved, is given as:
δnt =
(1
Nt
Nt∑i=1
100.1(i−nt)λ
)−1(4.24)
where λ is a user-defined PFI in dB. For example, if λ = 2 dB in (4.24) and Nt = 4, the
emitted optical power from LEDs 1 to 4 are scaled by δ1 = 0.4406, δ2 = 0.6984, δ3 = 1.1068
and δ4 = 1.7542, respectively. It should be noted that the λ implementation neither increases
the total transmit power nor the complexity of the decoder [162]. Also, the performance of
RC-CAP is unaffected by λ due to the preservation of the total transmit power and it is not
necessary to apply λ when the channel gains are similar. Hence, the effect of λ is only shown
on the performance of SMux-CAP in H1 as depicted in Fig. 4.4. It is seen that the λ of 1 dB
and 3 dB lead to substantial SNR gain of 26 dB and 28.5 dB, respectively when compared to
the case of no λ at the representative BER of 10−4. This shows that λ is an effective precoding
technique for the improvement of the power efficiency of SMux-CAP. However, an optimum
scaling factor is λ = 3 dB. Beyond 3 dB, λ results in reduced SNR on the channels with smaller
gains which leads to performance degradation. This is reflected by the result of λ = 4 dB.
4.4.2 Performance Comparison of the Detection Algorithms
The performance analysis of the various SMux-CAP detectors are also investigated and verified
through simulation using channel matrix H3 as shown in (4.25).
The performance comparison of ML detector with linear ZF and MMSE detectors is shown
in Fig. 4.5 for a 4 × 8 SMux-CAP with M = 4 and η = 8 bits/s/Hz. The figure shows the
accuracy of the derived analysis for SMux-CAP with ZF and MMSE in (4.18) and (4.21) as
the simulation results perfectly match the derived analytical expressions. The slight deviation
observed in the ML results at low BER region is due to the union bound technique considered
in its derivation. As expected, the ML detector is shown to outperform the linear detectors as
it only requires an γb of 18 dB to achieve BER of 10−4 in comparison to 28 dB and 28.2 dB
required by MMSE and ZF, respectively. Also, the MMSE performs better than ZF at low γb
76
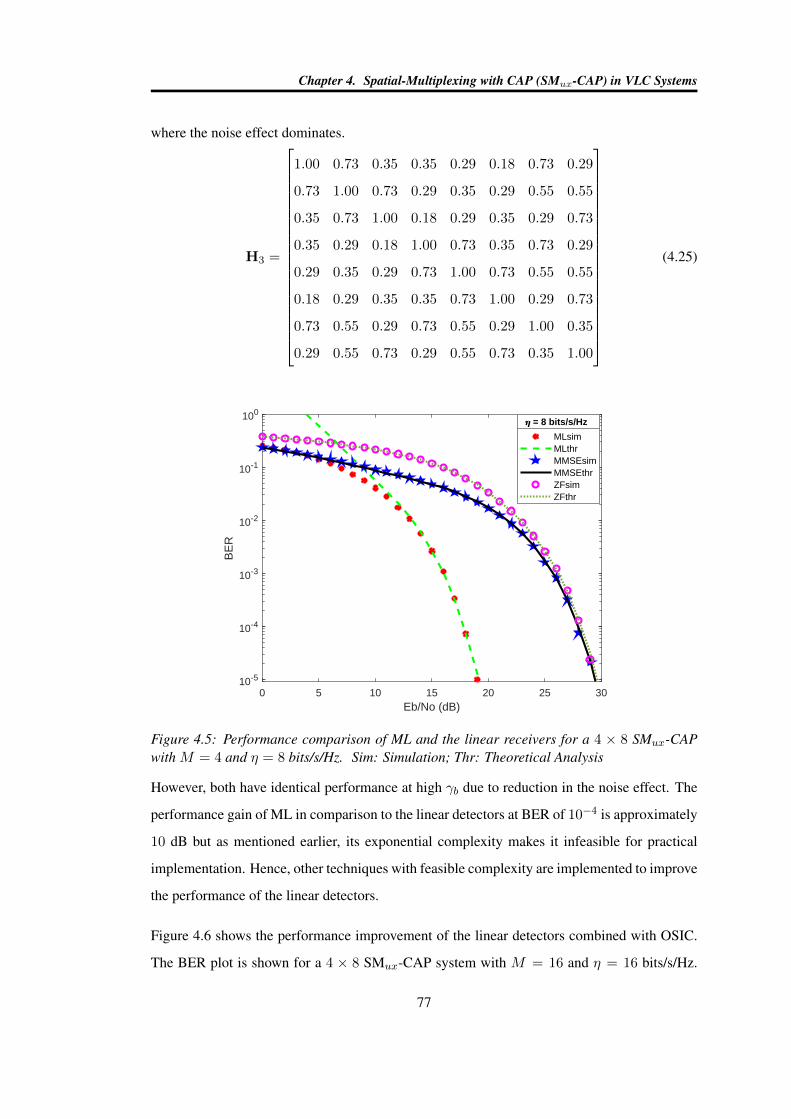
Chapter 4. Spatial-Multiplexing with CAP (SMux-CAP) in VLC Systems
where the noise effect dominates.
H3 =
1.00 0.73 0.35 0.35 0.29 0.18 0.73 0.29
0.73 1.00 0.73 0.29 0.35 0.29 0.55 0.55
0.35 0.73 1.00 0.18 0.29 0.35 0.29 0.73
0.35 0.29 0.18 1.00 0.73 0.35 0.73 0.29
0.29 0.35 0.29 0.73 1.00 0.73 0.55 0.55
0.18 0.29 0.35 0.35 0.73 1.00 0.29 0.73
0.73 0.55 0.29 0.73 0.55 0.29 1.00 0.35
0.29 0.55 0.73 0.29 0.55 0.73 0.35 1.00
(4.25)
0 5 10 15 20 25 30Eb/No (dB)
10-5
10-4
10-3
10-2
10-1
100
BE
R
MLsimMLthrMMSEsimMMSEthrZFsimZFthr
= 8 bits/s/Hz
Figure 4.5: Performance comparison of ML and the linear receivers for a 4 × 8 SMux-CAPwith M = 4 and η = 8 bits/s/Hz. Sim: Simulation; Thr: Theoretical Analysis
However, both have identical performance at high γb due to reduction in the noise effect. The
performance gain of ML in comparison to the linear detectors at BER of 10−4 is approximately
10 dB but as mentioned earlier, its exponential complexity makes it infeasible for practical
implementation. Hence, other techniques with feasible complexity are implemented to improve
the performance of the linear detectors.
Figure 4.6 shows the performance improvement of the linear detectors combined with OSIC.
The BER plot is shown for a 4 × 8 SMux-CAP system with M = 16 and η = 16 bits/s/Hz.
77
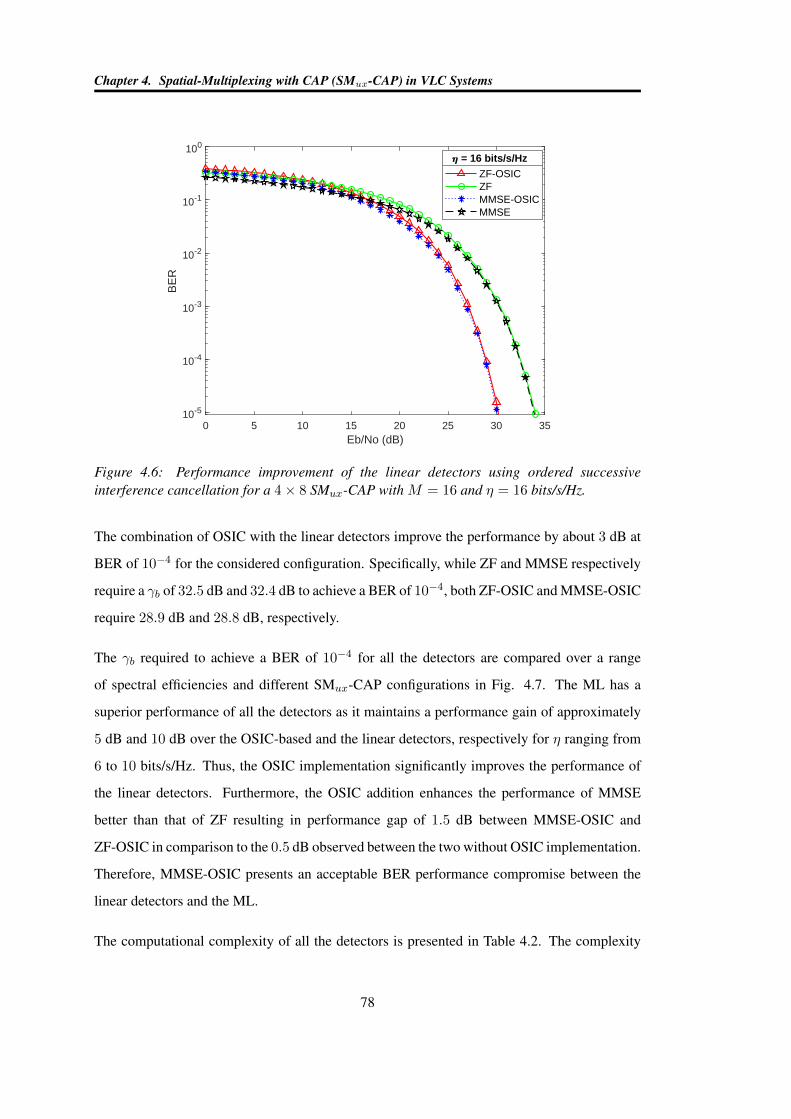
Chapter 4. Spatial-Multiplexing with CAP (SMux-CAP) in VLC Systems
0 5 10 15 20 25 30 35Eb/No (dB)
10-5
10-4
10-3
10-2
10-1
100
BE
RZF-OSICZFMMSE-OSICMMSE
= 16 bits/s/Hz
Figure 4.6: Performance improvement of the linear detectors using ordered successiveinterference cancellation for a 4× 8 SMux-CAP with M = 16 and η = 16 bits/s/Hz.
The combination of OSIC with the linear detectors improve the performance by about 3 dB at
BER of 10−4 for the considered configuration. Specifically, while ZF and MMSE respectively
require a γb of 32.5 dB and 32.4 dB to achieve a BER of 10−4, both ZF-OSIC and MMSE-OSIC
require 28.9 dB and 28.8 dB, respectively.
The γb required to achieve a BER of 10−4 for all the detectors are compared over a range
of spectral efficiencies and different SMux-CAP configurations in Fig. 4.7. The ML has a
superior performance of all the detectors as it maintains a performance gain of approximately
5 dB and 10 dB over the OSIC-based and the linear detectors, respectively for η ranging from
6 to 10 bits/s/Hz. Thus, the OSIC implementation significantly improves the performance of
the linear detectors. Furthermore, the OSIC addition enhances the performance of MMSE
better than that of ZF resulting in performance gap of 1.5 dB between MMSE-OSIC and
ZF-OSIC in comparison to the 0.5 dB observed between the two without OSIC implementation.
Therefore, MMSE-OSIC presents an acceptable BER performance compromise between the
linear detectors and the ML.
The computational complexity of all the detectors is presented in Table 4.2. The complexity
78
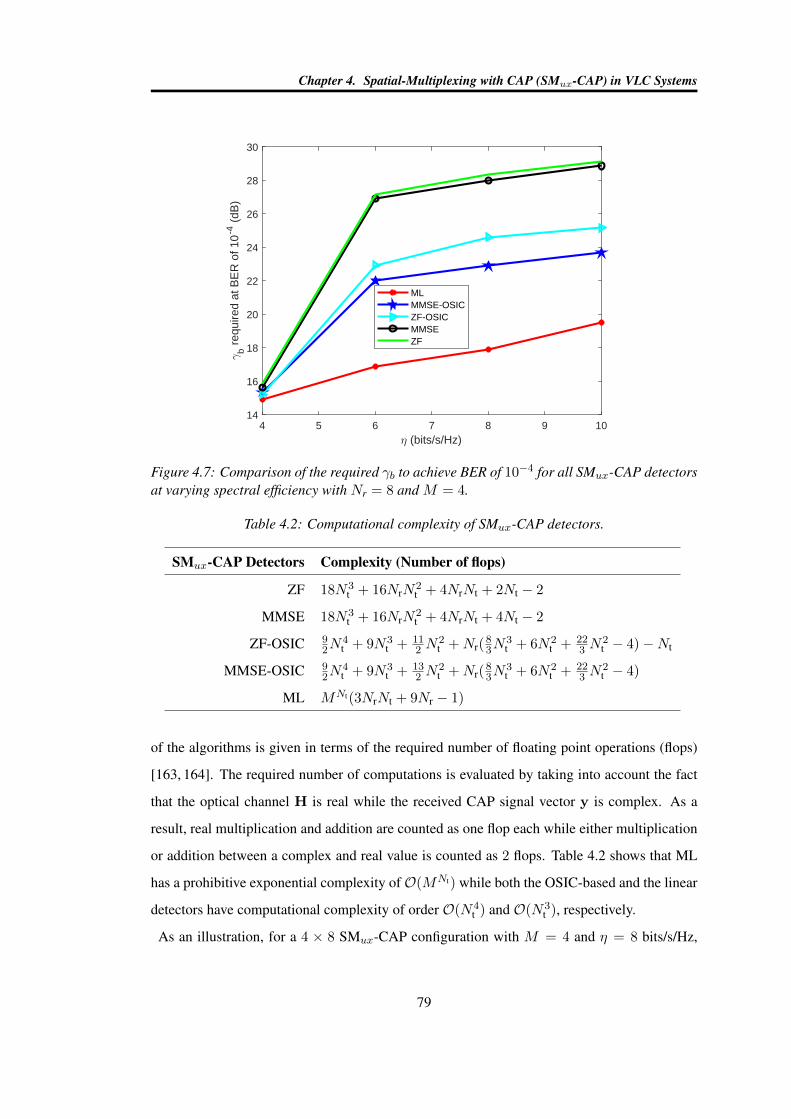
Chapter 4. Spatial-Multiplexing with CAP (SMux-CAP) in VLC Systems
4 5 6 7 8 9 10 (bits/s/Hz)
14
16
18
20
22
24
26
28
30
b r
equi
red
at B
ER
of 1
0-4
(dB
)
MLMMSE-OSICZF-OSICMMSEZF
Figure 4.7: Comparison of the required γb to achieve BER of 10−4 for all SMux-CAP detectorsat varying spectral efficiency with Nr = 8 and M = 4.
Table 4.2: Computational complexity of SMux-CAP detectors.
SMux-CAP Detectors Complexity (Number of flops)
ZF 18N3t + 16NrN
2t + 4NrNt + 2Nt − 2
MMSE 18N3t + 16NrN
2t + 4NrNt + 4Nt − 2
ZF-OSIC 92N
4t + 9N3
t + 112 N
2t +Nr(
83N
3t + 6N2
t + 223 N
2t − 4)−Nt
MMSE-OSIC 92N
4t + 9N3
t + 132 N
2t +Nr(
83N
3t + 6N2
t + 223 N
2t − 4)
ML MNt(3NrNt + 9Nr − 1)
of the algorithms is given in terms of the required number of floating point operations (flops)
[163, 164]. The required number of computations is evaluated by taking into account the fact
that the optical channel H is real while the received CAP signal vector y is complex. As a
result, real multiplication and addition are counted as one flop each while either multiplication
or addition between a complex and real value is counted as 2 flops. Table 4.2 shows that ML
has a prohibitive exponential complexity ofO(MNt) while both the OSIC-based and the linear
detectors have computational complexity of order O(N4t ) and O(N3
t ), respectively.
As an illustration, for a 4 × 8 SMux-CAP configuration with M = 4 and η = 8 bits/s/Hz,
79
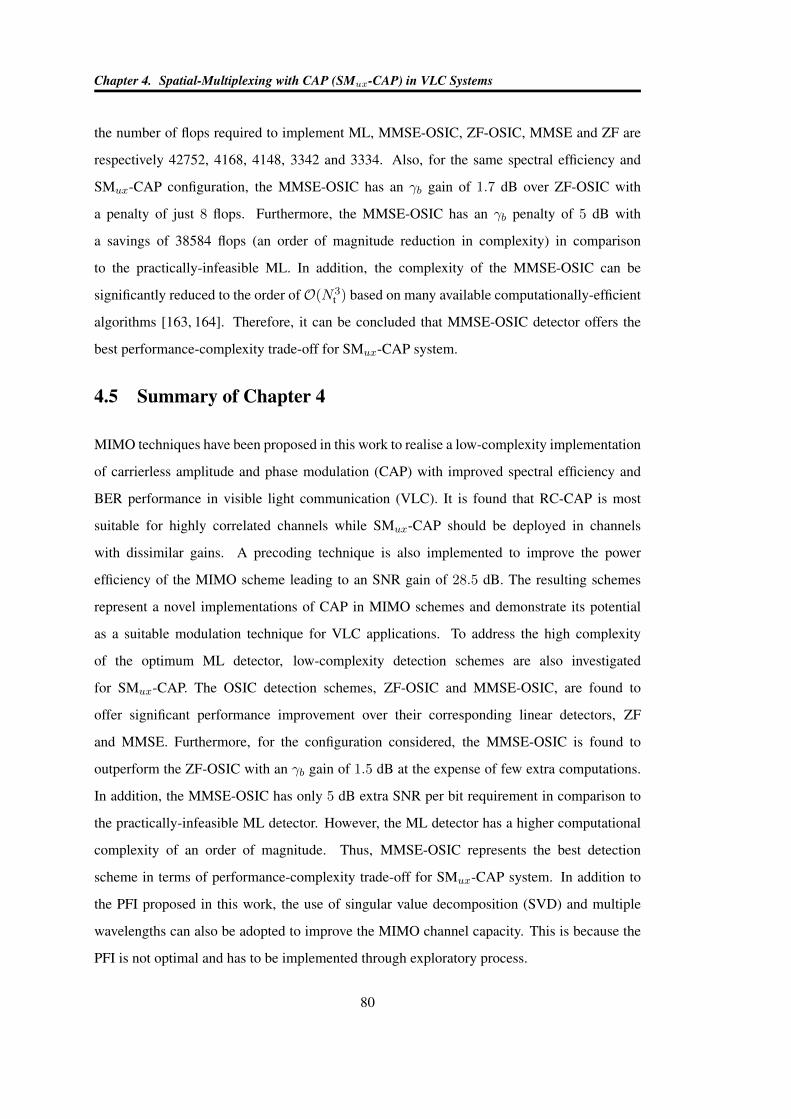
Chapter 4. Spatial-Multiplexing with CAP (SMux-CAP) in VLC Systems
the number of flops required to implement ML, MMSE-OSIC, ZF-OSIC, MMSE and ZF are
respectively 42752, 4168, 4148, 3342 and 3334. Also, for the same spectral efficiency and
SMux-CAP configuration, the MMSE-OSIC has an γb gain of 1.7 dB over ZF-OSIC with
a penalty of just 8 flops. Furthermore, the MMSE-OSIC has an γb penalty of 5 dB with
a savings of 38584 flops (an order of magnitude reduction in complexity) in comparison
to the practically-infeasible ML. In addition, the complexity of the MMSE-OSIC can be
significantly reduced to the order ofO(N3t ) based on many available computationally-efficient
algorithms [163, 164]. Therefore, it can be concluded that MMSE-OSIC detector offers the
best performance-complexity trade-off for SMux-CAP system.
4.5 Summary of Chapter 4
MIMO techniques have been proposed in this work to realise a low-complexity implementation
of carrierless amplitude and phase modulation (CAP) with improved spectral efficiency and
BER performance in visible light communication (VLC). It is found that RC-CAP is most
suitable for highly correlated channels while SMux-CAP should be deployed in channels
with dissimilar gains. A precoding technique is also implemented to improve the power
efficiency of the MIMO scheme leading to an SNR gain of 28.5 dB. The resulting schemes
represent a novel implementations of CAP in MIMO schemes and demonstrate its potential
as a suitable modulation technique for VLC applications. To address the high complexity
of the optimum ML detector, low-complexity detection schemes are also investigated
for SMux-CAP. The OSIC detection schemes, ZF-OSIC and MMSE-OSIC, are found to
offer significant performance improvement over their corresponding linear detectors, ZF
and MMSE. Furthermore, for the configuration considered, the MMSE-OSIC is found to
outperform the ZF-OSIC with an γb gain of 1.5 dB at the expense of few extra computations.
In addition, the MMSE-OSIC has only 5 dB extra SNR per bit requirement in comparison to
the practically-infeasible ML detector. However, the ML detector has a higher computational
complexity of an order of magnitude. Thus, MMSE-OSIC represents the best detection
scheme in terms of performance-complexity trade-off for SMux-CAP system. In addition to
the PFI proposed in this work, the use of singular value decomposition (SVD) and multiple
wavelengths can also be adopted to improve the MIMO channel capacity. This is because the
PFI is not optimal and has to be implemented through exploratory process.
80
Chapter 5
Spatial-CAP (S-CAP) in VLC Systems
The spatial modulation (SM) technique is another MIMO transmission technique that has
been studied in optical wireless communication. Only one out of Nt LEDs is active at any
instant in an SM system. The index/position of this active LED is then used to encode
data [165, 166]. In SM, a block of information bits to be transmitted is divided into two
subblocks. One subblock is mapped to symbols in the signal domain corresponding to the
regular modulation scheme while the other is used to activate one of the LED transmitters in
the spatial domain. Therefore, the signal domain bits are transmitted through the activated LED
while other LEDs remain inactive [157]. Unlike spatial multiplexing, the SM technique avoids
inter-carrier/inter-channel interference at the receiver while improving the spectral efficiency of
the system. The SM technique has been studied and compared with other modulation schemes
in [153, 167]. Experimental demonstrations of SM techniques have also been reported for
optical wireless systems in [168]. These studies conclude that SM offers a low complexity
approach to improving the throughput of optical wireless communication systems.
As a result, a spatial modulation-based CAP (S-CAP) is proposed to improve the spectral
efficiency of CAP while maintaining its low complexity. The BER analysis of S-CAP is
derived and its performance is investigated in both LOS and NLOS scenarios. Furthermore,
performance enhancing techniques are proposed to improve on its performance.
Though S-CAP avoids ICI with significant reduction in receiver complexity, it only offers
logarithmic increase in spectral efficiency and requires that the number of transmitting LEDs
be a power of two. These limitations means that a large number of LEDs is required to achieve
similar throughput as SMux-CAP. Therefore, generalised S-CAP (GS-CAP) is developed
to retain the benefits of S-CAP while improving its spectral efficiency. The GS-CAP
81
Chapter 5. Spatial-CAP (S-CAP) in VLC Systems
error rate performance is derived and validated via simulation. In addition, various system
configurations and parameters are investigated for the developed GS-CAP using the derived
analytical expression.
5.1 System Model Description
In S-CAP, only one LED transmits CAP signal of theNt available in each symbol duration. An
extra log2(Nt) information bits can then be encoded on the index of the transmitting LED.
Thus, by transmitting extra bits in the spatial domain, S-CAP achieves higher throughput
compared to the conventional CAP. The benefits of S-CAP can be illustrated in two ways: (i) for
a fixed number of transmitted bits/symbol, S-CAP requires lower bandwidth in comparison to
CAP. (ii) For a fixed bandwidth requirement, S-CAP transmits more bits/symbol thus achieving
a higher spectral efficiency. For a bit duration Tb and modulation order M , the S-CAP symbol
duration can be expressed as:
TS-CAP = Tblog2MNt (5.1)
while CAP symbol duration is expressed as:
TCAP = Tblog2M (5.2)
Using (5.1) and (5.2), the spectral efficiency improvement factor of S-CAP over the
conventional CAP can be derived as:
ηf =TS-CAP
TCAP= logM (MNt) (5.3)
Similarly, during each symbol duration, the GS-CAP transmits copies of the same CAP symbol
over Na active LEDs out of the total Nt transmitting LEDs. As a result, there are N =(NtNa
)possible number of symbols in the spatial constellation of GS-CAP with a maximum spectral
efficiency of log2(N) bits/s/Hz. The S-CAP can be viewed as a special case of GS-CAP with
Na = 1.
5.1.1 S-CAP System Model
The block diagram illustrating the modulation process of S-CAP is shown in Fig. 5.1. The
stream of information bits is grouped into blocks of b bits, where b = log2(Nt)+ log2(M). The
82
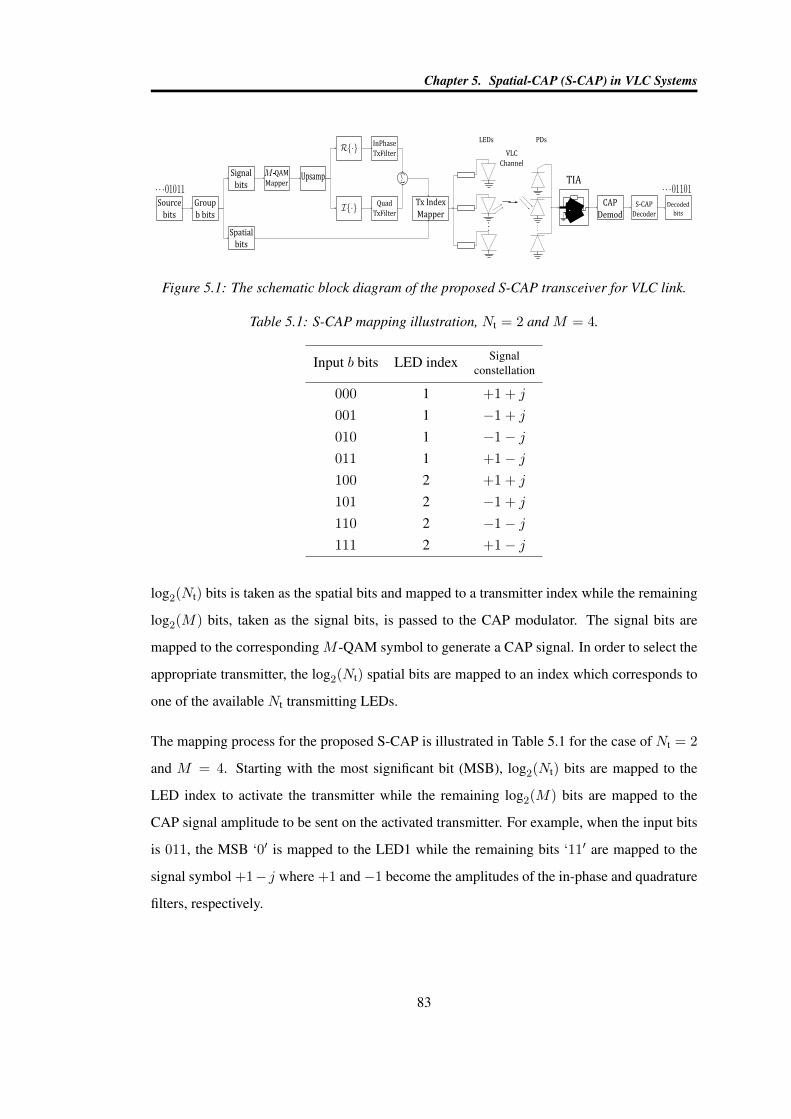
Chapter 5. Spatial-CAP (S-CAP) in VLC Systems
Source
bits
Group
b bits
Signal
bits
Spatial
bits
QAM
MapperUpsamp
InPhase
TxFilter
Quad
TxFilter
CAP
Demod
S-CAP
Decoder
Decoded
bits
VLC
Channel
LEDs PDs
Tx Index
Mapper
TIA
Figure 5.1: The schematic block diagram of the proposed S-CAP transceiver for VLC link.
Table 5.1: S-CAP mapping illustration, Nt = 2 and M = 4.
Input b bits LED index Signalconstellation
000 1 +1 + j
001 1 −1 + j
010 1 −1− j011 1 +1− j100 2 +1 + j
101 2 −1 + j
110 2 −1− j111 2 +1− j
log2(Nt) bits is taken as the spatial bits and mapped to a transmitter index while the remaining
log2(M) bits, taken as the signal bits, is passed to the CAP modulator. The signal bits are
mapped to the corresponding M -QAM symbol to generate a CAP signal. In order to select the
appropriate transmitter, the log2(Nt) spatial bits are mapped to an index which corresponds to
one of the available Nt transmitting LEDs.
The mapping process for the proposed S-CAP is illustrated in Table 5.1 for the case of Nt = 2
and M = 4. Starting with the most significant bit (MSB), log2(Nt) bits are mapped to the
LED index to activate the transmitter while the remaining log2(M) bits are mapped to the
CAP signal amplitude to be sent on the activated transmitter. For example, when the input bits
is 011, the MSB ‘0′ is mapped to the LED1 while the remaining bits ‘11′ are mapped to the
signal symbol +1− j where +1 and−1 become the amplitudes of the in-phase and quadrature
filters, respectively.
83
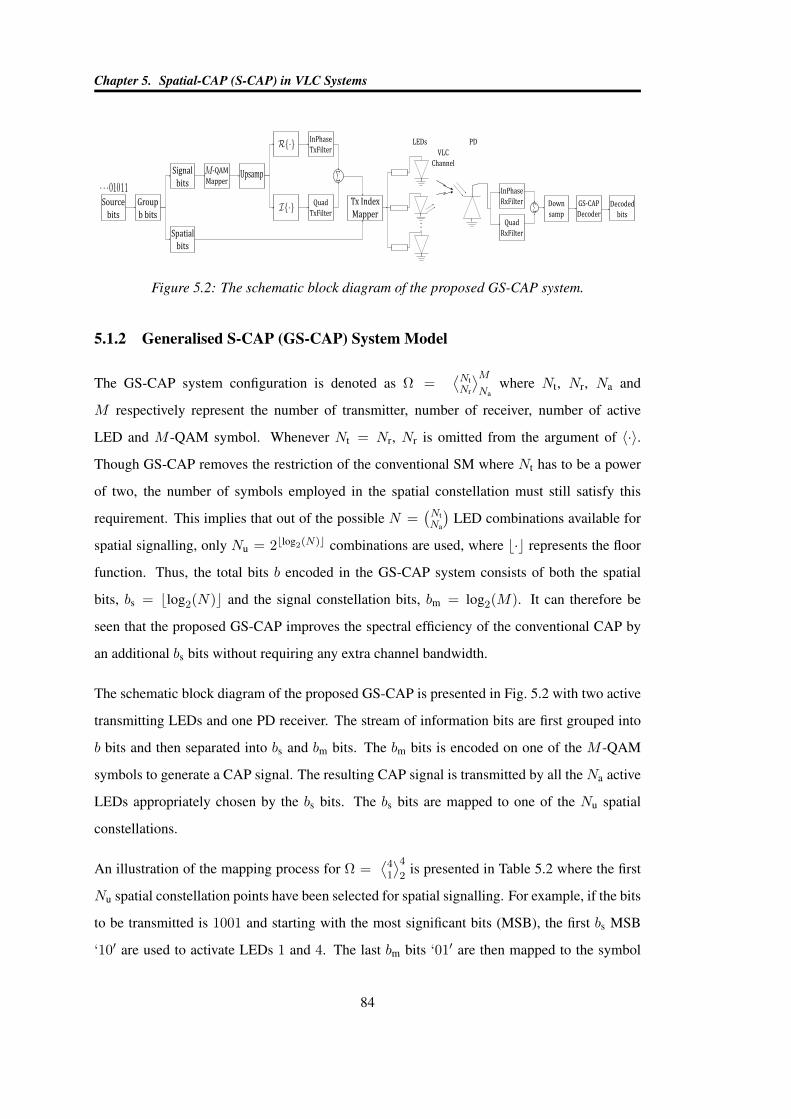
Chapter 5. Spatial-CAP (S-CAP) in VLC Systems
InPhase
RxFilter
Quad
RxFilter
Down
samp
GS-CAP
Decoder
Decoded
bits
LEDs PD
Source
bits
Group
b bits
Signal
bits
Spatial
bits
-QAM
MapperUpsamp
InPhase
TxFilter
Quad
TxFilter
Tx Index
Mapper
VLC
Channel
Figure 5.2: The schematic block diagram of the proposed GS-CAP system.
5.1.2 Generalised S-CAP (GS-CAP) System Model
The GS-CAP system configuration is denoted as Ω =⟨NtNr
⟩MNa
where Nt, Nr, Na and
M respectively represent the number of transmitter, number of receiver, number of active
LED and M -QAM symbol. Whenever Nt = Nr, Nr is omitted from the argument of 〈·〉.
Though GS-CAP removes the restriction of the conventional SM where Nt has to be a power
of two, the number of symbols employed in the spatial constellation must still satisfy this
requirement. This implies that out of the possible N =(NtNa
)LED combinations available for
spatial signalling, only Nu = 2blog2(N)c combinations are used, where b·c represents the floor
function. Thus, the total bits b encoded in the GS-CAP system consists of both the spatial
bits, bs = blog2(N)c and the signal constellation bits, bm = log2(M). It can therefore be
seen that the proposed GS-CAP improves the spectral efficiency of the conventional CAP by
an additional bs bits without requiring any extra channel bandwidth.
The schematic block diagram of the proposed GS-CAP is presented in Fig. 5.2 with two active
transmitting LEDs and one PD receiver. The stream of information bits are first grouped into
b bits and then separated into bs and bm bits. The bm bits is encoded on one of the M -QAM
symbols to generate a CAP signal. The resulting CAP signal is transmitted by all the Na active
LEDs appropriately chosen by the bs bits. The bs bits are mapped to one of the Nu spatial
constellations.
An illustration of the mapping process for Ω =⟨41
⟩42
is presented in Table 5.2 where the first
Nu spatial constellation points have been selected for spatial signalling. For example, if the bits
to be transmitted is 1001 and starting with the most significant bits (MSB), the first bs MSB
‘10′ are used to activate LEDs 1 and 4. The last bm bits ‘01′ are then mapped to the symbol
84
Chapter 5. Spatial-CAP (S-CAP) in VLC Systems
−1 + j.
5.2 BER Performance Analysis
5.2.1 BER Expression for S-CAP
The received S-CAP signal on the nthr receiver given that symbol m has been transmitted on
the ntht transmitter can be written as:
ynr(t) = rmnrnt(t) + wnr(t) nr = 1, 2, · · · , Nr (5.4)
where rmnrnt(t) = RKβhnrntxm(t). At each receiver, the S-CAP demodulator uses a pair of
linear filters that are, respectively, matched to the pair of the transmit orthogonal filters. From
(5.4), the output of the S-CAP demodulators can be expressed as:
y = rmnt+ w (5.5)
where ynr , rmnrnt
and wnr are the components of y, rmntand w, respectively. The S-CAP
detector will then make a decision on the transmitted signal in each signal interval based on
the demodulator output such that the probability of a correct decision is maximized. Assuming
perfect synchronization and full knowledge of the channel matrix H, the S-CAP optimum
detector employs ML criterion since xmMm=1 are equiprobable with p(xm) = 1/M . Thus,
the S-CAP optimum detector decides on the xmnt , which is the mth symbol transmitted on the
ntht transmitter, that maximizes the probability of y conditioned on rmnt
as:
xmnt = arg maxnt,m
p(y|rmnt) (5.6)
where the conditional PDF, given the AWGN corrupted channel, is expressed as:
p(y|rmnt) =
1
(2πN0)Nr/2exp
[−
Nr∑nr=1
∣∣ynr − rmnrnt
∣∣22N0
](5.7)
The ML criterion reduces to finding the xmnt that results in the minimum Euclidean distance,
i.e.
xmnt = arg minnt,m
D(y, rmnt) (5.8)
85
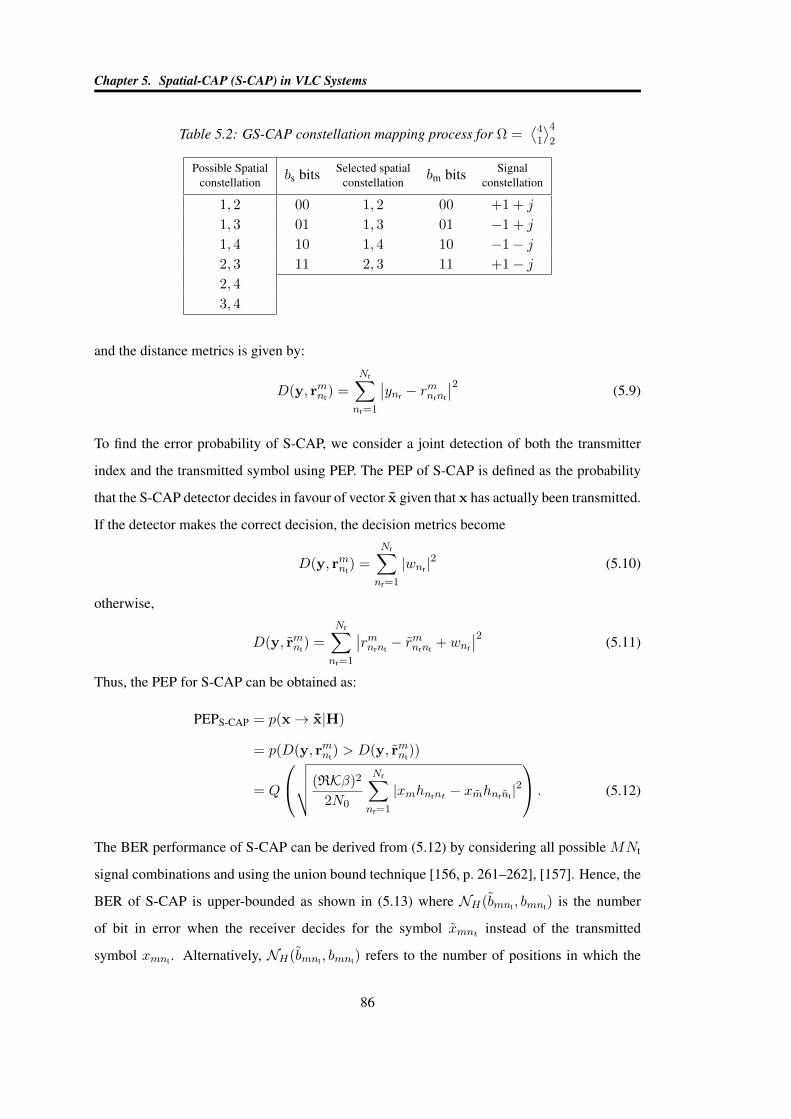
Chapter 5. Spatial-CAP (S-CAP) in VLC Systems
Table 5.2: GS-CAP constellation mapping process for Ω =⟨41
⟩42
Possible Spatialconstellation
bs bits Selected spatialconstellation
bm bits Signalconstellation
1, 2 00 1, 2 00 +1 + j
1, 3 01 1, 3 01 −1 + j
1, 4 10 1, 4 10 −1− j2, 3 11 2, 3 11 +1− j2, 4
3, 4
and the distance metrics is given by:
D(y, rmnt) =
Nr∑nr=1
∣∣ynr − rmnrnt
∣∣2 (5.9)
To find the error probability of S-CAP, we consider a joint detection of both the transmitter
index and the transmitted symbol using PEP. The PEP of S-CAP is defined as the probability
that the S-CAP detector decides in favour of vector x given that x has actually been transmitted.
If the detector makes the correct decision, the decision metrics become
D(y, rmnt) =
Nr∑nr=1
|wnr |2 (5.10)
otherwise,
D(y, rmnt) =
Nr∑nr=1
∣∣rmnrnt− rmnrnt
+ wnr
∣∣2 (5.11)
Thus, the PEP for S-CAP can be obtained as:
PEPS-CAP = p(x→ x|H)
= p(D(y, rmnt) > D(y, rmnt
))
= Q
√√√√(RKβ)2
2N0
Nr∑nr=1
|xmhnrnt − xmhnrnt |2
. (5.12)
The BER performance of S-CAP can be derived from (5.12) by considering all possible MNt
signal combinations and using the union bound technique [156, p. 261–262], [157]. Hence, the
BER of S-CAP is upper-bounded as shown in (5.13) where NH(bmnt , bmnt) is the number
of bit in error when the receiver decides for the symbol xmnt instead of the transmitted
symbol xmnt . Alternatively, NH(bmnt , bmnt) refers to the number of positions in which the
86
Chapter 5. Spatial-CAP (S-CAP) in VLC Systems
BERS-CAP ≤1
MNtlog2(MNt)
M∑m=1
Nt∑nt=1
M∑m=1
Nt∑nt=1
NH(bmnt , bmnt)
Q
√√√√(RKβ)2
2N0
Nr∑nr=1
|xmhnrnt − xmhnrnt |2
. (5.13)
bits corresponding to symbol xmnt and xmnt differ (Hamming distance). For example, if a
symbol corresponding to bits ’100’ is transmitted and the S-CAP detector erroneously detect
the symbol corresponding to bits ‘000’, ‘001’ or ‘011’, theNH(bmnt , bmnt) term becomes 1, 2
or 3, respectively.
5.2.2 BER Expression for GS-CAP
Since the same copies of the CAP signal xm are transmitted over Na active LEDs in GS-CAP,
the received signal at the nthr receiver is given as
ynr(t) = ψmnrnu(t) + wnr(t) nr = 1, 2, · · · , Nr (5.14)
where ψmnrnu(t) = RKβϑnrnuxm and ϑnrnu =
∑Nanahnunrna
. The ϑnrnu is the sum of the channel
gains that correspond to the Na active LEDs from the nthu spatial constellation to the nth
r
receiver. Therefore, ϑnrnu is the effective channel gain of the GS-CAP system. The output
of the GS-CAP demodulators can then be expressed as:
y = ψmnu+ w (5.15)
where ynr , ψmnrnu
and wnr are the entries of y, ψmnuand w, respectively. Given that ψmnu
are equiprobable, the optimum GS-CAP detector employs maximum ML decision criterion.
The ML criterion decides on the xmnu , which is the mth signal transmitted on the nthu LED
combination, that maximizes the probability of y conditioned on ψmnuas:
xmnu = arg maxnu,m
p(y,ψmnu) (5.16)
where p(r,ψmnu), considering the AWGN channel, is given by
p(y,ψmnu) =
1
(2πN0)Nr/2exp
[−
Nr∑nr=1
∣∣ynr − ψmnrnu
∣∣22N0
](5.17)
87
Chapter 5. Spatial-CAP (S-CAP) in VLC Systems
BERGS-CAP ≤1
MNulog2(MNu)
M∑m=1
Nu∑nu=1
M∑m=1
Nu∑nu=1
NH(bmnu , bmnu)
Q
√√√√(RKβ)2
2N0
Nr∑nr=1
|xmϑnrnu − xmϑnrnu |2
. (5.23)
The ML criterion of (5.16) is equivalent to finding the xmnu that minimizes the minimum
Euclidean distance as:
xmnu = arg minnu,m
D(y,ψmnu) (5.18)
where the distance metric D(y,ψmnu) is given by
D(y,ψmnu) =
Nr∑nr=1
∣∣ynr − ψmnrnu
∣∣2 (5.19)
A joint detection of the LED combination index nu and the transmitted symbol xm is considered
in finding the error probability of GS-CAP using the PEP. When the GS-CAP detector makes
the correct decision, the distance metric becomes
D(y,ψmnu) =
Nr∑nr=1
|wnr |2 (5.20)
otherwise,
D(y, ψmnu) =
Nr∑nr=1
∣∣∣ψmnrnt− ψmnrnt
+ wnr
∣∣∣2 (5.21)
Therefore, the PEP of GS-CAP can be obtained as:
PEPGS-CAP = p(x→ x|H)
= p(D(y,ψmnu) > D(y, ψmnu
))
= Q
√√√√(RKβ)2
2N0
Nr∑nr=1
|xmϑnrnu − xmϑnrnu |2
. (5.22)
An upper bound expression for the BER performance of GS-CAP, shown in (5.23), can be
derived from (5.22) by considering all possible MNu combinations of GS-CAP symbol using
the union bound technique [156, p. 261–262], [157]. The NH(bmnu , bmnu) in (5.23) is the
number of bits in error when the GS-CAP detector decides in favour of symbol x instead of the
transmitted symbol x.
88
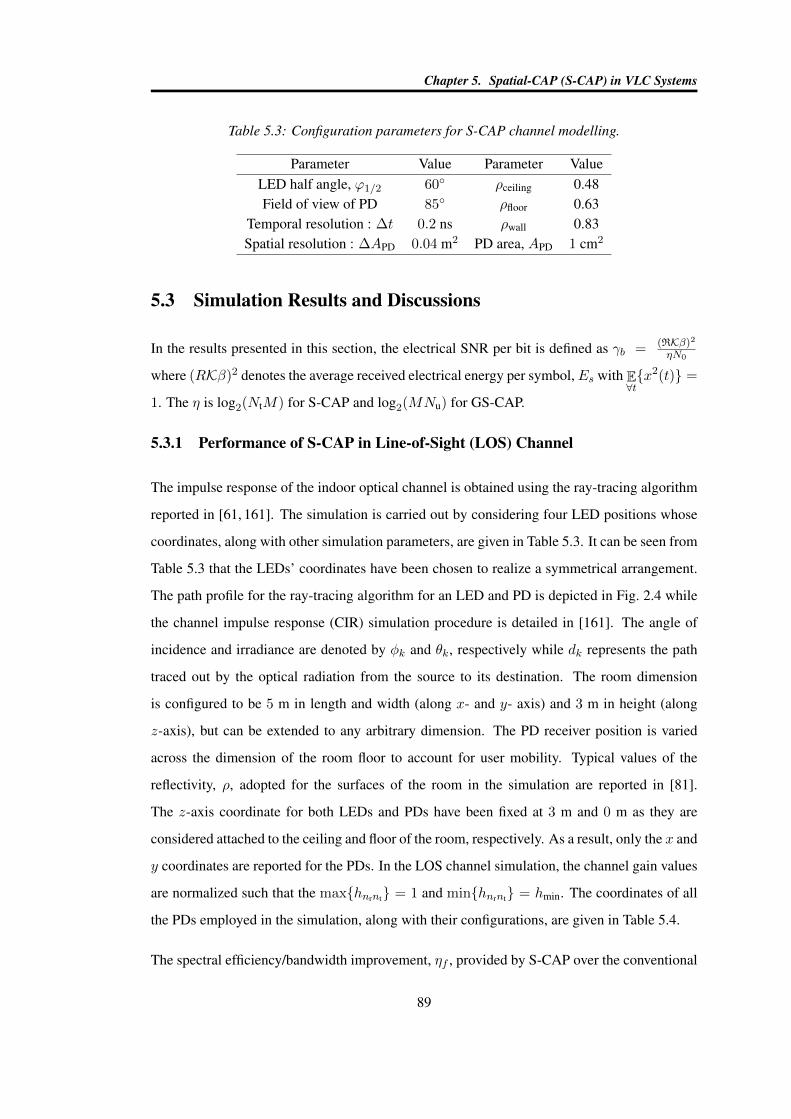
Chapter 5. Spatial-CAP (S-CAP) in VLC Systems
Table 5.3: Configuration parameters for S-CAP channel modelling.
Parameter Value Parameter ValueLED half angle, ϕ1/2 60 ρceiling 0.48Field of view of PD 85 ρfloor 0.63
Temporal resolution : ∆t 0.2 ns ρwall 0.83Spatial resolution : ∆APD 0.04 m2 PD area, APD 1 cm2
5.3 Simulation Results and Discussions
In the results presented in this section, the electrical SNR per bit is defined as γb = (RKβ)2ηN0
where (RKβ)2 denotes the average received electrical energy per symbol,Es with E∀tx2(t) =
1. The η is log2(NtM) for S-CAP and log2(MNu) for GS-CAP.
5.3.1 Performance of S-CAP in Line-of-Sight (LOS) Channel
The impulse response of the indoor optical channel is obtained using the ray-tracing algorithm
reported in [61, 161]. The simulation is carried out by considering four LED positions whose
coordinates, along with other simulation parameters, are given in Table 5.3. It can be seen from
Table 5.3 that the LEDs’ coordinates have been chosen to realize a symmetrical arrangement.
The path profile for the ray-tracing algorithm for an LED and PD is depicted in Fig. 2.4 while
the channel impulse response (CIR) simulation procedure is detailed in [161]. The angle of
incidence and irradiance are denoted by φk and θk, respectively while dk represents the path
traced out by the optical radiation from the source to its destination. The room dimension
is configured to be 5 m in length and width (along x- and y- axis) and 3 m in height (along
z-axis), but can be extended to any arbitrary dimension. The PD receiver position is varied
across the dimension of the room floor to account for user mobility. Typical values of the
reflectivity, ρ, adopted for the surfaces of the room in the simulation are reported in [81].
The z-axis coordinate for both LEDs and PDs have been fixed at 3 m and 0 m as they are
considered attached to the ceiling and floor of the room, respectively. As a result, only the x and
y coordinates are reported for the PDs. In the LOS channel simulation, the channel gain values
are normalized such that the maxhnrnt = 1 and minhnrnt = hmin. The coordinates of all
the PDs employed in the simulation, along with their configurations, are given in Table 5.4.
The spectral efficiency/bandwidth improvement, ηf , provided by S-CAP over the conventional
89
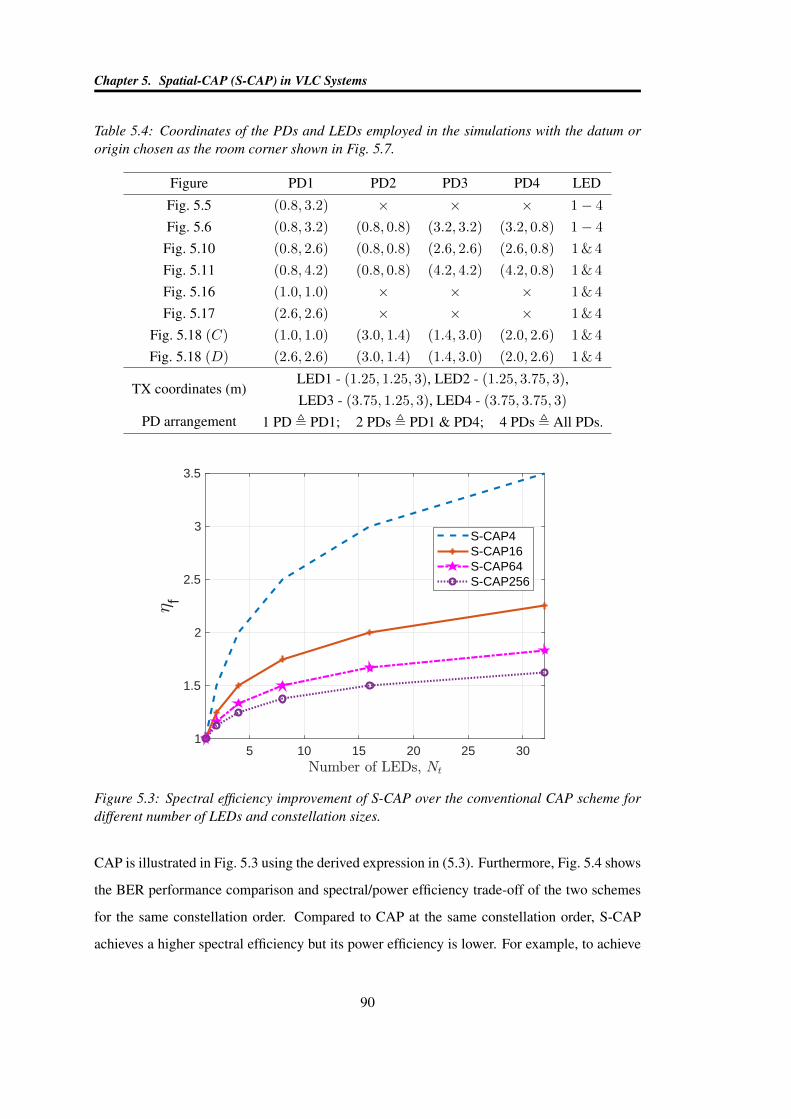
Chapter 5. Spatial-CAP (S-CAP) in VLC Systems
Table 5.4: Coordinates of the PDs and LEDs employed in the simulations with the datum ororigin chosen as the room corner shown in Fig. 5.7.
Figure PD1 PD2 PD3 PD4 LED
Fig. 5.5 (0.8, 3.2) × × × 1− 4
Fig. 5.6 (0.8, 3.2) (0.8, 0.8) (3.2, 3.2) (3.2, 0.8) 1− 4
Fig. 5.10 (0.8, 2.6) (0.8, 0.8) (2.6, 2.6) (2.6, 0.8) 1 & 4
Fig. 5.11 (0.8, 4.2) (0.8, 0.8) (4.2, 4.2) (4.2, 0.8) 1 & 4
Fig. 5.16 (1.0, 1.0) × × × 1 & 4
Fig. 5.17 (2.6, 2.6) × × × 1 & 4
Fig. 5.18 (C) (1.0, 1.0) (3.0, 1.4) (1.4, 3.0) (2.0, 2.6) 1 & 4
Fig. 5.18 (D) (2.6, 2.6) (3.0, 1.4) (1.4, 3.0) (2.0, 2.6) 1 & 4
TX coordinates (m)LED1 - (1.25, 1.25, 3), LED2 - (1.25, 3.75, 3),LED3 - (3.75, 1.25, 3), LED4 - (3.75, 3.75, 3)
PD arrangement 1 PD , PD1; 2 PDs , PD1 & PD4; 4 PDs , All PDs.
5 10 15 20 25 301
1.5
2
2.5
3
3.5
f
S-CAP4S-CAP16S-CAP64S-CAP256
Figure 5.3: Spectral efficiency improvement of S-CAP over the conventional CAP scheme fordifferent number of LEDs and constellation sizes.
CAP is illustrated in Fig. 5.3 using the derived expression in (5.3). Furthermore, Fig. 5.4 shows
the BER performance comparison and spectral/power efficiency trade-off of the two schemes
for the same constellation order. Compared to CAP at the same constellation order, S-CAP
achieves a higher spectral efficiency but its power efficiency is lower. For example, to achieve
90
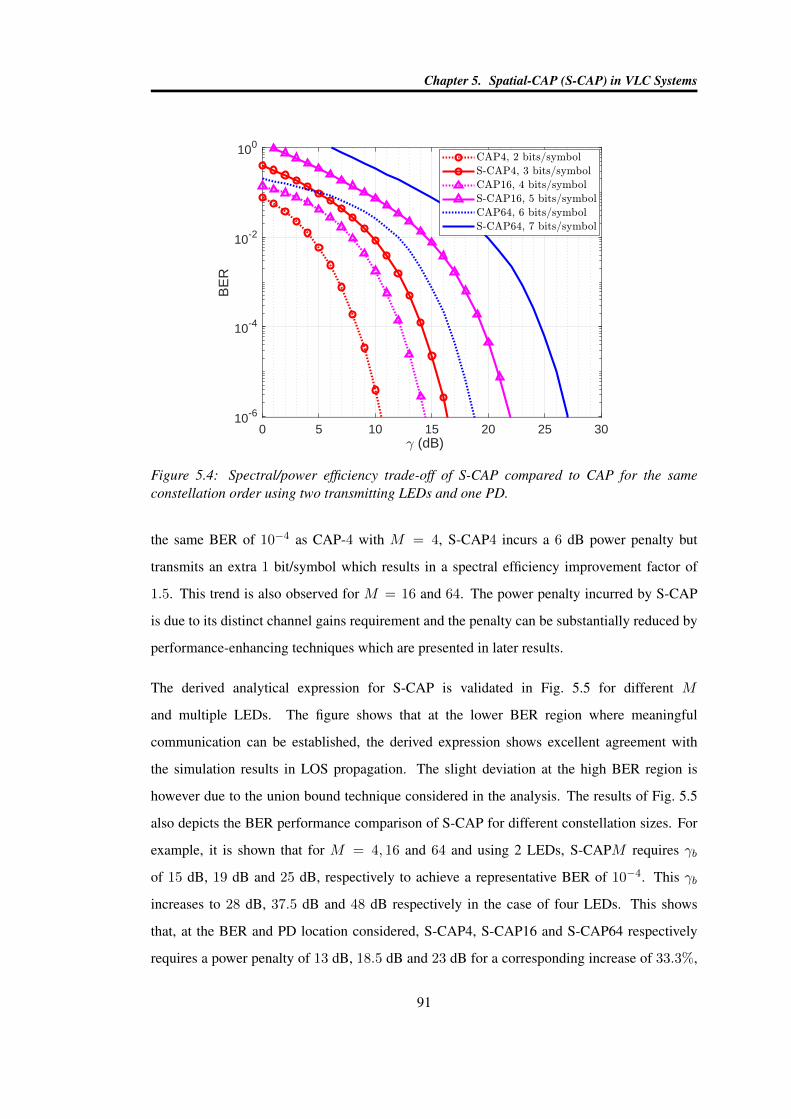
Chapter 5. Spatial-CAP (S-CAP) in VLC Systems
0 5 10 15 20 25 30 (dB)
10-6
10-4
10-2
100
BE
R
Figure 5.4: Spectral/power efficiency trade-off of S-CAP compared to CAP for the sameconstellation order using two transmitting LEDs and one PD.
the same BER of 10−4 as CAP-4 with M = 4, S-CAP4 incurs a 6 dB power penalty but
transmits an extra 1 bit/symbol which results in a spectral efficiency improvement factor of
1.5. This trend is also observed for M = 16 and 64. The power penalty incurred by S-CAP
is due to its distinct channel gains requirement and the penalty can be substantially reduced by
performance-enhancing techniques which are presented in later results.
The derived analytical expression for S-CAP is validated in Fig. 5.5 for different M
and multiple LEDs. The figure shows that at the lower BER region where meaningful
communication can be established, the derived expression shows excellent agreement with
the simulation results in LOS propagation. The slight deviation at the high BER region is
however due to the union bound technique considered in the analysis. The results of Fig. 5.5
also depicts the BER performance comparison of S-CAP for different constellation sizes. For
example, it is shown that for M = 4, 16 and 64 and using 2 LEDs, S-CAPM requires γb
of 15 dB, 19 dB and 25 dB, respectively to achieve a representative BER of 10−4. This γb
increases to 28 dB, 37.5 dB and 48 dB respectively in the case of four LEDs. This shows
that, at the BER and PD location considered, S-CAP4, S-CAP16 and S-CAP64 respectively
requires a power penalty of 13 dB, 18.5 dB and 23 dB for a corresponding increase of 33.3%,
91
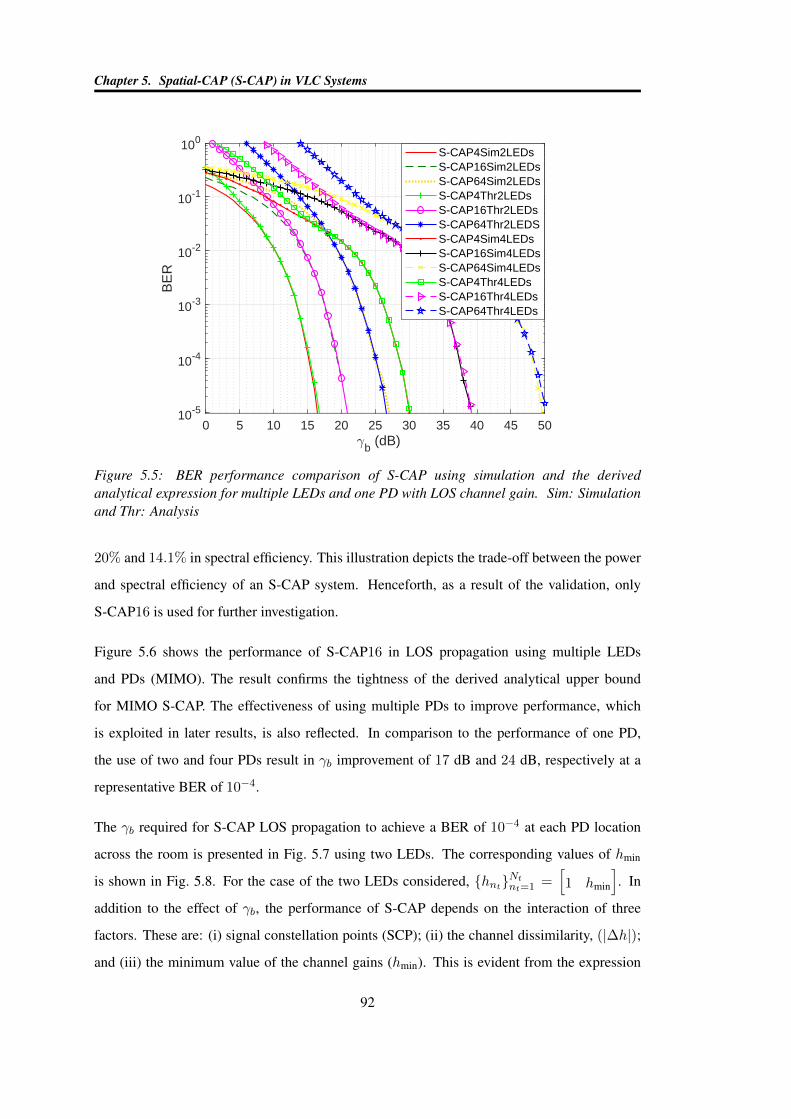
Chapter 5. Spatial-CAP (S-CAP) in VLC Systems
0 5 10 15 20 25 30 35 40 45 50
b (dB)
10-5
10-4
10-3
10-2
10-1
100
BE
RS-CAP4Sim2LEDsS-CAP16Sim2LEDsS-CAP64Sim2LEDsS-CAP4Thr2LEDsS-CAP16Thr2LEDsS-CAP64Thr2LEDSS-CAP4Sim4LEDsS-CAP16Sim4LEDsS-CAP64Sim4LEDsS-CAP4Thr4LEDsS-CAP16Thr4LEDsS-CAP64Thr4LEDs
Figure 5.5: BER performance comparison of S-CAP using simulation and the derivedanalytical expression for multiple LEDs and one PD with LOS channel gain. Sim: Simulationand Thr: Analysis
20% and 14.1% in spectral efficiency. This illustration depicts the trade-off between the power
and spectral efficiency of an S-CAP system. Henceforth, as a result of the validation, only
S-CAP16 is used for further investigation.
Figure 5.6 shows the performance of S-CAP16 in LOS propagation using multiple LEDs
and PDs (MIMO). The result confirms the tightness of the derived analytical upper bound
for MIMO S-CAP. The effectiveness of using multiple PDs to improve performance, which
is exploited in later results, is also reflected. In comparison to the performance of one PD,
the use of two and four PDs result in γb improvement of 17 dB and 24 dB, respectively at a
representative BER of 10−4.
The γb required for S-CAP LOS propagation to achieve a BER of 10−4 at each PD location
across the room is presented in Fig. 5.7 using two LEDs. The corresponding values of hmin
is shown in Fig. 5.8. For the case of the two LEDs considered, hntNtnt=1 =[1 hmin
]. In
addition to the effect of γb, the performance of S-CAP depends on the interaction of three
factors. These are: (i) signal constellation points (SCP); (ii) the channel dissimilarity, (|∆h|);
and (iii) the minimum value of the channel gains (hmin). This is evident from the expression
92
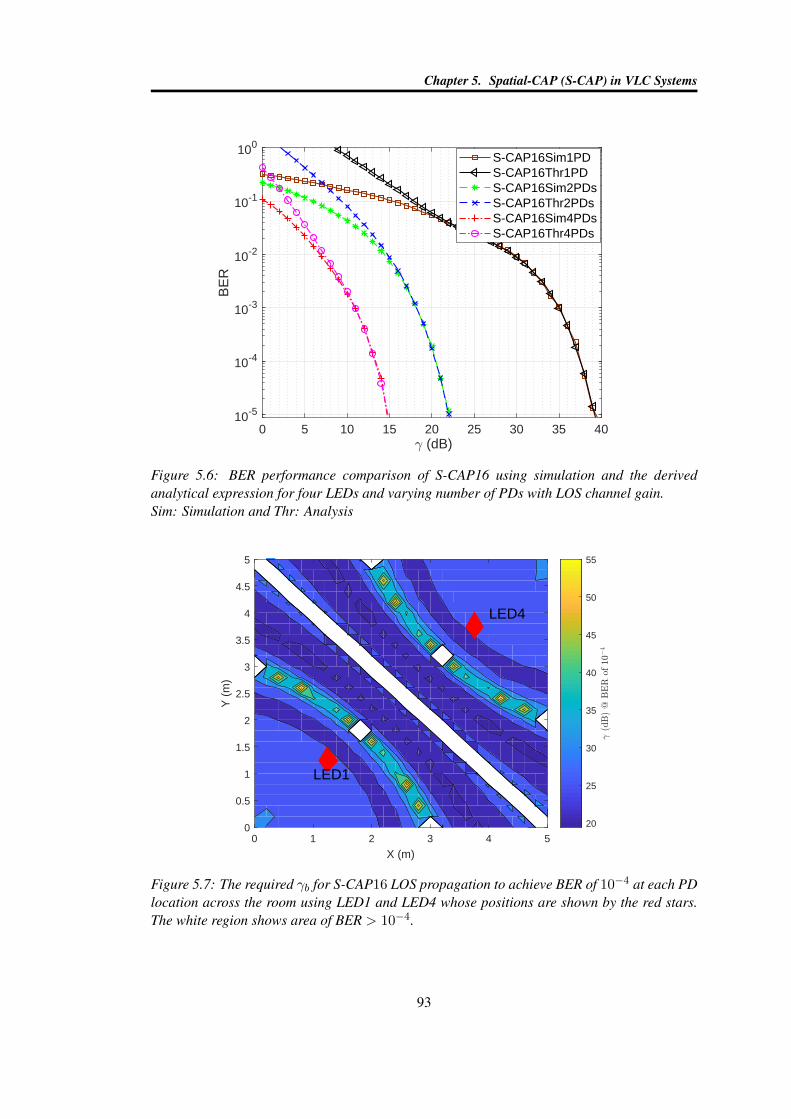
Chapter 5. Spatial-CAP (S-CAP) in VLC Systems
0 5 10 15 20 25 30 35 40 (dB)
10-5
10-4
10-3
10-2
10-1
100
BE
R
S-CAP16Sim1PDS-CAP16Thr1PDS-CAP16Sim2PDsS-CAP16Thr2PDsS-CAP16Sim4PDsS-CAP16Thr4PDs
Figure 5.6: BER performance comparison of S-CAP16 using simulation and the derivedanalytical expression for four LEDs and varying number of PDs with LOS channel gain.Sim: Simulation and Thr: Analysis
LED1
LED4
0 1 2 3 4 5
X (m)
0
0.5
1
1.5
2
2.5
3
3.5
4
4.5
5
Y (
m)
20
25
30
35
40
45
50
55
Figure 5.7: The required γb for S-CAP16 LOS propagation to achieve BER of 10−4 at each PDlocation across the room using LED1 and LED4 whose positions are shown by the red stars.The white region shows area of BER > 10−4.
93
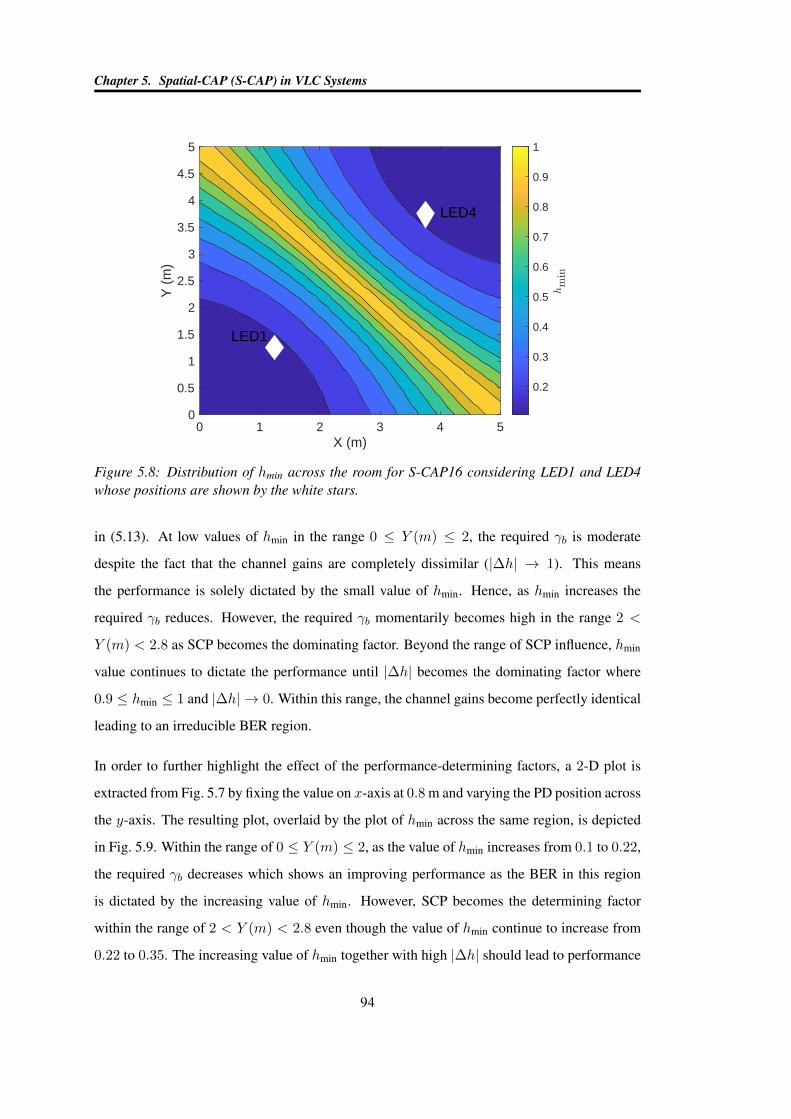
Chapter 5. Spatial-CAP (S-CAP) in VLC Systems
LED1
LED4
0 1 2 3 4 5X (m)
0
0.5
1
1.5
2
2.5
3
3.5
4
4.5
5Y
(m
)
0.2
0.3
0.4
0.5
0.6
0.7
0.8
0.9
1
Figure 5.8: Distribution of hmin across the room for S-CAP16 considering LED1 and LED4whose positions are shown by the white stars.
in (5.13). At low values of hmin in the range 0 ≤ Y (m) ≤ 2, the required γb is moderate
despite the fact that the channel gains are completely dissimilar (|∆h| → 1). This means
the performance is solely dictated by the small value of hmin. Hence, as hmin increases the
required γb reduces. However, the required γb momentarily becomes high in the range 2 <
Y (m) < 2.8 as SCP becomes the dominating factor. Beyond the range of SCP influence, hmin
value continues to dictate the performance until |∆h| becomes the dominating factor where
0.9 ≤ hmin ≤ 1 and |∆h| → 0. Within this range, the channel gains become perfectly identical
leading to an irreducible BER region.
In order to further highlight the effect of the performance-determining factors, a 2-D plot is
extracted from Fig. 5.7 by fixing the value on x-axis at 0.8 m and varying the PD position across
the y-axis. The resulting plot, overlaid by the plot of hmin across the same region, is depicted
in Fig. 5.9. Within the range of 0 ≤ Y (m) ≤ 2, as the value of hmin increases from 0.1 to 0.22,
the required γb decreases which shows an improving performance as the BER in this region
is dictated by the increasing value of hmin. However, SCP becomes the determining factor
within the range of 2 < Y (m) < 2.8 even though the value of hmin continue to increase from
0.22 to 0.35. The increasing value of hmin together with high |∆h| should lead to performance
94
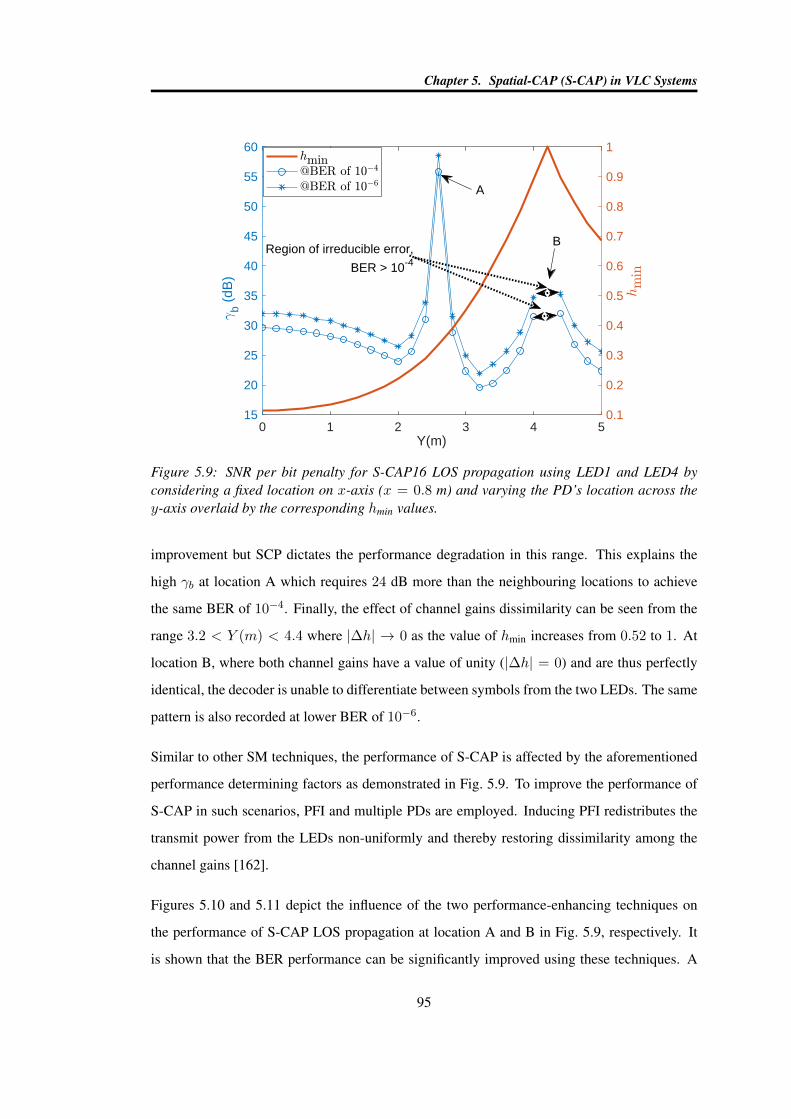
Chapter 5. Spatial-CAP (S-CAP) in VLC Systems
0 1 2 3 4 5Y(m)
15
20
25
30
35
40
45
50
55
60
b (dB
)
0.1
0.2
0.3
0.4
0.5
0.6
0.7
0.8
0.9
1
B
A
Region of irreducible error,
BER > 10-4
Figure 5.9: SNR per bit penalty for S-CAP16 LOS propagation using LED1 and LED4 byconsidering a fixed location on x-axis (x = 0.8 m) and varying the PD’s location across they-axis overlaid by the corresponding hmin values.
improvement but SCP dictates the performance degradation in this range. This explains the
high γb at location A which requires 24 dB more than the neighbouring locations to achieve
the same BER of 10−4. Finally, the effect of channel gains dissimilarity can be seen from the
range 3.2 < Y (m) < 4.4 where |∆h| → 0 as the value of hmin increases from 0.52 to 1. At
location B, where both channel gains have a value of unity (|∆h| = 0) and are thus perfectly
identical, the decoder is unable to differentiate between symbols from the two LEDs. The same
pattern is also recorded at lower BER of 10−6.
Similar to other SM techniques, the performance of S-CAP is affected by the aforementioned
performance determining factors as demonstrated in Fig. 5.9. To improve the performance of
S-CAP in such scenarios, PFI and multiple PDs are employed. Inducing PFI redistributes the
transmit power from the LEDs non-uniformly and thereby restoring dissimilarity among the
channel gains [162].
Figures 5.10 and 5.11 depict the influence of the two performance-enhancing techniques on
the performance of S-CAP LOS propagation at location A and B in Fig. 5.9, respectively. It
is shown that the BER performance can be significantly improved using these techniques. A
95
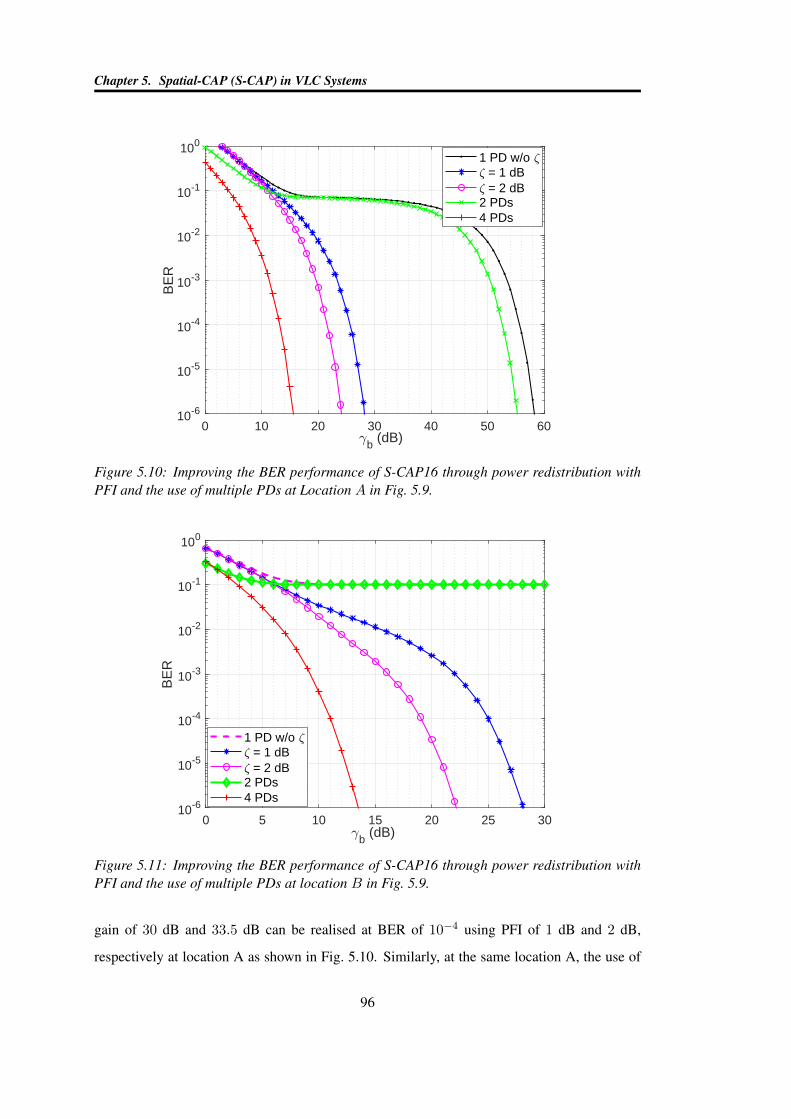
Chapter 5. Spatial-CAP (S-CAP) in VLC Systems
0 10 20 30 40 50 60
b (dB)
10-6
10-5
10-4
10-3
10-2
10-1
100
BE
R1 PD w/o = 1 dB = 2 dB
2 PDs4 PDs
Figure 5.10: Improving the BER performance of S-CAP16 through power redistribution withPFI and the use of multiple PDs at Location A in Fig. 5.9.
0 5 10 15 20 25 30
b (dB)
10-6
10-5
10-4
10-3
10-2
10-1
100
BE
R
1 PD w/o = 1 dB = 2 dB
2 PDs4 PDs
Figure 5.11: Improving the BER performance of S-CAP16 through power redistribution withPFI and the use of multiple PDs at location B in Fig. 5.9.
gain of 30 dB and 33.5 dB can be realised at BER of 10−4 using PFI of 1 dB and 2 dB,
respectively at location A as shown in Fig. 5.10. Similarly, at the same location A, the use of
96
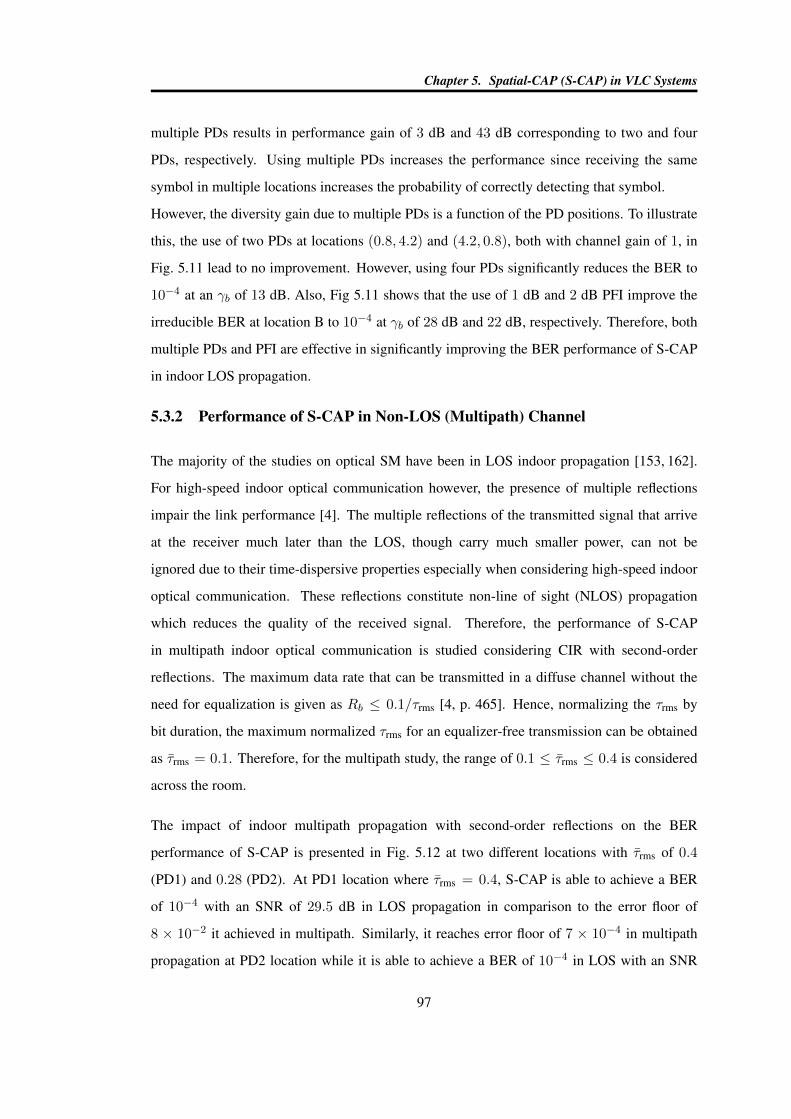
Chapter 5. Spatial-CAP (S-CAP) in VLC Systems
multiple PDs results in performance gain of 3 dB and 43 dB corresponding to two and four
PDs, respectively. Using multiple PDs increases the performance since receiving the same
symbol in multiple locations increases the probability of correctly detecting that symbol.
However, the diversity gain due to multiple PDs is a function of the PD positions. To illustrate
this, the use of two PDs at locations (0.8, 4.2) and (4.2, 0.8), both with channel gain of 1, in
Fig. 5.11 lead to no improvement. However, using four PDs significantly reduces the BER to
10−4 at an γb of 13 dB. Also, Fig 5.11 shows that the use of 1 dB and 2 dB PFI improve the
irreducible BER at location B to 10−4 at γb of 28 dB and 22 dB, respectively. Therefore, both
multiple PDs and PFI are effective in significantly improving the BER performance of S-CAP
in indoor LOS propagation.
5.3.2 Performance of S-CAP in Non-LOS (Multipath) Channel
The majority of the studies on optical SM have been in LOS indoor propagation [153, 162].
For high-speed indoor optical communication however, the presence of multiple reflections
impair the link performance [4]. The multiple reflections of the transmitted signal that arrive
at the receiver much later than the LOS, though carry much smaller power, can not be
ignored due to their time-dispersive properties especially when considering high-speed indoor
optical communication. These reflections constitute non-line of sight (NLOS) propagation
which reduces the quality of the received signal. Therefore, the performance of S-CAP
in multipath indoor optical communication is studied considering CIR with second-order
reflections. The maximum data rate that can be transmitted in a diffuse channel without the
need for equalization is given as Rb ≤ 0.1/τrms [4, p. 465]. Hence, normalizing the τrms by
bit duration, the maximum normalized τrms for an equalizer-free transmission can be obtained
as τrms = 0.1. Therefore, for the multipath study, the range of 0.1 ≤ τrms ≤ 0.4 is considered
across the room.
The impact of indoor multipath propagation with second-order reflections on the BER
performance of S-CAP is presented in Fig. 5.12 at two different locations with τrms of 0.4
(PD1) and 0.28 (PD2). At PD1 location where τrms = 0.4, S-CAP is able to achieve a BER
of 10−4 with an SNR of 29.5 dB in LOS propagation in comparison to the error floor of
8 × 10⁻² it achieved in multipath. Similarly, it reaches error floor of 7 × 10⁻⁴ in multipath
propagation at PD2 location while it is able to achieve a BER of 10−4 in LOS with an SNR
97
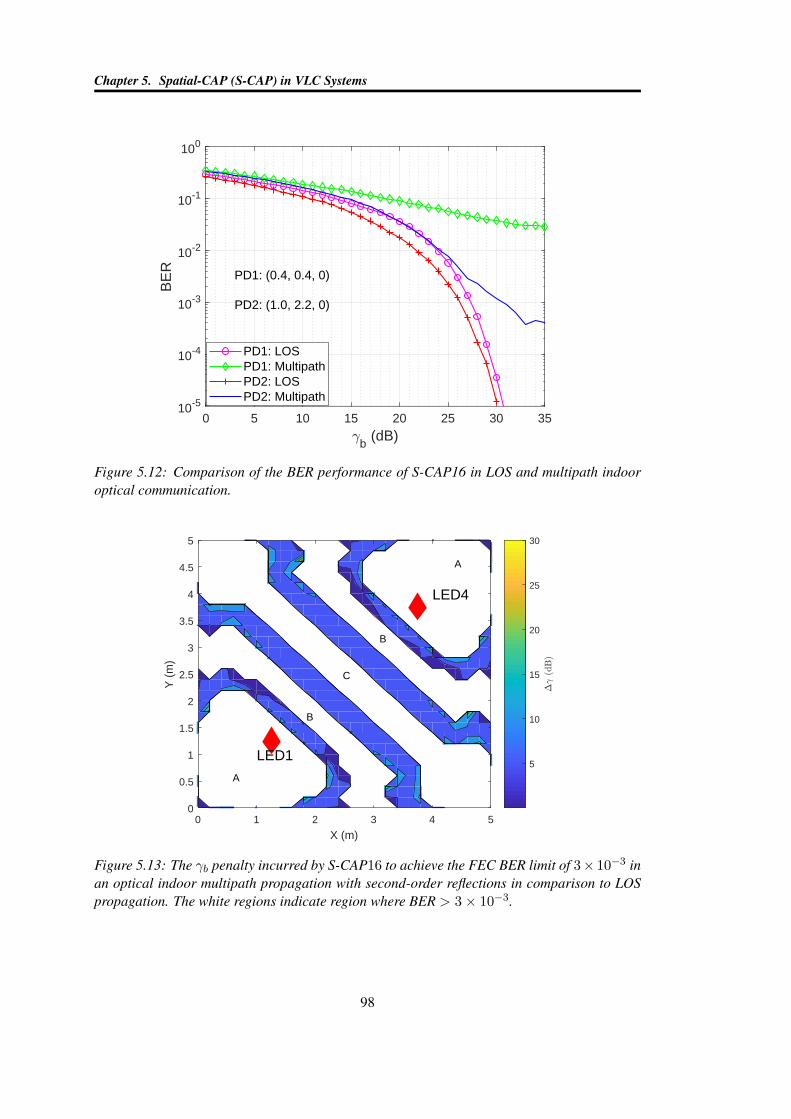
Chapter 5. Spatial-CAP (S-CAP) in VLC Systems
0 5 10 15 20 25 30 35
b (dB)
10-5
10-4
10-3
10-2
10-1
100
BE
R
PD1: LOSPD1: MultipathPD2: LOSPD2: Multipath
PD1: (0.4, 0.4, 0) PD2: (1.0, 2.2, 0)
Figure 5.12: Comparison of the BER performance of S-CAP16 in LOS and multipath indooroptical communication.
LED1
LED4
0 1 2 3 4 5
X (m)
0
0.5
1
1.5
2
2.5
3
3.5
4
4.5
5
Y (
m)
5
10
15
20
25
30
A
B
C
B
A
Figure 5.13: The γb penalty incurred by S-CAP16 to achieve the FEC BER limit of 3× 10⁻³ inan optical indoor multipath propagation with second-order reflections in comparison to LOSpropagation. The white regions indicate region where BER > 3× 10⁻³.
98
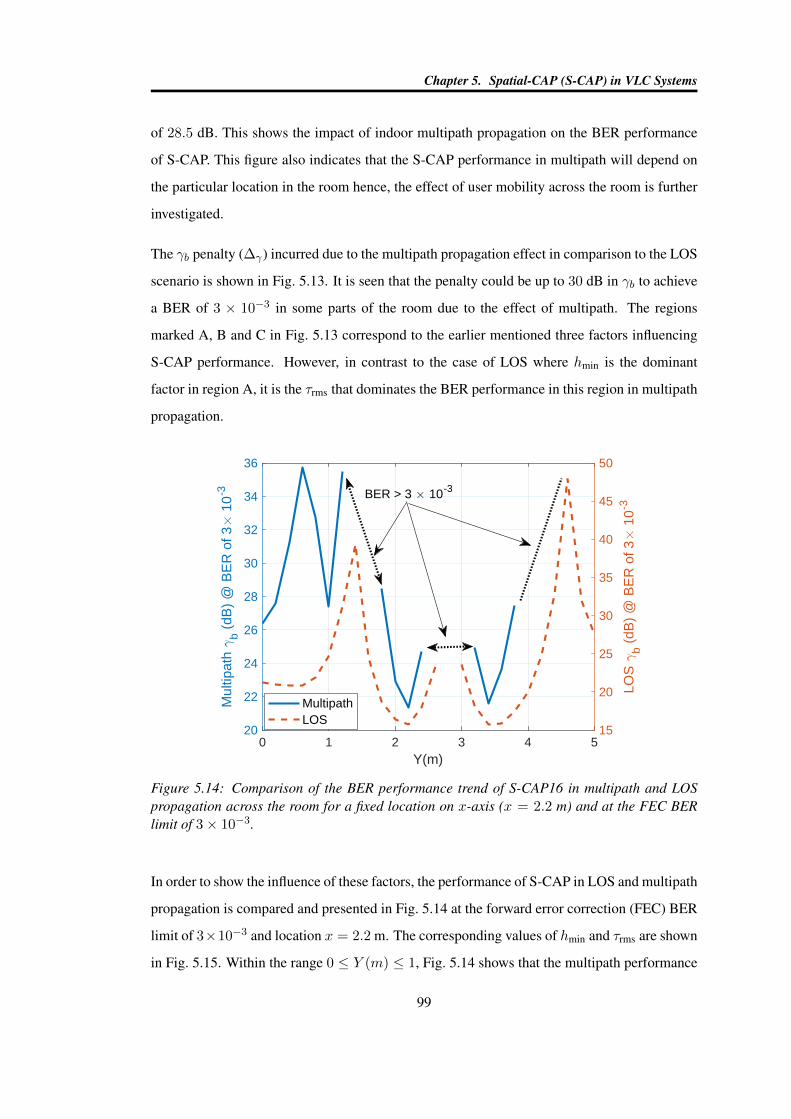
Chapter 5. Spatial-CAP (S-CAP) in VLC Systems
of 28.5 dB. This shows the impact of indoor multipath propagation on the BER performance
of S-CAP. This figure also indicates that the S-CAP performance in multipath will depend on
the particular location in the room hence, the effect of user mobility across the room is further
investigated.
The γb penalty (∆γ) incurred due to the multipath propagation effect in comparison to the LOS
scenario is shown in Fig. 5.13. It is seen that the penalty could be up to 30 dB in γb to achieve
a BER of 3 × 10⁻³ in some parts of the room due to the effect of multipath. The regions
marked A, B and C in Fig. 5.13 correspond to the earlier mentioned three factors influencing
S-CAP performance. However, in contrast to the case of LOS where hmin is the dominant
factor in region A, it is the τrms that dominates the BER performance in this region in multipath
propagation.
0 1 2 3 4 5Y(m)
20
22
24
26
28
30
32
34
36
Mul
tipat
h b (
dB)
@ B
ER
of 3
10
-3
15
20
25
30
35
40
45
50
LOS
b (
dB)
@ B
ER
of 3
10
-3
MultipathLOS
BER > 3 10-3
Figure 5.14: Comparison of the BER performance trend of S-CAP16 in multipath and LOSpropagation across the room for a fixed location on x-axis (x = 2.2 m) and at the FEC BERlimit of 3× 10⁻³.
In order to show the influence of these factors, the performance of S-CAP in LOS and multipath
propagation is compared and presented in Fig. 5.14 at the forward error correction (FEC) BER
limit of 3×10⁻³ and location x = 2.2 m. The corresponding values of hmin and τrms are shown
in Fig. 5.15. Within the range 0 ≤ Y (m) ≤ 1, Fig. 5.14 shows that the multipath performance
99
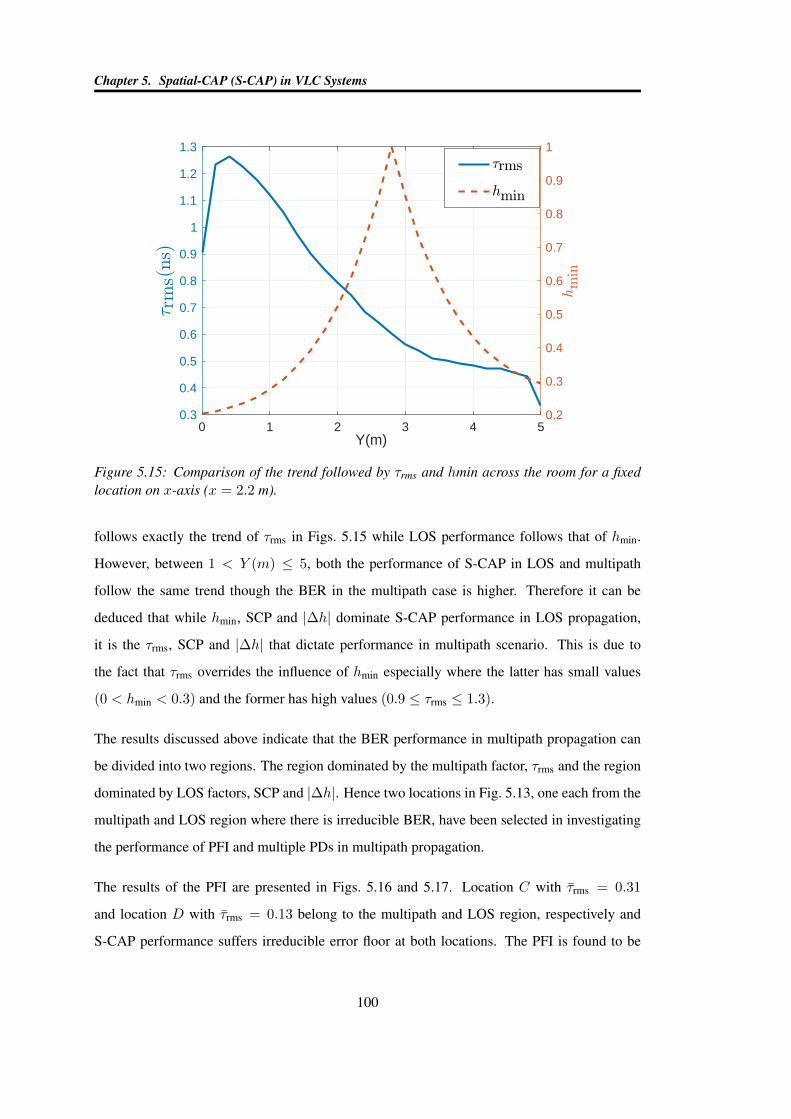
Chapter 5. Spatial-CAP (S-CAP) in VLC Systems
0 1 2 3 4 5Y(m)
0.3
0.4
0.5
0.6
0.7
0.8
0.9
1
1.1
1.2
1.3
0.2
0.3
0.4
0.5
0.6
0.7
0.8
0.9
1
Figure 5.15: Comparison of the trend followed by τrms and hmin across the room for a fixedlocation on x-axis (x = 2.2 m).
follows exactly the trend of τrms in Figs. 5.15 while LOS performance follows that of hmin.
However, between 1 < Y (m) ≤ 5, both the performance of S-CAP in LOS and multipath
follow the same trend though the BER in the multipath case is higher. Therefore it can be
deduced that while hmin, SCP and |∆h| dominate S-CAP performance in LOS propagation,
it is the τrms, SCP and |∆h| that dictate performance in multipath scenario. This is due to
the fact that τrms overrides the influence of hmin especially where the latter has small values
(0 < hmin < 0.3) and the former has high values (0.9 ≤ τrms ≤ 1.3).
The results discussed above indicate that the BER performance in multipath propagation can
be divided into two regions. The region dominated by the multipath factor, τrms and the region
dominated by LOS factors, SCP and |∆h|. Hence two locations in Fig. 5.13, one each from the
multipath and LOS region where there is irreducible BER, have been selected in investigating
the performance of PFI and multiple PDs in multipath propagation.
The results of the PFI are presented in Figs. 5.16 and 5.17. Location C with τrms = 0.31
and location D with τrms = 0.13 belong to the multipath and LOS region, respectively and
S-CAP performance suffers irreducible error floor at both locations. The PFI is found to be
100
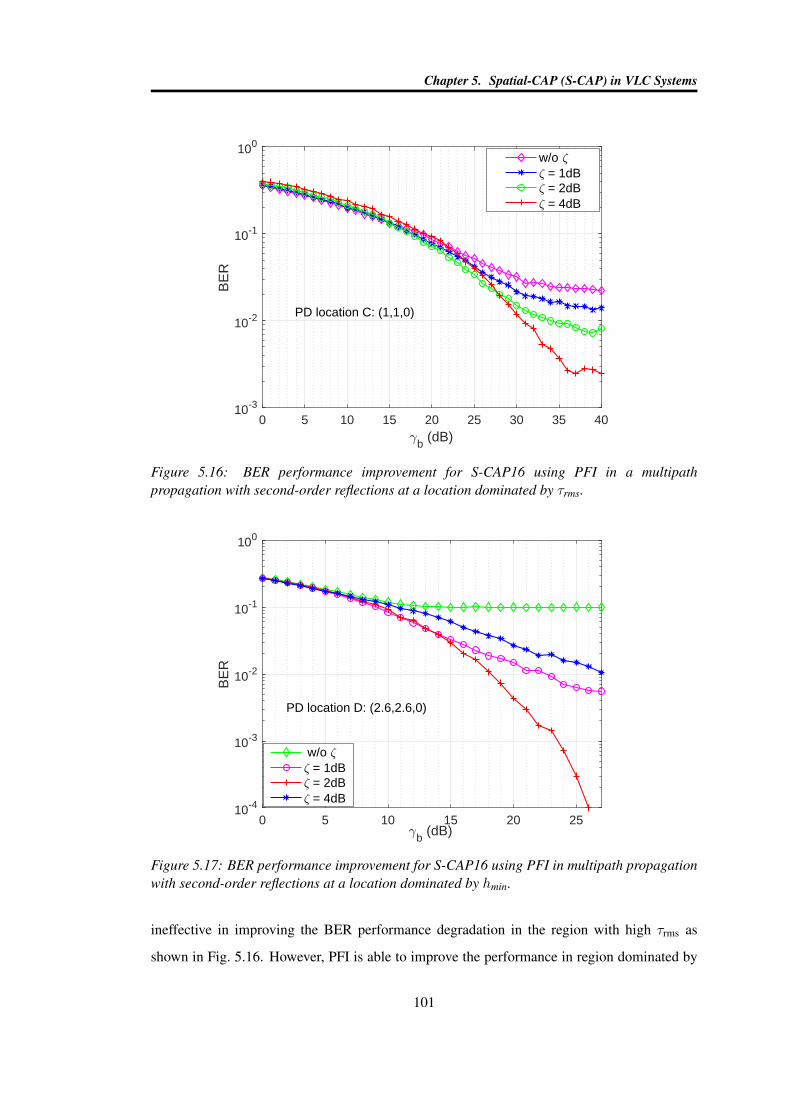
Chapter 5. Spatial-CAP (S-CAP) in VLC Systems
0 5 10 15 20 25 30 35 40
b (dB)
10-3
10-2
10-1
100
BE
R
w/o = 1dB = 2dB = 4dB
PD location C: (1,1,0)
Figure 5.16: BER performance improvement for S-CAP16 using PFI in a multipathpropagation with second-order reflections at a location dominated by τrms.
0 5 10 15 20 25b (dB)
10-4
10-3
10-2
10-1
100
BE
R
w/o = 1dB = 2dB = 4dB
PD location D: (2.6,2.6,0)
Figure 5.17: BER performance improvement for S-CAP16 using PFI in multipath propagationwith second-order reflections at a location dominated by hmin.
ineffective in improving the BER performance degradation in the region with high τrms as
shown in Fig. 5.16. However, PFI is able to improve the performance in region dominated by
101
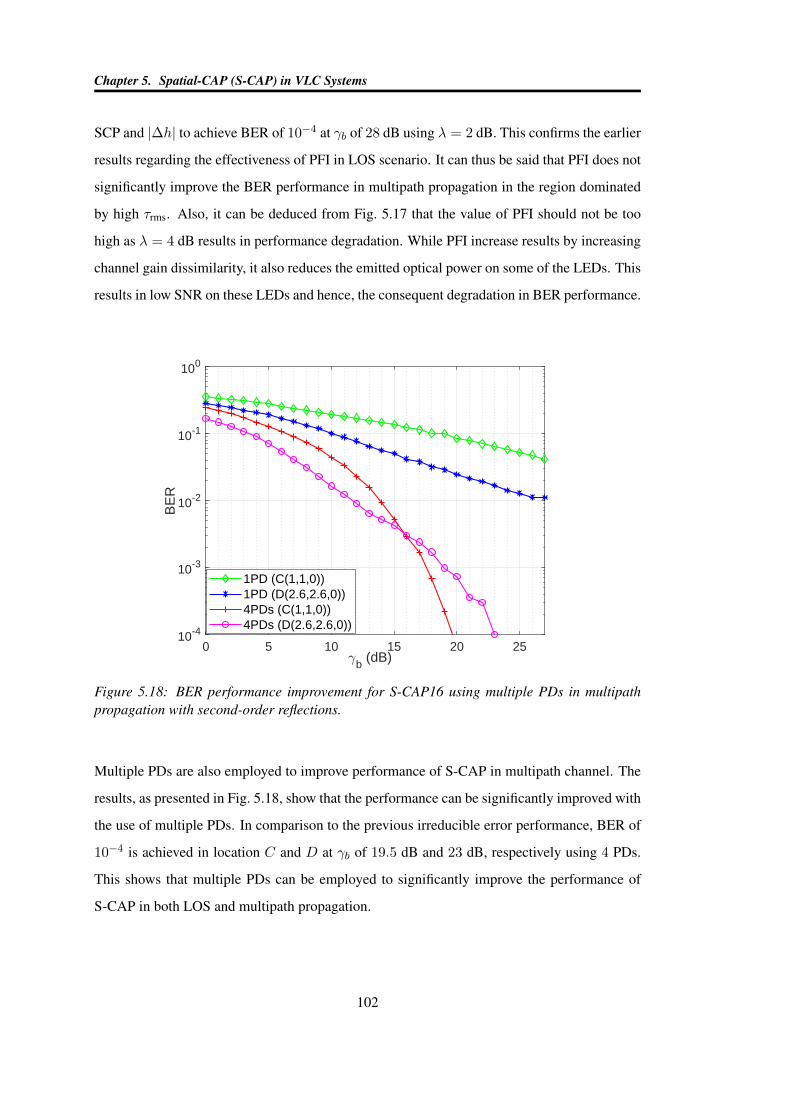
Chapter 5. Spatial-CAP (S-CAP) in VLC Systems
SCP and |∆h| to achieve BER of 10−4 at γb of 28 dB using λ = 2 dB. This confirms the earlier
results regarding the effectiveness of PFI in LOS scenario. It can thus be said that PFI does not
significantly improve the BER performance in multipath propagation in the region dominated
by high τrms. Also, it can be deduced from Fig. 5.17 that the value of PFI should not be too
high as λ = 4 dB results in performance degradation. While PFI increase results by increasing
channel gain dissimilarity, it also reduces the emitted optical power on some of the LEDs. This
results in low SNR on these LEDs and hence, the consequent degradation in BER performance.
0 5 10 15 20 25b (dB)
10-4
10-3
10-2
10-1
100
BE
R
1PD (C(1,1,0))1PD (D(2.6,2.6,0))4PDs (C(1,1,0))4PDs (D(2.6,2.6,0))
Figure 5.18: BER performance improvement for S-CAP16 using multiple PDs in multipathpropagation with second-order reflections.
Multiple PDs are also employed to improve performance of S-CAP in multipath channel. The
results, as presented in Fig. 5.18, show that the performance can be significantly improved with
the use of multiple PDs. In comparison to the previous irreducible error performance, BER of
10−4 is achieved in location C and D at γb of 19.5 dB and 23 dB, respectively using 4 PDs.
This shows that multiple PDs can be employed to significantly improve the performance of
S-CAP in both LOS and multipath propagation.
102
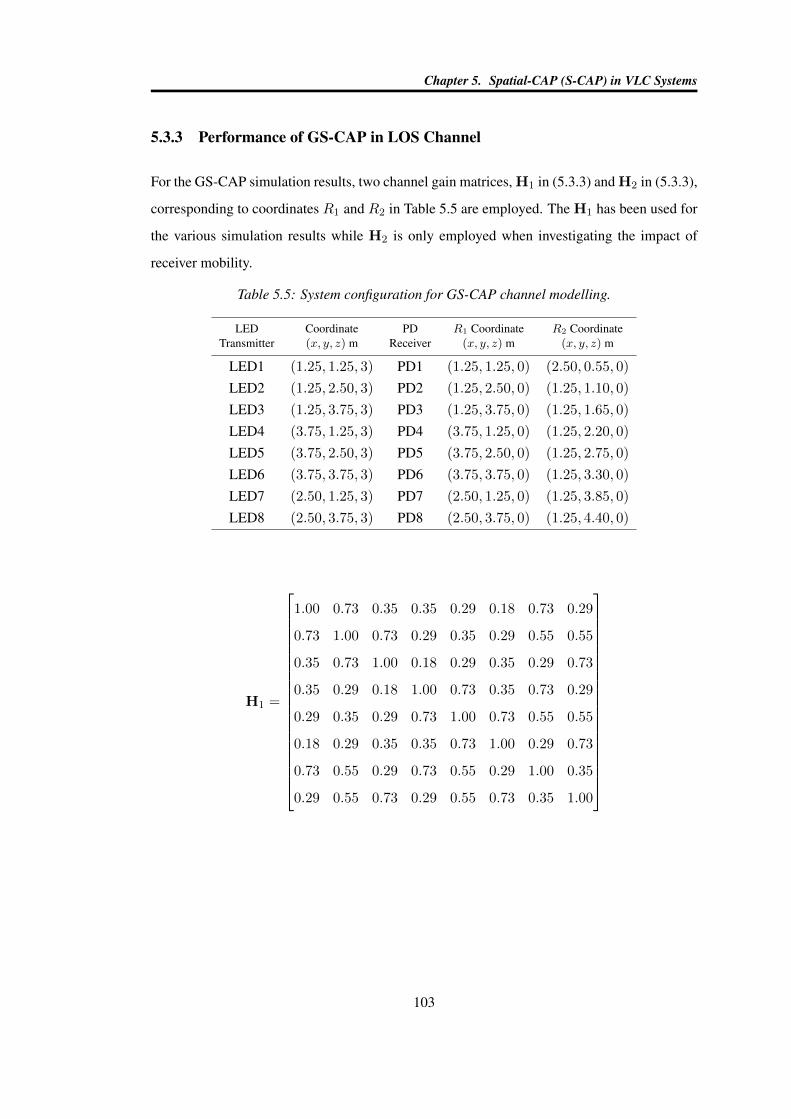
Chapter 5. Spatial-CAP (S-CAP) in VLC Systems
5.3.3 Performance of GS-CAP in LOS Channel
For the GS-CAP simulation results, two channel gain matrices, H1 in (5.3.3) and H2 in (5.3.3),
corresponding to coordinates R1 and R2 in Table 5.5 are employed. The H1 has been used for
the various simulation results while H2 is only employed when investigating the impact of
receiver mobility.
Table 5.5: System configuration for GS-CAP channel modelling.
LEDTransmitter
Coordinate(x, y, z) m
PDReceiver
R1 Coordinate(x, y, z) m
R2 Coordinate(x, y, z) m
LED1 (1.25, 1.25, 3) PD1 (1.25, 1.25, 0) (2.50, 0.55, 0)
LED2 (1.25, 2.50, 3) PD2 (1.25, 2.50, 0) (1.25, 1.10, 0)
LED3 (1.25, 3.75, 3) PD3 (1.25, 3.75, 0) (1.25, 1.65, 0)
LED4 (3.75, 1.25, 3) PD4 (3.75, 1.25, 0) (1.25, 2.20, 0)
LED5 (3.75, 2.50, 3) PD5 (3.75, 2.50, 0) (1.25, 2.75, 0)
LED6 (3.75, 3.75, 3) PD6 (3.75, 3.75, 0) (1.25, 3.30, 0)
LED7 (2.50, 1.25, 3) PD7 (2.50, 1.25, 0) (1.25, 3.85, 0)
LED8 (2.50, 3.75, 3) PD8 (2.50, 3.75, 0) (1.25, 4.40, 0)
H1 =
1.00 0.73 0.35 0.35 0.29 0.18 0.73 0.29
0.73 1.00 0.73 0.29 0.35 0.29 0.55 0.55
0.35 0.73 1.00 0.18 0.29 0.35 0.29 0.73
0.35 0.29 0.18 1.00 0.73 0.35 0.73 0.29
0.29 0.35 0.29 0.73 1.00 0.73 0.55 0.55
0.18 0.29 0.35 0.35 0.73 1.00 0.29 0.73
0.73 0.55 0.29 0.73 0.55 0.29 1.00 0.35
0.29 0.55 0.73 0.29 0.55 0.73 0.35 1.00
103
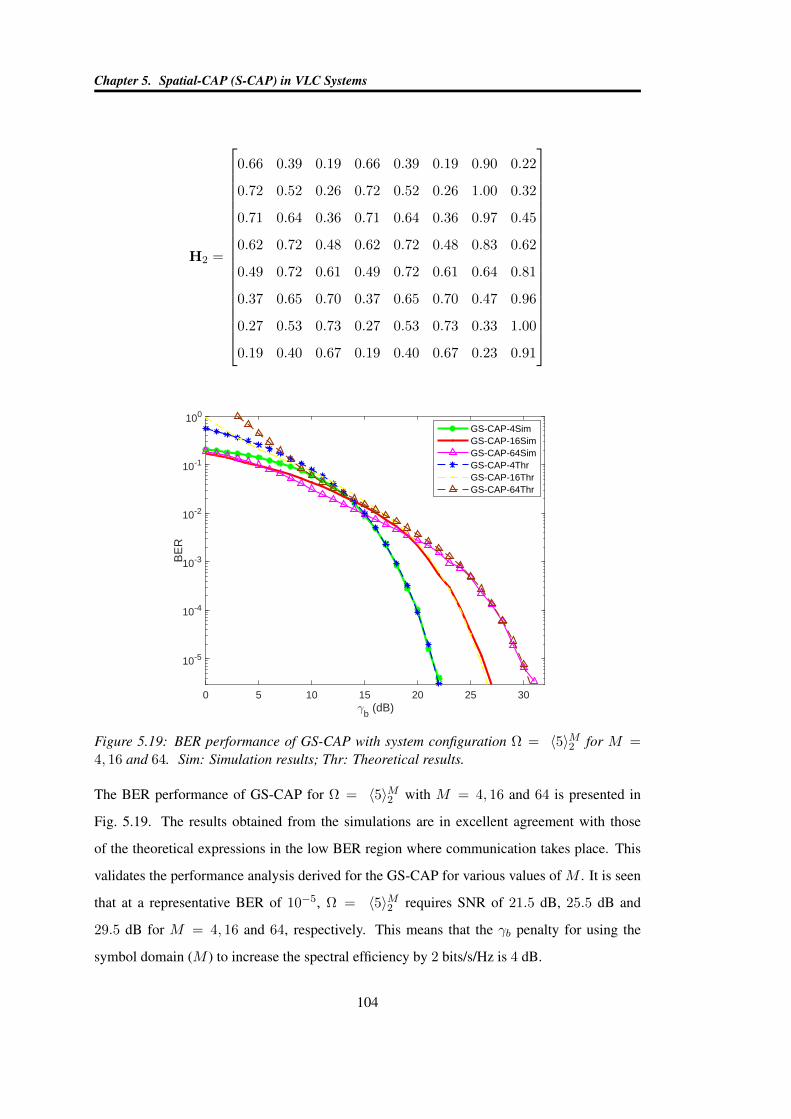
Chapter 5. Spatial-CAP (S-CAP) in VLC Systems
H2 =
0.66 0.39 0.19 0.66 0.39 0.19 0.90 0.22
0.72 0.52 0.26 0.72 0.52 0.26 1.00 0.32
0.71 0.64 0.36 0.71 0.64 0.36 0.97 0.45
0.62 0.72 0.48 0.62 0.72 0.48 0.83 0.62
0.49 0.72 0.61 0.49 0.72 0.61 0.64 0.81
0.37 0.65 0.70 0.37 0.65 0.70 0.47 0.96
0.27 0.53 0.73 0.27 0.53 0.73 0.33 1.00
0.19 0.40 0.67 0.19 0.40 0.67 0.23 0.91
0 5 10 15 20 25 30
b (dB)
10-5
10-4
10-3
10-2
10-1
100
BE
R
GS-CAP-4SimGS-CAP-16SimGS-CAP-64SimGS-CAP-4ThrGS-CAP-16ThrGS-CAP-64Thr
Figure 5.19: BER performance of GS-CAP with system configuration Ω = 〈5〉M2 for M =4, 16 and 64. Sim: Simulation results; Thr: Theoretical results.
The BER performance of GS-CAP for Ω = 〈5〉M2 with M = 4, 16 and 64 is presented in
Fig. 5.19. The results obtained from the simulations are in excellent agreement with those
of the theoretical expressions in the low BER region where communication takes place. This
validates the performance analysis derived for the GS-CAP for various values of M . It is seen
that at a representative BER of 10−5, Ω = 〈5〉M2 requires SNR of 21.5 dB, 25.5 dB and
29.5 dB for M = 4, 16 and 64, respectively. This means that the γb penalty for using the
symbol domain (M ) to increase the spectral efficiency by 2 bits/s/Hz is 4 dB.
104
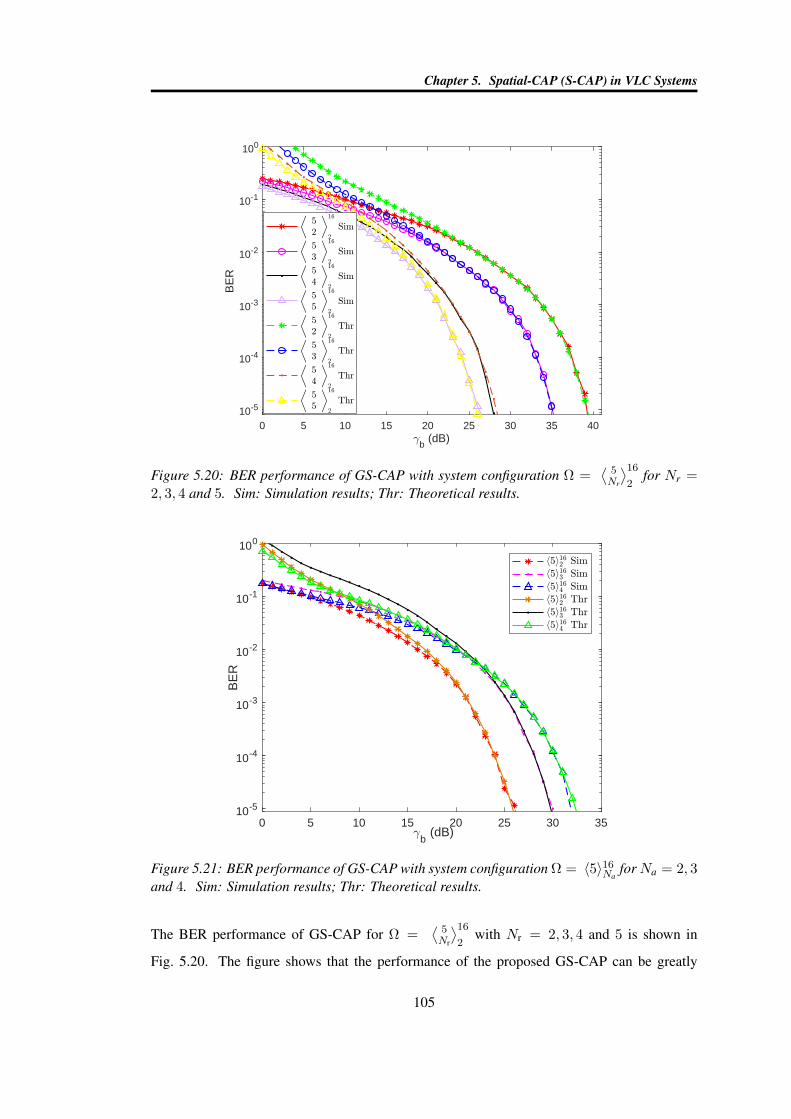
Chapter 5. Spatial-CAP (S-CAP) in VLC Systems
0 5 10 15 20 25 30 35 40
b (dB)
10-5
10-4
10-3
10-2
10-1
100
BE
R
Figure 5.20: BER performance of GS-CAP with system configuration Ω =⟨5Nr
⟩162
for Nr =2, 3, 4 and 5. Sim: Simulation results; Thr: Theoretical results.
0 5 10 15 20 25 30 35b (dB)
10-5
10-4
10-3
10-2
10-1
100
BE
R
Figure 5.21: BER performance of GS-CAP with system configuration Ω = 〈5〉16NaforNa = 2, 3
and 4. Sim: Simulation results; Thr: Theoretical results.
The BER performance of GS-CAP for Ω =⟨5Nr
⟩162
with Nr = 2, 3, 4 and 5 is shown in
Fig. 5.20. The figure shows that the performance of the proposed GS-CAP can be greatly
105
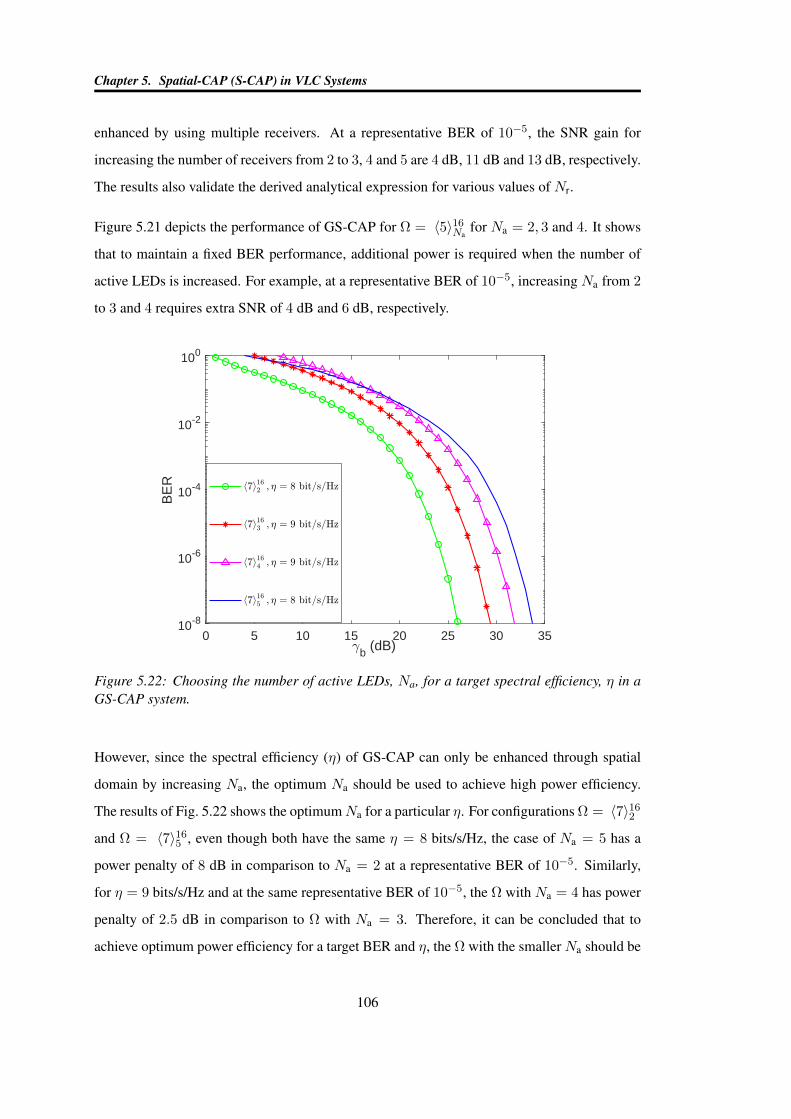
Chapter 5. Spatial-CAP (S-CAP) in VLC Systems
enhanced by using multiple receivers. At a representative BER of 10−5, the SNR gain for
increasing the number of receivers from 2 to 3, 4 and 5 are 4 dB, 11 dB and 13 dB, respectively.
The results also validate the derived analytical expression for various values of Nr.
Figure 5.21 depicts the performance of GS-CAP for Ω = 〈5〉16Nafor Na = 2, 3 and 4. It shows
that to maintain a fixed BER performance, additional power is required when the number of
active LEDs is increased. For example, at a representative BER of 10−5, increasing Na from 2
to 3 and 4 requires extra SNR of 4 dB and 6 dB, respectively.
0 5 10 15 20 25 30 35b (dB)
10-8
10-6
10-4
10-2
100
BE
R
Figure 5.22: Choosing the number of active LEDs, Na, for a target spectral efficiency, η in aGS-CAP system.
However, since the spectral efficiency (η) of GS-CAP can only be enhanced through spatial
domain by increasing Na, the optimum Na should be used to achieve high power efficiency.
The results of Fig. 5.22 shows the optimumNa for a particular η. For configurations Ω = 〈7〉162and Ω = 〈7〉165 , even though both have the same η = 8 bits/s/Hz, the case of Na = 5 has a
power penalty of 8 dB in comparison to Na = 2 at a representative BER of 10−5. Similarly,
for η = 9 bits/s/Hz and at the same representative BER of 10−5, the Ω with Na = 4 has power
penalty of 2.5 dB in comparison to Ω with Na = 3. Therefore, it can be concluded that to
achieve optimum power efficiency for a target BER and η, the Ω with the smaller Na should be
106
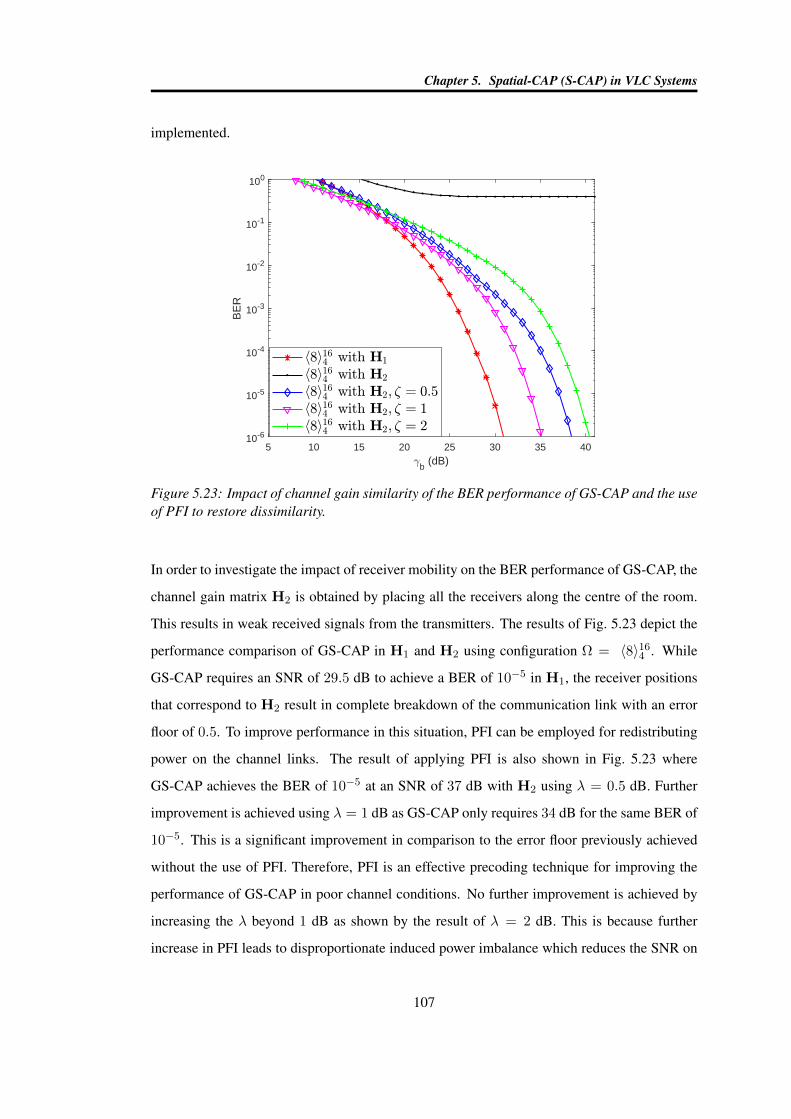
Chapter 5. Spatial-CAP (S-CAP) in VLC Systems
implemented.
5 10 15 20 25 30 35 40
b (dB)
10-6
10-5
10-4
10-3
10-2
10-1
100
BE
R
Figure 5.23: Impact of channel gain similarity of the BER performance of GS-CAP and the useof PFI to restore dissimilarity.
In order to investigate the impact of receiver mobility on the BER performance of GS-CAP, the
channel gain matrix H2 is obtained by placing all the receivers along the centre of the room.
This results in weak received signals from the transmitters. The results of Fig. 5.23 depict the
performance comparison of GS-CAP in H1 and H2 using configuration Ω = 〈8〉164 . While
GS-CAP requires an SNR of 29.5 dB to achieve a BER of 10−5 in H1, the receiver positions
that correspond to H2 result in complete breakdown of the communication link with an error
floor of 0.5. To improve performance in this situation, PFI can be employed for redistributing
power on the channel links. The result of applying PFI is also shown in Fig. 5.23 where
GS-CAP achieves the BER of 10−5 at an SNR of 37 dB with H2 using λ = 0.5 dB. Further
improvement is achieved using λ = 1 dB as GS-CAP only requires 34 dB for the same BER of
10−5. This is a significant improvement in comparison to the error floor previously achieved
without the use of PFI. Therefore, PFI is an effective precoding technique for improving the
performance of GS-CAP in poor channel conditions. No further improvement is achieved by
increasing the λ beyond 1 dB as shown by the result of λ = 2 dB. This is because further
increase in PFI leads to disproportionate induced power imbalance which reduces the SNR on
107
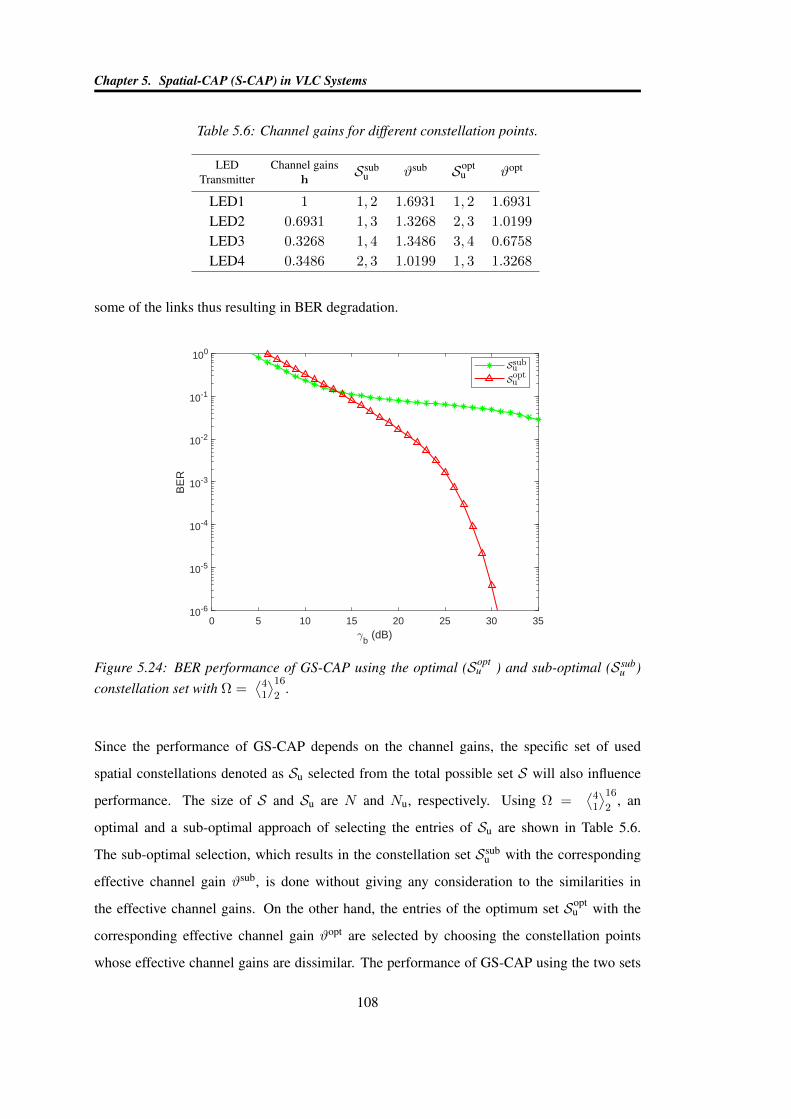
Chapter 5. Spatial-CAP (S-CAP) in VLC Systems
Table 5.6: Channel gains for different constellation points.
LEDTransmitter
Channel gainsh
Ssubu ϑsub Sopt
u ϑopt
LED1 1 1, 2 1.6931 1, 2 1.6931
LED2 0.6931 1, 3 1.3268 2, 3 1.0199
LED3 0.3268 1, 4 1.3486 3, 4 0.6758
LED4 0.3486 2, 3 1.0199 1, 3 1.3268
some of the links thus resulting in BER degradation.
0 5 10 15 20 25 30 35
b (dB)
10-6
10-5
10-4
10-3
10-2
10-1
100
BE
R
Figure 5.24: BER performance of GS-CAP using the optimal (Soptu ) and sub-optimal (Ssub
u )constellation set with Ω =
⟨41
⟩162
.
Since the performance of GS-CAP depends on the channel gains, the specific set of used
spatial constellations denoted as Su selected from the total possible set S will also influence
performance. The size of S and Su are N and Nu, respectively. Using Ω =⟨41
⟩162
, an
optimal and a sub-optimal approach of selecting the entries of Su are shown in Table 5.6.
The sub-optimal selection, which results in the constellation set Ssubu with the corresponding
effective channel gain ϑsub, is done without giving any consideration to the similarities in
the effective channel gains. On the other hand, the entries of the optimum set Soptu with the
corresponding effective channel gain ϑopt are selected by choosing the constellation points
whose effective channel gains are dissimilar. The performance of GS-CAP using the two sets
108
Chapter 5. Spatial-CAP (S-CAP) in VLC Systems
is presented in Fig. 5.24. The figure shows that while GS-CAP performance results in error
floor when using the sub-optimal set, the use of the optimal set results in a BER of 10−5 at an
SNR of 29 dB. This result highlights the importance of selecting an optimal constellation set
for GS-CAP system.
5.4 Summary of Chapter 5
Spatial carrierless amplitude and phase modulation (S-CAP) has been developed as a
low-complexity, spectrally-efficient scheme for visible light communication system. The
S-CAP improves the spectral efficiency of the conventional CAP scheme by a factor
of logM (MNt). An analytical expression for the BER performance of S-CAP in LOS
propagation is derived and verified via simulation. It is found that the BER performance
of S-CAP in LOS propagation is dictated by the minimum of the channel gains hmin, the
signal constellation points, SCP and the channel dissimilarity, ∆|h|. While in multipath
propagation, the channel RMS delay spread τrms overrides the influence of hmin. The impact
of multipath propagation due to second-order reflections on the performance of S-CAP is
also reported. Considering user mobility across the room at the FEC BER limit of 3 × 10⁻³,
multipath propagation results in up to 30 dB SNR penalty in some parts of the room. Both
power factor imbalance (PFI) and the use of multiple photodiode receivers (multiple PDs) are
then introduced as performance enhancing techniques. PFI is found to be very effective in
improving performance for LOS scenario resulting in SNR gain of 33.5 dB for PFI = 2 dB
while it is largely ineffective in multipath scenario when the performance is dominated by high
τrms. In contrast, multiple PDs are able to significantly improve the performance of S-CAP in
both LOS and multipath channels leading to 43 dB SNR gain with the use of four PDs.
Generalised spatial carrierless amplitude and phase modulation (GS-CAP) is also developed to
improve on the spectral efficiency of S-CAP. The theoretical analysis for the BER performance
of the GS-CAP is presented and shown to be in excellent agreement with the simulation results
for various system parameters. It is found that for different GS-CAP system configurations
with the same spectral efficiency, the configuration with the lowest number of active LEDs
results in optimum power efficiency (SNR) and BER performance. It is also shown that while
the GS-CAP performance degrades due to receiver mobility, PFI precoding technique can be
employed to significantly improve its performance.
109
Chapter 6
Subband Index CAP Modulation (SI-CAP)
The challenge with the MIMO and spatial approaches that are developed in chapters 4 and
5 for CAP modulation is that they require distinct channel gains for optimal performance
and this might not be available especially for mobile VLC systems [169]. As an alternative,
the available link bandwidth can be subdivided to realise multi-band CAP (m-CAP) with
improved tolerance towards channel non-linearity effect [24, 116]. The m-CAP scheme
has been experimentally demonstrated to offer improved BER performance for optical
communication systems [24, 25]. Despite its BER improvement, the m-CAP scheme does not
improve the spectral efficiency of the conventional CAP system. In addition, m-CAP suffers
the same high PAPR problem inherent in multi-carrier systems. Therefore, subband index
CAP (SI-CAP) is introduced in this chapter to improve on the spectral and energy efficiency
of the m-CAP system.
The SI-CAP works by modulating some of the subbands (termed active subbands) of m-CAP
with data symbols. It then make up on the lost spectral efficiency by encoding additional
bits in the selection of the active/inactive subband indices. Additionally, a detection scheme
is developed for SI-CAP that achieves maximum likelihood (ML) performance at lower
complexity. Furthermore, as will be shown, a proper configuration of the SI-CAP system
parameters results in higher throughput beyond the maximum log2(M) bits per channel use
(bpcu) possible in m-CAP. The performance gain of SI-CAP is demonstrated using theoretical
analysis, simulations and experimental demonstrations in both VLC and SI-POF. An adaptive
equalization technique is further implemented which results in higher gain for the proposed
SI-CAP.
During each symbol duration, the SI-CAP scheme transmits unique M -QAM symbol on each
Na active subbands out of the total N subbands available. Though, there are NCNa possible
110
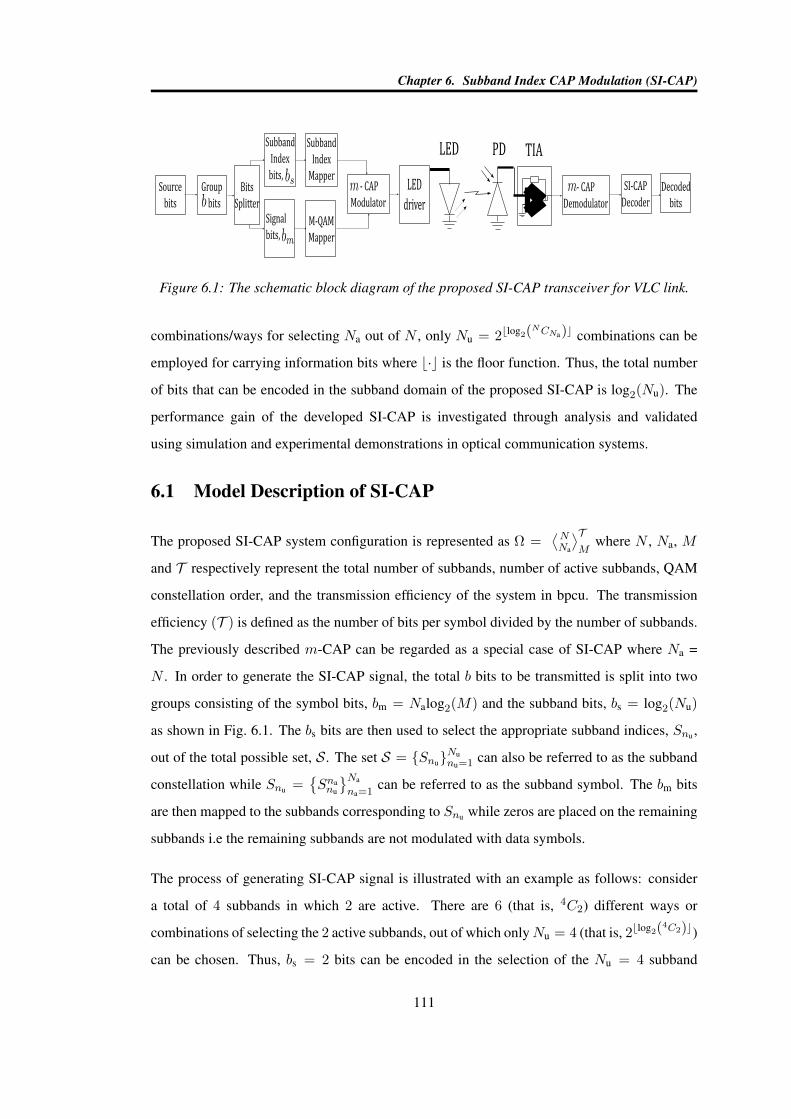
Chapter 6. Subband Index CAP Modulation (SI-CAP)
Source
bits
Group
bits
LED
LED
driver
PD TIASubband
Index
MapperSI-CAP
Decoder
Decoded
bits
- CAP
Modulator
- CAP
Demodulator
M-QAM
Mapper
Bits
Splitter
Subband
Index
bits,
Signal
bits,
Figure 6.1: The schematic block diagram of the proposed SI-CAP transceiver for VLC link.
combinations/ways for selecting Na out of N , only Nu = 2blog2(NCNa)c combinations can be
employed for carrying information bits where b·c is the floor function. Thus, the total number
of bits that can be encoded in the subband domain of the proposed SI-CAP is log2(Nu). The
performance gain of the developed SI-CAP is investigated through analysis and validated
using simulation and experimental demonstrations in optical communication systems.
6.1 Model Description of SI-CAP
The proposed SI-CAP system configuration is represented as Ω =⟨NNa
⟩TM
where N , Na, M
and T respectively represent the total number of subbands, number of active subbands, QAM
constellation order, and the transmission efficiency of the system in bpcu. The transmission
efficiency (T ) is defined as the number of bits per symbol divided by the number of subbands.
The previously described m-CAP can be regarded as a special case of SI-CAP where Na =
N . In order to generate the SI-CAP signal, the total b bits to be transmitted is split into two
groups consisting of the symbol bits, bm = Nalog2(M) and the subband bits, bs = log2(Nu)
as shown in Fig. 6.1. The bs bits are then used to select the appropriate subband indices, Snu ,
out of the total possible set, S. The set S = SnuNunu=1 can also be referred to as the subband
constellation while Snu =Snanu
Na
na=1can be referred to as the subband symbol. The bm bits
are then mapped to the subbands corresponding to Snu while zeros are placed on the remaining
subbands i.e the remaining subbands are not modulated with data symbols.
The process of generating SI-CAP signal is illustrated with an example as follows: consider
a total of 4 subbands in which 2 are active. There are 6 (that is, 4C2) different ways or
combinations of selecting the 2 active subbands, out of which onlyNu = 4 (that is, 2blog2(4C2)c)
can be chosen. Thus, bs = 2 bits can be encoded in the selection of the Nu = 4 subband
111
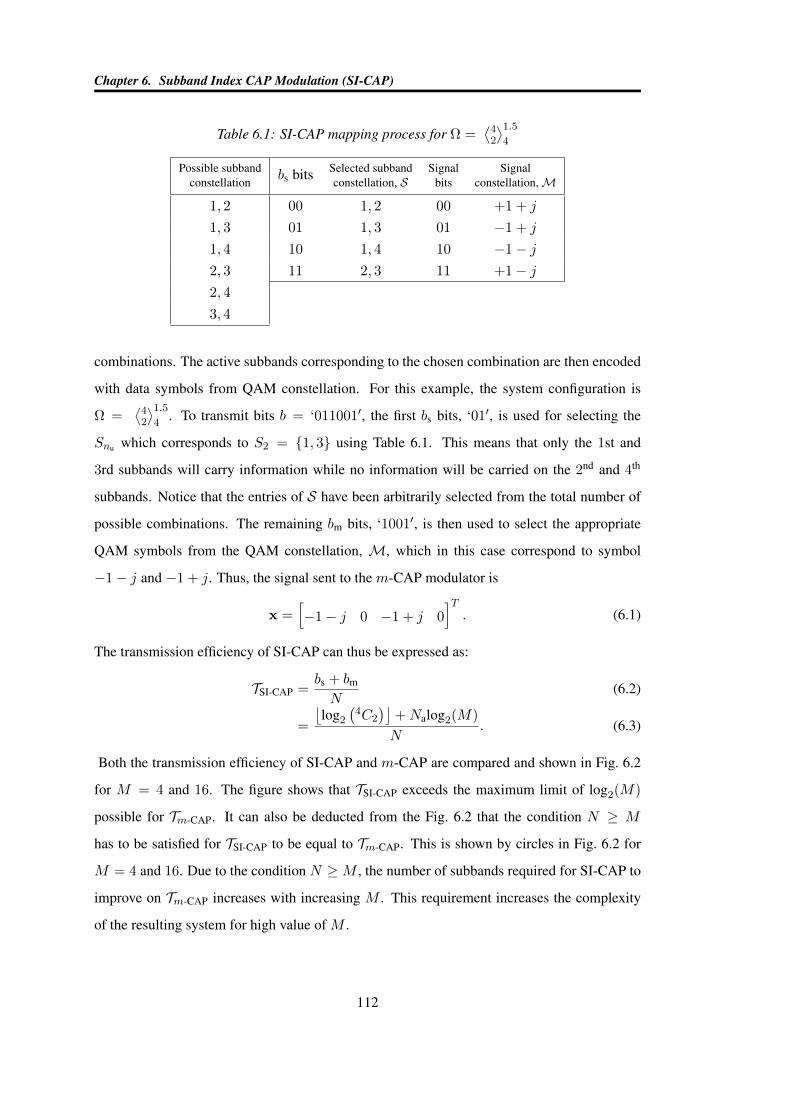
Chapter 6. Subband Index CAP Modulation (SI-CAP)
Table 6.1: SI-CAP mapping process for Ω =⟨42
⟩1.54
Possible subbandconstellation
bs bits Selected subbandconstellation, S
Signalbits
Signalconstellation, M
1, 2 00 1, 2 00 +1 + j
1, 3 01 1, 3 01 −1 + j
1, 4 10 1, 4 10 −1− j2, 3 11 2, 3 11 +1− j2, 4
3, 4
combinations. The active subbands corresponding to the chosen combination are then encoded
with data symbols from QAM constellation. For this example, the system configuration is
Ω =⟨42
⟩1.54
. To transmit bits b = ‘011001′, the first bs bits, ‘01′, is used for selecting the
Snu which corresponds to S2 = 1, 3 using Table 6.1. This means that only the 1st and
3rd subbands will carry information while no information will be carried on the 2nd and 4th
subbands. Notice that the entries of S have been arbitrarily selected from the total number of
possible combinations. The remaining bm bits, ‘1001′, is then used to select the appropriate
QAM symbols from the QAM constellation, M, which in this case correspond to symbol
−1− j and −1 + j. Thus, the signal sent to the m-CAP modulator is
x =[−1− j 0 −1 + j 0
]T. (6.1)
The transmission efficiency of SI-CAP can thus be expressed as:
TSI-CAP =bs + bm
N(6.2)
=
⌊log2
(4C2
)⌋+Nalog2(M)
N. (6.3)
Both the transmission efficiency of SI-CAP and m-CAP are compared and shown in Fig. 6.2
for M = 4 and 16. The figure shows that TSI-CAP exceeds the maximum limit of log2(M)
possible for Tm-CAP. It can also be deducted from the Fig. 6.2 that the condition N ≥ M
has to be satisfied for TSI-CAP to be equal to Tm-CAP. This is shown by circles in Fig. 6.2 for
M = 4 and 16. Due to the condition N ≥M , the number of subbands required for SI-CAP to
improve on Tm-CAP increases with increasing M . This requirement increases the complexity
of the resulting system for high value of M .
112
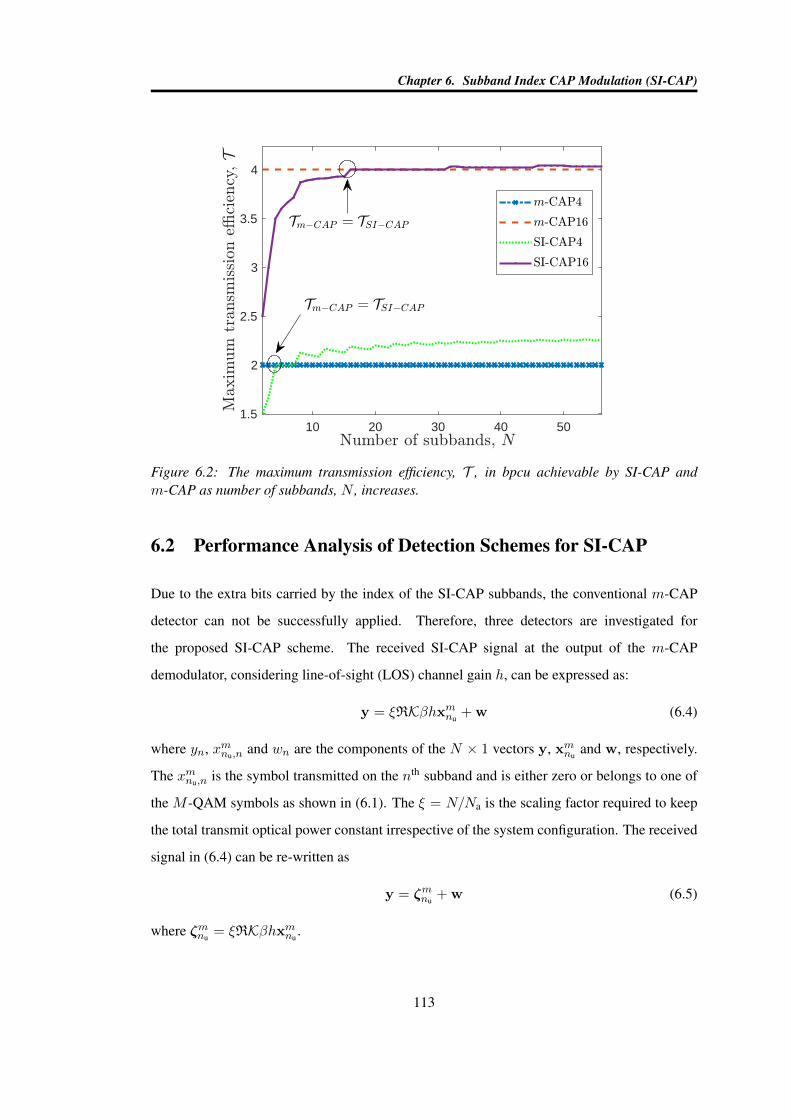
Chapter 6. Subband Index CAP Modulation (SI-CAP)
10 20 30 40 501.5
2
2.5
3
3.5
4
Figure 6.2: The maximum transmission efficiency, T , in bpcu achievable by SI-CAP andm-CAP as number of subbands, N , increases.
6.2 Performance Analysis of Detection Schemes for SI-CAP
Due to the extra bits carried by the index of the SI-CAP subbands, the conventional m-CAP
detector can not be successfully applied. Therefore, three detectors are investigated for
the proposed SI-CAP scheme. The received SI-CAP signal at the output of the m-CAP
demodulator, considering line-of-sight (LOS) channel gain h, can be expressed as:
y = ξRKβhxmnu+ w (6.4)
where yn, xmnu,n and wn are the components of the N × 1 vectors y, xmnuand w, respectively.
The xmnu,n is the symbol transmitted on the nth subband and is either zero or belongs to one of
the M -QAM symbols as shown in (6.1). The ξ = N/Na is the scaling factor required to keep
the total transmit optical power constant irrespective of the system configuration. The received
signal in (6.4) can be re-written as
y = ζmnu+ w (6.5)
where ζmnu= ξRKβhxmnu
.
113
Chapter 6. Subband Index CAP Modulation (SI-CAP)
6.2.1 BER Derivation for Maximum Likelihood Detector (MLD)
The performance analysis of the proposed SI-CAP is derived based on the ML detector. The
MLD is the optimum detector for SI-CAP considering the fact that its symbols,xmnu
, are
equiprobable with p(xmnu) = 1/NuM
Na . As a result, the decision criteria for MLD can be
expressed as [170]:
xmnu= arg max
nu,mp(y, ζmnu
) (6.6)
where
p(y, ζmnu) =
1
(2πN0)N/2exp
[−∥∥y − ζmnu
∥∥22N0
](6.7)
due to the AWGN channel. The criterion in (6.6) can be reduced to
xmnu= arg min
nu,mD(y, ζmnu
) (6.8)
where
D(y, ζmnu) =
∥∥y − ζmnu
∥∥2 . (6.9)
The MED criterion of (6.8) becomes
D(y, ζmnu) = ‖w‖2 (6.10)
in case the detector makes the correct decision, otherwise
D(y, ζmnu) =
∥∥∥ζmnu− ζmnu
−w∥∥∥2 . (6.11)
Using (6.10) and (6.11), the PEP of SI-CAP can be derived as:
PEPSI-CAP = p(xmnu→ xmnu
)
= p(D(y, ζmnu) > D(y, ζmnu
))
= Q
√(ξRKβ)2
2N0
∥∥h (xmnu− xmnu
)∥∥2 . (6.12)
The PEP of (6.12) is used to obtain an upper bound on the BER of SI-CAP, as shown in (6.13),
by considering all possible NuMNa symbol combinations using union bound technique.
Though the optimum detector for SI-CAP is MLD, its computational complexity is prohibitive
as it searches NuMNa symbol combinations in order to make decision. As a result, two lower
114
Chapter 6. Subband Index CAP Modulation (SI-CAP)
BERSI-CAP ≤1
NuMNa log2(NuMNa)
Nu∑nu=1
MNa∑m=1
Nu∑nu=1
MNa∑m=1
NH(bmnu , bmnu)
Q
√(ξRKβ)2
2N0
∥∥h (xmnu− xmnu
)∥∥2 . (6.13)
complexity detectors are further investigated.
6.2.2 SI-CAP with Log-Likelihood Ratio Detector (LLR)
The LLR computes the logarithm of the ratio between the a posteriori probabilities of the
SI-CAP symbols in each subband considering the fact that they are either zero or drawn from
M. Thus, the LLR is formulated as [170]:
χn = ln∑M
i=1 Pr(xn = mi|yn)
Pr(xn = 0|yn)(6.14)
where mi ∈M. Using Bayes’ theorem, (6.14) can be written as:
χn = ln∑M
i=1 Pr(yn|xn = mi)Pr(xn = mi)
Pr(yn|xn = 0)Pr(xn = 0). (6.15)
Given the AWGN corrupted channel,
Pr(yn|xn = mi) =1
(2πN0)1/2exp
[−|yn −mihn|2
2N0
](6.16)
while
Pr(yn|xn = 0) =1
(2πN0)1/2exp
[−|yn|
2
2N0
]. (6.17)
Therefore, considering the fact that Pr(yn|xn = mi) = Na/N and Pr(yn|xn = 0) = (N −
Na)/N , the expression in (6.15) can be expressed as:
χn = ln(
Na
N −Na
)+|yn|2
N0+ ln
(M∑i=1
exp
[−|yn −mihn|2
2N0
]). (6.18)
To avoid computational overflow when computing the last term of (6.18), the Jacobian
logarithm is employed [171, 172]. The indices of the first Na entries of the computed χn
when sorted in descending order correspond to the indices of the active subbands, Snu .
Thereafter, M -QAM decoder is used to decode the symbols on the detected active subbands.
It can be seen from (6.18) that the complexity of LLR is of O(NM), the same as the
115
Chapter 6. Subband Index CAP Modulation (SI-CAP)
conventional m-CAP. In addition, though the LLR is a near-ML decoder as it does not use
all the possible combinations of symbols, it will be shown in the results section that it does
achieve the same error rate performance as the MLD.
Finally, it is possible for LLR to detect some Snu /∈ S when the noise variance is very high. In
such cases, the detected indices can be randomly mapped to any entry of S since it is already
an error event.
6.2.3 SI-CAP with Low Complexity Detector (LCD)
In comparison to MLD, the LLR achieves the same solution at significantly lower complexity.
However, LLR requires the knowledge of the noise variance and is susceptible to computational
overflow [170, 172]. In order to address these concerns, a novel low complexity detection
(LCD) scheme is proposed. The LCD makes use of prior knowledge of the constellation by
directly comparing the received symbol in each subband to the entries ofM. The formulation
for LCD can be expressed as:
λn,i = mini|yn −mihn|2. (6.19)
The expression in (6.19) stores both the minimum value, λn and its corresponding index,
λn,i. Consequently, the subbands corresponding to the first Na entries of λn when sorted
in ascending order are chosen as the active subbands. In addition, the mi with λn,i that
correspond to those Na entries are chosen as the symbols on the active subbands. Thus, it can
be seen that the complexity of LCD is also ofO(NM) but with less number of computations in
comparison with LLR. This is because the LCD of (6.19) only computes a part of the last term
of (6.18) to complete its detection process. Whereas, the LLR detection still require M -QAM
decoding after evaluating all the terms in (6.18). Furthermore, the LCD is not susceptible to
computational overflow like LLR and does not contain the noise variance in its expression. In
addition, LCD achieves the same performance as the ML and LLR detectors.
However, the LCD is also liable to decide on some Snu /∈ S. In such cases, the random mapping
solution employed for LLR is implemented.
116
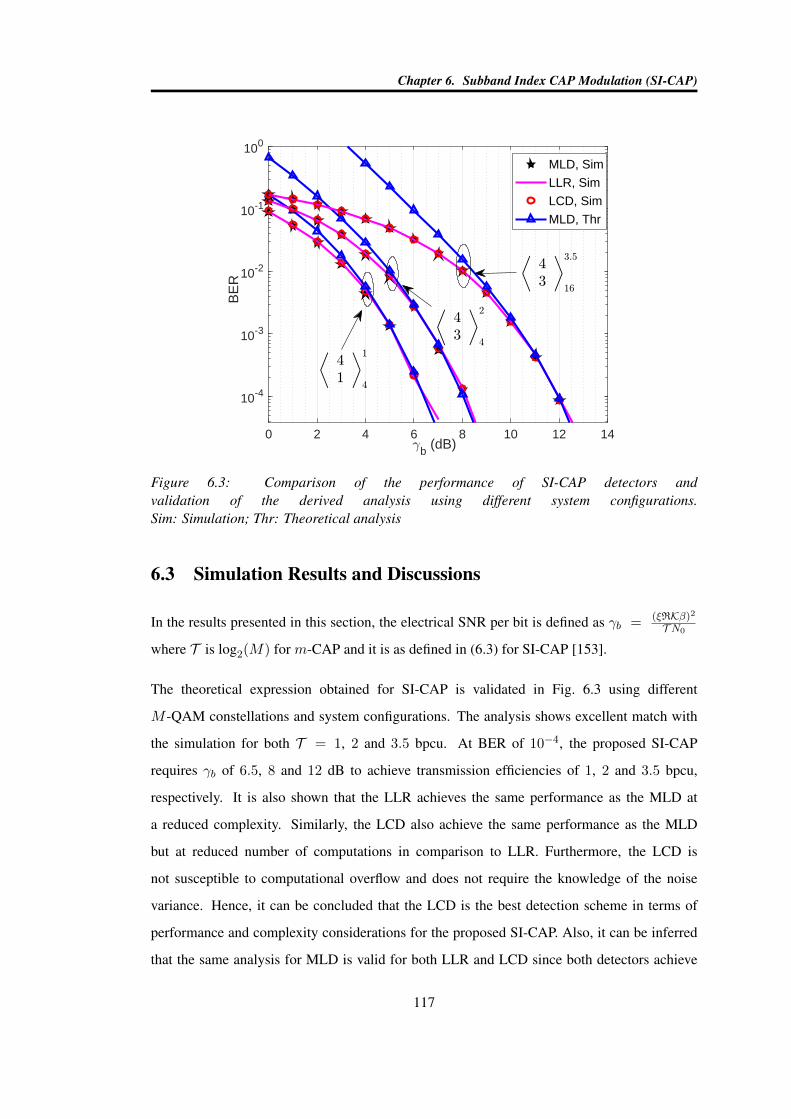
Chapter 6. Subband Index CAP Modulation (SI-CAP)
0 2 4 6 8 10 12 14b (dB)
10-4
10-3
10-2
10-1
100
BE
R
MLD, Sim
LLR, Sim
LCD, Sim
MLD, Thr
Figure 6.3: Comparison of the performance of SI-CAP detectors andvalidation of the derived analysis using different system configurations.Sim: Simulation; Thr: Theoretical analysis
6.3 Simulation Results and Discussions
In the results presented in this section, the electrical SNR per bit is defined as γb = (ξRKβ)2T N0
where T is log2(M) for m-CAP and it is as defined in (6.3) for SI-CAP [153].
The theoretical expression obtained for SI-CAP is validated in Fig. 6.3 using different
M -QAM constellations and system configurations. The analysis shows excellent match with
the simulation for both T = 1, 2 and 3.5 bpcu. At BER of 10−4, the proposed SI-CAP
requires γb of 6.5, 8 and 12 dB to achieve transmission efficiencies of 1, 2 and 3.5 bpcu,
respectively. It is also shown that the LLR achieves the same performance as the MLD at
a reduced complexity. Similarly, the LCD also achieve the same performance as the MLD
but at reduced number of computations in comparison to LLR. Furthermore, the LCD is
not susceptible to computational overflow and does not require the knowledge of the noise
variance. Hence, it can be concluded that the LCD is the best detection scheme in terms of
performance and complexity considerations for the proposed SI-CAP. Also, it can be inferred
that the same analysis for MLD is valid for both LLR and LCD since both detectors achieve
117
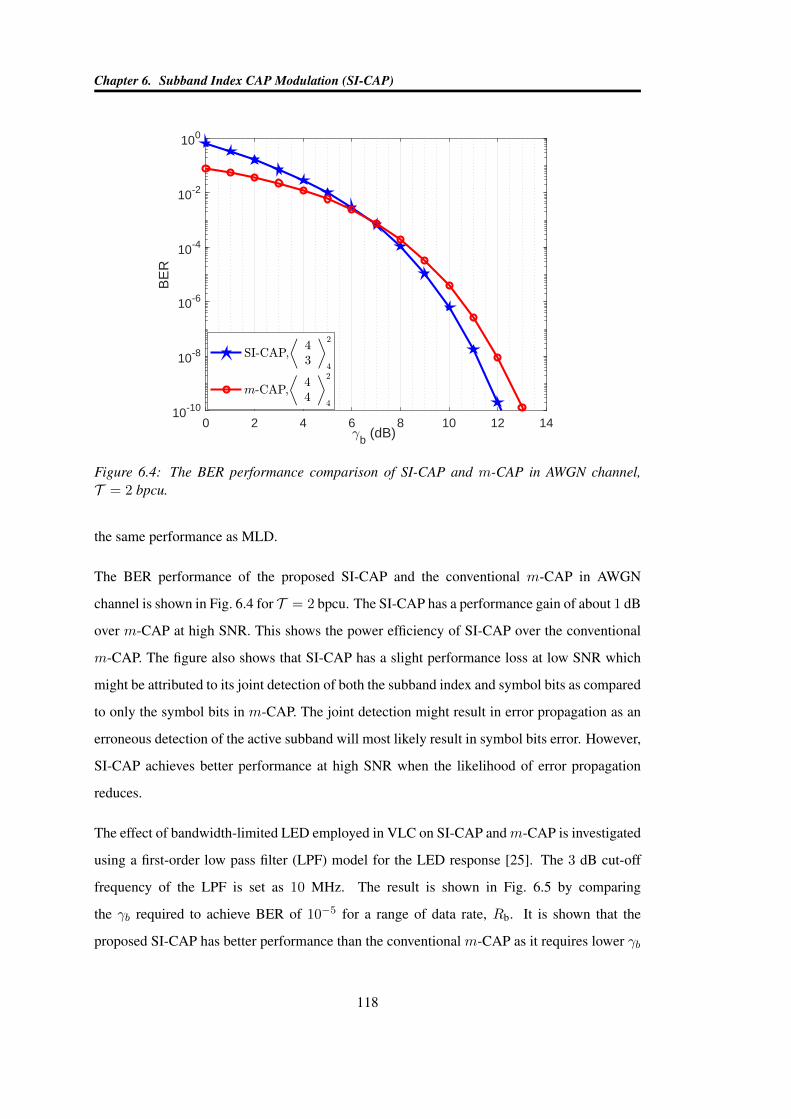
Chapter 6. Subband Index CAP Modulation (SI-CAP)
0 2 4 6 8 10 12 14b (dB)
10-10
10-8
10-6
10-4
10-2
100
BE
R
Figure 6.4: The BER performance comparison of SI-CAP and m-CAP in AWGN channel,T = 2 bpcu.
the same performance as MLD.
The BER performance of the proposed SI-CAP and the conventional m-CAP in AWGN
channel is shown in Fig. 6.4 for T = 2 bpcu. The SI-CAP has a performance gain of about 1 dB
over m-CAP at high SNR. This shows the power efficiency of SI-CAP over the conventional
m-CAP. The figure also shows that SI-CAP has a slight performance loss at low SNR which
might be attributed to its joint detection of both the subband index and symbol bits as compared
to only the symbol bits in m-CAP. The joint detection might result in error propagation as an
erroneous detection of the active subband will most likely result in symbol bits error. However,
SI-CAP achieves better performance at high SNR when the likelihood of error propagation
reduces.
The effect of bandwidth-limited LED employed in VLC on SI-CAP andm-CAP is investigated
using a first-order low pass filter (LPF) model for the LED response [25]. The 3 dB cut-off
frequency of the LPF is set as 10 MHz. The result is shown in Fig. 6.5 by comparing
the γb required to achieve BER of 10−5 for a range of data rate, Rb. It is shown that the
proposed SI-CAP has better performance than the conventional m-CAP as it requires lower γb
118

Chapter 6. Subband Index CAP Modulation (SI-CAP)
60 80 100 120 140 16016
17
18
19
20
21
22(b)
20 40 60 80Data rate, Rb (Mb/s)
10
11
12
13
14
15
16
17
18
b req
uire
d to
ach
ieve
BE
R o
f 10-5
(dB
) (a) (b)
Figure 6.5: Comparison of the γb required by SI-CAP and m-CAP to achieve BER of 10−5 atvarying Rb in a VLC system modelled using a first-order low pass filter with a 10 MHz 3 dBcut-off frequency, T = 2 and 4 bpcu.
to achieve the same data rate. For example, to achieve BER of 10−5 at Rb = 50 Mb/s, SI-CAP
requires about 13.2 dB compare to 15.7 dB required by m-CAP as shown in Fig. 6.5 (a).
This results in an γb gain of 2.5 dB for SI-CAP over m-CAP. Alternatively, with an γb of
15 dB, SI-CAP achievesRb of 74 Mb/s in comparison to 47.5 Mb/s achieved bym-CAP which
leads to 26.5 Mb/s improvement in Rb. The SI-CAP maintains its performance gain at higher
constellation and data rate as shown in Fig. 6.5 (b) using M = 16 to achieve T = 4 bpcu.
From the Fig. 6.5 (b), the γb required by SI-CAP to achieve Rb = 150 Mb/s is 1.6 dB less
than that of m-CAP. This illustration shows the power/spectral efficiency gain of SI-CAP over
the conventional m-CAP. The performance gain shown by the simulations is further validated
through experimental demonstrations in section 6.4.
The CCDF of the electrical PAPR of SI-CAP andm-CAP is investigated and shown in Fig. 6.6.
Though Fig. 6.6 shows that both SI-CAP and m-CAP exhibit comparable PAPR, a closer
observation reveals that the PAPR of SI-CAP is marginally better especially in the region of
interest form-CAP. For example, the probability that the PAPR will exceed 9 dB is 6×10⁻⁴ and
3.5× 10⁻³ respectively for SI-CAP and m-CAP using 4-QAM with N = 4 and T = 2 bpcu.
119
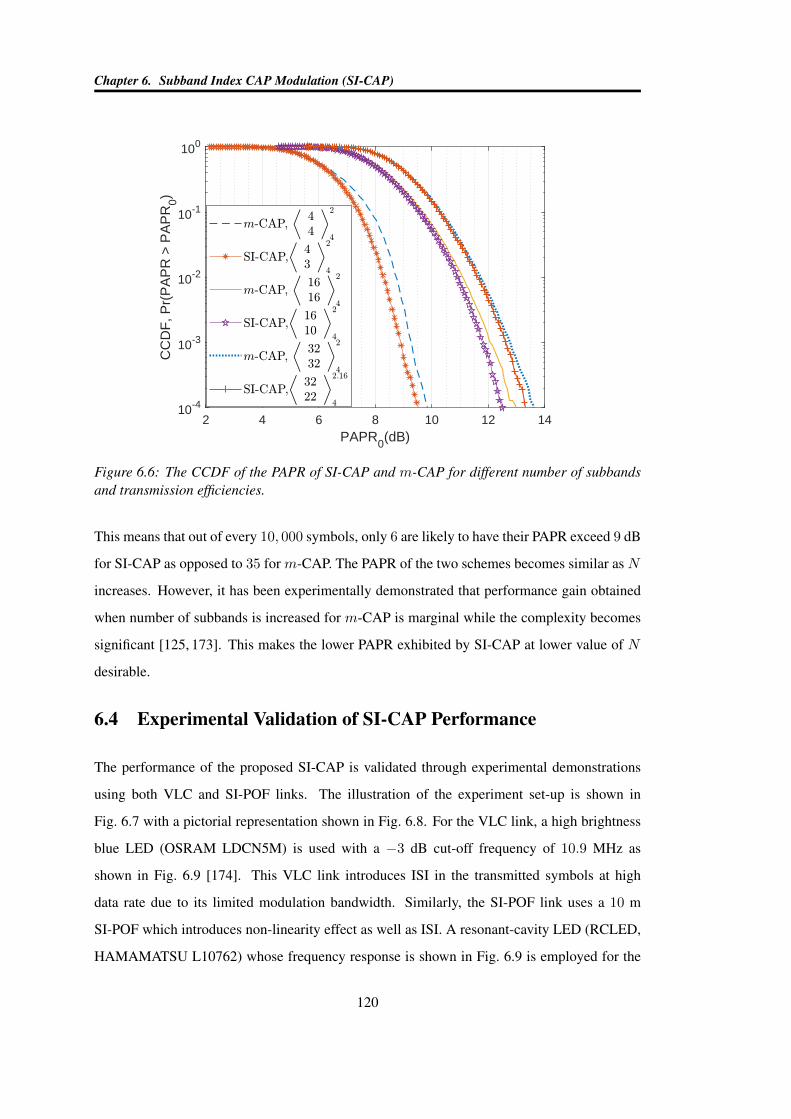
Chapter 6. Subband Index CAP Modulation (SI-CAP)
2 4 6 8 10 12 14PAPR0(dB)
10-4
10-3
10-2
10-1
100
CC
DF
, Pr(
PA
PR
> P
AP
R0)
Figure 6.6: The CCDF of the PAPR of SI-CAP and m-CAP for different number of subbandsand transmission efficiencies.
This means that out of every 10, 000 symbols, only 6 are likely to have their PAPR exceed 9 dB
for SI-CAP as opposed to 35 for m-CAP. The PAPR of the two schemes becomes similar as N
increases. However, it has been experimentally demonstrated that performance gain obtained
when number of subbands is increased for m-CAP is marginal while the complexity becomes
significant [125, 173]. This makes the lower PAPR exhibited by SI-CAP at lower value of N
desirable.
6.4 Experimental Validation of SI-CAP Performance
The performance of the proposed SI-CAP is validated through experimental demonstrations
using both VLC and SI-POF links. The illustration of the experiment set-up is shown in
Fig. 6.7 with a pictorial representation shown in Fig. 6.8. For the VLC link, a high brightness
blue LED (OSRAM LDCN5M) is used with a −3 dB cut-off frequency of 10.9 MHz as
shown in Fig. 6.9 [174]. This VLC link introduces ISI in the transmitted symbols at high
data rate due to its limited modulation bandwidth. Similarly, the SI-POF link uses a 10 m
SI-POF which introduces non-linearity effect as well as ISI. A resonant-cavity LED (RCLED,
HAMAMATSU L10762) whose frequency response is shown in Fig. 6.9 is employed for the
120
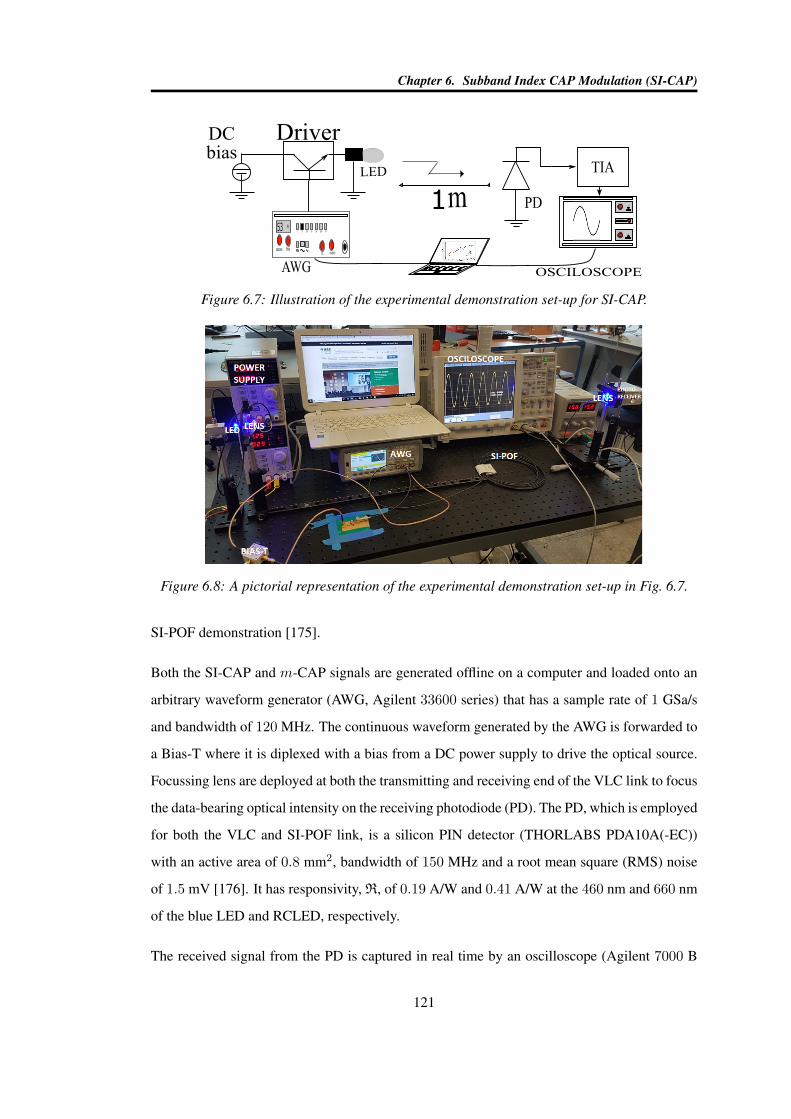
Chapter 6. Subband Index CAP Modulation (SI-CAP)
Driver
LED
DC
bias
coarse
Hz53
fine
1 10 100 1k 10k 100k 1M
DC output
AWG OSCILOSCOPE
Y
V/div
vertical
X
s/div
timebase
trigger
PD
TIA
1
Figure 6.7: Illustration of the experimental demonstration set-up for SI-CAP.
Figure 6.8: A pictorial representation of the experimental demonstration set-up in Fig. 6.7.
SI-POF demonstration [175].
Both the SI-CAP and m-CAP signals are generated offline on a computer and loaded onto an
arbitrary waveform generator (AWG, Agilent 33600 series) that has a sample rate of 1 GSa/s
and bandwidth of 120 MHz. The continuous waveform generated by the AWG is forwarded to
a Bias-T where it is diplexed with a bias from a DC power supply to drive the optical source.
Focussing lens are deployed at both the transmitting and receiving end of the VLC link to focus
the data-bearing optical intensity on the receiving photodiode (PD). The PD, which is employed
for both the VLC and SI-POF link, is a silicon PIN detector (THORLABS PDA10A(-EC))
with an active area of 0.8 mm2, bandwidth of 150 MHz and a root mean square (RMS) noise
of 1.5 mV [176]. It has responsivity, R, of 0.19 A/W and 0.41 A/W at the 460 nm and 660 nm
of the blue LED and RCLED, respectively.
The received signal from the PD is captured in real time by an oscilloscope (Agilent 7000 B
121
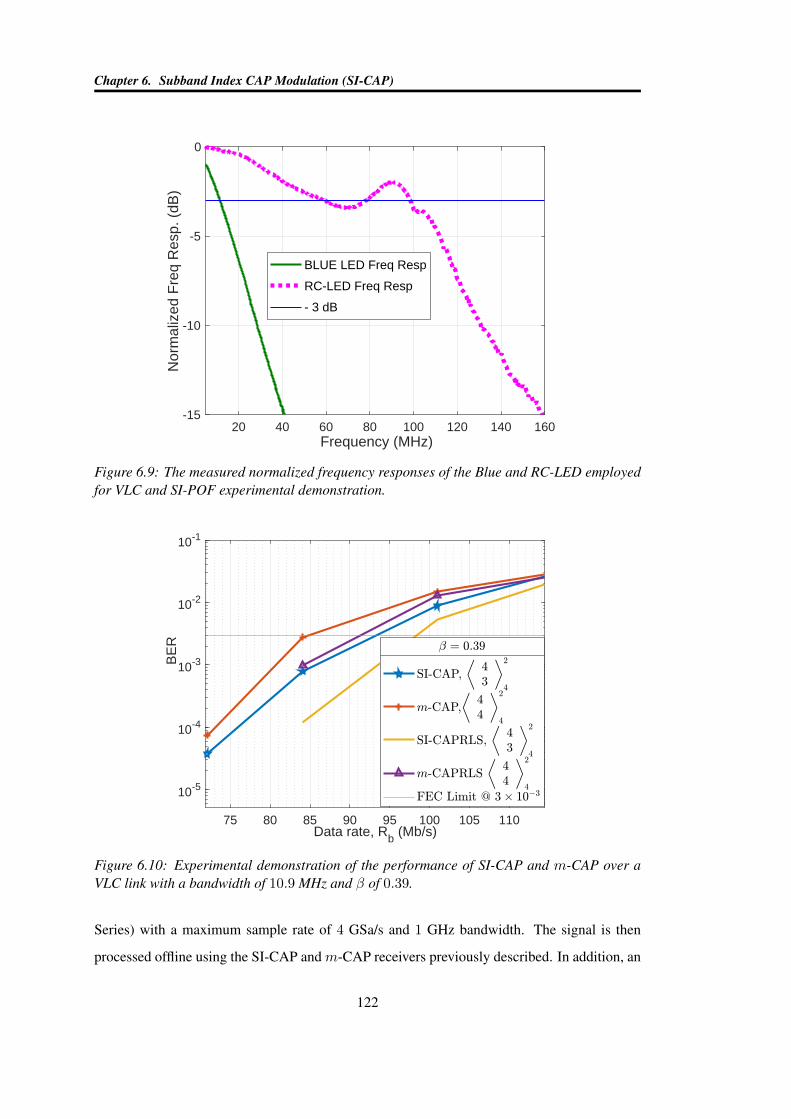
Chapter 6. Subband Index CAP Modulation (SI-CAP)
20 40 60 80 100 120 140 160Frequency (MHz)
-15
-10
-5
0
Nor
mal
ized
Fre
q R
esp.
(dB
)
BLUE LED Freq Resp
RC-LED Freq Resp
- 3 dB
Figure 6.9: The measured normalized frequency responses of the Blue and RC-LED employedfor VLC and SI-POF experimental demonstration.
75 80 85 90 95 100 105 110Data rate, Rb (Mb/s)
10-5
10-4
10-3
10-2
10-1
BE
R
Figure 6.10: Experimental demonstration of the performance of SI-CAP and m-CAP over aVLC link with a bandwidth of 10.9 MHz and β of 0.39.
Series) with a maximum sample rate of 4 GSa/s and 1 GHz bandwidth. The signal is then
processed offline using the SI-CAP and m-CAP receivers previously described. In addition, an
122
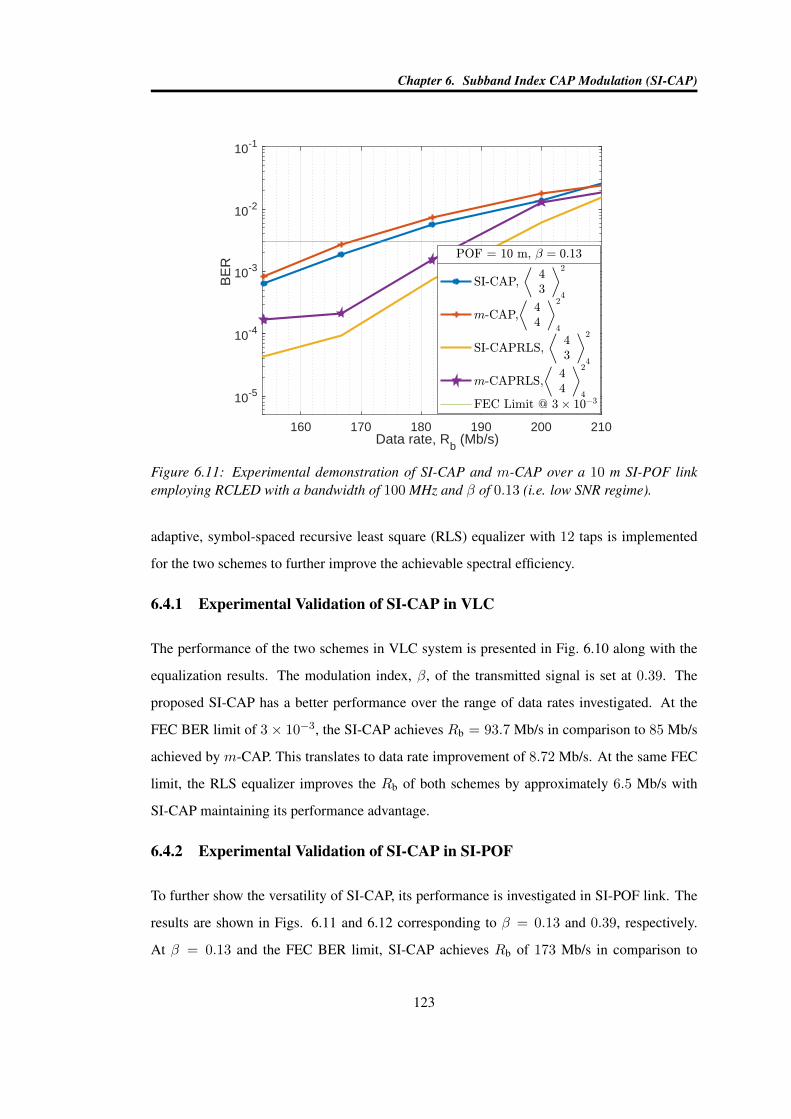
Chapter 6. Subband Index CAP Modulation (SI-CAP)
160 170 180 190 200 210Data rate, Rb (Mb/s)
10-5
10-4
10-3
10-2
10-1
BE
R
Figure 6.11: Experimental demonstration of SI-CAP and m-CAP over a 10 m SI-POF linkemploying RCLED with a bandwidth of 100 MHz and β of 0.13 (i.e. low SNR regime).
adaptive, symbol-spaced recursive least square (RLS) equalizer with 12 taps is implemented
for the two schemes to further improve the achievable spectral efficiency.
6.4.1 Experimental Validation of SI-CAP in VLC
The performance of the two schemes in VLC system is presented in Fig. 6.10 along with the
equalization results. The modulation index, β, of the transmitted signal is set at 0.39. The
proposed SI-CAP has a better performance over the range of data rates investigated. At the
FEC BER limit of 3× 10⁻³, the SI-CAP achieves Rb = 93.7 Mb/s in comparison to 85 Mb/s
achieved by m-CAP. This translates to data rate improvement of 8.72 Mb/s. At the same FEC
limit, the RLS equalizer improves the Rb of both schemes by approximately 6.5 Mb/s with
SI-CAP maintaining its performance advantage.
6.4.2 Experimental Validation of SI-CAP in SI-POF
To further show the versatility of SI-CAP, its performance is investigated in SI-POF link. The
results are shown in Figs. 6.11 and 6.12 corresponding to β = 0.13 and 0.39, respectively.
At β = 0.13 and the FEC BER limit, SI-CAP achieves Rb of 173 Mb/s in comparison to
123
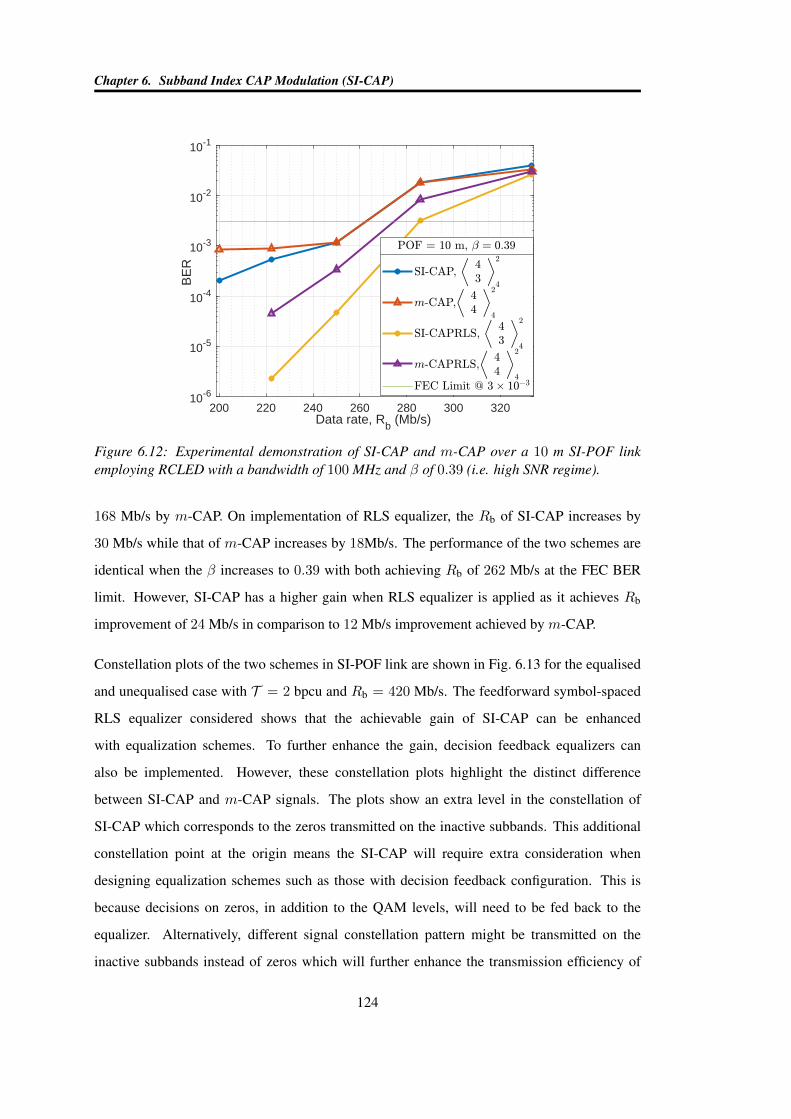
Chapter 6. Subband Index CAP Modulation (SI-CAP)
200 220 240 260 280 300 320Data rate, Rb (Mb/s)
10-6
10-5
10-4
10-3
10-2
10-1
BE
R
Figure 6.12: Experimental demonstration of SI-CAP and m-CAP over a 10 m SI-POF linkemploying RCLED with a bandwidth of 100 MHz and β of 0.39 (i.e. high SNR regime).
168 Mb/s by m-CAP. On implementation of RLS equalizer, the Rb of SI-CAP increases by
30 Mb/s while that of m-CAP increases by 18Mb/s. The performance of the two schemes are
identical when the β increases to 0.39 with both achieving Rb of 262 Mb/s at the FEC BER
limit. However, SI-CAP has a higher gain when RLS equalizer is applied as it achieves Rb
improvement of 24 Mb/s in comparison to 12 Mb/s improvement achieved by m-CAP.
Constellation plots of the two schemes in SI-POF link are shown in Fig. 6.13 for the equalised
and unequalised case with T = 2 bpcu and Rb = 420 Mb/s. The feedforward symbol-spaced
RLS equalizer considered shows that the achievable gain of SI-CAP can be enhanced
with equalization schemes. To further enhance the gain, decision feedback equalizers can
also be implemented. However, these constellation plots highlight the distinct difference
between SI-CAP and m-CAP signals. The plots show an extra level in the constellation of
SI-CAP which corresponds to the zeros transmitted on the inactive subbands. This additional
constellation point at the origin means the SI-CAP will require extra consideration when
designing equalization schemes such as those with decision feedback configuration. This is
because decisions on zeros, in addition to the QAM levels, will need to be fed back to the
equalizer. Alternatively, different signal constellation pattern might be transmitted on the
inactive subbands instead of zeros which will further enhance the transmission efficiency of
124
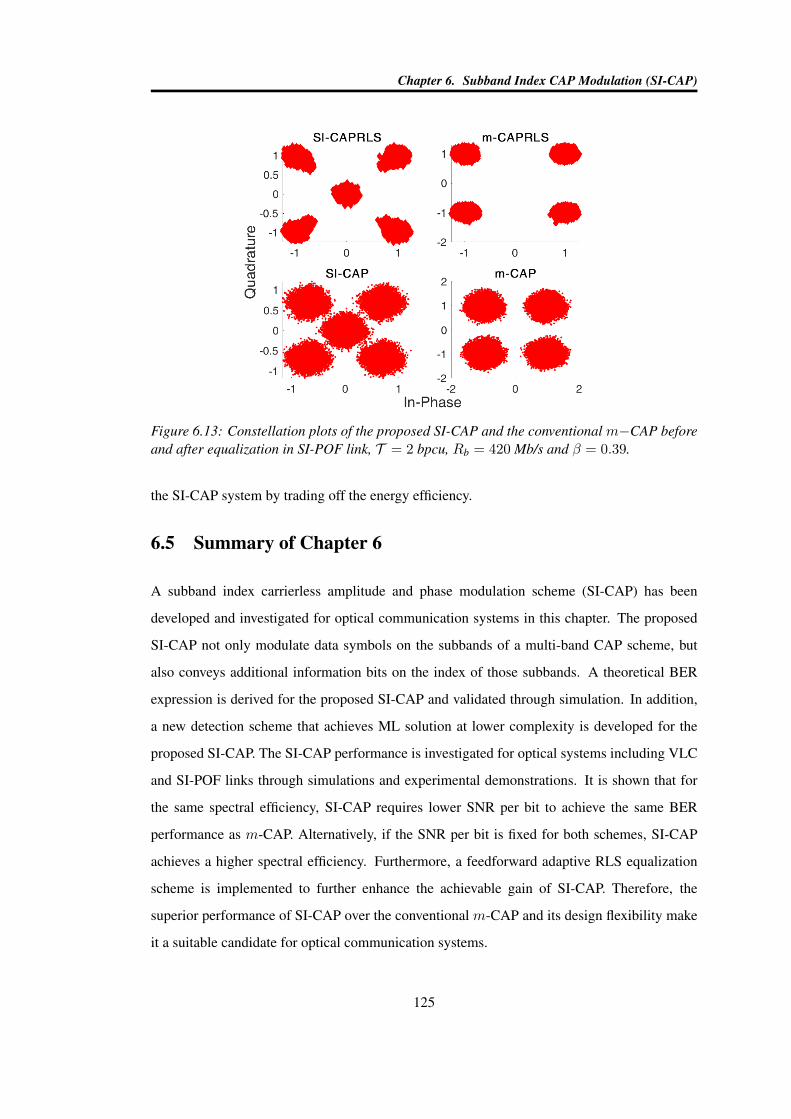
Chapter 6. Subband Index CAP Modulation (SI-CAP)
Figure 6.13: Constellation plots of the proposed SI-CAP and the conventional m−CAP beforeand after equalization in SI-POF link, T = 2 bpcu, Rb = 420 Mb/s and β = 0.39.
the SI-CAP system by trading off the energy efficiency.
6.5 Summary of Chapter 6
A subband index carrierless amplitude and phase modulation scheme (SI-CAP) has been
developed and investigated for optical communication systems in this chapter. The proposed
SI-CAP not only modulate data symbols on the subbands of a multi-band CAP scheme, but
also conveys additional information bits on the index of those subbands. A theoretical BER
expression is derived for the proposed SI-CAP and validated through simulation. In addition,
a new detection scheme that achieves ML solution at lower complexity is developed for the
proposed SI-CAP. The SI-CAP performance is investigated for optical systems including VLC
and SI-POF links through simulations and experimental demonstrations. It is shown that for
the same spectral efficiency, SI-CAP requires lower SNR per bit to achieve the same BER
performance as m-CAP. Alternatively, if the SNR per bit is fixed for both schemes, SI-CAP
achieves a higher spectral efficiency. Furthermore, a feedforward adaptive RLS equalization
scheme is implemented to further enhance the achievable gain of SI-CAP. Therefore, the
superior performance of SI-CAP over the conventional m-CAP and its design flexibility make
it a suitable candidate for optical communication systems.
125
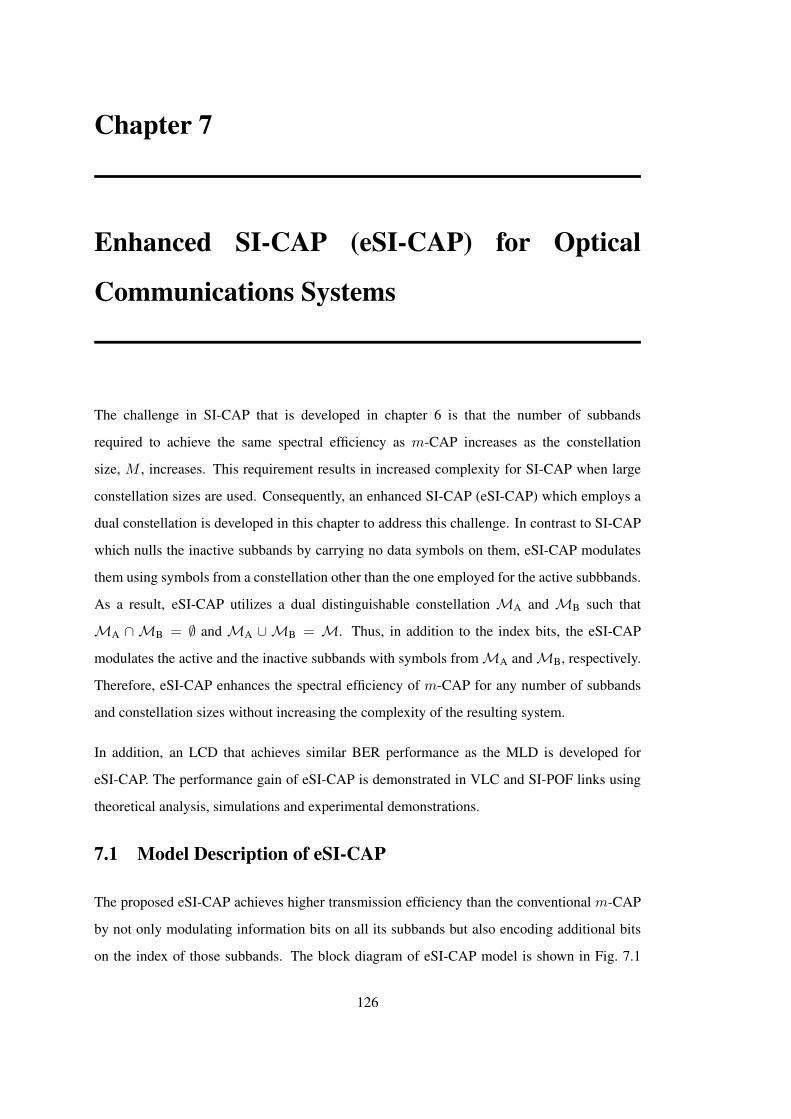
Chapter 7
Enhanced SI-CAP (eSI-CAP) for Optical
Communications Systems
The challenge in SI-CAP that is developed in chapter 6 is that the number of subbands
required to achieve the same spectral efficiency as m-CAP increases as the constellation
size, M , increases. This requirement results in increased complexity for SI-CAP when large
constellation sizes are used. Consequently, an enhanced SI-CAP (eSI-CAP) which employs a
dual constellation is developed in this chapter to address this challenge. In contrast to SI-CAP
which nulls the inactive subbands by carrying no data symbols on them, eSI-CAP modulates
them using symbols from a constellation other than the one employed for the active subbbands.
As a result, eSI-CAP utilizes a dual distinguishable constellation MA and MB such that
MA ∩ MB = ∅ and MA ∪ MB = M. Thus, in addition to the index bits, the eSI-CAP
modulates the active and the inactive subbands with symbols fromMA andMB, respectively.
Therefore, eSI-CAP enhances the spectral efficiency of m-CAP for any number of subbands
and constellation sizes without increasing the complexity of the resulting system.
In addition, an LCD that achieves similar BER performance as the MLD is developed for
eSI-CAP. The performance gain of eSI-CAP is demonstrated in VLC and SI-POF links using
theoretical analysis, simulations and experimental demonstrations.
7.1 Model Description of eSI-CAP
The proposed eSI-CAP achieves higher transmission efficiency than the conventional m-CAP
by not only modulating information bits on all its subbands but also encoding additional bits
on the index of those subbands. The block diagram of eSI-CAP model is shown in Fig. 7.1
126
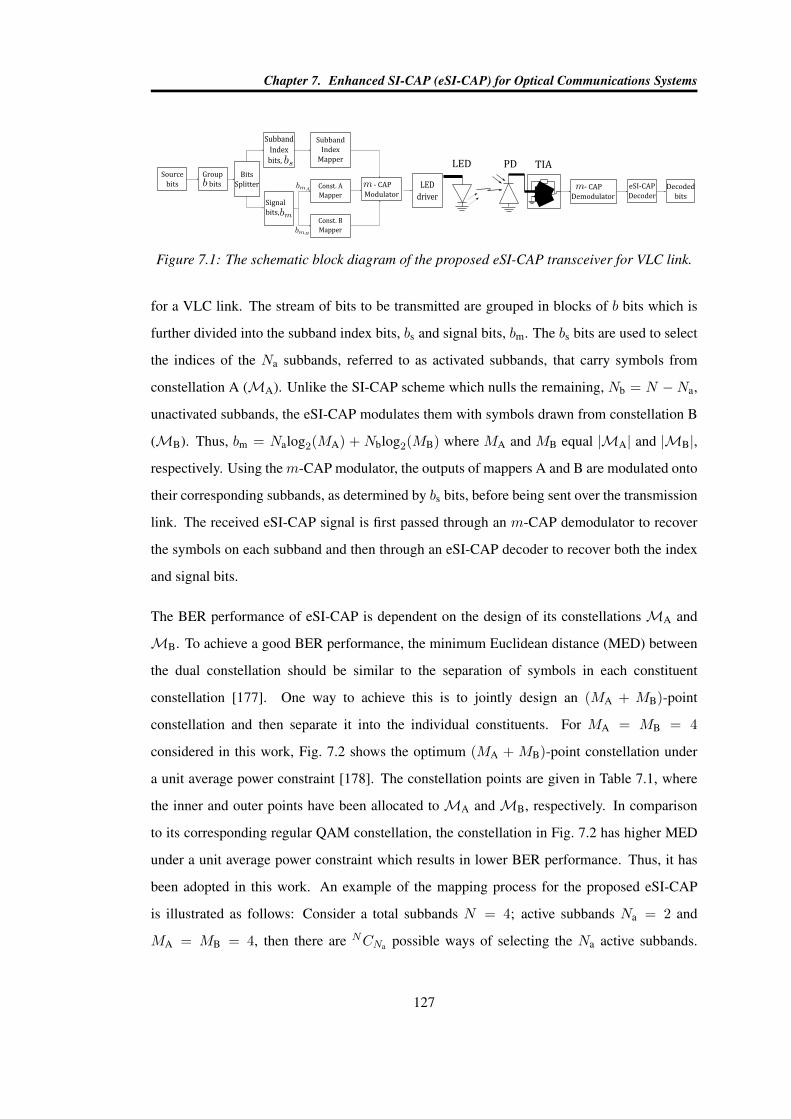
Chapter 7. Enhanced SI-CAP (eSI-CAP) for Optical Communications Systems
Source
bits
Group
bits eSI-CAP
Decoder
Decoded
bits
- CAP
Modulator- CAP
Demodulator
Bits
Splitter
Subband
Index
bits,
Signal
bits,
Const. A
Mapper
Const. B
Mapper
Subband
Index
Mapper
LED
driver
TIALED PD
Figure 7.1: The schematic block diagram of the proposed eSI-CAP transceiver for VLC link.
for a VLC link. The stream of bits to be transmitted are grouped in blocks of b bits which is
further divided into the subband index bits, bs and signal bits, bm. The bs bits are used to select
the indices of the Na subbands, referred to as activated subbands, that carry symbols from
constellation A (MA). Unlike the SI-CAP scheme which nulls the remaining, Nb = N −Na,
unactivated subbands, the eSI-CAP modulates them with symbols drawn from constellation B
(MB). Thus, bm = Nalog2(MA) + Nblog2(MB) where MA and MB equal |MA| and |MB|,
respectively. Using them-CAP modulator, the outputs of mappers A and B are modulated onto
their corresponding subbands, as determined by bs bits, before being sent over the transmission
link. The received eSI-CAP signal is first passed through an m-CAP demodulator to recover
the symbols on each subband and then through an eSI-CAP decoder to recover both the index
and signal bits.
The BER performance of eSI-CAP is dependent on the design of its constellations MA and
MB. To achieve a good BER performance, the minimum Euclidean distance (MED) between
the dual constellation should be similar to the separation of symbols in each constituent
constellation [177]. One way to achieve this is to jointly design an (MA + MB)-point
constellation and then separate it into the individual constituents. For MA = MB = 4
considered in this work, Fig. 7.2 shows the optimum (MA + MB)-point constellation under
a unit average power constraint [178]. The constellation points are given in Table 7.1, where
the inner and outer points have been allocated to MA and MB, respectively. In comparison
to its corresponding regular QAM constellation, the constellation in Fig. 7.2 has higher MED
under a unit average power constraint which results in lower BER performance. Thus, it has
been adopted in this work. An example of the mapping process for the proposed eSI-CAP
is illustrated as follows: Consider a total subbands N = 4; active subbands Na = 2 and
MA = MB = 4, then there are NCNa possible ways of selecting the Na active subbands.
127
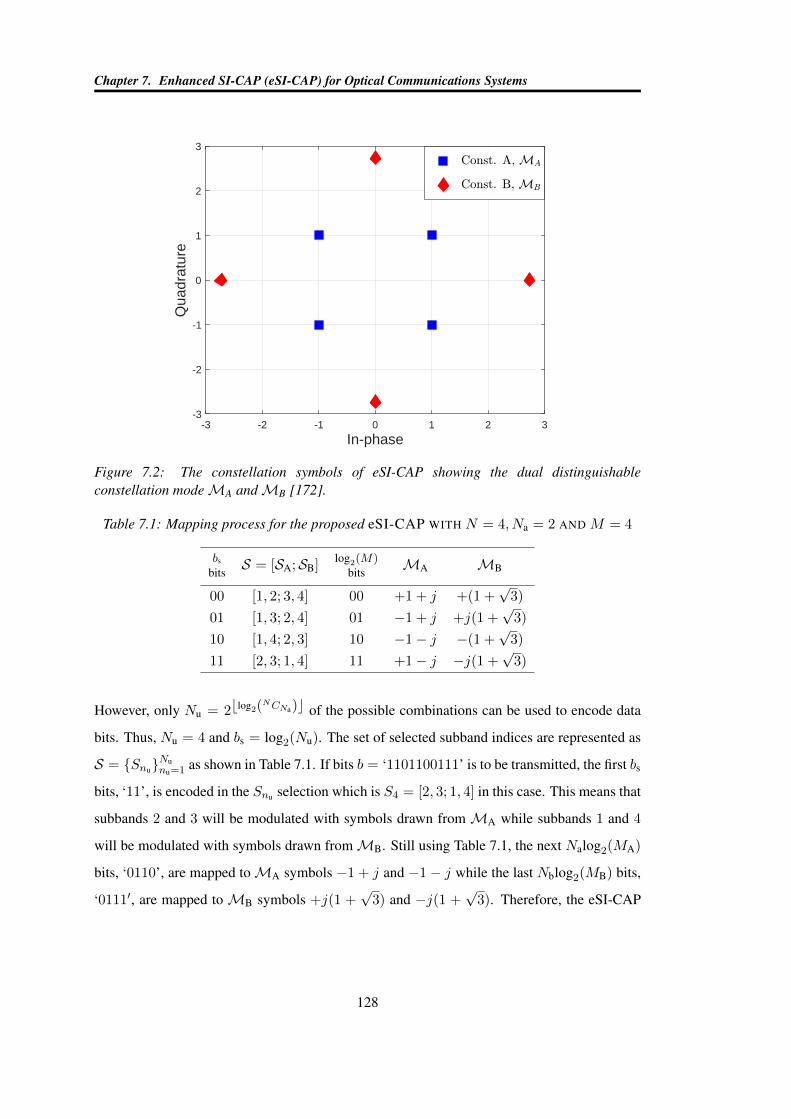
Chapter 7. Enhanced SI-CAP (eSI-CAP) for Optical Communications Systems
-3 -2 -1 0 1 2 3
In-phase
-3
-2
-1
0
1
2
3
Qua
drat
ure
Figure 7.2: The constellation symbols of eSI-CAP showing the dual distinguishableconstellation modeMA andMB [172].
Table 7.1: Mapping process for the proposed eSI-CAP WITH N = 4, Na = 2 AND M = 4
bs
bitsS = [SA;SB]
log2(M)bits
MA MB
00 [1, 2; 3, 4] 00 +1 + j +(1 +√
3)
01 [1, 3; 2, 4] 01 −1 + j +j(1 +√
3)
10 [1, 4; 2, 3] 10 −1− j −(1 +√
3)
11 [2, 3; 1, 4] 11 +1− j −j(1 +√
3)
However, only Nu = 2blog2(NCNa)c of the possible combinations can be used to encode data
bits. Thus, Nu = 4 and bs = log2(Nu). The set of selected subband indices are represented as
S = SnuNunu=1 as shown in Table 7.1. If bits b = ‘1101100111’ is to be transmitted, the first bs
bits, ‘11’, is encoded in the Snu selection which is S4 = [2, 3; 1, 4] in this case. This means that
subbands 2 and 3 will be modulated with symbols drawn from MA while subbands 1 and 4
will be modulated with symbols drawn fromMB. Still using Table 7.1, the next Nalog2(MA)
bits, ‘0110’, are mapped toMA symbols −1 + j and −1− j while the last Nblog2(MB) bits,
‘0111′, are mapped toMB symbols +j(1 +√
3) and −j(1 +√
3). Therefore, the eSI-CAP
128
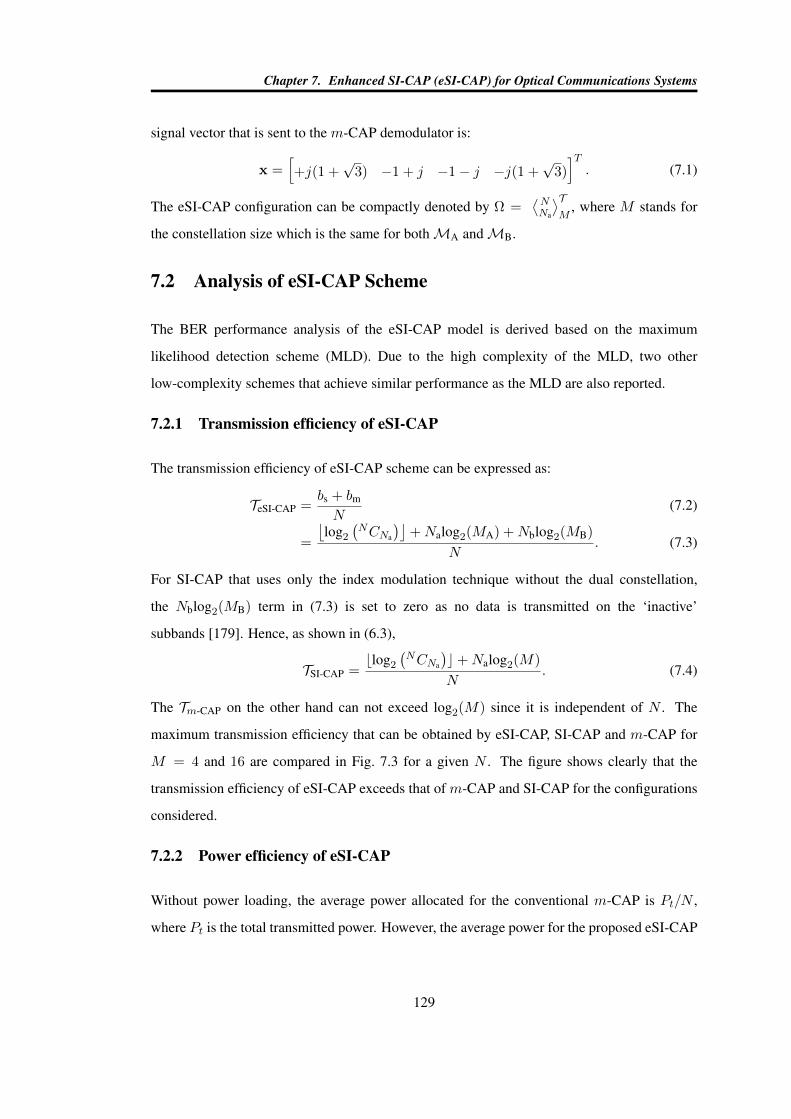
Chapter 7. Enhanced SI-CAP (eSI-CAP) for Optical Communications Systems
signal vector that is sent to the m-CAP demodulator is:
x =[+j(1 +
√3) −1 + j −1− j −j(1 +
√3)]T. (7.1)
The eSI-CAP configuration can be compactly denoted by Ω =⟨NNa
⟩TM
, where M stands for
the constellation size which is the same for bothMA andMB.
7.2 Analysis of eSI-CAP Scheme
The BER performance analysis of the eSI-CAP model is derived based on the maximum
likelihood detection scheme (MLD). Due to the high complexity of the MLD, two other
low-complexity schemes that achieve similar performance as the MLD are also reported.
7.2.1 Transmission efficiency of eSI-CAP
The transmission efficiency of eSI-CAP scheme can be expressed as:
TeSI-CAP =bs + bm
N(7.2)
=
⌊log2
(NCNa
)⌋+Nalog2(MA) +Nblog2(MB)
N. (7.3)
For SI-CAP that uses only the index modulation technique without the dual constellation,
the Nblog2(MB) term in (7.3) is set to zero as no data is transmitted on the ‘inactive’
subbands [179]. Hence, as shown in (6.3),
TSI-CAP =blog2
(NCNa
)c+Nalog2(M)
N. (7.4)
The Tm-CAP on the other hand can not exceed log2(M) since it is independent of N . The
maximum transmission efficiency that can be obtained by eSI-CAP, SI-CAP and m-CAP for
M = 4 and 16 are compared in Fig. 7.3 for a given N . The figure shows clearly that the
transmission efficiency of eSI-CAP exceeds that of m-CAP and SI-CAP for the configurations
considered.
7.2.2 Power efficiency of eSI-CAP
Without power loading, the average power allocated for the conventional m-CAP is Pt/N ,
where Pt is the total transmitted power. However, the average power for the proposed eSI-CAP
129
Chapter 7. Enhanced SI-CAP (eSI-CAP) for Optical Communications Systems
10 20 30 40 501.5
2
2.5
3
3.5
4
4.5
5
Figure 7.3: The comparison of the maximum possible transmission efficiency of eSI-CAP,SI-CAP and m-CAP for a given N and M .
is ξPt/N where:
ξ =N
NaEa +NbEb. (7.5)
Both Ea and Eb respectively refers to the average energy ofMA andMB withM normalized
to unit average energy. Since Eb > Ea, (7.5) shows that the configuration with higher Na is
the most power efficient for a fixed N and T . Intuitively, this will be the configuration with
most symbols drawn from the lower-energy constellation MA. For example, if N = 4 then
Na = 1, 2 and 3 all result in T = 2.5 bpcu. However, using the constellation depicted in
Fig. 7.2, the average transmitted power required for the case of Na = 1, 2 and 3 is 1.29 W,
1 W and 0.71 W, respectively. Therefore, even though the three configurations provide the
same T , the configuration with Na = 3 is the most power efficient. Hence, it can be stated
that for a fixed transmission efficiency, increasing the active number of subbands results in a
configuration that requires less transmitted power. The insight provided by (7.5) enables the
use of optimum configuration to obtain the best performance for eSI-CAP. This will later be
confirmed with simulation results and validated through an experimental demonstration.
130
Chapter 7. Enhanced SI-CAP (eSI-CAP) for Optical Communications Systems
7.2.3 Analysis of eSI-CAP BER performance with MLD
The eSI-CAP signal obtained at the output of the m-CAP demodulator, considering a
line-of-sight (LOS) channel gain h, can be expressed as:
y = ζk + w (7.6)
where ζk = ξRKβhxk. Since the eSI-CAP symbol xkKk=1 with K = NuMNaA MNb
B is
equiprobable with probability 1/K, the ML criterion that maximizes the probability of y given
ζk can be expressed as:
xk = arg maxk
p(y, ζk) (7.7)
where,
p(y, ζk) =1
(2πN0)N/2exp
[−‖y − ζk‖
2
2N0
](7.8)
The ML criteria of (7.7) can be reduced to the minimum distance criteria as:
xk = arg minkD(y, ζk) (7.9)
where the MED metric D(y, ζm) is expressed as:
D(y, ζk) = ‖y − ζk‖2 (7.10)
Using the PEP, the eSI-CAP detector considers the joint detection of both the subband index
combination and the transmitted symbols. The PEP for eSI-CAP is therefore derived as:
PEPeSI-CAP = p(xk → xk)
= Q
√(ξRKβ)2
2N0‖h (xk − xk)‖2
. (7.11)
The PEP of (7.11) is then used to obtain an upper bound BER expression that is shown in
(7.12). The expression is obtained by considering all the possible K combinations of the
eSI-CAP symbols using the union bound technique.
The computational complexity of MLD, which is of the order O(K), grows exponentially and
becomes infeasible as the constellation size increases. In order to address this, two other lower
complexity detection schemes are presented.
131
Chapter 7. Enhanced SI-CAP (eSI-CAP) for Optical Communications Systems
BEReSI-CAP ≤1
Klog2(K)
K∑k=1
K∑k=1
NH(bk, bk)Q
√(ξRKβ)2
2N0‖h (xk − xk)‖2
.
(7.12)
7.2.4 Analysis of eSI-CAP BER performance with LLR
The LLR detector considers the logarithm of the ratio of the a posteriori probabilities for each
received subband symbol. It uses the fact that the subband symbol can either be drawn from
MA = smaMAma=1 orMB = smb
MBmb=1. The formulation for the LLR can be stated as:
χn = ln
(∑MAma=1 Pr(xn = sma |yn)∑MBmb=1 Pr(xn = smb |yn)
)(7.13)
where xn and yn respectively represent the transmitted and received symbols on the nth
subband. Using Baye’s theorem, (7.13) can be restated as:
χn = ln
(∑MAma=1 Pr(yn|xn = sma)Pr(xn = sma)∑MBmb=1 Pr(yn|xn = smb)Pr(xn = smb)
)(7.14)
and given the AWGN channel, the conditional probabilities can be expressed as:
Pr(yn|xn = sma) =1
(2πN0)1/2exp
[−|yn − smahn|
2
2N0
](7.15)
and
Pr(yn|xn = smb) =1
(2πN0)1/2exp
[−|yn − smbhn|
2
2N0
]. (7.16)
By substituting (7.15) and (7.16) in (7.14) and considering the fact that Pr(xn = sma) =
Na/NMA while Pr(xn = smb) = (N −Na)/NMB, the LLR values for each subband can be
computed as follows:
χn = ln(
MBNa
MA(N −Na)
)+ ln
(MA∑ma=1
exp
[−|yn − smahn|
2
2N0
])
− ln
M∑mb=1
exp
[−|yn − smbhn|
2
2N0
] . (7.17)
The LLR computations of (7.17) is prone to computational overflow which can be avoided by
employing the Jacobian logarithm [170]. The computed LLR values, χnNn=1, are arranged in
decreasing order and the indices of the first Na entries are taken as the activated subband index
132
Chapter 7. Enhanced SI-CAP (eSI-CAP) for Optical Communications Systems
combination. Using the already detected Na indices, the remaining Nb indices that complete
the detected Snu is easily determined as shown in Table 7.1. Thereafter,MA andMB decoders
are employed to detect the symbols on the subbands in accordance with the detected Snu .
Because the LLR has no knowledge of the subband index combinations that are employed, it
is possible to decide on some Snu /∈ S especially when the noise variance is high. Since this is
an error event, such cases can be resolved by randomly mapping the detected combination to
any of the entries in S .
7.2.5 Analysis of eSI-CAP BER performance with LCD
The LLR detector of (7.17) requires the knowledge of noise variance and is also susceptible to
computational overflow. As a result, a novel lower complexity detector is developed to address
these issues. The proposed LCD employs the knowledge ofMA andMB, which is known to
the receiver, to compute the MED between the received subband symbol and the constellation
points. It then selects the most likely of the constellation symbols based on the computed
values. The proposed LCD is elucidated in Algorithm 2. Using the outputs of Algorithm 2,
the symbols on the active and inactive subbands can easily be detected by mapping them to the
nearest symbol inMA andMB, respectively. Similar to LLR, the LCD is also prone to detect
some Snu /∈ S. In such cases, the random mapping solution is also implemented.
A comparison of the LCD and LLR also shows that the LCD has lower complexity as it
only computes a part of the second term in (7.17). Furthermore, the LCD dispenses with the
knowledge of the noise variance and is not susceptible to computational overflow. In addition,
the LCD achieves similar results with MLD especially at high SNR and it has the same order
of complexity as the conventional m-CAP detector.
7.3 Simulation Results and Discussions
Computer simulations are conducted to investigate the performance of the proposed eSI-CAP.
For the simulations, the electrical SNR per bit is defined as γb = (ξRKβ)2T N0
where T is log2(M)
for m-CAP and it is as defined in (7.3) and (7.4) for eSI-CAP and SI-CAP, respectively.
The BER against SNR for the various configurations of eSI-CAP and comparison of its
detection schemes is depicted in Fig. 7.4. For N = 4, eSI-CAP configurations using Na = 1, 2
133
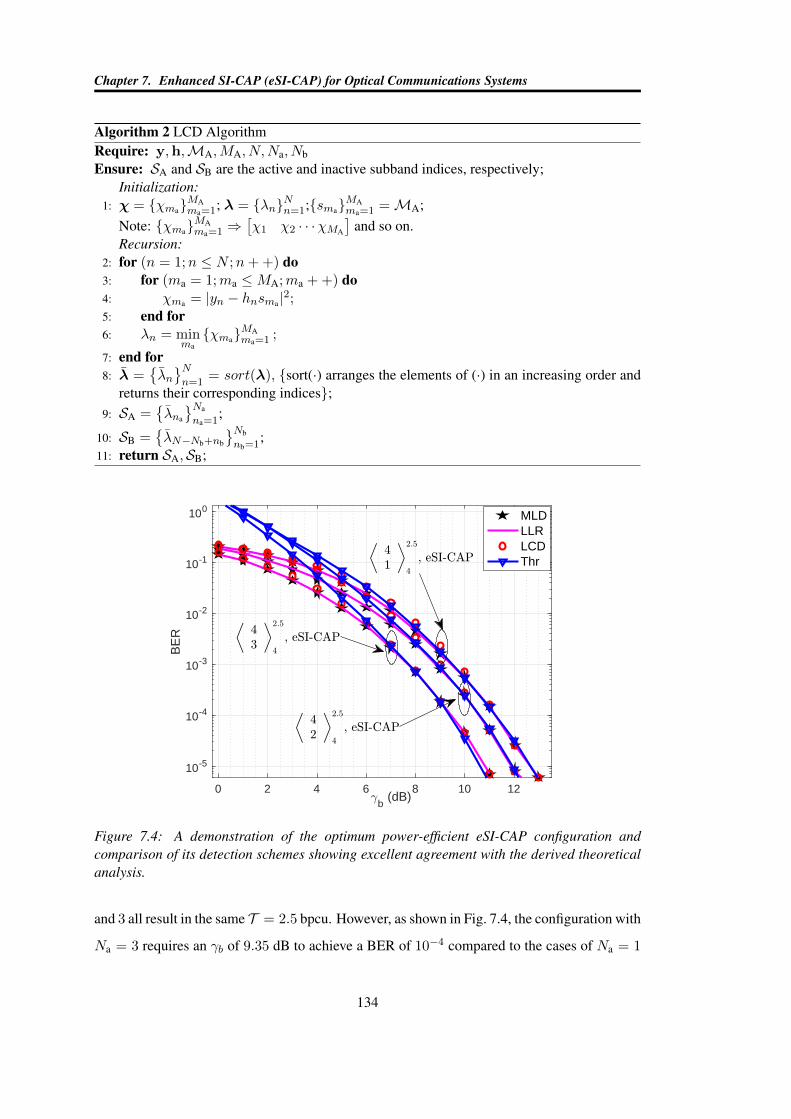
Chapter 7. Enhanced SI-CAP (eSI-CAP) for Optical Communications Systems
Algorithm 2 LCD AlgorithmRequire: y,h,MA,MA, N,Na, NbEnsure: SA and SB are the active and inactive subband indices, respectively;
Initialization:1: χ = χma
MAma=1; λ = λnNn=1;sma
MAma=1 =MA;
Note: χmaMAma=1 ⇒
[χ1 χ2 · · ·χMA
]and so on.
Recursion:2: for (n = 1;n ≤ N ;n+ +) do3: for (ma = 1;ma ≤MA;ma + +) do4: χma = |yn − hnsma |2;5: end for6: λn = min
maχma
MAma=1 ;
7: end for8: λ =
λnNn=1
= sort(λ), sort(·) arranges the elements of (·) in an increasing order andreturns their corresponding indices;
9: SA =λna
Na
na=1;
10: SB =λN−Nb+nb
Nb
nb=1;
11: return SA,SB;
0 2 4 6 8 10 12b (dB)
10-5
10-4
10-3
10-2
10-1
100
BE
R
MLDLLRLCDThr
Figure 7.4: A demonstration of the optimum power-efficient eSI-CAP configuration andcomparison of its detection schemes showing excellent agreement with the derived theoreticalanalysis.
and 3 all result in the same T = 2.5 bpcu. However, as shown in Fig. 7.4, the configuration with
Na = 3 requires an γb of 9.35 dB to achieve a BER of 10−4 compared to the cases of Na = 1
134
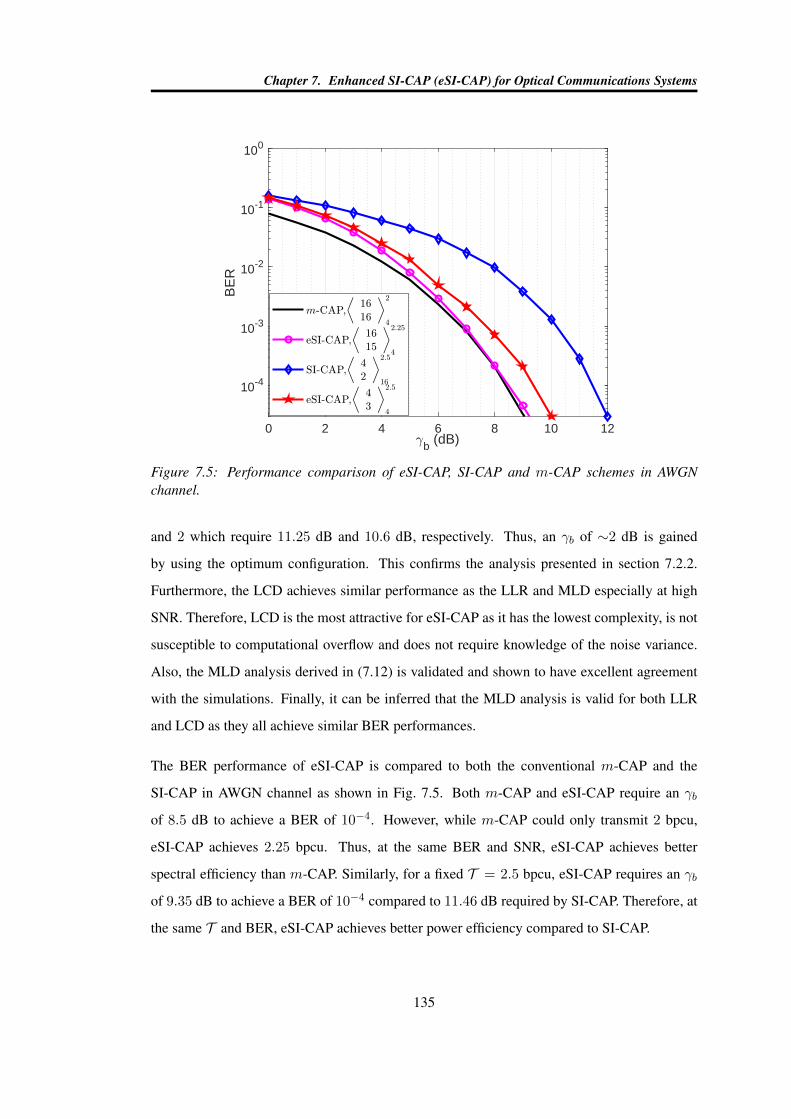
Chapter 7. Enhanced SI-CAP (eSI-CAP) for Optical Communications Systems
0 2 4 6 8 10 12b (dB)
10-4
10-3
10-2
10-1
100
BE
R
Figure 7.5: Performance comparison of eSI-CAP, SI-CAP and m-CAP schemes in AWGNchannel.
and 2 which require 11.25 dB and 10.6 dB, respectively. Thus, an γb of ∼2 dB is gained
by using the optimum configuration. This confirms the analysis presented in section 7.2.2.
Furthermore, the LCD achieves similar performance as the LLR and MLD especially at high
SNR. Therefore, LCD is the most attractive for eSI-CAP as it has the lowest complexity, is not
susceptible to computational overflow and does not require knowledge of the noise variance.
Also, the MLD analysis derived in (7.12) is validated and shown to have excellent agreement
with the simulations. Finally, it can be inferred that the MLD analysis is valid for both LLR
and LCD as they all achieve similar BER performances.
The BER performance of eSI-CAP is compared to both the conventional m-CAP and the
SI-CAP in AWGN channel as shown in Fig. 7.5. Both m-CAP and eSI-CAP require an γb
of 8.5 dB to achieve a BER of 10−4. However, while m-CAP could only transmit 2 bpcu,
eSI-CAP achieves 2.25 bpcu. Thus, at the same BER and SNR, eSI-CAP achieves better
spectral efficiency than m-CAP. Similarly, for a fixed T = 2.5 bpcu, eSI-CAP requires an γb
of 9.35 dB to achieve a BER of 10−4 compared to 11.46 dB required by SI-CAP. Therefore, at
the same T and BER, eSI-CAP achieves better power efficiency compared to SI-CAP.
135
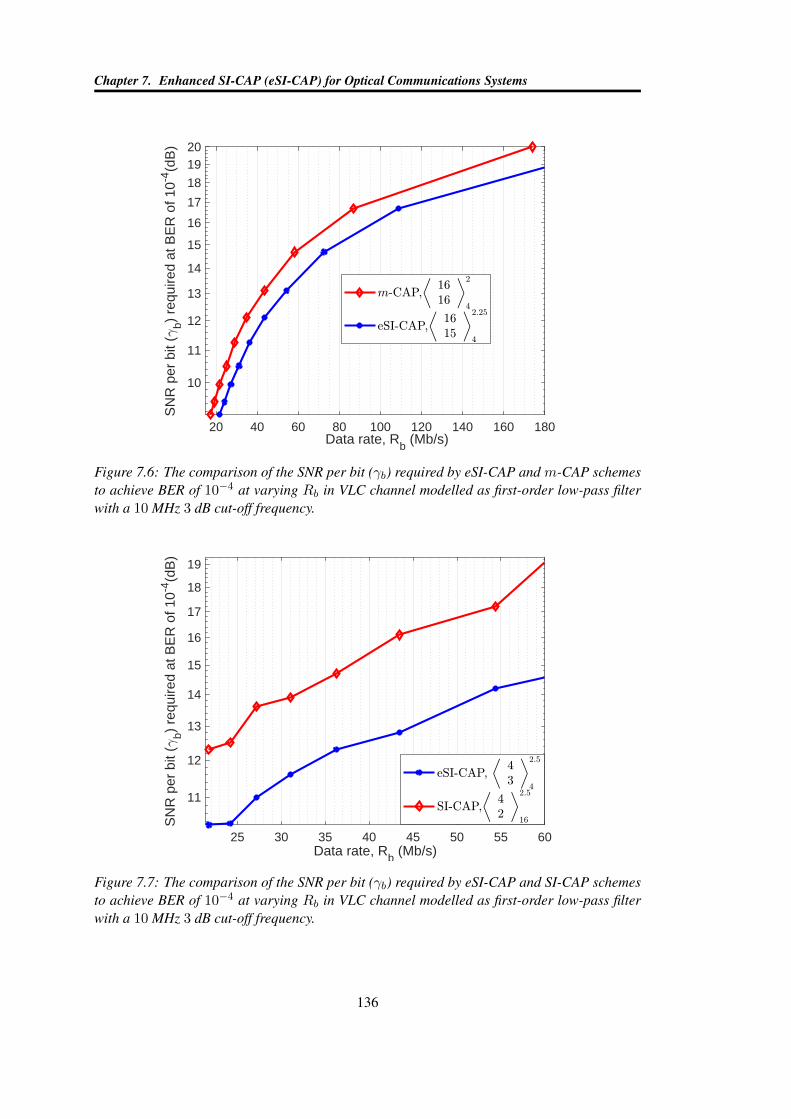
Chapter 7. Enhanced SI-CAP (eSI-CAP) for Optical Communications Systems
20 40 60 80 100 120 140 160 180Data rate, Rb (Mb/s)
10
11
12
13
14
15
16
17
18
1920
SN
R p
er b
it (
b) re
quire
d at
BE
R o
f 10-4
(dB
)
Figure 7.6: The comparison of the SNR per bit (γb) required by eSI-CAP and m-CAP schemesto achieve BER of 10−4 at varying Rb in VLC channel modelled as first-order low-pass filterwith a 10 MHz 3 dB cut-off frequency.
25 30 35 40 45 50 55 60Data rate, Rb (Mb/s)
11
12
13
14
15
16
17
18
19
SN
R p
er b
it (
b) re
quire
d at
BE
R o
f 10-4
(dB
)
Figure 7.7: The comparison of the SNR per bit (γb) required by eSI-CAP and SI-CAP schemesto achieve BER of 10−4 at varying Rb in VLC channel modelled as first-order low-pass filterwith a 10 MHz 3 dB cut-off frequency.
136
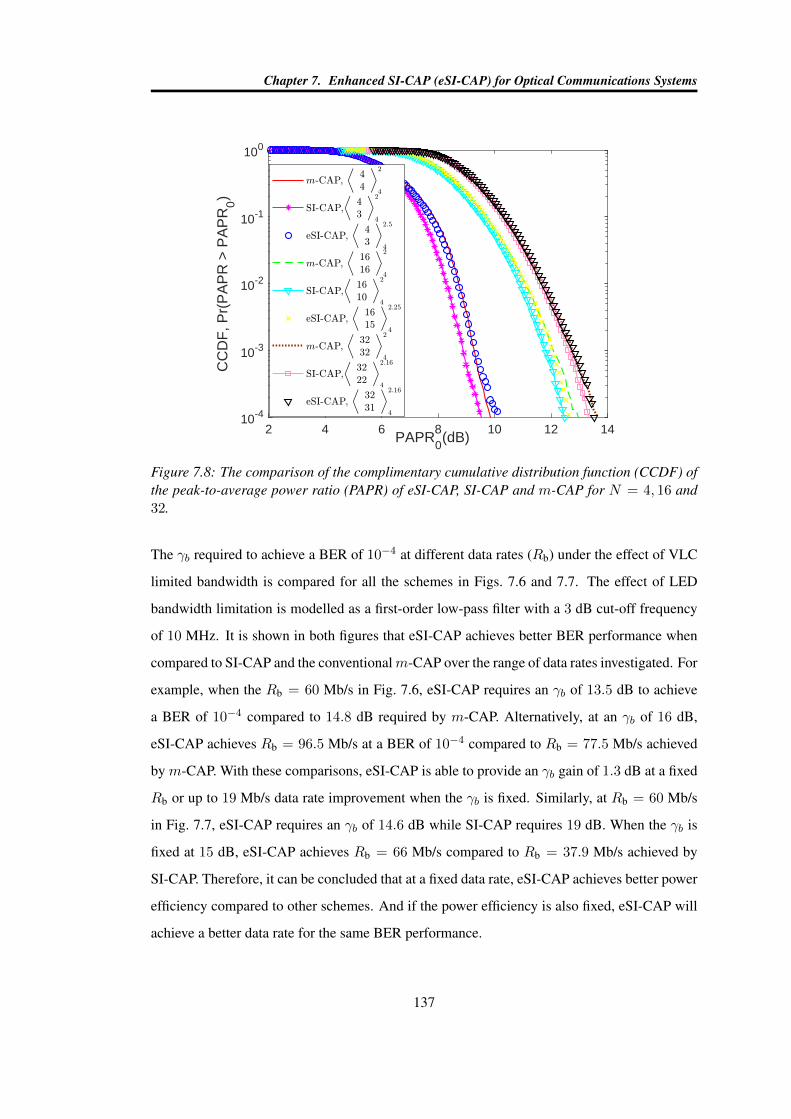
Chapter 7. Enhanced SI-CAP (eSI-CAP) for Optical Communications Systems
2 4 6 8 10 12 14PAPR
0(dB)
10-4
10-3
10-2
10-1
100
CC
DF
, Pr(
PA
PR
> P
AP
R0)
Figure 7.8: The comparison of the complimentary cumulative distribution function (CCDF) ofthe peak-to-average power ratio (PAPR) of eSI-CAP, SI-CAP and m-CAP for N = 4, 16 and32.
The γb required to achieve a BER of 10−4 at different data rates (Rb) under the effect of VLC
limited bandwidth is compared for all the schemes in Figs. 7.6 and 7.7. The effect of LED
bandwidth limitation is modelled as a first-order low-pass filter with a 3 dB cut-off frequency
of 10 MHz. It is shown in both figures that eSI-CAP achieves better BER performance when
compared to SI-CAP and the conventionalm-CAP over the range of data rates investigated. For
example, when the Rb = 60 Mb/s in Fig. 7.6, eSI-CAP requires an γb of 13.5 dB to achieve
a BER of 10−4 compared to 14.8 dB required by m-CAP. Alternatively, at an γb of 16 dB,
eSI-CAP achieves Rb = 96.5 Mb/s at a BER of 10−4 compared to Rb = 77.5 Mb/s achieved
by m-CAP. With these comparisons, eSI-CAP is able to provide an γb gain of 1.3 dB at a fixed
Rb or up to 19 Mb/s data rate improvement when the γb is fixed. Similarly, at Rb = 60 Mb/s
in Fig. 7.7, eSI-CAP requires an γb of 14.6 dB while SI-CAP requires 19 dB. When the γb is
fixed at 15 dB, eSI-CAP achieves Rb = 66 Mb/s compared to Rb = 37.9 Mb/s achieved by
SI-CAP. Therefore, it can be concluded that at a fixed data rate, eSI-CAP achieves better power
efficiency compared to other schemes. And if the power efficiency is also fixed, eSI-CAP will
achieve a better data rate for the same BER performance.
137
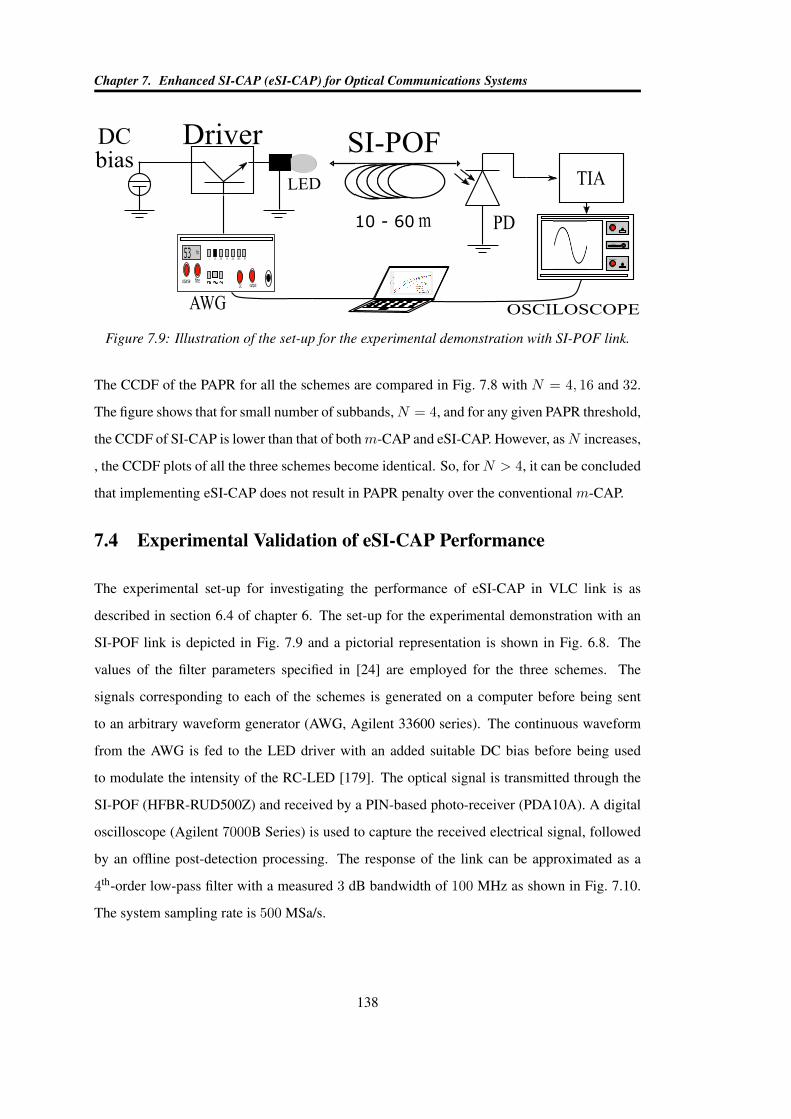
Chapter 7. Enhanced SI-CAP (eSI-CAP) for Optical Communications Systems
Driver
LED
DC
bias
coarse
Hz53
fine
1 10 100 1k 10k 100k 1M
DC output
AWG OSCILOSCOPE
Y
V/div
vertical
X
s/div
timebase
trigger
PD
TIA
10 - 60
SI-POF
Figure 7.9: Illustration of the set-up for the experimental demonstration with SI-POF link.
The CCDF of the PAPR for all the schemes are compared in Fig. 7.8 with N = 4, 16 and 32.
The figure shows that for small number of subbands,N = 4, and for any given PAPR threshold,
the CCDF of SI-CAP is lower than that of bothm-CAP and eSI-CAP. However, asN increases,
, the CCDF plots of all the three schemes become identical. So, for N > 4, it can be concluded
that implementing eSI-CAP does not result in PAPR penalty over the conventional m-CAP.
7.4 Experimental Validation of eSI-CAP Performance
The experimental set-up for investigating the performance of eSI-CAP in VLC link is as
described in section 6.4 of chapter 6. The set-up for the experimental demonstration with an
SI-POF link is depicted in Fig. 7.9 and a pictorial representation is shown in Fig. 6.8. The
values of the filter parameters specified in [24] are employed for the three schemes. The
signals corresponding to each of the schemes is generated on a computer before being sent
to an arbitrary waveform generator (AWG, Agilent 33600 series). The continuous waveform
from the AWG is fed to the LED driver with an added suitable DC bias before being used
to modulate the intensity of the RC-LED [179]. The optical signal is transmitted through the
SI-POF (HFBR-RUD500Z) and received by a PIN-based photo-receiver (PDA10A). A digital
oscilloscope (Agilent 7000B Series) is used to capture the received electrical signal, followed
by an offline post-detection processing. The response of the link can be approximated as a
4th-order low-pass filter with a measured 3 dB bandwidth of 100 MHz as shown in Fig. 7.10.
The system sampling rate is 500 MSa/s.
138
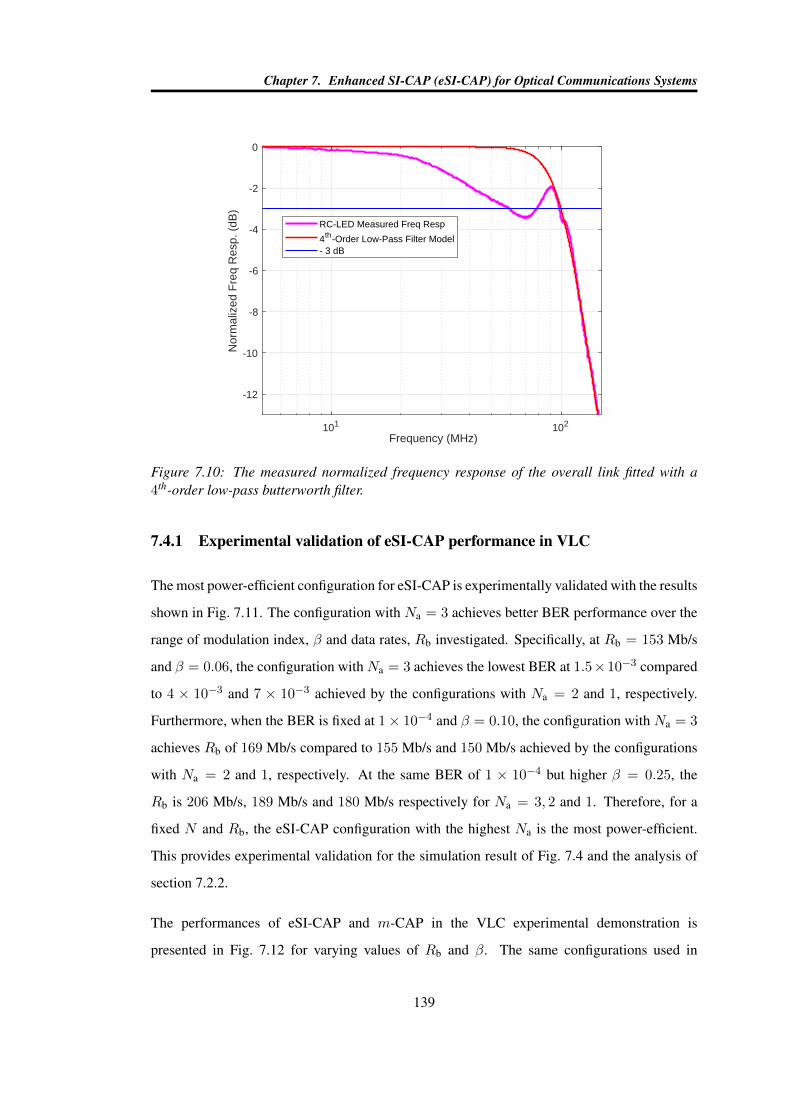
Chapter 7. Enhanced SI-CAP (eSI-CAP) for Optical Communications Systems
101 102
Frequency (MHz)
-12
-10
-8
-6
-4
-2
0
Nor
mal
ized
Fre
q R
esp.
(dB
)RC-LED Measured Freq Resp
4th-Order Low-Pass Filter Model- 3 dB
Figure 7.10: The measured normalized frequency response of the overall link fitted with a4th-order low-pass butterworth filter.
7.4.1 Experimental validation of eSI-CAP performance in VLC
The most power-efficient configuration for eSI-CAP is experimentally validated with the results
shown in Fig. 7.11. The configuration with Na = 3 achieves better BER performance over the
range of modulation index, β and data rates, Rb investigated. Specifically, at Rb = 153 Mb/s
and β = 0.06, the configuration with Na = 3 achieves the lowest BER at 1.5×10⁻³ compared
to 4 × 10⁻³ and 7 × 10⁻³ achieved by the configurations with Na = 2 and 1, respectively.
Furthermore, when the BER is fixed at 1× 10⁻⁴ and β = 0.10, the configuration with Na = 3
achieves Rb of 169 Mb/s compared to 155 Mb/s and 150 Mb/s achieved by the configurations
with Na = 2 and 1, respectively. At the same BER of 1 × 10⁻⁴ but higher β = 0.25, the
Rb is 206 Mb/s, 189 Mb/s and 180 Mb/s respectively for Na = 3, 2 and 1. Therefore, for a
fixed N and Rb, the eSI-CAP configuration with the highest Na is the most power-efficient.
This provides experimental validation for the simulation result of Fig. 7.4 and the analysis of
section 7.2.2.
The performances of eSI-CAP and m-CAP in the VLC experimental demonstration is
presented in Fig. 7.12 for varying values of Rb and β. The same configurations used in
139
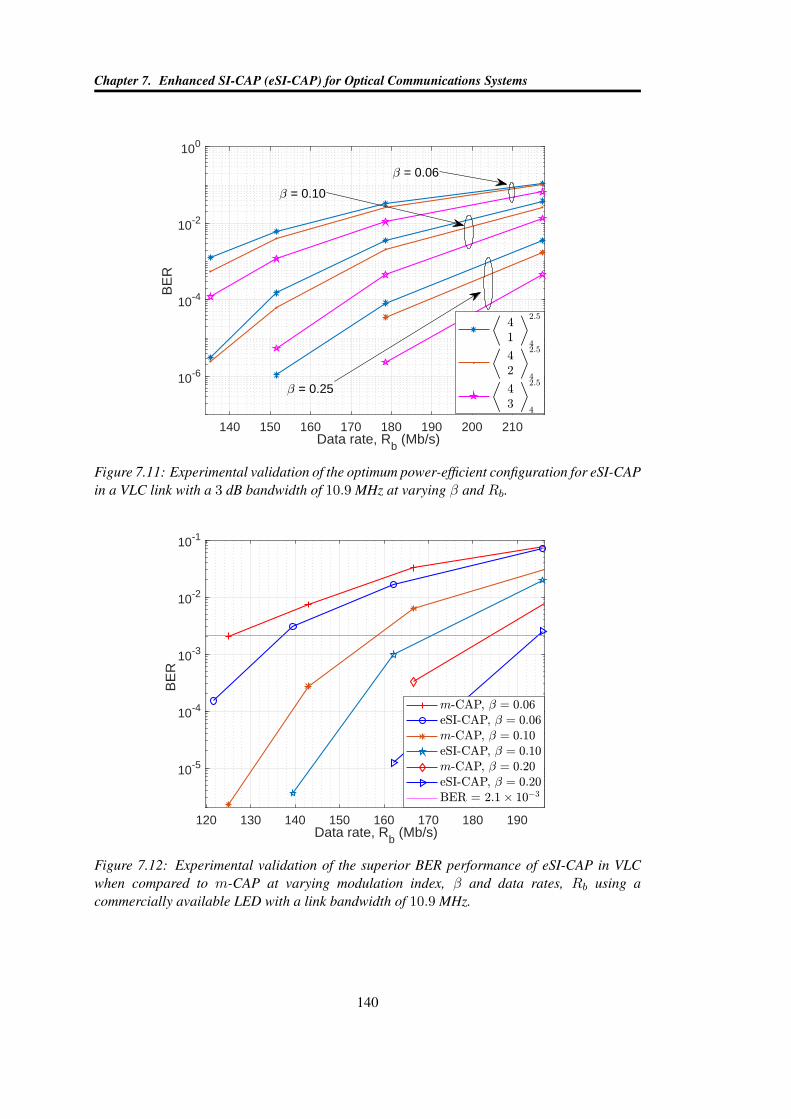
Chapter 7. Enhanced SI-CAP (eSI-CAP) for Optical Communications Systems
140 150 160 170 180 190 200 210Data rate, Rb (Mb/s)
10-6
10-4
10-2
100
BE
R = 0.06
= 0.10
= 0.25
Figure 7.11: Experimental validation of the optimum power-efficient configuration for eSI-CAPin a VLC link with a 3 dB bandwidth of 10.9 MHz at varying β and Rb.
120 130 140 150 160 170 180 190Data rate, Rb (Mb/s)
10-5
10-4
10-3
10-2
10-1
BE
R
Figure 7.12: Experimental validation of the superior BER performance of eSI-CAP in VLCwhen compared to m-CAP at varying modulation index, β and data rates, Rb using acommercially available LED with a link bandwidth of 10.9 MHz.
140
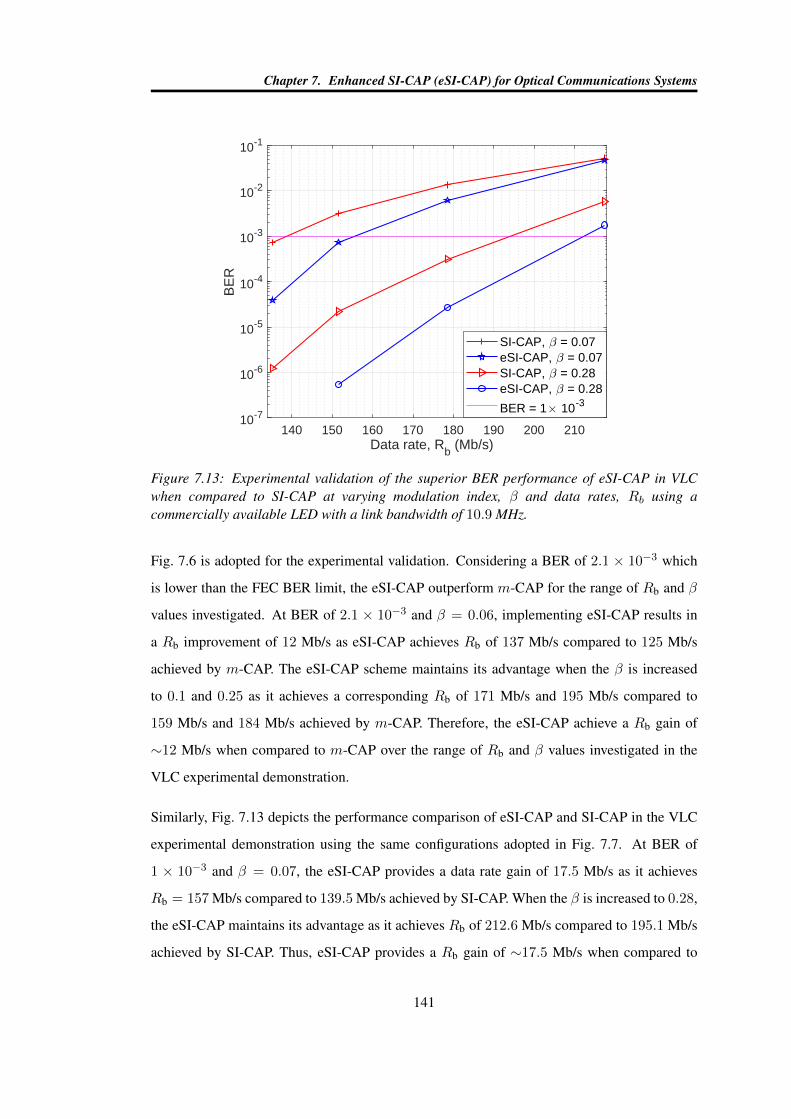
Chapter 7. Enhanced SI-CAP (eSI-CAP) for Optical Communications Systems
140 150 160 170 180 190 200 210Data rate, Rb (Mb/s)
10-7
10-6
10-5
10-4
10-3
10-2
10-1
BE
R
SI-CAP, = 0.07eSI-CAP, = 0.07SI-CAP, = 0.28eSI-CAP, = 0.28
BER = 1 10-3
Figure 7.13: Experimental validation of the superior BER performance of eSI-CAP in VLCwhen compared to SI-CAP at varying modulation index, β and data rates, Rb using acommercially available LED with a link bandwidth of 10.9 MHz.
Fig. 7.6 is adopted for the experimental validation. Considering a BER of 2.1 × 10⁻³ which
is lower than the FEC BER limit, the eSI-CAP outperform m-CAP for the range of Rb and β
values investigated. At BER of 2.1 × 10⁻³ and β = 0.06, implementing eSI-CAP results in
a Rb improvement of 12 Mb/s as eSI-CAP achieves Rb of 137 Mb/s compared to 125 Mb/s
achieved by m-CAP. The eSI-CAP scheme maintains its advantage when the β is increased
to 0.1 and 0.25 as it achieves a corresponding Rb of 171 Mb/s and 195 Mb/s compared to
159 Mb/s and 184 Mb/s achieved by m-CAP. Therefore, the eSI-CAP achieve a Rb gain of
∼12 Mb/s when compared to m-CAP over the range of Rb and β values investigated in the
VLC experimental demonstration.
Similarly, Fig. 7.13 depicts the performance comparison of eSI-CAP and SI-CAP in the VLC
experimental demonstration using the same configurations adopted in Fig. 7.7. At BER of
1 × 10⁻³ and β = 0.07, the eSI-CAP provides a data rate gain of 17.5 Mb/s as it achieves
Rb = 157 Mb/s compared to 139.5 Mb/s achieved by SI-CAP. When the β is increased to 0.28,
the eSI-CAP maintains its advantage as it achieves Rb of 212.6 Mb/s compared to 195.1 Mb/s
achieved by SI-CAP. Thus, eSI-CAP provides a Rb gain of ∼17.5 Mb/s when compared to
141
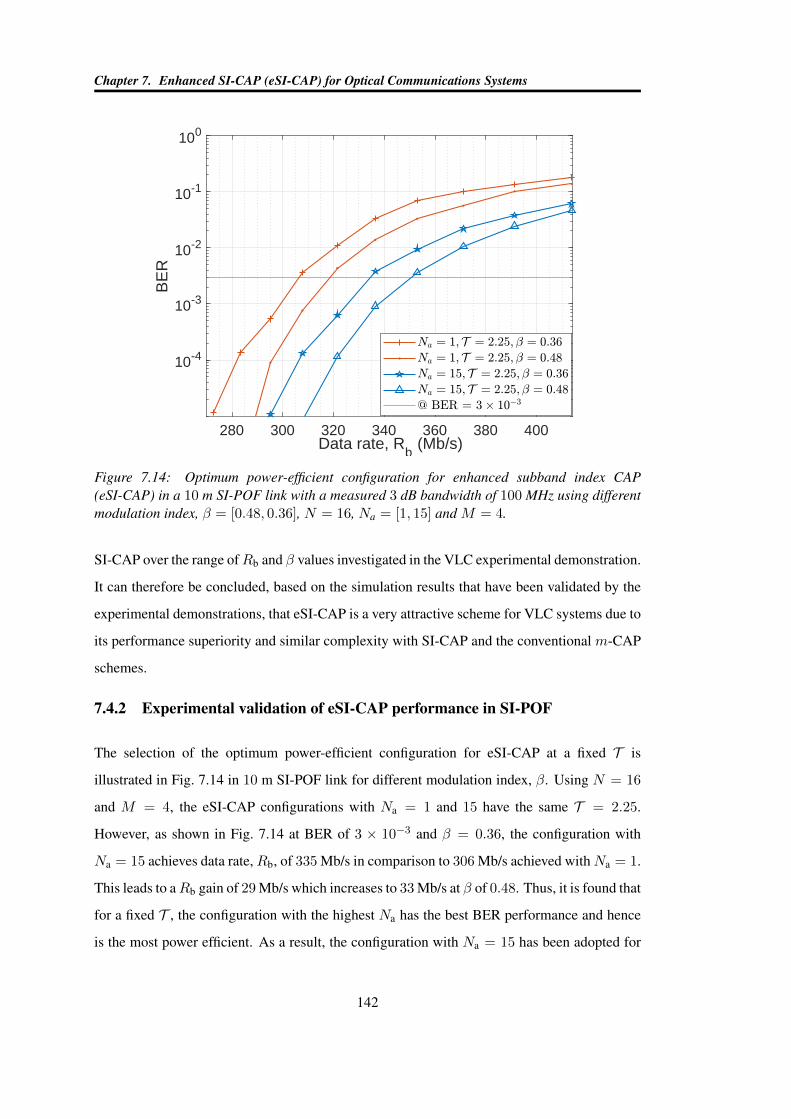
Chapter 7. Enhanced SI-CAP (eSI-CAP) for Optical Communications Systems
280 300 320 340 360 380 400Data rate, R
b (Mb/s)
10-4
10-3
10-2
10-1
100
BE
R
Figure 7.14: Optimum power-efficient configuration for enhanced subband index CAP(eSI-CAP) in a 10 m SI-POF link with a measured 3 dB bandwidth of 100 MHz using differentmodulation index, β = [0.48, 0.36], N = 16, Na = [1, 15] and M = 4.
SI-CAP over the range ofRb and β values investigated in the VLC experimental demonstration.
It can therefore be concluded, based on the simulation results that have been validated by the
experimental demonstrations, that eSI-CAP is a very attractive scheme for VLC systems due to
its performance superiority and similar complexity with SI-CAP and the conventional m-CAP
schemes.
7.4.2 Experimental validation of eSI-CAP performance in SI-POF
The selection of the optimum power-efficient configuration for eSI-CAP at a fixed T is
illustrated in Fig. 7.14 in 10 m SI-POF link for different modulation index, β. Using N = 16
and M = 4, the eSI-CAP configurations with Na = 1 and 15 have the same T = 2.25.
However, as shown in Fig. 7.14 at BER of 3 × 10⁻³ and β = 0.36, the configuration with
Na = 15 achieves data rate,Rb, of 335 Mb/s in comparison to 306 Mb/s achieved withNa = 1.
This leads to aRb gain of 29 Mb/s which increases to 33 Mb/s at β of 0.48. Thus, it is found that
for a fixed T , the configuration with the highest Na has the best BER performance and hence
is the most power efficient. As a result, the configuration with Na = 15 has been adopted for
142
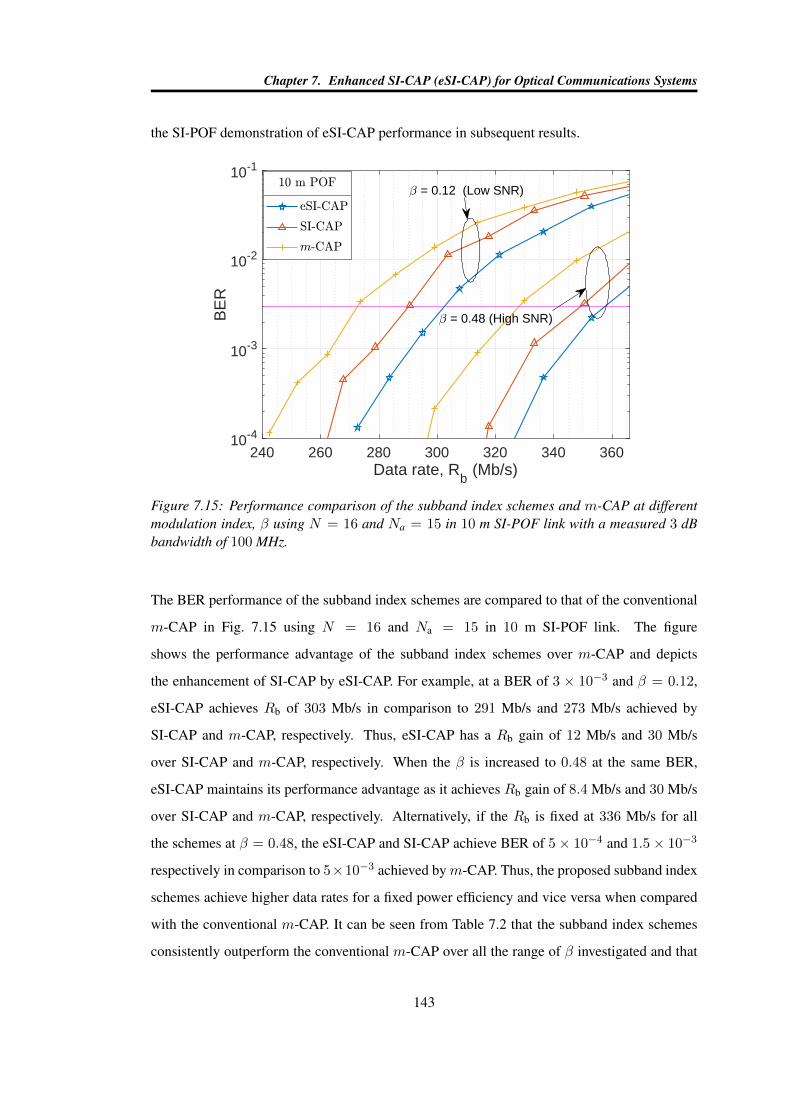
Chapter 7. Enhanced SI-CAP (eSI-CAP) for Optical Communications Systems
the SI-POF demonstration of eSI-CAP performance in subsequent results.
240 260 280 300 320 340 360Data rate, R
b (Mb/s)
10-4
10-3
10-2
10-1
BE
R
= 0.12 (Low SNR)
= 0.48 (High SNR)
Figure 7.15: Performance comparison of the subband index schemes and m-CAP at differentmodulation index, β using N = 16 and Na = 15 in 10 m SI-POF link with a measured 3 dBbandwidth of 100 MHz.
The BER performance of the subband index schemes are compared to that of the conventional
m-CAP in Fig. 7.15 using N = 16 and Na = 15 in 10 m SI-POF link. The figure
shows the performance advantage of the subband index schemes over m-CAP and depicts
the enhancement of SI-CAP by eSI-CAP. For example, at a BER of 3 × 10⁻³ and β = 0.12,
eSI-CAP achieves Rb of 303 Mb/s in comparison to 291 Mb/s and 273 Mb/s achieved by
SI-CAP and m-CAP, respectively. Thus, eSI-CAP has a Rb gain of 12 Mb/s and 30 Mb/s
over SI-CAP and m-CAP, respectively. When the β is increased to 0.48 at the same BER,
eSI-CAP maintains its performance advantage as it achieves Rb gain of 8.4 Mb/s and 30 Mb/s
over SI-CAP and m-CAP, respectively. Alternatively, if the Rb is fixed at 336 Mb/s for all
the schemes at β = 0.48, the eSI-CAP and SI-CAP achieve BER of 5× 10⁻⁴ and 1.5× 10⁻³
respectively in comparison to 5×10⁻³ achieved bym-CAP. Thus, the proposed subband index
schemes achieve higher data rates for a fixed power efficiency and vice versa when compared
with the conventional m-CAP. It can be seen from Table 7.2 that the subband index schemes
consistently outperform the conventional m-CAP over all the range of β investigated and that
143
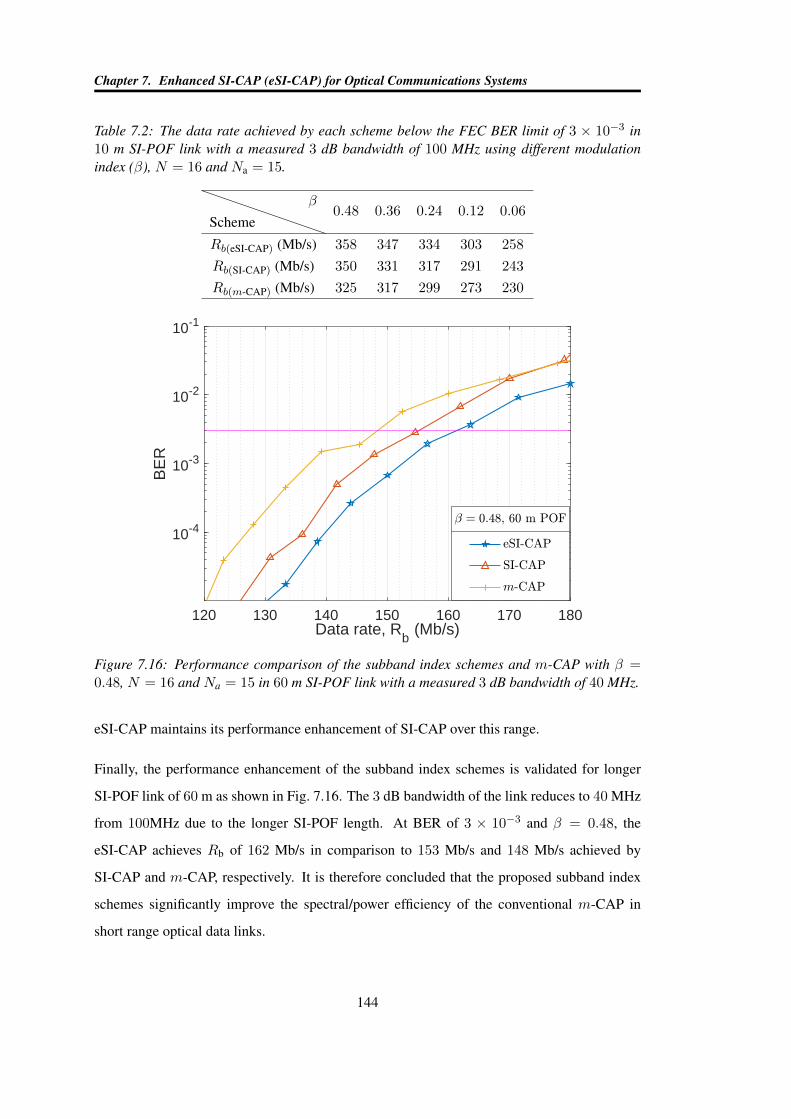
Chapter 7. Enhanced SI-CAP (eSI-CAP) for Optical Communications Systems
Table 7.2: The data rate achieved by each scheme below the FEC BER limit of 3 × 10⁻³ in10 m SI-POF link with a measured 3 dB bandwidth of 100 MHz using different modulationindex (β), N = 16 and Na = 15.
Schemeβ
0.48 0.36 0.24 0.12 0.06
Rb(eSI-CAP) (Mb/s) 358 347 334 303 258
Rb(SI-CAP) (Mb/s) 350 331 317 291 243
Rb(m-CAP) (Mb/s) 325 317 299 273 230
120 130 140 150 160 170 180Data rate, R
b (Mb/s)
10-4
10-3
10-2
10-1
BE
R
Figure 7.16: Performance comparison of the subband index schemes and m-CAP with β =0.48, N = 16 and Na = 15 in 60 m SI-POF link with a measured 3 dB bandwidth of 40 MHz.
eSI-CAP maintains its performance enhancement of SI-CAP over this range.
Finally, the performance enhancement of the subband index schemes is validated for longer
SI-POF link of 60 m as shown in Fig. 7.16. The 3 dB bandwidth of the link reduces to 40 MHz
from 100MHz due to the longer SI-POF length. At BER of 3 × 10⁻³ and β = 0.48, the
eSI-CAP achieves Rb of 162 Mb/s in comparison to 153 Mb/s and 148 Mb/s achieved by
SI-CAP and m-CAP, respectively. It is therefore concluded that the proposed subband index
schemes significantly improve the spectral/power efficiency of the conventional m-CAP in
short range optical data links.
144
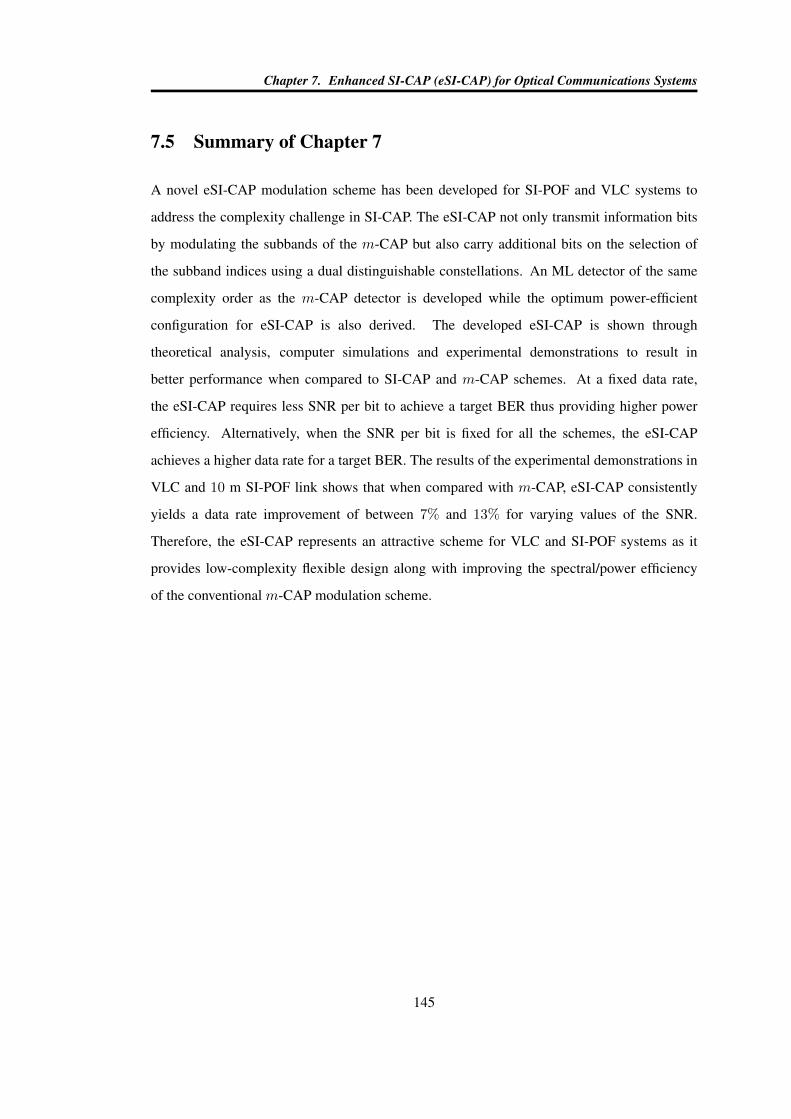
Chapter 7. Enhanced SI-CAP (eSI-CAP) for Optical Communications Systems
7.5 Summary of Chapter 7
A novel eSI-CAP modulation scheme has been developed for SI-POF and VLC systems to
address the complexity challenge in SI-CAP. The eSI-CAP not only transmit information bits
by modulating the subbands of the m-CAP but also carry additional bits on the selection of
the subband indices using a dual distinguishable constellations. An ML detector of the same
complexity order as the m-CAP detector is developed while the optimum power-efficient
configuration for eSI-CAP is also derived. The developed eSI-CAP is shown through
theoretical analysis, computer simulations and experimental demonstrations to result in
better performance when compared to SI-CAP and m-CAP schemes. At a fixed data rate,
the eSI-CAP requires less SNR per bit to achieve a target BER thus providing higher power
efficiency. Alternatively, when the SNR per bit is fixed for all the schemes, the eSI-CAP
achieves a higher data rate for a target BER. The results of the experimental demonstrations in
VLC and 10 m SI-POF link shows that when compared with m-CAP, eSI-CAP consistently
yields a data rate improvement of between 7% and 13% for varying values of the SNR.
Therefore, the eSI-CAP represents an attractive scheme for VLC and SI-POF systems as it
provides low-complexity flexible design along with improving the spectral/power efficiency
of the conventional m-CAP modulation scheme.
145
Chapter 8
Conclusions
8.1 Summary of Key Results
The overriding objective of this thesis is to improve the performance of optical communication
systems, including VLC and SI-POF. In order to achieve this objective, the thesis
focusses on improving the performance of CAP modulation scheme by developing novel
performance-enhancing techniques. The CAP scheme is a popular physical layer technique for
optical communication systems. Challenges such as low modulation bandwidth, susceptibility
to timing jitter, impact of ISI, low spectral and energy efficiency as well as high computational
complexity are addressed in the thesis. The techniques that are developed to address these
challenges are validated using theoretical analysis, computer simulations and proof-of-concept
experimental demonstrations.
To provide a solid background for the thesis, the state of the art in VLC, SI-POF and CAP
modulation are reviewed in chapter 2. The detailed review shows that the use of LED as
a transmitter is one of the major factors contributing to the fast adoption of VLC. Other
highlighted factors include the challenge of the dwindling spectrum in RF and why the huge
free spectrum in VLC can serve a complimentary or alternate solution. The proliferation
of in-home, in-car and in-office applications that are employing SI-POF as a medium of
communication due to its low cost and ease of installation is also mentioned. The review
shows that the emergence of VLC and SI-POF is currently revolutionizing the communication
landscape. The main channel models of the VLC and SI-POF systems are also presented,
including their challenges. It is shown that the limited bandwidth of the LED is a major
bottleneck to achieving high-speed data communication in VLC and SI-POF systems. Several
146
Chapter 8. Conclusions
solutions such as the use of blue filtering, equalization and pre and post processing techniques
are discussed in details. The use of CAP modulation technique is presented as a major
approach to improving the performance of optical communication systems. The benefits of
CAP such as its simple implementation and high performance in comparison to other physical
layer techniques are mentioned. In conclusion, to derive the maximum benefits from the CAP
scheme, the challenges facing the implementation of CAP such as its timing jitter sensitivity,
low tolerance to ISI, high PAPR and complexity of its multiband version are highlighted as
deserving of novel solutions.
Two novel techniques are proposed in chapter 3 to address the timing jitter sensitivity and
the effect of low modulation bandwidth on the implementation of CAP modulation scheme.
The ‘CAP filter’ synchronization technique is developed to address the timing jitter sensitivity
of the CAP scheme. Simulations, analysis and experimental demonstrations show that the
synchronization technique achieves perfect synchronization for CAP-based VLC systems. In
comparison to the state of the art, the ‘CAP filter’ synchronization technique achieve similar
BER and EVM at significantly lower complexity. For example, using a high-order CAP-128
in an VLC experiment over a 1 m distance, both ‘CAP filter’ synchronization technique and
the state of the art technique achieve EVM of 15.7 dB. However, the ‘CAP filter’ technique
utilizes only 6% of the length of the sequence that is employed for the state of the art. To
further reduce the complexity of the system, FSE is employed for joint mitigation of the effects
of timing jitter and low modulation bandwidth. Using the FSE removes the need for a separate
synchronization block as the FSE is shown to be capable of addressing both the effects of
timing jitter and low modulation bandwidth. The result of VLC experimental demonstration
shows that the FSE achieves a data rate of 80 Mb/s compared to 55 Mb/s achieved by the SSE
that is normally employed in the literature. Furthermore, the FSE performance is shown to be
insensitive to increasing timing jitter while that of SSE degrades.
To improve the spectral and energy efficiency of the CAP-based VLC systems, the multiple
LEDs that are usually deployed in VLC are employed in chapter 4 to simultaneously transmit
multiple CAP signals in parallel through the spatial domain. In particular, spatial multiplexing
and repetitive coding techniques are combined with the conventional CAP to improve its
throughput and diversity, respectively. Using spatial multiplexing with CAP, the SMux-CAP
147
Chapter 8. Conclusions
is developed that improves the throughput of the conventional CAP by a factor Nt. In
addition, RC-CAP is also developed that significantly improve the BER performance of the
conventional CAP using repetitive coding. The BER expression of both SMux-CAP and
RC-CAP are derived using ML detector. The simulation results show that the SMux-CAP
is most appropriate in channels with dissimilar gains while RC-CAP should be deployed in
systems with closely co-located transmitters. The PFI precoding technique is then developed
to address the performance degradation of SMux-CAP in channels with similar gains. The PFI
is shown to result in 28.5 dB SNR gain when employed for SMux-CAP. To address the high
complexity of the optimum ML detector, four low complexity detectors are investigated for
SMux-CAP. These detectors include the ZF, MMSE, ZF-OSIC and MMSE-OSIC. It is shown
that MMSE-OSIC is the best detector for SMux-CAP as it achieves superior performance at a
moderate computational complexity. It outperforms other low complexity detectors and only
has about 5 dB degradation in comparison to the practically infeasible ML detector. However,
its computational complexity is an order of magnitude lower than that of the ML detector. Thus,
MMSE-OSIC has the best performance-complexity trade-off for SMux-CAP based systems.
The challenge with SMux-CAP system is that the simultaneous use of all the available
LEDs results in inter-channel/intersymbol interference at the receiver which degrades the
system performance. To tackle this challenge, the S-CAP is developed in chapter 5 by
considering the combination of spatial modulation and the conventional CAP. In contrast to
the SMux, the S-CAP only transmits a CAP signal through one LED out of the total number
of LEDs available. Its special efficiency improvement factor compared to CAP is shown to be
logM (MNt). In addition to the bits encoded in the CAP signal, the S-CAP encodes additional
information bits on the index/position of the LED that transmits the CAP signal. The BER
analysis of S-CAP is also derived and its performance is investigated for both LOS and NLOS
propagation. The investigation shows that S-CAP performance in LOS depends largely on
three factors namely: (i) signal constellation points (SCP); (ii) the channel dissimilarity,
(|∆h|); and (iii) the minimum value of the channel gains (hmin). While in NLOS, the τrms
effect overrides the effect of hmin. It is found that the S-CAP performance degrades due to
closely-spaced transmitting LEDs and multipath propagation that results from high order
reflections. The use of PFI is found to substantially improve the S-CAP performance in LOS
resulting in an SNR gain of 33.5 dB while it is ineffective in NLOS propagation. However, the
148
Chapter 8. Conclusions
use of multiple PDs improve the performance of S-CAP in both LOS and NLOS scenarios
leading to an SNR gain of 43 dB with the use of four PDs. The GS-CAP which uses multiple
LEDs to transmit copies of CAP signal is further developed to improve on the S-CAP scheme.
It is found that for different GS-CAP system configurations with the same spectral efficiency,
the configuration with the lowest number of active LEDs results in optimum power efficiency
(SNR) and BER performance.
The problem with the SMux-CAP and S-CAP techniques is the requirement for sufficient
separation between transmitting LEDs and receiving PDs to achieve good BER performance.
So as alternative to using the spatial domains, the suband domains is explored in chapter 6 to
improve on the performance of CAP modulation. The index modulation technique is combined
with m-CAP to develop SI-CAP. The SI-CAP only transmits data bits on some selected
subbands of m-CAP. Additional bits are then encoded on the selection of which subbands to
modulate with data bits while the rest are nulled, that is no data symbols are modulated on them.
The BER analysis of SI-CAP is derived based on MLD and its performance is investigated in
both VLC and SI-POF. The derived BER expression is validated using computer simulations.
Two low complexity detectors are then developed to address the computational complexity
of the MLD. It is shown that the two detectors achieve similar BER performance as MLD at
significantly low complexity. The performance of SI-CAP and m-CAP are compared using
simulation and experimental demonstrations. It is shown that SI-CAP achieves SNR gain of
1 dB over m-CAP in AWGN channel. When the performance is compared in VLC systems,
SI-CAP achieves an SNR gain of 2.2 dB. The performance gain of SI-CAP is validated using
experimental demonstration for both VLC and SI-POF channels. The SI-CAP also maintains
its performance advantage when RLS equalizers are employed to improve performance. It
is found that for a fixed data rate, the SI-CAP requires lower SNR per bit to achieve the same
BER performance as them-CAP. Alternatively, when the SNR per bit is fixed for both schemes,
SI-CAP achieves higher data rate at a target BER.
However, a challenge arises with increasing constellation size in SI-CAP. It is noted that the
number of subbands required to achieve the same spectral efficiency as m-CAP increases
as the constellation size, M , increases in SI-CAP. This requirement results in increased
complexity for SI-CAP when large constellation sizes are used. As a result, an enhanced
149
Chapter 8. Conclusions
SI-CAP (eSI-CAP) is developed in chapter 7 to address this challenge. The eSI-CAP
addresses the challenge by modulating all the subbands of m-CAP with data symbols from
a dual distinguishable constellations. In addition, it encodes information bits on the index
of the subbands. This ensure that eSI-CAP achieves higher spectral efficiency than SI-CAP
and m-CAP without increasing complexity as the constellation size increases. The BER
performance analysis of eSI-CAP is derived using the MLD and validated through simulation
and experimental demonstrations. To further reduce complexity, a low complexity detector is
developed for eSI-CAP that achieves similar BER performance as the MLD. The results also
show that eSI-CAP outperform SI-CAP and m-CAP for varying values of modulation index
considered in VLC and SI-POF channels. The results of the experimental demonstrations in
VLC and 10 m SI-POF link shows that when compared with m-CAP, eSI-CAP consistently
yields a data rate improvement of between 7% and 13% for varying values of the SNR.
A comparison of the schemes’ PAPR shows that beyond N > 4, all the schemes exhibit
similar PAPR. Thus, eSI-CAP is a low-complexity technique that improves the data rate of the
conventional m-CAP modulation.
8.2 Limitation
The main limitation of the various techniques that are proposed in this thesis pertains to their
complexities. The ML receiver is not scalable as its computational complexity increases
exponentially with increasing system parameters. This makes the implementation of ML
receiver infeasible for real-time applications. As a result, low-complexity receivers have been
designed for the proposed techniques in the thesis which result in compromising performance
for reduced complexity. Hence, further research is required to develop receivers that are
suitable for real-time applications in terms of their complexities while having similar or
comparable performance to the ML receiver.
8.3 Future Direction
The techniques that have been developed in this theses are by no means exhaustive and based
on the results, there are several considerations that merit further investigations. Some of these
considerations are further discussed as future work to be carried out.
150
Chapter 8. Conclusions
Theoretical quantification of channel impairments: Theoretical analysis quantifying the
effect of timing jitter in CAP as well as the effect of multipath remains open research issues.
Similarly, the analytical quantification of the effects of signal clipping and LED non-linearity
also remain outstanding research problem, especially in view of the high PAPR of the m-CAP
scheme. The effect of a non-linear system on a multi-carrier input signal can be modelled as an
attenuation of the signal plus a non- Gaussian clipping noise component using the central limit
and Bussgang theorem [180]. But whether this characterization can be extended to the m-CAP
scheme requires some investigation, considering its use of RRC filter and the fact that only a
few subbands are implemented.
Analysis incorporating NLOS and timing jitter effects: The BER performance analysis
for spatial and MIMO CAP as well as SI-CAP all assumed perfect synchronization and
line-of-sight (LOS) conditions. These analyses can be extended further to obtain BER
expressions that incorporate the effects of non LOS and timing jitter. Such analyses will
enable a more accurate evaluation of the effects of NLOS and timing jitter on the techniques
that have been developed in the theses.
Hybrid of spatial and subband indexing techniques: Considering the performance gain
of the S-CAP and SI-CAP, a hybrid system can also be developed that combines the two
techniques. This means that the SI-CAP, rather than the CAP signal, is transmitted through
multiple LEDs. This will combine the advantages of both the spatial and subband index
modulations and results in further enhancement of the CAP modulation technique.
Real time implementation: Field programmable gate array (FPGA) development is a
promising area of research and provides a means of achieving real-time implementation
(RTI) of CAP modulation. There has not been much work done on RTI of CAP in the
literature compared to other competing schemes [181–183]. The possibility of operating at
the Nyquist sampling rate offered by m-CAP modulation might be an advantage in hardware
implementation, especially for the design of analogue-to-digital converter (ADC) and
digital-to-analogue converter (DAC) at high data rates [24]. Other parameters of considerable
importance will be the bit resolution and the previously highlighted timing jitter. While a CAP
system, being a single carrier, requires low bit resolution [89], m-CAP will require higher
bit resolution as more subbands are added. Furthermore, the computational cost and power
151

Chapter 8. Conclusions
requirements will put significant constraints on the hardware realization and will be crucial in
its design. Overall, RTI of CAP on FPGA will enable thorough analysis of the various issues
concerning CAP system and the required hardware resources.
152
References
[1] H. Haas, “LiFi is a paradigm-shifting 5G technology,” Reviews in Physics, vol. 3, pp. 26 – 31,
2018.
[2] D. Karunatilaka, F. Zafar, V. Kalavally, and R. Parthiban, “LED based indoor visible light
communications: State of the art,” IEEE Communications Surveys Tutorials, vol. 17, no. 3, pp.
1649–1678, thirdquarter 2015.
[3] H. Haas, L. Yin, Y. Wang, and C. Chen, “What is LiFi?” Journal of Lightwave Technology,
vol. 34, no. 6, pp. 1533–1544, March 2016.
[4] Z. Ghassemlooy, W. Popoola, and S. Rajbhandari, Optical Wireless Communications: System
and Channel Modelling with MATLAB, 1st ed. Boca Raton, FL, USA: CRC Press, Inc., 2012.
[5] M. Figueiredo, L. N. Alves, and C. Ribeiro, “Lighting the wireless world: The promise and
challenges of visible light communication,” IEEE Consumer Electronics Magazine, vol. 6, no. 4,
pp. 28–37, Oct 2017.
[6] S. H. Yu, O. Shih, H. M. Tsai, N. Wisitpongphan, and R. D. Roberts, “Smart automotive lighting
for vehicle safety,” IEEE Communications Magazine, vol. 51, no. 12, pp. 50–59, December 2013.
[7] K. O. Akande, P. A. Haigh, and W. O. Popoola, “On the implementation of carrierless amplitude
and phase modulation in visible light communication,” IEEE Access, pp. 1–1, 2018.
[8] H. Le Minh et al., “100-Mb/s NRZ visible light communications using a postequalized white
LED,” IEEE Photonics Technology Letters, vol. 21, no. 15, pp. 1063–1065, 2009.
[9] K. H. Lee and S. W. R. Lee, “Process development for yellow phosphor coating on blue
light emitting diodes (LEDs) for white light illumination,” in 2006 8th Electronics Packaging
Technology Conference, Dec 2006, pp. 379–384.
[10] H. L. Minh, D. O’Brien, G. Faulkner, L. Zeng, K. Lee, D. Jung, and Y. Oh, “High-speed visible
light communications using multiple-resonant equalization,” IEEE Photonics Technology Letters,
vol. 20, no. 14, pp. 1243–1245, July 2008.
[11] J. Grubor, S. C. J. Lee, K. D. Langer, T. Koonen, and J. W. Walewski, “Wireless high-speed
data transmission with phosphorescent white-light LEDs,” in 33rd European Conference and
Exhibition of Optical Communication - Post-Deadline Papers (published 2008), Sept 2007, pp.
1–2.
153
References
[12] C. W. Chow, C. H. Yeh, Y. Liu, and Y. F. Liu, “Digital signal processing for light emitting
diode based visible light communication,” IEEE Photon. Soc. Newslett., vol. 26, no. 5, pp. 9–13,
October 2012.
[13] G. Stepniak, M. Schuppert, and C. A. Bunge, “Advanced modulation formats in phosphorous
LED VLC links and the impact of blue filtering,” Journal of Lightwave Technology, vol. 33,
no. 21, pp. 4413–4423, Nov 2015.
[14] G. Stepniak, M. Schuppert, and C.-A. Bunge, “8 - polymer-optical fibres for data transmission,”
in Polymer Optical Fibres, C.-A. Bunge, T. Gries, and M. Beckers, Eds. Woodhead Publishing,
2017, pp. 217 – 310.
[15] O. Ziemann, J. Krauser, P. E. Zamzow, and W. Daum, POF Handbook: Optical Short Range
Transmission Systems. Berlin, Heidelberg: Springer-Verlag, 2008.
[16] O. Ziemann, P. E. Zamzow, J. Krauser, W. Daum, W. Daumeister, and E. Al, POF-Polymer
Optical Fibers for Data Communication. Berlin, Heidelberg: Springer-Verlag, 2002.
[17] I. N. Osahon, S. Rajbhandari, and W. O. Popoola, “Performance comparison of equalization
techniques for SI-POF multi-gigabit communication with PAM- M and device non-linearities,”
Journal of Lightwave Technology, vol. 36, no. 11, pp. 2301–2308, June 2018.
[18] I. N. Osahon, M. Safari, and W. O. Popoola, “10-Gb/s transmission over 10-m SI-POF with
M -PAM and multilayer perceptron equalizer,” IEEE Photonics Technology Letters, vol. 30,
no. 10, pp. 911–914, May 2018.
[19] Y. Wang, L. Tao, X. Huang, J. Shi, and N. Chi, “8-Gb/s RGBY LED-based WDM VLC system
employing high-order CAP modulation and hybrid post equalizer,” IEEE Photonics Journal,
vol. 7, no. 6, pp. 1–7, Dec 2015.
[20] Y. Wang, X. Huang, L. Tao, J. Shi, and N. Chi, “4.5-Gb/s RGB-LED based WDM visible light
communication system employing CAP modulation and RLS based adaptive equalization,” Opt.
Express, vol. 23, no. 10, pp. 13 626–13 633, May 2015.
[21] Y. Wang, X. Huang, L. Tao, and N. Chi, “1.8-Gb/s WDM visible light communication over
50-meter outdoor free space transmission employing CAP modulation and receiver diversity
technology,” in 2015 Optical Fiber Communications Conference and Exhibition (OFC), March
2015, pp. 1–3.
[22] S. Lin, J. B. Wang, J. Y. Wang, J. Wang, and M. Chen, “Low-timing-sensitivity waveform
design for carrierless amplitude and phase modulation in visible light communications,” IET
Optoelectronics, vol. 9, no. 6, pp. 317–324, 2015.
154
References
[23] A. H. Abdolhamid and D. A. Johns, “A comparison of CAP/QAM architectures,” in Proceedings
of the 1998 IEEE International Symposium on Circuits and Systems, 1998. ISCAS’98., vol. 4.
IEEE, 1998, pp. 316–316.
[24] M. I. Olmedo, T. Zuo, J. B. Jensen, Q. Zhong, X. Xu, S. Popov, and I. T. Monroy, “Multiband
carrierless amplitude phase modulation for high capacity optical data links,” Journal of Lightwave
Technology, vol. 32, no. 4, pp. 798–804, Feb 2014.
[25] P. A. Haigh et al., “Multi-band carrier-less amplitude and phase modulation for bandlimited
visible light communications systems,” IEEE Wireless Communications, vol. 22, no. 2, pp. 46–53,
April 2015.
[26] G. . Im, D. B. Harman, G. Huang, A. V. Mandzik, M. . Nguyen, and J. . Werner, “51.84 Mb/s
16-CAP ATM LAN standard,” IEEE Journal on Selected Areas in Communications, vol. 13,
no. 4, pp. 620–632, May 1995.
[27] J. Gao, Y. H. Leung, and V. Sreeram, “Digital filters for carrierless amplitude and phase
receivers,” in Proceedings of IEEE Region 10 International Conference on Electrical and
Electronic Technology. TENCON 2001 (Cat. No.01CH37239), vol. 2, 2001, pp. 575–579 vol.2.
[28] B. R. Saltzberg, “Comparison of single-carrier and multitone digital modulation for ADSL
applications,” IEEE Communications magazine, vol. 36, no. 11, pp. 114–121, 1998.
[29] W. O. Popoola, Z. Ghassemlooy, and B. G. Stewart, “Pilot-assisted PAPR reduction technique
for optical OFDM communication systems,” Journal of Lightwave Technology, vol. 32, no. 7, pp.
1374–1382, 2014.
[30] G. Stepniak and J. Siuzdak, “Experimental investigation of PAM, CAP and DMT modulations
efficiency over a double-step-index polymer optical fiber,” Optical Fiber Technology, vol. 20,
no. 4, pp. 369 – 373, 2014.
[31] K. Zhong et al., “Experimental study of PAM-4, CAP-16, and DMT for 100 Gb/s short reach
optical transmission systems,” Opt. Express, vol. 23, no. 2, pp. 1176–1189, Jan 2015.
[32] A. G. Bell, W. G. Adams, Tyndall, and W. H. Preece, “Discussion on ”the photophone and the
conversion of radiant energy into sound”,” Journal of the Society of Telegraph Engineers, vol. 9,
no. 34, pp. 375–383, 1880.
[33] P. M. Pattison, M. Hansen, and J. Y. Tsao, “LED lighting efficacy: Status and directions,”
Comptes Rendus Physique, vol. 19, no. 3, pp. 134 – 145, 2018.
[34] G. Pang, T. Kwan, C.-H. Chan, and H. Liu, “LED traffic light as a communications device,”
in Proceedings 199 IEEE/IEEJ/JSAI International Conference on Intelligent Transportation
Systems (Cat. No.99TH8383), Oct 1999, pp. 788–793.
155
References
[35] Y. Tanaka, S. Haruyama, and M. Nakagawa, “Wireless optical transmissions with white colored
LED for wireless home links,” in 11th IEEE International Symposium on Personal Indoor and
Mobile Radio Communications. PIMRC 2000. Proceedings (Cat. No.00TH8525), vol. 2, Sept
2000, pp. 1325–1329 vol.2.
[36] J. Soderberg, “Free space optics in the czech wireless community: Shedding some light on the
role of normativity for user-initiated innovations,” Science, Technology, & Human Values, vol. 36,
no. 4, pp. 423–450, 2011.
[37] H. Burchardt, N. Serafimovski, D. Tsonev, S. Videv, and H. Haas, “VLC: Beyond point-to-point
communication,” IEEE Communications Magazine, vol. 52, no. 7, pp. 98–105, July 2014.
[38] P. A. Haigh, F. Bausi, H. L. Minh, I. Papakonstantinou, W. O. Popoola, A. Burton, and
F. Cacialli, “Wavelength-multiplexed polymer LEDs: Towards 55 Mb/s organic visible light
communications,” IEEE Journal on Selected Areas in Communications, vol. 33, no. 9, pp.
1819–1828, Sept 2015.
[39] S.-H. Yang, H.-S. Kim, Y.-H. Son, and S.-K. Han, “Reduction of optical interference by
wavelength filtering in RGB-LED based indoor VLC system,” in 16th Opto-Electronics and
Communications Conference, July 2011, pp. 551–552.
[40] P. A. Haigh, Z. Ghassemlooy, S. Rajbhandari, and I. Papakonstantinou, “Visible light
communications using organic light emitting diodes,” IEEE Communications Magazine, vol. 51,
no. 8, pp. 148–154, August 2013.
[41] P. A. Haigh, Z. Ghassemlooy, S. T. Le, F. Bausi, H. L. Minh, F. Cacialli, and I. Darwazeh,
“Organic visible light communications: Methods to achieve 10 Mb/s,” in 2017 IEEE Photonics
Conference (IPC), Oct 2017, pp. 553–554.
[42] H. Chen, Z. Xu, Q. Gao, and S. Li, “A 51.6 Mbps experimental VLC system using a monochromic
organic LED,” IEEE Photonics Journal, vol. PP, no. 99, pp. 1–1, 2017.
[43] M. S. Islim, R. X. Ferreira, X. He, E. Xie, S. Videv, S. Viola, S. Watson, N. Bamiedakis,
R. V. Penty, I. H. White, A. E. Kelly, E. Gu, H. Haas, and M. D. Dawson, “Towards 10 Gb/s
orthogonal frequency division multiplexing-based visible light communication using a GaN
violet micro-LED,” Photon. Res., vol. 5, no. 2, pp. A35–A43, Apr 2017.
[44] R. X. G. Ferreira, E. Xie, J. J. D. McKendry, S. Rajbhandari, H. Chun, G. Faulkner,
S. Watson, A. E. Kelly, E. Gu, R. V. Penty, I. H. White, D. C. O’Brien, and M. D. Dawson,
“High bandwidth GaN-based micro-LEDs for multi-Gb/s visible light communications,” IEEE
Photonics Technology Letters, vol. 28, no. 19, pp. 2023–2026, Oct 2016.
[45] J. J. D. McKendry, R. P. Green, A. E. Kelly, Z. Gong, B. Guilhabert, D. Massoubre, E. Gu,
and M. D. Dawson, “High-speed visible light communications using individual pixels in a micro
156
References
light-emitting diode array,” IEEE Photonics Technology Letters, vol. 22, no. 18, pp. 1346–1348,
Sept 2010.
[46] R. Baets, D. Delbeke, R. Bockstaele, and P. Bienstman, “Resonant-cavity light-emitting diodes:
a review,” in Proceedings of SPIE ( Light-emitting Diodes:Research, Manufactering, and
Applications VII), E. Schubert, H. Yao, K. Linden, and D. McGraw, Eds., 2003, pp. 74–86.
[47] J. Vucic, C. Kottke, S. Nerreter, A. Buttner, K. . Langer, and J. W. Walewski, “White light
wireless transmission at 200+Mb/s net data rate by use of discrete-multitone modulation,” IEEE
Photonics Technology Letters, vol. 21, no. 20, pp. 1511–1513, Oct 2009.
[48] A. M. Khalid, G. Cossu, R. Corsini, P. Choudhury, and E. Ciaramella, “1-Gb/s transmission
over a phosphorescent white LED by using rate-adaptive discrete multitone modulation,” IEEE
Photonics Journal, vol. 4, no. 5, pp. 1465–1473, Oct 2012.
[49] F. M. Wu, C. T. Lin, C. C. Wei, C. W. Chen, H. T. Huang, and C. H. Ho, “1.1-Gb/s
white-LED-based visible light communication employing carrier-less amplitude and phase
modulation,” IEEE Photonics Technology Letters, vol. 24, no. 19, pp. 1730–1732, Oct 2012.
[50] X. Huang, S. Chen, Z. Wang, J. Shi, Y. Wang, J. Xiao, and N. Chi, “2.0-Gb/s visible light link
based on adaptive bit allocation OFDM of a single phosphorescent white LED,” IEEE Photonics
Journal, vol. 7, no. 5, pp. 1–8, Oct 2015.
[51] H. Chun, S. Rajbhandari, G. Faulkner, D. Tsonev, E. Xie, J. J. D. McKendry, E. Gu, M. D.
Dawson, D. C. O’Brien, and H. Haas, “LED based wavelength division multiplexed 10 Gb/s
visible light communications,” Journal of Lightwave Technology, vol. 34, no. 13, pp. 3047–3052,
July 2016.
[52] A. Burton, S. Zvanovec, Z. Ghassemlooy, P. A. Haigh, I. Darwazeh, and H. L. Minh,
“Investigation of WDM VLC using standard 5 mm RGB LEDs,” in 2018 11th International
Symposium on Communication Systems, Networks Digital Signal Processing (CSNDSP), July
2018, pp. 1–6.
[53] G. Cossu, W. Ali, R. Corsini, and E. Ciaramella, “Gigabit-class optical wireless communication
system at indoor distances (1.5 – 4 m),” Opt. Express, vol. 23, no. 12, pp. 15 700–15 705, Jun
2015.
[54] D. Tsonev, H. Chun, S. Rajbhandari, J. J. D. McKendry, S. Videv, E. Gu, M. Haji, S. Watson,
A. E. Kelly, G. Faulkner, M. D. Dawson, H. Haas, and D. O’Brien, “A 3-Gb/s single-LED
OFDM-based wireless VLC link using a gallium nitride µLED,” IEEE Photonics Technology
Letters, vol. 26, no. 7, pp. 637–640, April 2014.
[55] C. Shen, T. K. Ng, J. T. Leonard, A. Pourhashemi, H. M. Oubei, M. S. Alias, S. Nakamura,
S. P. DenBaars, J. S. Speck, A. Y. Alyamani, M. M. Eldesouki, and B. S. Ooi,
157
References
“High-modulation-efficiency, integrated waveguide modulator–laser diode at 448 nm,” ACS
Photonics, vol. 3, no. 2, pp. 262–268, 2016.
[56] Y.-C. Chi, D.-H. Hsieh, C.-T. Tsai, H.-Y. Chen, H.-C. Kuo, and G.-R. Lin, “450-nm GaN laser
diode enables high-speed visible light communication with 9-Gbps QAM-OFDM,” Opt. Express,
vol. 23, no. 10, pp. 13 051–13 059, May 2015.
[57] D. Tsonev, S. Videv, and H. Haas, “Towards a 100 Gb/s visible light wireless access network,”
Opt. Express, vol. 23, no. 2, pp. 1627–1637, Jan 2015.
[58] M. T. Sajjad, P. P. Manousiadis, H. Chun, D. A. Vithanage, S. Rajbhandari, A. L. Kanibolotsky,
G. Faulkner, D. O’Brien, P. J. Skabara, I. D. W. Samuel, and G. A. Turnbull, “Novel fast
color-converter for visible light communication using a blend of conjugated polymers,” ACS
Photonics, vol. 2, no. 2, pp. 194–199, 2015.
[59] D. A. Vithanage, A. L. Kanibolotsky, S. Rajbhandari, P. P. Manousiadis, M. T. Sajjad, H. Chun,
G. E. Faulkner, D. C. O’Brien, P. J. Skabara, I. D. W. Samuel, and G. A. Turnbull, “Polymer
colour converter with very high modulation bandwidth for visible light communications,” J.
Mater. Chem. C, vol. 5, pp. 8916–8920, 2017.
[60] S. Rajbhandari, J. J. D. McKendry, J. Herrnsdorf, H. Chun, G. Faulkner, H. Haas, I. M. Watson,
D. O’Brien, and M. D. Dawson, “A review of gallium nitride LEDs for multi-gigabit-per-second
visible light data communications,” Semiconductor Science and Technology, vol. 32, no. 2, p.
023001, 2017.
[61] J. M. Kahn and J. R. Barry, “Wireless infrared communications,” Proceedings of the IEEE,
vol. 85, no. 2, pp. 265–298, Feb 1997.
[62] O. Kharraz and D. Forsyth, “Performance comparisons between PIN and APD photodetectors
for use in optical communication systems,” Optik - International Journal for Light and Electron
Optics, vol. 124, no. 13, pp. 1493 – 1498, 2013.
[63] N. Saha, M. S. Ifthekhar, N. T. Le, and Y. M. Jang, “Survey on optical camera communications:
challenges and opportunities,” IET Optoelectronics, vol. 9, no. 5, pp. 172–183, 2015.
[64] E. Sarbazi, M. Safari, and H. Haas, “Statistical modeling of single-photon avalanche diode
receivers for optical wireless communications,” IEEE Transactions on Communications, vol. 66,
no. 9, pp. 4043–4058, Sept 2018.
[65] F.-M. Wu, C.-T. Lin, C.-C. Wei, C.-W. Chen, Z.-Y. Chen, and H.-T. Huang, “3.22-Gb/s WDM
visible light communication of a single RGB LED employing carrier-less amplitude and phase
modulation,” in 2013 Optical Fiber Communication Conference and Exposition and the National
Fiber Optic Engineers Conference (OFC/NFOEC), March 2013, pp. 1–3.
158
References
[66] Y. Li, M. Safari, R. Henderson, and H. Haas, “Optical OFDM with single-photon avalanche
diode,” IEEE Photonics Technology Letters, vol. 27, no. 9, pp. 943–946, May 2015.
[67] B. Fahs, M. Romanowicz, and M. M. Hella, “A Gbps building-to-building VLC link using
standard CMOS avalanche photodiodes,” IEEE Photonics Journal, vol. 9, no. 6, pp. 1–9, Dec
2017.
[68] P. Luo, M. Zhang, Z. Ghassemlooy, H. L. Minh, H. M. Tsai, X. Tang, and D. Han,
“Experimental demonstration of a 1024-QAM optical camera communication system,” IEEE
Photonics Technology Letters, vol. 28, no. 2, pp. 139–142, Jan 2016.
[69] T. Yamazato, I. Takai, H. Okada, T. Fujii, T. Yendo, S. Arai, M. Andoh, T. Harada, K. Yasutomi,
K. Kagawa, and S. Kawahito, “Image-sensor-based visible light communication for automotive
applications,” IEEE Communications Magazine, vol. 52, no. 7, pp. 88–97, July 2014.
[70] C.-W. Chen, C.-W. Chow, Y. Liu, and C.-H. Yeh, “Efficient demodulation scheme for
rolling-shutter-patterning of CMOS image sensor based visible light communications,” Opt.
Express, vol. 25, no. 20, pp. 24 362–24 367, Oct 2017.
[71] W.-C. Wang, C.-W. Chow, L.-Y. Wei, Y. Liu, and C.-H. Yeh, “Long distance non-line-of-sight
(nlos) visible light signal detection based on rolling-shutter-patterning of mobile-phone camera,”
Opt. Express, vol. 25, no. 9, pp. 10 103–10 108, May 2017.
[72] S. Collins, D. C. O’Brien, and A. Watt, “High gain, wide field of view concentrator for optical
communications,” Opt. Lett., vol. 39, no. 7, pp. 1756–1759, Apr 2014.
[73] A comparative study of optical concentrators for visible light communications, vol. 10128, 2017.
[74] R. Mulyawan, H. Chun, A. Gomez, S. Rajbhandari, G. Faulkner, P. P. Manousiadis, D. A.
Vithanage, G. A. Turnbull, I. D. W. Samuel, S. Collins, and D. O’Brien, “MIMO visible
light communications using a wide field-of-view fluorescent concentrator,” IEEE Photonics
Technology Letters, vol. 29, no. 3, pp. 306–309, Feb 2017.
[75] P. P. Manousiadis, S. Rajbhandari, R. Mulyawan, D. A. Vithanage, H. Chun, G. Faulkner, D. C.
O’Brien, G. A. Turnbull, S. Collins, and I. D. Samuel, “Wide field-of-view fluorescent antenna
for visible light communications beyond the etendue limit,” Optica, vol. 3, no. 7, pp. 702–706,
Jul 2016.
[76] J. Armstrong, R. J. Green, and M. D. Higgins, “Comparison of three receiver designs for optical
wireless communications using white LEDs,” IEEE Communications Letters, vol. 16, no. 5, pp.
748–751, May 2012.
[77] J. M. Kahn, R. You, P. Djahani, A. G. Weisbin, B. K. Teik, and A. Tang, “Imaging diversity
receivers for high-speed infrared wireless communication,” IEEE Communications Magazine,
vol. 36, no. 12, pp. 88–94, Dec 1998.
159
References
[78] G. Yun and M. Kavehrad, “Spot-diffusing and fly-eye receivers for indoor infrared wireless
communications,” in 1992 IEEE International Conference on Selected Topics in Wireless
Communications, June 1992, pp. 262–265.
[79] A. H. Azhar, T. Tran, and D. O’Brien, “Demonstration of high-speed data transmission using
MIMO-OFDM visible light communications,” in 2010 IEEE Globecom Workshops, Dec 2010,
pp. 1052–1056.
[80] F. R. Gfeller and U. Bapst, “Wireless in-house data communication via diffuse infrared radiation,”
Proceedings of the IEEE, vol. 67, no. 11, pp. 1474–1486, Nov 1979.
[81] K. Lee, H. Park, and J. R. Barry, “Indoor channel characteristics for visible light
communications,” IEEE Communications Letters, vol. 15, no. 2, pp. 217–219, February 2011.
[82] H. L. Minh, D. O’Brien, G. Faulkner, L. Zeng, K. Lee, D. Jung, and Y. Oh, “80 Mbit/s visible
light communications using pre-equalized white LED,” in 2008 34th European Conference on
Optical Communication, Sept 2008, pp. 1–2.
[83] J. Vucic, C. Kottke, S. Nerreter, K. Langer, and J. W. Walewski, “513 Mbit/s visible light
communications link based on DMT-modulation of a white LED,” Journal of Lightwave
Technology, vol. 28, no. 24, pp. 3512–3518, Dec 2010.
[84] B. S. Krongold, K. Ramchandran, and D. L. Jones, “Computationally efficient optimal
power allocation algorithm for multicarrier communication systems,” in ICC ’98. 1998
IEEE International Conference on Communications. Conference Record. Affiliated with
SUPERCOMM’98 (Cat. No.98CH36220), vol. 2, June 1998, pp. 1018–1022 vol.2.
[85] L. Zeng, D. O’Brien, H. Le-Minh, K. Lee, D. Jung, and Y. Oh, “Improvement of date rate by using
equalization in an indoor visible light communication system,” in 2008 4th IEEE International
Conference on Circuits and Systems for Communications, May 2008, pp. 678–682.
[86] T. Komine and M. Nakagawa, “Fundamental analysis for visible-light communication system
using LED lights,” IEEE Transactions on Consumer Electronics, vol. 50, no. 1, pp. 100–107, Feb
2004.
[87] H. Elgala, R. Mesleh, and H. Haas, “A study of led nonlinearity effects on optical wireless
transmission using ofdm,” in 2009 IFIP International Conference on Wireless and Optical
Communications Networks, April 2009, pp. 1–5.
[88] J. Armstrong and A. J. Lowery, “Power efficient optical OFDM,” Electronics Letters, vol. 42,
no. 6, pp. 370–372, March 2006.
[89] J. Armstrong, “OFDM for optical communications,” Journal of Lightwave Technology, vol. 27,
no. 3, pp. 189–204, Feb 2009.
160
References
[90] ——, “Peak-to-average power reduction for OFDM by repeated clipping and frequency domain
filtering,” Electronics Letters, vol. 38, no. 5, pp. 246–247, Feb 2002.
[91] C. W. Chow, C. H. Yeh, Y. F. Liu, and P. Y. Huang, “Mitigation of optical background noise
in light-emitting diode (led) optical wireless communication systems,” IEEE Photonics Journal,
vol. 5, no. 1, pp. 7 900 307–7 900 307, Feb 2013.
[92] C. Chang, Y. Su, U. Kurokawa, and B. I. Choi, “Interference rejection using filter-based sensor
array in VLC systems,” IEEE Sensors Journal, vol. 12, no. 5, pp. 1025–1032, May 2012.
[93] K. C. Kao and G. A. Hockham, “Dielectric-fibre surface waveguides for optical frequencies,”
Proc. Inst. Electric. Eng.3. Radio Commun. Eng., vol. 113, pp. 1151–1158, 1966.
[94] G. Keiser, Optical fiber communications; 2nd ed., ser. McGraw-Hill electrical and electronic
engineering series. New York, NY: McGraw-Hill, 1991.
[95] E. F. Schubert, N. E. J. Hunt, R. J. Malik, M. Micovic, and D. L. Miller, “Temperature
and modulation characteristics of resonant-cavity light-emitting diodes,” Journal of Lightwave
Technology, vol. 14, no. 7, pp. 1721–1729, July 1996.
[96] M. Atef, R. Swoboda, and H. Zimmermann, “Real-time 1.25-Gb/s transmission over 50-m
SI-POF using a green laser diode,” IEEE Photonics Technology Letters, vol. 24, no. 15, pp.
1331–1333, Aug 2012.
[97] C. Gimeno, C. Sanchez-Azqueta, E. Guerrero, J. Aguirre, C. Aldea, and S. Celma, “Single-chip
receiver for 1.25 Gb/s over 50-m SI-POF,” IEEE Photonics Technology Letters, vol. 27, no. 11,
pp. 1220–1223, June 2015.
[98] X. Li, N. Bamiedakis, J. Wei, J. J. D. McKendry, E. Xie, R. Ferreira, E. Gu, M. D. Dawson,
R. V. Penty, and I. H. White, “µLED-based single-wavelength bi-directional POF link with 10
Gb/s aggregate data rate,” Journal of Lightwave Technology, vol. 33, no. 17, pp. 3571–3576, Sept
2015.
[99] J. B. D. Soole and H. Schumacher, “InGaAs metal-semiconductor-metal photodetectors for long
wavelength optical communications,” IEEE Journal of Quantum Electronics, vol. 27, no. 3, pp.
737–752, March 1991.
[100] S. Loquai, F. Winkler, S. Wabra, E. Hartl, B. Schmauss, and O. Ziemann, “High-speed,
large-area POF receivers for fiber characterization and data transmission ≥10-Gb/s based on
MSM-photodetectors,” Journal of Lightwave Technology, vol. 31, no. 7, pp. 1132–1137, April
2013.
[101] D. L. Rogers, “Integrated optical receivers using MSM detectors,” Journal of Lightwave
Technology, vol. 9, no. 12, pp. 1635–1638, Dec 1991.
[102] Spectrally efficient polymer optical fiber transmission, vol. 7960, 2011.
161
References
[103] S. Werzinger and C.-A. Bunge, “Statistical analysis of intrinsic and extrinsic coupling losses for
step-index polymer optical fibers,” Opt. Express, vol. 23, no. 17, pp. 22 318–22 329, Aug 2015.
[104] C. Zerna, J. Sundermeyer, A. Fiederer, N. Verwaal, B. Offenbeck, and N. Weber, “Integrated
PAM2 decision feedback equalizer for gigabit ethernet over standard SI-POF using red LED,” in
36th European Conference and Exhibition on Optical Communication, Sept 2010.
[105] H. Li, X. Chen, B. Huang, D. Tang, and H. Chen, “High bandwidth visible light communications
based on a post-equalization circuit,” IEEE Photonics Technology Letters, vol. 26, no. 2, pp.
119–122, Jan 2014.
[106] S. He, G. Ren, Z. Zhong, and Y. Zhao, “M-ary variable period modulation for indoor visible
light communication system,” IEEE Communications Letters, vol. 17, no. 7, pp. 1325–1328, July
2013.
[107] S. H. Lee, K. Ahn, and J. K. Kwon, “Multilevel transmission in dimmable visible light
communication systems,” Journal of Lightwave Technology, vol. 31, no. 20, Oct 2013.
[108] X. Li, N. Bamiedakis, X. Guo, J. J. D. McKendry, E. Xie, R. Ferreira, E. Gu, M. D. Dawson,
R. V. Penty, and I. H. White, “Wireless visible light communications employing feed-forward
pre-equalization and PAM-4 modulation,” Journal of Lightwave Technology, vol. 34, no. 8, pp.
2049–2055, April 2016.
[109] R. Kruglov, S. Loquai, C. Bunge, M. Schueppert, J. Vinogradov, and O. Ziemann, “Comparison
of PAM and CAP modulation schemes for data transmission over SI-POF,” IEEE Photonics
Technology Letters, vol. 25, no. 23, pp. 2293–2296, Dec 2013.
[110] X. Li, J. L. Wei, N. Bamiedakis, R. V. Penty, and I. H. White, “Avalanche photodiode enhanced
PAM-32 5 Gb/s LED-POF link,” in 2014 The European Conference on Optical Communication
(ECOC), Sept 2014, pp. 1–3.
[111] R. Mesleh, H. Elgala, and H. Haas, “On the performance of different OFDM based
optical wireless communication systems,” IEEE/OSA Journal of Optical Communications and
Networking, vol. 3, no. 8, pp. 620–628, August 2011.
[112] S. Loquai, R. Kruglov, O. Ziemann, J. Vinogradov, and C. Bunge, “10 Gbit/s over 25 m plastic
optical fiber as a way for extremely low-cost optical interconnection,” in 2010 Conference
on Optical Fiber Communication (OFC/NFOEC), collocated National Fiber Optic Engineers
Conference, March 2010, pp. 1–3.
[113] G.-H. Im, D. Harman, G. Huang, A. Mandzik, M.-H. Nguyen, and J.-J. Werner, “51.84 Mb/s
16-CAP ATM LAN standard,” IEEE Journal on Selected Areas in Communications, vol. 13,
no. 4, pp. 620–632, 1995.
162
References
[114] K. Gentile, “The care and feeding of digital pulse-shaping filters,” RF DESIGN, vol. 25, no. 4,
pp. 50–58, Oct 2002.
[115] S. Long, M. A. Khalighi, M. Wolf, Z. Ghassemlooy, and S. Bourennane, “Performance of
carrier-less amplitude and phase modulation with frequency domain equalization for indoor
visible light communications,” in 2015 4th International Workshop on Optical Wireless
Communications (IWOW), Sept 2015, pp. 16–20.
[116] P. A. Haigh et al., “A multi-CAP visible-light communications system with 4.85-b/s/Hz spectral
efficiency,” IEEE Journal on Selected Areas in Communications, vol. 33, no. 9, pp. 1771–1779,
Sept 2015.
[117] P. A. Haigh, P. Chvojka, S. Zvanovec, Z. Ghassemlooy, S. T. Le, T. Kanesan, E. Giacoumidis,
N. J. Doran, I. Papakonstantinou, and I. Darwazeh, “Experimental verification of visible light
communications based on multi-band CAP modulation,” in 2015 Optical Fiber Communications
Conference and Exhibition (OFC), March 2015, pp. 1–3.
[118] P. A. Haigh et al., “Multi-band carrier-less amplitude and phase modulation for highly
bandlimited visible light communications-invited paper,” in 2015 International Conference on
Wireless Communications Signal Processing (WCSP), Oct 2015, pp. 1–5.
[119] F. Sjoberg, “A VDSL tutorial,” Lulea tekniska universitet, Tech. Rep., 2000, godkand; 2000;
20070912 (margjo).
[120] M. A. Khalighi, S. Long, S. Bourennane, and Z. Ghassemlooy, “PAM- and CAP-based
transmission schemes for visible-light communications,” IEEE Access, vol. 5, pp. 27 002–27 013,
2017.
[121] A. Shalash and K. K. Parhi, “Comparison of discrete multitone and carrierless AM/PM
techniques for line equalization,” in Circuits and Systems, 1996. ISCAS’96., Connecting the
World., 1996 IEEE International Symposium on, vol. 2. IEEE, 1996, pp. 560–563.
[122] G. Stepniak, L. Maksymiuk, and J. Siuzdak, “Experimental comparison of PAM, CAP, and DMT
modulations in phosphorescent white LED transmission link,” IEEE Photonics Journal, vol. 7,
no. 3, pp. 1–8, June 2015.
[123] F. M. Wu et al., “Performance comparison of OFDM signal and CAP signal over high capacity
RGB-LED-based WDM visible light communication,” IEEE Photonics Journal, vol. 5, no. 4, pp.
7 901 507–7 901 507, Aug 2013.
[124] J. Wei, L. Geng, D. Cunningham, R. Penty, and I. White, “Gigabit NRZ, CAP and optical OFDM
systems over POF links using LEDs,” Optics express, vol. 20, no. 20, pp. 22 284–22 290, 2012.
163
References
[125] J. L. Wei, C. Sanchez, and E. Giacoumidis, “Fair comparison of complexity between a multi-band
CAP and DMT for data center interconnects,” Opt. Lett., vol. 42, no. 19, pp. 3860–3863, Oct
2017.
[126] Y. Wang, X. Huang, L. Tao, J. Shi, and N. Chi, “4.5-Gb/s RGB-LED based WDM visible light
communication system employing CAP modulation and rls based adaptive equalization,” Optics
express, vol. 23, no. 10, pp. 13 626–13 633, 2015.
[127] Y. Wang, L. Tao, X. Huang, J. Shi, and N. Chi, “Enhanced performance of a high-speed WDM
CAP64 VLC system employing Volterra series-based nonlinear equalizer,” IEEE Photonics
Journal, vol. 7, no. 3, pp. 1–7, June 2015.
[128] Y. Wang, L. Tao, Y. Wang, and N. Chi, “High speed WDM VLC system based on multi-band
CAP64 with weighted pre-equalization and modified CMMA based post-equalization,” IEEE
Communications Letters, vol. 18, no. 10, pp. 1719–1722, Oct 2014.
[129] F.-M. Wu, C.-T. Lin, C.-C. Wei, C.-W. Chen, Z.-Y. Chen, and H.-T. Huang, “3.22-Gb/s WDM
visible light communication of a single RGB LED employing carrier-less amplitude and phase
modulation,” in 2013 Optical Fiber Communication Conference and Exposition and the National
Fiber Optic Engineers Conference (OFC/NFOEC), March 2013, pp. 1–3.
[130] G. Stepniak and J. Siuzdak, “Transmission beyond 2 Gbit/s in a 100 m SI-POF with multilevel
CAP modulation and digital equalization,” in 2013 Optical Fiber Communication Conference and
Exposition and the National Fiber Optic Engineers Conference (OFC/NFOEC), March 2013, pp.
1–3.
[131] F.-M. Wu, C.-T. Lin, C.-C. Wei, C.-W. Chen, H.-T. Huang, and C.-H. Ho, “1.1-Gb/s
white-LED-based visible light communication employing carrier-less amplitude and phase
modulation,” IEEE photonics technology letters, vol. 24, no. 19, pp. 1730–1732, 2012.
[132] A. N. Pinto, J. R. F. da Rocha, , and G. P. Agrawal, “Optical versus electrical dispersion
compensation: role of timing jitter,” Journal of Lightwave Technology, vol. 24, no. 1, pp.
387–395, Jan 2006.
[133] J. O’Reilly, J. da Rocha, and K. Schumacher, “Optical fiber direct detection receivers optimally
tolerant to jitter,” IEEE Transactions on Communications, vol. 34, no. 11, pp. 1141–1147,
November 1986.
[134] K. Schumacher and J. J. O’Reilly, “Power penalty due to jitter on optical communication
systems,” Electronics Letters, vol. 23, no. 14, pp. 718–719, July 1987.
[135] A. V. T. Cartaxo and A. A. de Albuquerque, “Jitter in the square synchroniser on direct detection
optical communications. part 1: theoretical analysis,” IEE Proceedings - Optoelectronics, vol.
141, no. 4, pp. 209–219, Aug 1994.
164
References
[136] K. O. Akande and W. O. Popoola, “Synchronization of carrierless amplitude and phase
modulation in visible light communication,” in 2017 IEEE International Conference on
Communications Workshops (ICC Workshops), May 2017, pp. 156–161.
[137] J. Gao and Y. H. Leung, “A new adaptive equalizer for carrierless amplitude and phase (CAP)
receivers,” in Proceedings of the 1999 IEEE International Symposium on Circuits and Systems,
1999. ISCAS ’99., vol. 3, Jul 1999, pp. 90–93 vol.3.
[138] P. A. Haigh, P. Chvojka, S. Zvanovec, Z. Ghassemlooy, and I. Darwazeh, “Analysis of Nyquist
pulse shapes for carrierless amplitude and phase modulation in visible light communications,”
Journal of Lightwave Technology, vol. 36, no. 20, pp. 5023–5029, Oct 2018.
[139] P. A. Haigh and I. Darwazeh, “Demonstration of reduced complexity multi-band CAP modulation
using Xia-pulses in visible light communications,” in 2018 Optical Fiber Communications
Conference and Exposition (OFC), March 2018, pp. 1–3.
[140] I. L. Thng, A. Cantoni, and Y. H. Leung, “Low timing sensitivity receiver structures for CAP,”
IEEE Transactions on Communications, vol. 48, no. 3, pp. 396–400, 2000.
[141] S. Daumont, B. Rihawi, and Y. Lout, “Root-raised cosine filter influences on PAPR distribution of
single carrier signals,” in 3rd International Symposium on Communications, Control and Signal
Processing, 2008. ISCCSP 2008., March 2008, pp. 841–845.
[142] R. H. Barker, “Group synchronizing of binary digital sequences,” In Communication Theory, pp.
273–287, London, Butterworth, 1953.
[143] F. Penna, R. Garello, and M. A. Spirito, “Probability of missed detection in eigenvalue ratio
spectrum sensing,” in 2009 IEEE International Conference on Wireless and Mobile Computing,
Networking and Communications, Oct 2009, pp. 117–122.
[144] K. Werfli et al., “Multi-band carrier-less amplitude and phase modulation with decision feedback
equalization for bandlimited VLC systems,” in 4th International Workshop on Optical Wireless
Communications (IWOW), 2015, Sept 2015, pp. 6–10.
[145] Y. Wang and N. Chi, “Investigation of advanced pre- and post-equalization schemes in high-order
CAP modulation based high-speed indoor VLC transmission system,” in Society of Photo-Optical
Instrumentation Engineers (SPIE) Conference Series, vol. 10019, oct 2016, p. 100190C.
[146] J. G. Proakis, “Adaptive equalization for TDMA digital mobile radio,” IEEE Transactions on
Vehicular Technology, vol. 40, no. 2, pp. 333–341, 1991.
[147] K. O. Akande, P. A. Haigh, and W. O. Popoola, “Joint equalization and synchronization for
carrierless amplitude and phase modulation in visible light communication,” in 2017 13th
International Wireless Communications and Mobile Computing Conference (IWCMC), June
2017, pp. 876–881.
165
References
[148] A. H. Sayed, Adaptive Filters. Wiley-IEEE Press, 2008.
[149] J. R. Treichler, I. Fijalkow, and C. Johnson, “Fractionally spaced equalizers,” IEEE Signal
Processing Magazine, vol. 13, no. 3, pp. 65–81, 1996.
[150] N. W. K. Lo, D. D. Falconer, and A. U. H. Sheikh, “Adaptive equalization for co-channel
interference in a multipath fading environment,” IEEE Transactions on Communications, vol. 43,
no. 2/3/4, pp. 1441–1453, Feb 1995.
[151] E. Ip and J. M. Kahn, “Digital equalization of chromatic dispersion and polarization mode
dispersion,” Journal of Lightwave Technology, vol. 25, no. 8, pp. 2033–2043, Aug 2007.
[152] P. A. Haigh, Z. Ghassemlooy, S. Rajbhandari, and E. Leitgeb, “A 100 Mb/s visible light
communications system using a linear adaptive equalizer,” in 19th European Conference on
Networks and Optical Communications - (NOC 2014),, June 2014, pp. 136–139.
[153] W. O. Popoola, E. Poves, and H. Haas, “Error performance of generalised space shift keying for
indoor visible light communications,” IEEE Transactions on Communications, vol. 61, no. 5, pp.
1968–1976, 2013.
[154] M. Safari and M. Uysal, “Do we really need OSTBCs for free-space optical communication
with direct detection?” IEEE Transactions on Wireless Communications, vol. 7, no. 11, pp.
4445–4448, November 2008.
[155] P. W. Wolniansky, G. J. Foschini, G. D. Golden, and R. A. Valenzuela, “V-BLAST: an architecture
for realizing very high data rates over the rich-scattering wireless channel,” in 1998 URSI
International Symposium on Signals, Systems, and Electronics. Conference Proceedings (Cat.
No.98EX167), Sep 1998, pp. 295–300.
[156] J. G. Proakis, Digital Communications, (4th Ed). New York: McGraw-Hill, 2001.
[157] J. Jeganathan, A. Ghrayeb, and L. Szczecinski, “Spatial modulation: optimal detection and
performance analysis,” IEEE Communications Letters, vol. 12, no. 8, pp. 545–547, Aug 2008.
[158] K. Cho and D. Yoon, “On the general BER expression of one-and two-dimensional amplitude
modulations,” IEEE Transactions on Communications, vol. 50, no. 7, pp. 1074–1080, 2002.
[159] C. Wang, E. K. S. Au, R. D. Murch, W. H. Mow, R. S. Cheng, and V. Lau, “On the performance of
the MIMO zero-forcing receiver in the presence of channel estimation error,” IEEE Transactions
on Wireless Communications, vol. 6, no. 3, pp. 805–810, March 2007.
[160] Y. Jiang, M. K. Varanasi, and J. Li, “Performance analysis of ZF and MMSE equalizers for
MIMO systems: An in-depth study of the high SNR regime,” IEEE Transactions on Information
Theory, vol. 57, no. 4, pp. 2008–2026, April 2011.
166
References
[161] J. R. Barry et al., “Simulation of multipath impulse response for indoor wireless optical
channels,” IEEE Journal on Selected Areas in Communications, vol. 11, no. 3, pp. 367–379,
Apr 1993.
[162] T. Fath and H. Haas, “Performance comparison of MIMO techniques for optical wireless
communications in indoor environments,” IEEE Transactions on Communications, vol. 61, no. 2,
pp. 733–742, 2013.
[163] D. Wubben, R. Bohnke, V. Kuhn, and K. D. Kammeyer, “MMSE extension of V-BLAST based on
sorted QR decomposition ,” in 2003 IEEE 58th Vehicular Technology Conference. VTC 2003-Fall
(IEEE Cat. No.03CH37484), vol. 1, Oct 2003, pp. 508–512 Vol.1.
[164] J. Benesty, Y. Huang, and J. Chen, “A fast recursive algorithm for optimum sequential signal
detection in a BLAST system,” IEEE Transactions on Signal Processing, vol. 51, no. 7, pp.
1722–1730, July 2003.
[165] M. D. Renzo, H. Haas, A. Ghrayeb, S. Sugiura, and L. Hanzo, “Spatial modulation for
generalized MIMO: Challenges, opportunities, and implementation,” Proceedings of the IEEE,
vol. 102, no. 1, pp. 56–103, Jan 2014.
[166] X. Zhang, S. Dimitrov, S. Sinanovic, and H. Haas, “Optimal power allocation in spatial
modulation OFDM for visible light communications,” in 2012 IEEE 75th Vehicular Technology
Conference (VTC Spring), May 2012, pp. 1–5.
[167] W. O. Popoola and H. Haas, “Demonstration of the merit and limitation of generalised space
shift keying for indoor visible light communications,” Journal of Lightwave Technology, vol. 32,
no. 10, pp. 1960–1965, May 2014.
[168] H. G. Olanrewaju, J. Thompson, and W. O. Popoola, “On spatial pulse position modulation for
optical wireless communications,” in 2016 IEEE Photonics Society Summer Topical Meeting
Series (SUM), July 2016, pp. 44–45.
[169] W. O. Popoola, “Merits and limitations of spatial modulation for optical wireless
communications,” in 2013 2nd International Workshop on Optical Wireless Communications
(IWOW), Oct 2013, pp. 152–156.
[170] E. Basar, U. Aygolu, E. Panayırcı, and H. V. Poor, “Orthogonal frequency division multiplexing
with index modulation,” in 2012 IEEE Global Communications Conference (GLOBECOM), Dec
2012, pp. 4741–4746.
[171] E. Basar, “Orbital angular momentum with index modulation,” IEEE Transactions on Wireless
Communications, vol. 17, no. 3, pp. 2029–2037, March 2018.
[172] T. Mao, Z. Wang, Q. Wang, S. Chen, and L. Hanzo, “Dual-mode index modulation aided OFDM,”
IEEE Access, vol. 5, pp. 50–60, 2017.
167
References
[173] P. A. Haigh, E. Hugues-Salas, and J. Wei, “On the performance of increasing subcarrier order
in multi-band carrier-less amplitude and phase modulation for short haul optical links,” in Asia
Communications and Photonics Conference. Optical Society of America, 2017, p. S4B.6.
[174] O. O. Semiconductors, OSLON SX Datasheet, Nov. 2012, ver 1.1.
[175] Hamamatsu, Resonant cavity LED for POF data communication, Feb. 2016.
[176] Thorlabs, Si Amplified Fixed Gain Detector, Sept. 2017, rev. J.
[177] Q. Wang, T. Mao, and Z. Wang, “Index modulation-aided OFDM for visible light
communications,” in Visible Light Communications, J.-Y. Wang, Ed. Rijeka: InTech, 2017,
ch. 4.
[178] G. Foschini, R. Gitlin, and S. Weinstein, “Optimization of two-dimensional signal constellations
in the presence of Gaussian noise,” IEEE Transactions on Communications, vol. 22, no. 1, pp.
28–38, January 1974.
[179] K. O. Akande and W. O. Popoola, “Subband index carrierless amplitude and phase modulation
for optical communications,” Journal of Lightwave Technology, vol. 36, no. 18, pp. 4190–4197,
Sept 2018.
[180] S. Dimitrov, S. Sinanovic, and H. Haas, “Clipping noise in OFDM-based optical wireless
communication systems,” IEEE Transactions on Communications, vol. 60, no. 4, pp. 1072–1081,
April 2012.
[181] Y. Mao, X. Jin, W. Liu, C. Gong, and Z. Xu, “Demonstration of real-time CAP transceivers
with hybrid digital equalization for visible light communication,” in Asia Communications and
Photonics Conference. Optical Society of America, 2017, p. M1G.4.
[182] J. Shi, X. Huang, Y. Wang, and N. Chi, “Real-time bi-directional visible light communication
system utilizing a phosphor-based LED and RGB LED,” in 2014 Sixth International Conference
on Wireless Communications and Signal Processing (WCSP), Oct 2014, pp. 1–5.
[183] C.-H. Yeh, Y.-L. Liu, and C.-W. Chow, “Real-time white-light phosphor-LED visible light
communication (VLC) with compact size,” Optics express, vol. 21, no. 22, pp. 26 192–26 197,
2013.
168


![Multiband Carrierless Amplitude Phase Modulation for High ... · quadrature amplitude modulation (QAM) [5], and 100 Gb/s, 25 Gbaud 4 level pulse amplitude modulation (PAM) [6]. Discrete](https://img.pdfslide.us/doc/110x75/5d63576088c9936c668b65fb/multiband-carrierless-amplitude-phase-modulation-for-high-quadrature-amplitude.jpg)