Embed Size (px)
Citation preview
Enhanced Biological Phosphorus Removal and Recovery
at the MWRD’s Stickney WRP
Start-Up, Transition and ProgressJanuary 23, 2015
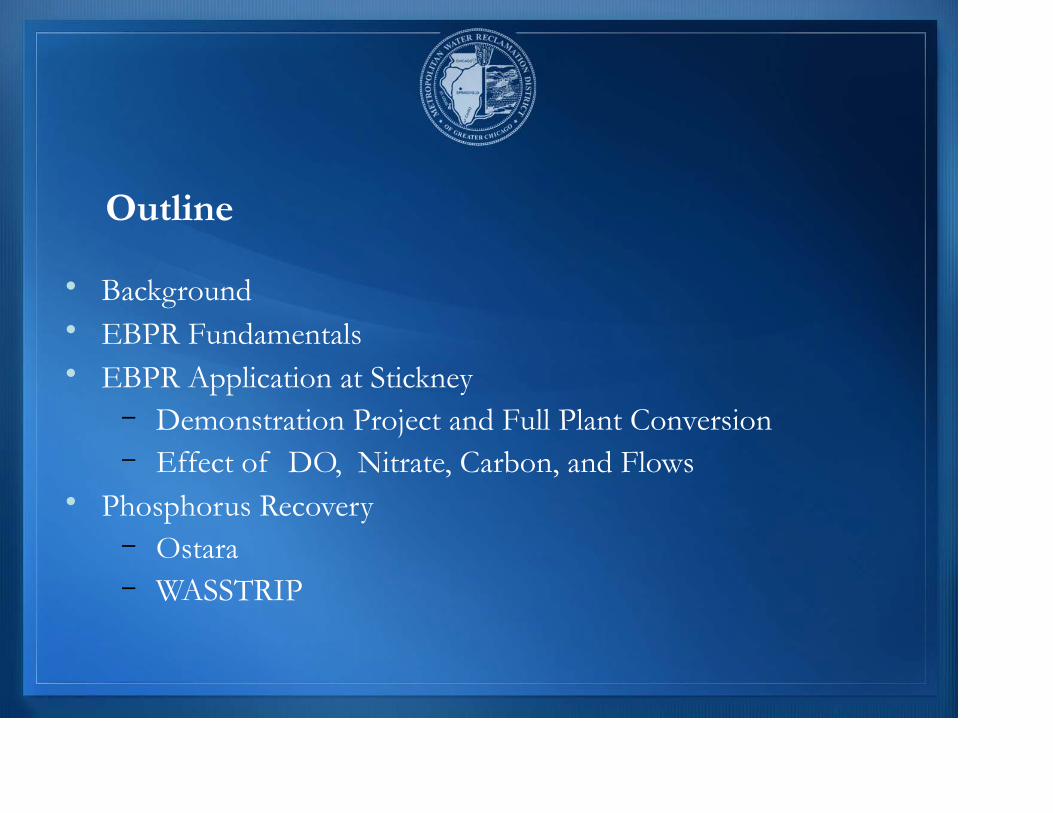
Outline
• Background• EBPR Fundamentals• EBPR Application at Stickney
– Demonstration Project and Full Plant Conversion– Effect of DO, Nitrate, Carbon, and Flows
• Phosphorus Recovery– Ostara– WASSTRIP

BACKGROUND
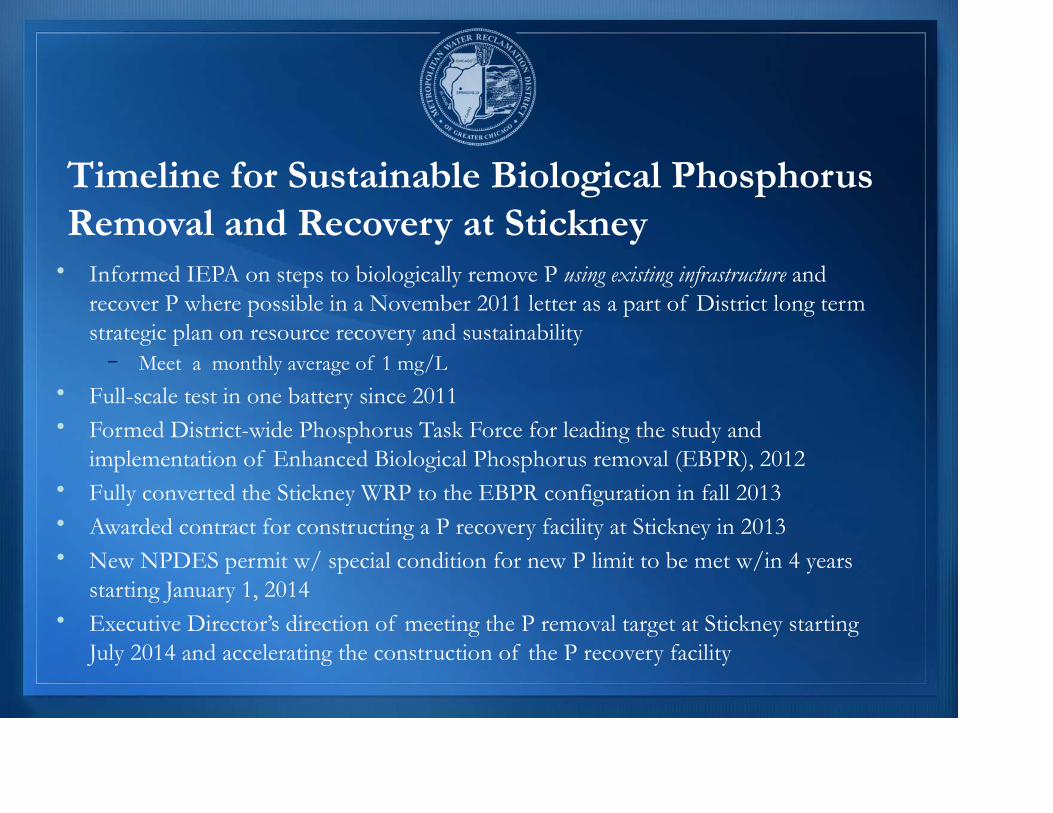
Timeline for Sustainable Biological Phosphorus Removal and Recovery at Stickney• Informed IEPA on steps to biologically remove P using existing infrastructure and
recover P where possible in a November 2011 letter as a part of District long term strategic plan on resource recovery and sustainability
– Meet a monthly average of 1 mg/L• Full-scale test in one battery since 2011• Formed District-wide Phosphorus Task Force for leading the study and
implementation of Enhanced Biological Phosphorus removal (EBPR), 2012• Fully converted the Stickney WRP to the EBPR configuration in fall 2013• Awarded contract for constructing a P recovery facility at Stickney in 2013• New NPDES permit w/ special condition for new P limit to be met w/in 4 years
starting January 1, 2014• Executive Director’s direction of meeting the P removal target at Stickney starting
July 2014 and accelerating the construction of the P recovery facility

EBPR FUNDAMENTALS
Fundamentals of Enhanced Biological Phosphorus Removal (EBPR) and recovery
• Simple philosophy– Some microorganisms can perform luxury uptake of P into
their cells if the right environment is provided (EBPR process)
– The P accumulated in the cells can be removed from the main liquid stream via solids separation.
– The P is released in the proper solids processing for harvesting
• Sustainability- Less energy is required for EBPR compared to conventional secondary
treatment process (lower air requirements)
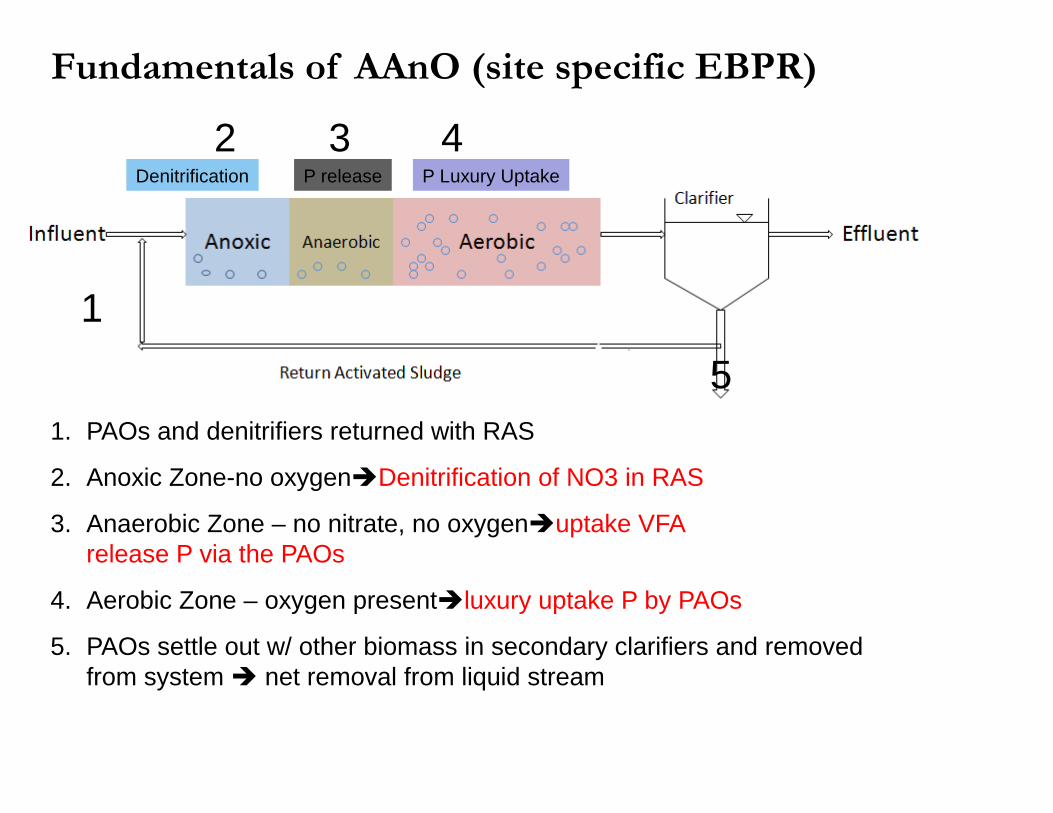
2 3 4
1. PAOs and denitrifiers returned with RAS
2. Anoxic Zone-no oxygenDenitrification of NO3 in RAS
3. Anaerobic Zone – no nitrate, no oxygenuptake VFA, form PHB and release P via the PAOs
4. Aerobic Zone – oxygen presentluxury uptake P by PAOs
5. PAOs settle out w/ other biomass in secondary clarifiers and removed from system net removal from liquid stream
Fundamentals of AAnO (site specific EBPR)
Denitrification P release P Luxury Uptake
1
5
O P OO
O
O P OO
OO P O
O
O
VFA
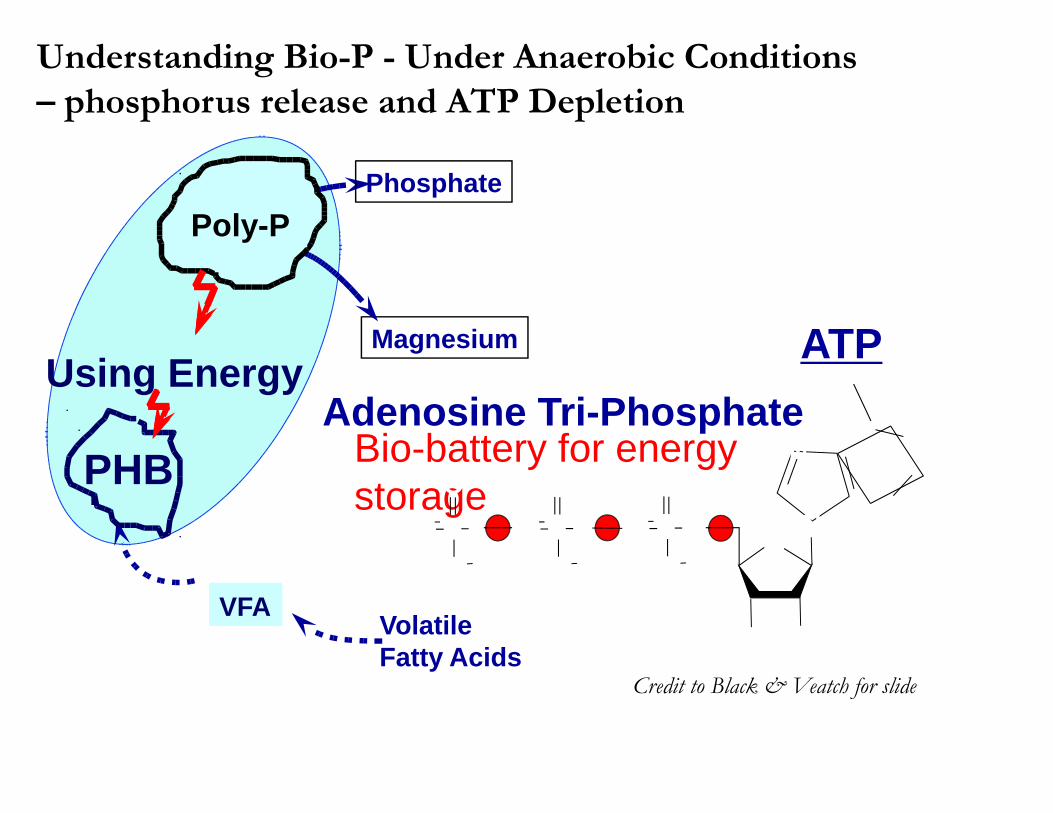
Understanding Bio-P - Under Anaerobic Conditions – phosphorus release and ATP Depletion
Bio-battery for energy storage
N
N
H2N
N
N
O
OH OH
O P OO
O
O P OO
OO P O
O
O
VolatileFatty Acids
Phosphate
Using Energy
VFAVFAVFA
PHBPHBPHBPHB
Poly-P
Magnesium ATP
MgMgMgPoly-PPoly-PPoly-P
Adenosine Tri-Phosphate
8Credit to Black & Veatch for slide
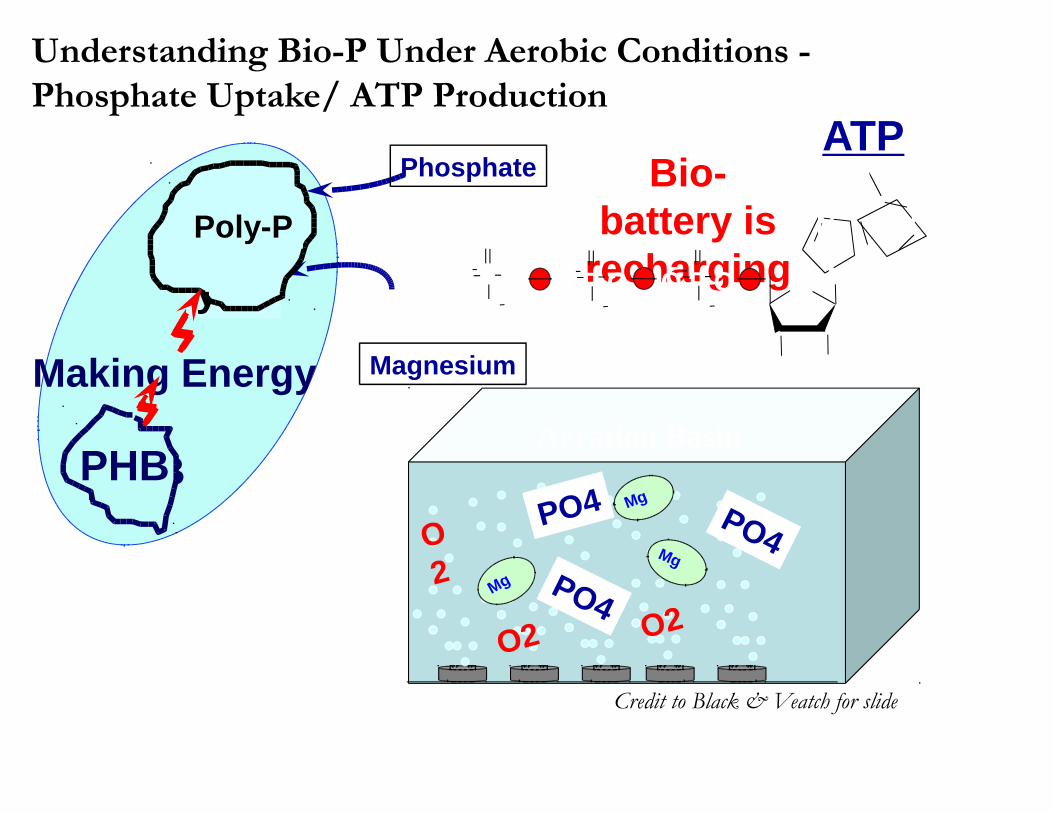
Understanding Bio-P Under Aerobic Conditions - Phosphate Uptake/ ATP Production
Aeration Basin
Phosphate
Making Energy
Poly-P
PO4
PO4 PO4
Magnesium
Mg
Mg
Mg
Poly-PPoly-PPoly-P
Bio-battery is
recharging
OH OH
N
N
H2N
N
N
OO P OO
OO P O
O
OO P O
O
O
ATP
O2O2
O2
PHBPHBPHBPHBPHB
9Credit to Black & Veatch for slide
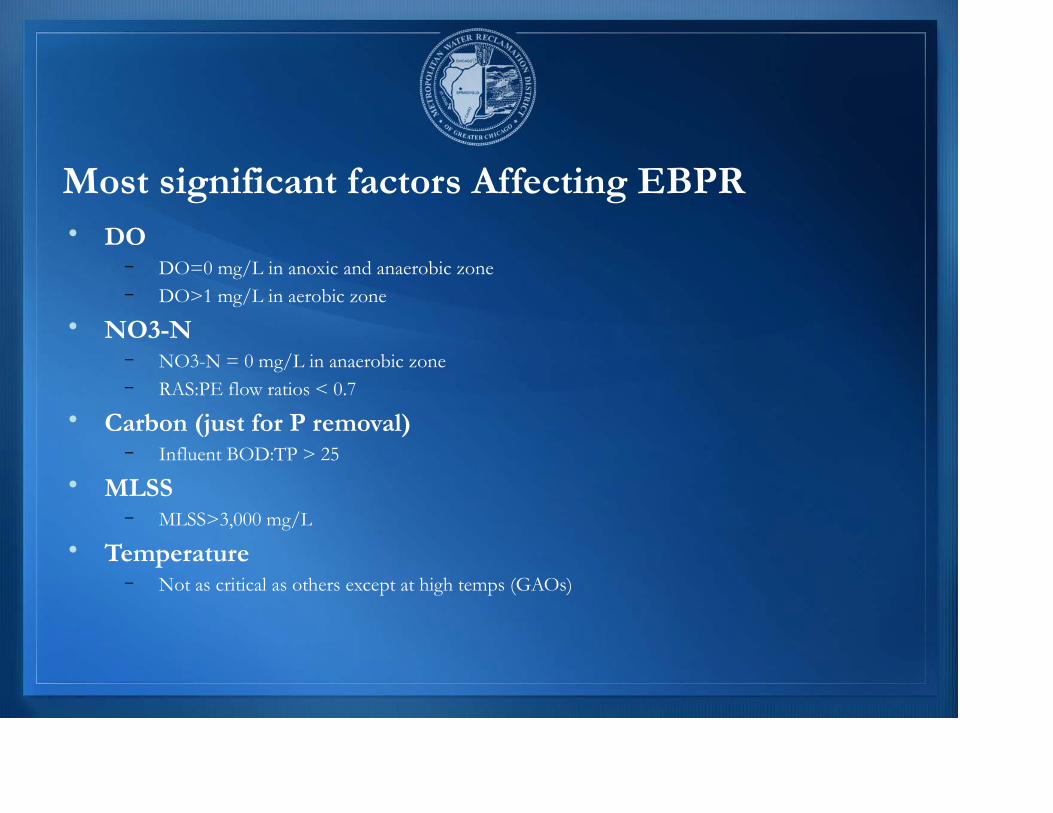
Most significant factors Affecting EBPR• DO
– DO=0 mg/L in anoxic and anaerobic zone– DO>1 mg/L in aerobic zone
• NO3-N– NO3-N = 0 mg/L in anaerobic zone– RAS:PE flow ratios < 0.7
• Carbon (just for P removal)– Influent BOD:TP > 25
• MLSS– MLSS>3,000 mg/L
• Temperature– Not as critical as others except at high temps (GAOs)

EBPR APPLICATION AT STICKNEY
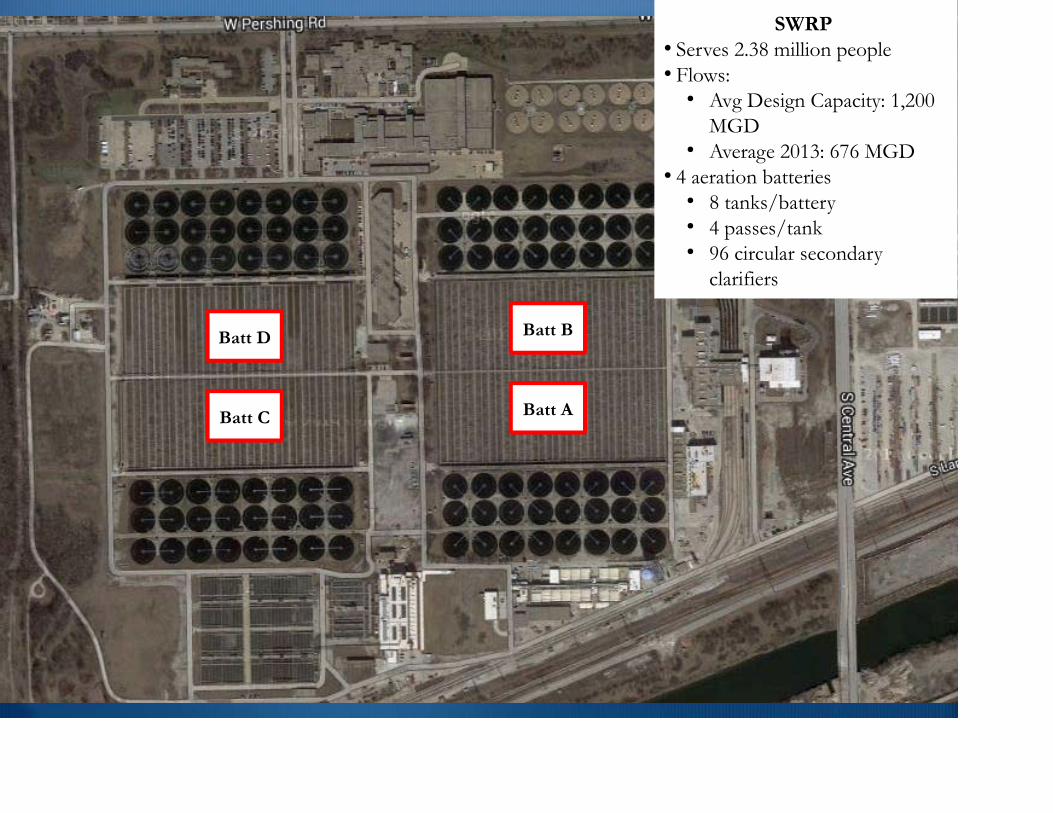
Batt C
Batt D Batt B
Batt A
SWRP • Serves 2.38 million people • Flows:
● Avg Design Capacity: 1,200 MGD
● Average 2013: 676 MGD• 4 aeration batteries
● 8 tanks/battery● 4 passes/tank● 96 circular secondary
clarifiers

Developing EBPR at Stickney WRP
• October 31, 2011 – EBPR trial in Battery D started• May 2012 – December 2013
– Full-scale tests in Battery D to improve EBPR• August – October 2013
– Batteries A, B, & C converted to EBPR configuration• January 2014 – Present
– Monitoring and data analysis to improve and understand EBPR performance
– Continued optimization of operations using existing infrastructure– Began evaluation of options for achieving stable EBPR
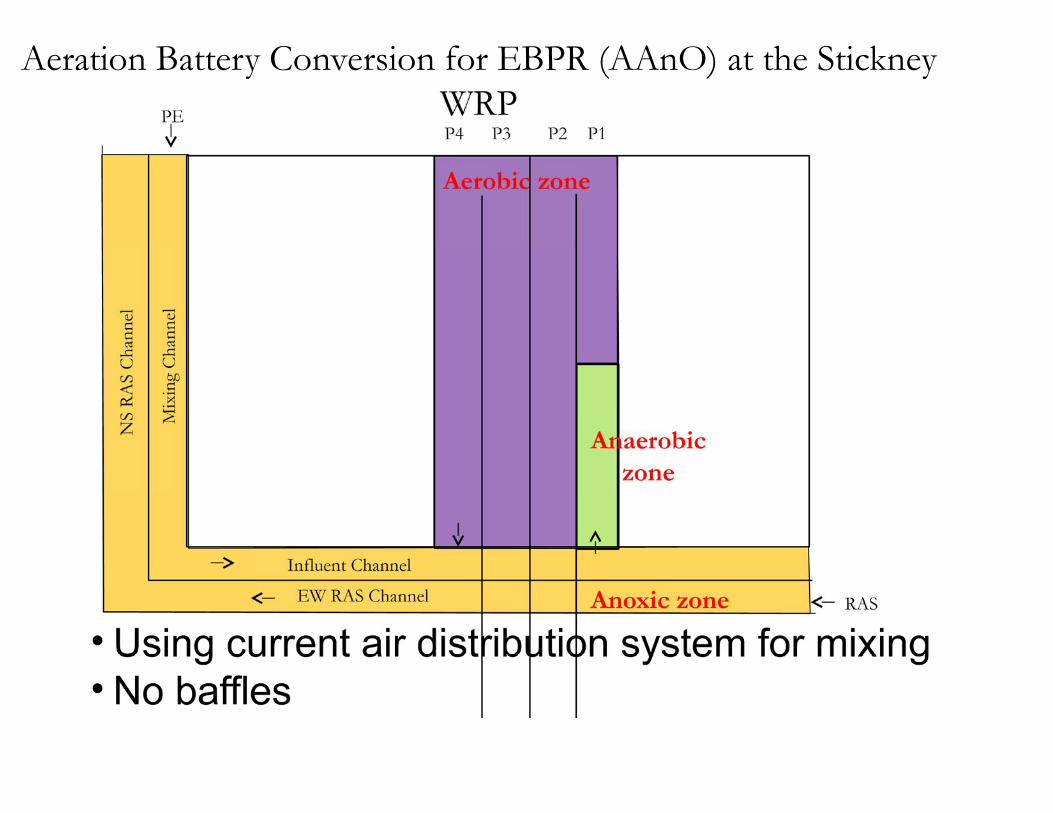
Aeration Battery Conversion for EBPR (AAnO) at the Stickney
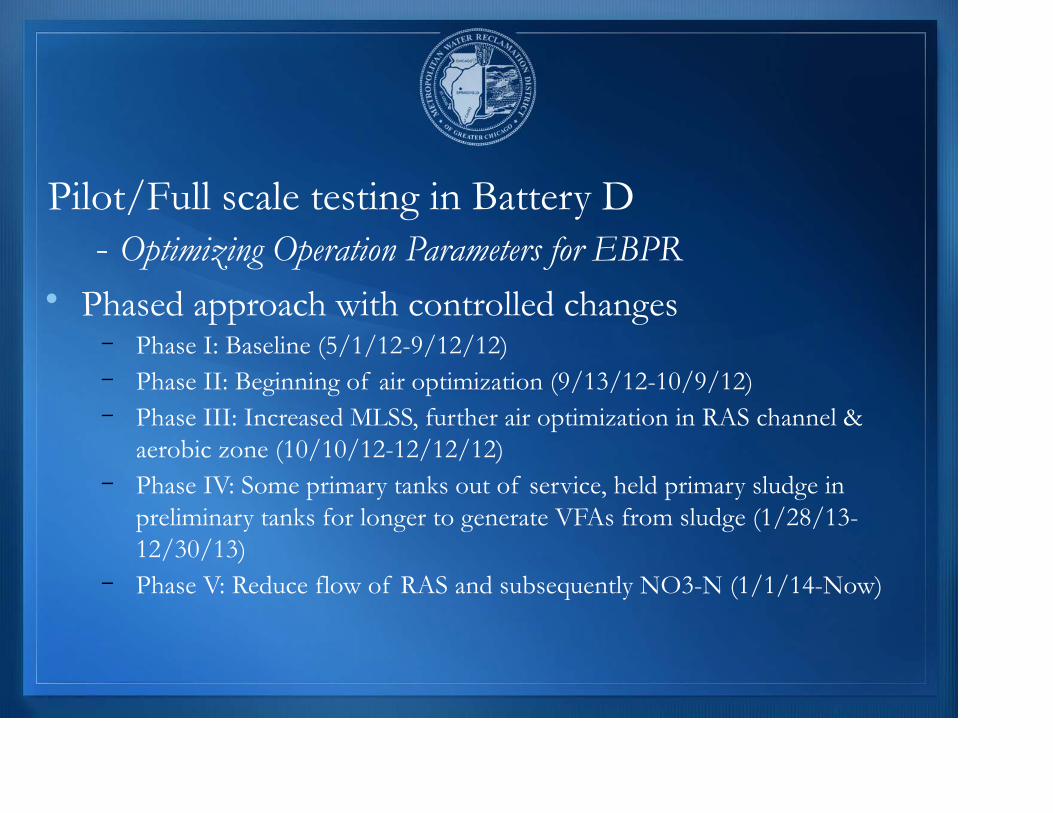
Pilot/Full scale testing in Battery D - Optimizing Operation Parameters for EBPR
• Phased approach with controlled changes– Phase I: Baseline (5/1/12-9/12/12)– Phase II: Beginning of air optimization (9/13/12-10/9/12)– Phase III: Increased MLSS, further air optimization in RAS channel &
aerobic zone (10/10/12-12/12/12)– Phase IV: Some primary tanks out of service, held primary sludge in
preliminary tanks for longer to generate VFAs from sludge (1/28/13-12/30/13)
– Phase V: Reduce flow of RAS and subsequently NO3-N (1/1/14-Now)
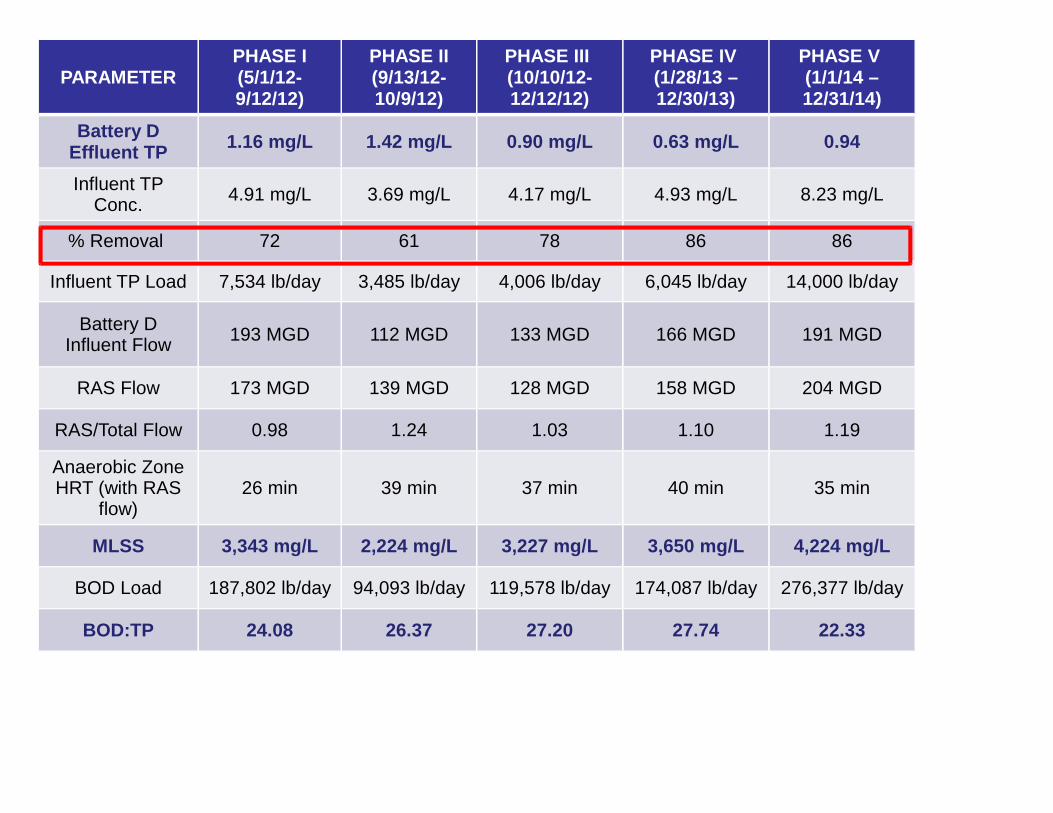
PARAMETERPHASE I(5/1/12-9/12/12)
PHASE II(9/13/12-10/9/12)
PHASE III (10/10/12-12/12/12)
PHASE IV (1/28/13 – 12/30/13)
PHASE V (1/1/14 – 12/31/14)
Battery D Effluent TP 1.16 mg/L 1.42 mg/L 0.90 mg/L 0.63 mg/L 0.94
Influent TP Conc. 4.91 mg/L 3.69 mg/L 4.17 mg/L 4.93 mg/L 8.23 mg/L
% Removal 72 61 78 86 86
Influent TP Load 7,534 lb/day 3,485 lb/day 4,006 lb/day 6,045 lb/day 14,000 lb/day
Battery D Influent Flow 193 MGD 112 MGD 133 MGD 166 MGD 191 MGD
RAS Flow 173 MGD 139 MGD 128 MGD 158 MGD 204 MGD
RAS/Total Flow 0.98 1.24 1.03 1.10 1.19
Anaerobic Zone HRT (with RAS
flow)26 min 39 min 37 min 40 min 35 min
MLSS 3,343 mg/L 2,224 mg/L 3,227 mg/L 3,650 mg/L 4,224 mg/L
BOD Load 187,802 lb/day 94,093 lb/day 119,578 lb/day 174,087 lb/day 276,377 lb/day
BOD:TP 24.08 26.37 27.20 27.74 22.33

FACTORS AFFECTING EBPR PERFORMANCE
DONO3-N
CARBONPLANT FLOWS
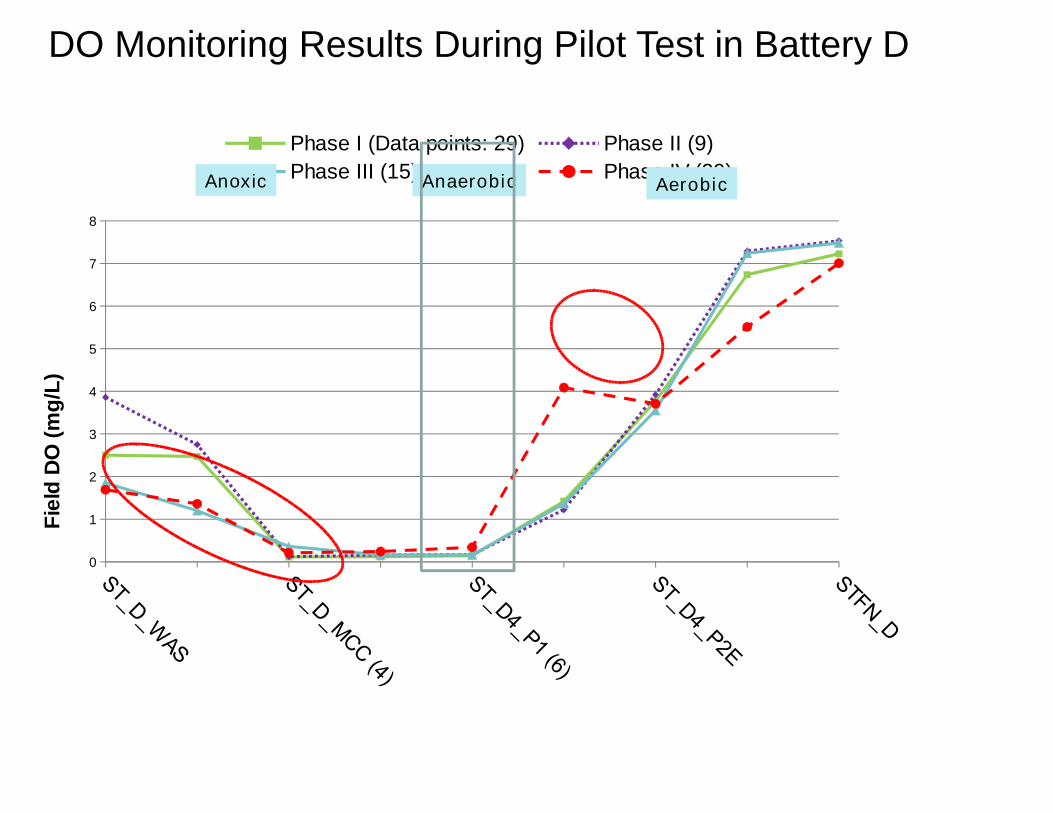
DO Monitoring Results During Pilot Test in Battery D
0
1
2
3
4
5
6
7
8
Phase I (Data points: 29) Phase II (9)Phase III (15) Phase IV (29)
Fiel
d D
O (m
g/L)
AerobicAnaerobicAnoxic
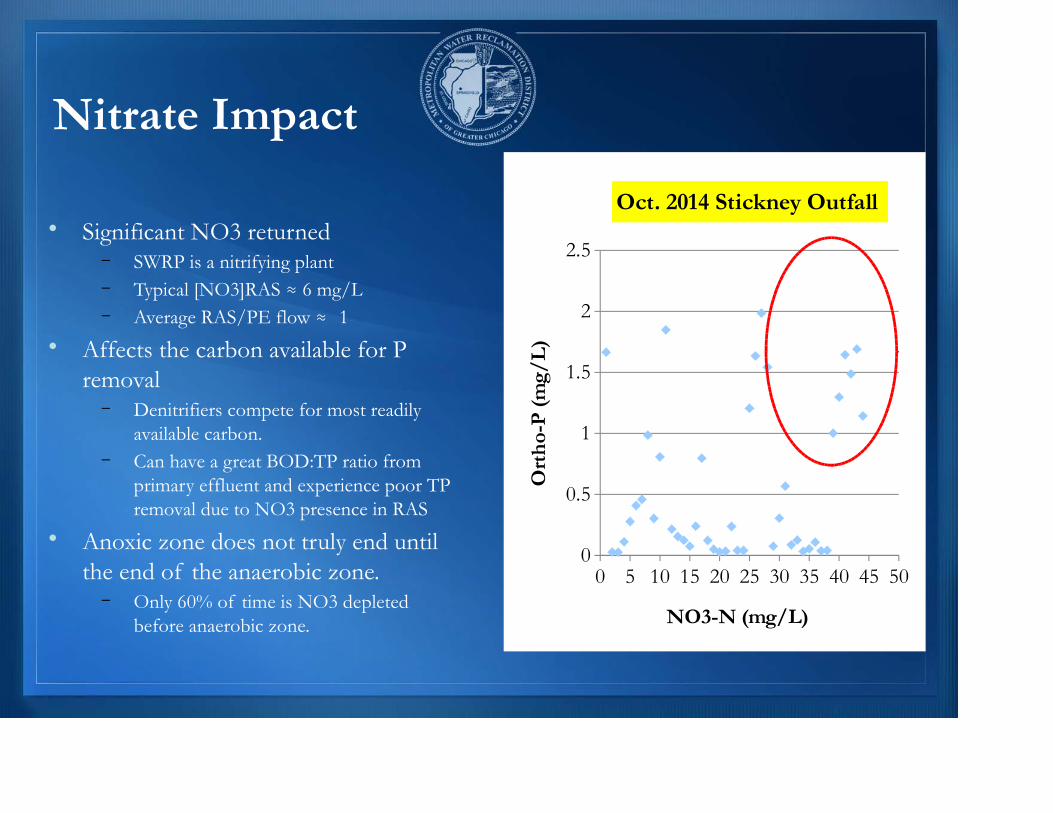
Nitrate Impact
• Significant NO3 returned– SWRP is a nitrifying plant– Typical [NO3]RAS ≈ 6 mg/L– Average RAS/PE flow ≈ 1
• Affects the carbon available for P removal
– Denitrifiers compete for most readily available carbon.
– Can have a great BOD:TP ratio from primary effluent and experience poor TP removal due to NO3 presence in RAS
• Anoxic zone does not truly end until the end of the anaerobic zone.
– Only 60% of time is NO3 depleted before anaerobic zone.
0 5 10 15 20 25 30 35 40 45 500
0.5
1
1.5
2
2.5
Oct. 2014 Stickney Outfall
NO3-N (mg/L)
Ort
ho-
P (
mg/
L)
0 2 4 6 8 10 12 14 16 180
0.5
1
1.5
2
2.5
3
3.5
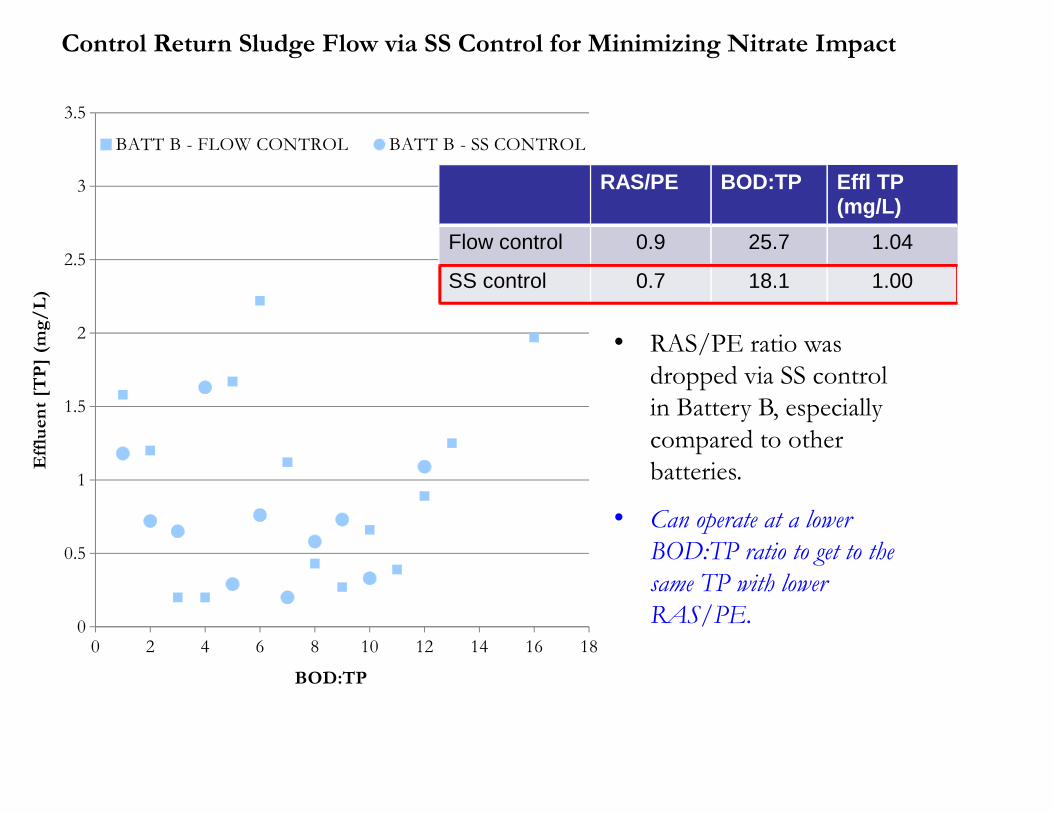
BATT B - FLOW CONTROL BATT B - SS CONTROL
BOD:TP
Eff
luen
t [T
P]
(mg/
L)
Control Return Sludge Flow via SS Control for Minimizing Nitrate Impact
RAS/PE BOD:TP Effl TP (mg/L)
Flow control 0.9 25.7 1.04
SS control 0.7 18.1 1.00
• RAS/PE ratio was dropped via SS control in Battery B, especially compared to other batteries.
• Can operate at a lower BOD:TP ratio to get to the same TP with lower RAS/PE.

Carbon needs for EBPR
• All carbon ratios indicate that SWRP is near the lower end of recommended ratios
● BOD:TP ~ 24.5 (2014) vs. recommended > 25● rbCOD:TP ~ 11.5 (2014) vs. recommended 11-16
– On daily basis, the process may be carbon limited about 50% of time.
• Prolonged periods of low BOD:TP have longer lasting impact
● PAOs could be essentially starved over a period of insufficient carbon.● P release rates recover faster than uptake rates● Release rates recover within a day● Can take 3 days to recover orthoP uptake rates
– May need BOD:TP to increase for a prolonged period to see recovery of system.
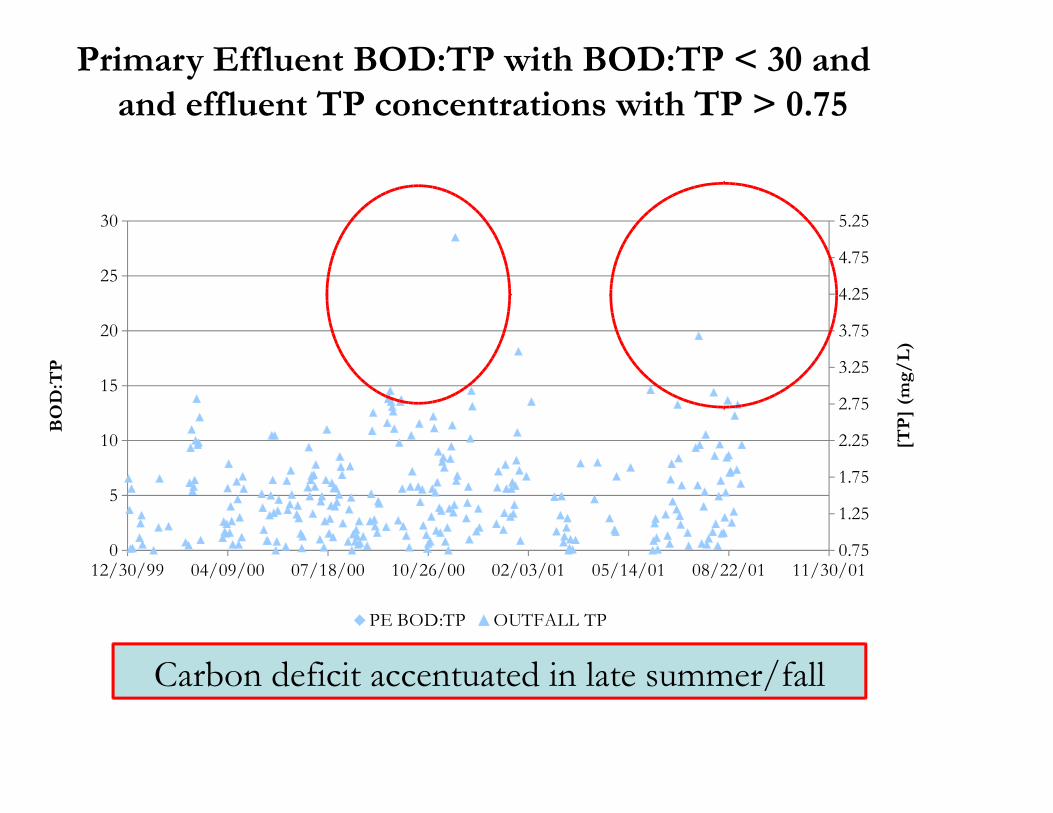
Primary Effluent BOD:TP with BOD:TP < 30 and and effluent TP concentrations with TP > 0.75
12/30/99 04/09/00 07/18/00 10/26/00 02/03/01 05/14/01 08/22/01 11/30/010
5
10
15
20
25
30
0.75
1.25
1.75
2.25
2.75
3.25
3.75
4.25
4.75
5.25
PE BOD:TP OUTFALL TP
BO
D:T
P
[TP
] (m
g/L
)
Carbon deficit accentuated in late summer/fall
0
0.2
0.4
0.6
0.8
1
1.2
1.4
1.6
1.8
0
50
100
150
200
250
300
STFN_D TP HRT BOD
HR
T (
hrs
) &
[T
P]
(mg/
L)
[BO
D]
(mg/
L)
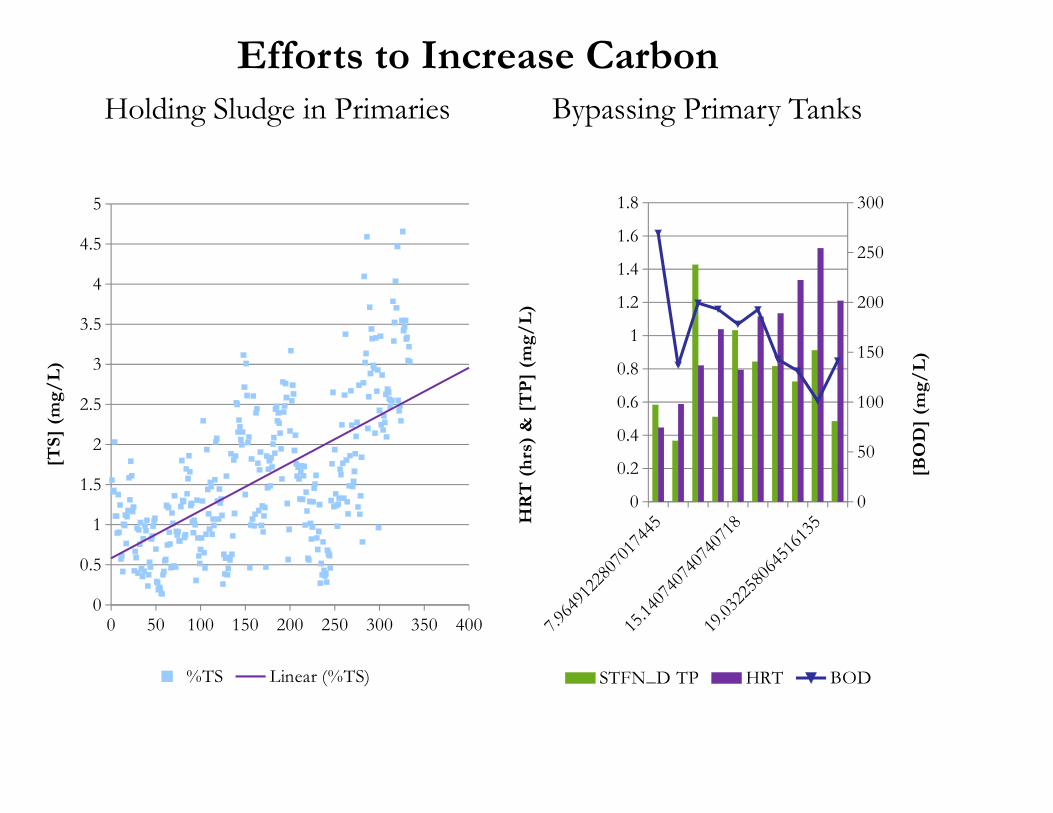
Bypassing Primary TanksEfforts to Increase Carbon
0 50 100 150 200 250 300 350 4000
0.5
1
1.5
2
2.5
3
3.5
4
4.5
5
%TS Linear (%TS)
[TS]
(m
g/L
)
Holding Sludge in Primaries
What is Happening in Low Flows?
0
2
4
6
8
10
12
0
2
4
6
8
10
12
Post/STRAW influent ortho/TP Flow
Pos
t/ST
RA
W &
ort
hoP
/T
P
Flo
w @
STR
AW
(M
GD
)
0
2
4
6
8
10
12
0
2
4
6
8
10
12
GCT/STRAW influent ortho/TP
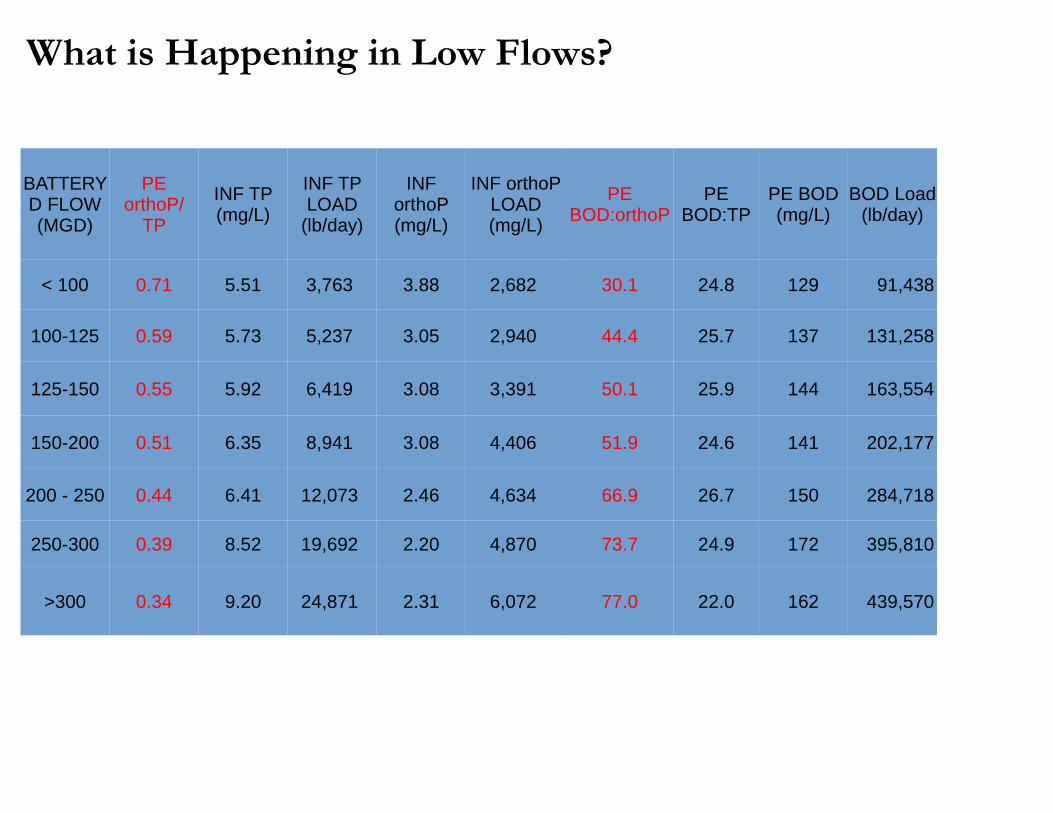
BATTERY D FLOW (MGD)
PE orthoP/
TP
INF TP (mg/L)
INF TP LOAD
(lb/day)
INF orthoP (mg/L)
INF orthoP LOAD (mg/L)
PE BOD:orthoP
PE BOD:TP
PE BOD (mg/L)
BOD Load (lb/day)
< 100 0.71 5.51 3,763 3.88 2,682 30.1 24.8 129 91,438
100-125 0.59 5.73 5,237 3.05 2,940 44.4 25.7 137 131,258
125-150 0.55 5.92 6,419 3.08 3,391 50.1 25.9 144 163,554
150-200 0.51 6.35 8,941 3.08 4,406 51.9 24.6 141 202,177
200 - 250 0.44 6.41 12,073 2.46 4,634 66.9 26.7 150 284,718
250-300 0.39 8.52 19,692 2.20 4,870 73.7 24.9 172 395,810
>300 0.34 9.20 24,871 2.31 6,072 77.0 22.0 162 439,570
What is Happening in Low Flows?
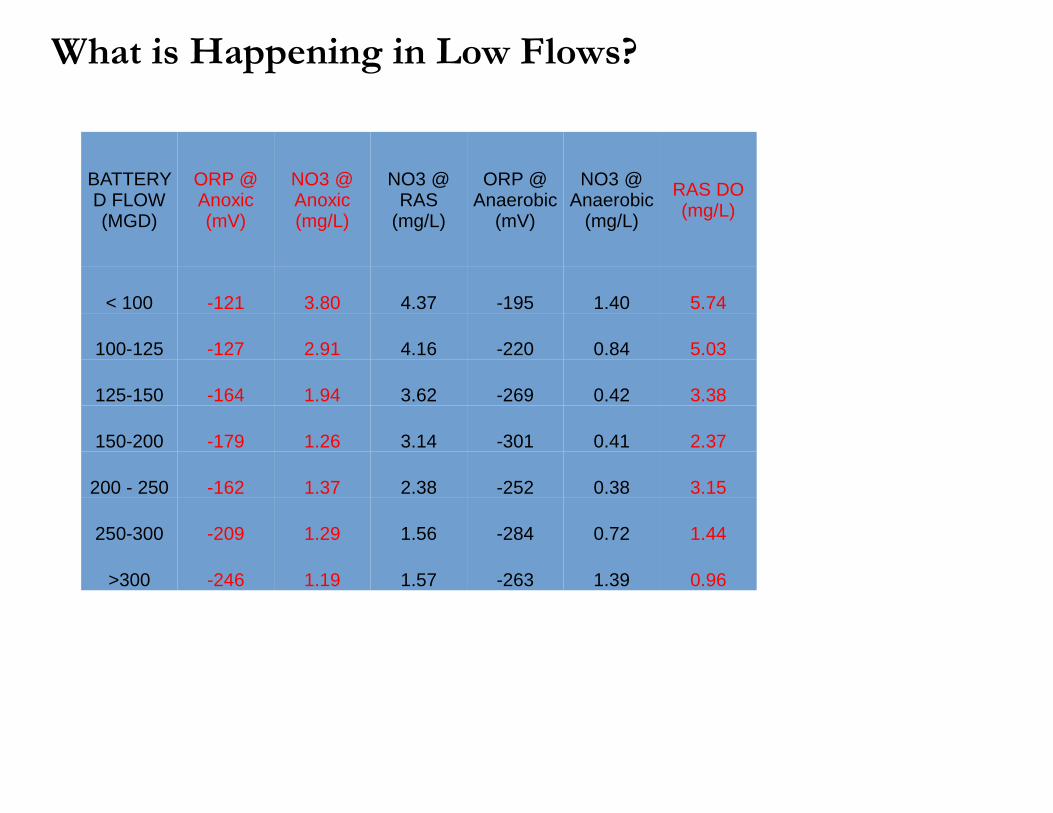
BATTERY D FLOW (MGD)
ORP @ Anoxic (mV)
NO3 @ Anoxic (mg/L)
NO3 @ RAS
(mg/L)
ORP @ Anaerobic
(mV)
NO3 @ Anaerobic
(mg/L)
RAS DO (mg/L)
< 100 -121 3.80 4.37 -195 1.40 5.74
100-125 -127 2.91 4.16 -220 0.84 5.03
125-150 -164 1.94 3.62 -269 0.42 3.38
150-200 -179 1.26 3.14 -301 0.41 2.37
200 - 250 -162 1.37 2.38 -252 0.38 3.15
250-300 -209 1.29 1.56 -284 0.72 1.44
>300 -246 1.19 1.57 -263 1.39 0.96
What is Happening in Low Flows?
4103041061
4109141122
4115341183
4121441244
4127541306
4133441365
4139541426
4145641487
4151841548
4157941609
4164041671
4169941730
4176041791
4182141852
4188341913
4194441974
0
0.2
0.4
0.6
0.8
1
1.2
1.4
1.6
1.8
0
2
4
6
8
10
12
14
16
ST Plant Outfall Battery D Effluent PE WEIGHTED TP
[TP]
@ O
utfa
ll, B
atte
ry D
(mg/
L)
[TP]
@ P
E (m
g/L)
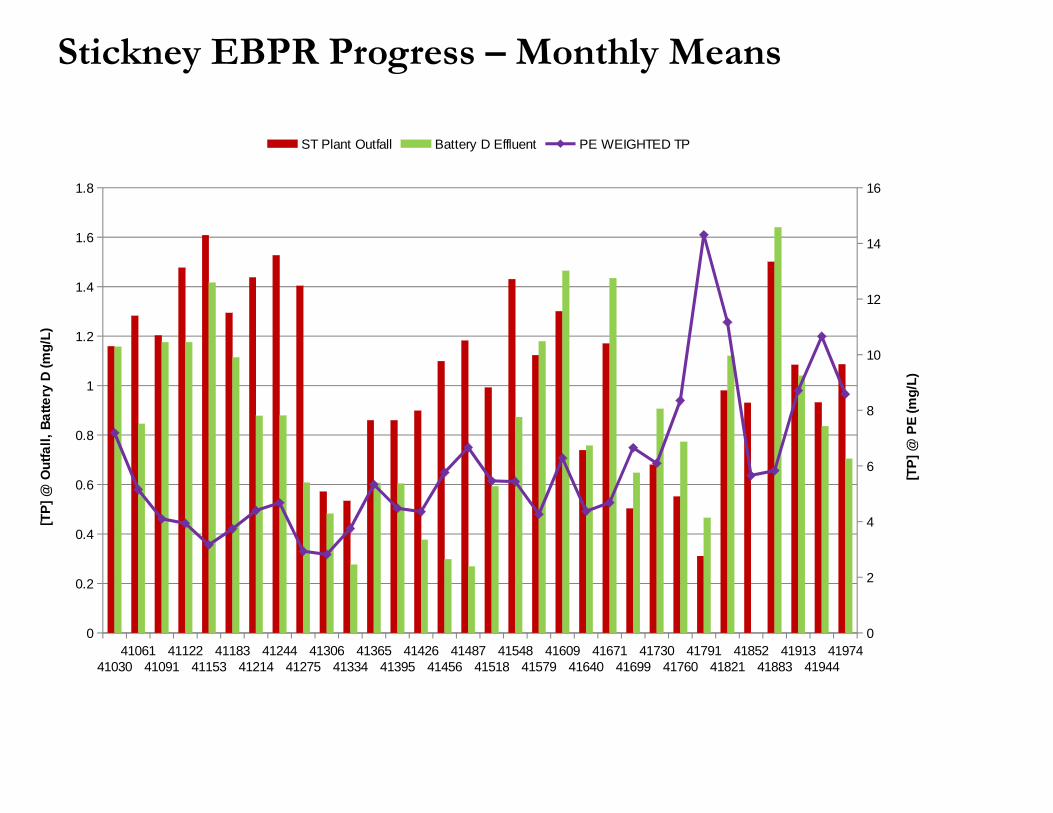
Stickney EBPR Progress – Monthly Means
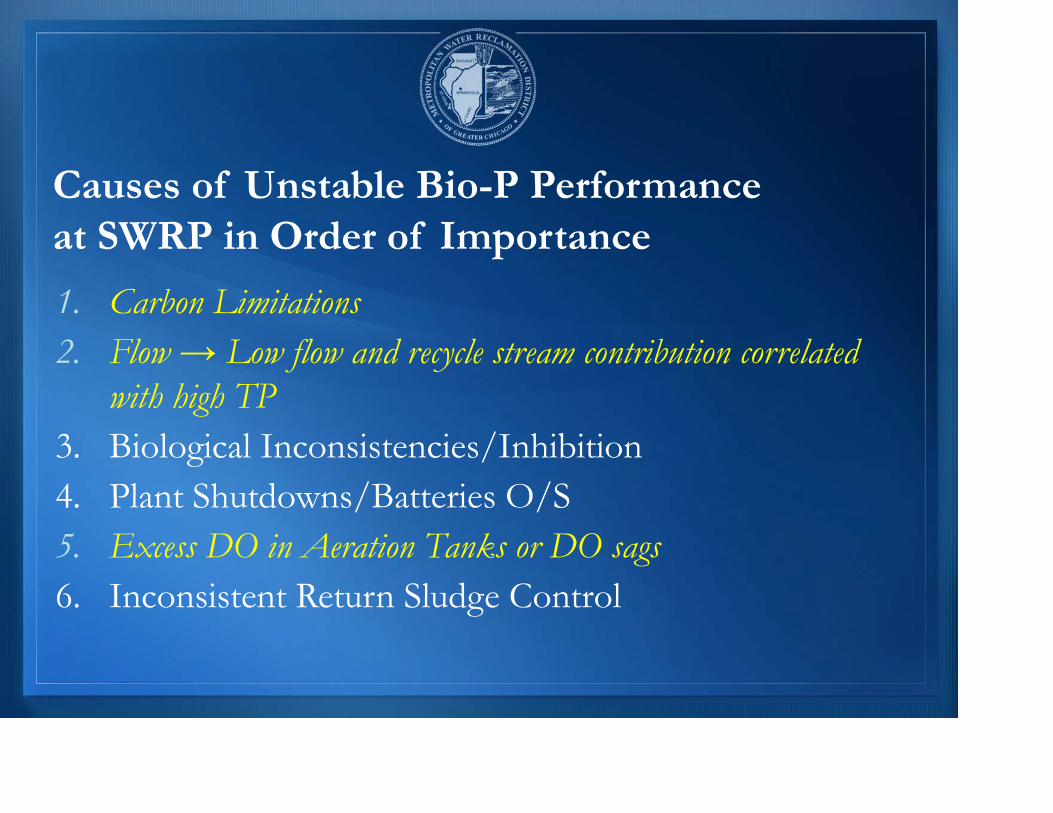
Causes of Unstable Bio-P Performance at SWRP in Order of Importance
1. Carbon Limitations2. Flow → Low flow and recycle stream contribution correlated
with high TP3. Biological Inconsistencies/Inhibition 4. Plant Shutdowns/Batteries O/S5. Excess DO in Aeration Tanks or DO sags6. Inconsistent Return Sludge Control
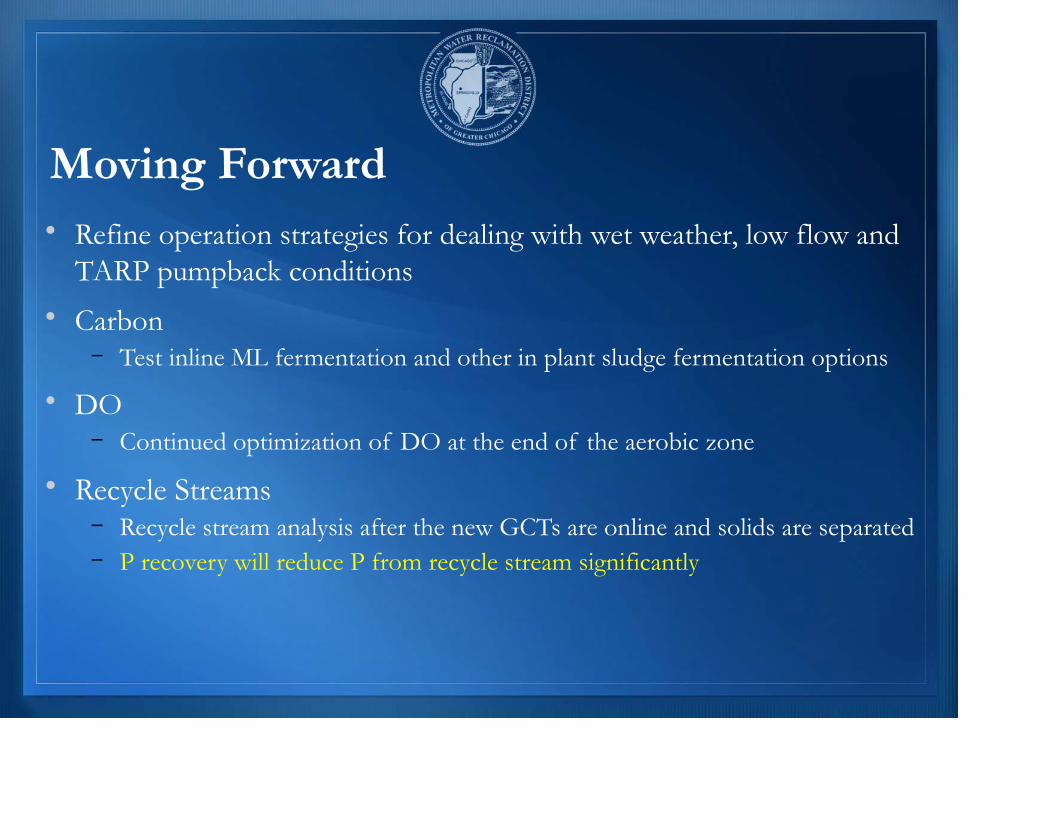
Moving Forward• Refine operation strategies for dealing with wet weather, low flow and
TARP pumpback conditions• Carbon
– Test inline ML fermentation and other in plant sludge fermentation options
• DO– Continued optimization of DO at the end of the aerobic zone
• Recycle Streams– Recycle stream analysis after the new GCTs are online and solids are separated– P recovery will reduce P from recycle stream significantly

PHOSPHORUS RECOVERY

P-release from Biological Solids• Under anaerobic conditions if rbCOD is available, P will be released from the
solids• Occurs
– Gravity concentration tanks– Lagoons– Anaerobic digesters
● Also P release from breakdown of organic bound P• If we do have unintentional release, P is just recycled again and again
internally
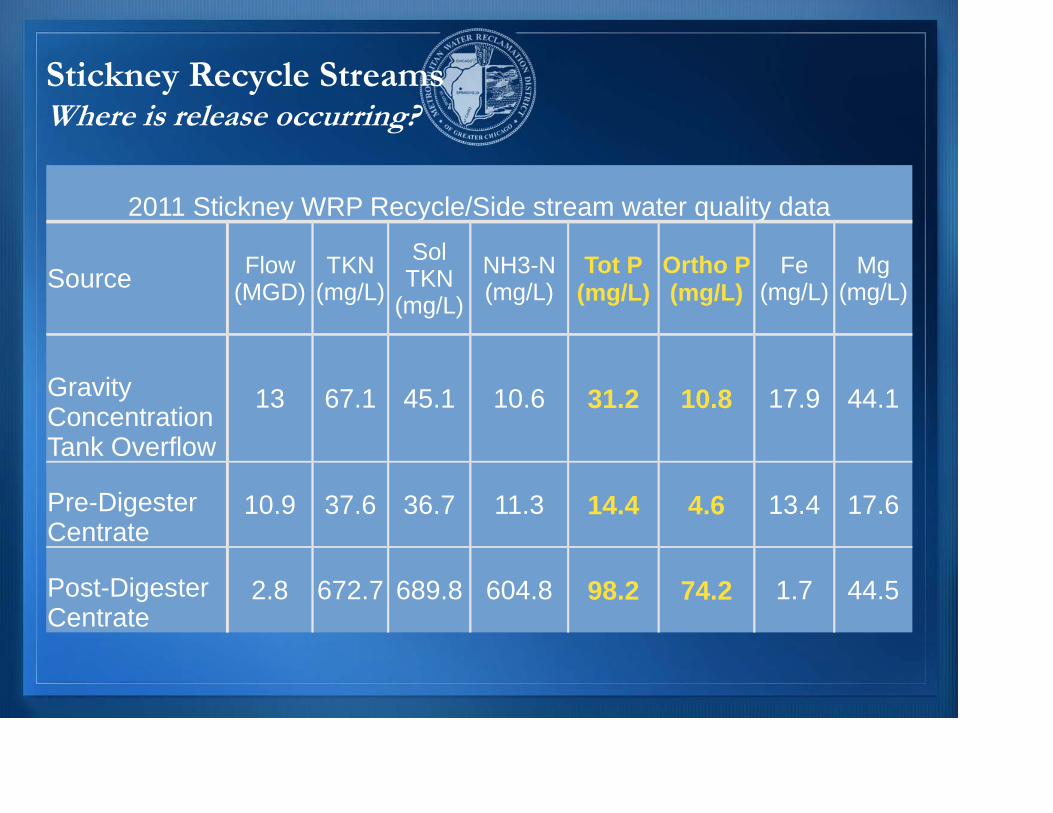
Stickney Recycle StreamsWhere is release occurring?
2011 Stickney WRP Recycle/Side stream water quality data
Source Flow(MGD)
TKN(mg/L)
Sol TKN
(mg/L)
NH3-N(mg/L)
Tot P(mg/L)
Ortho P(mg/L)
Fe(mg/L)
Mg(mg/L)
Gravity Concentration Tank Overflow
13 67.1 45.1 10.6 31.2 10.8 17.9 44.1
Pre-Digester Centrate
10.9 37.6 36.7 11.3 14.4 4.6 13.4 17.6
Post-Digester Centrate
2.8 672.7 689.8 604.8 98.2 74.2 1.7 44.5
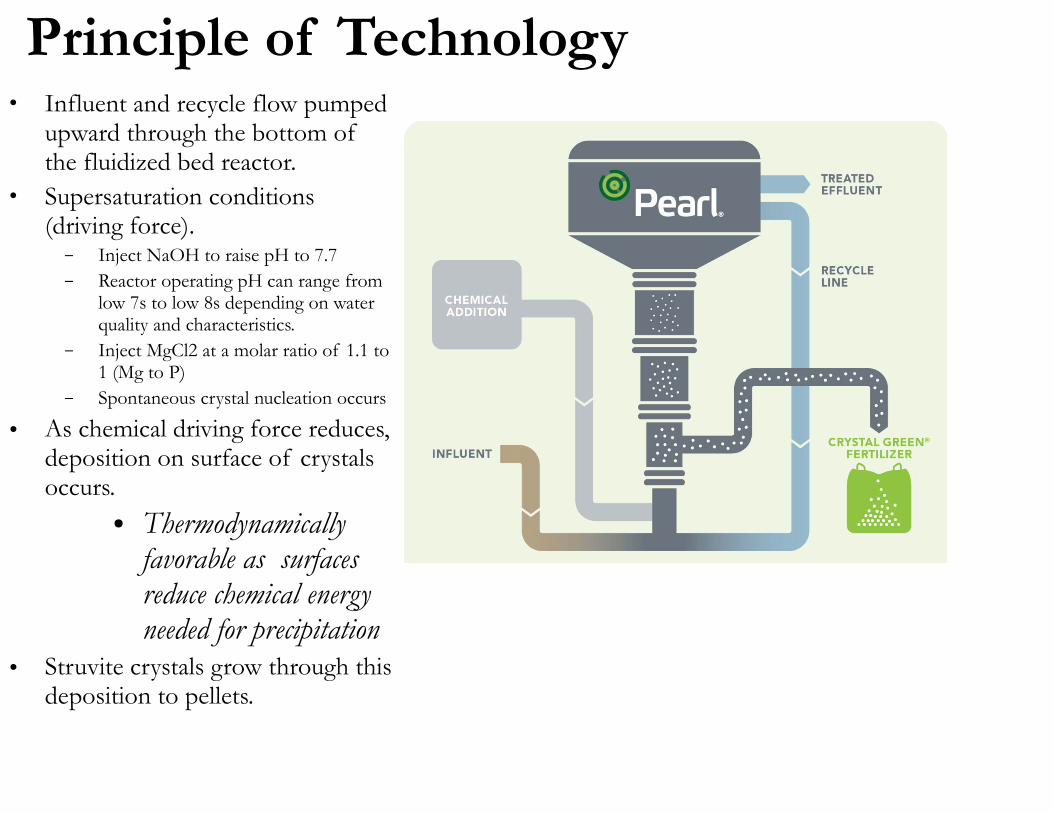
Principle of Technology• Influent and recycle flow pumped
upward through the bottom of the fluidized bed reactor.
• Supersaturation conditions (driving force).
– Inject NaOH to raise pH to 7.7– Reactor operating pH can range from
low 7s to low 8s depending on water quality and characteristics.
– Inject MgCl2 at a molar ratio of 1.1 to 1 (Mg to P)
– Spontaneous crystal nucleation occurs
• As chemical driving force reduces, deposition on surface of crystals occurs.
● Thermodynamically favorable as surfaces reduce chemical energy needed for precipitation
• Struvite crystals grow through this deposition to pellets.
34 © 2011 Ostara Nutrient Recovery Technologies Inc. All Rights Reserved. Pearl and CRYSTAL GREEN are registered Trademarks. | O s t a r a . c o m
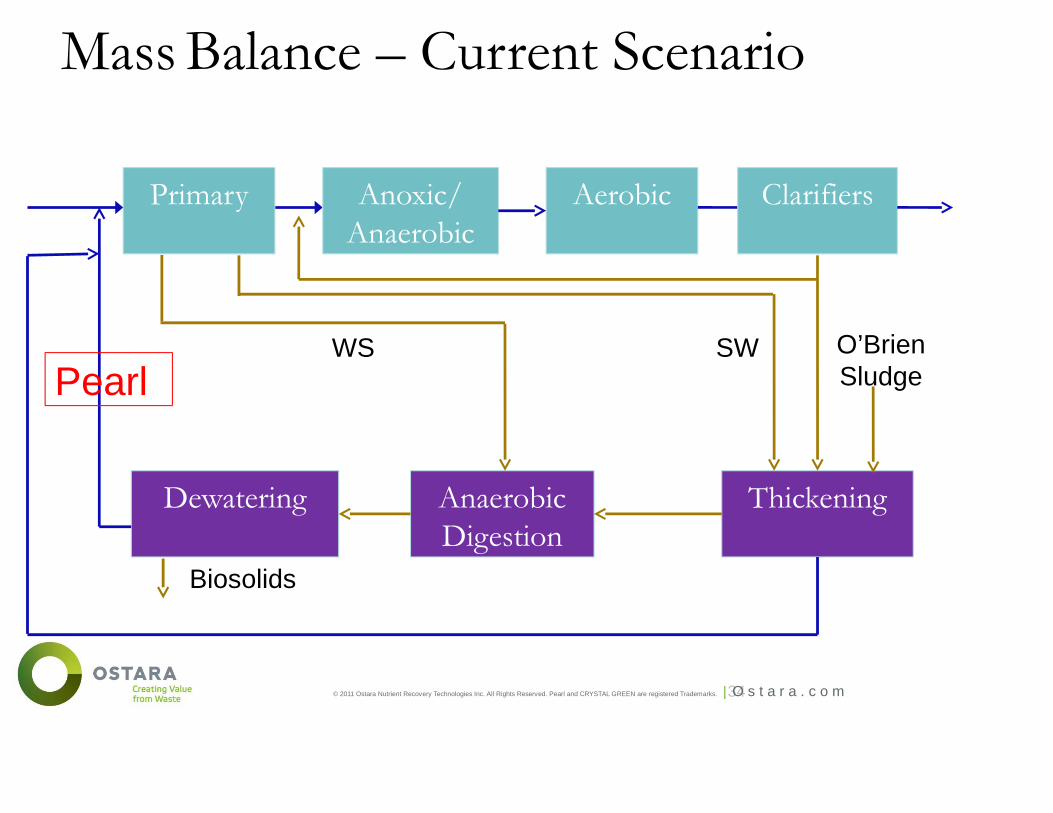
Mass Balance – Current Scenario
Primary Anoxic/Anaerobic
Aerobic
ThickeningAnaerobic Digestion
Dewatering
Clarifiers
Biosolids
WS SW O’Brien SludgePearl
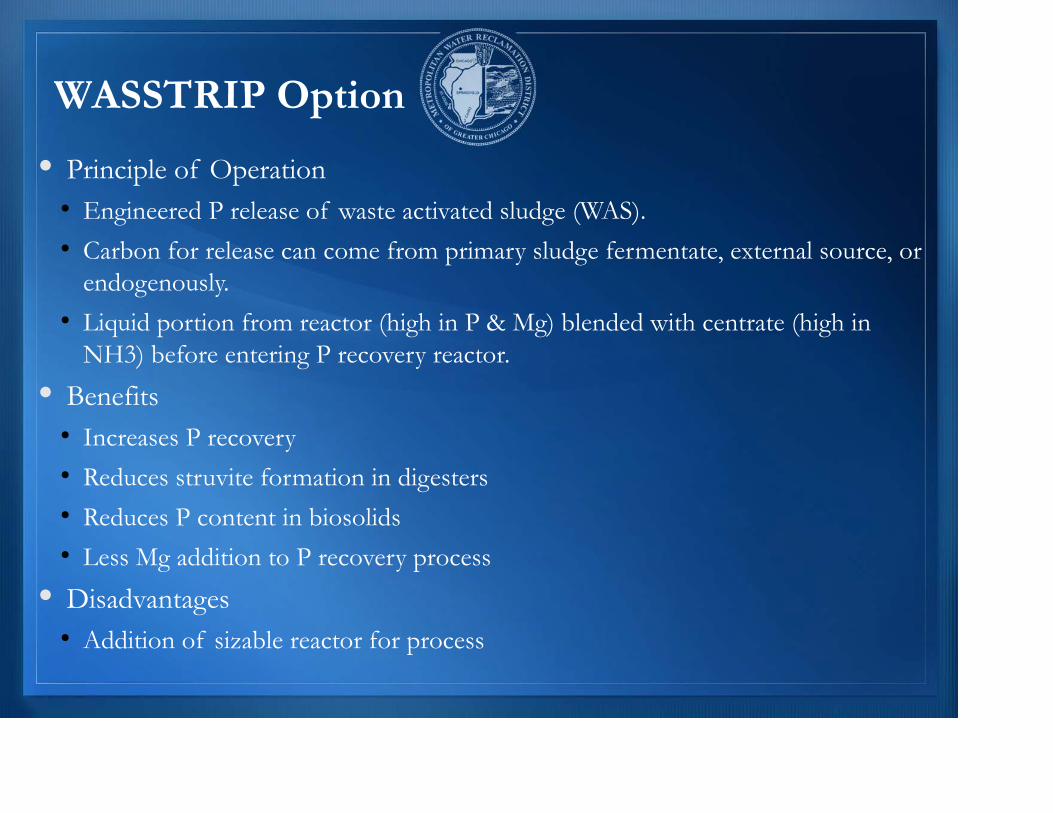
WASSTRIP Option
Principle of Operation● Engineered P release of waste activated sludge (WAS).● Carbon for release can come from primary sludge fermentate, external source, or
endogenously.● Liquid portion from reactor (high in P & Mg) blended with centrate (high in
NH3) before entering P recovery reactor. Benefits
● Increases P recovery● Reduces struvite formation in digesters● Reduces P content in biosolids● Less Mg addition to P recovery process
Disadvantages● Addition of sizable reactor for process
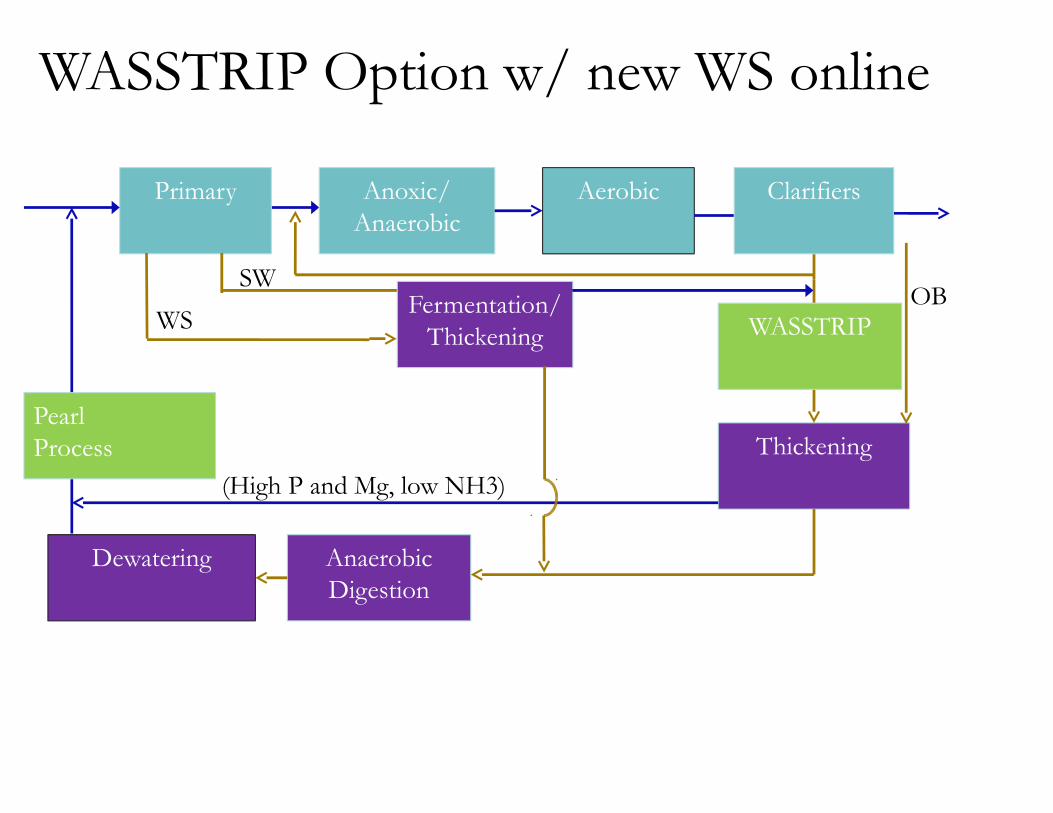
WASSTRIP Option w/ new WS online
Primary Anoxic/Anaerobic
Aerobic
Thickening
Anaerobic Digestion
Dewatering
(High P and Mg, low NH3)
WASSTRIP
Pearl Process
Clarifiers
WSSW
OBFermentation/Thickening
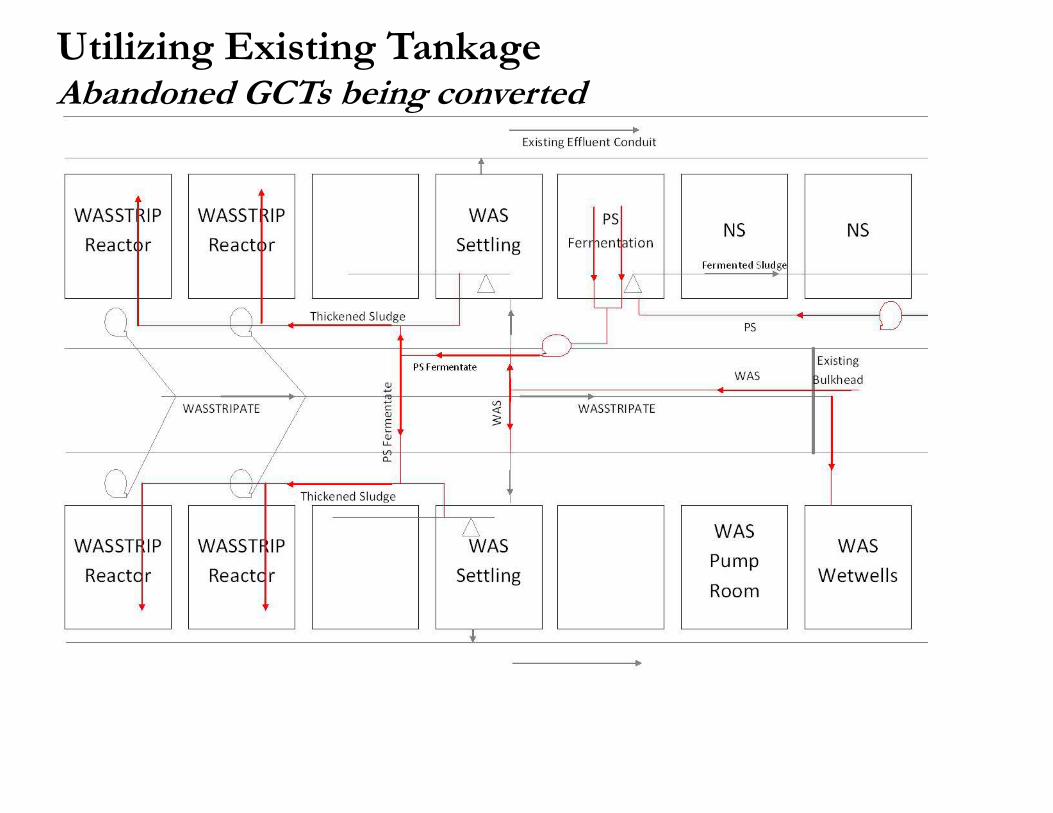
Utilizing Existing TankageAbandoned GCTs being converted
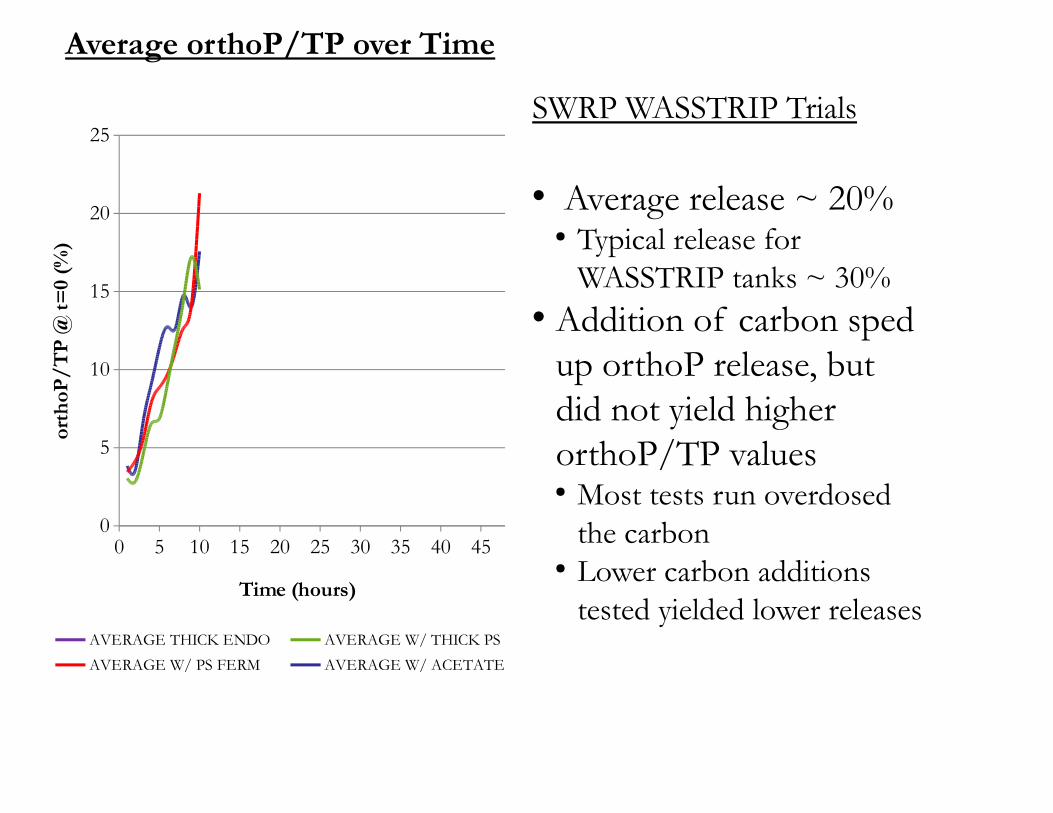
Average orthoP/TP over Time
SWRP WASSTRIP Trials
• Average release ~ 20%● Typical release for
WASSTRIP tanks ~ 30%• Addition of carbon sped
up orthoP release, but did not yield higher orthoP/TP values● Most tests run overdosed
the carbon● Lower carbon additions
tested yielded lower releases
0 5 10 15 20 25 30 35 40 450
5
10
15
20
25
AVERAGE THICK ENDO AVERAGE W/ THICK PSAVERAGE W/ PS FERM AVERAGE W/ ACETATE
Time (hours)
orth
oP/
TP
@ t
=0
(%)
0 2 4 6 8 10 12 14 16 180
20
40
60
80
100
120
140
R² = 0.06
R² = 0.14
max orthoP Linear (max orthoP)max release rate Linear (max release rate)
Initial [TP]/[SS] (%)
Max
[O
rth
o-P
] (m
g/L
) &
Max
Ort
ho-
P R
elea
se R
ate
(% r
elea
se/
hr)
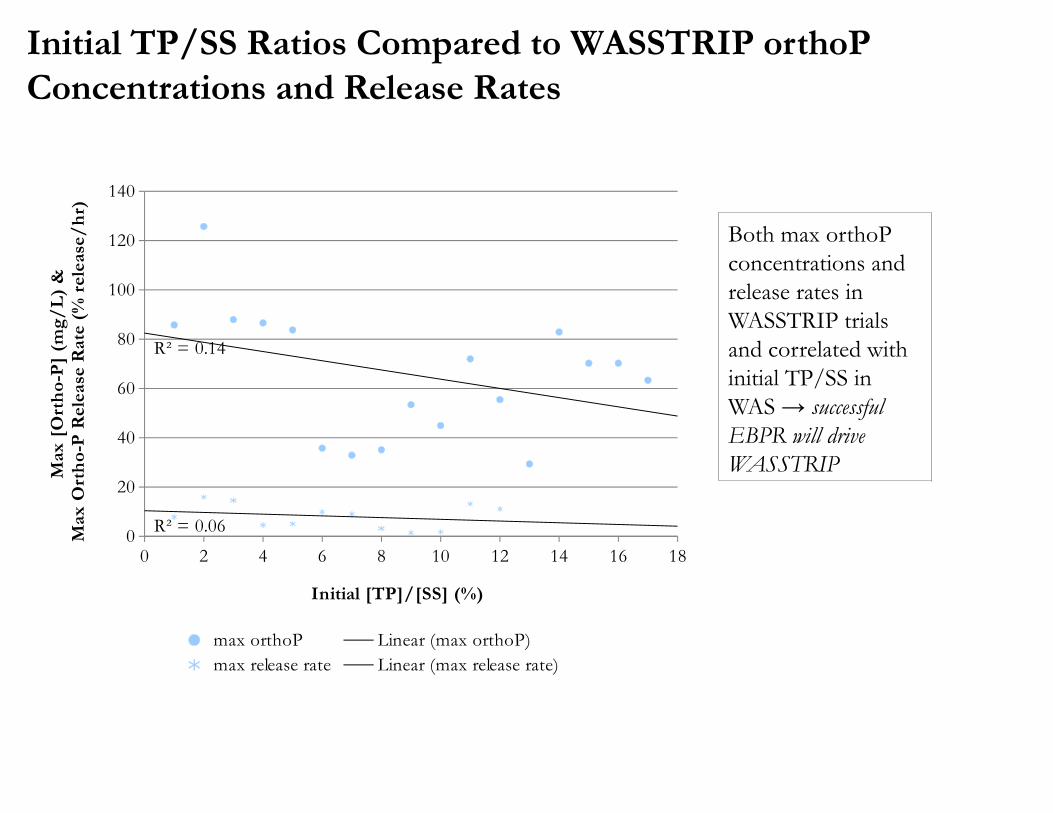
Initial TP/SS Ratios Compared to WASSTRIP orthoP Concentrations and Release Rates
Both max orthoP concentrations and release rates in WASSTRIP trials and correlated with initial TP/SS in WAS → successful EBPR will drive WASSTRIP
41 © 2011 Ostara Nutrient Recovery Technologies Inc. All Rights Reserved. Pearl and CRYSTAL GREEN are registered Trademarks. | O s t a r a . c o m
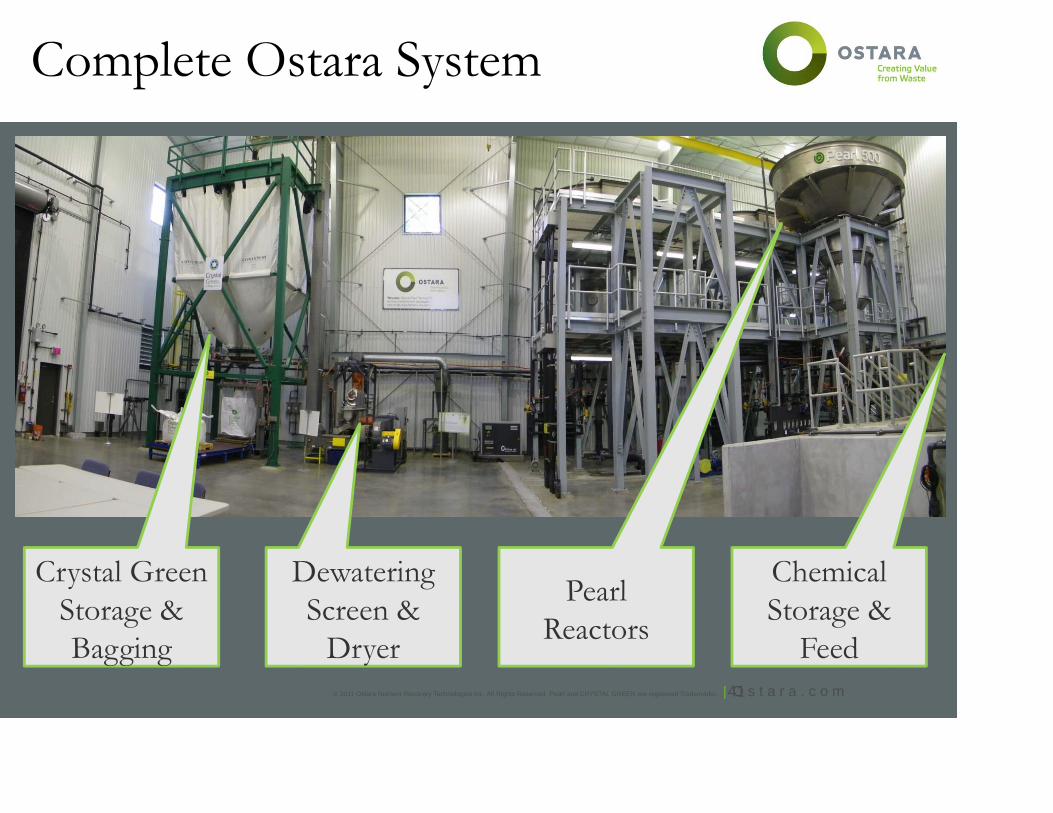
Complete Ostara System
Crystal Green Storage & Bagging
Dewatering Screen &
Dryer
Pearl Reactors
Chemical Storage &
Feed
Acknowledgements• Executive Team• Interdepartmental Phosphorus Task Force
– Joe Cummings, M&O– Brett Garelli , M&O– Dongqi Qin, M&R– Heng Zhang, M&R– Mwende Lefler, Engineering– Glenn Rohloff, Engineering– Catherine O’Connor, Engineering
• M&R Staff– EM&RD Technicians – running all benchscale experiments & collecting countless field samples – Microbiology – many, many, many PAO analyses
• ALD Staff– Analyzing the countless samples
• M&O Staff– TPOs – making the field adjustments– Trades – installing monitoring equipment
• Engineering Department– Overseeing construction of P recovery– Design of WASSTRIP system


![^ u o o µ ] o ] v P W ] ] ] } v > } v W } P u...h August 2020 ^ u o o µ ] o ] v P W ] ] ] } v > } v W } P u, Z [ ^ u o o µ ] o ] v P W ] ] ] } v > } v W } P u } À ] P } i ( ] v](https://img.pdfslide.us/doc/110x75/61255bcc660d0b5c0765fc8b/-u-o-o-o-v-p-w-v-v-w-p-u-h-august-2020-u-o-o-.jpg)

![u } ] } v o } } } ( ] P Z r Á ] v P } o ] ] o } µ o ] u D ... · u } ] } v o } } } ( ] P Z r Á ] v P } o ] ] o } µ o ] u ... u } ] } v o } } } ( ] P Z r Á ] v P } o ] ] o } µ](https://img.pdfslide.us/doc/110x75/5e0ee75edea8723fe9108e76/u-v-o-p-z-r-v-p-o-o-o-u-d-u-v-o-.jpg)


![s o P µ o } ] v À o P î ì í õ ~ À ] } v ì î X u î ì í õ o ...€¦ · s o P P µ í r s o P P µ À ] v l o ] P } v o v o u u v P ] À µ ( } Z Z À X o ] } P } v](https://img.pdfslide.us/doc/110x75/6021caaeef03fc38e63bf879/s-o-p-o-v-o-p-v-x-u-o-s-o-p.jpg)


![P ] o & o o ]](https://img.pdfslide.us/doc/110x75/62ad94ec58e4b82eb5584ac8/p-o-amp-o-o-.jpg)