Embed Size (px)
Citation preview
Journals Library
DOI 10.3310/hta23690
Enhanced motivational interviewing for reducing weight and increasing physical activity in adults with high cardiovascular risk: the MOVE IT three-arm RCT Khalida Ismail, Daniel Stahl, Adam Bayley, Katherine Twist, Kurtis Stewart, Katie Ridge, Emma Britneff, Mark Ashworth, Nicole de Zoysa, Jennifer Rundle, Derek Cook, Peter Whincup, Janet Treasure, Paul McCrone, Anne Greenough and Kirsty Winkley
Health Technology AssessmentVolume 23 • Issue 69 • December 2019
ISSN 1366-5278

Enhanced motivational interviewing forreducing weight and increasing physicalactivity in adults with high cardiovascularrisk: the MOVE IT three-arm RCT
Khalida Ismail,1* Daniel Stahl,2 Adam Bayley,1
Katherine Twist,1 Kurtis Stewart,1 Katie Ridge,1
Emma Britneff,1 Mark Ashworth,3 Nicole de Zoysa,1
Jennifer Rundle,1 Derek Cook,4 Peter Whincup,4
Janet Treasure,5 Paul McCrone,6 Anne Greenough7
and Kirsty Winkley1
1Department of Psychological Medicine, Institute of Psychiatry, Psychology andNeuroscience, King’s College London, London, UK
2Department of Biostatistics, Institute of Psychiatry, Psychology and Neuroscience,King’s College London, London, UK
3Department of Primary Care and Public Health Sciences, King’s College London,London, UK
4Population Health Research Institute, St George’s, University of London,London, UK
5Department of Health Services and Population Research, Institute of Psychiatry,King’s College London, London, UK
6Section of Eating Disorders, Institute of Psychiatry, Psychology and Neuroscience,King’s College London, London, UK
7Division of Asthma, Allergy and Lung Biology, King’s College London,Guy’s Hospital, London, UK
*Corresponding author
Declared competing interests of authors: Khalida Ismail has received honoraria for educationallectures from Sanofi SA (Paris, France), Novo Nordisk (Bagsværd, Denmark), Janssen Pharmaceutica (Beerse,Belgium) and Eli Lilly and Company (Indianapolis, IN, USA). Kirsty Winkley received consultancy fees fromMerck Sharp & Dohme (Kenilworth, NJ, USA).
Published December 2019DOI: 10.3310/hta23690


This report should be referenced as follows:
Ismail K, Stahl D, Bayley A, Twist K, Stewart K, Ridge K, et al. Enhanced motivational interviewing
for reducing weight and increasing physical activity in adults with high cardiovascular risk: the
MOVE IT three-arm RCT. Health Technol Assess 2019;23(69).
Health Technology Assessment is indexed and abstracted in Index Medicus/MEDLINE, ExcerptaMedica/EMBASE, Science Citation Index Expanded (SciSearch®) and Current Contents®/Clinical Medicine.

Health Technology Assessment HTA/HTA TAR
ISSN 1366-5278 (Print)
ISSN 2046-4924 (Online)
Impact factor: 3.819
Health Technology Assessment is indexed in MEDLINE, CINAHL, EMBASE, The Cochrane Library and the Clarivate Analytics ScienceCitation Index.
This journal is a member of and subscribes to the principles of the Committee on Publication Ethics (COPE) (www.publicationethics.org/).
Editorial contact: [email protected]
The full HTA archive is freely available to view online at www.journalslibrary.nihr.ac.uk/hta. Print-on-demand copies can be purchased from thereport pages of the NIHR Journals Library website: www.journalslibrary.nihr.ac.uk
Criteria for inclusion in the Health Technology Assessment journalReports are published in Health Technology Assessment (HTA) if (1) they have resulted from work for the HTA programme, and (2) theyare of a sufficiently high scientific quality as assessed by the reviewers and editors.
Reviews in Health Technology Assessment are termed ‘systematic’ when the account of the search appraisal and synthesis methods(to minimise biases and random errors) would, in theory, permit the replication of the review by others.
HTA programmeHealth Technology Assessment (HTA) research is undertaken where some evidence already exists to show that a technology can be effectiveand this needs to be compared to the current standard intervention to see which works best. Research can evaluate any intervention used inthe treatment, prevention or diagnosis of disease, provided the study outcomes lead to findings that have the potential to be of direct benefitto NHS patients. Technologies in this context mean any method used to promote health; prevent and treat disease; and improve rehabilitationor long-term care. They are not confined to new drugs and include any intervention used in the treatment, prevention or diagnosis of disease.
The journal is indexed in NHS Evidence via its abstracts included in MEDLINE and its Technology Assessment Reports inform National Institutefor Health and Care Excellence (NICE) guidance. HTA research is also an important source of evidence for National Screening Committee (NSC)policy decisions.
This reportThe research reported in this issue of the journal was funded by the HTA programme as project number 10/62/03. The contractual start datewas in January 2013. The draft report began editorial review in April 2018 and was accepted for publication in September 2018. The authorshave been wholly responsible for all data collection, analysis and interpretation, and for writing up their work. The HTA editors and publisherhave tried to ensure the accuracy of the authors’ report and would like to thank the reviewers for their constructive comments on the draftdocument. However, they do not accept liability for damages or losses arising from material published in this report.
This report presents independent research funded by the National Institute for Health Research (NIHR). The views and opinions expressed byauthors in this publication are those of the authors and do not necessarily reflect those of the NHS, the NIHR, NETSCC, the HTA programmeor the Department of Health and Social Care. If there are verbatim quotations included in this publication the views and opinions expressedby the interviewees are those of the interviewees and do not necessarily reflect those of the authors, those of the NHS, the NIHR, NETSCC,the HTA programme or the Department of Health and Social Care.
© Queen’s Printer and Controller of HMSO 2019. This work was produced by Ismail et al. under the terms of a commissioningcontract issued by the Secretary of State for Health and Social Care. This issue may be freely reproduced for the purposes ofprivate research and study and extracts (or indeed, the full report) may be included in professional journals provided thatsuitable acknowledgement is made and the reproduction is not associated with any form of advertising. Applications forcommercial reproduction should be addressed to: NIHR Journals Library, National Institute for Health Research, Evaluation,Trials and Studies Coordinating Centre, Alpha House, University of Southampton Science Park, Southampton SO16 7NS, UK.
Published by the NIHR Journals Library (www.journalslibrary.nihr.ac.uk), produced by Prepress Projects Ltd, Perth, Scotland(www.prepress-projects.co.uk).

NIHR Journals Library Editor-in-Chief
Professor Ken Stein Professor of Public Health, University of Exeter Medical School, UK
NIHR Journals Library Editors
Professor John Powell Chair of HTA and EME Editorial Board and Editor-in-Chief of HTA and EME journals. Consultant Clinical Adviser, National Institute for Health and Care Excellence (NICE), UK, and Senior Clinical Researcher, Nuffield Department of Primary Care Health Sciences, University of Oxford, UK
Professor Andrée Le May Chair of NIHR Journals Library Editorial Group (HS&DR, PGfAR, PHR journals) and Editor-in-Chief of HS&DR, PGfAR, PHR journals
Professor Matthias Beck Professor of Management, Cork University Business School, Department of Management and Marketing, University College Cork, Ireland
Dr Tessa Crilly Director, Crystal Blue Consulting Ltd, UK
Dr Eugenia Cronin Senior Scientific Advisor, Wessex Institute, UK
Dr Peter Davidson Consultant Advisor, Wessex Institute, University of Southampton, UK
Ms Tara Lamont Director, NIHR Dissemination Centre, UK
Dr Catriona McDaid Senior Research Fellow, York Trials Unit, Department of Health Sciences, University of York, UK
Professor William McGuire Professor of Child Health, Hull York Medical School, University of York, UK
Professor Geoffrey Meads Professor of Wellbeing Research, University of Winchester, UK
Professor John Norrie Chair in Medical Statistics, University of Edinburgh, UK
Professor James Raftery Professor of Health Technology Assessment, Wessex Institute, Faculty of Medicine, University of Southampton, UK
Dr Rob Riemsma Reviews Manager, Kleijnen Systematic Reviews Ltd, UK
Professor Helen Roberts Professor of Child Health Research, UCL Great Ormond Street Institute of Child Health, UK
Professor Jonathan Ross Professor of Sexual Health and HIV, University Hospital Birmingham, UK
Professor Helen Snooks Professor of Health Services Research, Institute of Life Science, College of Medicine, Swansea University, UK
Professor Ken Stein Professor of Public Health, University of Exeter Medical School, UK
Professor Jim Thornton Professor of Obstetrics and Gynaecology, Faculty of Medicine and Health Sciences, University of Nottingham, UK
Professor Martin Underwood Warwick Clinical Trials Unit, Warwick Medical School, University of Warwick, UK
Please visit the website for a list of editors: www.journalslibrary.nihr.ac.uk/about/editors
Editorial contact: [email protected]
NIHR Journals Library www.journalslibrary.nihr.ac.uk
Abstract
Enhanced motivational interviewing for reducing weightand increasing physical activity in adults with highcardiovascular risk: the MOVE IT three-arm RCT
Khalida Ismail,1* Daniel Stahl,2 Adam Bayley,1 Katherine Twist,1
Kurtis Stewart,1 Katie Ridge,1 Emma Britneff,1 Mark Ashworth,3
Nicole de Zoysa,1 Jennifer Rundle,1 Derek Cook,4 Peter Whincup,4
Janet Treasure,5 Paul McCrone,6 Anne Greenough7
and Kirsty Winkley1
1Department of Psychological Medicine, Institute of Psychiatry, Psychology and Neuroscience,King’s College London, London, UK
2Department of Biostatistics, Institute of Psychiatry, Psychology and Neuroscience, King’s CollegeLondon, London, UK
3Department of Primary Care and Public Health Sciences, King’s College London, London, UK4Population Health Research Institute, St George’s, University of London, London, UK5Department of Health Services and Population Research, Institute of Psychiatry, King’s CollegeLondon, London, UK
6Section of Eating Disorders, Institute of Psychiatry, Psychology and Neuroscience, King’s CollegeLondon, London, UK
7Division of Asthma, Allergy and Lung Biology, King’s College London, Guy’s Hospital,London, UK
*Corresponding author [email protected]
Background: Motivational interviewing (MI) enhanced with behaviour change techniques (BCTs) anddeployed by health trainers targeting multiple risk factors for cardiovascular disease (CVD) may be moreeffective than interventions targeting a single risk factor.
Objectives: The clinical effectiveness and cost-effectiveness of an enhanced lifestyle motivationalinterviewing intervention for patients at high risk of CVD in group settings versus individual settingsand usual care (UC) in reducing weight and increasing physical activity (PA) were tested.
Design: This was a three-arm, single-blind, parallel randomised controlled trial.
Setting: A total of 135 general practices across all 12 South London Clinical Commissioning Groups wererecruited.
Participants: A total of 1742 participants aged 40–74 years with a ≥ 20.0% risk of a CVD event in thefollowing 10 years were randomised.
Interventions: The intervention was designed to integrate MI and cognitive–behavioural therapy (CBT),delivered by trained healthy lifestyle facilitators in 10 sessions over 1 year, in group or individual format.The control group received UC.
DOI: 10.3310/hta23690 HEALTH TECHNOLOGY ASSESSMENT 2019 VOL. 23 NO. 69
© Queen’s Printer and Controller of HMSO 2019. This work was produced by Ismail et al. under the terms of a commissioning contract issued by the Secretary of State for Healthand Social Care. This issue may be freely reproduced for the purposes of private research and study and extracts (or indeed, the full report) may be included in professionaljournals provided that suitable acknowledgement is made and the reproduction is not associated with any form of advertising. Applications for commercial reproduction shouldbe addressed to: NIHR Journals Library, National Institute for Health Research, Evaluation, Trials and Studies Coordinating Centre, Alpha House, University of Southampton SciencePark, Southampton SO16 7NS, UK.
vii
Randomisation: Simple randomisation was used with computer-generated randomisation blocks. In eachblock, 10 participants were randomised to the group, individual or UC arm in a 4 : 3 : 3 ratio. Researcherswere blind to the allocation.
Main outcome measures: The primary outcomes are change in weight (kg) from baseline and change inPA (average number of steps per day over 1 week) from baseline at the 24-month follow-up, with aninterim follow-up at 12 months. An economic evaluation estimates the relative cost-effectiveness of eachintervention. Secondary outcomes include changes in low-density lipoprotein cholesterol and CVD risk score.
Results: The mean age of participants was 69.75 years (standard deviation 4.11 years), 85.5% were maleand 89.4% were white. At the 24-month follow-up, the group and individual intervention arms were notmore effective than UC in increasing PA [mean 70.05 steps, 95% confidence interval (CI) –288 to 147.9steps, and mean 7.24 steps, 95% CI –224.01 to 238.5 steps, respectively] or in reducing weight (mean–0.03 kg, 95% CI –0.49 to 0.44 kg, and mean –0.42 kg, 95% CI –0.93 to 0.09 kg, respectively). At the12-month follow-up, the group and individual intervention arms were not more effective than UC inincreasing PA (mean 131.1 steps, 95% CI –85.28 to 347.48 steps, and mean 210.22 steps, 95% CI–19.46 to 439.91 steps, respectively), but there were reductions in weight for the group and individualintervention arms compared with UC (mean –0.52 kg, 95% CI –0.90 to –0.13 kg, and mean –0.55 kg,95% CI –0.95 to –0.14 kg, respectively). The group intervention arm was not more effective than theindividual intervention arm in improving outcomes at either follow-up point. The group and individualinterventions were not cost-effective.
Conclusions: Enhanced MI, in group or individual formats, targeted at members of the general populationwith high CVD risk is not effective in reducing weight or increasing PA compared with UC. Future workshould focus on ensuring objective evidence of high competency in BCTs, identifying those with modifiablefactors for CVD risk and improving engagement of patients and primary care.
Trial registration: Current Controlled Trials ISRCTN84864870.
Funding: This project was funded by the National Institute for Health Research (NIHR) Health TechnologyAssessment programme and will be published in full in Health Technology Assessment; Vol. 23, No. 69.See the NIHR Journals Library website for further project information. This research was part-funded bythe NIHR Biomedical Research Centre at South London and Maudsley NHS Foundation Trust and King’sCollege London.
ABSTRACT
NIHR Journals Library www.journalslibrary.nihr.ac.uk
viii
Contents
List of tables xiii
List of figures xv
List of supplementary material xvii
List of abbreviations xix
Plain English summary xxi
Scientific summary xxiii
Chapter 1 Introduction 1Epidemiology of cardiovascular disease and its risk factors 1Cardiovascular risk identification 1The evidence for increasing physical activity 2The evidence for dietary interventions 2The evidence for motivational interviewing 3A taxonomy of behaviour change techniques 3The role of health trainers 4The case for an enhanced motivational interviewing intervention 4
Chapter 2 Research objectives 7Primary objective 7Secondary objectives 7
Chapter 3 Methods 9Trial design 9
Ethics approval and research governance 9Setting 9Eligibility criteria 9Sample size 10
Recruitment 10Invitation procedure 10Consenting participants 11Calculation of cardiovascular disease risk score 11Baseline measures 12Randomisation and allocation concealment 14
Outcome measures 14Trial arms and intervention details 14
Arm 1: usual care and enhanced motivational interviewing in a group format 14Intervention development 15Training the healthy lifestyle facilitators 16Arm 2: usual care and enhanced motivational interviewing in an individual format 18Arm 3: usual care only 18
Clinical effectiveness 18Primary outcomes 18Secondary outcomes 18
DOI: 10.3310/hta23690 HEALTH TECHNOLOGY ASSESSMENT 2019 VOL. 23 NO. 69
© Queen’s Printer and Controller of HMSO 2019. This work was produced by Ismail et al. under the terms of a commissioning contract issued by the Secretary of State for Healthand Social Care. This issue may be freely reproduced for the purposes of private research and study and extracts (or indeed, the full report) may be included in professionaljournals provided that suitable acknowledgement is made and the reproduction is not associated with any form of advertising. Applications for commercial reproduction shouldbe addressed to: NIHR Journals Library, National Institute for Health Research, Evaluation, Trials and Studies Coordinating Centre, Alpha House, University of Southampton SciencePark, Southampton SO16 7NS, UK.
ix
Cost-effectiveness 18Process evaluation 19
Participation bias 19Fidelity analysis 19Processes of change 19
Statistical analysis 19Sensitivity analysis adjusting for delay in intervention start 20Sensitivity analysis adjusting for unblinding of research assistants at follow-up 20Sensitivity analysis adjusting for insufficient accelerometer wear at baseline 20Sensitivity analysis adjusting for insufficient accelerometer wear at follow-up 20Sensitivity analysis adjusting for the recruitment of participants with a body massindex of < 25 kg/m2 21Sensitivity analysis adjusting for the recruitment of participants with a QRISK2score of < 20.0% 21Dietary intake analysis 21Cost-effectiveness analysis 21
Ethics issues 22Adverse events 22Obtaining informed consent 23Withdrawal and stopping rules 23Time period for retention of trial documentation 23
Patient and public involvement 23
Chapter 4 Protocol changes 25Low uptake of NHS Health Checks 25Change to recruitment and study time frame 25Research sites 25Randomisation 25Research measures 26Intervention details 26Additional consent procedures 26Elaboration of process evaluation: participation bias 27King’s College London network outage and impact on the fidelity analysis 27
Chapter 5 Main clinical results of the trial 29Practice recruitment 29Participant recruitment and flow through the trial 30Intervention delivery 32
Sessions received 32Delays to intervention commencement 33Intervention duration 33Reasons for not starting or not completing the intervention 34Participant adherence to the intervention 34
Loss to follow-up 36Accelerometer data completeness 37Baseline characteristics 39Missing data 42
Predictors of missing outcome data at 12 and 24 months 42Primary outcomes 43
Physical activity 43Assessment of assumptions 44
Distribution of data 44Assessment of standard deviations between arms and over time 44
CONTENTS
NIHR Journals Library www.journalslibrary.nihr.ac.uk
x
Weight 45Assessment of assumptions 45
Distribution of data 45Assessment of standard deviations between arms and over time 46Sensitivity analyses 46
Sensitivity analysis adjusting for imbalances in baseline characteristics 46Complier-average causal effect analysis 47
Secondary outcomes 47Dietary intake analysis 47Adverse events 49
Chapter 6 Cost-effectiveness 53Summary 59
Chapter 7 Participation biases 61Background 61Methods 61Results 62Summary 62
Chapter 8 Fidelity analysis 67Introduction 67Aims 67Original methods 67
Identifying sessions to rate 67Measures of competency 68Interrater reliability 69
Revised methods 70Identifying sessions to rate 70Association between healthy lifestyle facilitator competencies and patient outcomes 71
Results 71Fidelity to the intervention 71
Discussion 75Limitations 75
Chapter 9 Qualitative findings: the views of participants 77Background 77Methods 77Results 78
Theme 1: perceived benefits of the study 78Theme 2: factors enhancing behaviour change 79Theme 3: perceived risk of cardiovascular disease 81Theme 4: potential barriers to change and overcoming these barriers 82
Summary 83
Chapter 10 Qualitative findings: the views of healthy lifestyle facilitators andclinical psychologists 85Background 85Methods 85Results 86
Theme 1: challenges and suggested improvement for the training 86The clinical psychologist perspective 87Theme 2: supervision issues and peer support 88
DOI: 10.3310/hta23690 HEALTH TECHNOLOGY ASSESSMENT 2019 VOL. 23 NO. 69
© Queen’s Printer and Controller of HMSO 2019. This work was produced by Ismail et al. under the terms of a commissioning contract issued by the Secretary of State for Healthand Social Care. This issue may be freely reproduced for the purposes of private research and study and extracts (or indeed, the full report) may be included in professionaljournals provided that suitable acknowledgement is made and the reproduction is not associated with any form of advertising. Applications for commercial reproduction shouldbe addressed to: NIHR Journals Library, National Institute for Health Research, Evaluation, Trials and Studies Coordinating Centre, Alpha House, University of Southampton SciencePark, Southampton SO16 7NS, UK.
xi
Theme 3: challenges with delivering the intervention 90Challenges with patients 90
Summary 92
Chapter 11 Discussion 93Summary of the clinical effectiveness of MOVE IT 93Strengths and limitations 94Interpretation 95Clinical implications 98Research implications and future directions 99Summary 99
Acknowledgements 101
References 105
Appendix 1 Proficiency levels adapted for healthy lifestyle facilitator training 117
Appendix 2 List of participating general practices 119
Appendix 3 Behaviour change technique coding framework for the fidelity analysis 131
Appendix 4 Participant focus group topic guides 135
Appendix 5 Characteristics of focus group attendees 139
Appendix 6 Health-care professional feedback topic guides 143
CONTENTS
NIHR Journals Library www.journalslibrary.nihr.ac.uk
xii
List of tables
TABLE 1 Data collection schedule summary 11
TABLE 2 Intervention session contents 17
TABLE 3 General practice participation in the MOVE IT trial and practicedeprivation by each South London CCG 29
TABLE 4 Participant recruitment by CCG 30
TABLE 5 Summary of intervention receipt 32
TABLE 6 Number of sessions attended, by participants in the intervention armswho started the intervention and by session type 32
TABLE 7 Reason given for not starting or not completing the intervention,by participants in each intervention arm 34
TABLE 8 Summary of intervention adherence: target set by intervention arm 35
TABLE 9 Summary of targets achieved for intervention adherence 35
TABLE 10 Reasons for loss to follow-up, by arm at 12 and 24 months 37
TABLE 11 Summary of accelerometer data collection at each time point and bytrial arm 38
TABLE 12 Baseline characteristics of participants, by trial arm 39
TABLE 13 Secondary outcome measures at baseline, by trial arm 41
TABLE 14 Summary of baseline characteristics of participants with present vs.missing primary outcome data at the 12-month follow-up 42
TABLE 15 Summary of baseline characteristics of participants with present vs.missing primary outcome data at the 24-month follow-up 43
TABLE 16 Summary of PA (number of steps) outcome, by trial arm 43
TABLE 17 Pairwise comparisons of trial arms of treatment effect on the primaryoutcomes 45
TABLE 18 Summary of weight (kg) outcome by trial arm 45
TABLE 19 Pairwise comparisons between trial arms of treatment effect onsecondary outcomes 48
TABLE 20 Summary of nutrient intake at each time point, by treatment arm 49
TABLE 21 Summary of AEs per participant, by trial arm 50
DOI: 10.3310/hta23690 HEALTH TECHNOLOGY ASSESSMENT 2019 VOL. 23 NO. 69
© Queen’s Printer and Controller of HMSO 2019. This work was produced by Ismail et al. under the terms of a commissioning contract issued by the Secretary of State for Healthand Social Care. This issue may be freely reproduced for the purposes of private research and study and extracts (or indeed, the full report) may be included in professionaljournals provided that suitable acknowledgement is made and the reproduction is not associated with any form of advertising. Applications for commercial reproduction shouldbe addressed to: NIHR Journals Library, National Institute for Health Research, Evaluation, Trials and Studies Coordinating Centre, Alpha House, University of Southampton SciencePark, Southampton SO16 7NS, UK.
xiii
TABLE 22 Summary of AEs, by subcategory and trial arm 50
TABLE 23 Number of participants using services in the 12 months prior tobaseline and at each follow-up 54
TABLE 24 Mean number of contacts, by those using services in the 12 monthsprior to baseline and at each follow-up 55
TABLE 25 Mean service costs (2015/16 £) in the 12 months prior to baseline andat each follow-up 56
TABLE 26 Mean EQ-5D tariff scores and QALYs, by arm and time point 57
TABLE 27 South London CCG deprivation, ethnicity and anonymous data collected 63
TABLE 28 Comparison of responders and non-responders to the trial invitation 64
TABLE 29 Potential and actual hours of session recordings 68
TABLE 30 Minimum values to achieve for MITI proficiency and competency 69
TABLE 31 Comparison of session characteristics of original and recovered recordings 70
TABLE 32 Summary of MITI domain scores 72
TABLE 33 The MITI scores, by HLF, combining session types 73
TABLE 34 The MITI scores, by HLF and session type 73
TABLE 35 Summary of BCT adherence 74
TABLE 36 Behaviour change technique adherence, by HLF and session type 74
TABLE 37 Summary of themes and subthemes 78
TABLE 38 Characteristics of intervention providers 86
TABLE 39 List of participating general practices 120
TABLE 40 Characteristics of focus group attendees 140
LIST OF TABLES
NIHR Journals Library www.journalslibrary.nihr.ac.uk
xiv
List of figures
FIGURE 1 Theoretical framework and intervention map 15
FIGURE 2 The CONSORT flow diagram 31
FIGURE 3 Time between randomisation and intervention start date (session 0),by intervention arm 33
FIGURE 4 Number of targets set, by each session and intervention arm 35
FIGURE 5 Distribution of target achievement, by intervention arm and sessionnumber 36
FIGURE 6 Mean PA (number of steps) with 95% CIs for each arm over time 44
FIGURE 7 Mean weight with 95% CIs for each arm over time 46
FIGURE 8 Cost-effectiveness plane comparing the group intervention arm and UC 57
FIGURE 9 Cost-effectiveness plane comparing the individual intervention armand UC 58
FIGURE 10 Cost-effectiveness acceptability curves 59
DOI: 10.3310/hta23690 HEALTH TECHNOLOGY ASSESSMENT 2019 VOL. 23 NO. 69
© Queen’s Printer and Controller of HMSO 2019. This work was produced by Ismail et al. under the terms of a commissioning contract issued by the Secretary of State for Healthand Social Care. This issue may be freely reproduced for the purposes of private research and study and extracts (or indeed, the full report) may be included in professionaljournals provided that suitable acknowledgement is made and the reproduction is not associated with any form of advertising. Applications for commercial reproduction shouldbe addressed to: NIHR Journals Library, National Institute for Health Research, Evaluation, Trials and Studies Coordinating Centre, Alpha House, University of Southampton SciencePark, Southampton SO16 7NS, UK.
xv


List of supplementary material
Report Supplementary Material 1 Additional data and results for Chapter 5(main clinical results of the trial)
Supplementary material can be found on the NIHR Journals Library report project page(www.journalslibrary.nihr.ac.uk/programmes/hta/106203/#/documentation).
Supplementary material has been provided by the authors to support the report and any files providedat submission will have been seen by peer reviewers, but not extensively reviewed. Any supplementarymaterial provided at a later stage in the process may not have been peer reviewed.
DOI: 10.3310/hta23690 HEALTH TECHNOLOGY ASSESSMENT 2019 VOL. 23 NO. 69
© Queen’s Printer and Controller of HMSO 2019. This work was produced by Ismail et al. under the terms of a commissioning contract issued by the Secretary of State for Healthand Social Care. This issue may be freely reproduced for the purposes of private research and study and extracts (or indeed, the full report) may be included in professionaljournals provided that suitable acknowledgement is made and the reproduction is not associated with any form of advertising. Applications for commercial reproduction shouldbe addressed to: NIHR Journals Library, National Institute for Health Research, Evaluation, Trials and Studies Coordinating Centre, Alpha House, University of Southampton SciencePark, Southampton SO16 7NS, UK.
xvii

List of abbreviations
A&E accident and emergency
AE adverse event
AOR adjusted odds ratio
AUDIT Alcohol Use Disorders IdentificationTest
BCT behaviour change technique
BMI body mass index
CACE complier average causal effect
CBT cognitive–behavioural therapy
CCG Clinical Commissioning Group
CI confidence interval
CONSORT Consolidated Standards ofReporting Trials
CP clinical psychologist
CSRI Client Service Receipt Inventory
CVD cardiovascular disease
DHSC Department of Health and SocialCare
DMEC Data Monitoring and EthicsCommittee
EQ-5D EuroQol-5 Dimensions
EQ-5D-3L EuroQol-5 Dimensions, three-levelversion
GP general practitioner
HDL high-density lipoprotein
HLF healthy lifestyle facilitator
ICC intraclass correlation coefficient
ICER incremental cost-effectiveness ratio
IMD Index of Multiple Deprivation
IQR interquartile range
IT information technology
ITT intention to treat
LDL low-density lipoprotein
MCD minimum clinically significantdifference
MI motivational interviewing
MITI Motivational InterviewingTreatment Integrity
MOVE IT enhanced MOtiVationalintErviewing InTervention
MVPA moderate to vigorous physicalactivity
NICE National Institute for Health andCare Excellence
NIHR National Institute for HealthResearch
PA physical activity
PHQ-9 Patient Health Questionnaire-9items
PI principal investigator
PPI patient and public involvement
QALY quality-adjusted life-year
RCT randomised controlled trial
REC Research Ethics Committee
SD standard deviation
SLHIEC South London Health Innovationand Education Cluster
SMS short message service
TSC Trial Steering Committee
UC usual care
DOI: 10.3310/hta23690 HEALTH TECHNOLOGY ASSESSMENT 2019 VOL. 23 NO. 69
© Queen’s Printer and Controller of HMSO 2019. This work was produced by Ismail et al. under the terms of a commissioning contract issued by the Secretary of State for Healthand Social Care. This issue may be freely reproduced for the purposes of private research and study and extracts (or indeed, the full report) may be included in professionaljournals provided that suitable acknowledgement is made and the reproduction is not associated with any form of advertising. Applications for commercial reproduction shouldbe addressed to: NIHR Journals Library, National Institute for Health Research, Evaluation, Trials and Studies Coordinating Centre, Alpha House, University of Southampton SciencePark, Southampton SO16 7NS, UK.
xix

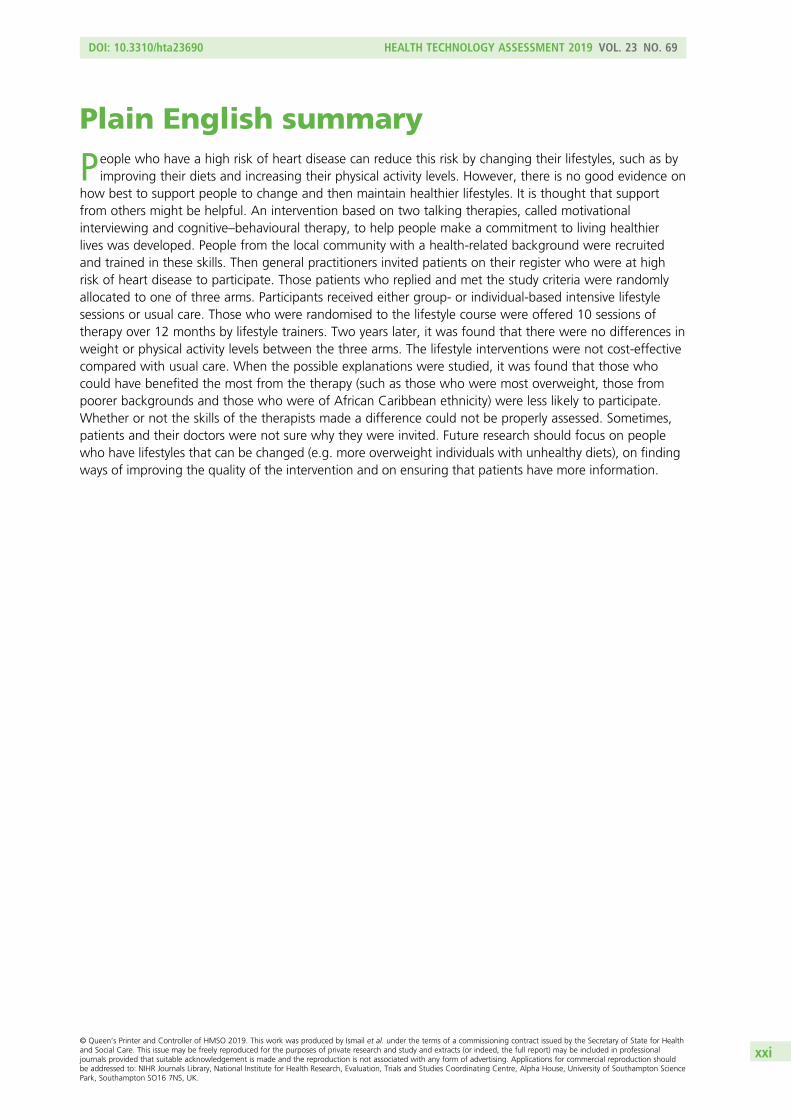
Plain English summary
People who have a high risk of heart disease can reduce this risk by changing their lifestyles, such as byimproving their diets and increasing their physical activity levels. However, there is no good evidence on
how best to support people to change and then maintain healthier lifestyles. It is thought that supportfrom others might be helpful. An intervention based on two talking therapies, called motivationalinterviewing and cognitive–behavioural therapy, to help people make a commitment to living healthierlives was developed. People from the local community with a health-related background were recruitedand trained in these skills. Then general practitioners invited patients on their register who were at highrisk of heart disease to participate. Those patients who replied and met the study criteria were randomlyallocated to one of three arms. Participants received either group- or individual-based intensive lifestylesessions or usual care. Those who were randomised to the lifestyle course were offered 10 sessions oftherapy over 12 months by lifestyle trainers. Two years later, it was found that there were no differences inweight or physical activity levels between the three arms. The lifestyle interventions were not cost-effectivecompared with usual care. When the possible explanations were studied, it was found that those whocould have benefited the most from the therapy (such as those who were most overweight, those frompoorer backgrounds and those who were of African Caribbean ethnicity) were less likely to participate.Whether or not the skills of the therapists made a difference could not be properly assessed. Sometimes,patients and their doctors were not sure why they were invited. Future research should focus on peoplewho have lifestyles that can be changed (e.g. more overweight individuals with unhealthy diets), on findingways of improving the quality of the intervention and on ensuring that patients have more information.
DOI: 10.3310/hta23690 HEALTH TECHNOLOGY ASSESSMENT 2019 VOL. 23 NO. 69
© Queen’s Printer and Controller of HMSO 2019. This work was produced by Ismail et al. under the terms of a commissioning contract issued by the Secretary of State for Healthand Social Care. This issue may be freely reproduced for the purposes of private research and study and extracts (or indeed, the full report) may be included in professionaljournals provided that suitable acknowledgement is made and the reproduction is not associated with any form of advertising. Applications for commercial reproduction shouldbe addressed to: NIHR Journals Library, National Institute for Health Research, Evaluation, Trials and Studies Coordinating Centre, Alpha House, University of Southampton SciencePark, Southampton SO16 7NS, UK.
xxi

Scientific summary
Background
Interventions targeting multiple risk factors for cardiovascular disease (CVD) are more effective thaninterventions targeting a single risk factor. Most lifestyle interventions lead to early improvements but aredifficult to maintain longer term. Motivational interviewing (MI) is associated with modest short-termimprovements in diet and physical activity (PA) and is a brief intervention. Adding behaviour changetechniques (BCTs) using cognitive–behavioural therapy (CBT) skills may support maintenance long term.Deployment of health trainers to deliver lifestyle interventions is a potentially cost-effective method toreduce health inequalities. The importance of peer learning to support lifestyle change compared withindividual support to reduce CVD risk is understudied.
Objectives
The overall purpose was to design and evaluate an intensive lifestyle intervention based on psychologicaltheory using BCTs, to reduce the risk of CVD. This would be delivered by a healthy lifestyle facilitator (HLF)employed from the local community.
Primary objectivesTo assess whether or not MOVE IT (enhanced MOtiVational intErviewing InTervention), delivered in either(1) a group or (2) an individual format, is more effective than usual care (UC) in reducing weight andincreasing PA 24 months later.
Secondary objectives
l To assess whether or not group MOVE IT is more effective than the individual format in reducingweight and increasing PA 24 months later.
l To assess whether or not MOVE IT, delivered in either (1) a group or (2) an individual format, is moreeffective than UC in reducing low-density lipoprotein (LDL) cholesterol and reducing CVD risk score24 months later.
l To compare the number of fatal or non-fatal cardiovascular events, and other recorded adverse events(AEs), per treatment allocation.
l Cost-effectiveness: to assess whether or not MOVE IT, delivered in either (1) a group or (2) an individualformat, is more cost-effective than UC, in terms of quality-adjusted life-years (QALYs) gained over the24-month follow-up period.
l To conduct a process evaluation to understand the mechanisms of action of the intervention byassessing mediation, participation bias, competency and fidelity of the intervention, and participant andtherapist experience.
Methods
SettingThe study was set in 12 South London Clinical Commissioning Groups aiming to capture socioeconomicand ethnic diversity. General practices with list sizes of > 5000 patients were invited to participate.
DOI: 10.3310/hta23690 HEALTH TECHNOLOGY ASSESSMENT 2019 VOL. 23 NO. 69
© Queen’s Printer and Controller of HMSO 2019. This work was produced by Ismail et al. under the terms of a commissioning contract issued by the Secretary of State for Healthand Social Care. This issue may be freely reproduced for the purposes of private research and study and extracts (or indeed, the full report) may be included in professionaljournals provided that suitable acknowledgement is made and the reproduction is not associated with any form of advertising. Applications for commercial reproduction shouldbe addressed to: NIHR Journals Library, National Institute for Health Research, Evaluation, Trials and Studies Coordinating Centre, Alpha House, University of Southampton SciencePark, Southampton SO16 7NS, UK.
xxiii
Study criteriaThe case definition includes adults aged 40–74 years who screen as positive for high CVD risk and whoare not known to have CVD or to be on the diabetes mellitus, kidney, atrial fibrillation or stroke registers.The QRISK®2 score (QResearch, Nottingham, UK) was used to identify those with a CVD risk score of≥ 20%, indicating the chance of having a fatal or non-fatal cardiovascular event over the next 10 years.
The inclusion criteria were being fluent in conversational English, having permanent residency andplanning to stay in the UK for at least three-quarters of the year.
The exclusion criteria were having established CVD; having a pacemaker; being on a register for diabetesmellitus, kidney disease, atrial fibrillation or stroke; having chronic obstructive pulmonary disease; havinga disabling neurological disorder; having a severe mental illness; being registered blind; being houseboundor resident in a nursing home; not being ambulatory; having more than three falls in the previous year;pregnancy; having advanced cancer; having morbid obesity (body mass index of ≥ 50 kg/m2); or currentlyparticipating in a weight-loss programme.
Sample sizeA conservative effect size of 0.25 was selected, which translates to a difference between two arms of675 steps per day (PA), 1.25 kg of weight and total cholesterol of 0.25 mmol/l at the 24-month follow-up.Clustering effect within the arm was taken into account. A sample size of 1420 participants was needed todetect these differences with a two-tailed alpha of 0.025. Assuming an approximate dropout rate of 20%,1704 participants (648 in the group intervention arm and 528 each in the individual intervention and UCarms, accounting for the dropout rate) were needed.
Baseline measuresSociodemographic data, family history of CVD, biomedical data, QRISK2 score, smoking status, alcoholintake, PA [measured objectively using the ActiGraph GT3X accelerometer (ActiGraph, Pensacola, FL, USA)and using self-report scales], diet (measured using a standardised multiple-pass 24-hour dietary recallquestionnaire), depressive symptoms (measured using the nine-item Patient Health Questionnaire), illnessperceptions, and self-efficacy for changing PA and dietary habits were collected.
Randomisation and allocation concealmentParticipant randomisation was conducted by the data manager from an independent clinical trials unit(King’s College London) using computer-generated randomisation blocks. In each block, 10 participantswere randomised to the group intervention arm, individual intervention arm or UC in a 4 : 3 : 3 ratio. It wasnot possible to conceal the allocation to the participants or the HLFs post randomisation, but assessorswere blind to the allocation for the primary and secondary outcomes.
Planned interventionsArm 1 received UC only. General practitioners participating in the study were expected to follow their localNHS Health Check pathway for those who have a CVD risk score of ≥ 20%.
Arm 2 received UC and enhanced MI in a group format. The intervention was based on the theory ofplanned behaviour and delivered using principles and techniques from MI, CBT and social cognitive theory.A training manual, an intervention curriculum and a participant workbook were developed. The interventionconsisted of 10 sessions, plus an introductory session, over 12 months. The intensive phase consists ofsix weekly sessions at the beginning of the first quarter. The maintenance phase consists of four sessionsdelivered at 3, 6, 9 and 12 months. Abraham and Michie’s BCT taxonomy was used to classify the specifictechniques.
Arm 3 received UC and enhanced MI in an individual format. This was the same as arm 2 except that thecomponents were delivered individually (one to one).
SCIENTIFIC SUMMARY
NIHR Journals Library www.journalslibrary.nihr.ac.uk
xxiv
Measurement of outcomesThe primary outcomes are change in weight (kg) and PA (average number of steps per day assessed byaccelerometry) between arms. Secondary outcomes are change in LDL cholesterol and CVD risk score,dietary habits, health beliefs and depression.
The EuroQol-5 Dimensions was used to generate QALYs for use in the economic analyses. Interventioncosts were calculated and service use was measured at baseline and at the 12- and 24-month follow-upassessments using an adapted Client Service Receipt Inventory.
Statistical analysis planAnalysis and reporting was in line with the Consolidated Standards of Reporting Trials (CONSORT) guidelines.Primary analyses were on an intention-to-treat basis. The differences in treatment effect between the threearms at 12 and 24 months of this partially nested design were analysed using mixed-effects models withpre-randomisation values as a covariate. Sensitivity analysis included adjusting for potential baseline variablesof age, sex, Index of Multiple Deprivation, education, marital status, smoking status and missing data. Thereare no formal stopping rules.
Health-care costs were compared between the three arms using bootstrapping methods to estimate 95%confidence intervals (CIs) around the mean cost differences.
Process evaluationThe main outcome measures were a quantitative assessment of participation bias (reach), quantitativeassessment of the competency (and also fidelity) of the intervention and patient and therapist experiencesof the process of change.
Adverse eventsParticipants receiving the intervention were able to report AEs at any time during the intervention period tothe HLF and this information was routinely collected at 12 and 24 months.
Results
This three-arm parallel randomised controlled trial tested the effectiveness of an enhanced MI intervention,delivered by specially trained health trainers (HLFs), in a group format versus an individual format, andversus UC, for reducing weight and increasing PA in adults at high risk (≥ 20.0%) of developing CVD inthe next 10 years. The mean age of participants was 69.75 years (4.11 years), 85.5% were male and89.4% were white, with baseline characteristics being similar between the three arms.
There were only minor and non-significant differences between treatment arms in PA at 12 or 24 months.Participants in the individual intervention arm walked a mean of 210 steps (95% CI –19.5 to 439.9 steps)more at 12 months than UC participants and those in the group intervention arm walked a mean of 131steps (95% CI –85.3 to 347.5 steps) more at 12 months than UC participants. All differences (including limitsof the 95% CIs) were less than the minimum clinically significant difference (MCD) of 675 steps as definedin the study protocol. Similarly, at the 12-month follow-up and using 97.5% CIs, minor and non-significantdifferences in the mean number of steps between the individual and UC arms (210.22 steps, 97.5% CI–52.44 to 472.89 steps) and the group and UC arms (131.10 steps, 97.5% CI –116.35 to 378.55 steps)were observed.
For weight, there was a small but significant mean difference between the individual and UC arms of–0.55 kg (95% CI –0.95 to –0.14 kg) and between the group and UC arms of –0.52 kg (95% CI –0.90 to–0.13 kg). However, the mean differences (including the 95% CI limits) are below the MCD of 1.25 kg.There was no mean difference between the group and individual intervention arms (–0.03 kg, 95% CI–0.43 to 0.37 kg). At 24 months, no significant mean differences were observed. Similarly, at the 12-month
DOI: 10.3310/hta23690 HEALTH TECHNOLOGY ASSESSMENT 2019 VOL. 23 NO. 69
© Queen’s Printer and Controller of HMSO 2019. This work was produced by Ismail et al. under the terms of a commissioning contract issued by the Secretary of State for Healthand Social Care. This issue may be freely reproduced for the purposes of private research and study and extracts (or indeed, the full report) may be included in professionaljournals provided that suitable acknowledgement is made and the reproduction is not associated with any form of advertising. Applications for commercial reproduction shouldbe addressed to: NIHR Journals Library, National Institute for Health Research, Evaluation, Trials and Studies Coordinating Centre, Alpha House, University of Southampton SciencePark, Southampton SO16 7NS, UK.
xxv
follow-up and using 97.5% CIs, minor mean differences between the individual and UC arms (–0.55 kg,97.5% CI –1.01 to –0.08 kg) and the group and UC arms (–0.52 kg, 97.5% CI –0.96 to –0.08 kg) wereobserved.
It was found that there was no treatment effect for any of the secondary outcomes at either follow-uppoint. There were no differences in the number of fatal or non-fatal cardiovascular events and otherrecorded AEs between the three treatment arms.
The health economic results revealed that there was little difference in terms of service use and costs betweenthe three arms other than those resulting from the interventions themselves. Total service costs over thefollow-up period were highest for the individual intervention arm, followed by the group intervention arm,and then followed by the UC arm. Differences were not statistically significant. QALYs were very similarfor each arm. The group intervention was dominated by UC, which had lower costs and produced moreQALYs. The individual intervention did produce more QALYs than UC but the incremental cost-effectivenessratio indicated a cost per QALY far in excess of the threshold commonly used by NICE. For this reason,neither form of the intervention was cost-effective. There was much uncertainty around the cost andoutcome differences but the conclusion of a lack of cost-effectiveness holds.
Process evaluation results
MediatorsIt was found that dietary changes did not mediate any treatment effects on the primary outcomes. Furthermediational analyses were not conducted, as there was no change in the primary or secondary outcomes.
Participation biasIt was found there was significant evidence of reduced reach, in that those patients with higher CVD risk,higher levels of deprivation status and of African Caribbean ethnicity were less likely to reply to invitationsfrom their general practice to participate in this trial.
Fidelity analysisThere were significant methodological limitations of conducting a fidelity analysis because of internetoutage resulting in the loss of all audio data. From data retrieved from elsewhere, consisting of a highlyselected sample, there was evidence that nearly all of the HLFs had sufficient competencies in at least oneMI skillset.
Patient experienceThe main themes that emerged were (1) perceived benefits of the study (benefits of increased healthawareness, positive lifestyle changes and the opportunity to learn from others); (2) factors enhancingbehaviour change (continuity of sessions over a longer period and having continuity of the same HLF);and (3) perceived risk of CVD (this was lower than was expected). One further theme that emergedsolely for the non-completers was (4) potential barriers to change, such as lack of feedback, andovercoming these barriers.
Therapist experienceThe overall view was that the formal training period could have been shortened, with more exposureto training cases, and that the HLFs had not been prepared for the real-world challenges once in theclinical setting. They perceived themselves as competent in the MI approach and BCT. They observedthe importance of working with patients towards their goals but there were some common challenges,such as patients not engaging and some of the intervention materials not being deemed age-appropriate.The HLFs felt that support from supervisors, and administrative support, was insufficient but that theycould problem-solve by supporting each other.
SCIENTIFIC SUMMARY
NIHR Journals Library www.journalslibrary.nihr.ac.uk
xxvi
Conclusions
This study suggests that an intensive lifestyle intervention using BCTs based on MI and CBT is not effectivein reducing weight and increasing PA in a population-based sample of people at high risk of CVD. Thereason may be that the study did not reach those with modifiable CVD risk factors as this sample consistedof predominantly older males. This suggests that the QRISK2 engine on its own is not suitable for identifyingthose patients most likely to benefit from intensive lifestyle interventions. Further research should focus oninterventions for those subgroups most at risk who are less likely to participate in lifestyle interventions(people of African Caribbean ethnicity or in low socioeconomic settings) or who have a higher proportionof modifiable CVD risk factors (evidence of being overweight or having high lipids levels).
Trial registration
This trial is registered as ISRCTN84864870.
Funding
Funding for this study was provided by the Health Technology Assessment programme of the NationalInstitute for Health Research (NIHR). This research was part-funded by the NIHR Biomedical ResearchCentre at South London and Maudsley NHS Foundation Trust and King’s College London.
DOI: 10.3310/hta23690 HEALTH TECHNOLOGY ASSESSMENT 2019 VOL. 23 NO. 69
© Queen’s Printer and Controller of HMSO 2019. This work was produced by Ismail et al. under the terms of a commissioning contract issued by the Secretary of State for Healthand Social Care. This issue may be freely reproduced for the purposes of private research and study and extracts (or indeed, the full report) may be included in professionaljournals provided that suitable acknowledgement is made and the reproduction is not associated with any form of advertising. Applications for commercial reproduction shouldbe addressed to: NIHR Journals Library, National Institute for Health Research, Evaluation, Trials and Studies Coordinating Centre, Alpha House, University of Southampton SciencePark, Southampton SO16 7NS, UK.
xxvii

Chapter 1 Introduction
Epidemiology of cardiovascular disease and its risk factors
Cardiovascular disease (CVD) is the leading cause of mortality, morbidity and disability in the UK and inother developed countries.1 However, many of the major determinants of CVD are modifiable, includingtobacco smoking, a diet high in saturated fat, high low-density lipoprotein (LDL) cholesterol, obesity,a sedentary lifestyle, hypertension and diabetes mellitus.2–6 Lower educational attainment and lowersocioeconomic status are associated with a greater risk of CVD, and this association is strongest forfemales.7 The risk of CVD varies markedly between ethnic groups, with a higher rate of ischaemic heartdisease in those of South Asian ethnicity and a higher rate of cerebrovascular disease in those of Africanethnicity among those living in England and Wales.8
Although CVD remains the most common cause of death in developed nations, mortality rates havebeen falling. Between 1981 and 2000, CVD mortality in the UK fell by 62% in men and 45% in women.9
Cohort studies and prediction models suggested that a fall in the prevalence of tobacco smoking, adecline in population blood pressure levels and changes in cholesterol levels were important contributors.9,10
Population-wide changes in modifiable risk factors, such as dietary intake, can bring about substantialbenefits and further changes in blood lipids, particularly reductions in levels of non-high-density lipoprotein(HDL) cholesterol.10 However, limited changes in physical activity (PA) and rising levels of obesity havelimited the decline in CVD mortality.10 Further efforts are therefore needed to bring about positive changes,particularly in diet, obesity and PA.
Cardiovascular risk identification
The NHS in England introduced the Health Check programme in 2009 as part of the Department of Healthand Social Care (DHSC)’s long-term vision for the future of public health in England.11 In offering HealthChecks to all those aged 40–74 years without a known diagnosis of CVD, the aim is to prevent heartdisease, stroke, diabetes mellitus and kidney disease and to reduce health inequalities. The risk assessmentincludes collection of demographic data, smoking status, cholesterol level, blood pressure and diabetesmellitus status. An individualised risk management plan is given in accordance with the assessment tosupport lifestyle changes, such as referral to smoking cessation sessions, exercise prescriptions, lifestyleadvice and signposting to local resources.
A lower-than-anticipated coverage of NHS Health Checks has been reported,12 with regional variations inattendance ranging from 27% to 52%,12 with greater uptake in patients of older age and in regions oflower deprivation.13 Reductions in CVD risk have been reported for those attending Health Checks;14
however, a systematic review of the implementation of Health Checks found no reduction in mortality ormorbidity.15 The programme has attracted criticism owing to a lack of an up-to-date evidence base andClinical Commissioning Groups (CCGs) lacking the resources to implement them.16
Several risk algorithms have been developed and validated to estimate the risk of developing CVD basedon known risk factors; these risk algorithms include the Framingham Risk Score,17 the ASSIGN score,18
QRISK®19 and QRISK®220 (both QResearch, Nottingham, UK). The latter is now recommended by theNational Institute for Health and Care Excellence (NICE) for the identification of people at risk of CVDup to the age of 84 years in England.21 The QRISK2 algorithm takes into account self-report ethnicity,deprivation and other relevant clinical conditions, and is updated annually to reflect changes in clinicalevidence, data recording and population demographics. Once a high CVD risk is ascertained, the primaryprevention of CVD is recommended via lifestyle advice and interventions.
DOI: 10.3310/hta23690 HEALTH TECHNOLOGY ASSESSMENT 2019 VOL. 23 NO. 69
© Queen’s Printer and Controller of HMSO 2019. This work was produced by Ismail et al. under the terms of a commissioning contract issued by the Secretary of State for Healthand Social Care. This issue may be freely reproduced for the purposes of private research and study and extracts (or indeed, the full report) may be included in professionaljournals provided that suitable acknowledgement is made and the reproduction is not associated with any form of advertising. Applications for commercial reproduction shouldbe addressed to: NIHR Journals Library, National Institute for Health Research, Evaluation, Trials and Studies Coordinating Centre, Alpha House, University of Southampton SciencePark, Southampton SO16 7NS, UK.
1
The evidence for increasing physical activity
Physical inactivity increases mortality and the risk of diseases such as CVD and diabetes mellitus.22 TheDHSC advises adults to perform ≥ 30 minutes of at least moderate-intensity PA on ≥ 5 days per week,in ≥ 10-minute bouts, for optimum health benefits.23 Walking is the most common form of PA in adultsand is associated with reductions in CVD and all-cause mortality, and walking pace is a stronger predictorof improved outcomes than walking duration.24 Walking is promoted as a near-perfect exercise as it hasthe lowest risk of harm and is now included in UK public health policy.25,26
However, the proportion of those achieving PA recommendations is low, particularly when objectivemeasures are used to assess PA. In England, 39% of men and 29% of women self-report achievingthe recommended PA levels, but objective assessment of PA using accelerometers in a subsample of theHealth Survey for England found that only 5% of men and 4% of women aged 35–64 years achieved therecommended levels.27
Systematic reviews and meta-analyses report moderate positive short-term increases in PA followinglifestyle interventions, in either a group or an individual format, but findings are limited because moststudies used self-report measures.28,29 Evidence for brief PA interventions suggests improvement in PA inthe short term, but there is limited evidence for the long-term impact, cost-effectiveness and deliverabilityin a primary care setting.30,31 A review of 32 trials reported that walking interventions led to improvementin a number of cardiovascular risk factors, including blood pressure and weight, but not in lipids.32 Themajority of the reviewed intervention trials recruit motivated volunteers and report low response rates,which may limit the representativeness of observed findings.
The contents of assessed interventions to promote PA differ significantly, but social support andcognitive–behavioural therapy (CBT) strategies, rather than health education alone, are recommendedin older adults.33 The use of pedometers as a method of self-monitoring can increase PA and improvehealth in the short term.34 Compared with usual care (UC), the use of pedometers and a brief walkingintervention in primary care led to improvements in 12-month PA in a sample of adults not achieving therecommended activity levels at baseline.35 The intervention was as effective when delivered by post aswhen delivered by nurses in primary care, suggesting that PA can be improved in physically inactivepatients with minimal resources. Details of the components used in trials of interventions to promote PA,including information on the behaviour change techniques (BCTs) used, are recommended to improveimplementation and evidence syntheses.29,36
The evidence for dietary interventions
Modest beneficial changes to dietary intake, specifically changes to fat, fibre, fruit and vegetable intake,are found following healthy diet interventions in primary care, but there is variability in intervention designand delivery as well as the methodological quality of previous studies.37 Based on the limited evidenceavailable, estimates of the cost-effectiveness of dietary interventions in primary care suggest that interventionsneed to be targeted towards the older population at greatest risk of disease to be cost-effective.38
A systematic review of randomised controlled trials (RCTs) assessing generic dietary advice for reducingCVD risk found modest beneficial effects on mean total and LDL cholesterol levels and small reductions inblood pressure up to 12 months later, suggesting that dietary advice may contribute to an improved CVDrisk profile.39 However, the longer-term effects of dietary interventions are unknown owing to limitedfollow-up periods of reviewed studies. Compared with UC, dietary interventions produce modest weightlosses that diminish over time.40 Further work is needed to understand how the modest benefits of dietaryinterventions may be maintained.
INTRODUCTION
NIHR Journals Library www.journalslibrary.nihr.ac.uk
2
The evidence for motivational interviewing
Motivational interviewing (MI) is a common approach to behaviour change in health care, defined as acollaborative, goal-oriented style of communication with particular emphasis on the language of change.41
It is designed to strengthen motivation for and commitment to a specific behavioural goal by eliciting andexploring personal reasons for change within an atmosphere of acceptance and compassion.42 The appealof MI is that it is brief, can be delivered by a range of health-care providers, has a competency frameworkand can be applied to a range of health-care settings, with evidence of benefits to health outcomes whencompared with other interventions.43
Systematic reviews and meta-analyses have demonstrated significant, moderate effects of MI on diet andexercise behaviours,44 as well as on health outcomes such as reduced weight, cholesterol and bloodpressure, although the number of trials is small.45,46 However, a systematic review of MI used in lifestyleinterventions for people at risk or with a diagnosis of CVD found little evidence of the benefits of MI,noting the considerable variability between interventions and the outcomes measured and that few haveincluded a long-term follow-up to assess whether or not any observed benefits are sustained.47 A 14-monthfollow-up of diabetic patients who had received a MI lifestyle intervention found no benefits in lifestyle,biomedical or psychological outcomes compared with UC.48 A RCT with a 12-month postinterventionfollow-up period found that the benefits of up to five MI sessions delivered over a period of 6 months onwalking and cholesterol levels were maintained in a sample of overweight or obese patients, but otherCVD risk factor outcomes were not maintained.49 Effects were stronger for those found to be at higherrisk at baseline, suggesting that interventions should target high-risk patients to achieve the best results.
A taxonomy of behaviour change techniques
The limitations of current models of lifestyle interventions, particularly their short-term effects, have led toa search for more sophisticated and targeted behavioural interventions.50 A Cochrane Database SystematicReview of multiple risk factor interventions for the primary prevention of coronary heart disease observedthat techniques based on instruction and information were associated with small improvements in lipidlevels and blood pressure, especially when embedded in a theoretical framework related to behaviourchange.51 A systematic review of behavioural interventions found that the techniques most effective inimproving diet and PA were based on self-regulatory behaviours, such as goal-setting, self-monitoring,giving feedback, utilising social support and MI.52 Interventions based on a psychological theory, such asthe theory of planned behaviour,53 were more effective, as were those for high-risk populations. There isless evidence to support the case for any minimum threshold of intensity, mode of delivery, interventionprovider and setting;50–52 therefore, further study is required to understand how the benefits of behaviouralinterventions on lifestyle and health outcomes can be maintained. Evaluating interventions in the contextof a taxonomy of BCTs and an intervention map offers a framework that is easier to teach, test, replicateand translate.52–54
In a pilot RCT, a group intervention developed in line with evidence of the most effective BCTs52 led toreductions in weight, when co-interventions and comorbidities were controlled for, but did not increasePA at the 12-month follow-up in people at high risk of CVD, compared with UC.55 As this was a pilot RCT,the authors note that the intervention was acceptable to participants and that outcomes could beimproved by adapting the intervention accordingly. The effects of the group-based setting were notcompared with a one-to-one setting, and there is little evidence in the literature on the differencesbetween group and individual approaches. It has been found that the benefits of group sessions outweighindividual sessions even when it is not preferred by participants,56 and that group sessions are highlyvalued by participants.57 However, it is also reported that at least one individual session is critical to thesuccess of interventions and in ameliorating disengagement in some participants.57,58 The variability inpatient samples involved in these studies, the intervention delivered and the methodology of each studylimit the generalisability of the findings.
DOI: 10.3310/hta23690 HEALTH TECHNOLOGY ASSESSMENT 2019 VOL. 23 NO. 69
© Queen’s Printer and Controller of HMSO 2019. This work was produced by Ismail et al. under the terms of a commissioning contract issued by the Secretary of State for Healthand Social Care. This issue may be freely reproduced for the purposes of private research and study and extracts (or indeed, the full report) may be included in professionaljournals provided that suitable acknowledgement is made and the reproduction is not associated with any form of advertising. Applications for commercial reproduction shouldbe addressed to: NIHR Journals Library, National Institute for Health Research, Evaluation, Trials and Studies Coordinating Centre, Alpha House, University of Southampton SciencePark, Southampton SO16 7NS, UK.
3
By enhancing a MI approach with effective BCTs, the modest effect sizes of each may lead to improvementin outcomes. In people with type 1 diabetes mellitus, four sessions of MI alone was not associated withimproved glycaemic control, but four sessions of MI followed by eight sessions of CBT was associatedwith improved glycaemic control, compared with UC.59 However, the effects were not maintained after12 months,60 and participants stated that MI helped them to become more ready to change their behaviourbut that further support was needed to implement the change.61 The evidence for enhancing MI with CBT isnot consistent, as the landmark COMBINE (Combined Pharmacotherapies and Behavioural Interventions forAlcohol Dependence) study did not demonstrate increased abstinence from alcohol in those receiving thepsychological intervention.62
The role of health trainers
The DHSC recommended the deployment of health trainers into the most deprived areas of the UK ina White Paper published in 2004.63 A health trainer is employed by the NHS from the local communityin which they serve to provide lifestyle advice to those at risk of disease, with the overall aim of theprogramme being to address health inequalities, an important issue within multi-ethnic and variablydeprived settings.64 The role involves identifying clients from hard-to-reach and disadvantaged groups,providing one-to-one support in identifying potential problems in lifestyles, setting goals, supportingbehaviour change and reviewing client progress.65 The health trainer programme has been found toincrease uptake of NHS Health Checks, particularly in men, younger age groups and those from lessaffluent areas.66
A comprehensive review of interventions delivered by lifestyle advisors found little evidence of the benefitsof interventions promoting healthy diet and/or increased PA in North American trials; there was no effecton weight and little evidence of improvement in PA levels, but the intervention contents, delivery andgoals varied considerably.67 A review of the available evidence on the NHS health trainer programmethus far indicates positive outcomes and acceptability, but critics argue that the models of service provisionare varied, evaluations have included no comparator group and there is a lack of evidence for themaintenance of behaviour change.68 A health trainer programme for CVD risk reduction in patients withat least one CVD risk factor found significant reductions in CVD risk after 12 months for only those whowere identified as being at high risk of CVD (a Framingham Risk Score for CVD of ≥ 20.0%) at baseline.69
The service also led to high levels of behavioural goal achievement and small, but significant, increases inquality of life. However, as this was a service evaluation there was no comparator group and achievementof behavioural goals was self-reported and unrelated to changes in CVD risk. Further work is neededto assess the potential for health trainers to deliver complex behavioural interventions, including theemployment of objective outcome measures, the assessment of maintenance of behavioural change andclinical benefits, and comparison of outcomes with a control group.
The case for an enhanced motivational interviewing intervention
At the population level, the potential benefits of reducing weight and increasing PA in those who are at riskof CVD are considerable. Modest, short-term beneficial effects of various behaviour change interventionsfor the primary prevention of CVD emphasise the need for more complex, targeted interventions andRCTs that assess long-term benefits. MI provides broad appeal for its collaborative patient-centred style,evidence base and deliverability, and by enhancing a MI approach with the specific BCTs that have thestrongest evidence, and incorporating techniques designed to enhance maintenance, observed outcomesmay be improved. The relative effectiveness of a group intervention versus an individual interventionremains uncertain, but the former offers social support and may be more cost-effective, if it is acceptableto participants. Health trainers may improve the acceptability of interventions to harder-to-reach populationsand positive outcomes have been reported in health trainer programmes thus far. The investigation of the
INTRODUCTION
NIHR Journals Library www.journalslibrary.nihr.ac.uk
4
potential for a health trainer to deliver more sophisticated interventions, and for the effects to be comparedwith UC in a RCT setting, is yet to be undertaken.
The overall aim was to compare the effectiveness of MOVE IT (enhanced MOtiVational intErviewingInTervention), which integrates MI with CBT BCTs, in reducing weight and increasing PA in those at highrisk of CVD over 24 months across three arms: (1) enhanced MI in a group format versus (2) in anindividual format versus (3) UC. The primary interest was whether or not MOVE IT in a group format wasmore effective and cost-effective than the individual format or UC because of its potential for social support.
DOI: 10.3310/hta23690 HEALTH TECHNOLOGY ASSESSMENT 2019 VOL. 23 NO. 69
© Queen’s Printer and Controller of HMSO 2019. This work was produced by Ismail et al. under the terms of a commissioning contract issued by the Secretary of State for Healthand Social Care. This issue may be freely reproduced for the purposes of private research and study and extracts (or indeed, the full report) may be included in professionaljournals provided that suitable acknowledgement is made and the reproduction is not associated with any form of advertising. Applications for commercial reproduction shouldbe addressed to: NIHR Journals Library, National Institute for Health Research, Evaluation, Trials and Studies Coordinating Centre, Alpha House, University of Southampton SciencePark, Southampton SO16 7NS, UK.
5

Chapter 2 Research objectives
The following material has been primarily reproduced from our published study protocol, Bayley et al.70
This is an Open Access article distributed in accordance with the terms of the Creative CommonsAttribution (CC BY 4.0) license, which permits others to distribute, remix, adapt and build upon this work,for commercial use, provided he original work is properly cited. See: http://creativecommons.org/licenses/by/4.0/. The text below includes minor additions and formatting changes to the original text.
The purpose of this study was to design and evaluate MOVE IT for people at high risk of CVD, to bedelivered by a healthy lifestyle facilitator (HLF) employed from the local community and trained in theintervention. We opted for the job title of HLF, rather than health trainer or lifestyle advisor, as this wasthought to better reflect the principles of collaborative work underpinning MI.
Primary objective
To assess whether or not MOVE IT delivered in either a (1) group or (2) individual format is more effectivethan UC in reducing weight (kg) and increasing PA (average number of steps per day assessed viaaccelerometry) 24 months later.
Secondary objectives
l To assess whether or not group MOVE IT is more effective than the individual format in reducing weightand increasing PA 24 months later.
l To assess whether or not MOVE IT, delivered in either (1) a group format or (2) an individual format,is more effective than UC in reducing LDL cholesterol and in reducing CVD risk score 24 months later.
l To compare the number of fatal or non-fatal cardiovascular events, and other recorded adverse events(AEs), per treatment allocation.
l Cost-effectiveness: to assess whether or not MOVE IT delivered in either (1) a group format or (2) anindividual format is more cost-effective than UC, in terms of quality-adjusted life-years (QALYs) gainedover the 24-month follow-up period.
l Process evaluation: using mixed methods, we conducted the following –
¢ Mediational analysis: to examine whether or not changes in behavioural and psychological factors,such as dietary intake, health beliefs, depressive symptoms and self-efficacy, mediate the associationbetween the intervention and outcomes.
¢ Participation bias: to assess whether or not the RCT recruited those it intended, we assessed theparticipation bias by comparing the sociodemographic characteristics and QRISK2 scores of thosewho responded to the invitation to participate and those who did not.
¢ Fidelity analysis: to assess whether or not MOVE IT was delivered in accordance with the manualand to compare whether or not the levels of competencies among the HLFs were associated withvariations in outcomes using thematic contents analysis of sessions.
¢ Participant and therapist experience: using qualitative methods, we describe the perceivedexpectations, benefits, strengths and limitations of the intervention from the patient andintervention provider perspective.
DOI: 10.3310/hta23690 HEALTH TECHNOLOGY ASSESSMENT 2019 VOL. 23 NO. 69
© Queen’s Printer and Controller of HMSO 2019. This work was produced by Ismail et al. under the terms of a commissioning contract issued by the Secretary of State for Healthand Social Care. This issue may be freely reproduced for the purposes of private research and study and extracts (or indeed, the full report) may be included in professionaljournals provided that suitable acknowledgement is made and the reproduction is not associated with any form of advertising. Applications for commercial reproduction shouldbe addressed to: NIHR Journals Library, National Institute for Health Research, Evaluation, Trials and Studies Coordinating Centre, Alpha House, University of Southampton SciencePark, Southampton SO16 7NS, UK.
7

Chapter 3 Methods
The following material has been primarily reproduced from our published study protocol, Bayley et al.70
This is an Open Access article distributed in accordance with the terms of the Creative CommonsAttribution (CC BY 4.0) license, which permits others to distribute, remix, adapt and build upon this work,for commercial use, provided he original work is properly cited. See: http://creativecommons.org/licenses/by/4.0/. The text below includes minor additions and formatting changes to the original text. The revisedprotocol was published before recruitment ended.70
Trial design
This was a three-arm parallel RCT for individuals at high risk of CVD. The three arms were (1) UC and enhancedMI in a group format, (2) UC and enhanced MI in an individual format and (3) UC. As participants in the groupintervention arm, but not in the other two arms, were clustered within groups, this trial has a partially clustered(or nested) design. Interventions were delivered in 10 sessions across a period of 12 months. Participants werefollowed up at 12 and 24 months from baseline.
Ethics approval and research governanceThe Dulwich Research Ethics Committee (REC) (reference number 12/LO/0917) granted ethics approval.The trial was registered with an International Standard Randomised Controlled Trial Number(ISRCTN84864870).
SettingThe study was set in 12 South London CCGs (Bexley, Bromley, Croydon, Greenwich, Kingston, Lambeth,Lewisham, Merton, Richmond, Southwark, Sutton and Wandsworth) that are linked to each other by theSouth London Health Innovation and Education Cluster (SLHIEC) and inherent in this infrastructure is anefficient method for recruitment. South London has additional advantages: the population is approximately3 million;71 nearly one-quarter of the population is African, Caribbean or South Asian; it spans the rangeof population densities, urbanisation and socioeconomic profiling; the development of a Health InnovationNetwork in South London can allow for rapid dissemination of research findings; and research resourcescan be shared across adjacent CCGs during periods of varying workload. General practices with list sizesof > 5000 patients were invited to take part, representing approximately 60% of all practices within theSLHIEC.
Eligibility criteriaThe following eligibility criteria were used by general practitioners (GPs) during the initial search for eligiblepatients. In addition, exclusions were made following patient response to the invitation when the researchassistant found that the patient did not meet the following criteria. When in any doubt, the opinion andapproval of the patient’s GP was sought.
The inclusion criteria were:
l being aged ≥ 40 years and ≤ 74 yearsl having a CVD risk score of ≥ 20.0%, calculated using QRISK2, a validated predictive tool for identifying
the percentage risk of having a fatal or non-fatal cardiovascular event in the next 10 years72
l being fluent in conversational Englishl being permanently resident and planning to stay in the UK at least three-quarters of a year.
DOI: 10.3310/hta23690 HEALTH TECHNOLOGY ASSESSMENT 2019 VOL. 23 NO. 69
© Queen’s Printer and Controller of HMSO 2019. This work was produced by Ismail et al. under the terms of a commissioning contract issued by the Secretary of State for Healthand Social Care. This issue may be freely reproduced for the purposes of private research and study and extracts (or indeed, the full report) may be included in professionaljournals provided that suitable acknowledgement is made and the reproduction is not associated with any form of advertising. Applications for commercial reproduction shouldbe addressed to: NIHR Journals Library, National Institute for Health Research, Evaluation, Trials and Studies Coordinating Centre, Alpha House, University of Southampton SciencePark, Southampton SO16 7NS, UK.
9
The exclusion criteria were:
l having established CVD (including congenital heart disease, angina, myocardial infarction,coronary revascularisation procedures, peripheral artery disease, coronary artery bypass graftor angioplasty)
l having a pacemakerl being on a register for diabetes mellitus, kidney disease, atrial fibrillation or stroke (either ischaemic or
haemorrhagic, including transient ischaemic attacks)l having chronic obstructive pulmonary diseasel having a disabling neurological disorderl having a severe mental illness such as psychosis, a learning disability, dementia or cognitive
impairmentl being registered blindl being housebound or resident in a nursing homel being unable to move about independently or not being ambulatoryl having more than three falls in the previous yearl being pregnantl having advanced cancerl being morbidly obese [body mass index (BMI) of > 50 kg/m2]l currently participating in a weight-loss programmel living in the same household as another participant who was already randomised.
Sample sizeThe power calculation of our main outcome variables is based on the findings of previous research.34,73
We selected a very conservative effect size of 0.25, expressed as the difference in units of pooled standarddeviations (SDs), which translates to an ability to detect differences between two arms of 675 steps perday, 1.25 kg of weight and total cholesterol of 0.25 mmol/l. Our study was powered to detect changesthat may be modest at the individual level but that would have an important impact if occurring at thepopulation level.74
We took into account clustering effect within the group intervention [intraclass correlation coefficient (ICC)of 0.05] by calculating the optimal sample size in presence of differential clustering effects.75 A samplesize of 1420 participants in total was needed to detect these differences in our primary hypotheses, anda two-tailed alpha of 0.025 was used to take account of multiple comparisons for ‘individual versus UC’,‘group versus UC’ and ‘group versus individual’. Assuming an approximate 17% loss to follow-up, a totalsample size of 1704 was calculated.
Recruitment
Invitation procedureParticipating general practices screened primary care databases for eligible patients using either EMIS(EMIS Health, Leeds, UK) or Vision (In Practice Systems, London, UK) medical records systems, two ofthe clinical software programmes most commonly used in UK primary care. Patients who met theeligibility criteria were invited to participate via a standardised letter from their general practice, whichwas posted along with a participant information sheet. A prepaid return envelope was included forthe return of a reply slip, for the patient to express interest to take part, to the main study centre. Afterthe patient had given permission to be contacted, a research assistant made telephone contact with thepatient to confirm that they met all eligibility criteria and to schedule a first appointment.
METHODS
NIHR Journals Library www.journalslibrary.nihr.ac.uk
10
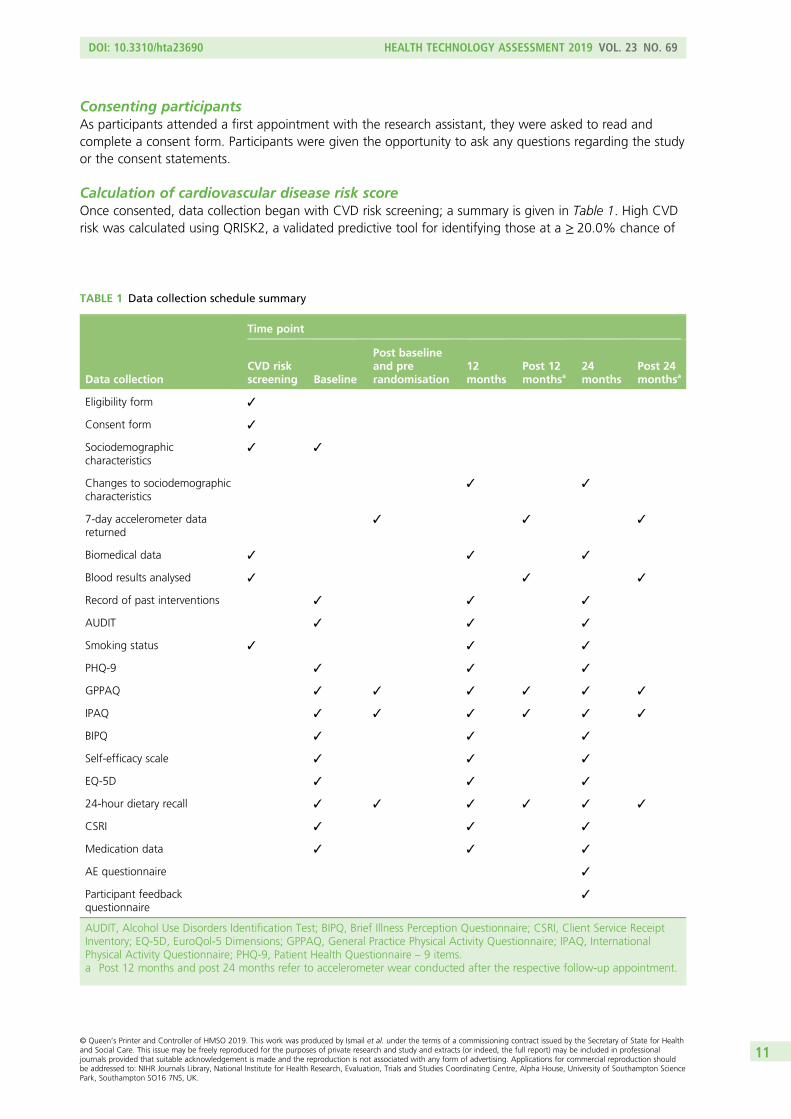
Consenting participantsAs participants attended a first appointment with the research assistant, they were asked to read andcomplete a consent form. Participants were given the opportunity to ask any questions regarding the studyor the consent statements.
Calculation of cardiovascular disease risk scoreOnce consented, data collection began with CVD risk screening; a summary is given in Table 1. High CVDrisk was calculated using QRISK2, a validated predictive tool for identifying those at a ≥ 20.0% chance of
TABLE 1 Data collection schedule summary
Data collection
Time point
CVD riskscreening Baseline
Post baselineand prerandomisation
12months
Post 12monthsa
24months
Post 24monthsa
Eligibility form ✓
Consent form ✓
Sociodemographiccharacteristics
✓ ✓
Changes to sociodemographiccharacteristics
✓ ✓
7-day accelerometer datareturned
✓ ✓ ✓
Biomedical data ✓ ✓ ✓
Blood results analysed ✓ ✓ ✓
Record of past interventions ✓ ✓ ✓
AUDIT ✓ ✓ ✓
Smoking status ✓ ✓ ✓
PHQ-9 ✓ ✓ ✓
GPPAQ ✓ ✓ ✓ ✓ ✓ ✓
IPAQ ✓ ✓ ✓ ✓ ✓ ✓
BIPQ ✓ ✓ ✓
Self-efficacy scale ✓ ✓ ✓
EQ-5D ✓ ✓ ✓
24-hour dietary recall ✓ ✓ ✓ ✓ ✓ ✓
CSRI ✓ ✓ ✓
Medication data ✓ ✓ ✓
AE questionnaire ✓
Participant feedbackquestionnaire
✓
AUDIT, Alcohol Use Disorders Identification Test; BIPQ, Brief Illness Perception Questionnaire; CSRI, Client Service ReceiptInventory; EQ-5D, EuroQol-5 Dimensions; GPPAQ, General Practice Physical Activity Questionnaire; IPAQ, InternationalPhysical Activity Questionnaire; PHQ-9, Patient Health Questionnaire – 9 items.a Post 12 months and post 24 months refer to accelerometer wear conducted after the respective follow-up appointment.
DOI: 10.3310/hta23690 HEALTH TECHNOLOGY ASSESSMENT 2019 VOL. 23 NO. 69
© Queen’s Printer and Controller of HMSO 2019. This work was produced by Ismail et al. under the terms of a commissioning contract issued by the Secretary of State for Healthand Social Care. This issue may be freely reproduced for the purposes of private research and study and extracts (or indeed, the full report) may be included in professionaljournals provided that suitable acknowledgement is made and the reproduction is not associated with any form of advertising. Applications for commercial reproduction shouldbe addressed to: NIHR Journals Library, National Institute for Health Research, Evaluation, Trials and Studies Coordinating Centre, Alpha House, University of Southampton SciencePark, Southampton SO16 7NS, UK.
11
having a fatal or non-fatal cardiovascular event over the next 10 years.72 The measures required for thecalculation of QRISK2 score are:
l Age (years).l Sex.l Self-report ethnicity.l Postcode.l Smoking status – current (if current, how many cigarettes or equivalent per day), ex-smoker or
non-smoker. We also collected the number of years smoking for current and ex-smokers.l Diabetes mellitus status (none, type 1 or type 2).l Rheumatoid arthritis status.l Chronic kidney disease status.l Atrial fibrillation status.l Hypertensive treatment status.l Family history of CVD (a first-degree relative diagnosed with angina or heart attack when < 60 years
of age).l Height (cm) and weight (kg) were taken for a calculation of BMI (kg/m2).l Systolic blood pressure (mmHg) – the third of three measurements taken.l The ratio of HDL cholesterol (mmol/l) to total cholesterol (mmol/l).
Postcode data were collected for the calculation of Index of Multiple Deprivation (IMD) 2010 scores76
(based on lower-layer super output area).77 The IMD incorporates seven domains: income deprivation,employment deprivation, health deprivation and disability, education deprivation, crime, barriers to housingand services and living environment.
Levels of LDL cholesterol (mmol/l), triglycerides (mmol/l), plasma glucose (mmol/l) and glycatedhaemoglobin (HbA1c) (mmol/mol) were also taken at this time point, and patients with a HbA1c level of> 47 mmol/mol were subsequently excluded.
Baseline measuresIf QRISK2 score was calculated as ≥ 20.0%, participants were subsequently invited to a secondappointment for the collection of the following data prior to randomisation.
Sociodemographic dataThese were age, sex, self-report ethnicity and family history of CVD collected for the QRISK2 calculation,occupational status, educational attainment, marital status, literacy [using the Rapid Estimate of AdultLiteracy in Medicine (REALM)78] and place of residence.
Biomedical dataThese were weight, height, BMI, blood pressure, plasma glucose level, lipids and HbA1c level, which werecollected for the QRISK2 calculation. Data collection included a full-body composition analysis andmeasurement of waist, hip and arm circumferences.
Weight and body composition were measured in light clothing without shoes on the Class 3 Tanita®
SC-240 digital scale (Tanita, Amsterdam, the Netherlands) to 0.1 units for weight (kg), fat range (%),fat mass (kg), fat-free mass (kg), body water (kg), muscle mass (kg), bone mass (kg) and to the nearest1 unit for visceral fat (level) and impedance (ohm) and basal metabolic rate (kcal). Height was measured to0.1 cm using stadiometers with the supported stretch stature method and weight and height measurementswere used to calculate BMI (kg/m2).
Waist circumference (cm) was measured horizontally halfway between the lowest rib and the upperprominence of the pelvis using a non-extensible steel tape against the bare abdomen. Hip circumference(cm) was measured at the widest part of the hip. Arm circumference (cm) was taken from the mid-upper
METHODS
NIHR Journals Library www.journalslibrary.nihr.ac.uk
12
arm, at the midpoint between the top of the shoulder and the point of the elbow. Two measurementswere taken for each circumference, with a third taken if the first two measurements differed by > 0.5 cm.
Blood pressure (mmHg/mmHg) and resting heart rate (beats per minute) were measured with digitalOmron blood pressure monitors [Omron Healthcare (UK) Ltd, Milton Keynes, UK) using standardisedprocedures of three readings taken 1 minute apart while seated.
Lifestyle dataThese were smoking status collected for QRISK2 calculation, PA, alcohol intake and dietary intake.
Physical activity was measured objectively using the ActiGraph GT3X accelerometer (ActiGraph, Pensacola,FL, USA), a validated tri-axial movement sensor that also records step count.79 The research assistantexplained to the participant how to wear the accelerometer: on a belt over the hip for 7 days, fromwaking in the morning until going to bed at night and removing only for bathing. Participants were askedto keep a log of activities, including sedentary activity, to assist with the qualitative interpretation of thedata. The output from the accelerometer includes number of steps taken and time spent doing PA usingstandard cut-off points for sedentary activity and light, moderate, vigorous and very vigorous PA. Theresearch assistant ensured that, on the participant returning the accelerometer, it had been worn for≥ 540 minutes on each of ≥ 5 days, and, if not, the participant was asked to wear the accelerometer foranother 7 days. Step count per day and a measurement of PA at an at least moderate level [moderate tovigorous PA (MVPA)] in > 10-minute bouts were extracted from the collected data. Standardised verticalaxis cut-off points for PA were used to classify sedentary (0–99 counts per minute), light (100–1951 countsper minute), moderate (1952–5724 counts per minute), vigorous (5725–9498 counts per minute) andvery vigorous (≥ 9499 counts per minute) activity, with MVPA equating to ≥ 1952 counts per minute.80
Self-report PA was also measured using the General Practice Physical Activity Questionnaire and theInternational Physical Activity Questionnaire81 at both the baseline appointment and after 1 week ofaccelerometer wear.
Alcohol intake was measured using the Alcohol Use Disorders Identification Test (AUDIT),82 which has arange of scores values from 0 to 40. Participants were categorised as abstainers (score 0), low-risk drinkers(score 1–7) or possibly harmful drinkers (score ≥ 8).
Dietary intake was assessed using a standardised multiple-pass 24-hour dietary recall, which provides amore objective and reliable measure of change in intervention studies, at both the baseline appointmentwith the research assistant and independently after 1 week of accelerometer wear. Research assistantswere trained to follow a standardised protocol and ask neutral probing questions to encourage recallof food items, and were taught about different methods of food preparations and brands in differentcultures. Portion size was assessed using food photographs to estimate daily calorie intake.83,84 Dietplan7software (Forestfield Software Ltd, Horsham, UK) was used for coding the 24-hour recall diaries andderiving nutrient intake. For food not listed in the software’s database, we created new food codes andinputted the available nutritional information. If nutritional information was unavailable for an unlistedtype of food, we selected the most similar type of food already in the database.
Psychological dataThese included depressive symptoms, health beliefs and health state. Depressive symptoms were collectedusing the Patient Health Questionnaire-9 items (PHQ-9),85 as depression is associated with worse outcomesin CVD.86 Each of the nine items are scored from 0 to 3 depending on frequency of occurrence of symptoms,for a score in the range of 0–27. One or two missing items can be substituted with the average score ofnon-missing items. When there are more than two missing values, the questionnaire is not scored. Thequestionnaire is followed by a functioning question, and the questionnaire results are provided to thepatient’s GP.
DOI: 10.3310/hta23690 HEALTH TECHNOLOGY ASSESSMENT 2019 VOL. 23 NO. 69
© Queen’s Printer and Controller of HMSO 2019. This work was produced by Ismail et al. under the terms of a commissioning contract issued by the Secretary of State for Healthand Social Care. This issue may be freely reproduced for the purposes of private research and study and extracts (or indeed, the full report) may be included in professionaljournals provided that suitable acknowledgement is made and the reproduction is not associated with any form of advertising. Applications for commercial reproduction shouldbe addressed to: NIHR Journals Library, National Institute for Health Research, Evaluation, Trials and Studies Coordinating Centre, Alpha House, University of Southampton SciencePark, Southampton SO16 7NS, UK.
13
The Brief Illness Perception Questionnaire was adapted to be used for ‘high risk of CVD’ rather than for anillness.87 The questionnaire asks the participant to rate their beliefs of the causes of their high risk of CVDand how being at high risk affects them. A total score is calculated by summing together all items, withitems 3, 4 and 7 reverse-scored, a higher score reflecting a more serious view of the high risk of CVD.
We also used a validated self-efficacy questionnaire for exercise,88 and adapted this to assess self-efficacyin keeping to a healthy diet as well as psychological processes we were seeking to change through theintervention. Average scores for both exercise and diet self-efficacy were calculated by summing togetherthe score of each answered item and dividing by the number of items answered.
The EuroQol-5 Dimensions (EQ-5D) was used to measure the health state of the participant on thedimensions of mobility, self-care, usual activities, pain or discomfort and anxiety or depression using threelevels: no problems, some problems or extreme problems.89 Participants are asked to rate their currenthealth state within the 0–100 range.
Health-care usage dataHealth-care usage was assessed using the Client Service Receipt Inventory (CSRI),90 which included usageof hospital services, community-based services and support received from friends or relatives for any healthreasons for the 12-month period leading up to the appointment. Data on current prescription medicationwere also collected from medical records.
Randomisation and allocation concealmentSimple randomisation was used, with general practice included as a random factor in the model andemphasis being on more practices and fewer patients per practice. Randomisation of participants wasconducted by the data manager from an independent clinical trials unit (King’s College London) usingcomputer-generated randomisation blocks with block sizes of 10. In each block, 10 participants wererandomised to the group intervention arm, the individual intervention arm or the UC arm in a 4 : 3 : 3ratio. The unequal allocation ratio ensured that the group intervention arm had approximately 33% moreparticipants, allowing the group sessions to run with enough participants.
As this is a complex psychological intervention, it was not possible to conceal the allocation to theparticipants or the HLFs post randomisation. Research assistants, statisticians and technicians were blind tothe allocation. Participants were reminded in advance of and during the follow-up appointments not toreveal their allocation.
Outcome measures
At the 12- and 24-month follow-up assessments, participants were asked if there had been any changeto their sociodemographic status, such as accommodation, relationship status and educational attainment.AE and participant feedback questionnaires were administered. All other baseline measures were repeatedat the 12- and 24-month follow-ups (see Table 1).
Trial arms and intervention details
Arm 1: usual care and enhanced motivational interviewing in a group format
Theoretical frameworkThe intervention is based on the theory of planned behaviour for initiation of behaviour change: to changebehaviour, people need to form an intention.53 Intention formation is influenced by three constructs:(1) expected value or positive attitude (people see the value in making the change), (2) subjective norm
METHODS
NIHR Journals Library www.journalslibrary.nihr.ac.uk
14
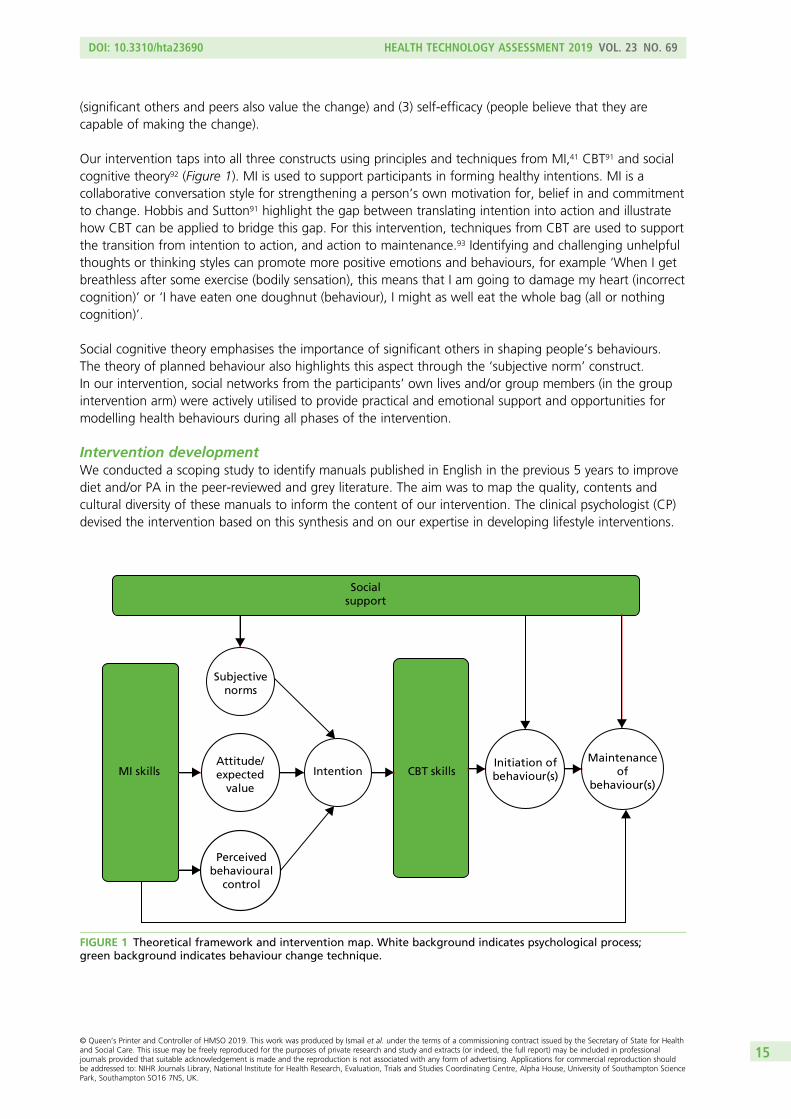
(significant others and peers also value the change) and (3) self-efficacy (people believe that they arecapable of making the change).
Our intervention taps into all three constructs using principles and techniques from MI,41 CBT91 and socialcognitive theory92 (Figure 1). MI is used to support participants in forming healthy intentions. MI is acollaborative conversation style for strengthening a person’s own motivation for, belief in and commitmentto change. Hobbis and Sutton91 highlight the gap between translating intention into action and illustratehow CBT can be applied to bridge this gap. For this intervention, techniques from CBT are used to supportthe transition from intention to action, and action to maintenance.93 Identifying and challenging unhelpfulthoughts or thinking styles can promote more positive emotions and behaviours, for example ‘When I getbreathless after some exercise (bodily sensation), this means that I am going to damage my heart (incorrectcognition)’ or ‘I have eaten one doughnut (behaviour), I might as well eat the whole bag (all or nothingcognition)’.
Social cognitive theory emphasises the importance of significant others in shaping people’s behaviours.The theory of planned behaviour also highlights this aspect through the ‘subjective norm’ construct.In our intervention, social networks from the participants’ own lives and/or group members (in the groupintervention arm) were actively utilised to provide practical and emotional support and opportunities formodelling health behaviours during all phases of the intervention.
Intervention developmentWe conducted a scoping study to identify manuals published in English in the previous 5 years to improvediet and/or PA in the peer-reviewed and grey literature. The aim was to map the quality, contents andcultural diversity of these manuals to inform the content of our intervention. The clinical psychologist (CP)devised the intervention based on this synthesis and on our expertise in developing lifestyle interventions.
Socialsupport
Subjectivenorms
Attitude/expected
value
Perceivedbehavioural
control
IntentionMI skills CBT skillsInitiation ofbehaviour(s)
Maintenanceof
behaviour(s)
FIGURE 1 Theoretical framework and intervention map. White background indicates psychological process;green background indicates behaviour change technique.
DOI: 10.3310/hta23690 HEALTH TECHNOLOGY ASSESSMENT 2019 VOL. 23 NO. 69
© Queen’s Printer and Controller of HMSO 2019. This work was produced by Ismail et al. under the terms of a commissioning contract issued by the Secretary of State for Healthand Social Care. This issue may be freely reproduced for the purposes of private research and study and extracts (or indeed, the full report) may be included in professionaljournals provided that suitable acknowledgement is made and the reproduction is not associated with any form of advertising. Applications for commercial reproduction shouldbe addressed to: NIHR Journals Library, National Institute for Health Research, Evaluation, Trials and Studies Coordinating Centre, Alpha House, University of Southampton SciencePark, Southampton SO16 7NS, UK.
15

We used an iterative process to draft the manual and refine it over 2–3 cycles. There are two manualisedoutputs from the trial:
1. An intervention curriculum. This provides an outline of each intervention session, including key learningpoints, interactive activities and action planning.
2. A participant workbook. This includes key learning points from each session, action planningworksheets, case studies and a self-monitoring diary for each participant.
The participants also received a pedometer, with guidance on how to use it effectively, and access toonline, DVD (digital versatile disc) and paper resources on CVD risk.
The programme consisted of 10 sessions, plus an introductory telephone session, spread over 12 months.The outline of each session is given in Table 2. Each participant allocated to a treatment arm had a ‘session 0’telephone call as an introduction to the intervention, to receive their intervention packs and to becomefamiliar with the HLF. The intensive phase consisted of six weekly sessions at the beginning of the first quarter.The first three sessions focused on PA and the second three sessions focused on diet. The maintenance phaseconsisted of four sessions delivered at 3, 6, 9 and 12 months after intervention commencement.
Those randomised to the group intervention arm were encouraged to use peer learning and the peersupport environment to facilitate change during both the intensive phase and the maintenance phase.Each group had a maximum of 11 participants and sessions lasted for 120 minutes. The interventionwas delivered in local venues, such as community halls and health centres. Between sessions and duringfollow-up, participants were encouraged to communicate with each other and the HLF. Novel methodsand teaching aids were used to supplement the delivery of BCTs, such as visual aids (food labels)/cuecards, exercise demonstrations, video/audio material of patient testimonials, activity-based learning aroundmeal planning, and text/e-mail reminders. HLFs were expected to offer sessions between 08.00 and 21.00,enabling flexibility for participants in full-time work or with carer roles. Cultural and religious awarenesswas built in to the intervention.
For ease of translation, the key components of the programme have been defined in accordance withAbraham and Michie’s BCT taxonomy:54
i. provide information on consequencesii. prompt intention formationiii. prompt barrier identificationiv. prompt specific goal-settingv. prompt review of behavioural goalsvi. prompt self-monitoring of behaviourvii. teach to use prompts or cuesviii. agree on behavioural contractix. use follow-up promptsx. plan social support or social changexi. relapse preventionxii. MI.
Training the healthy lifestyle facilitatorsThe HLFs were employed at NHS band 3 level by King’s College Hospital and seconded as appropriate tothe CCG. The training programme lasted for 8 weeks and involved a standardised package of trainingmaterials. The teaching was a combination of didactic learning, role playing and feedback, group exercises,reading and case study discussion. The HLFs used rating scales for self-monitoring of skill progressionduring role playing.
METHODS
NIHR Journals Library www.journalslibrary.nihr.ac.uk
16
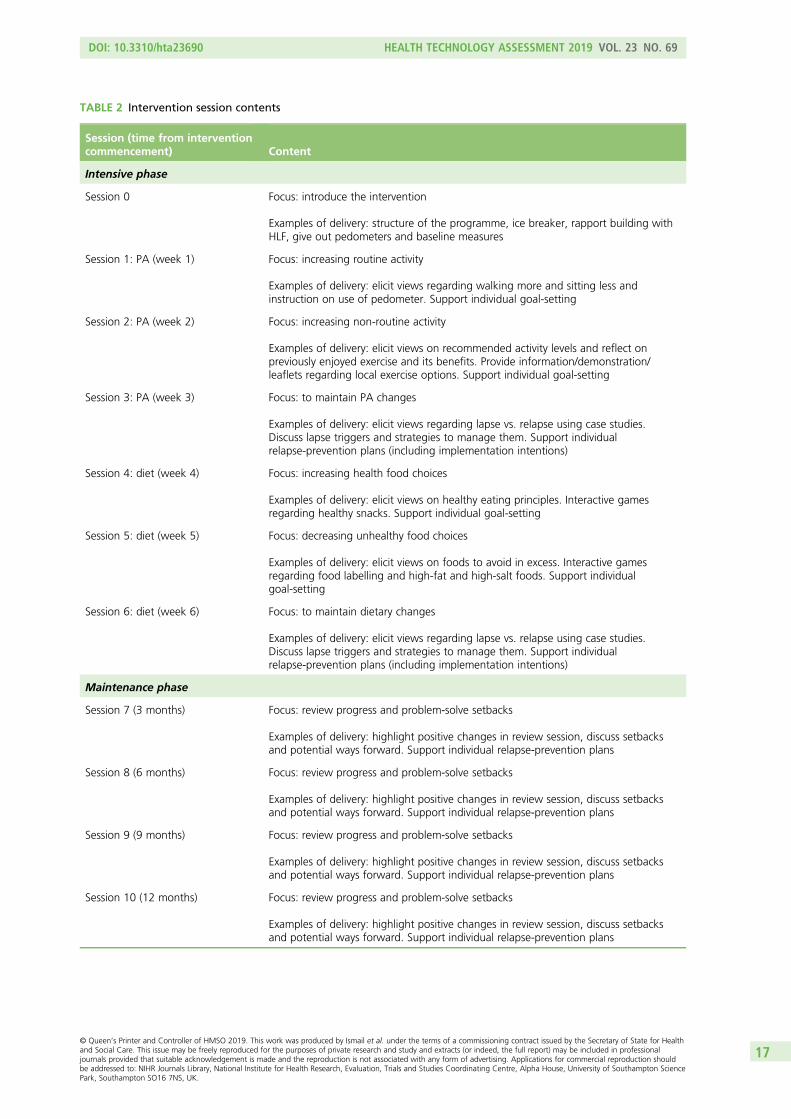
TABLE 2 Intervention session contents
Session (time from interventioncommencement) Content
Intensive phase
Session 0 Focus: introduce the intervention
Examples of delivery: structure of the programme, ice breaker, rapport building withHLF, give out pedometers and baseline measures
Session 1: PA (week 1) Focus: increasing routine activity
Examples of delivery: elicit views regarding walking more and sitting less andinstruction on use of pedometer. Support individual goal-setting
Session 2: PA (week 2) Focus: increasing non-routine activity
Examples of delivery: elicit views on recommended activity levels and reflect onpreviously enjoyed exercise and its benefits. Provide information/demonstration/leaflets regarding local exercise options. Support individual goal-setting
Session 3: PA (week 3) Focus: to maintain PA changes
Examples of delivery: elicit views regarding lapse vs. relapse using case studies.Discuss lapse triggers and strategies to manage them. Support individualrelapse-prevention plans (including implementation intentions)
Session 4: diet (week 4) Focus: increasing health food choices
Examples of delivery: elicit views on healthy eating principles. Interactive gamesregarding healthy snacks. Support individual goal-setting
Session 5: diet (week 5) Focus: decreasing unhealthy food choices
Examples of delivery: elicit views on foods to avoid in excess. Interactive gamesregarding food labelling and high-fat and high-salt foods. Support individualgoal-setting
Session 6: diet (week 6) Focus: to maintain dietary changes
Examples of delivery: elicit views regarding lapse vs. relapse using case studies.Discuss lapse triggers and strategies to manage them. Support individualrelapse-prevention plans (including implementation intentions)
Maintenance phase
Session 7 (3 months) Focus: review progress and problem-solve setbacks
Examples of delivery: highlight positive changes in review session, discuss setbacksand potential ways forward. Support individual relapse-prevention plans
Session 8 (6 months) Focus: review progress and problem-solve setbacks
Examples of delivery: highlight positive changes in review session, discuss setbacksand potential ways forward. Support individual relapse-prevention plans
Session 9 (9 months) Focus: review progress and problem-solve setbacks
Examples of delivery: highlight positive changes in review session, discuss setbacksand potential ways forward. Support individual relapse-prevention plans
Session 10 (12 months) Focus: review progress and problem-solve setbacks
Examples of delivery: highlight positive changes in review session, discuss setbacksand potential ways forward. Support individual relapse-prevention plans
DOI: 10.3310/hta23690 HEALTH TECHNOLOGY ASSESSMENT 2019 VOL. 23 NO. 69
© Queen’s Printer and Controller of HMSO 2019. This work was produced by Ismail et al. under the terms of a commissioning contract issued by the Secretary of State for Healthand Social Care. This issue may be freely reproduced for the purposes of private research and study and extracts (or indeed, the full report) may be included in professionaljournals provided that suitable acknowledgement is made and the reproduction is not associated with any form of advertising. Applications for commercial reproduction shouldbe addressed to: NIHR Journals Library, National Institute for Health Research, Evaluation, Trials and Studies Coordinating Centre, Alpha House, University of Southampton SciencePark, Southampton SO16 7NS, UK.
17
Each HLF’s competency was assessed at the end of training via a knowledge test and through observingdelivery of two sessions (one intensive, one maintenance). Four domains were assessed: MI, BCTs, groupskills and time management, utilising relevant coding frameworks (see Appendix 1). The competencythresholds were adapted for the study,94–96 requiring each HLF to demonstrate ‘moderate proficiency’ ineach of the domains before delivering the intervention, meaning that they delivered 70% of BCTs, were90% MI-adherent and scored in the moderate range in at least two of the other Motivational InterviewingTreatment Integrity (MITI)97 categories, in at least three of the group skills categories and in time management.HLFs that were not competent on initial assessment received further training and reassessment to reach therequired competency level.
Healthy lifestyle facilitator competency was monitored throughout the intervention by the CP, whofacilitated fortnightly group supervision and weekly e-mail supervision (based on the HLFs completingreflective practice logs). The CP also conducted quality assurance of the intervention administration byregularly reviewing audiotaped sessions (one individual session per month and two group sessions every8 months) and providing feedback, as needed.
Arm 2: usual care and enhanced motivational interviewing in an individual formatThis had the same components as the group intervention arm but was delivered individually (i.e. one to one).There was no opportunity/expectation/guidance for participants to form groups with each other betweensessions. The number, content and spread of sessions was the same and sessions lasted for 40 minutes;we reduced the duration of each session to approximately control for attention in the two treatment arms.
Arm 3: usual care onlyGeneral practitioners participating in the study were expected to follow their local Health Check pathwayfor those patients who had a CVD risk score of ≥ 20.0%.
Clinical effectiveness
Primary outcomesThe primary outcomes were change in weight (kg) and PA (average number of steps per day) between arms.
Secondary outcomesChanges in LDL cholesterol and CVD risk score were assessed. The QRISK2 measurement of CVD riskis sensitive to changes in weight, cholesterol level, blood pressure, HbA1c level and smoking status.The number of fatal and non-fatal CVD events and hospital admissions were recorded using an AEquestionnaire and by recording hospital services usage using the CSRI. Changes in dietary habits weremeasured via analysis of dietary recall data. Health beliefs and depression at 12 and 24 months wereassessed as measures of mediating processes.
Cost-effectiveness
The main perspective for the economic evaluation is that of the health-care system. The EuroQol-5Dimensions, three-level version (EQ-5D-3L) is used to generate QALYs for use in economic analyses.98
Intervention costs were calculated taking into account staff time for delivering the sessions and the unitcosts include elements for overheads and oncosts and account for the ratio of direct-to-indirect contacttime. We assumed that the clinician would be grade 3 and that the unit cost per hour was £32.40. For thegroup intervention, the costs are apportioned over the number of attendees, which averaged 5.5. Otherservice use was measured at baseline, 12 months and 24 months using the CSRI. EQ-5D instruments weredeveloped in the 1980s and have been subsequently adapted for use in around 500 studies. Service costs
METHODS
NIHR Journals Library www.journalslibrary.nihr.ac.uk
18
were calculated by combining service use data with information on unit costs.99,100 We had originallyplanned to explore the cost of lost employment. However, these data were not adequately recorded andso this was omitted.
Process evaluation
The overall aim of the qualitative analysis is to identify and describe factors and processes that affect thedelivery, receipt and outcome of the study to aid interpretation and translation of the observed findings.Process data are analysed before outcome data wherever possible to reduce bias in interpretation. Themain themes are described in the following sections.
Participation biasThe extent to which the intervention reached out to eligible participants is assessed by (1) the makeup ofgeneral practices that agreed and declined to participate, (2) participation biases and (3) attrition biases.We also invited participants who did not complete the intervention to attend a focus group to givefeedback on the programme.
Fidelity analysisWe measured adherence and competence of the trained HLF team in delivering the manualisedintervention. See Chapter 8 for a full description.
Processes of changeThe HLFs would record if targets were met (not at all, partially or fully) at the beginning of each session asa measure of participant adherence to the intervention. Supervision and interviews with the HLFs were usedto assess which BCTs were popular, why and for which lifestyle behaviour. We administered a processquestionnaire at the end of the study that required all randomised participants to discuss, in open-endedand standardised structured questions, which techniques they had found most useful, their appraisal ofthe techniques and their level of satisfaction with the interventions of their allocated arms. We included theUC arm to assess the similarity and differences with the intervention arms as there may have been someoverlap. In addition to the questionnaire, we conducted focus groups with a small number of participantsto elicit more detailed feedback (see Chapter 4).
Statistical analysis
Analysis and reporting is aligned with Consolidated Standards of Reporting Trials (CONSORT) guidelines,101
with primary analyses being on an intention-to-treat (ITT) basis. A description of the sample will be presentedusing mean (SD) or count (percentage). The baseline characteristics of those who withdrew and those whodid not complete the intervention are compared with those of participants who completed follow-up.Descriptive data also include maximum values, minimum values, medians and interquartile ranges (IQRs)when appropriate. Significance is reported to a two-tailed alpha level of 0.05 as appropriate for comparisons.
The differences in treatment effect between the three arms at 12 and 24 months of this partially nesteddesign are analysed using mixed-effects models, with pre-randomisation values as a covariate.102 In thelinear mixed model, ‘treatment arm’, ‘time’ (as a categorical variable with two levels: 12 and 24 months),the ‘interaction between treatment group and time’, ‘borough’, ‘ethnicity’ and the ‘baseline values’ of theoutcome variable are the fixed part of the model. The random parts of the models are ‘general practice’(participants are nested in practices) and ‘therapy group’. The design of the study is complex because wehave a partially clustered cross-classified design. In the previous version of the analysis plan, we planned toaccount for the partially nested design of ‘therapy group’ in an approach that matches the non-paralleldata structure.103 However, preliminary analyses with blinded data revealed that this complex model of apartially nested, cross-classified design did not converge. Thus, in agreement with the Trial Steering
DOI: 10.3310/hta23690 HEALTH TECHNOLOGY ASSESSMENT 2019 VOL. 23 NO. 69
© Queen’s Printer and Controller of HMSO 2019. This work was produced by Ismail et al. under the terms of a commissioning contract issued by the Secretary of State for Healthand Social Care. This issue may be freely reproduced for the purposes of private research and study and extracts (or indeed, the full report) may be included in professionaljournals provided that suitable acknowledgement is made and the reproduction is not associated with any form of advertising. Applications for commercial reproduction shouldbe addressed to: NIHR Journals Library, National Institute for Health Research, Evaluation, Trials and Studies Coordinating Centre, Alpha House, University of Southampton SciencePark, Southampton SO16 7NS, UK.
19
Committee (TSC) and Data Monitoring and Ethics Committee (DMEC) (on 6 July 2017), we decided todrop the random effect for therapist from the primary analyses. We are aware that we may underestimatestandard errors of treatment effects; however, health intervention therapist effects in similar studies[e.g. the National Institute for Health Research (NIHR)-funded IMPACT104 and Diabetes-6105 RCTs] rangedbetween negligible and small (ICC range 0 to 0.02).
The dependency of the repeated observations of the same participants at 12 and 24 months and thecovariance between the residuals within the lowest-level group ‘patients’ are correlated by using anunstructured covariance pattern model. For the final model, the group difference estimates and associatedconfidence intervals (CIs) are reported for 12 (for secondary analyses) and 24 months after randomisation.
In a sensitivity analysis, the random effect of borough was replaced by a partially nested random effect fortherapist group, as described previously, and results compared.
The described analysis approach provides valid inferences under the assumption that the missing datamechanism can be ignored (missing at random). Sensitivity of results to missing data was further assessedby including covariates predictive of missingness in the analyses model.
The significance level was 2.5% (two-sided) for the two main comparisons of (1) group format versus UCand (2) individual format versus UC. The (secondary) comparison (group format vs. individual format) wasassessed on a 5% significance level as our research hypotheses is a null hypothesis of no difference.
The large sample size should have ensured that all possible confounding variables are equally distributedbetween treatment arms. However, in the sensitivity analysis, we extended the model of the primary analysisby including baseline variables with substantial imbalance, thought to be important in determining outcome.The potential baseline variables were age, sex, IMD, education, marital status and smoking status.
The following further sensitivity analyses were conducted and, for all analyses, changes in predictedtreatment outcome differences are presented in the analysis plan – available on the project webpage[see www.journalslibrary.nihr.ac.uk/programmes/hta/106203/#/ (accessed 29 April 2019)].
Sensitivity analysis adjusting for delay in intervention startParticipants allocated to the intervention arms began intervention sessions at different time points relativeto randomisation. Therefore, we conducted a sensitivity analysis to include time between randomisationand session 0 of the intervention in the model.
Sensitivity analysis adjusting for unblinding of research assistants at follow-upEvery effort was made to avoid participants revealing their treatment allocation to the research assistant atfollow-up. Research assistants recorded whether or not they were unblinded to treatment allocation ateither the 12- or the 24-month follow-up. We conducted a sensitivity analysis to include unblinding (yes/no)at follow-up time into the model.
Sensitivity analysis adjusting for insufficient accelerometer wear at baselineWe conducted a sensitivity analysis to include the number of valid days (≥ 540 minutes) of accelerometerwear at baseline in the model.
Sensitivity analysis adjusting for insufficient accelerometer wear at follow-upWe conducted a sensitivity analysis to include the number of valid days (≥ 540 minutes) of accelerometerwear at 12 and 24 months in the model.
METHODS
NIHR Journals Library www.journalslibrary.nihr.ac.uk
20
Sensitivity analysis adjusting for the recruitment of participants with abody mass index of < 25 kg/m2
Although BMI was not included in the eligibility criteria, an aim of the study was to assess reduction inweight, which would be inappropriate for participants who were of healthy weight or underweight atbaseline. We conducted a sensitivity analysis to include a BMI of < 25 kg/m2 (yes/no) at baseline in the model.
Sensitivity analysis adjusting for the recruitment of participants with aQRISK2 score of < 20.0%We conducted a sensitivity analysis to include a QRISK2 score of ≥ 20.0% (yes/no) at baseline in the model.
Dietary intake analysisWhen available, the dietary recall diary from the appointment (or, if missing, the later diary) was used.Owing to resource constraints, we a priori elected to analyse a random sample of 602 participants whohad a recall diary available for each time point (baseline and 12- and 24-month follow-ups). The randomselection of the 602 participants approximately followed the treatment allocation ratio used for the study(4 : 3 : 3). Thus, the arm sizes for the group, individual and UC arms were 240, 180 and 182, respectively.
Food quantities and nutrient intake were checked for outliers, indicating possible data entry errors. Eightnutrients (water, protein, fat, carbohydrates, total sugar, fibre, saturated fat and sodium) and total energyintake (kcal) were selected as variables of interest. These variables were selected based on their relevanceto the intervention (i.e. its emphasis on reducing fat/sugar/salt intake and increasing water/fibre intake).
Dietary intake data are summarised at each time point using means (SDs). A linear mixed-effects model,accounting for the partially nested design, tested if there were any effects of treatment arm and time ortheir interaction on nutrient intake. The model controlled for participant age, sex, ethnicity, IMD 2010baseline score76 and if the day recalled was Saturday/Sunday (binary yes/no variable).
A series of mediation analyses were conducted to test if dietary intake measured at the 12-month follow-upmediated the effect of the intervention on the primary outcomes (weight and PA) or QRISK2 score atthe 24-month follow-up. Owing to the limitations of the software used – R version 3.4.2 (The R Foundationfor Statistical Computing, Vienna, Austria) and the mediation package [URL: https://cran.r-project.org/web/packages/mediation/mediation.pdf (accessed 29 April 2019)] – each mediation analysis was constrained totesting differences between two of the treatment arms. Thus, a total of 81 mediation analyses were run[three outcomes × nine diet variables × three treatment arm comparisons (UC vs. group, UC vs. individual,group vs. individual)]. The mediation models controlled for participant age, sex, ethnicity, IMD 2010baseline score,76 if the day recalled was Saturday/Sunday (binary yes/no variable), baseline diet and baselinevalue for the respective outcome.
Although many statistical tests were carried out for the dietary intake analysis, these tests were largelyexploratory. Therefore, a two-tailed alpha level of 0.01 was used to determine statistical significance.For the linear mixed-effects models, the fixed-effect estimates for the effects of time and treatment armand their interaction were bootstrapped with 1000 replicates and their 95% CIs calculated.
Cost-effectiveness analysisHealth-care costs are compared between the two treatment arms and UC. Given that the data are likely tobe skewed, we use bootstrapping methods to estimate 95% CIs around the mean cost differences. QALYsare calculated from the EQ-5D-3L administered at baseline, 12 months and 24 months. Area under thecurve methods allow us to calculate the QALY gain over the entire follow-up period and QALY differencesare analysed controlling for baseline EQ-5D-3L score in a regression model. If costs were higher for onearm than for another and QALY gains are greater, we then constructed an incremental cost-effectivenessratio (ICER) to show the cost per extra QALY gained. There will be uncertainty around cost and QALYestimates and this is explored using cost-effectiveness planes generated from 1000 bootstrapped resamplesof the data for each of the comparisons. Bootstrapping was carried out using the bsample routine in Stata®
DOI: 10.3310/hta23690 HEALTH TECHNOLOGY ASSESSMENT 2019 VOL. 23 NO. 69
© Queen’s Printer and Controller of HMSO 2019. This work was produced by Ismail et al. under the terms of a commissioning contract issued by the Secretary of State for Healthand Social Care. This issue may be freely reproduced for the purposes of private research and study and extracts (or indeed, the full report) may be included in professionaljournals provided that suitable acknowledgement is made and the reproduction is not associated with any form of advertising. Applications for commercial reproduction shouldbe addressed to: NIHR Journals Library, National Institute for Health Research, Evaluation, Trials and Studies Coordinating Centre, Alpha House, University of Southampton SciencePark, Southampton SO16 7NS, UK.
21
Version 15 (StataCorp LP, College Station, TX, USA), with the strata option used so resampling was byarm. Separate regressions of costs and QALYs were performed on each bootstrapped sample and resultsretrieved and plotted on the plane. Finally, we generated cost-effectiveness acceptability curves, using thenet-benefit approach and bootstrapping, to indicate the probability that any of the three approaches is themost cost-effective for different values placed on a QALY gain. The range of values used is £0 to £100,000.This includes the threshold that is used by the NICE: £20,000–30,000. Sensitivity analyses are carried outaround key costs, particularly those for the interventions themselves. We did not impute for missing valuesand a complete-case analysis was instead conducted.
Ethics issues
The trial was reviewed by the Dulwich REC and has been approved (reference 12/LO/0917). The TSCprovided overall trial supervision, supported by the DMEC. The main ethics consideration was to ensurethat the risk of harm to participants was minimised and that they were fully informed of any risks. Weconsidered literacy and cultural sensitivities in obtaining informed consent. Other ethics considerationswere in ensuring that recruitment and informed consent were handled in such a way that potentialparticipants were not put under pressure to take part and that confidentiality was preserved. All participantdata are stored using a unique study identifier and electronic data are password protected.
In general, regular PA is associated with improved health outcomes and this outweighs the risk ofsedentary lifestyles. However, sudden increases in vigorous PA for otherwise sedentary individuals isassociated with a higher risk of myocardial infarction and of musculoskeletal injuries, which may bepertinent as we were intervening in a group that is at high risk of CVD. However, one of the componentsof BCTs is to deliver the message that PA should be increased in a graded manner rather than suddenly.The intervention discouraged excessive and/or sudden changes to lifestyles. Weight loss could worsenfrailty by accelerating the usual age-related loss of muscle that leads to sarcopenia, but combining weightloss with increased PA can actually ameliorate frailty.106 Importantly, our intervention is based on healthierdiets and gradual and sustainable weight loss as opposed to commercial weight-loss programmes. Weconsidered risks to be small and minimal owing to the exclusion of patients with existing CVD and the useof GP advice when CVD events occurred during participation.
Adverse eventsAn AE, which may be classed as serious, was defined as any untoward occurrence during the study thatshould be reported to the REC and TSC within an agreed time frame. A suspected unexpected serious AEwas defined as an untoward occurrence that is related to the intervention and is unexpected. Participantshad the opportunity to report AEs at 12-month and 24-month study appointments with the researchassistant as an AE questionnaire was administered, and participants receiving the intervention were able toreport at any time during the intervention period to the HLF. All serious AEs and laboratory values werereviewed by the principal investigator (PI) and a co-investigator, and the PI was responsible for determiningcausality and reporting any AE related to the study to the REC using the National Research Ethics Serviceguidance.
The AE questionnaire included asking specifically about physical injuries, which were coded as one of thefollowing types of injury: (1) dislocation, (2) fracture, (3) sprain/strain, (4) other injury to a muscle/tendonor (5) other. Details were also collected of how the injury occurred (context, e.g. if the participant fell) andwhether or not any treatment was administered. Cardiovascular events were similarly coded, with thefollowing categories used: (1) angina, (2) atrial fibrillation, (3) coronary heart disease, (4) coronary bypass,(5) myocardial infarction, (6) stroke or transient ischaemic attack, or (7) other. Details were also added andverified by checking the participant’s medical records, as necessary.
METHODS
NIHR Journals Library www.journalslibrary.nihr.ac.uk
22
Obtaining informed consentGeneral practice staff conducted the searches using our guidance and invited potential participants to givepermission for research assistants to contact them. Research assistants invited potential participants tomeet them in the general practice, and they were given verbal and written information about the studyand at least 1 week to think about participating. We invited patients who were eligible but declinedparticipation to give informed consent for the collection of baseline data to assess the generalisability ofour findings.
Withdrawal and stopping rulesParticipants were free to withdraw from the study at any time. If the participant withdrew from theintervention, they were asked if they were happy to attend follow-up study appointments and for furtherdata to be collected. If they withdrew from the study without consent to follow-up, no further data werecollected.
There were no formal stopping rules. This is because the intervention did not ask participants to doanything more than follow usual GP advice regarding diet and PA. However, the PI evaluated the causalityof any AE and advised withdrawal if necessary.
Time period for retention of trial documentationCopies of patient consent forms were kept for 12 months after the study ended. Personal data that areidentifiable by patient name or address will be destroyed 3 years after the study ended. Other trial recordswill be archived for 7 years after the trial ended before being destroyed.
Patient and public involvement
Before the trial began, we held a focus group with 10 patients from a general practice in Peckham,London. All patients were of African, Caribbean or South Asian ethnicity, first generation migrants andat high risk of CVD, and were distributed equally between sexes. The group understood the rationale ofthe MOVE IT trial. They recognised that daily stressors affect lifestyle choices and welcomed the chanceto talk about this and think differently. The preference was for interventions in an individual format, butthey could see the potential benefits of learning from others in a group. Flexible appointment times werestressed as being important, so that the intervention could fit around other activities. The patients felt thatit was necessary to provide more information about individual health status rather than just telling patientsthat they are at high risk of heart disease. They also gave tips on how to recruit; they thought that bygetting some patients on board, these patients could network in the local community. These commentswere incorporated into the intervention.
We invited this group of patients to form a patient and public involvement (PPI) group to help with thedevelopment of study documentation, including the patient information sheet and consent form. A PPIgroup of five patients was formed, and two members remained involved until the end of the trial. Theirrole during recruitment involved advertising the trial to both general practices and potential participants,advising on the development of poster and leaflet campaigns to increase public awareness and activelyrecruiting general practice sites across four of the CCGs. As part of the process evaluation, we sought PPIin the development of topic guides to be used in focus groups to gain feedback from participants whoattended the intervention.
Throughout the trial, the trial team updated PPI members with progress and welcomed feedback. The PPImembers attended all TSC meetings throughout the trial to gain more detailed feedback and discusspoints of interest with the trial manager, PI and co-investigators.
DOI: 10.3310/hta23690 HEALTH TECHNOLOGY ASSESSMENT 2019 VOL. 23 NO. 69
© Queen’s Printer and Controller of HMSO 2019. This work was produced by Ismail et al. under the terms of a commissioning contract issued by the Secretary of State for Healthand Social Care. This issue may be freely reproduced for the purposes of private research and study and extracts (or indeed, the full report) may be included in professionaljournals provided that suitable acknowledgement is made and the reproduction is not associated with any form of advertising. Applications for commercial reproduction shouldbe addressed to: NIHR Journals Library, National Institute for Health Research, Evaluation, Trials and Studies Coordinating Centre, Alpha House, University of Southampton SciencePark, Southampton SO16 7NS, UK.
23

Chapter 4 Protocol changes
I t was necessary to make amendments to the original protocol for a number of unforeseen reasons andto enable improvement in our study methodology and the collected data.
Low uptake of NHS Health Checks
In parallel to setting up MOVE IT, there were increasing numbers of reports and concerns that there was alower-than-anticipated uptake of NHS Health Checks,12 with regional variations in attendance rangingfrom 27% to 52% and greater uptake among older patients and in regions of lower deprivation.13 Wealso observed this when we started recruiting and that this was delaying the project.
It was necessary to amend the protocol to detail that the researcher would repeat all CVD risk algorithmmeasures at screening. General practice searches for eligible participants could therefore not rely on recentHealth Check data but instead on estimates of CVD risk using outdated data or inaccurate substitutions formissing data.
This change to the protocol led to the exclusion of a large number of patients whose medical record datasuggested that they were at a ≥ 20.0% QRISK2 score but on screening were found to have a score of< 20.0% (see Chapter 5). Consequently, more resources were required to complete recruitment to target(substantial amendment; approved in July 2013).
Change to recruitment and study time frame
As research assistants were screening a larger proportion of ineligible patients who could not berandomised, the recruitment period had to be extended from 12 months to 21 months to allow the targetsample size to be reached. This required an increase in funding to support a greater number of researchassistants and for a longer period of time to support the recruitment procedures at a greater number ofresearch sites. As a result, the end-of-study follow-ups were also extended by a further 9 months (minoramendment; approved on 16 March 2015).
Research sites
We initially invited general practice sites with list sizes of > 8000 patients. We extended invitations tosmaller practices with > 5000 patients, as we required an increase in the number of sites owing to thehigh number of responses from ineligible patients (substantial amendment; approved in July 2013).
Randomisation
Randomisation was not stratified by general practice and ethnicity as planned, as the numbers of patientsin many practices are not large enough to stratify by both factors. Simple randomisation was agreed to bethe best method, with surgery included as a random factor in the model, and emphasis being on morepractices and fewer patients per practice (substantial amendment; approved in July 2013).
DOI: 10.3310/hta23690 HEALTH TECHNOLOGY ASSESSMENT 2019 VOL. 23 NO. 69
© Queen’s Printer and Controller of HMSO 2019. This work was produced by Ismail et al. under the terms of a commissioning contract issued by the Secretary of State for Healthand Social Care. This issue may be freely reproduced for the purposes of private research and study and extracts (or indeed, the full report) may be included in professionaljournals provided that suitable acknowledgement is made and the reproduction is not associated with any form of advertising. Applications for commercial reproduction shouldbe addressed to: NIHR Journals Library, National Institute for Health Research, Evaluation, Trials and Studies Coordinating Centre, Alpha House, University of Southampton SciencePark, Southampton SO16 7NS, UK.
25
Research measures
Three blood pressure measures were taken. The third, rather than the mean, systolic blood pressure is usedin the QRISK2 algorithm and will be reported in this final report (substantial amendment; approved on9 June 2015).
Intervention details
The proposed health trainer job title was changed to HLF to better incorporate the MI aspect of theintervention whereby the participant was ‘facilitated’ rather than ‘trained’ to make healthy lifestyle changes.
We revised the definition and description of MI to that used in the third edition of the MI textbook.42
The intervention was updated to include a session 0, which was an introductory session via telephone.The length of group intervention sessions was increased to 120 minutes, rather than 90 minutes, to bettermatch for attention with the individual intervention sessions (substantial amendment; approved in July 2013).
Further to the above changes, we changed the protocol to state that participants would be seen forintervention sessions within 6 months from randomisation, as this time period was not initially statedand the start of intervention sessions was presumed to be immediate. The time period varied greatly owingto (1) large numbers of participants randomised and waiting to be seen, as a result of the acceleratedrecruitment rate to meet the target, and (2) HLF staff turnover and the subsequent recruitment and trainingof new staff members, which created delays. When this time period was exceeded, we made every effortto still engage participants in the intervention and continued to follow-up for the ITT analysis (substantialamendment; approved on 9 June 2015).
Additional consent procedures
Participants were given the opportunity to consent to the following additional items post randomisation:
l Once participants had completed all research measures, they were asked if we could link their data toother collaborating research studies in which they also participated (substantial amendment; approvedon 21 September 2015).
l We requested access to Hospital Episodes Statistics data,107 information on all hospital appointments forup to a 6-year period beginning 12 months before participating in the study. However, as this wasrequested after participants completed the study, we did not gain consent from all participants for thisand thus did not seek the Hospital Episodes Statistics data and used only CSRI information on hospitalservices usage (substantial amendment; approved on 21 September 2015). We requested thatparticipants provided consent to these points remotely, via a letter to and a telephone call with theparticipant, to avoid unnecessary appointment scheduling (minor amendment; approved on13 January 2016).
l A small number of participants who received the intervention (group or individual) were randomlyselected to be invited to a focus group to provide feedback. They were asked to provide writteninformed consent to take part in an audiotaped focus group (substantial amendment; approved on7 March 2016).
l A small number of participants were asked to consent to a video recording or photograph of anintervention session to be used to promote the study for educational and training purposes only(substantial amendment; approved on 7 March 2016).
PROTOCOL CHANGES
NIHR Journals Library www.journalslibrary.nihr.ac.uk
26
Elaboration of process evaluation: participation bias
We gained ethics approval to collect anonymised demographic data on all patients who were identified aspotentially eligible and invited to participate when screening the GP medical records. These data enabledan estimation of participation bias through examining differences in age, sex, ethnicity, deprivation andQRISK2 score between responders and non-responders to the study invitation (substantial amendment;approved on 8 January 2016).
King’s College London network outage and impact on the fidelity analysis
On 18 October 2016, a university-wide information technology (IT) network outage occurred as a resultof an infrastructure fault, restricting us from accessing the shared network drives in which various trialdata were stored (as per university protocol) and resulting in some data being lost. Although King’s CollegeLondon IT services made an extensive effort to forensically retrieve data from backup sources, all audiotapedintervention session data were lost from the university-managed shared network drive. We estimated thisto be almost 2000 hours of intervention delivery. In addition, we lost data from approximately 200 dietaryrecall diaries (which could be re-inputted from their paper copies) and 95 accelerometry data files from the24-month follow-up. For the accelerometry data, we asked the 95 participants to rewear the accelerometer;of those, eight declined and consequently had missing data for the PA outcome. We conducted a sensitivityanalysis adjusting for participant rewear of the accelerometer.
The loss of the intervention session data was reported to the TSC. At the subsequent TSC meeting(on 6 July 2017), its members recommended that we attempt to recover the session recordings from othersources and conduct the fidelity analysis in accordance with the original plan as closely as possible. Of thedata lost, we were able to recover approximately 400 hours from local backups and physical audiotapes,with the co-operation of university IT services and previous HLF staff. This precluded us from conductingthe a priori fidelity analysis and randomly selecting coding data from a larger sample of tapes in thedatabase. Instead, we adapted our analysis plan to code and analyse all of the limited, non-random datathat were available. Furthermore, we had planned to use the data from the fidelity assessment to determinewhether or not the levels of competencies between the HLFs were associated with variations in patientoutcomes or mediated the treatment effect. However, the quality of the data recovered precluded usfrom conducting this analysis as well. See Chapter 8 for further details on our adapted fidelity analysis.
DOI: 10.3310/hta23690 HEALTH TECHNOLOGY ASSESSMENT 2019 VOL. 23 NO. 69
© Queen’s Printer and Controller of HMSO 2019. This work was produced by Ismail et al. under the terms of a commissioning contract issued by the Secretary of State for Healthand Social Care. This issue may be freely reproduced for the purposes of private research and study and extracts (or indeed, the full report) may be included in professionaljournals provided that suitable acknowledgement is made and the reproduction is not associated with any form of advertising. Applications for commercial reproduction shouldbe addressed to: NIHR Journals Library, National Institute for Health Research, Evaluation, Trials and Studies Coordinating Centre, Alpha House, University of Southampton SciencePark, Southampton SO16 7NS, UK.
27

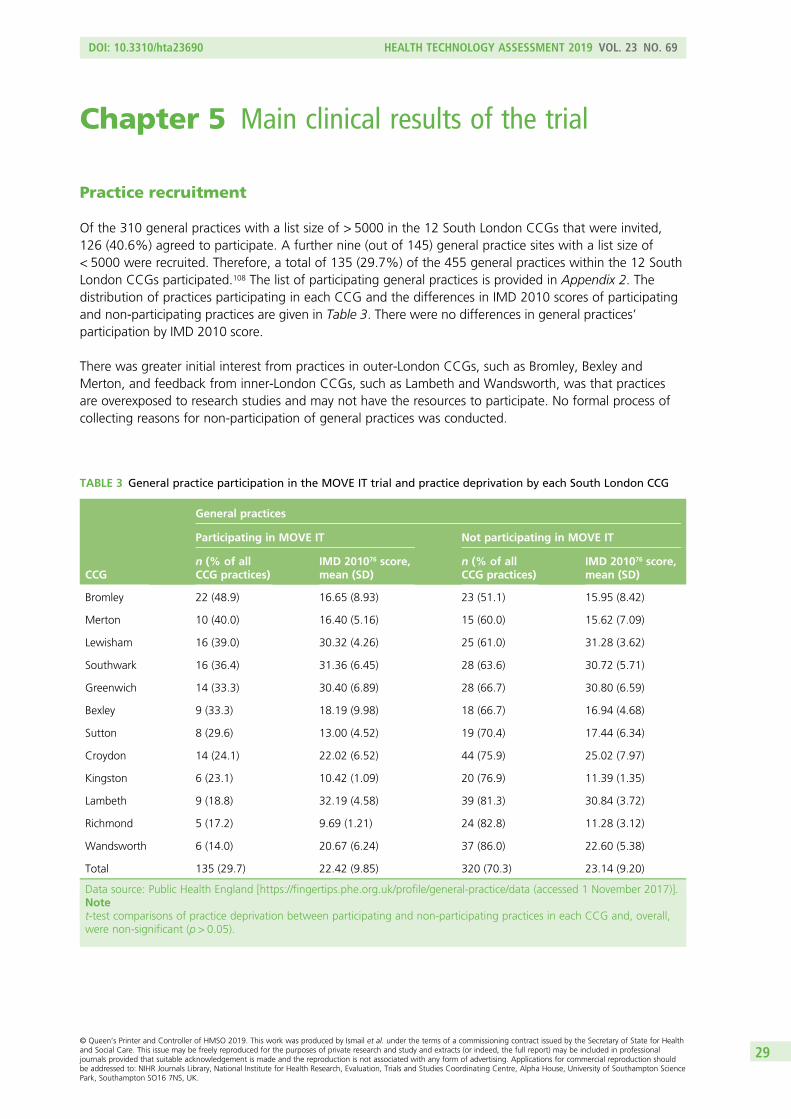
Chapter 5 Main clinical results of the trial
Practice recruitment
Of the 310 general practices with a list size of > 5000 in the 12 South London CCGs that were invited,126 (40.6%) agreed to participate. A further nine (out of 145) general practice sites with a list size of< 5000 were recruited. Therefore, a total of 135 (29.7%) of the 455 general practices within the 12 SouthLondon CCGs participated.108 The list of participating general practices is provided in Appendix 2. Thedistribution of practices participating in each CCG and the differences in IMD 2010 scores of participatingand non-participating practices are given in Table 3. There were no differences in general practices’participation by IMD 2010 score.
There was greater initial interest from practices in outer-London CCGs, such as Bromley, Bexley andMerton, and feedback from inner-London CCGs, such as Lambeth and Wandsworth, was that practicesare overexposed to research studies and may not have the resources to participate. No formal process ofcollecting reasons for non-participation of general practices was conducted.
TABLE 3 General practice participation in the MOVE IT trial and practice deprivation by each South London CCG
CCG
General practices
Participating in MOVE IT Not participating in MOVE IT
n (% of allCCG practices)
IMD 201076 score,mean (SD)
n (% of allCCG practices)
IMD 201076 score,mean (SD)
Bromley 22 (48.9) 16.65 (8.93) 23 (51.1) 15.95 (8.42)
Merton 10 (40.0) 16.40 (5.16) 15 (60.0) 15.62 (7.09)
Lewisham 16 (39.0) 30.32 (4.26) 25 (61.0) 31.28 (3.62)
Southwark 16 (36.4) 31.36 (6.45) 28 (63.6) 30.72 (5.71)
Greenwich 14 (33.3) 30.40 (6.89) 28 (66.7) 30.80 (6.59)
Bexley 9 (33.3) 18.19 (9.98) 18 (66.7) 16.94 (4.68)
Sutton 8 (29.6) 13.00 (4.52) 19 (70.4) 17.44 (6.34)
Croydon 14 (24.1) 22.02 (6.52) 44 (75.9) 25.02 (7.97)
Kingston 6 (23.1) 10.42 (1.09) 20 (76.9) 11.39 (1.35)
Lambeth 9 (18.8) 32.19 (4.58) 39 (81.3) 30.84 (3.72)
Richmond 5 (17.2) 9.69 (1.21) 24 (82.8) 11.28 (3.12)
Wandsworth 6 (14.0) 20.67 (6.24) 37 (86.0) 22.60 (5.38)
Total 135 (29.7) 22.42 (9.85) 320 (70.3) 23.14 (9.20)
Data source: Public Health England [https://fingertips.phe.org.uk/profile/general-practice/data (accessed 1 November 2017)].Notet-test comparisons of practice deprivation between participating and non-participating practices in each CCG and, overall,were non-significant (p > 0.05).
DOI: 10.3310/hta23690 HEALTH TECHNOLOGY ASSESSMENT 2019 VOL. 23 NO. 69
© Queen’s Printer and Controller of HMSO 2019. This work was produced by Ismail et al. under the terms of a commissioning contract issued by the Secretary of State for Healthand Social Care. This issue may be freely reproduced for the purposes of private research and study and extracts (or indeed, the full report) may be included in professionaljournals provided that suitable acknowledgement is made and the reproduction is not associated with any form of advertising. Applications for commercial reproduction shouldbe addressed to: NIHR Journals Library, National Institute for Health Research, Evaluation, Trials and Studies Coordinating Centre, Alpha House, University of Southampton SciencePark, Southampton SO16 7NS, UK.
29
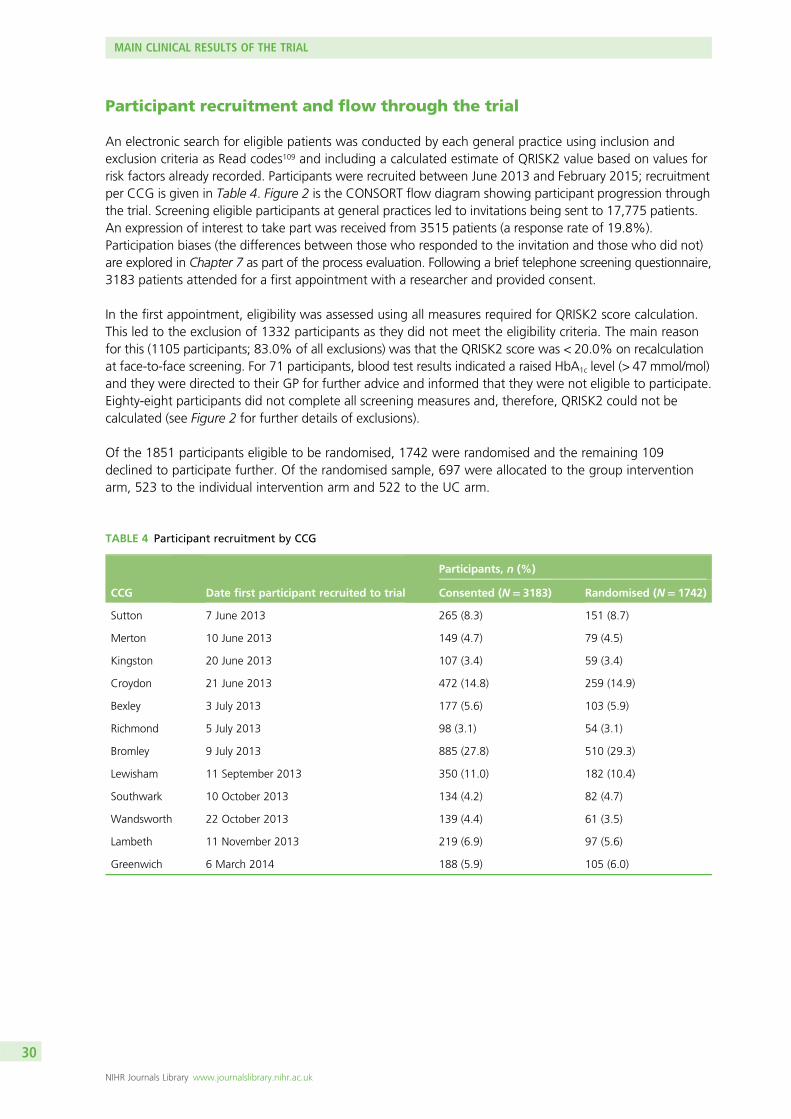
Participant recruitment and flow through the trial
An electronic search for eligible patients was conducted by each general practice using inclusion andexclusion criteria as Read codes109 and including a calculated estimate of QRISK2 value based on values forrisk factors already recorded. Participants were recruited between June 2013 and February 2015; recruitmentper CCG is given in Table 4. Figure 2 is the CONSORT flow diagram showing participant progression throughthe trial. Screening eligible participants at general practices led to invitations being sent to 17,775 patients.An expression of interest to take part was received from 3515 patients (a response rate of 19.8%).Participation biases (the differences between those who responded to the invitation and those who did not)are explored in Chapter 7 as part of the process evaluation. Following a brief telephone screening questionnaire,3183 patients attended for a first appointment with a researcher and provided consent.
In the first appointment, eligibility was assessed using all measures required for QRISK2 score calculation.This led to the exclusion of 1332 participants as they did not meet the eligibility criteria. The main reasonfor this (1105 participants; 83.0% of all exclusions) was that the QRISK2 score was < 20.0% on recalculationat face-to-face screening. For 71 participants, blood test results indicated a raised HbA1c level (> 47mmol/mol)and they were directed to their GP for further advice and informed that they were not eligible to participate.Eighty-eight participants did not complete all screening measures and, therefore, QRISK2 could not becalculated (see Figure 2 for further details of exclusions).
Of the 1851 participants eligible to be randomised, 1742 were randomised and the remaining 109declined to participate further. Of the randomised sample, 697 were allocated to the group interventionarm, 523 to the individual intervention arm and 522 to the UC arm.
TABLE 4 Participant recruitment by CCG
CCG Date first participant recruited to trial
Participants, n (%)
Consented (N= 3183) Randomised (N= 1742)
Sutton 7 June 2013 265 (8.3) 151 (8.7)
Merton 10 June 2013 149 (4.7) 79 (4.5)
Kingston 20 June 2013 107 (3.4) 59 (3.4)
Croydon 21 June 2013 472 (14.8) 259 (14.9)
Bexley 3 July 2013 177 (5.6) 103 (5.9)
Richmond 5 July 2013 98 (3.1) 54 (3.1)
Bromley 9 July 2013 885 (27.8) 510 (29.3)
Lewisham 11 September 2013 350 (11.0) 182 (10.4)
Southwark 10 October 2013 134 (4.2) 82 (4.7)
Wandsworth 22 October 2013 139 (4.4) 61 (3.5)
Lambeth 11 November 2013 219 (6.9) 97 (5.6)
Greenwich 6 March 2014 188 (5.9) 105 (6.0)
MAIN CLINICAL RESULTS OF THE TRIAL
NIHR Journals Library www.journalslibrary.nihr.ac.uk
30
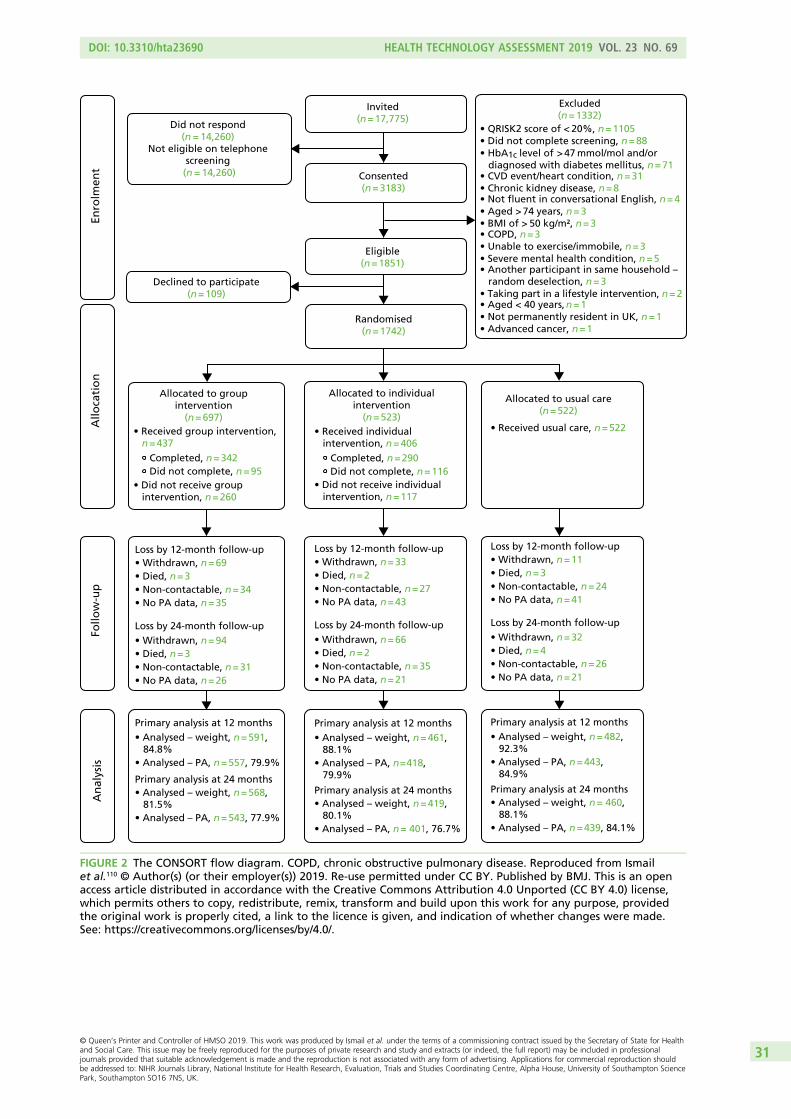
Excluded(n=1332)
• QRISK2 score of < 20%, n =1105• Did not complete screening, n =88• HbA1c > 47 mmol/mol and/or diagnosed with diabetes mellitus, n = 71• CVD event/heart condition, n =31• Chronic kidney disease, n =8• Not fluent in conversational English, n = 4• Aged >74 years, n =3• BMI of > 50 kg/m², n=3• COPD, n =3• Unable to exercise/immobile, n =3• Severe mental health condition, n =5• Another participant in same household – random deselection, n =3• Taking part in a lifestyle intervention, n=2• Aged < 40 years, n=1• Not permanently resident in UK, n =1• Advanced cancer, n =1
Allocated to groupintervention
(n=697)• Received group intervention,
n =437 Completed, n =342 Did not complete, n =95
• Did not receive group intervention, n =260
Allocated to individualintervention
(n=523)• Received individual intervention, n =406
Completed, n =290 Did not complete, n =116
• Did not receive individual intervention, n =117
Allocated to usual care(n=522)
• Received usual care, n=522
Loss by 12-month follow-up• Withdrawn, n =69• Died, n =3• Non-contactable, n =34• No PA data, n =35
Loss by 24-month follow-up• Withdrawn, n =94• Died, n =3• Non-contactable, n =31• No PA data, n =26
Primary analysis at 12 months• Analysed – weight, n = 591, 84.8%• Analysed – PA, n = 557, 79.9%
• Analysed – weight, n = 568, 81.5%• Analysed – PA, n = 543, 77.9%
Primary analysis at 24 months
Consented(n=3183)
Eligible(n=1851)
Invited(n=17,775)
Did not respond (n = 14,260)
Not eligible on telephone screening
(n = 14,260)
Randomised(n=1742)
Declined to participate(n=109)
Enro
lmen
tA
lloca
tio
nFo
llow
-up
An
alys
is
Loss by 12-month follow-up• Withdrawn, n =33 • Died, n=2• Non-contactable, n =27• No PA data, n =43
Loss by 24-month follow-up• Withdrawn, n =66• Died, n=2• Non-contactable, n =35• No PA data, n =21
Loss by 12-month follow-up• Withdrawn, n =11• Died, n =3• Non-contactable, n =24• No PA data, n =41
Loss by 24-month follow-up• Withdrawn, n =32• Died, n =4• Non-contactable, n =26• No PA data, n =21
Primary analysis at 12 months• Analysed – weight, n = 461, 88.1%• Analysed – PA, n = 418, 79.9%
• Analysed – weight, n = 419, 80.1%• Analysed – PA, n = 401, 76.7%
Primary analysis at 24 months
Primary analysis at 12 months • Analysed – weight, n = 482, 92.3%• Analysed – PA, n = 443, 84.9%
• Analysed – weight, n = 460, 88.1%• Analysed – PA, n = 439, 84.1%
Primary analysis at 24 months
level of
FIGURE 2 The CONSORT flow diagram. COPD, chronic obstructive pulmonary disease. Reproduced from Ismailet al.110 © Author(s) (or their employer(s)) 2019. Re-use permitted under CC BY. Published by BMJ. This is an openaccess article distributed in accordance with the Creative Commons Attribution 4.0 Unported (CC BY 4.0) license,which permits others to copy, redistribute, remix, transform and build upon this work for any purpose, providedthe original work is properly cited, a link to the licence is given, and indication of whether changes were made.See: https://creativecommons.org/licenses/by/4.0/.
DOI: 10.3310/hta23690 HEALTH TECHNOLOGY ASSESSMENT 2019 VOL. 23 NO. 69
© Queen’s Printer and Controller of HMSO 2019. This work was produced by Ismail et al. under the terms of a commissioning contract issued by the Secretary of State for Healthand Social Care. This issue may be freely reproduced for the purposes of private research and study and extracts (or indeed, the full report) may be included in professionaljournals provided that suitable acknowledgement is made and the reproduction is not associated with any form of advertising. Applications for commercial reproduction shouldbe addressed to: NIHR Journals Library, National Institute for Health Research, Evaluation, Trials and Studies Coordinating Centre, Alpha House, University of Southampton SciencePark, Southampton SO16 7NS, UK.
31
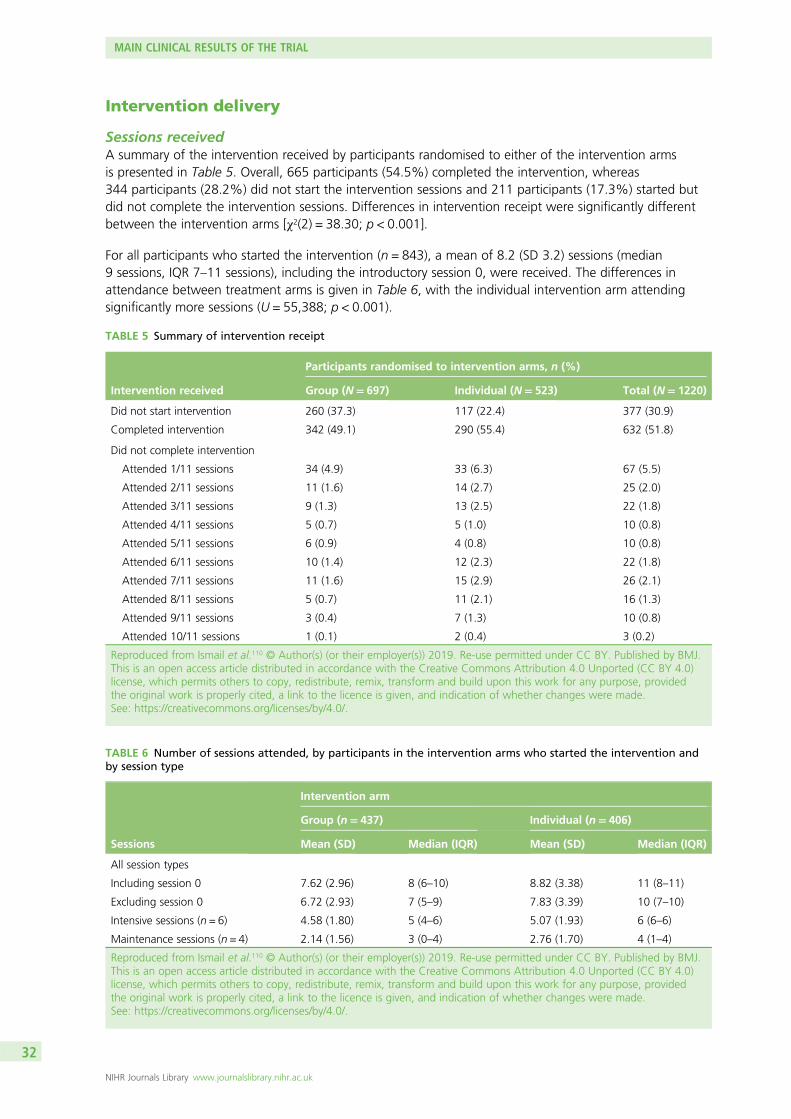
Intervention delivery
Sessions receivedA summary of the intervention received by participants randomised to either of the intervention armsis presented in Table 5. Overall, 665 participants (54.5%) completed the intervention, whereas344 participants (28.2%) did not start the intervention sessions and 211 participants (17.3%) started butdid not complete the intervention sessions. Differences in intervention receipt were significantly differentbetween the intervention arms [χ2(2) = 38.30; p < 0.001].
For all participants who started the intervention (n = 843), a mean of 8.2 (SD 3.2) sessions (median9 sessions, IQR 7–11 sessions), including the introductory session 0, were received. The differences inattendance between treatment arms is given in Table 6, with the individual intervention arm attendingsignificantly more sessions (U = 55,388; p < 0.001).
TABLE 5 Summary of intervention receipt
Intervention received
Participants randomised to intervention arms, n (%)
Group (N= 697) Individual (N= 523) Total (N= 1220)
Did not start intervention 260 (37.3) 117 (22.4) 377 (30.9)
Completed intervention 342 (49.1) 290 (55.4) 632 (51.8)
Did not complete intervention
Attended 1/11 sessions 34 (4.9) 33 (6.3) 67 (5.5)
Attended 2/11 sessions 11 (1.6) 14 (2.7) 25 (2.0)
Attended 3/11 sessions 9 (1.3) 13 (2.5) 22 (1.8)
Attended 4/11 sessions 5 (0.7) 5 (1.0) 10 (0.8)
Attended 5/11 sessions 6 (0.9) 4 (0.8) 10 (0.8)
Attended 6/11 sessions 10 (1.4) 12 (2.3) 22 (1.8)
Attended 7/11 sessions 11 (1.6) 15 (2.9) 26 (2.1)
Attended 8/11 sessions 5 (0.7) 11 (2.1) 16 (1.3)
Attended 9/11 sessions 3 (0.4) 7 (1.3) 10 (0.8)
Attended 10/11 sessions 1 (0.1) 2 (0.4) 3 (0.2)
Reproduced from Ismail et al.110 © Author(s) (or their employer(s)) 2019. Re-use permitted under CC BY. Published by BMJ.This is an open access article distributed in accordance with the Creative Commons Attribution 4.0 Unported (CC BY 4.0)license, which permits others to copy, redistribute, remix, transform and build upon this work for any purpose, providedthe original work is properly cited, a link to the licence is given, and indication of whether changes were made.See: https://creativecommons.org/licenses/by/4.0/.
TABLE 6 Number of sessions attended, by participants in the intervention arms who started the intervention andby session type
Sessions
Intervention arm
Group (n= 437) Individual (n= 406)
Mean (SD) Median (IQR) Mean (SD) Median (IQR)
All session types
Including session 0 7.62 (2.96) 8 (6–10) 8.82 (3.38) 11 (8–11)
Excluding session 0 6.72 (2.93) 7 (5–9) 7.83 (3.39) 10 (7–10)
Intensive sessions (n = 6) 4.58 (1.80) 5 (4–6) 5.07 (1.93) 6 (6–6)
Maintenance sessions (n = 4) 2.14 (1.56) 3 (0–4) 2.76 (1.70) 4 (1–4)
Reproduced from Ismail et al.110 © Author(s) (or their employer(s)) 2019. Re-use permitted under CC BY. Published by BMJ.This is an open access article distributed in accordance with the Creative Commons Attribution 4.0 Unported (CC BY 4.0)license, which permits others to copy, redistribute, remix, transform and build upon this work for any purpose, providedthe original work is properly cited, a link to the licence is given, and indication of whether changes were made.See: https://creativecommons.org/licenses/by/4.0/.
MAIN CLINICAL RESULTS OF THE TRIAL
NIHR Journals Library www.journalslibrary.nihr.ac.uk
32
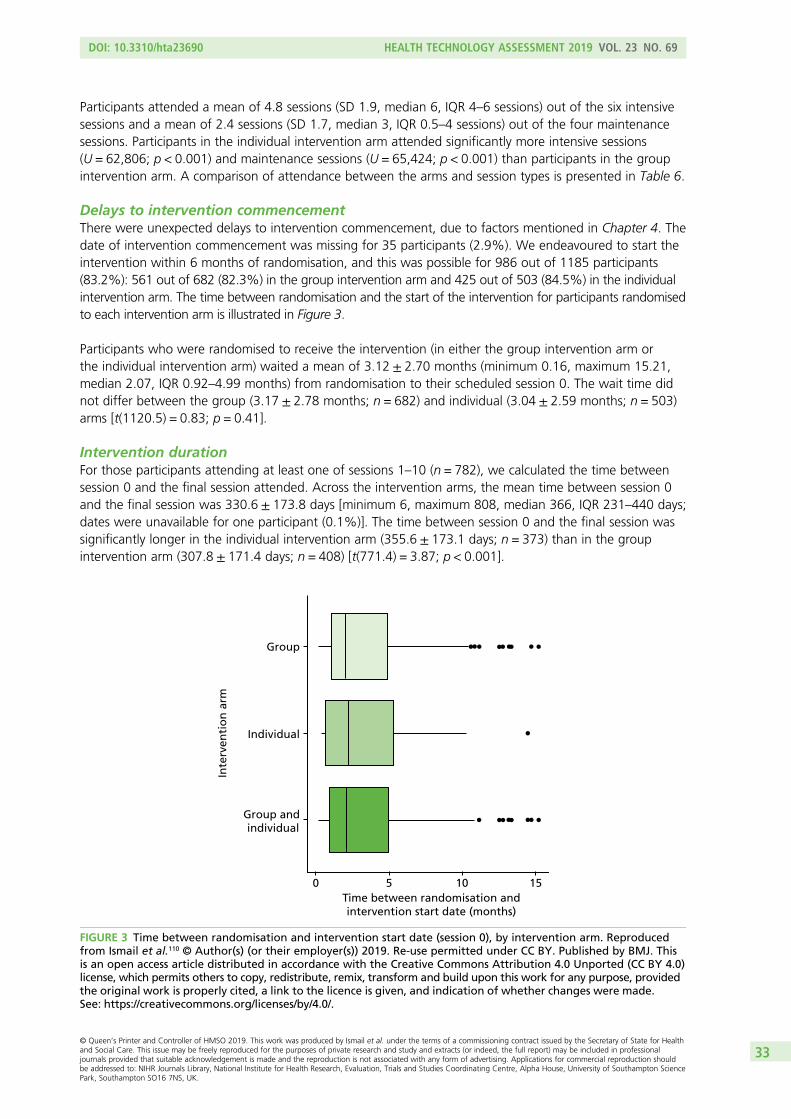
Participants attended a mean of 4.8 sessions (SD 1.9, median 6, IQR 4–6 sessions) out of the six intensivesessions and a mean of 2.4 sessions (SD 1.7, median 3, IQR 0.5–4 sessions) out of the four maintenancesessions. Participants in the individual intervention arm attended significantly more intensive sessions(U = 62,806; p < 0.001) and maintenance sessions (U = 65,424; p < 0.001) than participants in the groupintervention arm. A comparison of attendance between the arms and session types is presented in Table 6.
Delays to intervention commencementThere were unexpected delays to intervention commencement, due to factors mentioned in Chapter 4. Thedate of intervention commencement was missing for 35 participants (2.9%). We endeavoured to start theintervention within 6 months of randomisation, and this was possible for 986 out of 1185 participants(83.2%): 561 out of 682 (82.3%) in the group intervention arm and 425 out of 503 (84.5%) in the individualintervention arm. The time between randomisation and the start of the intervention for participants randomisedto each intervention arm is illustrated in Figure 3.
Participants who were randomised to receive the intervention (in either the group intervention arm orthe individual intervention arm) waited a mean of 3.12 ± 2.70 months (minimum 0.16, maximum 15.21,median 2.07, IQR 0.92–4.99 months) from randomisation to their scheduled session 0. The wait time didnot differ between the group (3.17 ± 2.78 months; n = 682) and individual (3.04 ± 2.59 months; n = 503)arms [t(1120.5) = 0.83; p = 0.41].
Intervention durationFor those participants attending at least one of sessions 1–10 (n = 782), we calculated the time betweensession 0 and the final session attended. Across the intervention arms, the mean time between session 0and the final session was 330.6 ± 173.8 days [minimum 6, maximum 808, median 366, IQR 231–440 days;dates were unavailable for one participant (0.1%)]. The time between session 0 and the final session wassignificantly longer in the individual intervention arm (355.6 ± 173.1 days; n = 373) than in the groupintervention arm (307.8 ± 171.4 days; n = 408) [t(771.4) = 3.87; p < 0.001].
Time between randomisation andintervention start date (months)
Inte
rven
tio
n a
rm
Group
Individual
Group and individual
0 5 10 15
FIGURE 3 Time between randomisation and intervention start date (session 0), by intervention arm. Reproducedfrom Ismail et al.110 © Author(s) (or their employer(s)) 2019. Re-use permitted under CC BY. Published by BMJ. Thisis an open access article distributed in accordance with the Creative Commons Attribution 4.0 Unported (CC BY 4.0)license, which permits others to copy, redistribute, remix, transform and build upon this work for any purpose, providedthe original work is properly cited, a link to the licence is given, and indication of whether changes were made.See: https://creativecommons.org/licenses/by/4.0/.
DOI: 10.3310/hta23690 HEALTH TECHNOLOGY ASSESSMENT 2019 VOL. 23 NO. 69
© Queen’s Printer and Controller of HMSO 2019. This work was produced by Ismail et al. under the terms of a commissioning contract issued by the Secretary of State for Healthand Social Care. This issue may be freely reproduced for the purposes of private research and study and extracts (or indeed, the full report) may be included in professionaljournals provided that suitable acknowledgement is made and the reproduction is not associated with any form of advertising. Applications for commercial reproduction shouldbe addressed to: NIHR Journals Library, National Institute for Health Research, Evaluation, Trials and Studies Coordinating Centre, Alpha House, University of Southampton SciencePark, Southampton SO16 7NS, UK.
33
Reasons for not starting or not completing the interventionWhen participants decided not to start the intervention that they had been randomly allocated to, theywere invited to provide a reason for this. When participants decided to stop attending intervention sessionsbefore the course finished, they were also asked for a reason. Table 7 presents the reasons given for notstarting or not completing the intervention by participants in each intervention arm.
We qualitatively explore the reasons for non-completers withdrawing from treatment, as part of theprocess evaluation, in Chapter 9.
Participant adherence to the interventionAfter the completion of each intervention session, the HLF was responsible for recording (1) if theparticipant set a target for that session (yes/no) and (2) if that target was achieved (coded as no/partially/fully). Session 0 was not included as participants were not asked to set goals for that session.
Of the 1220 participants randomised to the intervention arms, 774 (63.44%) had available adherencedata. Of those, 407 (58.39% of those randomised) were in the group intervention arm and 367 (70.17%of those randomised) were in the individual intervention arm.
The 774 participants attended a total of 5932 sessions. Table 8 shows the rate of targets set overall and byintervention arm and Figure 4 shows the number of targets set at each session. The overall rate of targetsset differed significantly between arms [χ2(1) = 6.12; p = 0.01] but the distribution of targets set at eachsession did not differ significantly between arms [χ2(9) = 16.18; p = 0.06].
For each target set, the HLF also recorded if the participant achieved it; achievement was rated as‘not at all’, ‘partially’ or ‘fully’. Table 9 shows the number of targets achieved by intervention arm andin total; the distribution of targets achieved (excluding missing data) differed significantly between arms[χ2(2) = 7.25; p = 0.03]. Figure 5 shows the distribution of target achievement at each session number.
TABLE 7 Reason given for not starting or not completing the intervention, by participants in each intervention arm
Reason
Intervention arm, n (%)
Group Individual
Did not startintervention(N= 103)
Did not completeintervention(N= 116)
Did not startintervention(N= 241)
Did not completeintervention(N= 95)
Delay to start of intervention 3 (1.2) 1 (1.1) 2 (1.7) 4 (3.4)
Ill health 12 (4.6) 7 (7.4) 6 (5.1) 10 (8.6)
Location of sessions 24 (9.2) 3 (3.2) 2 (1.7) 1 (0.9)
Multiple reasons 9 (3.5) 3 (3.2) 3 (2.6) 2 (1.7)
No benefit 6 (2.3) 11 (11.6) 5 (4.3) 4 (3.4)
No longer interested 41 (15.8) 13 (13.7) 14 (12.0) 18 (15.5)
Other 7 (2.7) 6 (6.3) 2 (1.7) 6 (5.2)
Too busy 68 (26.2) 20 (21.1) 26 (22.2) 38 (32.8)
Unable to contact 31 (11.9) 13 (13.7) 25 (21.4) 20 (17.2)
Unhappy with intervention design 7 (2.7) 9 (9.5) 6 (5.1) 10 (8.6)
Unknown 52 (20.0) 9 (9.5) 26 (22.2) 3 (2.6)
MAIN CLINICAL RESULTS OF THE TRIAL
NIHR Journals Library www.journalslibrary.nihr.ac.uk
34
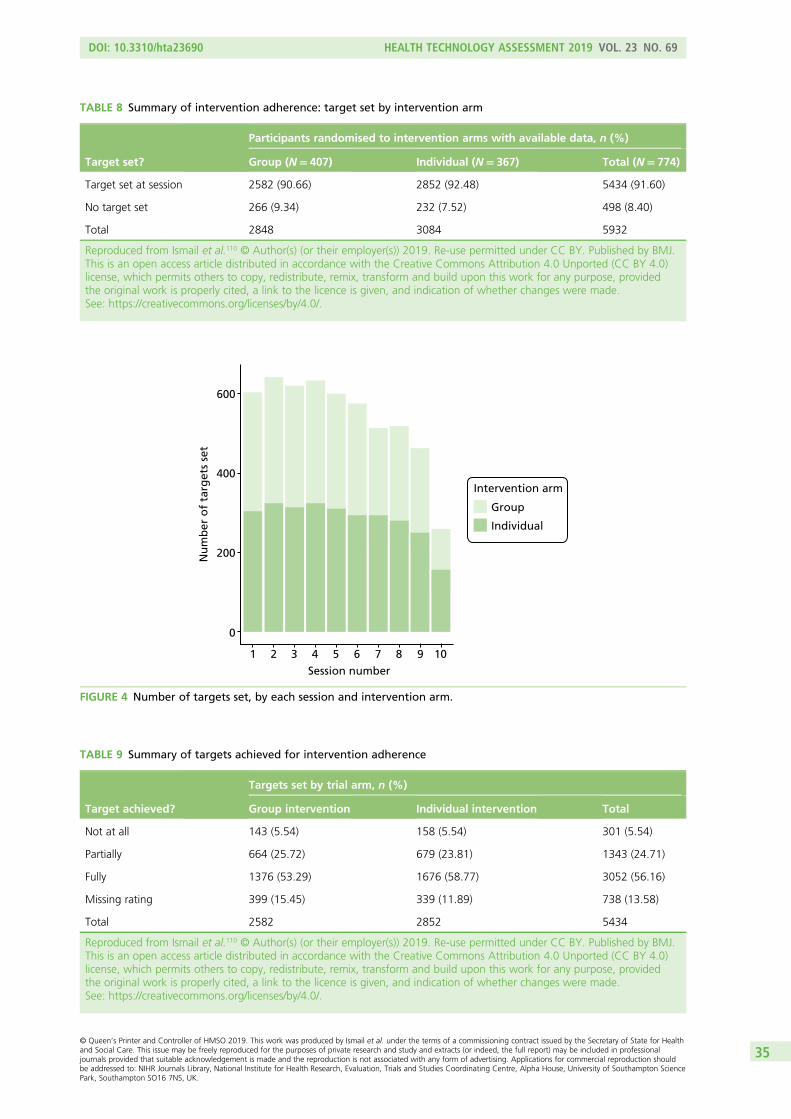
Session number1 2 3 4 5 6 7 8 9 10
Nu
mb
er o
f ta
rget
s se
t
600
400
200
0
Intervention arm
Group
Individual
FIGURE 4 Number of targets set, by each session and intervention arm.
TABLE 9 Summary of targets achieved for intervention adherence
Target achieved?
Targets set by trial arm, n (%)
Group intervention Individual intervention Total
Not at all 143 (5.54) 158 (5.54) 301 (5.54)
Partially 664 (25.72) 679 (23.81) 1343 (24.71)
Fully 1376 (53.29) 1676 (58.77) 3052 (56.16)
Missing rating 399 (15.45) 339 (11.89) 738 (13.58)
Total 2582 2852 5434
Reproduced from Ismail et al.110 © Author(s) (or their employer(s)) 2019. Re-use permitted under CC BY. Published by BMJ.This is an open access article distributed in accordance with the Creative Commons Attribution 4.0 Unported (CC BY 4.0)license, which permits others to copy, redistribute, remix, transform and build upon this work for any purpose, providedthe original work is properly cited, a link to the licence is given, and indication of whether changes were made.See: https://creativecommons.org/licenses/by/4.0/.
TABLE 8 Summary of intervention adherence: target set by intervention arm
Target set?
Participants randomised to intervention arms with available data, n (%)
Group (N= 407) Individual (N= 367) Total (N= 774)
Target set at session 2582 (90.66) 2852 (92.48) 5434 (91.60)
No target set 266 (9.34) 232 (7.52) 498 (8.40)
Total 2848 3084 5932
Reproduced from Ismail et al.110 © Author(s) (or their employer(s)) 2019. Re-use permitted under CC BY. Published by BMJ.This is an open access article distributed in accordance with the Creative Commons Attribution 4.0 Unported (CC BY 4.0)license, which permits others to copy, redistribute, remix, transform and build upon this work for any purpose, providedthe original work is properly cited, a link to the licence is given, and indication of whether changes were made.See: https://creativecommons.org/licenses/by/4.0/.
DOI: 10.3310/hta23690 HEALTH TECHNOLOGY ASSESSMENT 2019 VOL. 23 NO. 69
© Queen’s Printer and Controller of HMSO 2019. This work was produced by Ismail et al. under the terms of a commissioning contract issued by the Secretary of State for Healthand Social Care. This issue may be freely reproduced for the purposes of private research and study and extracts (or indeed, the full report) may be included in professionaljournals provided that suitable acknowledgement is made and the reproduction is not associated with any form of advertising. Applications for commercial reproduction shouldbe addressed to: NIHR Journals Library, National Institute for Health Research, Evaluation, Trials and Studies Coordinating Centre, Alpha House, University of Southampton SciencePark, Southampton SO16 7NS, UK.
35
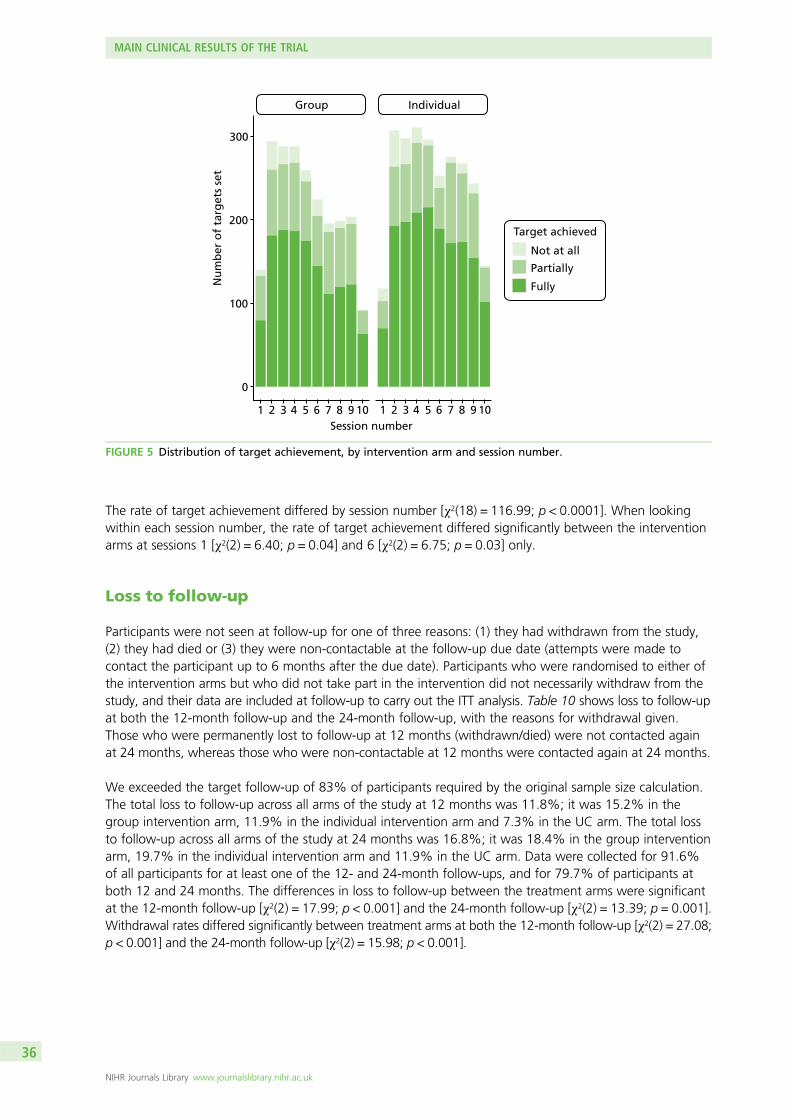
The rate of target achievement differed by session number [χ2(18) = 116.99; p < 0.0001]. When lookingwithin each session number, the rate of target achievement differed significantly between the interventionarms at sessions 1 [χ2(2) = 6.40; p = 0.04] and 6 [χ2(2) = 6.75; p = 0.03] only.
Loss to follow-up
Participants were not seen at follow-up for one of three reasons: (1) they had withdrawn from the study,(2) they had died or (3) they were non-contactable at the follow-up due date (attempts were made tocontact the participant up to 6 months after the due date). Participants who were randomised to either ofthe intervention arms but who did not take part in the intervention did not necessarily withdraw from thestudy, and their data are included at follow-up to carry out the ITT analysis. Table 10 shows loss to follow-upat both the 12-month follow-up and the 24-month follow-up, with the reasons for withdrawal given.Those who were permanently lost to follow-up at 12 months (withdrawn/died) were not contacted againat 24 months, whereas those who were non-contactable at 12 months were contacted again at 24 months.
We exceeded the target follow-up of 83% of participants required by the original sample size calculation.The total loss to follow-up across all arms of the study at 12 months was 11.8%; it was 15.2% in thegroup intervention arm, 11.9% in the individual intervention arm and 7.3% in the UC arm. The total lossto follow-up across all arms of the study at 24 months was 16.8%; it was 18.4% in the group interventionarm, 19.7% in the individual intervention arm and 11.9% in the UC arm. Data were collected for 91.6%of all participants for at least one of the 12- and 24-month follow-ups, and for 79.7% of participants atboth 12 and 24 months. The differences in loss to follow-up between the treatment arms were significantat the 12-month follow-up [χ2(2) = 17.99; p < 0.001] and the 24-month follow-up [χ2(2) = 13.39; p = 0.001].Withdrawal rates differed significantly between treatment arms at both the 12-month follow-up [χ2(2) = 27.08;p < 0.001] and the 24-month follow-up [χ2(2) = 15.98; p < 0.001].
Session number1 2 3 4 5 6 7 8 9 10 1 2 3 4 5 6 7 8 9 10
300
200
100
0
Nu
mb
er o
f ta
rget
s se
t
Group Individual
Target achieved
Not at all
Partially
Fully
FIGURE 5 Distribution of target achievement, by intervention arm and session number.
MAIN CLINICAL RESULTS OF THE TRIAL
NIHR Journals Library www.journalslibrary.nihr.ac.uk
36
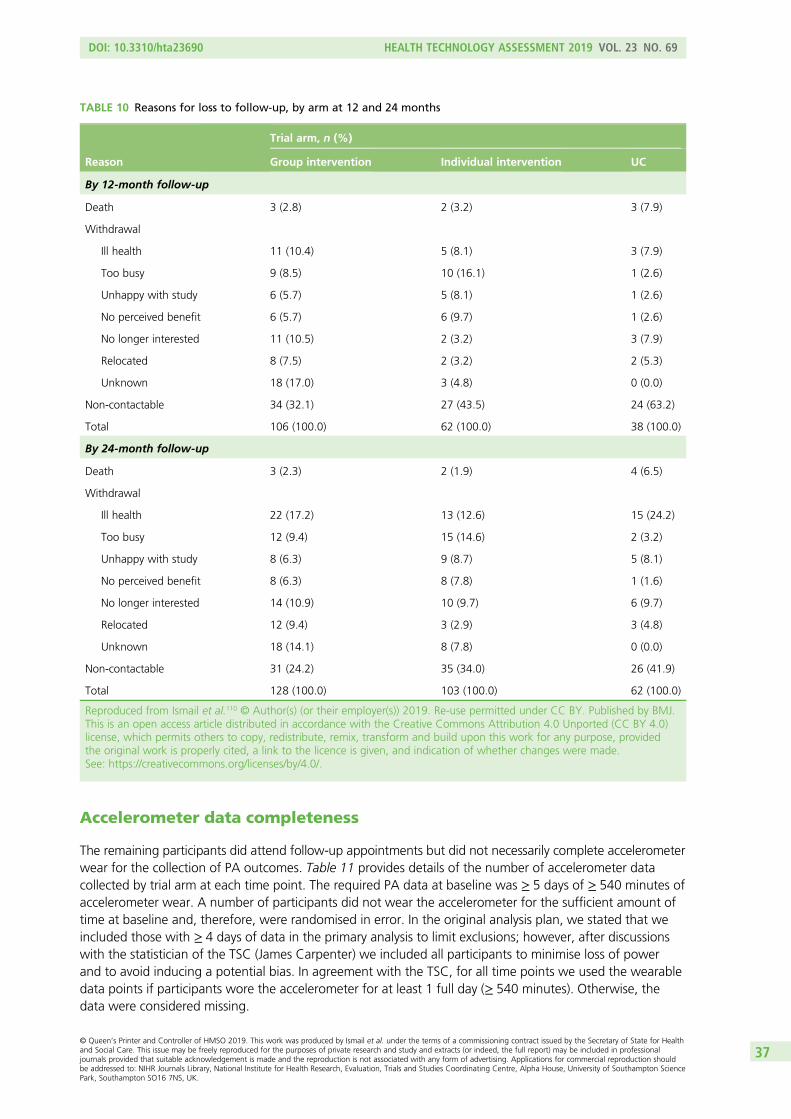
Accelerometer data completeness
The remaining participants did attend follow-up appointments but did not necessarily complete accelerometerwear for the collection of PA outcomes. Table 11 provides details of the number of accelerometer datacollected by trial arm at each time point. The required PA data at baseline was ≥ 5 days of ≥ 540 minutes ofaccelerometer wear. A number of participants did not wear the accelerometer for the sufficient amount oftime at baseline and, therefore, were randomised in error. In the original analysis plan, we stated that weincluded those with ≥ 4 days of data in the primary analysis to limit exclusions; however, after discussionswith the statistician of the TSC (James Carpenter) we included all participants to minimise loss of powerand to avoid inducing a potential bias. In agreement with the TSC, for all time points we used the wearabledata points if participants wore the accelerometer for at least 1 full day (≥ 540 minutes). Otherwise, thedata were considered missing.
TABLE 10 Reasons for loss to follow-up, by arm at 12 and 24 months
Reason
Trial arm, n (%)
Group intervention Individual intervention UC
By 12-month follow-up
Death 3 (2.8) 2 (3.2) 3 (7.9)
Withdrawal
Ill health 11 (10.4) 5 (8.1) 3 (7.9)
Too busy 9 (8.5) 10 (16.1) 1 (2.6)
Unhappy with study 6 (5.7) 5 (8.1) 1 (2.6)
No perceived benefit 6 (5.7) 6 (9.7) 1 (2.6)
No longer interested 11 (10.5) 2 (3.2) 3 (7.9)
Relocated 8 (7.5) 2 (3.2) 2 (5.3)
Unknown 18 (17.0) 3 (4.8) 0 (0.0)
Non-contactable 34 (32.1) 27 (43.5) 24 (63.2)
Total 106 (100.0) 62 (100.0) 38 (100.0)
By 24-month follow-up
Death 3 (2.3) 2 (1.9) 4 (6.5)
Withdrawal
Ill health 22 (17.2) 13 (12.6) 15 (24.2)
Too busy 12 (9.4) 15 (14.6) 2 (3.2)
Unhappy with study 8 (6.3) 9 (8.7) 5 (8.1)
No perceived benefit 8 (6.3) 8 (7.8) 1 (1.6)
No longer interested 14 (10.9) 10 (9.7) 6 (9.7)
Relocated 12 (9.4) 3 (2.9) 3 (4.8)
Unknown 18 (14.1) 8 (7.8) 0 (0.0)
Non-contactable 31 (24.2) 35 (34.0) 26 (41.9)
Total 128 (100.0) 103 (100.0) 62 (100.0)
Reproduced from Ismail et al.110 © Author(s) (or their employer(s)) 2019. Re-use permitted under CC BY. Published by BMJ.This is an open access article distributed in accordance with the Creative Commons Attribution 4.0 Unported (CC BY 4.0)license, which permits others to copy, redistribute, remix, transform and build upon this work for any purpose, providedthe original work is properly cited, a link to the licence is given, and indication of whether changes were made.See: https://creativecommons.org/licenses/by/4.0/.
DOI: 10.3310/hta23690 HEALTH TECHNOLOGY ASSESSMENT 2019 VOL. 23 NO. 69
© Queen’s Printer and Controller of HMSO 2019. This work was produced by Ismail et al. under the terms of a commissioning contract issued by the Secretary of State for Healthand Social Care. This issue may be freely reproduced for the purposes of private research and study and extracts (or indeed, the full report) may be included in professionaljournals provided that suitable acknowledgement is made and the reproduction is not associated with any form of advertising. Applications for commercial reproduction shouldbe addressed to: NIHR Journals Library, National Institute for Health Research, Evaluation, Trials and Studies Coordinating Centre, Alpha House, University of Southampton SciencePark, Southampton SO16 7NS, UK.
37
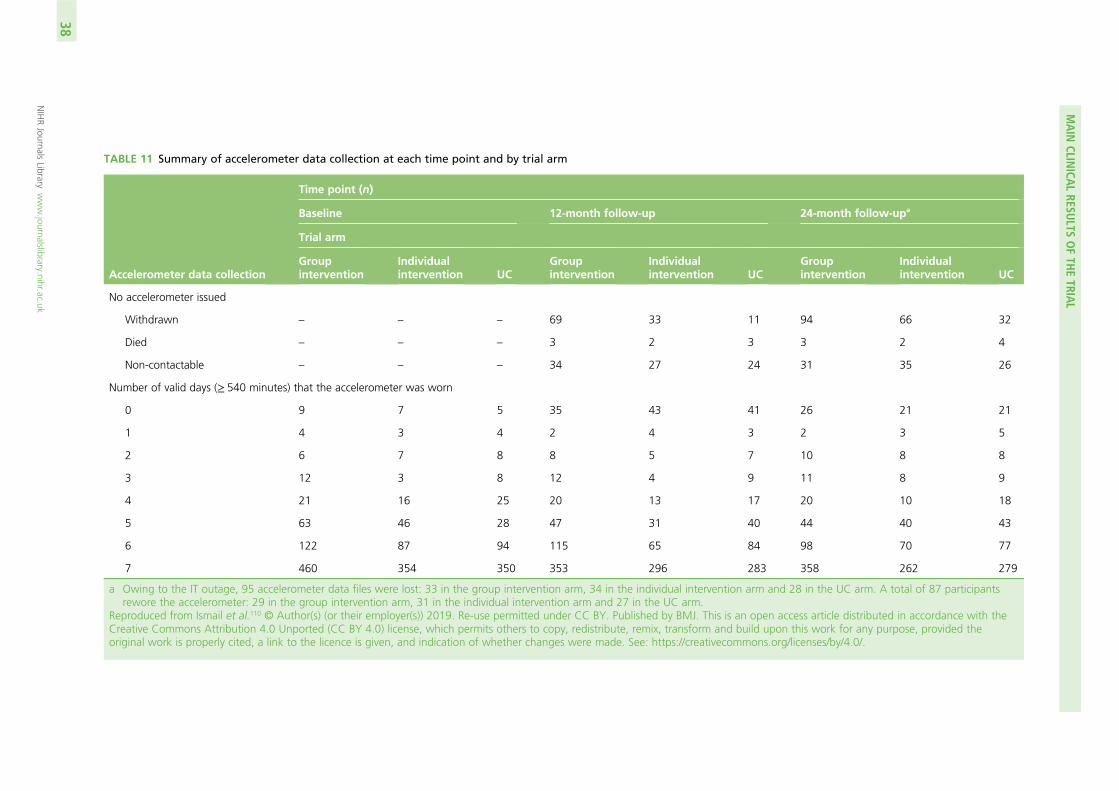
TABLE 11 Summary of accelerometer data collection at each time point and by trial arm
Accelerometer data collection
Time point (n)
Baseline 12-month follow-up 24-month follow-upa
Trial arm
Groupintervention
Individualintervention UC
Groupintervention
Individualintervention UC
Groupintervention
Individualintervention UC
No accelerometer issued
Withdrawn – – – 69 33 11 94 66 32
Died – – – 3 2 3 3 2 4
Non-contactable – – – 34 27 24 31 35 26
Number of valid days (≥ 540 minutes) that the accelerometer was worn
0 9 7 5 35 43 41 26 21 21
1 4 3 4 2 4 3 2 3 5
2 6 7 8 8 5 7 10 8 8
3 12 3 8 12 4 9 11 8 9
4 21 16 25 20 13 17 20 10 18
5 63 46 28 47 31 40 44 40 43
6 122 87 94 115 65 84 98 70 77
7 460 354 350 353 296 283 358 262 279
a Owing to the IT outage, 95 accelerometer data files were lost: 33 in the group intervention arm, 34 in the individual intervention arm and 28 in the UC arm. A total of 87 participantsrewore the accelerometer: 29 in the group intervention arm, 31 in the individual intervention arm and 27 in the UC arm.
Reproduced from Ismail et al.110 © Author(s) (or their employer(s)) 2019. Re-use permitted under CC BY. Published by BMJ. This is an open access article distributed in accordance with theCreative Commons Attribution 4.0 Unported (CC BY 4.0) license, which permits others to copy, redistribute, remix, transform and build upon this work for any purpose, provided theoriginal work is properly cited, a link to the licence is given, and indication of whether changes were made. See: https://creativecommons.org/licenses/by/4.0/.
MAIN
CLINICA
LRESU
LTSOFTH
ETRIA
L
NIHRJournals
Librarywww.journalslibrary.nihr.ac.uk
38
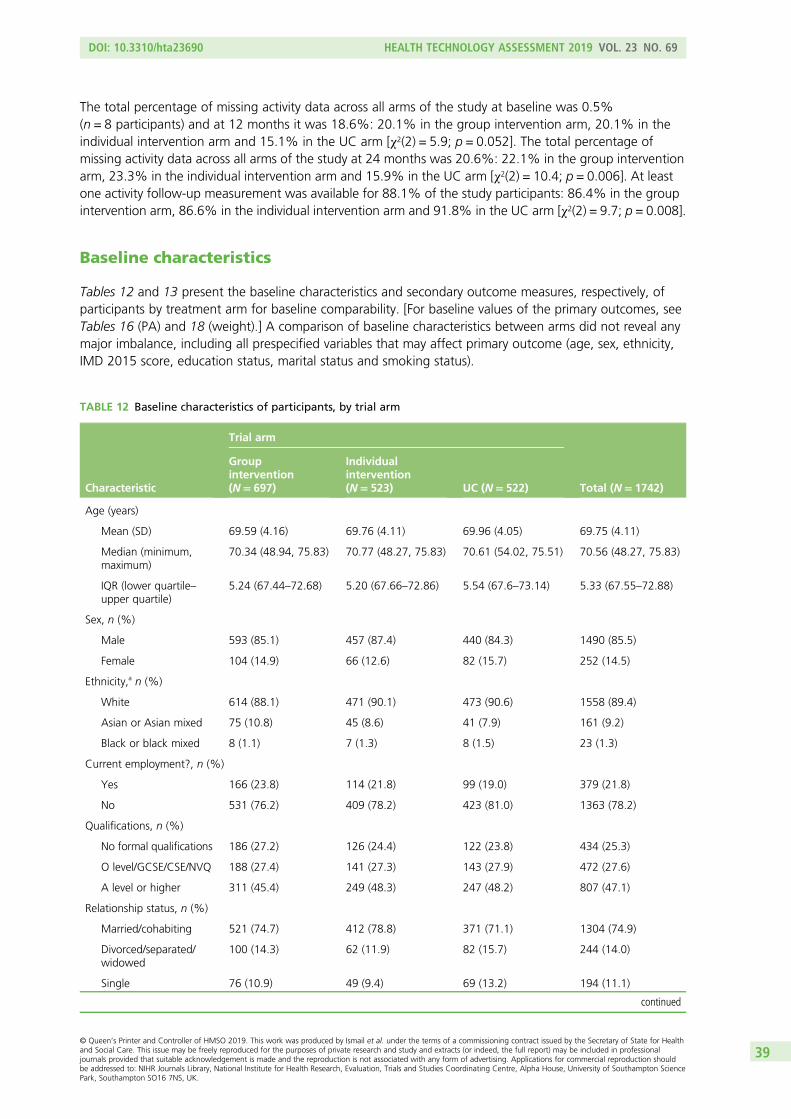
The total percentage of missing activity data across all arms of the study at baseline was 0.5%(n = 8 participants) and at 12 months it was 18.6%: 20.1% in the group intervention arm, 20.1% in theindividual intervention arm and 15.1% in the UC arm [χ2(2) = 5.9; p = 0.052]. The total percentage ofmissing activity data across all arms of the study at 24 months was 20.6%: 22.1% in the group interventionarm, 23.3% in the individual intervention arm and 15.9% in the UC arm [χ2(2) = 10.4; p = 0.006]. At leastone activity follow-up measurement was available for 88.1% of the study participants: 86.4% in the groupintervention arm, 86.6% in the individual intervention arm and 91.8% in the UC arm [χ2(2) = 9.7; p = 0.008].
Baseline characteristics
Tables 12 and 13 present the baseline characteristics and secondary outcome measures, respectively, ofparticipants by treatment arm for baseline comparability. [For baseline values of the primary outcomes, seeTables 16 (PA) and 18 (weight).] A comparison of baseline characteristics between arms did not reveal anymajor imbalance, including all prespecified variables that may affect primary outcome (age, sex, ethnicity,IMD 2015 score, education status, marital status and smoking status).
TABLE 12 Baseline characteristics of participants, by trial arm
Characteristic
Trial arm
Total (N= 1742)
Groupintervention(N= 697)
Individualintervention(N= 523) UC (N= 522)
Age (years)
Mean (SD) 69.59 (4.16) 69.76 (4.11) 69.96 (4.05) 69.75 (4.11)
Median (minimum,maximum)
70.34 (48.94, 75.83) 70.77 (48.27, 75.83) 70.61 (54.02, 75.51) 70.56 (48.27, 75.83)
IQR (lower quartile–upper quartile)
5.24 (67.44–72.68) 5.20 (67.66–72.86) 5.54 (67.6–73.14) 5.33 (67.55–72.88)
Sex, n (%)
Male 593 (85.1) 457 (87.4) 440 (84.3) 1490 (85.5)
Female 104 (14.9) 66 (12.6) 82 (15.7) 252 (14.5)
Ethnicity,a n (%)
White 614 (88.1) 471 (90.1) 473 (90.6) 1558 (89.4)
Asian or Asian mixed 75 (10.8) 45 (8.6) 41 (7.9) 161 (9.2)
Black or black mixed 8 (1.1) 7 (1.3) 8 (1.5) 23 (1.3)
Current employment?, n (%)
Yes 166 (23.8) 114 (21.8) 99 (19.0) 379 (21.8)
No 531 (76.2) 409 (78.2) 423 (81.0) 1363 (78.2)
Qualifications, n (%)
No formal qualifications 186 (27.2) 126 (24.4) 122 (23.8) 434 (25.3)
O level/GCSE/CSE/NVQ 188 (27.4) 141 (27.3) 143 (27.9) 472 (27.6)
A level or higher 311 (45.4) 249 (48.3) 247 (48.2) 807 (47.1)
Relationship status, n (%)
Married/cohabiting 521 (74.7) 412 (78.8) 371 (71.1) 1304 (74.9)
Divorced/separated/widowed
100 (14.3) 62 (11.9) 82 (15.7) 244 (14.0)
Single 76 (10.9) 49 (9.4) 69 (13.2) 194 (11.1)
continued
DOI: 10.3310/hta23690 HEALTH TECHNOLOGY ASSESSMENT 2019 VOL. 23 NO. 69
© Queen’s Printer and Controller of HMSO 2019. This work was produced by Ismail et al. under the terms of a commissioning contract issued by the Secretary of State for Healthand Social Care. This issue may be freely reproduced for the purposes of private research and study and extracts (or indeed, the full report) may be included in professionaljournals provided that suitable acknowledgement is made and the reproduction is not associated with any form of advertising. Applications for commercial reproduction shouldbe addressed to: NIHR Journals Library, National Institute for Health Research, Evaluation, Trials and Studies Coordinating Centre, Alpha House, University of Southampton SciencePark, Southampton SO16 7NS, UK.
39
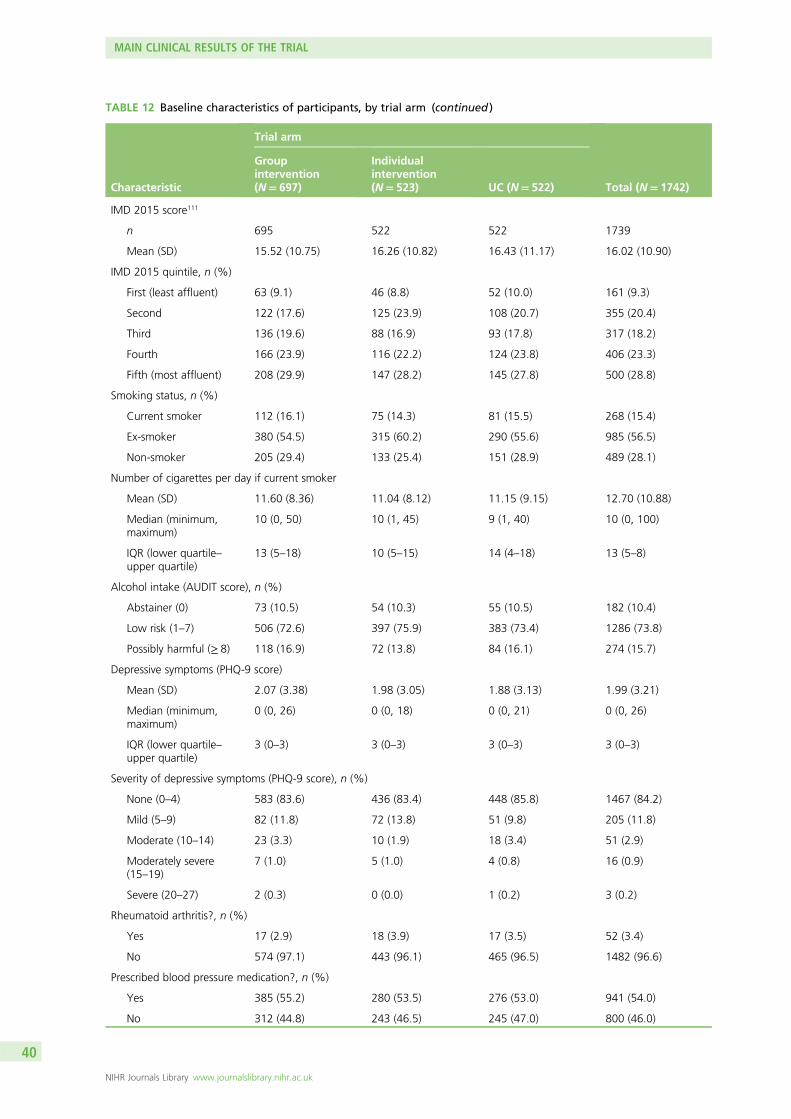
TABLE 12 Baseline characteristics of participants, by trial arm (continued )
Characteristic
Trial arm
Total (N= 1742)
Groupintervention(N= 697)
Individualintervention(N= 523) UC (N= 522)
IMD 2015 score111
n 695 522 522 1739
Mean (SD) 15.52 (10.75) 16.26 (10.82) 16.43 (11.17) 16.02 (10.90)
IMD 2015 quintile, n (%)
First (least affluent) 63 (9.1) 46 (8.8) 52 (10.0) 161 (9.3)
Second 122 (17.6) 125 (23.9) 108 (20.7) 355 (20.4)
Third 136 (19.6) 88 (16.9) 93 (17.8) 317 (18.2)
Fourth 166 (23.9) 116 (22.2) 124 (23.8) 406 (23.3)
Fifth (most affluent) 208 (29.9) 147 (28.2) 145 (27.8) 500 (28.8)
Smoking status, n (%)
Current smoker 112 (16.1) 75 (14.3) 81 (15.5) 268 (15.4)
Ex-smoker 380 (54.5) 315 (60.2) 290 (55.6) 985 (56.5)
Non-smoker 205 (29.4) 133 (25.4) 151 (28.9) 489 (28.1)
Number of cigarettes per day if current smoker
Mean (SD) 11.60 (8.36) 11.04 (8.12) 11.15 (9.15) 12.70 (10.88)
Median (minimum,maximum)
10 (0, 50) 10 (1, 45) 9 (1, 40) 10 (0, 100)
IQR (lower quartile–upper quartile)
13 (5–18) 10 (5–15) 14 (4–18) 13 (5–8)
Alcohol intake (AUDIT score), n (%)
Abstainer (0) 73 (10.5) 54 (10.3) 55 (10.5) 182 (10.4)
Low risk (1–7) 506 (72.6) 397 (75.9) 383 (73.4) 1286 (73.8)
Possibly harmful (≥ 8) 118 (16.9) 72 (13.8) 84 (16.1) 274 (15.7)
Depressive symptoms (PHQ-9 score)
Mean (SD) 2.07 (3.38) 1.98 (3.05) 1.88 (3.13) 1.99 (3.21)
Median (minimum,maximum)
0 (0, 26) 0 (0, 18) 0 (0, 21) 0 (0, 26)
IQR (lower quartile–upper quartile)
3 (0–3) 3 (0–3) 3 (0–3) 3 (0–3)
Severity of depressive symptoms (PHQ-9 score), n (%)
None (0–4) 583 (83.6) 436 (83.4) 448 (85.8) 1467 (84.2)
Mild (5–9) 82 (11.8) 72 (13.8) 51 (9.8) 205 (11.8)
Moderate (10–14) 23 (3.3) 10 (1.9) 18 (3.4) 51 (2.9)
Moderately severe(15–19)
7 (1.0) 5 (1.0) 4 (0.8) 16 (0.9)
Severe (20–27) 2 (0.3) 0 (0.0) 1 (0.2) 3 (0.2)
Rheumatoid arthritis?, n (%)
Yes 17 (2.9) 18 (3.9) 17 (3.5) 52 (3.4)
No 574 (97.1) 443 (96.1) 465 (96.5) 1482 (96.6)
Prescribed blood pressure medication?, n (%)
Yes 385 (55.2) 280 (53.5) 276 (53.0) 941 (54.0)
No 312 (44.8) 243 (46.5) 245 (47.0) 800 (46.0)
MAIN CLINICAL RESULTS OF THE TRIAL
NIHR Journals Library www.journalslibrary.nihr.ac.uk
40
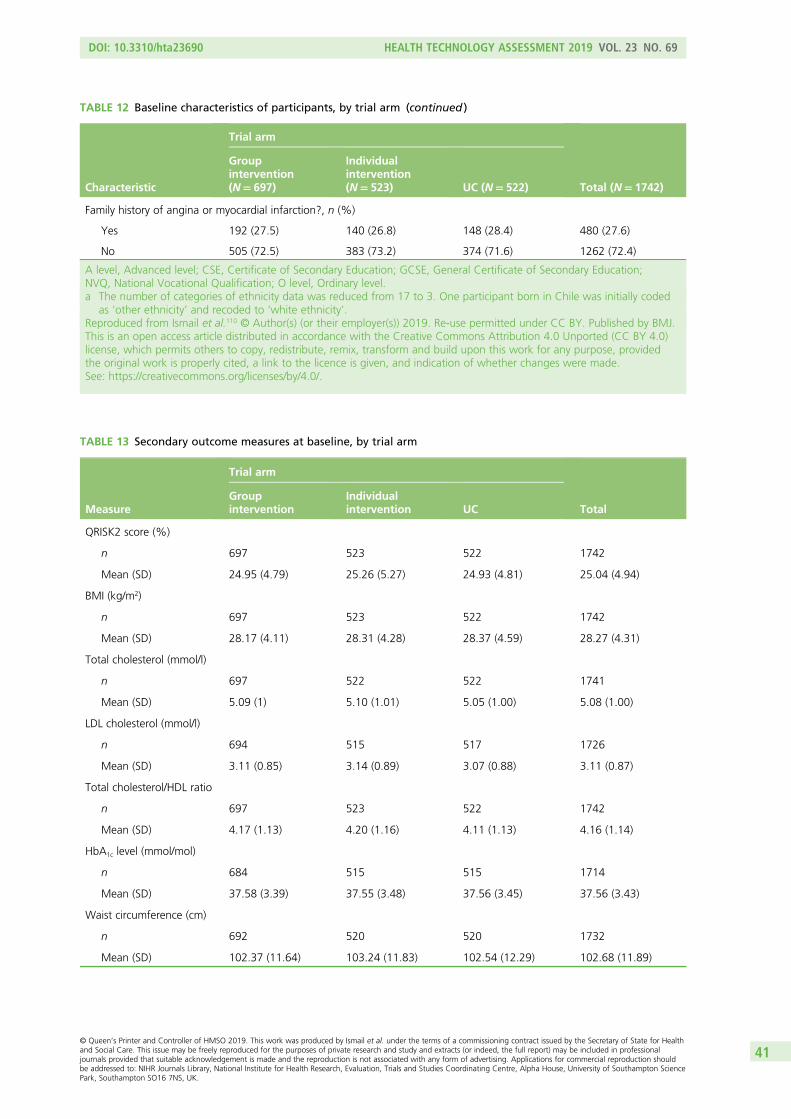
TABLE 12 Baseline characteristics of participants, by trial arm (continued )
Characteristic
Trial arm
Total (N= 1742)
Groupintervention(N= 697)
Individualintervention(N= 523) UC (N= 522)
Family history of angina or myocardial infarction?, n (%)
Yes 192 (27.5) 140 (26.8) 148 (28.4) 480 (27.6)
No 505 (72.5) 383 (73.2) 374 (71.6) 1262 (72.4)
A level, Advanced level; CSE, Certificate of Secondary Education; GCSE, General Certificate of Secondary Education;NVQ, National Vocational Qualification; O level, Ordinary level.a The number of categories of ethnicity data was reduced from 17 to 3. One participant born in Chile was initially coded
as ‘other ethnicity’ and recoded to ‘white ethnicity’.Reproduced from Ismail et al.110 © Author(s) (or their employer(s)) 2019. Re-use permitted under CC BY. Published by BMJ.This is an open access article distributed in accordance with the Creative Commons Attribution 4.0 Unported (CC BY 4.0)license, which permits others to copy, redistribute, remix, transform and build upon this work for any purpose, providedthe original work is properly cited, a link to the licence is given, and indication of whether changes were made.See: https://creativecommons.org/licenses/by/4.0/.
TABLE 13 Secondary outcome measures at baseline, by trial arm
Measure
Trial arm
TotalGroupintervention
Individualintervention UC
QRISK2 score (%)
n 697 523 522 1742
Mean (SD) 24.95 (4.79) 25.26 (5.27) 24.93 (4.81) 25.04 (4.94)
BMI (kg/m2)
n 697 523 522 1742
Mean (SD) 28.17 (4.11) 28.31 (4.28) 28.37 (4.59) 28.27 (4.31)
Total cholesterol (mmol/l)
n 697 522 522 1741
Mean (SD) 5.09 (1) 5.10 (1.01) 5.05 (1.00) 5.08 (1.00)
LDL cholesterol (mmol/l)
n 694 515 517 1726
Mean (SD) 3.11 (0.85) 3.14 (0.89) 3.07 (0.88) 3.11 (0.87)
Total cholesterol/HDL ratio
n 697 523 522 1742
Mean (SD) 4.17 (1.13) 4.20 (1.16) 4.11 (1.13) 4.16 (1.14)
HbA1c level (mmol/mol)
n 684 515 515 1714
Mean (SD) 37.58 (3.39) 37.55 (3.48) 37.56 (3.45) 37.56 (3.43)
Waist circumference (cm)
n 692 520 520 1732
Mean (SD) 102.37 (11.64) 103.24 (11.83) 102.54 (12.29) 102.68 (11.89)
DOI: 10.3310/hta23690 HEALTH TECHNOLOGY ASSESSMENT 2019 VOL. 23 NO. 69
© Queen’s Printer and Controller of HMSO 2019. This work was produced by Ismail et al. under the terms of a commissioning contract issued by the Secretary of State for Healthand Social Care. This issue may be freely reproduced for the purposes of private research and study and extracts (or indeed, the full report) may be included in professionaljournals provided that suitable acknowledgement is made and the reproduction is not associated with any form of advertising. Applications for commercial reproduction shouldbe addressed to: NIHR Journals Library, National Institute for Health Research, Evaluation, Trials and Studies Coordinating Centre, Alpha House, University of Southampton SciencePark, Southampton SO16 7NS, UK.
41
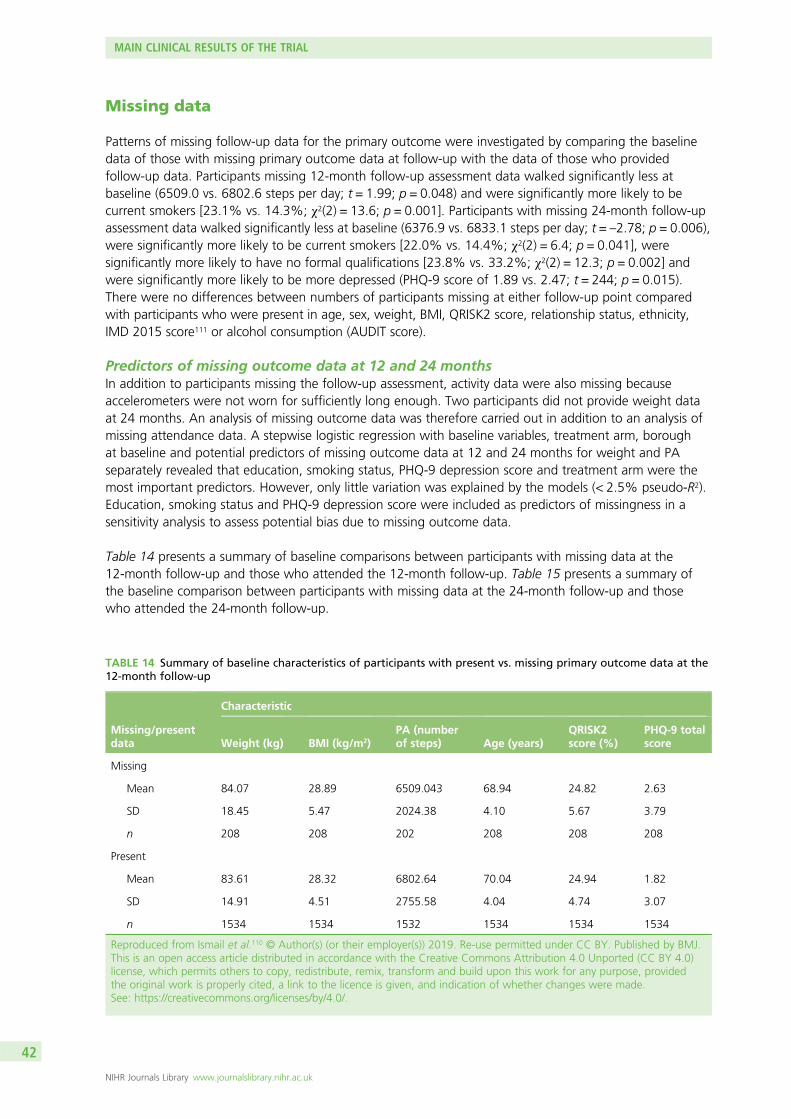
Missing data
Patterns of missing follow-up data for the primary outcome were investigated by comparing the baselinedata of those with missing primary outcome data at follow-up with the data of those who providedfollow-up data. Participants missing 12-month follow-up assessment data walked significantly less atbaseline (6509.0 vs. 6802.6 steps per day; t = 1.99; p = 0.048) and were significantly more likely to becurrent smokers [23.1% vs. 14.3%; χ2(2) = 13.6; p = 0.001]. Participants with missing 24-month follow-upassessment data walked significantly less at baseline (6376.9 vs. 6833.1 steps per day; t = –2.78; p = 0.006),were significantly more likely to be current smokers [22.0% vs. 14.4%; χ2(2) = 6.4; p = 0.041], weresignificantly more likely to have no formal qualifications [23.8% vs. 33.2%; χ2(2) = 12.3; p = 0.002] andwere significantly more likely to be more depressed (PHQ-9 score of 1.89 vs. 2.47; t = 244; p = 0.015).There were no differences between numbers of participants missing at either follow-up point comparedwith participants who were present in age, sex, weight, BMI, QRISK2 score, relationship status, ethnicity,IMD 2015 score111 or alcohol consumption (AUDIT score).
Predictors of missing outcome data at 12 and 24 monthsIn addition to participants missing the follow-up assessment, activity data were also missing becauseaccelerometers were not worn for sufficiently long enough. Two participants did not provide weight dataat 24 months. An analysis of missing outcome data was therefore carried out in addition to an analysis ofmissing attendance data. A stepwise logistic regression with baseline variables, treatment arm, boroughat baseline and potential predictors of missing outcome data at 12 and 24 months for weight and PAseparately revealed that education, smoking status, PHQ-9 depression score and treatment arm were themost important predictors. However, only little variation was explained by the models (< 2.5% pseudo-R2).Education, smoking status and PHQ-9 depression score were included as predictors of missingness in asensitivity analysis to assess potential bias due to missing outcome data.
Table 14 presents a summary of baseline comparisons between participants with missing data at the12-month follow-up and those who attended the 12-month follow-up. Table 15 presents a summary ofthe baseline comparison between participants with missing data at the 24-month follow-up and thosewho attended the 24-month follow-up.
TABLE 14 Summary of baseline characteristics of participants with present vs. missing primary outcome data at the12-month follow-up
Missing/presentdata
Characteristic
Weight (kg) BMI (kg/m2)PA (numberof steps) Age (years)
QRISK2score (%)
PHQ-9 totalscore
Missing
Mean 84.07 28.89 6509.043 68.94 24.82 2.63
SD 18.45 5.47 2024.38 4.10 5.67 3.79
n 208 208 202 208 208 208
Present
Mean 83.61 28.32 6802.64 70.04 24.94 1.82
SD 14.91 4.51 2755.58 4.04 4.74 3.07
n 1534 1534 1532 1534 1534 1534
Reproduced from Ismail et al.110 © Author(s) (or their employer(s)) 2019. Re-use permitted under CC BY. Published by BMJ.This is an open access article distributed in accordance with the Creative Commons Attribution 4.0 Unported (CC BY 4.0)license, which permits others to copy, redistribute, remix, transform and build upon this work for any purpose, providedthe original work is properly cited, a link to the licence is given, and indication of whether changes were made.See: https://creativecommons.org/licenses/by/4.0/.
MAIN CLINICAL RESULTS OF THE TRIAL
NIHR Journals Library www.journalslibrary.nihr.ac.uk
42
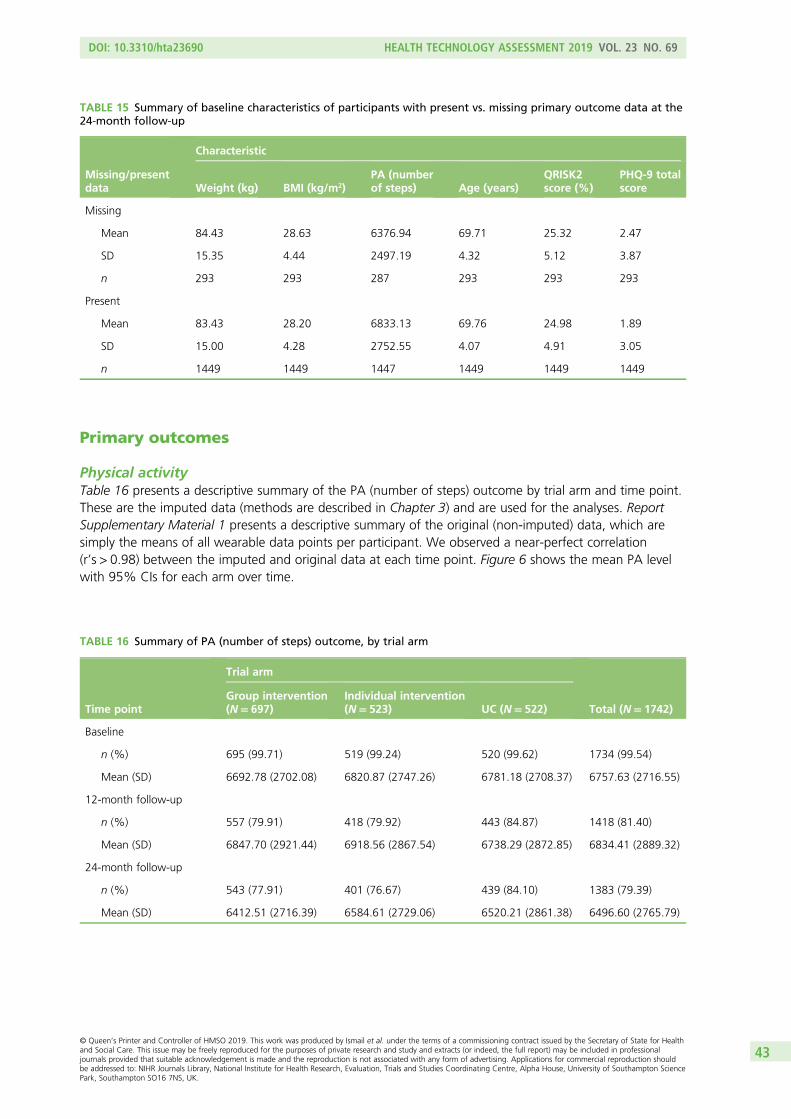
Primary outcomes
Physical activityTable 16 presents a descriptive summary of the PA (number of steps) outcome by trial arm and time point.These are the imputed data (methods are described in Chapter 3) and are used for the analyses. ReportSupplementary Material 1 presents a descriptive summary of the original (non-imputed) data, which aresimply the means of all wearable data points per participant. We observed a near-perfect correlation(r’s > 0.98) between the imputed and original data at each time point. Figure 6 shows the mean PA levelwith 95% CIs for each arm over time.
TABLE 15 Summary of baseline characteristics of participants with present vs. missing primary outcome data at the24-month follow-up
Missing/presentdata
Characteristic
Weight (kg) BMI (kg/m2)PA (numberof steps) Age (years)
QRISK2score (%)
PHQ-9 totalscore
Missing
Mean 84.43 28.63 6376.94 69.71 25.32 2.47
SD 15.35 4.44 2497.19 4.32 5.12 3.87
n 293 293 287 293 293 293
Present
Mean 83.43 28.20 6833.13 69.76 24.98 1.89
SD 15.00 4.28 2752.55 4.07 4.91 3.05
n 1449 1449 1447 1449 1449 1449
TABLE 16 Summary of PA (number of steps) outcome, by trial arm
Time point
Trial arm
Total (N= 1742)Group intervention(N= 697)
Individual intervention(N= 523) UC (N= 522)
Baseline
n (%) 695 (99.71) 519 (99.24) 520 (99.62) 1734 (99.54)
Mean (SD) 6692.78 (2702.08) 6820.87 (2747.26) 6781.18 (2708.37) 6757.63 (2716.55)
12-month follow-up
n (%) 557 (79.91) 418 (79.92) 443 (84.87) 1418 (81.40)
Mean (SD) 6847.70 (2921.44) 6918.56 (2867.54) 6738.29 (2872.85) 6834.41 (2889.32)
24-month follow-up
n (%) 543 (77.91) 401 (76.67) 439 (84.10) 1383 (79.39)
Mean (SD) 6412.51 (2716.39) 6584.61 (2729.06) 6520.21 (2861.38) 6496.60 (2765.79)
DOI: 10.3310/hta23690 HEALTH TECHNOLOGY ASSESSMENT 2019 VOL. 23 NO. 69
© Queen’s Printer and Controller of HMSO 2019. This work was produced by Ismail et al. under the terms of a commissioning contract issued by the Secretary of State for Healthand Social Care. This issue may be freely reproduced for the purposes of private research and study and extracts (or indeed, the full report) may be included in professionaljournals provided that suitable acknowledgement is made and the reproduction is not associated with any form of advertising. Applications for commercial reproduction shouldbe addressed to: NIHR Journals Library, National Institute for Health Research, Evaluation, Trials and Studies Coordinating Centre, Alpha House, University of Southampton SciencePark, Southampton SO16 7NS, UK.
43
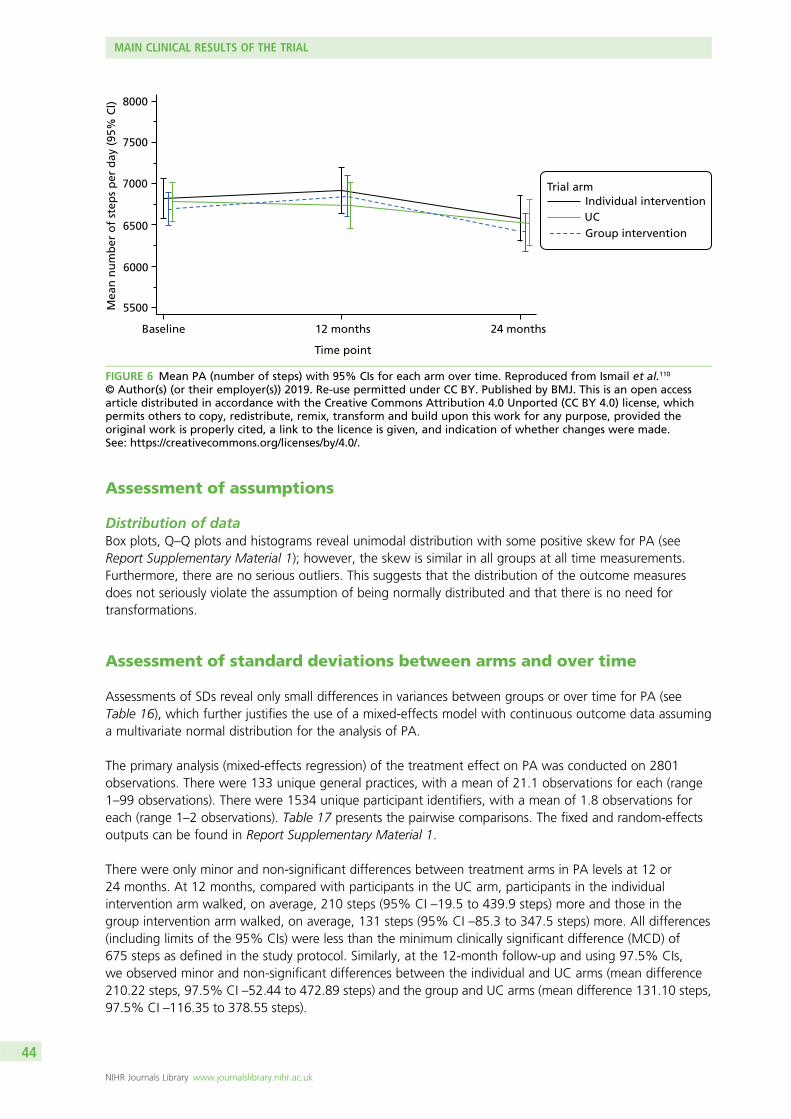
Assessment of assumptions
Distribution of dataBox plots, Q–Q plots and histograms reveal unimodal distribution with some positive skew for PA (seeReport Supplementary Material 1); however, the skew is similar in all groups at all time measurements.Furthermore, there are no serious outliers. This suggests that the distribution of the outcome measuresdoes not seriously violate the assumption of being normally distributed and that there is no need fortransformations.
Assessment of standard deviations between arms and over time
Assessments of SDs reveal only small differences in variances between groups or over time for PA (seeTable 16), which further justifies the use of a mixed-effects model with continuous outcome data assuminga multivariate normal distribution for the analysis of PA.
The primary analysis (mixed-effects regression) of the treatment effect on PA was conducted on 2801observations. There were 133 unique general practices, with a mean of 21.1 observations for each (range1–99 observations). There were 1534 unique participant identifiers, with a mean of 1.8 observations foreach (range 1–2 observations). Table 17 presents the pairwise comparisons. The fixed and random-effectsoutputs can be found in Report Supplementary Material 1.
There were only minor and non-significant differences between treatment arms in PA levels at 12 or24 months. At 12 months, compared with participants in the UC arm, participants in the individualintervention arm walked, on average, 210 steps (95% CI –19.5 to 439.9 steps) more and those in thegroup intervention arm walked, on average, 131 steps (95% CI –85.3 to 347.5 steps) more. All differences(including limits of the 95% CIs) were less than the minimum clinically significant difference (MCD) of675 steps as defined in the study protocol. Similarly, at the 12-month follow-up and using 97.5% CIs,we observed minor and non-significant differences between the individual and UC arms (mean difference210.22 steps, 97.5% CI –52.44 to 472.89 steps) and the group and UC arms (mean difference 131.10 steps,97.5% CI –116.35 to 378.55 steps).
Mea
n n
um
ber
of
step
s p
er d
ay (
95%
Cl) 8000
7500
7000
6500
6000
5500
Baseline 12 months 24 months
Individual interventionUCGroup intervention
Trial arm
Time point
FIGURE 6 Mean PA (number of steps) with 95% CIs for each arm over time. Reproduced from Ismail et al.110
© Author(s) (or their employer(s)) 2019. Re-use permitted under CC BY. Published by BMJ. This is an open accessarticle distributed in accordance with the Creative Commons Attribution 4.0 Unported (CC BY 4.0) license, whichpermits others to copy, redistribute, remix, transform and build upon this work for any purpose, provided theoriginal work is properly cited, a link to the licence is given, and indication of whether changes were made.See: https://creativecommons.org/licenses/by/4.0/.
MAIN CLINICAL RESULTS OF THE TRIAL
NIHR Journals Library www.journalslibrary.nihr.ac.uk
44
Weight
Table 18 presents a descriptive summary of weight by trial arm and at each time point. Figure 7 shows themean weight with 95% CIs for each arm over time.
Assessment of assumptions
Distribution of dataBox plots, Q–Q plots and histograms reveal unimodal distribution with only minor positive skew for weight(see Report Supplementary Material 1). The skew is similar in all groups at all time points. Furthermore,there are no serious outliers. This suggests that the distribution of the outcome measures could be treatedas normally distributed without the need for transformations.
TABLE 17 Pairwise comparisons of trial arms of treatment effect on the primary outcomes
Comparisons
Outcome
PA (number of steps) Weight (kg)
Mean difference (95% CI) p-value Mean difference (95% CI) p-value
12-month follow-up
Individual and UC 210.22 (–19.46 to 439.91) 0.073 –0.55 (–0.95 to –0.14) 0.008
Group and UC 131.1 (–85.28 to 347.48) 0.24 –0.52 (–0.90 to –0.13) 0.009
Individual and group 79.12 (–157.73 to 315.98) 0.51 –0.03 (–0.43 to 0.37) 0.89
24-month follow-up
Individual and UC 7.24 (–224.01 to 238.5) 0.95 –0.42 (–0.93 to 0.09) 0.104
Group and UC 70.05 (–288 to 147.9) 0.53 –0.03 (–0.49 to 0.44) 0.91
Individual and group 77.29 (–153.37 to 307.95) 0.51 –0.40 (–0.86 to 0.07) 0.096
TABLE 18 Summary of weight (kg) outcome by trial arm
Time point
Trial arm
Total (N= 1742)Group intervention(N= 697)
Individual intervention(N= 523) UC (N= 522)
Baseline
n (%) 697 (100) 523 (100) 522 (100) 1742 (100)
Weight (kg), mean (SD) 83.15 (14.75) 84.15 (15.35) 83.65 (15.19) 83.60 (15.06)
12-month follow-up
n (%) 591 (84.79) 461 (88.15) 482 (92.34) 1534 (88.06)
Weight (kg), mean (SD) 82.59 (15.19) 83.31 (15.13) 83.43 (15.07) 83.07 (15.13)
24-month follow-up
n (%) 568 (81.49) 419 (80.11) 460 (88.12) 1447 (83.07)
Weight (kg), mean (SD) 82.72 (15.29) 82.98 (15.40) 83.10 (15.13) 82.92 (15.26)
DOI: 10.3310/hta23690 HEALTH TECHNOLOGY ASSESSMENT 2019 VOL. 23 NO. 69
© Queen’s Printer and Controller of HMSO 2019. This work was produced by Ismail et al. under the terms of a commissioning contract issued by the Secretary of State for Healthand Social Care. This issue may be freely reproduced for the purposes of private research and study and extracts (or indeed, the full report) may be included in professionaljournals provided that suitable acknowledgement is made and the reproduction is not associated with any form of advertising. Applications for commercial reproduction shouldbe addressed to: NIHR Journals Library, National Institute for Health Research, Evaluation, Trials and Studies Coordinating Centre, Alpha House, University of Southampton SciencePark, Southampton SO16 7NS, UK.
45
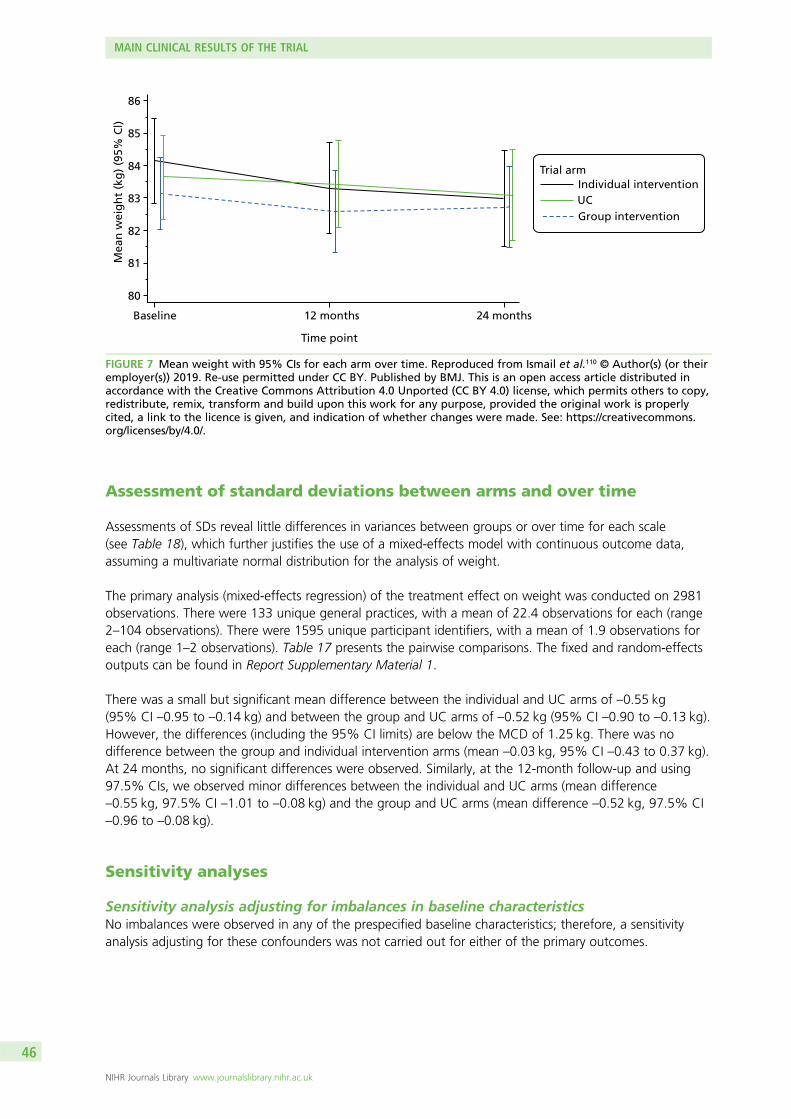
Assessment of standard deviations between arms and over time
Assessments of SDs reveal little differences in variances between groups or over time for each scale(see Table 18), which further justifies the use of a mixed-effects model with continuous outcome data,assuming a multivariate normal distribution for the analysis of weight.
The primary analysis (mixed-effects regression) of the treatment effect on weight was conducted on 2981observations. There were 133 unique general practices, with a mean of 22.4 observations for each (range2–104 observations). There were 1595 unique participant identifiers, with a mean of 1.9 observations foreach (range 1–2 observations). Table 17 presents the pairwise comparisons. The fixed and random-effectsoutputs can be found in Report Supplementary Material 1.
There was a small but significant mean difference between the individual and UC arms of –0.55 kg(95% CI –0.95 to –0.14 kg) and between the group and UC arms of –0.52 kg (95% CI –0.90 to –0.13 kg).However, the differences (including the 95% CI limits) are below the MCD of 1.25 kg. There was nodifference between the group and individual intervention arms (mean –0.03 kg, 95% CI –0.43 to 0.37 kg).At 24 months, no significant differences were observed. Similarly, at the 12-month follow-up and using97.5% CIs, we observed minor differences between the individual and UC arms (mean difference–0.55 kg, 97.5% CI –1.01 to –0.08 kg) and the group and UC arms (mean difference –0.52 kg, 97.5% CI–0.96 to –0.08 kg).
Sensitivity analyses
Sensitivity analysis adjusting for imbalances in baseline characteristicsNo imbalances were observed in any of the prespecified baseline characteristics; therefore, a sensitivityanalysis adjusting for these confounders was not carried out for either of the primary outcomes.
Baseline
Mea
n w
eig
ht
(kg
) (9
5% C
l)
85
84
83
82
81
80
86
12 months 24 months
Individual interventionUCGroup intervention
Trial arm
Time point
FIGURE 7 Mean weight with 95% CIs for each arm over time. Reproduced from Ismail et al.110 © Author(s) (or theiremployer(s)) 2019. Re-use permitted under CC BY. Published by BMJ. This is an open access article distributed inaccordance with the Creative Commons Attribution 4.0 Unported (CC BY 4.0) license, which permits others to copy,redistribute, remix, transform and build upon this work for any purpose, provided the original work is properlycited, a link to the licence is given, and indication of whether changes were made. See: https://creativecommons.org/licenses/by/4.0/.
MAIN CLINICAL RESULTS OF THE TRIAL
NIHR Journals Library www.journalslibrary.nihr.ac.uk
46
A total of 15 sensitivity analyses were conducted for each (except for two instances; the weight outcomewas not completed) of the primary outcomes:
1. adjusting for partially nested random effect for therapist2. adding therapist and general practice as random factors and exchangeable residual covariance matrix3. removing potential outliers (removed 12 for weight and 6 for PA)4. only including patients with a BMI of > 25 kg/m2 (analysed 2298 for weight and 2159 for PA)5. adjusting for treatment compliance, including participants in the group or individual intervention arms
who attended at least one intervention session (analysed 2427 for weight and 2305 for PA)6. adjusting for the delay in intervention start (continuous variable)7. adjusting for the unblinding of the research assistant at each follow-up appointment (binary variable)8. adjusting for the number of days of accelerometer wear at baseline (> 3 days, binary variable)9. adjusting for the number of days of accelerometer wear at baseline (> 5 days, binary variable)
10. adjusting for the number of valid days of accelerometer wear at baseline (≥ 540 minutes, continuousvariable); not completed for weight
11. adjusting for the number of days of accelerometer wear at each follow-up appointment (continuousvariable); not completed for weight
12. adjusting for a BMI score of < 25 kg/m2 at baseline (binary variable)13. adjusting for a QRISK2 score ≥ 20.0% at baseline (binary variable)14. adjusting for predictors (PHQ-9, smoking status and education) of missing outcome data15. adjusting for accelerometer rewear at the 24-month follow-up (binary variable); not completed
for weight.
Report Supplementary Material 1 presents the output of the sensitivity analyses for each of the primaryoutcomes, following the numbering above. None of the above sensitivity analyses altered our conclusionsfor either of the primary outcomes.
Complier-average causal effect analysisBecause there is no evidence of any clinically important treatment effect using a per-protocol analysis(analysing only compliers in the treatment arms), we did not conduct a complier-average causal effect(CACE) analysis. A lack of a clear binary adherence variable for all participants also prevented us fromundertaking a reliable CACE analysis.
Secondary outcomes
Table 19 presents the pairwise comparison output for each of the secondary outcomes. We did notobserve any treatment effects for any of the secondary outcomes at 12 or 24 months.
Dietary intake analysisTable 20 shows nutrient intake at each time point and by treatment arm. The linear mixed-effects modelsshowed four significant effects for three of the nutrients:
1. fat: a time effect (b = –3.19, 95% CI –6.10 to –0.13)2. fibre: a treatment-arm-by-time interaction effect for the group intervention arm versus the UC arm
(b = 1.20, 95% CI 0.15 to 2.29)3. saturated fat: a treatment arm effect for the group intervention arm versus the UC arm (b = –3.32,
95% CI –6.37 to –0.11)4. saturated fat: a time effect (b = –1.53, 95% CI –2.89 to –0.20).
The mediation analyses revealed that none of the nutrients of interest at the 12-month follow-up mediatedthe effect of the intervention on the 24-month outcomes (p > 0.24 for all analyses).
DOI: 10.3310/hta23690 HEALTH TECHNOLOGY ASSESSMENT 2019 VOL. 23 NO. 69
© Queen’s Printer and Controller of HMSO 2019. This work was produced by Ismail et al. under the terms of a commissioning contract issued by the Secretary of State for Healthand Social Care. This issue may be freely reproduced for the purposes of private research and study and extracts (or indeed, the full report) may be included in professionaljournals provided that suitable acknowledgement is made and the reproduction is not associated with any form of advertising. Applications for commercial reproduction shouldbe addressed to: NIHR Journals Library, National Institute for Health Research, Evaluation, Trials and Studies Coordinating Centre, Alpha House, University of Southampton SciencePark, Southampton SO16 7NS, UK.
47
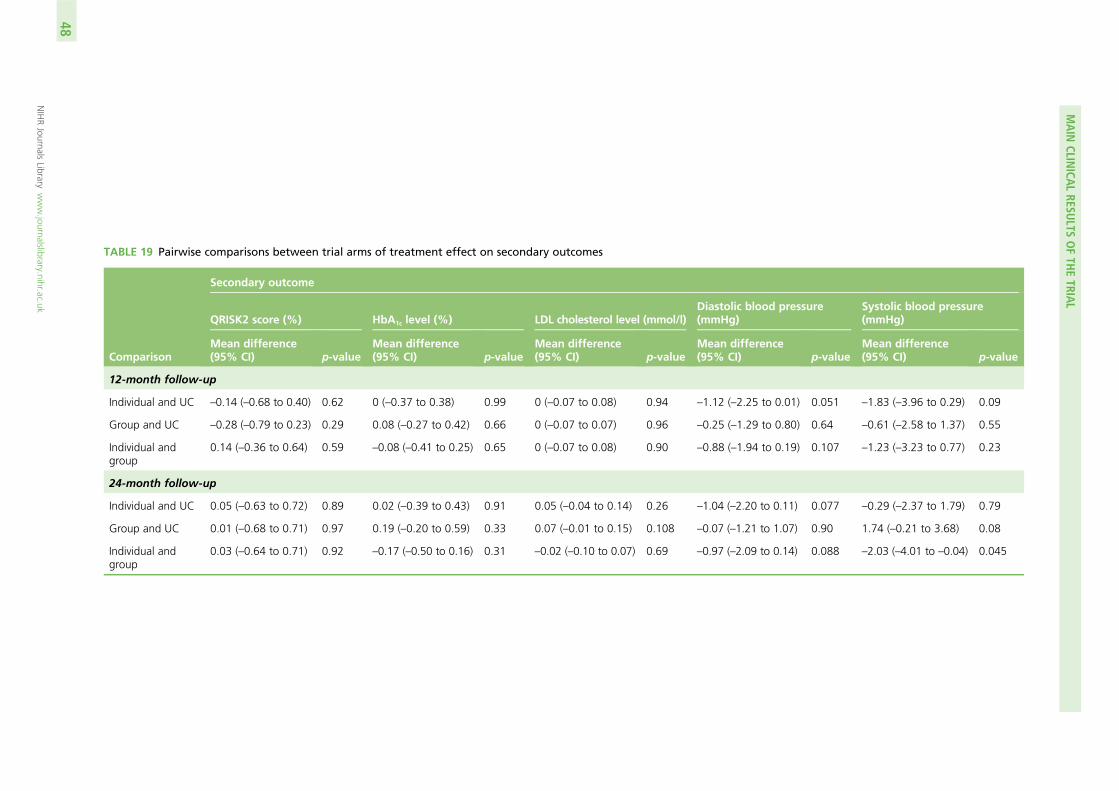
TABLE 19 Pairwise comparisons between trial arms of treatment effect on secondary outcomes
Comparison
Secondary outcome
QRISK2 score (%) HbA1c level (%) LDL cholesterol level (mmol/l)Diastolic blood pressure(mmHg)
Systolic blood pressure(mmHg)
Mean difference(95% CI) p-value
Mean difference(95% CI) p-value
Mean difference(95% CI) p-value
Mean difference(95% CI) p-value
Mean difference(95% CI) p-value
12-month follow-up
Individual and UC –0.14 (–0.68 to 0.40) 0.62 0 (–0.37 to 0.38) 0.99 0 (–0.07 to 0.08) 0.94 –1.12 (–2.25 to 0.01) 0.051 –1.83 (–3.96 to 0.29) 0.09
Group and UC –0.28 (–0.79 to 0.23) 0.29 0.08 (–0.27 to 0.42) 0.66 0 (–0.07 to 0.07) 0.96 –0.25 (–1.29 to 0.80) 0.64 –0.61 (–2.58 to 1.37) 0.55
Individual andgroup
0.14 (–0.36 to 0.64) 0.59 –0.08 (–0.41 to 0.25) 0.65 0 (–0.07 to 0.08) 0.90 –0.88 (–1.94 to 0.19) 0.107 –1.23 (–3.23 to 0.77) 0.23
24-month follow-up
Individual and UC 0.05 (–0.63 to 0.72) 0.89 0.02 (–0.39 to 0.43) 0.91 0.05 (–0.04 to 0.14) 0.26 –1.04 (–2.20 to 0.11) 0.077 –0.29 (–2.37 to 1.79) 0.79
Group and UC 0.01 (–0.68 to 0.71) 0.97 0.19 (–0.20 to 0.59) 0.33 0.07 (–0.01 to 0.15) 0.108 –0.07 (–1.21 to 1.07) 0.90 1.74 (–0.21 to 3.68) 0.08
Individual andgroup
0.03 (–0.64 to 0.71) 0.92 –0.17 (–0.50 to 0.16) 0.31 –0.02 (–0.10 to 0.07) 0.69 –0.97 (–2.09 to 0.14) 0.088 –2.03 (–4.01 to –0.04) 0.045
MAIN
CLINICA
LRESU
LTSOFTH
ETRIA
L
NIHRJournals
Librarywww.journalslibrary.nihr.ac.uk
48
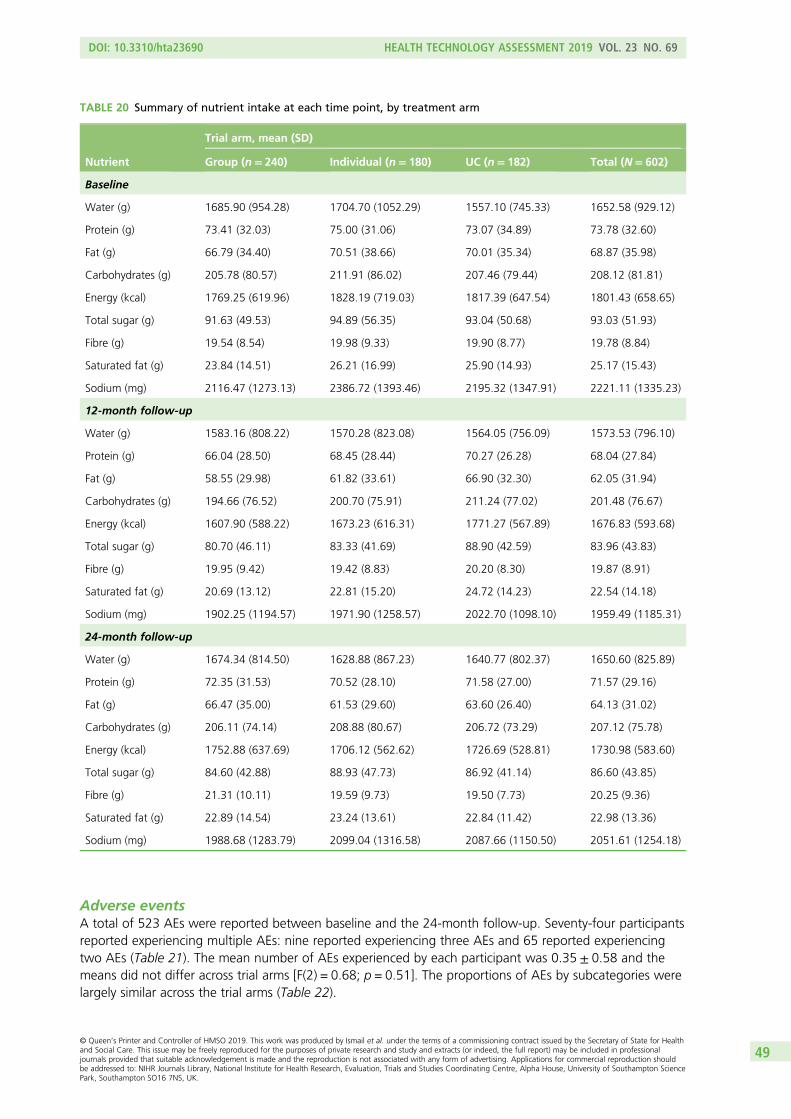
Adverse eventsA total of 523 AEs were reported between baseline and the 24-month follow-up. Seventy-four participantsreported experiencing multiple AEs: nine reported experiencing three AEs and 65 reported experiencingtwo AEs (Table 21). The mean number of AEs experienced by each participant was 0.35 ± 0.58 and themeans did not differ across trial arms [F(2) = 0.68; p = 0.51]. The proportions of AEs by subcategories werelargely similar across the trial arms (Table 22).
TABLE 20 Summary of nutrient intake at each time point, by treatment arm
Nutrient
Trial arm, mean (SD)
Group (n= 240) Individual (n= 180) UC (n= 182) Total (N= 602)
Baseline
Water (g) 1685.90 (954.28) 1704.70 (1052.29) 1557.10 (745.33) 1652.58 (929.12)
Protein (g) 73.41 (32.03) 75.00 (31.06) 73.07 (34.89) 73.78 (32.60)
Fat (g) 66.79 (34.40) 70.51 (38.66) 70.01 (35.34) 68.87 (35.98)
Carbohydrates (g) 205.78 (80.57) 211.91 (86.02) 207.46 (79.44) 208.12 (81.81)
Energy (kcal) 1769.25 (619.96) 1828.19 (719.03) 1817.39 (647.54) 1801.43 (658.65)
Total sugar (g) 91.63 (49.53) 94.89 (56.35) 93.04 (50.68) 93.03 (51.93)
Fibre (g) 19.54 (8.54) 19.98 (9.33) 19.90 (8.77) 19.78 (8.84)
Saturated fat (g) 23.84 (14.51) 26.21 (16.99) 25.90 (14.93) 25.17 (15.43)
Sodium (mg) 2116.47 (1273.13) 2386.72 (1393.46) 2195.32 (1347.91) 2221.11 (1335.23)
12-month follow-up
Water (g) 1583.16 (808.22) 1570.28 (823.08) 1564.05 (756.09) 1573.53 (796.10)
Protein (g) 66.04 (28.50) 68.45 (28.44) 70.27 (26.28) 68.04 (27.84)
Fat (g) 58.55 (29.98) 61.82 (33.61) 66.90 (32.30) 62.05 (31.94)
Carbohydrates (g) 194.66 (76.52) 200.70 (75.91) 211.24 (77.02) 201.48 (76.67)
Energy (kcal) 1607.90 (588.22) 1673.23 (616.31) 1771.27 (567.89) 1676.83 (593.68)
Total sugar (g) 80.70 (46.11) 83.33 (41.69) 88.90 (42.59) 83.96 (43.83)
Fibre (g) 19.95 (9.42) 19.42 (8.83) 20.20 (8.30) 19.87 (8.91)
Saturated fat (g) 20.69 (13.12) 22.81 (15.20) 24.72 (14.23) 22.54 (14.18)
Sodium (mg) 1902.25 (1194.57) 1971.90 (1258.57) 2022.70 (1098.10) 1959.49 (1185.31)
24-month follow-up
Water (g) 1674.34 (814.50) 1628.88 (867.23) 1640.77 (802.37) 1650.60 (825.89)
Protein (g) 72.35 (31.53) 70.52 (28.10) 71.58 (27.00) 71.57 (29.16)
Fat (g) 66.47 (35.00) 61.53 (29.60) 63.60 (26.40) 64.13 (31.02)
Carbohydrates (g) 206.11 (74.14) 208.88 (80.67) 206.72 (73.29) 207.12 (75.78)
Energy (kcal) 1752.88 (637.69) 1706.12 (562.62) 1726.69 (528.81) 1730.98 (583.60)
Total sugar (g) 84.60 (42.88) 88.93 (47.73) 86.92 (41.14) 86.60 (43.85)
Fibre (g) 21.31 (10.11) 19.59 (9.73) 19.50 (7.73) 20.25 (9.36)
Saturated fat (g) 22.89 (14.54) 23.24 (13.61) 22.84 (11.42) 22.98 (13.36)
Sodium (mg) 1988.68 (1283.79) 2099.04 (1316.58) 2087.66 (1150.50) 2051.61 (1254.18)
DOI: 10.3310/hta23690 HEALTH TECHNOLOGY ASSESSMENT 2019 VOL. 23 NO. 69
© Queen’s Printer and Controller of HMSO 2019. This work was produced by Ismail et al. under the terms of a commissioning contract issued by the Secretary of State for Healthand Social Care. This issue may be freely reproduced for the purposes of private research and study and extracts (or indeed, the full report) may be included in professionaljournals provided that suitable acknowledgement is made and the reproduction is not associated with any form of advertising. Applications for commercial reproduction shouldbe addressed to: NIHR Journals Library, National Institute for Health Research, Evaluation, Trials and Studies Coordinating Centre, Alpha House, University of Southampton SciencePark, Southampton SO16 7NS, UK.
49
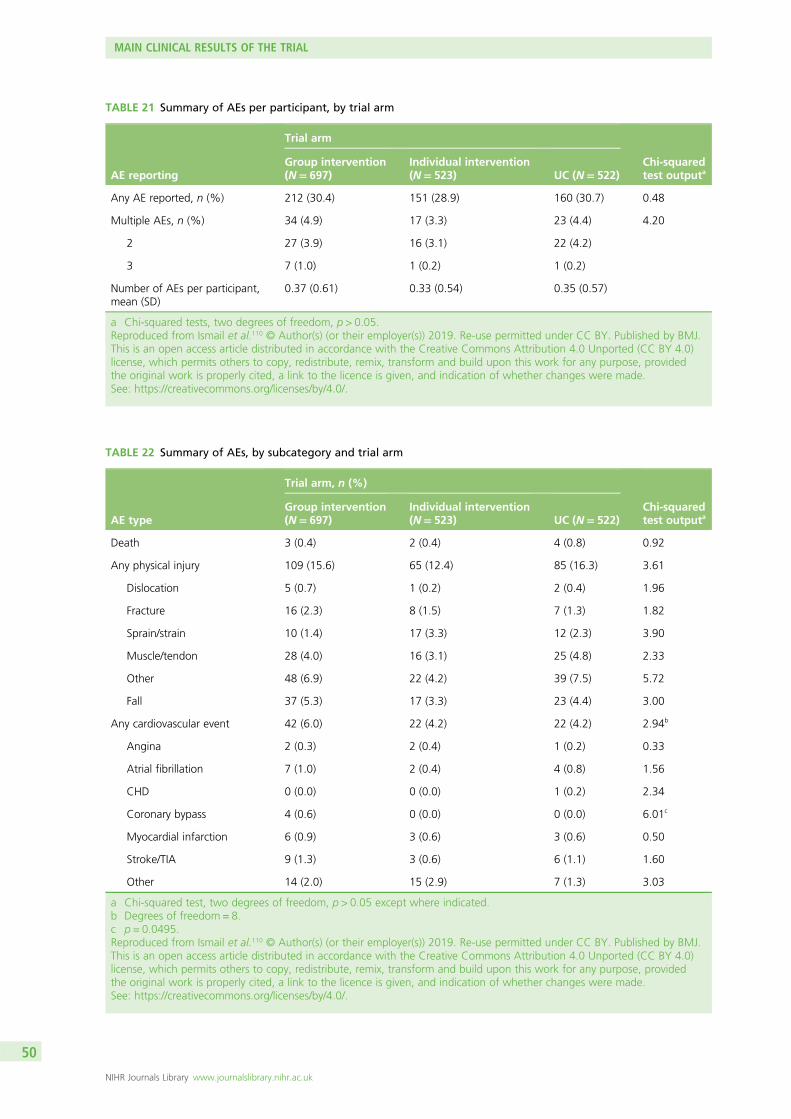
TABLE 21 Summary of AEs per participant, by trial arm
AE reporting
Trial arm
Chi-squaredtest outputa
Group intervention(N= 697)
Individual intervention(N= 523) UC (N= 522)
Any AE reported, n (%) 212 (30.4) 151 (28.9) 160 (30.7) 0.48
Multiple AEs, n (%) 34 (4.9) 17 (3.3) 23 (4.4) 4.20
2 27 (3.9) 16 (3.1) 22 (4.2)
3 7 (1.0) 1 (0.2) 1 (0.2)
Number of AEs per participant,mean (SD)
0.37 (0.61) 0.33 (0.54) 0.35 (0.57)
a Chi-squared tests, two degrees of freedom, p > 0.05.Reproduced from Ismail et al.110 © Author(s) (or their employer(s)) 2019. Re-use permitted under CC BY. Published by BMJ.This is an open access article distributed in accordance with the Creative Commons Attribution 4.0 Unported (CC BY 4.0)license, which permits others to copy, redistribute, remix, transform and build upon this work for any purpose, providedthe original work is properly cited, a link to the licence is given, and indication of whether changes were made.See: https://creativecommons.org/licenses/by/4.0/.
TABLE 22 Summary of AEs, by subcategory and trial arm
AE type
Trial arm, n (%)
Chi-squaredtest outputa
Group intervention(N= 697)
Individual intervention(N= 523) UC (N= 522)
Death 3 (0.4) 2 (0.4) 4 (0.8) 0.92
Any physical injury 109 (15.6) 65 (12.4) 85 (16.3) 3.61
Dislocation 5 (0.7) 1 (0.2) 2 (0.4) 1.96
Fracture 16 (2.3) 8 (1.5) 7 (1.3) 1.82
Sprain/strain 10 (1.4) 17 (3.3) 12 (2.3) 3.90
Muscle/tendon 28 (4.0) 16 (3.1) 25 (4.8) 2.33
Other 48 (6.9) 22 (4.2) 39 (7.5) 5.72
Fall 37 (5.3) 17 (3.3) 23 (4.4) 3.00
Any cardiovascular event 42 (6.0) 22 (4.2) 22 (4.2) 2.94b
Angina 2 (0.3) 2 (0.4) 1 (0.2) 0.33
Atrial fibrillation 7 (1.0) 2 (0.4) 4 (0.8) 1.56
CHD 0 (0.0) 0 (0.0) 1 (0.2) 2.34
Coronary bypass 4 (0.6) 0 (0.0) 0 (0.0) 6.01c
Myocardial infarction 6 (0.9) 3 (0.6) 3 (0.6) 0.50
Stroke/TIA 9 (1.3) 3 (0.6) 6 (1.1) 1.60
Other 14 (2.0) 15 (2.9) 7 (1.3) 3.03
a Chi-squared test, two degrees of freedom, p > 0.05 except where indicated.b Degrees of freedom = 8.c p = 0.0495.Reproduced from Ismail et al.110 © Author(s) (or their employer(s)) 2019. Re-use permitted under CC BY. Published by BMJ.This is an open access article distributed in accordance with the Creative Commons Attribution 4.0 Unported (CC BY 4.0)license, which permits others to copy, redistribute, remix, transform and build upon this work for any purpose, providedthe original work is properly cited, a link to the licence is given, and indication of whether changes were made.See: https://creativecommons.org/licenses/by/4.0/.
MAIN CLINICAL RESULTS OF THE TRIAL
NIHR Journals Library www.journalslibrary.nihr.ac.uk
50
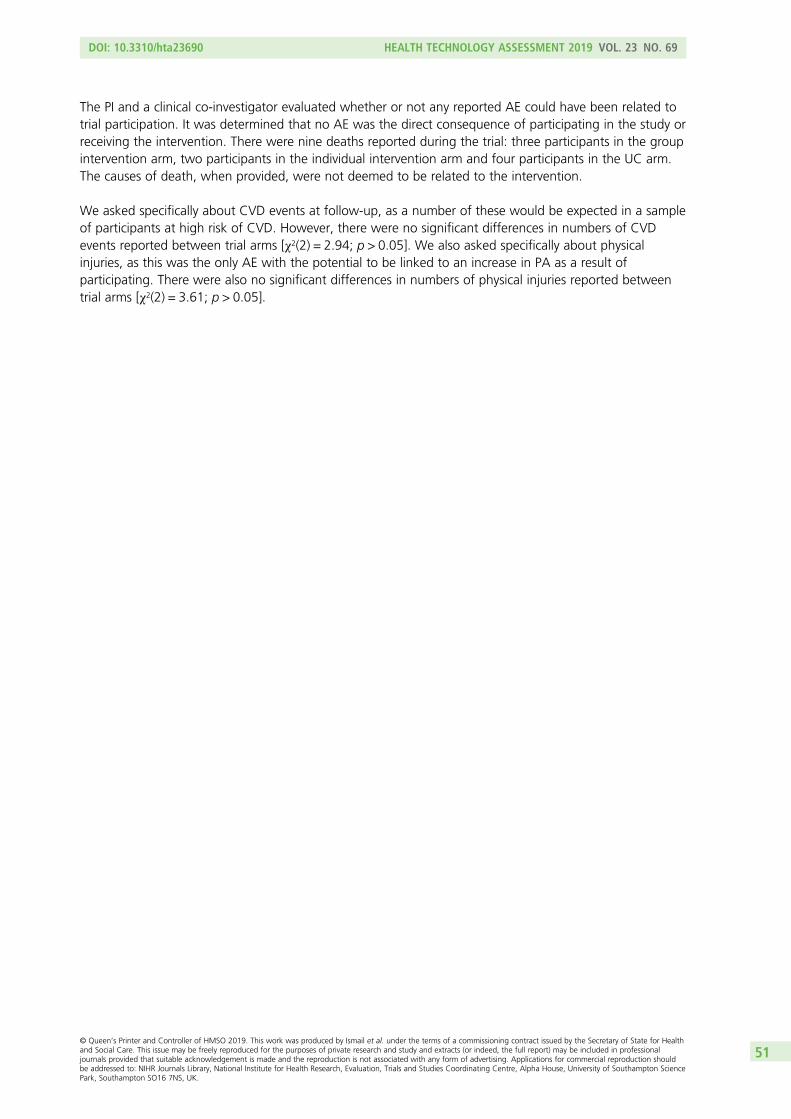
The PI and a clinical co-investigator evaluated whether or not any reported AE could have been related totrial participation. It was determined that no AE was the direct consequence of participating in the study orreceiving the intervention. There were nine deaths reported during the trial: three participants in the groupintervention arm, two participants in the individual intervention arm and four participants in the UC arm.The causes of death, when provided, were not deemed to be related to the intervention.
We asked specifically about CVD events at follow-up, as a number of these would be expected in a sampleof participants at high risk of CVD. However, there were no significant differences in numbers of CVDevents reported between trial arms [χ2(2) = 2.94; p > 0.05]. We also asked specifically about physicalinjuries, as this was the only AE with the potential to be linked to an increase in PA as a result ofparticipating. There were also no significant differences in numbers of physical injuries reported betweentrial arms [χ2(2) = 3.61; p > 0.05].
DOI: 10.3310/hta23690 HEALTH TECHNOLOGY ASSESSMENT 2019 VOL. 23 NO. 69
© Queen’s Printer and Controller of HMSO 2019. This work was produced by Ismail et al. under the terms of a commissioning contract issued by the Secretary of State for Healthand Social Care. This issue may be freely reproduced for the purposes of private research and study and extracts (or indeed, the full report) may be included in professionaljournals provided that suitable acknowledgement is made and the reproduction is not associated with any form of advertising. Applications for commercial reproduction shouldbe addressed to: NIHR Journals Library, National Institute for Health Research, Evaluation, Trials and Studies Coordinating Centre, Alpha House, University of Southampton SciencePark, Southampton SO16 7NS, UK.
51

Chapter 6 Cost-effectiveness
The number and percentage of participants using specific services or groups of services are shown inTable 23. In the 12-month period prior to baseline assessment, the use of all services was very similar
between the three treatment arms. There were relatively few people attending accident and emergency(A&E) or day hospitals or being admitted as inpatients. About half of the participants in each arm hadoutpatient contacts and nearly every participant had community contacts. This was largely due to GP visits.
In the 12 months prior to the 12-month follow-up, around two-thirds of the group intervention arm andthree-quarters of the individual intervention arm received the relevant intervention. Numbers of visits toA&E and outpatient attendances had increased slightly from baseline but there were no clear differencesbetween treatment arms. These patterns were again observed in the 12-month period prior to the secondfollow-up, although there was again a slight increase in the proportions having outpatient attendances.
For those with specific service contacts, the average number of contacts is shown in Table 24. At baseline,community services were used more intensely than other services. The inpatient contacts refer to thenumber of days in hospital. It can be seen that there are no major differences between arms. The data forthe 1-year follow-up show that the individual intervention arm had slightly more intervention contacts thanthe group intervention arm. Those admitted to hospital from the individual intervention arm had moredays in hospital than the other two arms. There were no clear differences between arms in the period upto the 24-month follow-up.
Service costs (including zero costs for non-users) were similar for inpatient care, outpatient attendancesand community contacts (Table 25). Costs of services did not differ markedly between arms, althoughinpatient costs were somewhat higher for the individual intervention arm at the 12-month follow-up andlower at the 24-month follow-up. The intervention cost was highest for those in the individual intervention arm.
Compared with the UC arm, the total costs at baseline were, on average, £151 more for the groupintervention arm (95% CI –£27 to £328) and £55 more for the individual intervention arm (95% CI –£96to £203). The group intervention arm costs were, on average, £95 (95% CI –£93 to £299) more thanthose for the individual intervention arm. After controlling for baseline in a regression model, the totalcosts in the 12-month period prior to the first follow-up were, on average, £89 (95% CI –£274 to £390)more for the group intervention arm than for the UC arm and £409 (95% CI –£171 to £1133) more forthe individual intervention arm than the UC arm. The individual intervention arm costs were, on average,£320 (95% CI –£170 to £1133) more than those for the UC arm. By the second follow-up, and againcontrolling for baseline, the mean costs for the group intervention arm were £82 (95% CI –£93 to £263)more than those for UC and £39 (95% CI –£108 to £188) more for UC than for the individual interventionarm. Costs were £121 (95% CI –£37 to £309) more for the group intervention arm than for the individualintervention arm.
Mean total costs over the whole 24-month follow-up period with year 2 costs discounted by 3.5% were£2071 (SD £3363) for the group intervention arm, £2230 (SD £7645) for the individual intervention armand £1852 (SD £3726) for the UC arm. Compared with UC and controlling for baseline, the groupintervention arm had costs that were, on average, £172 higher (95% CI –£237 to £599) and the individualintervention arm had costs that were £352 higher (95% CI –£309 to £1271). For cases in which both costand QALY data were available, the group intervention arm had incremental costs of £173 compared withthe UC arm and the individual intervention arm had incremental costs of £356 compared with the UC arm.These are the incremental costs subsequently used in the ICERs.
Mean EQ-5D tariff scores were similar for each arm and did not change markedly over time (Table 26).Controlling for baseline utility and compared with the UC arm, the group intervention arm had 0.0150fewer QALYs (95% CI –0.0388 to 0.0088 QALYs) and the individual intervention arm had 0.0039 more
DOI: 10.3310/hta23690 HEALTH TECHNOLOGY ASSESSMENT 2019 VOL. 23 NO. 69
© Queen’s Printer and Controller of HMSO 2019. This work was produced by Ismail et al. under the terms of a commissioning contract issued by the Secretary of State for Healthand Social Care. This issue may be freely reproduced for the purposes of private research and study and extracts (or indeed, the full report) may be included in professionaljournals provided that suitable acknowledgement is made and the reproduction is not associated with any form of advertising. Applications for commercial reproduction shouldbe addressed to: NIHR Journals Library, National Institute for Health Research, Evaluation, Trials and Studies Coordinating Centre, Alpha House, University of Southampton SciencePark, Southampton SO16 7NS, UK.
53
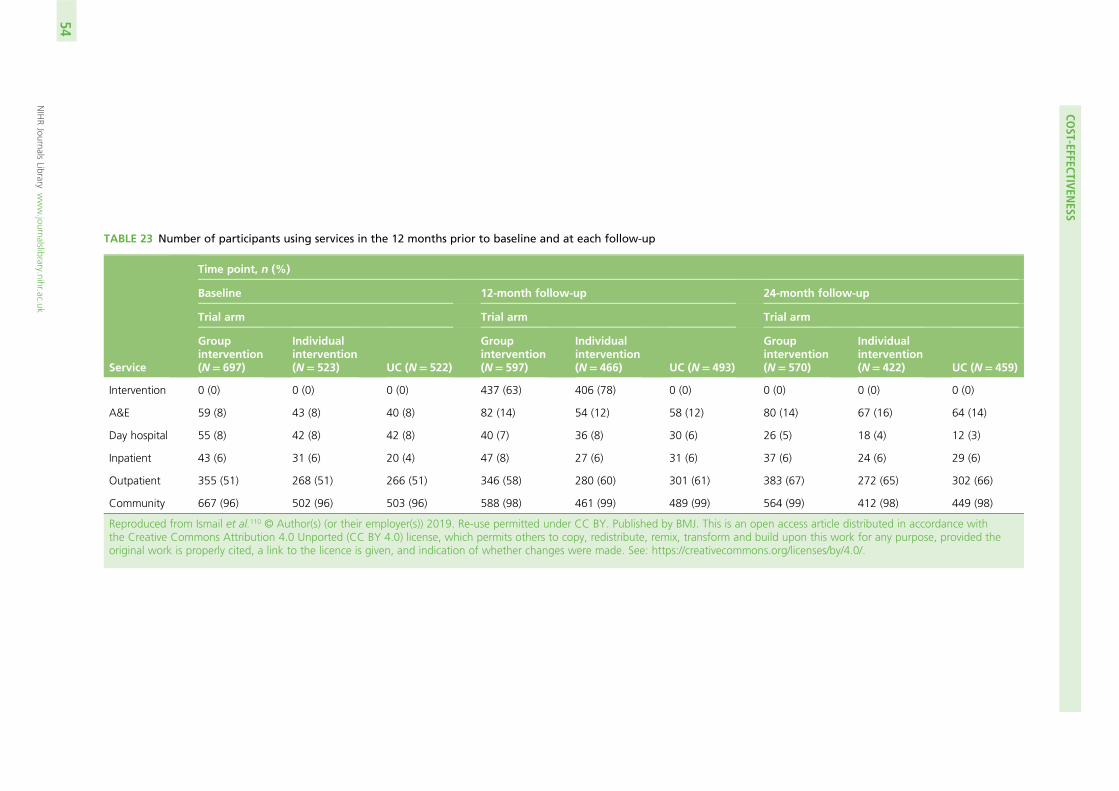
TABLE 23 Number of participants using services in the 12 months prior to baseline and at each follow-up
Service
Time point, n (%)
Baseline 12-month follow-up 24-month follow-up
Trial arm Trial arm Trial arm
Groupintervention(N= 697)
Individualintervention(N= 523) UC (N= 522)
Groupintervention(N= 597)
Individualintervention(N= 466) UC (N= 493)
Groupintervention(N= 570)
Individualintervention(N= 422) UC (N= 459)
Intervention 0 (0) 0 (0) 0 (0) 437 (63) 406 (78) 0 (0) 0 (0) 0 (0) 0 (0)
A&E 59 (8) 43 (8) 40 (8) 82 (14) 54 (12) 58 (12) 80 (14) 67 (16) 64 (14)
Day hospital 55 (8) 42 (8) 42 (8) 40 (7) 36 (8) 30 (6) 26 (5) 18 (4) 12 (3)
Inpatient 43 (6) 31 (6) 20 (4) 47 (8) 27 (6) 31 (6) 37 (6) 24 (6) 29 (6)
Outpatient 355 (51) 268 (51) 266 (51) 346 (58) 280 (60) 301 (61) 383 (67) 272 (65) 302 (66)
Community 667 (96) 502 (96) 503 (96) 588 (98) 461 (99) 489 (99) 564 (99) 412 (98) 449 (98)
Reproduced from Ismail et al.110 © Author(s) (or their employer(s)) 2019. Re-use permitted under CC BY. Published by BMJ. This is an open access article distributed in accordance withthe Creative Commons Attribution 4.0 Unported (CC BY 4.0) license, which permits others to copy, redistribute, remix, transform and build upon this work for any purpose, provided theoriginal work is properly cited, a link to the licence is given, and indication of whether changes were made. See: https://creativecommons.org/licenses/by/4.0/.
COST-EFFECTIVEN
ESS
NIHRJournals
Librarywww.journalslibrary.nihr.ac.uk
54
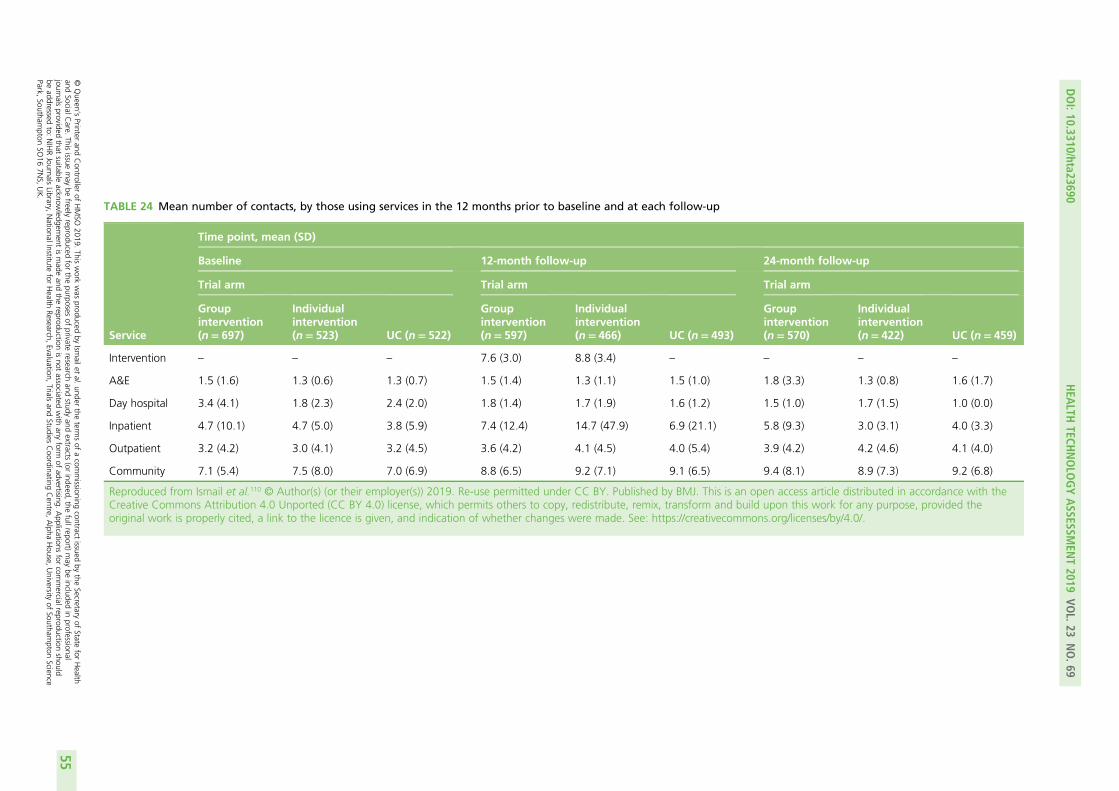
TABLE 24 Mean number of contacts, by those using services in the 12 months prior to baseline and at each follow-up
Service
Time point, mean (SD)
Baseline 12-month follow-up 24-month follow-up
Trial arm Trial arm Trial arm
Groupintervention(n= 697)
Individualintervention(n= 523) UC (n= 522)
Groupintervention(n= 597)
Individualintervention(n= 466) UC (n= 493)
Groupintervention(n= 570)
Individualintervention(n= 422) UC (n= 459)
Intervention – – – 7.6 (3.0) 8.8 (3.4) – – – –
A&E 1.5 (1.6) 1.3 (0.6) 1.3 (0.7) 1.5 (1.4) 1.3 (1.1) 1.5 (1.0) 1.8 (3.3) 1.3 (0.8) 1.6 (1.7)
Day hospital 3.4 (4.1) 1.8 (2.3) 2.4 (2.0) 1.8 (1.4) 1.7 (1.9) 1.6 (1.2) 1.5 (1.0) 1.7 (1.5) 1.0 (0.0)
Inpatient 4.7 (10.1) 4.7 (5.0) 3.8 (5.9) 7.4 (12.4) 14.7 (47.9) 6.9 (21.1) 5.8 (9.3) 3.0 (3.1) 4.0 (3.3)
Outpatient 3.2 (4.2) 3.0 (4.1) 3.2 (4.5) 3.6 (4.2) 4.1 (4.5) 4.0 (5.4) 3.9 (4.2) 4.2 (4.6) 4.1 (4.0)
Community 7.1 (5.4) 7.5 (8.0) 7.0 (6.9) 8.8 (6.5) 9.2 (7.1) 9.1 (6.5) 9.4 (8.1) 8.9 (7.3) 9.2 (6.8)
Reproduced from Ismail et al.110 © Author(s) (or their employer(s)) 2019. Re-use permitted under CC BY. Published by BMJ. This is an open access article distributed in accordance with theCreative Commons Attribution 4.0 Unported (CC BY 4.0) license, which permits others to copy, redistribute, remix, transform and build upon this work for any purpose, provided theoriginal work is properly cited, a link to the licence is given, and indication of whether changes were made. See: https://creativecommons.org/licenses/by/4.0/.
DOI:10.3310/hta23690
HEA
LTHTECH
NOLO
GYASSESSM
ENT2019
VOL.23
NO.69
©Queen
’sPrinter
andController
ofHMSO
2019.This
work
was
producedby
Ismailet
al.under
theterm
sof
acom
missioning
contractissued
bythe
Secretaryof
Statefor
Health
andSocialC
are.This
issuemay
befreely
reproducedfor
thepurposes
ofprivate
researchand
studyand
extracts(or
indeed,the
fullreport)may
beincluded
inprofessional
journalsprovided
thatsuitable
acknowledgem
entismade
andthe
reproductionisnot
associatedwith
anyform
ofadvertising.
Applications
forcom
mercialreproduction
shouldbe
addressedto:
NIHRJournals
Library,NationalInstitute
forHealth
Research,Evaluation,
Trialsand
StudiesCoordinating
Centre,
Alpha
House,
University
ofSoutham
ptonScience
Park,Southam
ptonSO
167N
S,UK.
55
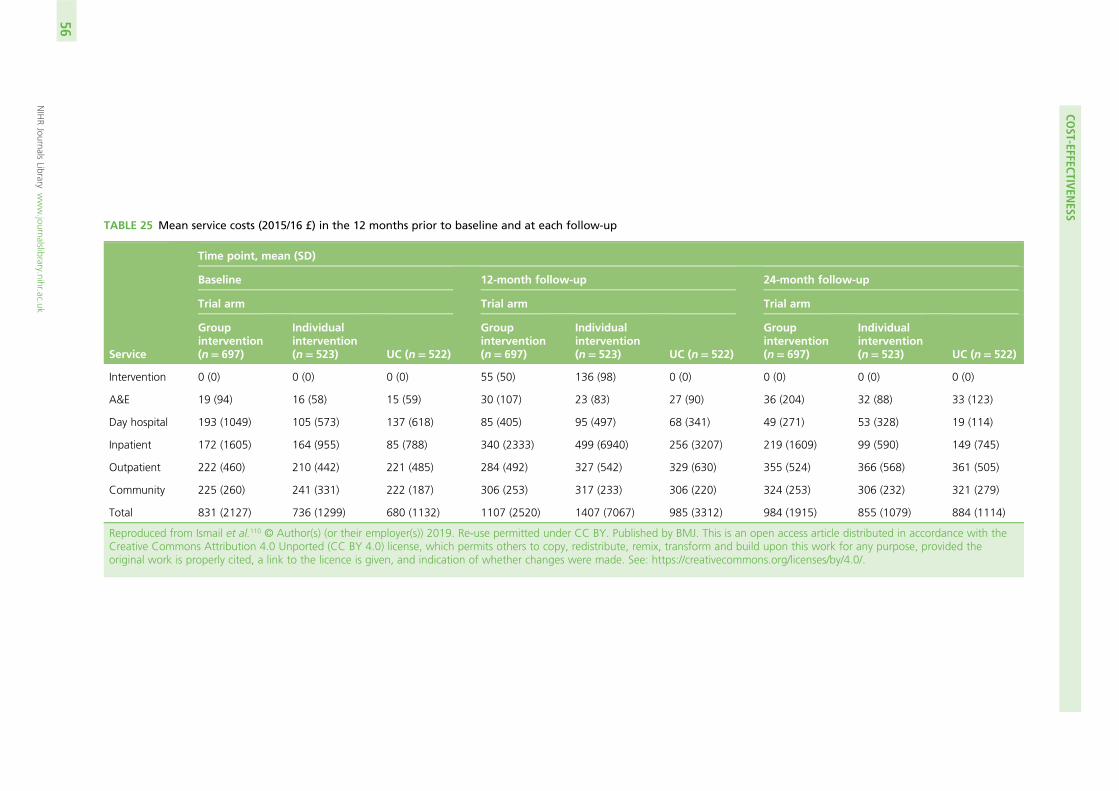
TABLE 25 Mean service costs (2015/16 £) in the 12 months prior to baseline and at each follow-up
Service
Time point, mean (SD)
Baseline 12-month follow-up 24-month follow-up
Trial arm Trial arm Trial arm
Groupintervention(n= 697)
Individualintervention(n= 523) UC (n= 522)
Groupintervention(n= 697)
Individualintervention(n= 523) UC (n= 522)
Groupintervention(n= 697)
Individualintervention(n= 523) UC (n= 522)
Intervention 0 (0) 0 (0) 0 (0) 55 (50) 136 (98) 0 (0) 0 (0) 0 (0) 0 (0)
A&E 19 (94) 16 (58) 15 (59) 30 (107) 23 (83) 27 (90) 36 (204) 32 (88) 33 (123)
Day hospital 193 (1049) 105 (573) 137 (618) 85 (405) 95 (497) 68 (341) 49 (271) 53 (328) 19 (114)
Inpatient 172 (1605) 164 (955) 85 (788) 340 (2333) 499 (6940) 256 (3207) 219 (1609) 99 (590) 149 (745)
Outpatient 222 (460) 210 (442) 221 (485) 284 (492) 327 (542) 329 (630) 355 (524) 366 (568) 361 (505)
Community 225 (260) 241 (331) 222 (187) 306 (253) 317 (233) 306 (220) 324 (253) 306 (232) 321 (279)
Total 831 (2127) 736 (1299) 680 (1132) 1107 (2520) 1407 (7067) 985 (3312) 984 (1915) 855 (1079) 884 (1114)
Reproduced from Ismail et al.110 © Author(s) (or their employer(s)) 2019. Re-use permitted under CC BY. Published by BMJ. This is an open access article distributed in accordance with theCreative Commons Attribution 4.0 Unported (CC BY 4.0) license, which permits others to copy, redistribute, remix, transform and build upon this work for any purpose, provided theoriginal work is properly cited, a link to the licence is given, and indication of whether changes were made. See: https://creativecommons.org/licenses/by/4.0/.
COST-EFFECTIVEN
ESS
NIHRJournals
Librarywww.journalslibrary.nihr.ac.uk
56
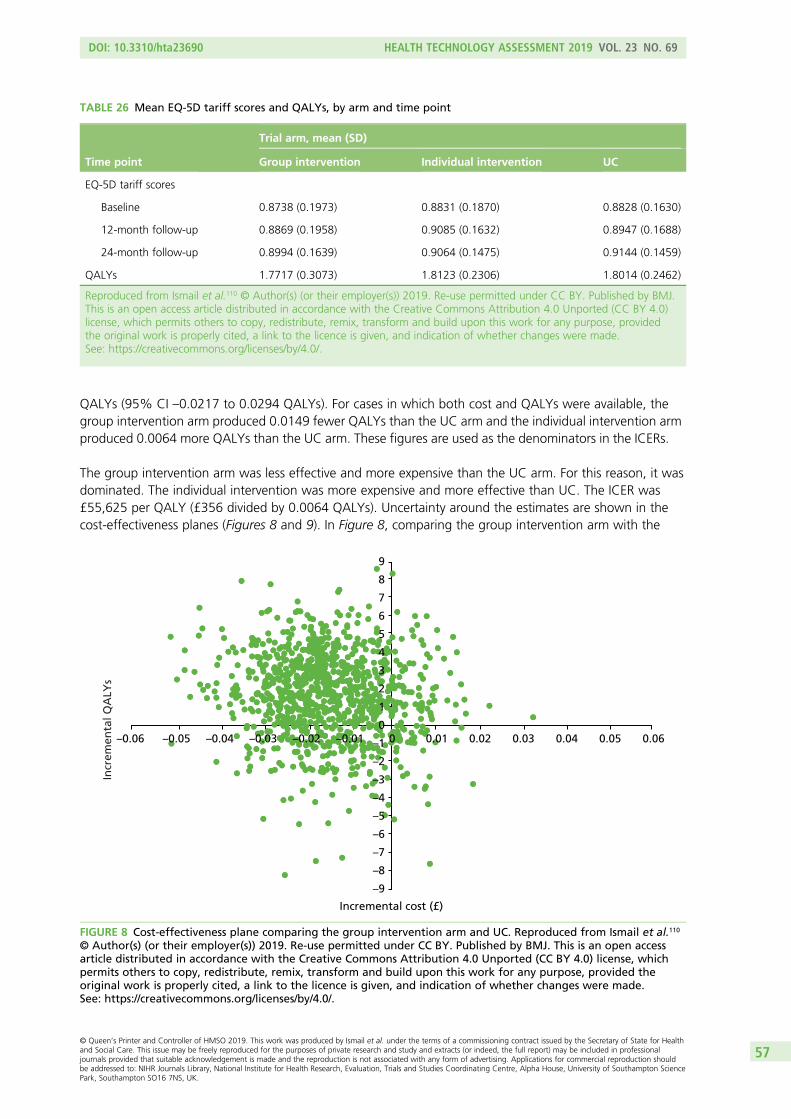
QALYs (95% CI –0.0217 to 0.0294 QALYs). For cases in which both cost and QALYs were available, thegroup intervention arm produced 0.0149 fewer QALYs than the UC arm and the individual intervention armproduced 0.0064 more QALYs than the UC arm. These figures are used as the denominators in the ICERs.
The group intervention arm was less effective and more expensive than the UC arm. For this reason, it wasdominated. The individual intervention was more expensive and more effective than UC. The ICER was£55,625 per QALY (£356 divided by 0.0064 QALYs). Uncertainty around the estimates are shown in thecost-effectiveness planes (Figures 8 and 9). In Figure 8, comparing the group intervention arm with the
TABLE 26 Mean EQ-5D tariff scores and QALYs, by arm and time point
Time point
Trial arm, mean (SD)
Group intervention Individual intervention UC
EQ-5D tariff scores
Baseline 0.8738 (0.1973) 0.8831 (0.1870) 0.8828 (0.1630)
12-month follow-up 0.8869 (0.1958) 0.9085 (0.1632) 0.8947 (0.1688)
24-month follow-up 0.8994 (0.1639) 0.9064 (0.1475) 0.9144 (0.1459)
QALYs 1.7717 (0.3073) 1.8123 (0.2306) 1.8014 (0.2462)
Reproduced from Ismail et al.110 © Author(s) (or their employer(s)) 2019. Re-use permitted under CC BY. Published by BMJ.This is an open access article distributed in accordance with the Creative Commons Attribution 4.0 Unported (CC BY 4.0)license, which permits others to copy, redistribute, remix, transform and build upon this work for any purpose, providedthe original work is properly cited, a link to the licence is given, and indication of whether changes were made.See: https://creativecommons.org/licenses/by/4.0/.
–8
–9
–7
–6
–5
–4
–3
–2
–1
0
1
2
3
4
5
6
7
8
9
–0.06 –0.05 –0.04 –0.03 –0.02 –0.01 0 0.01 0.02 0.03 0.04 0.05 0.06
Incr
emen
tal Q
ALY
s
Incremental cost (£)
FIGURE 8 Cost-effectiveness plane comparing the group intervention arm and UC. Reproduced from Ismail et al.110
© Author(s) (or their employer(s)) 2019. Re-use permitted under CC BY. Published by BMJ. This is an open accessarticle distributed in accordance with the Creative Commons Attribution 4.0 Unported (CC BY 4.0) license, whichpermits others to copy, redistribute, remix, transform and build upon this work for any purpose, provided theoriginal work is properly cited, a link to the licence is given, and indication of whether changes were made.See: https://creativecommons.org/licenses/by/4.0/.
DOI: 10.3310/hta23690 HEALTH TECHNOLOGY ASSESSMENT 2019 VOL. 23 NO. 69
© Queen’s Printer and Controller of HMSO 2019. This work was produced by Ismail et al. under the terms of a commissioning contract issued by the Secretary of State for Healthand Social Care. This issue may be freely reproduced for the purposes of private research and study and extracts (or indeed, the full report) may be included in professionaljournals provided that suitable acknowledgement is made and the reproduction is not associated with any form of advertising. Applications for commercial reproduction shouldbe addressed to: NIHR Journals Library, National Institute for Health Research, Evaluation, Trials and Studies Coordinating Centre, Alpha House, University of Southampton SciencePark, Southampton SO16 7NS, UK.
57
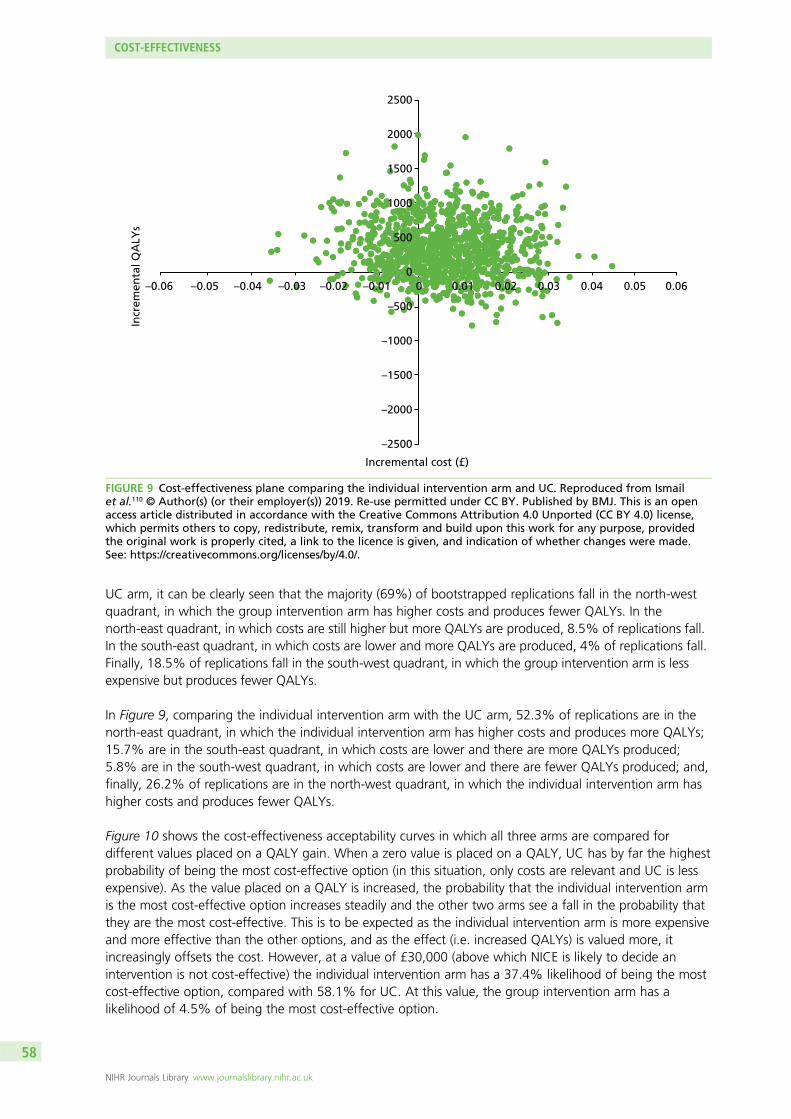
UC arm, it can be clearly seen that the majority (69%) of bootstrapped replications fall in the north-westquadrant, in which the group intervention arm has higher costs and produces fewer QALYs. In thenorth-east quadrant, in which costs are still higher but more QALYs are produced, 8.5% of replications fall.In the south-east quadrant, in which costs are lower and more QALYs are produced, 4% of replications fall.Finally, 18.5% of replications fall in the south-west quadrant, in which the group intervention arm is lessexpensive but produces fewer QALYs.
In Figure 9, comparing the individual intervention arm with the UC arm, 52.3% of replications are in thenorth-east quadrant, in which the individual intervention arm has higher costs and produces more QALYs;15.7% are in the south-east quadrant, in which costs are lower and there are more QALYs produced;5.8% are in the south-west quadrant, in which costs are lower and there are fewer QALYs produced; and,finally, 26.2% of replications are in the north-west quadrant, in which the individual intervention arm hashigher costs and produces fewer QALYs.
Figure 10 shows the cost-effectiveness acceptability curves in which all three arms are compared fordifferent values placed on a QALY gain. When a zero value is placed on a QALY, UC has by far the highestprobability of being the most cost-effective option (in this situation, only costs are relevant and UC is lessexpensive). As the value placed on a QALY is increased, the probability that the individual intervention armis the most cost-effective option increases steadily and the other two arms see a fall in the probability thatthey are the most cost-effective. This is to be expected as the individual intervention arm is more expensiveand more effective than the other options, and as the effect (i.e. increased QALYs) is valued more, itincreasingly offsets the cost. However, at a value of £30,000 (above which NICE is likely to decide anintervention is not cost-effective) the individual intervention arm has a 37.4% likelihood of being the mostcost-effective option, compared with 58.1% for UC. At this value, the group intervention arm has alikelihood of 4.5% of being the most cost-effective option.
–2500
–2000
–1500
–1000
–500
0
500
1000
1500
2000
2500
–0.06 –0.05 –0.04 –0.03 –0.02 –0.01 0 0.01 0.02 0.03 0.04 0.05 0.06
Incr
emen
tal Q
ALY
s
Incremental cost (£)
FIGURE 9 Cost-effectiveness plane comparing the individual intervention arm and UC. Reproduced from Ismailet al.110 © Author(s) (or their employer(s)) 2019. Re-use permitted under CC BY. Published by BMJ. This is an openaccess article distributed in accordance with the Creative Commons Attribution 4.0 Unported (CC BY 4.0) license,which permits others to copy, redistribute, remix, transform and build upon this work for any purpose, providedthe original work is properly cited, a link to the licence is given, and indication of whether changes were made.See: https://creativecommons.org/licenses/by/4.0/.
COST-EFFECTIVENESS
NIHR Journals Library www.journalslibrary.nihr.ac.uk
58
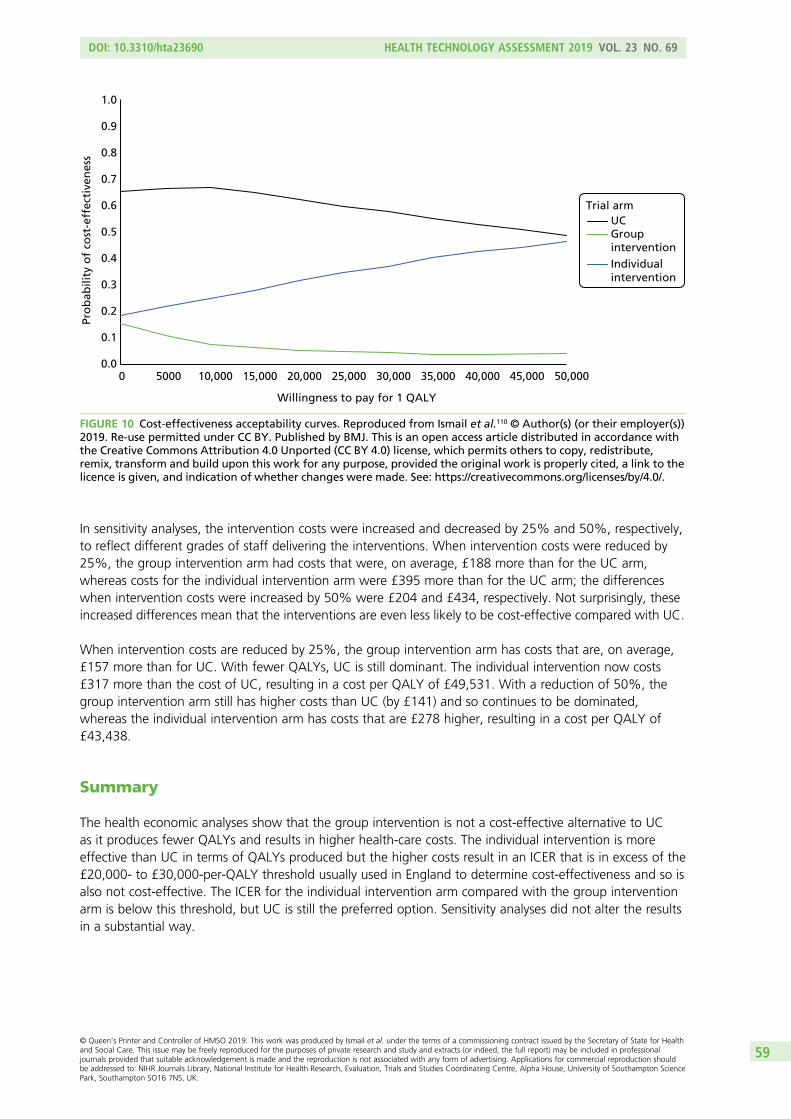
In sensitivity analyses, the intervention costs were increased and decreased by 25% and 50%, respectively,to reflect different grades of staff delivering the interventions. When intervention costs were reduced by25%, the group intervention arm had costs that were, on average, £188 more than for the UC arm,whereas costs for the individual intervention arm were £395 more than for the UC arm; the differenceswhen intervention costs were increased by 50% were £204 and £434, respectively. Not surprisingly, theseincreased differences mean that the interventions are even less likely to be cost-effective compared with UC.
When intervention costs are reduced by 25%, the group intervention arm has costs that are, on average,£157 more than for UC. With fewer QALYs, UC is still dominant. The individual intervention now costs£317 more than the cost of UC, resulting in a cost per QALY of £49,531. With a reduction of 50%, thegroup intervention arm still has higher costs than UC (by £141) and so continues to be dominated,whereas the individual intervention arm has costs that are £278 higher, resulting in a cost per QALY of£43,438.
Summary
The health economic analyses show that the group intervention is not a cost-effective alternative to UCas it produces fewer QALYs and results in higher health-care costs. The individual intervention is moreeffective than UC in terms of QALYs produced but the higher costs result in an ICER that is in excess of the£20,000- to £30,000-per-QALY threshold usually used in England to determine cost-effectiveness and so isalso not cost-effective. The ICER for the individual intervention arm compared with the group interventionarm is below this threshold, but UC is still the preferred option. Sensitivity analyses did not alter the resultsin a substantial way.
0.0
0.1
0.2
0.3
0.4
0.5
0.6
0.7
0.8
0.9
1.0
0 5000 10,000 15,000 20,000 25,000 30,000 35,000 40,000 45,000 50,000
UCGroup interventionIndividual intervention
Willingness to pay for 1 QALY
Pro
bab
ility
of
cost
-eff
ecti
ven
ess
Trial arm
FIGURE 10 Cost-effectiveness acceptability curves. Reproduced from Ismail et al.110 © Author(s) (or their employer(s))2019. Re-use permitted under CC BY. Published by BMJ. This is an open access article distributed in accordance withthe Creative Commons Attribution 4.0 Unported (CC BY 4.0) license, which permits others to copy, redistribute,remix, transform and build upon this work for any purpose, provided the original work is properly cited, a link to thelicence is given, and indication of whether changes were made. See: https://creativecommons.org/licenses/by/4.0/.
DOI: 10.3310/hta23690 HEALTH TECHNOLOGY ASSESSMENT 2019 VOL. 23 NO. 69
© Queen’s Printer and Controller of HMSO 2019. This work was produced by Ismail et al. under the terms of a commissioning contract issued by the Secretary of State for Healthand Social Care. This issue may be freely reproduced for the purposes of private research and study and extracts (or indeed, the full report) may be included in professionaljournals provided that suitable acknowledgement is made and the reproduction is not associated with any form of advertising. Applications for commercial reproduction shouldbe addressed to: NIHR Journals Library, National Institute for Health Research, Evaluation, Trials and Studies Coordinating Centre, Alpha House, University of Southampton SciencePark, Southampton SO16 7NS, UK.
59

Chapter 7 Participation biases
Background
Lifestyle intervention trials have previously reported low response rates and do not always recruit thosemost at risk, which will limit the generalisability of observed associations.112,113 Failure to recruit thosewith the highest risk of CVD to the MOVE IT trial could have led to limited representativeness andunderestimated effect sizes, and could have contributed to increasing rather than reducing healthinequalities. It is important, therefore, that RCTs such as MOVE IT report on participation bias.
The factors found to increase likelihood of participation in walking and lifestyle intervention trials aremid-life, female sex, living in more affluent areas, white ethnicity and university education.112,114 Ethnicminorities are at higher risk of CVD and related disorders, such as type 2 diabetes mellitus.115 Regardingthe health of participants versus non-participants, some trials report that participants are more likelyto be of poorest health,112,116–118 whereas other studies report that participants are healthier or moreactive.113,117,119,120
We compared the anonymised sociodemographic data and CVD risk of responders and non-responders tothe MOVE IT invitation to participate. We aim to test the hypothesis that people who are older, female,living in more affluent areas, at lower risk of CVD and of white ethnicity are more likely to respond.
Methods
Using a cross-sectional design, we compared anonymous data from medical records of patients whoresponded to the invitation to participate in MOVE IT and those of patients who did not. We gained RECapproval to extract anonymised data for all patients invited to participate unless an informed dissent codewas present on medical records.
The measures collected anonymously for all patients invited to participate included age (at time ofscreening), sex, postcode data to calculate IMD 2010 score,76 QRISK2 score and ethnicity.
QRISK2 score was estimated on medical records via a batch calculator, using age- and sex-based nationalaverages for missing data values.
Ethnicity data from medical records were grouped into white, black African or Caribbean, South Asian,other Asian, other/mixed or missing for this analysis. South Asian and other Asian ethnicities are codedseparately because South Asian ethnicity is associated with a higher CVD risk.72 The category of other/mixedincorporates any ethnicity that is reported and does not fit into the previous categories, as well as includingmixed ethnic backgrounds.
Data are summarised as mean (SD) or percentages. The adjusted odds ratios (AORs) for response toinvitation by the sociodemographic and CVD risk data collected were calculated using logistic regression inStata version 14. General practice was included as a random effect in the model to allow for clustering bypractice. AORs for age are presented per 5-year increase, for IMD 2010 scores per 10-point increase andfor QRISK2 scores per 5-percentage-point increase to provide a better comparison of the strength of therelationships.
DOI: 10.3310/hta23690 HEALTH TECHNOLOGY ASSESSMENT 2019 VOL. 23 NO. 69
© Queen’s Printer and Controller of HMSO 2019. This work was produced by Ismail et al. under the terms of a commissioning contract issued by the Secretary of State for Healthand Social Care. This issue may be freely reproduced for the purposes of private research and study and extracts (or indeed, the full report) may be included in professionaljournals provided that suitable acknowledgement is made and the reproduction is not associated with any form of advertising. Applications for commercial reproduction shouldbe addressed to: NIHR Journals Library, National Institute for Health Research, Evaluation, Trials and Studies Coordinating Centre, Alpha House, University of Southampton SciencePark, Southampton SO16 7NS, UK.
61
Results
Lists of patients invited to participate were not saved by general practices and we returned to practiceslater to extract anonymous data. Sixty practices provided the original anonymised data. Sociodemographicdata and QRISK2 scores were extracted for 8902 patients, representing 50.5% of the 17,618 patientsoriginally invited to participate. Table 27 shows the CCGs from which anonymised data were collectedand the deprivation and ethnicity census data of each local authority.71 General practice deprivation scores(IMD 2010)76 of practices from which anonymised data were extracted did not differ significantly from thatof all other practices in South London [t(440) = 0.57; p = 0.57).108
The sociodemographic and QRISK2 data of responders (n = 1489) and non-responders (n = 7413) arepresented in Table 28. The mean age of all patients at the time of invitation was 67.3 ± 5.7 years, and20.7% were female. The mean IMD 201076 score of patients invited was 21.7, a score that falls within thesecond-most-deprived quintile, and the mean QRISK2 score of invitees was 25.2%. Of all patients invited,69.9% had a white ethnic background, 13.9% had ethnic minority backgrounds and 16.2% had noethnicity data recorded in their medical records.
The logistic regression analyses that were conducted to estimate the odds of response are also presented inTable 28. Response rates were higher with increasing age (AOR 1.19, 95% CI 1.12 to 1.26); the odds ofresponse increased by 19% for each 5-year increase in age. The response rate was greater in male patients(AOR 1.24, 95% CI 1.07 to 1.44) and decreased with greater levels of deprivation (AOR 0.84, 95% CI 0.79to 0.90); for every 10-point increase in IMD 2010 score, the odds of responding decreased by 16%. IncreasedCVD risk also lowered the response rate (AOR 0.83, 95% CI 0.77 to 0.88); for every 5-point increase inQRISK2 score, the odds of responding decreased by 17%. The response rate was lower for patients of blackAfrican or Caribbean ethnicity (AOR 0.66, 95% CI 0.45 to 0.96) and those with missing ethnicity data (AOR0.55, 95% CI 0.46 to 0.66) than for patients of white ethnicity. The response rates of Asian and other ethnicbackgrounds were not significantly different from those of patients of white ethnicity.
Pairwise comparisons were conducted to explore differences in response between different ethnic minoritygroups, but there were no significant differences. Response rates of patients with missing ethnicity datawere significantly lower than those of patients of South Asian ethnicity (p = 0.002). Owing to small numbersof invitees from non-white ethnic backgrounds, a sensitivity analysis was undertaken to investigate predictorsof response to invitation with ethnicity removed from the model. Older age (p < 0.001), male sex (p = 0.017),being more affluent (p < 0.001) and having a lower CVD risk (p < 0.001) remained significant predictors ofresponse.
Summary
In Chapter 5, we demonstrated that the trial successfully recruited general practices that did not differsignificantly from all other practices in South London in practice deprivation, and this was also true for thesmaller group of practices involved in this analysis. Therefore, the MOVE IT trial successfully recruited fromsocioeconomically varied areas. For this analysis, we found evidence of participation bias towards patientswho were older, male, residing in more affluent areas and at a lower CVD risk and we found that patientsof black African or Caribbean ethnicity were less likely to respond than patients of white ethnicity. SouthAsian patients were as likely to respond as patients of white ethnicity but the QRISK2 score identified asmaller sample size of people of African Caribbean and Asian ethnicities. This could be partly becausethose CCGs with the highest IMD 2010 scores and greater ethnic diversity were less likely to participate inMOVE IT. It is noteworthy that these CCGs were the slowest to respond to participate although all CCGswere invited at the same time. We also observed high rates of missing ethnicity data on medical recordsand this group of patients with missing ethnicity data was less likely to respond than patients of white orSouth Asian ethnicity. These findings suggest that there may have been a participation bias towards thosewith lower CVD risk compared with those most at risk.
PARTICIPATION BIASES
NIHR Journals Library www.journalslibrary.nihr.ac.uk
62
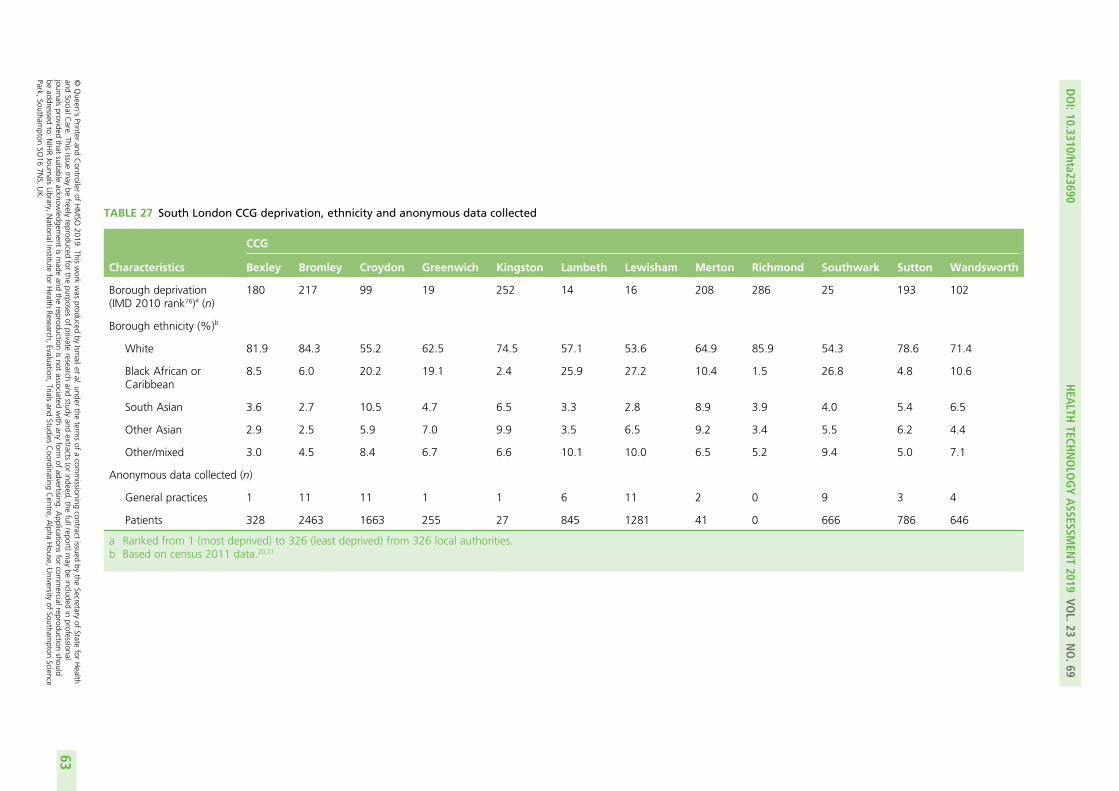
TABLE 27 South London CCG deprivation, ethnicity and anonymous data collected
Characteristics
CCG
Bexley Bromley Croydon Greenwich Kingston Lambeth Lewisham Merton Richmond Southwark Sutton Wandsworth
Borough deprivation(IMD 2010 rank76)a (n)
180 217 99 19 252 14 16 208 286 25 193 102
Borough ethnicity (%)b
White 81.9 84.3 55.2 62.5 74.5 57.1 53.6 64.9 85.9 54.3 78.6 71.4
Black African orCaribbean
8.5 6.0 20.2 19.1 2.4 25.9 27.2 10.4 1.5 26.8 4.8 10.6
South Asian 3.6 2.7 10.5 4.7 6.5 3.3 2.8 8.9 3.9 4.0 5.4 6.5
Other Asian 2.9 2.5 5.9 7.0 9.9 3.5 6.5 9.2 3.4 5.5 6.2 4.4
Other/mixed 3.0 4.5 8.4 6.7 6.6 10.1 10.0 6.5 5.2 9.4 5.0 7.1
Anonymous data collected (n)
General practices 1 11 11 1 1 6 11 2 0 9 3 4
Patients 328 2463 1663 255 27 845 1281 41 0 666 786 646
a Ranked from 1 (most deprived) to 326 (least deprived) from 326 local authorities.b Based on census 2011 data.20,71
DOI:10.3310/hta23690
HEA
LTHTECH
NOLO
GYASSESSM
ENT2019
VOL.23
NO.69
©Queen
’sPrinter
andController
ofHMSO
2019.This
work
was
producedby
Ismailet
al.under
theterm
sof
acom
missioning
contractissued
bythe
Secretaryof
Statefor
Health
andSocialC
are.This
issuemay
befreely
reproducedfor
thepurposes
ofprivate
researchand
studyand
extracts(or
indeed,the
fullreport)may
beincluded
inprofessional
journalsprovided
thatsuitable
acknowledgem
entismade
andthe
reproductionisnot
associatedwith
anyform
ofadvertising.
Applications
forcom
mercialreproduction
shouldbe
addressedto:
NIHRJournals
Library,NationalInstitute
forHealth
Research,Evaluation,
Trialsand
StudiesCoordinating
Centre,
Alpha
House,
University
ofSoutham
ptonScience
Park,Southam
ptonSO
167N
S,UK.
63
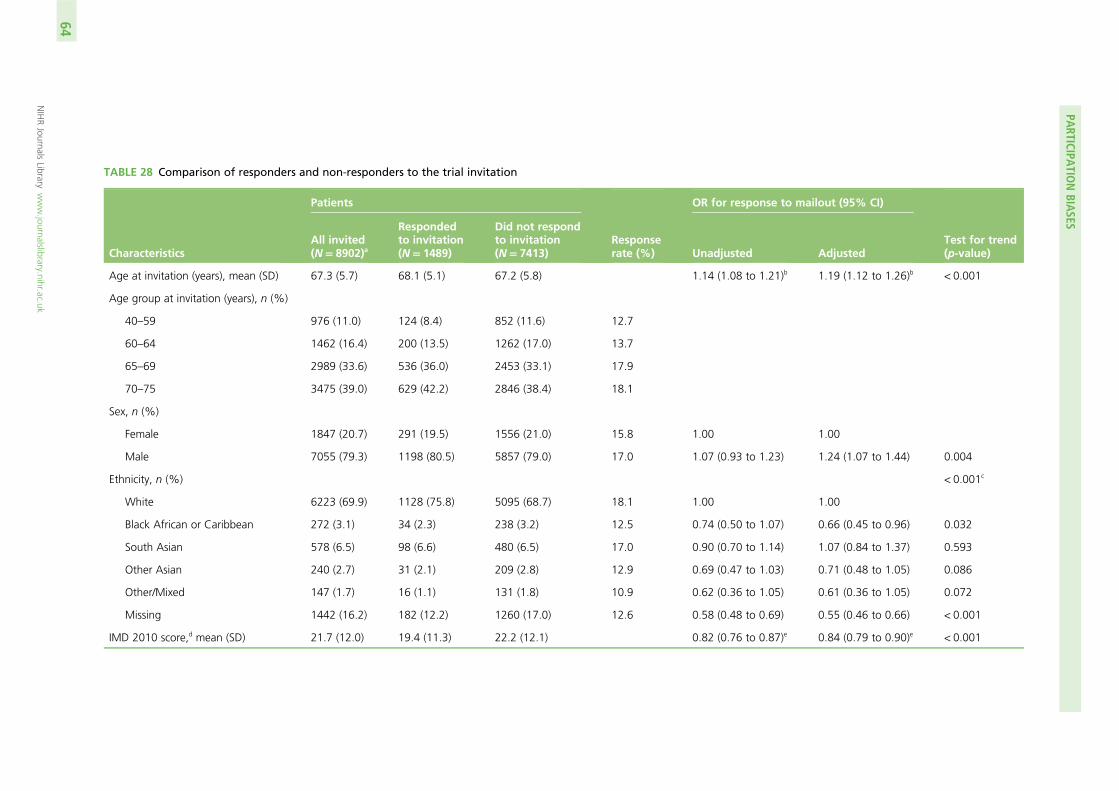
TABLE 28 Comparison of responders and non-responders to the trial invitation
Characteristics
Patients
Responserate (%)
OR for response to mailout (95% CI)
Test for trend(p-value)
All invited(N= 8902)a
Respondedto invitation(N= 1489)
Did not respondto invitation(N= 7413) Unadjusted Adjusted
Age at invitation (years), mean (SD) 67.3 (5.7) 68.1 (5.1) 67.2 (5.8) 1.14 (1.08 to 1.21)b 1.19 (1.12 to 1.26)b < 0.001
Age group at invitation (years), n (%)
40–59 976 (11.0) 124 (8.4) 852 (11.6) 12.7
60–64 1462 (16.4) 200 (13.5) 1262 (17.0) 13.7
65–69 2989 (33.6) 536 (36.0) 2453 (33.1) 17.9
70–75 3475 (39.0) 629 (42.2) 2846 (38.4) 18.1
Sex, n (%)
Female 1847 (20.7) 291 (19.5) 1556 (21.0) 15.8 1.00 1.00
Male 7055 (79.3) 1198 (80.5) 5857 (79.0) 17.0 1.07 (0.93 to 1.23) 1.24 (1.07 to 1.44) 0.004
Ethnicity, n (%) < 0.001c
White 6223 (69.9) 1128 (75.8) 5095 (68.7) 18.1 1.00 1.00
Black African or Caribbean 272 (3.1) 34 (2.3) 238 (3.2) 12.5 0.74 (0.50 to 1.07) 0.66 (0.45 to 0.96) 0.032
South Asian 578 (6.5) 98 (6.6) 480 (6.5) 17.0 0.90 (0.70 to 1.14) 1.07 (0.84 to 1.37) 0.593
Other Asian 240 (2.7) 31 (2.1) 209 (2.8) 12.9 0.69 (0.47 to 1.03) 0.71 (0.48 to 1.05) 0.086
Other/Mixed 147 (1.7) 16 (1.1) 131 (1.8) 10.9 0.62 (0.36 to 1.05) 0.61 (0.36 to 1.05) 0.072
Missing 1442 (16.2) 182 (12.2) 1260 (17.0) 12.6 0.58 (0.48 to 0.69) 0.55 (0.46 to 0.66) < 0.001
IMD 2010 score,d mean (SD) 21.7 (12.0) 19.4 (11.3) 22.2 (12.1) 0.82 (0.76 to 0.87)e 0.84 (0.79 to 0.90)e < 0.001
PARTICIPA
TIONBIA
SES
NIHRJournals
Librarywww.journalslibrary.nihr.ac.uk
64
Characteristics
Patients
Responserate (%)
OR for response to mailout (95% CI)
Test for trend(p-value)
All invited(N= 8902)a
Respondedto invitation(N= 1489)
Did not respondto invitation(N= 7413) Unadjusted Adjusted
IMD 2010 quintile, n (%)
1 (least deprived) 1407 (15.8) 293 (19.7) 1114 (15.0) 20.8
2 1531 (17.2) 285 (19.1) 1246 (16.8) 18.6
3 1616 (18.2) 315 (21.2) 1301 (17.6) 19.5
4 2725 (30.6) 420 (28.2) 2305 (31.1) 15.4
5 (most deprived) 1604 (18.0) 171 (11.5) 1433 (19.3) 10.7
Unknown 19 (0.2) 5 (0.3) 14 (0.2) 26.3
QRISK2 score, mean (SD) 25.2 (5.0) 24.6 (4.5) 25.3 (5.1) 0.86 (0.81 to 0.92)f 0.83 (0.77 to 0.88)f < 0.001
QRISK2 score category, n (%)
20–24.9% 5357 (60.2) 968 (65.0) 4389 (59.2) 18.1
25–29.9% 2245 (25.2) 347 (23.3) 1898 (25.6) 15.5
≥ 30% 1300 (14.6) 174 (11.7) 1126 (15.2) 13.4
OR, odds ratio.a All patients invited to participate in the trial from general practice sites at which it was possible to extract anonymised data.b OR per 5-year increase in age.c Chi-squared test for independence of ethnicity groups.d IMD 2010 score;76 higher score is more deprived.e OR per 10-point increase in IMD score.76
f OR per 5% increase in QRISK2 score.
DOI:10.3310/hta23690
HEA
LTHTECH
NOLO
GYASSESSM
ENT2019
VOL.23
NO.69
©Queen
’sPrinter
andController
ofHMSO
2019.This
work
was
producedby
Ismailet
al.under
theterm
sof
acom
missioning
contractissued
bythe
Secretaryof
Statefor
Health
andSocialC
are.This
issuemay
befreely
reproducedfor
thepurposes
ofprivate
researchand
studyand
extracts(or
indeed,the
fullreport)may
beincluded
inprofessional
journalsprovided
thatsuitable
acknowledgem
entismade
andthe
reproductionisnot
associatedwith
anyform
ofadvertising.
Applications
forcom
mercialreproduction
shouldbe
addressedto:
NIHRJournals
Library,NationalInstitute
forHealth
Research,Evaluation,
Trialsand
StudiesCoordinating
Centre,
Alpha
House,
University
ofSoutham
ptonScience
Park,Southam
ptonSO
167N
S,UK.
65

Chapter 8 Fidelity analysis
Introduction
As part of the process evaluation of the study, we assessed fidelity, here defined as delivery of the enhancedMI intervention by the HLFs in accordance with the manual. Furthermore, we were interested in determiningif the level of HLF competency in delivering the intervention differed between the individual and groupintervention arms.
As described in Chapter 3, HLFs received extensive training and supervision before and during theintervention to ensure that they were competent in delivering MOVE IT. HLFs were asked to audiotapeeach intervention session, and these data were stored on King’s College London’s shared network drives,as per the university protocol. Chapter 4 describes how a university-wide network outage caused therecorded session data to be completely lost, with only a limited sample being subsequently recovered fromother sources. In this chapter, we will describe our original aims and methods and how these wereadapted following the network outage.
Aims
For the analysis, we were originally interested in answering five questions:
1. What was the degree of adherence by the HLFs to the MI and BCT elements in the group andindividual intervention arms?
2. What was the level of HLF competency in delivering the MI aspects?3. What was the level of HLF competency in delivering the BCTs?4. Were there any differences in competency in delivering the MI and BCT elements between the group
and individual treatment arms?5. Were the HLF competency levels in delivering the intervention associated with patient outcomes or
mediators of any treatment effects?
Owing to the network outage and the number and quality of data that were subsequently recovered,we were unable to address question 5. In addition, although the HLFs were trained to a certain level ofcompetency in two other domains (group skills and time management; see Chapter 3), we were notinterested in assessing their competency in these domains for this fidelity analysis.
Original methods
Identifying sessions to rateIdeally, if every patient randomised to the individual or group intervention attended each of the 10sessions, we would have obtained 6200 hours of recordings (Table 29). In addition, by assuming a 20%dropout rate halfway through the intervention, we would have obtained 5201 hours of recordings. Weoriginally had 2756 tapes of the intervention sessions, comprising 1989 hours of content.
We planned to randomly select and rate 25% of the available recordings, stratified by intervention arm(group vs. individual), ensuring that every participant in the individual intervention arm and every group inthe group intervention arm had at least one recording assessed for fidelity. Sessions lasting ≥ 20 minuteswould be selected. We planned that a 20-minute segment (randomly selected from the beginning, middleor end) of each tape would be rated for individual sessions, and we selected a 50-minute segment of the
DOI: 10.3310/hta23690 HEALTH TECHNOLOGY ASSESSMENT 2019 VOL. 23 NO. 69
© Queen’s Printer and Controller of HMSO 2019. This work was produced by Ismail et al. under the terms of a commissioning contract issued by the Secretary of State for Healthand Social Care. This issue may be freely reproduced for the purposes of private research and study and extracts (or indeed, the full report) may be included in professionaljournals provided that suitable acknowledgement is made and the reproduction is not associated with any form of advertising. Applications for commercial reproduction shouldbe addressed to: NIHR Journals Library, National Institute for Health Research, Evaluation, Trials and Studies Coordinating Centre, Alpha House, University of Southampton SciencePark, Southampton SO16 7NS, UK.
67
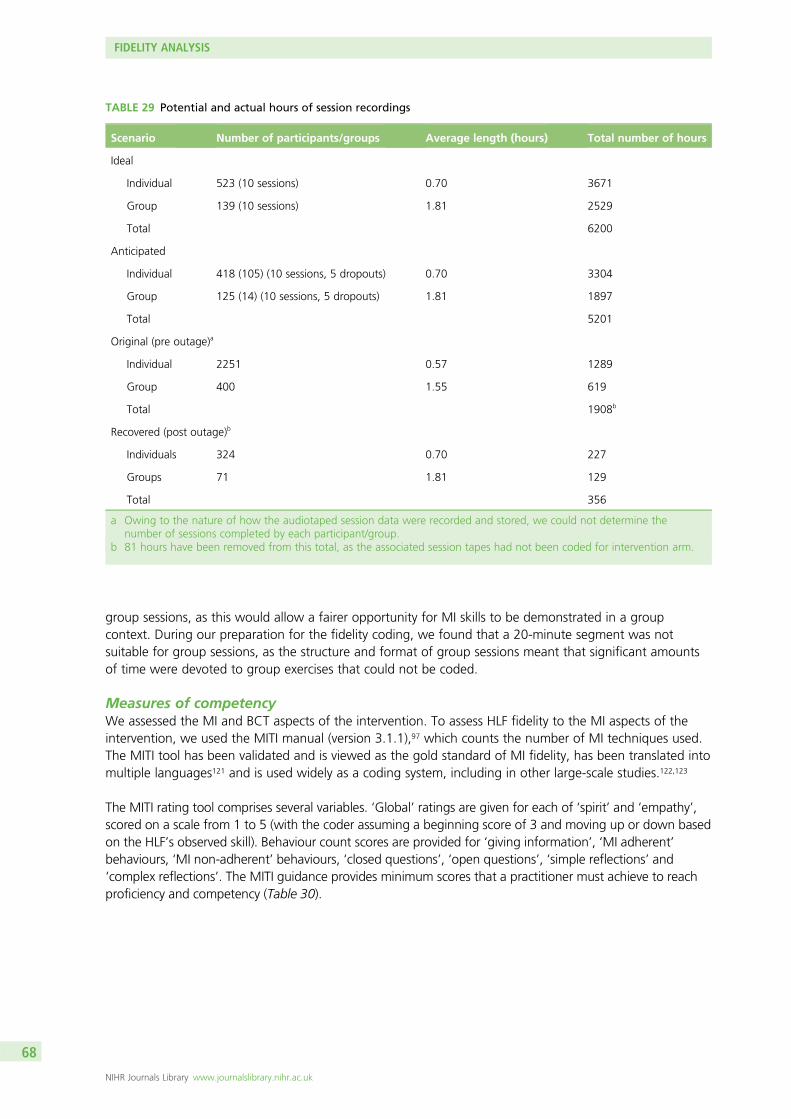
group sessions, as this would allow a fairer opportunity for MI skills to be demonstrated in a groupcontext. During our preparation for the fidelity coding, we found that a 20-minute segment was notsuitable for group sessions, as the structure and format of group sessions meant that significant amountsof time were devoted to group exercises that could not be coded.
Measures of competencyWe assessed the MI and BCT aspects of the intervention. To assess HLF fidelity to the MI aspects of theintervention, we used the MITI manual (version 3.1.1),97 which counts the number of MI techniques used.The MITI tool has been validated and is viewed as the gold standard of MI fidelity, has been translated intomultiple languages121 and is used widely as a coding system, including in other large-scale studies.122,123
The MITI rating tool comprises several variables. ‘Global’ ratings are given for each of ‘spirit’ and ‘empathy’,scored on a scale from 1 to 5 (with the coder assuming a beginning score of 3 and moving up or down basedon the HLF’s observed skill). Behaviour count scores are provided for ‘giving information’, ‘MI adherent’behaviours, ‘MI non-adherent’ behaviours, ‘closed questions’, ‘open questions’, ‘simple reflections’ and‘complex reflections’. The MITI guidance provides minimum scores that a practitioner must achieve to reachproficiency and competency (Table 30).
TABLE 29 Potential and actual hours of session recordings
Scenario Number of participants/groups Average length (hours) Total number of hours
Ideal
Individual 523 (10 sessions) 0.70 3671
Group 139 (10 sessions) 1.81 2529
Total 6200
Anticipated
Individual 418 (105) (10 sessions, 5 dropouts) 0.70 3304
Group 125 (14) (10 sessions, 5 dropouts) 1.81 1897
Total 5201
Original (pre outage)a
Individual 2251 0.57 1289
Group 400 1.55 619
Total 1908b
Recovered (post outage)b
Individuals 324 0.70 227
Groups 71 1.81 129
Total 356
a Owing to the nature of how the audiotaped session data were recorded and stored, we could not determine thenumber of sessions completed by each participant/group.
b 81 hours have been removed from this total, as the associated session tapes had not been coded for intervention arm.
FIDELITY ANALYSIS
NIHR Journals Library www.journalslibrary.nihr.ac.uk
68
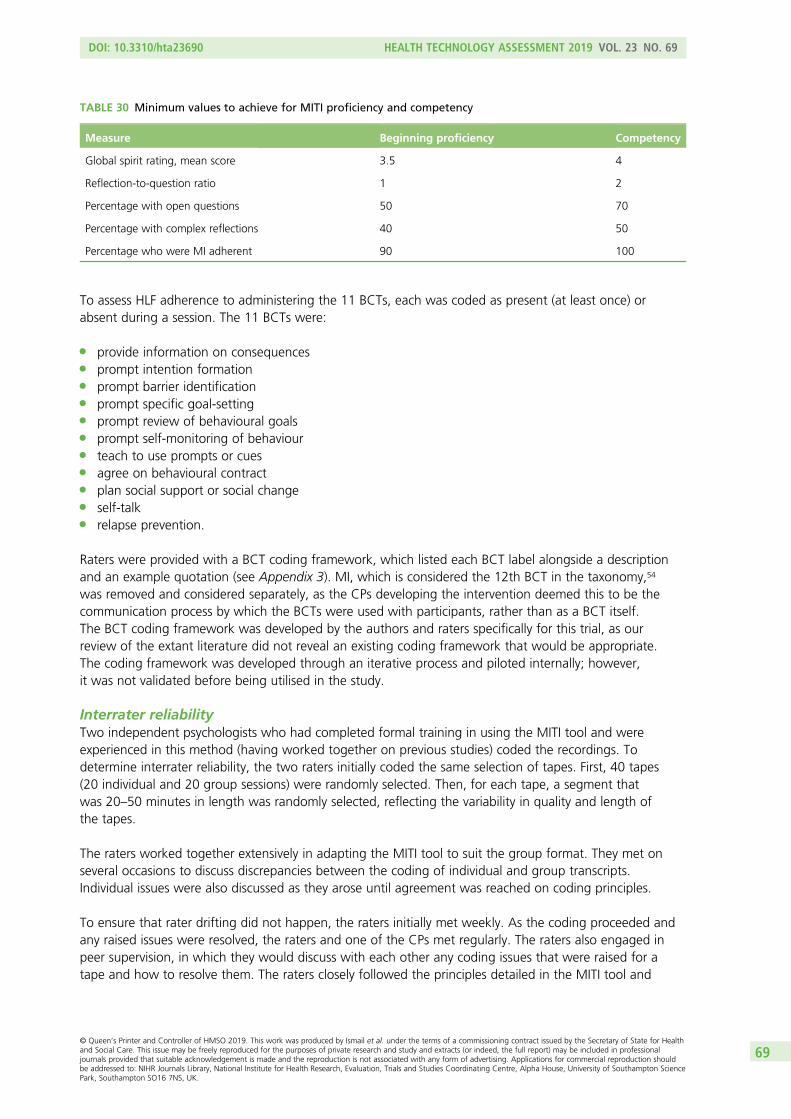
To assess HLF adherence to administering the 11 BCTs, each was coded as present (at least once) orabsent during a session. The 11 BCTs were:
l provide information on consequencesl prompt intention formationl prompt barrier identificationl prompt specific goal-settingl prompt review of behavioural goalsl prompt self-monitoring of behaviourl teach to use prompts or cuesl agree on behavioural contractl plan social support or social changel self-talkl relapse prevention.
Raters were provided with a BCT coding framework, which listed each BCT label alongside a descriptionand an example quotation (see Appendix 3). MI, which is considered the 12th BCT in the taxonomy,54
was removed and considered separately, as the CPs developing the intervention deemed this to be thecommunication process by which the BCTs were used with participants, rather than as a BCT itself.The BCT coding framework was developed by the authors and raters specifically for this trial, as ourreview of the extant literature did not reveal an existing coding framework that would be appropriate.The coding framework was developed through an iterative process and piloted internally; however,it was not validated before being utilised in the study.
Interrater reliabilityTwo independent psychologists who had completed formal training in using the MITI tool and wereexperienced in this method (having worked together on previous studies) coded the recordings. Todetermine interrater reliability, the two raters initially coded the same selection of tapes. First, 40 tapes(20 individual and 20 group sessions) were randomly selected. Then, for each tape, a segment thatwas 20–50 minutes in length was randomly selected, reflecting the variability in quality and length ofthe tapes.
The raters worked together extensively in adapting the MITI tool to suit the group format. They met onseveral occasions to discuss discrepancies between the coding of individual and group transcripts.Individual issues were also discussed as they arose until agreement was reached on coding principles.
To ensure that rater drifting did not happen, the raters initially met weekly. As the coding proceeded andany raised issues were resolved, the raters and one of the CPs met regularly. The raters also engaged inpeer supervision, in which they would discuss with each other any coding issues that were raised for atape and how to resolve them. The raters closely followed the principles detailed in the MITI tool and
TABLE 30 Minimum values to achieve for MITI proficiency and competency
Measure Beginning proficiency Competency
Global spirit rating, mean score 3.5 4
Reflection-to-question ratio 1 2
Percentage with open questions 50 70
Percentage with complex reflections 40 50
Percentage who were MI adherent 90 100
DOI: 10.3310/hta23690 HEALTH TECHNOLOGY ASSESSMENT 2019 VOL. 23 NO. 69
© Queen’s Printer and Controller of HMSO 2019. This work was produced by Ismail et al. under the terms of a commissioning contract issued by the Secretary of State for Healthand Social Care. This issue may be freely reproduced for the purposes of private research and study and extracts (or indeed, the full report) may be included in professionaljournals provided that suitable acknowledgement is made and the reproduction is not associated with any form of advertising. Applications for commercial reproduction shouldbe addressed to: NIHR Journals Library, National Institute for Health Research, Evaluation, Trials and Studies Coordinating Centre, Alpha House, University of Southampton SciencePark, Southampton SO16 7NS, UK.
69
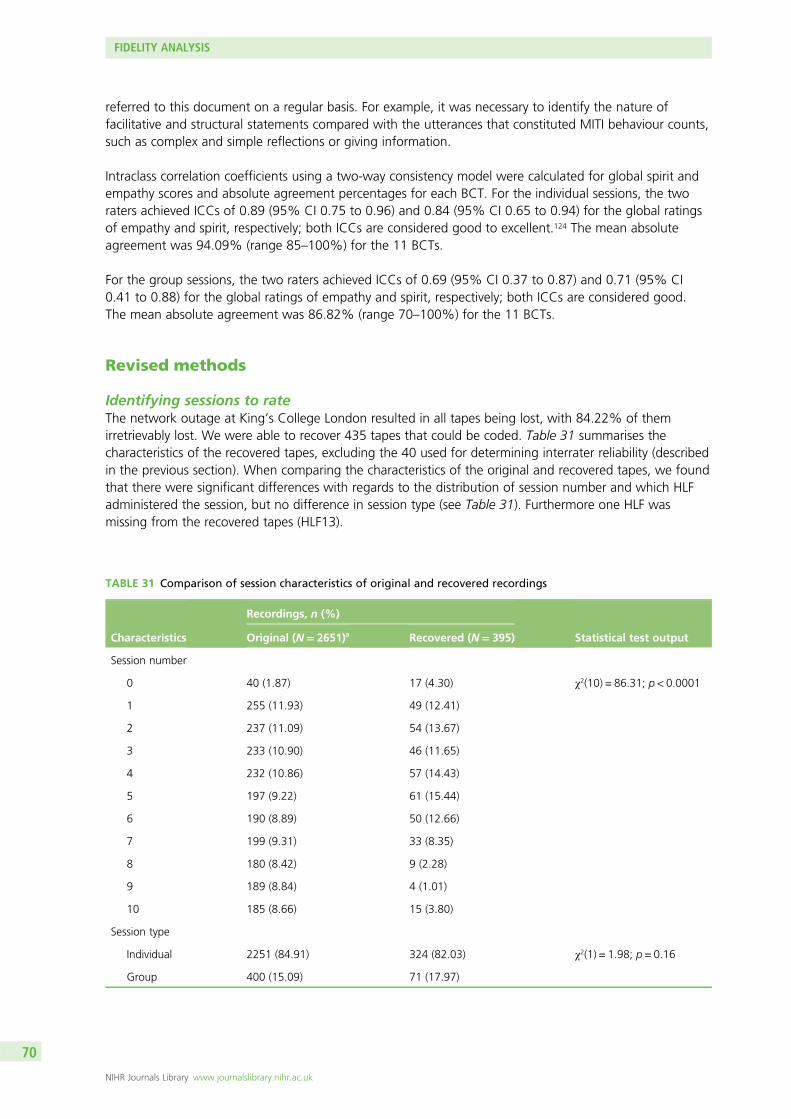
referred to this document on a regular basis. For example, it was necessary to identify the nature offacilitative and structural statements compared with the utterances that constituted MITI behaviour counts,such as complex and simple reflections or giving information.
Intraclass correlation coefficients using a two-way consistency model were calculated for global spirit andempathy scores and absolute agreement percentages for each BCT. For the individual sessions, the tworaters achieved ICCs of 0.89 (95% CI 0.75 to 0.96) and 0.84 (95% CI 0.65 to 0.94) for the global ratingsof empathy and spirit, respectively; both ICCs are considered good to excellent.124 The mean absoluteagreement was 94.09% (range 85–100%) for the 11 BCTs.
For the group sessions, the two raters achieved ICCs of 0.69 (95% CI 0.37 to 0.87) and 0.71 (95% CI0.41 to 0.88) for the global ratings of empathy and spirit, respectively; both ICCs are considered good.The mean absolute agreement was 86.82% (range 70–100%) for the 11 BCTs.
Revised methods
Identifying sessions to rateThe network outage at King’s College London resulted in all tapes being lost, with 84.22% of themirretrievably lost. We were able to recover 435 tapes that could be coded. Table 31 summarises thecharacteristics of the recovered tapes, excluding the 40 used for determining interrater reliability (describedin the previous section). When comparing the characteristics of the original and recovered tapes, we foundthat there were significant differences with regards to the distribution of session number and which HLFadministered the session, but no difference in session type (see Table 31). Furthermore one HLF wasmissing from the recovered tapes (HLF13).
TABLE 31 Comparison of session characteristics of original and recovered recordings
Characteristics
Recordings, n (%)
Statistical test outputOriginal (N= 2651)a Recovered (N= 395)
Session number
0 40 (1.87) 17 (4.30) χ2(10) = 86.31; p < 0.0001
1 255 (11.93) 49 (12.41)
2 237 (11.09) 54 (13.67)
3 233 (10.90) 46 (11.65)
4 232 (10.86) 57 (14.43)
5 197 (9.22) 61 (15.44)
6 190 (8.89) 50 (12.66)
7 199 (9.31) 33 (8.35)
8 180 (8.42) 9 (2.28)
9 189 (8.84) 4 (1.01)
10 185 (8.66) 15 (3.80)
Session type
Individual 2251 (84.91) 324 (82.03) χ2(1) = 1.98; p = 0.16
Group 400 (15.09) 71 (17.97)
FIDELITY ANALYSIS
NIHR Journals Library www.journalslibrary.nihr.ac.uk
70
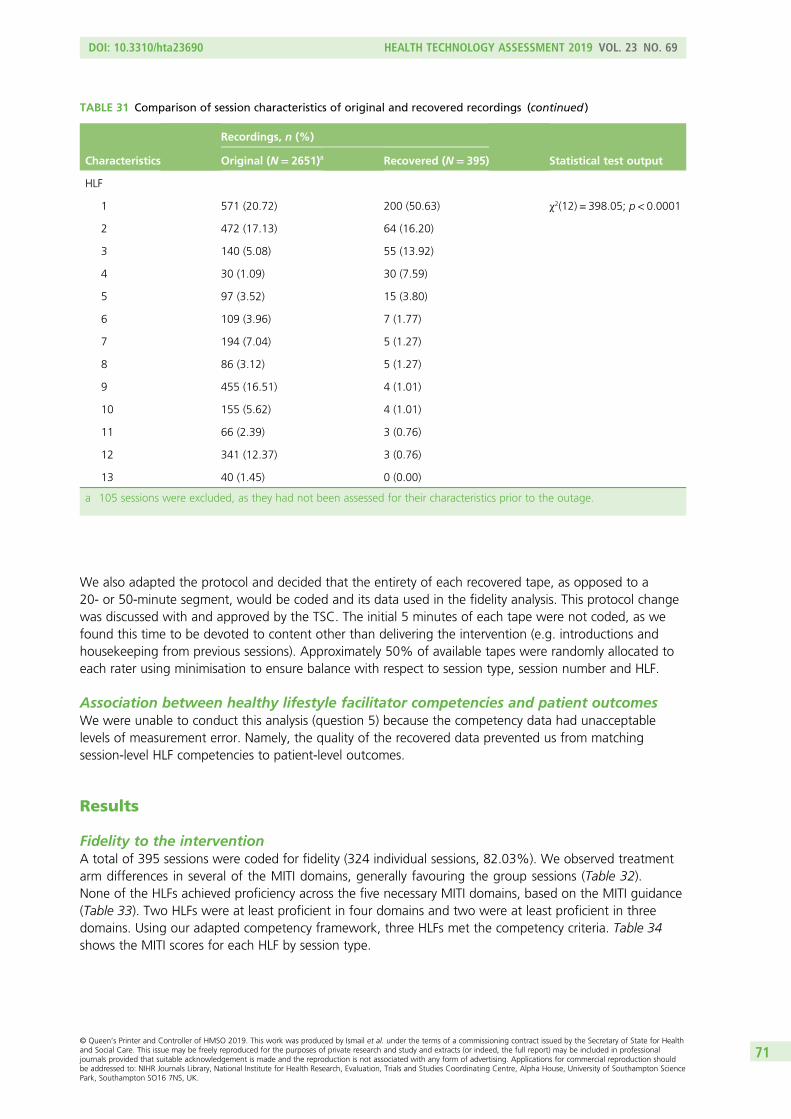
We also adapted the protocol and decided that the entirety of each recovered tape, as opposed to a20- or 50-minute segment, would be coded and its data used in the fidelity analysis. This protocol changewas discussed with and approved by the TSC. The initial 5 minutes of each tape were not coded, as wefound this time to be devoted to content other than delivering the intervention (e.g. introductions andhousekeeping from previous sessions). Approximately 50% of available tapes were randomly allocated toeach rater using minimisation to ensure balance with respect to session type, session number and HLF.
Association between healthy lifestyle facilitator competencies and patient outcomesWe were unable to conduct this analysis (question 5) because the competency data had unacceptablelevels of measurement error. Namely, the quality of the recovered data prevented us from matchingsession-level HLF competencies to patient-level outcomes.
Results
Fidelity to the interventionA total of 395 sessions were coded for fidelity (324 individual sessions, 82.03%). We observed treatmentarm differences in several of the MITI domains, generally favouring the group sessions (Table 32).None of the HLFs achieved proficiency across the five necessary MITI domains, based on the MITI guidance(Table 33). Two HLFs were at least proficient in four domains and two were at least proficient in threedomains. Using our adapted competency framework, three HLFs met the competency criteria. Table 34shows the MITI scores for each HLF by session type.
TABLE 31 Comparison of session characteristics of original and recovered recordings (continued )
Characteristics
Recordings, n (%)
Statistical test outputOriginal (N= 2651)a Recovered (N= 395)
HLF
1 571 (20.72) 200 (50.63) χ2(12) = 398.05; p < 0.0001
2 472 (17.13) 64 (16.20)
3 140 (5.08) 55 (13.92)
4 30 (1.09) 30 (7.59)
5 97 (3.52) 15 (3.80)
6 109 (3.96) 7 (1.77)
7 194 (7.04) 5 (1.27)
8 86 (3.12) 5 (1.27)
9 455 (16.51) 4 (1.01)
10 155 (5.62) 4 (1.01)
11 66 (2.39) 3 (0.76)
12 341 (12.37) 3 (0.76)
13 40 (1.45) 0 (0.00)
a 105 sessions were excluded, as they had not been assessed for their characteristics prior to the outage.
DOI: 10.3310/hta23690 HEALTH TECHNOLOGY ASSESSMENT 2019 VOL. 23 NO. 69
© Queen’s Printer and Controller of HMSO 2019. This work was produced by Ismail et al. under the terms of a commissioning contract issued by the Secretary of State for Healthand Social Care. This issue may be freely reproduced for the purposes of private research and study and extracts (or indeed, the full report) may be included in professionaljournals provided that suitable acknowledgement is made and the reproduction is not associated with any form of advertising. Applications for commercial reproduction shouldbe addressed to: NIHR Journals Library, National Institute for Health Research, Evaluation, Trials and Studies Coordinating Centre, Alpha House, University of Southampton SciencePark, Southampton SO16 7NS, UK.
71
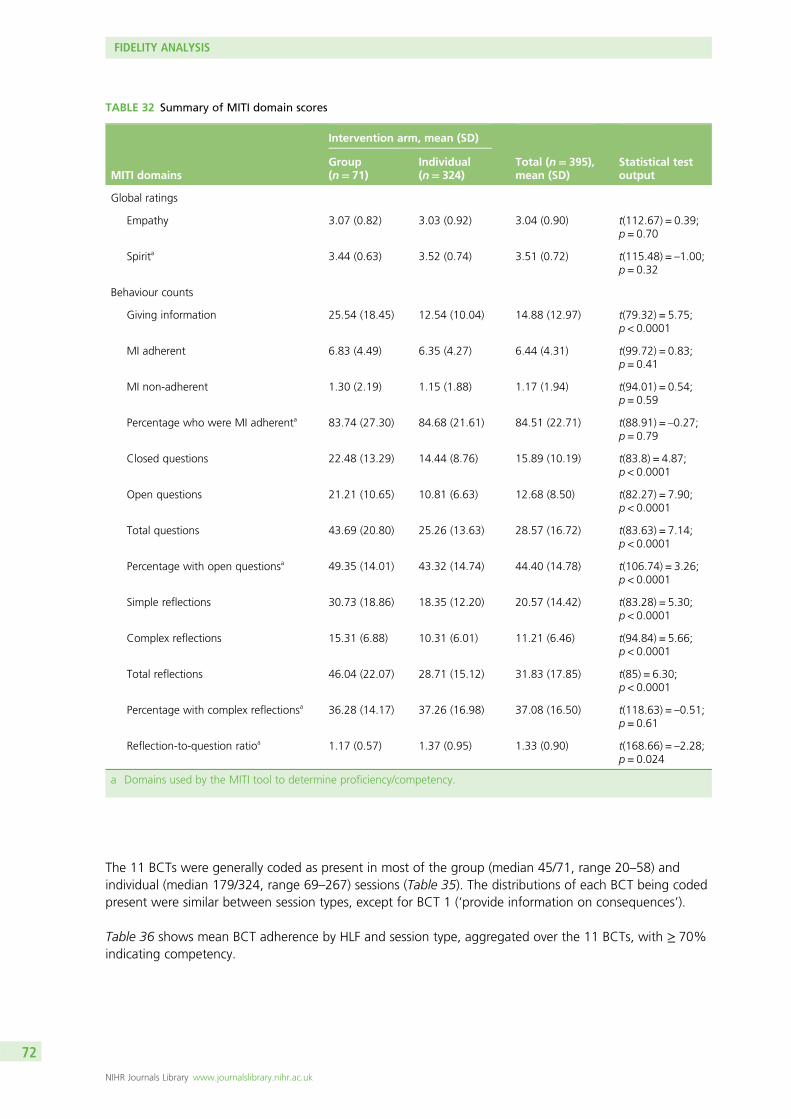
The 11 BCTs were generally coded as present in most of the group (median 45/71, range 20–58) andindividual (median 179/324, range 69–267) sessions (Table 35). The distributions of each BCT being codedpresent were similar between session types, except for BCT 1 (‘provide information on consequences’).
Table 36 shows mean BCT adherence by HLF and session type, aggregated over the 11 BCTs, with ≥ 70%indicating competency.
TABLE 32 Summary of MITI domain scores
MITI domains
Intervention arm, mean (SD)
Total (n= 395),mean (SD)
Statistical testoutput
Group(n= 71)
Individual(n= 324)
Global ratings
Empathy 3.07 (0.82) 3.03 (0.92) 3.04 (0.90) t(112.67) = 0.39;p = 0.70
Spirita 3.44 (0.63) 3.52 (0.74) 3.51 (0.72) t(115.48) = –1.00;p = 0.32
Behaviour counts
Giving information 25.54 (18.45) 12.54 (10.04) 14.88 (12.97) t(79.32) = 5.75;p < 0.0001
MI adherent 6.83 (4.49) 6.35 (4.27) 6.44 (4.31) t(99.72) = 0.83;p = 0.41
MI non-adherent 1.30 (2.19) 1.15 (1.88) 1.17 (1.94) t(94.01) = 0.54;p = 0.59
Percentage who were MI adherenta 83.74 (27.30) 84.68 (21.61) 84.51 (22.71) t(88.91) = –0.27;p = 0.79
Closed questions 22.48 (13.29) 14.44 (8.76) 15.89 (10.19) t(83.8) = 4.87;p < 0.0001
Open questions 21.21 (10.65) 10.81 (6.63) 12.68 (8.50) t(82.27) = 7.90;p < 0.0001
Total questions 43.69 (20.80) 25.26 (13.63) 28.57 (16.72) t(83.63) = 7.14;p < 0.0001
Percentage with open questionsa 49.35 (14.01) 43.32 (14.74) 44.40 (14.78) t(106.74) = 3.26;p < 0.0001
Simple reflections 30.73 (18.86) 18.35 (12.20) 20.57 (14.42) t(83.28) = 5.30;p < 0.0001
Complex reflections 15.31 (6.88) 10.31 (6.01) 11.21 (6.46) t(94.84) = 5.66;p < 0.0001
Total reflections 46.04 (22.07) 28.71 (15.12) 31.83 (17.85) t(85) = 6.30;p < 0.0001
Percentage with complex reflectionsa 36.28 (14.17) 37.26 (16.98) 37.08 (16.50) t(118.63) = –0.51;p = 0.61
Reflection-to-question ratioa 1.17 (0.57) 1.37 (0.95) 1.33 (0.90) t(168.66) = –2.28;p = 0.024
a Domains used by the MITI tool to determine proficiency/competency.
FIDELITY ANALYSIS
NIHR Journals Library www.journalslibrary.nihr.ac.uk
72
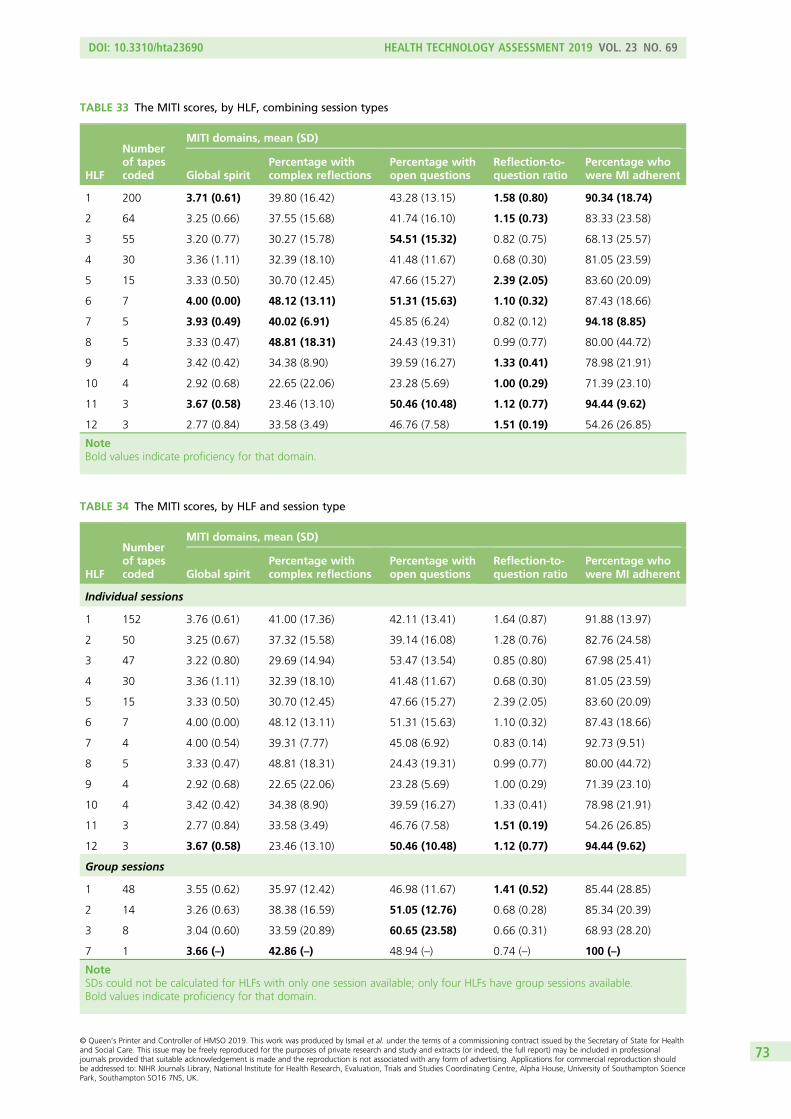
TABLE 33 The MITI scores, by HLF, combining session types
HLF
Numberof tapescoded
MITI domains, mean (SD)
Global spiritPercentage withcomplex reflections
Percentage withopen questions
Reflection-to-question ratio
Percentage whowere MI adherent
1 200 3.71 (0.61) 39.80 (16.42) 43.28 (13.15) 1.58 (0.80) 90.34 (18.74)
2 64 3.25 (0.66) 37.55 (15.68) 41.74 (16.10) 1.15 (0.73) 83.33 (23.58)
3 55 3.20 (0.77) 30.27 (15.78) 54.51 (15.32) 0.82 (0.75) 68.13 (25.57)
4 30 3.36 (1.11) 32.39 (18.10) 41.48 (11.67) 0.68 (0.30) 81.05 (23.59)
5 15 3.33 (0.50) 30.70 (12.45) 47.66 (15.27) 2.39 (2.05) 83.60 (20.09)
6 7 4.00 (0.00) 48.12 (13.11) 51.31 (15.63) 1.10 (0.32) 87.43 (18.66)
7 5 3.93 (0.49) 40.02 (6.91) 45.85 (6.24) 0.82 (0.12) 94.18 (8.85)
8 5 3.33 (0.47) 48.81 (18.31) 24.43 (19.31) 0.99 (0.77) 80.00 (44.72)
9 4 3.42 (0.42) 34.38 (8.90) 39.59 (16.27) 1.33 (0.41) 78.98 (21.91)
10 4 2.92 (0.68) 22.65 (22.06) 23.28 (5.69) 1.00 (0.29) 71.39 (23.10)
11 3 3.67 (0.58) 23.46 (13.10) 50.46 (10.48) 1.12 (0.77) 94.44 (9.62)
12 3 2.77 (0.84) 33.58 (3.49) 46.76 (7.58) 1.51 (0.19) 54.26 (26.85)
NoteBold values indicate proficiency for that domain.
TABLE 34 The MITI scores, by HLF and session type
HLF
Numberof tapescoded
MITI domains, mean (SD)
Global spiritPercentage withcomplex reflections
Percentage withopen questions
Reflection-to-question ratio
Percentage whowere MI adherent
Individual sessions
1 152 3.76 (0.61) 41.00 (17.36) 42.11 (13.41) 1.64 (0.87) 91.88 (13.97)
2 50 3.25 (0.67) 37.32 (15.58) 39.14 (16.08) 1.28 (0.76) 82.76 (24.58)
3 47 3.22 (0.80) 29.69 (14.94) 53.47 (13.54) 0.85 (0.80) 67.98 (25.41)
4 30 3.36 (1.11) 32.39 (18.10) 41.48 (11.67) 0.68 (0.30) 81.05 (23.59)
5 15 3.33 (0.50) 30.70 (12.45) 47.66 (15.27) 2.39 (2.05) 83.60 (20.09)
6 7 4.00 (0.00) 48.12 (13.11) 51.31 (15.63) 1.10 (0.32) 87.43 (18.66)
7 4 4.00 (0.54) 39.31 (7.77) 45.08 (6.92) 0.83 (0.14) 92.73 (9.51)
8 5 3.33 (0.47) 48.81 (18.31) 24.43 (19.31) 0.99 (0.77) 80.00 (44.72)
9 4 2.92 (0.68) 22.65 (22.06) 23.28 (5.69) 1.00 (0.29) 71.39 (23.10)
10 4 3.42 (0.42) 34.38 (8.90) 39.59 (16.27) 1.33 (0.41) 78.98 (21.91)
11 3 2.77 (0.84) 33.58 (3.49) 46.76 (7.58) 1.51 (0.19) 54.26 (26.85)
12 3 3.67 (0.58) 23.46 (13.10) 50.46 (10.48) 1.12 (0.77) 94.44 (9.62)
Group sessions
1 48 3.55 (0.62) 35.97 (12.42) 46.98 (11.67) 1.41 (0.52) 85.44 (28.85)
2 14 3.26 (0.63) 38.38 (16.59) 51.05 (12.76) 0.68 (0.28) 85.34 (20.39)
3 8 3.04 (0.60) 33.59 (20.89) 60.65 (23.58) 0.66 (0.31) 68.93 (28.20)
7 1 3.66 (–) 42.86 (–) 48.94 (–) 0.74 (–) 100 (–)
NoteSDs could not be calculated for HLFs with only one session available; only four HLFs have group sessions available.Bold values indicate proficiency for that domain.
DOI: 10.3310/hta23690 HEALTH TECHNOLOGY ASSESSMENT 2019 VOL. 23 NO. 69
© Queen’s Printer and Controller of HMSO 2019. This work was produced by Ismail et al. under the terms of a commissioning contract issued by the Secretary of State for Healthand Social Care. This issue may be freely reproduced for the purposes of private research and study and extracts (or indeed, the full report) may be included in professionaljournals provided that suitable acknowledgement is made and the reproduction is not associated with any form of advertising. Applications for commercial reproduction shouldbe addressed to: NIHR Journals Library, National Institute for Health Research, Evaluation, Trials and Studies Coordinating Centre, Alpha House, University of Southampton SciencePark, Southampton SO16 7NS, UK.
73
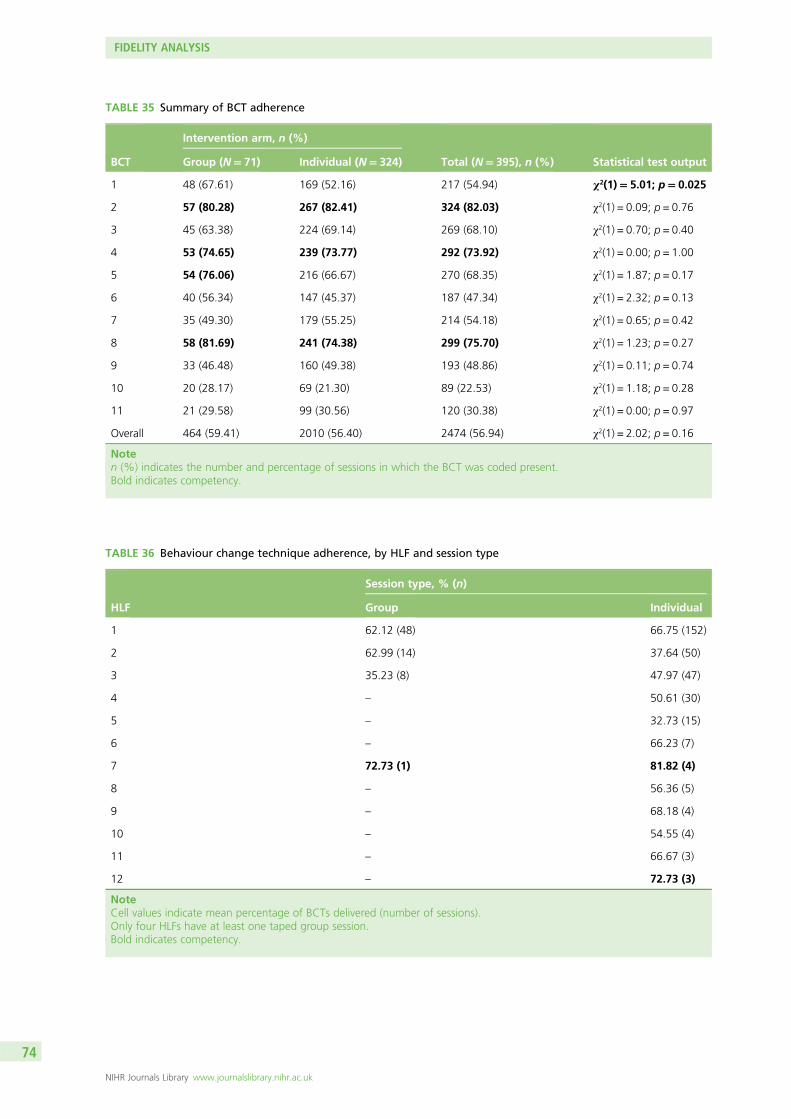
TABLE 36 Behaviour change technique adherence, by HLF and session type
HLF
Session type, % (n)
Group Individual
1 62.12 (48) 66.75 (152)
2 62.99 (14) 37.64 (50)
3 35.23 (8) 47.97 (47)
4 – 50.61 (30)
5 – 32.73 (15)
6 – 66.23 (7)
7 72.73 (1) 81.82 (4)
8 – 56.36 (5)
9 – 68.18 (4)
10 – 54.55 (4)
11 – 66.67 (3)
12 – 72.73 (3)
NoteCell values indicate mean percentage of BCTs delivered (number of sessions).Only four HLFs have at least one taped group session.Bold indicates competency.
TABLE 35 Summary of BCT adherence
BCT
Intervention arm, n (%)
Total (N= 395), n (%) Statistical test outputGroup (N= 71) Individual (N= 324)
1 48 (67.61) 169 (52.16) 217 (54.94) χ2(1)= 5.01; p= 0.025
2 57 (80.28) 267 (82.41) 324 (82.03) χ2(1) = 0.09; p = 0.76
3 45 (63.38) 224 (69.14) 269 (68.10) χ2(1) = 0.70; p = 0.40
4 53 (74.65) 239 (73.77) 292 (73.92) χ2(1) = 0.00; p = 1.00
5 54 (76.06) 216 (66.67) 270 (68.35) χ2(1) = 1.87; p = 0.17
6 40 (56.34) 147 (45.37) 187 (47.34) χ2(1) = 2.32; p = 0.13
7 35 (49.30) 179 (55.25) 214 (54.18) χ2(1) = 0.65; p = 0.42
8 58 (81.69) 241 (74.38) 299 (75.70) χ2(1) = 1.23; p = 0.27
9 33 (46.48) 160 (49.38) 193 (48.86) χ2(1) = 0.11; p = 0.74
10 20 (28.17) 69 (21.30) 89 (22.53) χ2(1) = 1.18; p = 0.28
11 21 (29.58) 99 (30.56) 120 (30.38) χ2(1) = 0.00; p = 0.97
Overall 464 (59.41) 2010 (56.40) 2474 (56.94) χ2(1) = 2.02; p = 0.16
Noten (%) indicates the number and percentage of sessions in which the BCT was coded present.Bold indicates competency.
FIDELITY ANALYSIS
NIHR Journals Library www.journalslibrary.nihr.ac.uk
74
Discussion
We coded 395 recorded intervention sessions for fidelity. We observed that nearly all (11/13) of the HLFsachieved high levels of competency on at least one dimension of MI but fewer did so with the BCT, inwhich only 2 out of 13 HLFs achieved competency. The HLFs received extensive training in delivering theMI and BCT elements of MOVE IT and were supervised throughout the trial; our analysis of a non-randomand probably underpowered sample of tapes indicates that the intervention was administered withacceptable levels of competencies in MI but the competency of HLFs in delivering the BCTs is not known.
When combining MITI scores across HLFs, we found that the MI aspects of the intervention were notdelivered at the desired competency level. At the HLF level, none of the HLFs reached the minimumMITI-based proficiency level and only three met the competency criteria adapted for the study. By furtherstratifying by session type, however, we found that two HLFs delivered the MI elements in individualsessions at a level deemed competent for our study.
We observed treatment arm differences in several of the MITI domains. Most of these differences were indomains with count scores, hence these were expected given the longer length of the group sessionformat (i.e. HLFs had more opportunity to use the technique repeatedly). Of particular interest, HLFs ingroup sessions demonstrated a greater percentage of open questions, whereas in individual sessions theymade more reflections relative to questions. This may be because in group sessions a large proportion oftime was spent facilitating group discussion, which lends to repeated use of open questions. In addition,in group sessions there may have been less opportunity for HLFs to ask closed questions, which naturallyfollow open questions in individual sessions (e.g. to clarify what the individual has just said or encouragefurther conversation). In terms of the reflection-to-question ratio, this could be explained by the fact thatreflections require a deeper level of listening and understanding, which the group session format does notlend itself to as easily as individual sessions do.
Most HLFs were ‘partially proficient’ in delivering BCTs. Only three BCTs (‘prompt intention formation’,‘prompt specific goal-setting’ and ‘agree on behavioural contract’) were administered in > 70% of sessions.Furthermore, two BCTs (‘self-talk’ and ‘relapse prevention’) were delivered in approximately < 30% ofsessions. Across the BCTs defined for the trial, we observed treatment arm differences in only one (‘provideinformation on consequences’); however, this is possibly a false positive owing to the number of testsconducted. Finally, only two HLFs delivered, on average, ≥ 70% of the BCTs across the sessions assessed(however, this was only five sessions for one HLF and three individual sessions for the other). These resultsshould be interpreted cautiously as we used an unvalidated BCT coding framework developed for thisstudy; thus, we may have underestimated HLFs’ competency in delivering the BCTs.
LimitationsOwing to the network outage and loss of recorded sessions, the characteristics of the recovered tapesare based on a non-random subsample of the original tapes. Thus, it is highly likely that our findings arebiased and probably an underestimation of the HLFs’ competency. We are uncertain when these sessionswere recorded. For instance, if the sessions were recorded earlier in the study, the HLFs may have hadless competency than later in the study. We do not know why these specific tapes were saved. As part ofsupervision, the HLFs were required to identify sessions in which they had had difficulties and, therefore,these may be tapes representing lower competencies.
As the data loss occurred while we were preparing our database of recorded sessions, some session detailswere left incomplete. When comparing the characteristics of the sessions in our original (pre-IT outage)and recovered databases, we found that distributions of session numbers and HLFs were different. Inparticular, the recovered sessions contained fewer maintenance sessions. The majority were retained byone HLF and another HLF had no sessions recovered at all. Thus, it is likely that this fidelity analysis of therecovered sessions is biased towards an underestimation.
DOI: 10.3310/hta23690 HEALTH TECHNOLOGY ASSESSMENT 2019 VOL. 23 NO. 69
© Queen’s Printer and Controller of HMSO 2019. This work was produced by Ismail et al. under the terms of a commissioning contract issued by the Secretary of State for Healthand Social Care. This issue may be freely reproduced for the purposes of private research and study and extracts (or indeed, the full report) may be included in professionaljournals provided that suitable acknowledgement is made and the reproduction is not associated with any form of advertising. Applications for commercial reproduction shouldbe addressed to: NIHR Journals Library, National Institute for Health Research, Evaluation, Trials and Studies Coordinating Centre, Alpha House, University of Southampton SciencePark, Southampton SO16 7NS, UK.
75
We did not observe any pattern concerning the number of sessions delivered by each HLF and their MIskills. The HLF who also supervised and trained other HLFs had the largest number of sessions recovered.
Furthermore, the fidelity analysis that we conducted was possibly unsuited to the content of theintervention. For instance, although the MITI tool was the optimum coding system for assessing fidelity inthe individual sessions, it has not been previously validated for MI delivered in a group format. Thus, theraters faced challenges in using this to code the group sessions. For example, as the structure of the groupsessions contained more group exercises and more didactic interactions, it was difficult to detect sufficientutterances that demonstrated empathy. Instead, it may have been better to use a different coding systemfor MI in the group sessions.
Similarly, the nature of MOVE IT may have prevented the BCTs from being consistently captured by thefidelity raters. For example, six of the BCTs (ii–iv and vii–ix) were intended to be delivered by the HLFsduring one-to-one portions of the group sessions when participants completed their action plans, whichwere probably not captured by the recordings. Furthermore, three of the BCTs (ix–xi) were intended to bedelivered in the maintenance sessions only; hence, it is not surprising that these were among the leastcaptured in the fidelity analysis. And this issue is compounded by the fact that fewer maintenance sessionswere recovered after the network outage. Thus, we felt that the data loss from the outage barred us fromconducting a more robust and detailed analysis of BCT delivery by the HLFs.
FIDELITY ANALYSIS
NIHR Journals Library www.journalslibrary.nihr.ac.uk
76
Chapter 9 Qualitative findings: the views ofparticipants
Background
Randomised controlled trials provide a reliable and rigorous method of assessing the effectiveness of anintervention.125 However, owing to their complex nature there are a number of additional challenges thatmay arise when reproducing the intervention. Therefore, it is important to evaluate the delivery andprocesses of the intervention from the patient’s perspective.126
Focus groups give participants the opportunity to provide in-depth reflections of their experiences andviews of the intervention.127,128 Understanding the experiences of participants is vital to provide an insightinto potential barriers and improvements that often occur in lifestyle interventions.129 Therefore, the use offocus groups can enable researchers to review the different behavioural or social processes that may notbe evident from the use of quantitative analysis only, leading to the successful implementation of anintervention in the future.126
A recent systematic review and meta-analysis revealed the effectiveness of structured lifestyle interventionsthat target both diet and PA as being successful in reducing CVD risk factors.130 Studies have found thatthe delivery of MI for health-related behaviour change in lifestyle interventions to be beneficial, particularlyin the short term.49,131,132 However, few have investigated the maintenance of behaviour change in the longterm with the use of qualitative methodology.
The aim of this qualitative analysis was to explore the views of participants of MOVE IT in terms of reasonsfor engagement, factors enabling behaviour change and the potential barriers to engagement.
Methods
Two groups of participants were approached for process evaluation: (1) those who attended the intensivephase of the intervention, that is, six or more sessions (completers), and (2) those who withdrew beforethe intensive phase was completed or did not attend at all (non-completers). Participants were invited,based on a purposive sampling method to form heterogeneous groups. Only those who had completed allthree follow-up appointments were approached.
Participants were separated into six focus groups: four groups of completers (labelled as 1A–1D) and twogroups of non-completers (2A and 2B). Each group had two facilitators, who were research assistants fromthe MOVE IT programme and had not met the patients before, to avoid response bias. For each group, weaimed to include at least one female participant, an individual with an ethnic minority background and amix of those who attended individual and group sessions.
Focus groups using a semistructured interview schedule were carried out with the use of a topic guide(see Appendix 4). The topic guide was informed by preliminary analysis from the HLF contribution, inputfrom the research team and investigators, and feedback from PPI members. It consisted of open-endedquestions relating to (1) the invitation to take part in the study, (2) lifestyle changes made since joiningthe MOVE IT programme, (3) most and least helpful aspects of the sessions, (4) participant diversity and(5) potential online interventions.
DOI: 10.3310/hta23690 HEALTH TECHNOLOGY ASSESSMENT 2019 VOL. 23 NO. 69
© Queen’s Printer and Controller of HMSO 2019. This work was produced by Ismail et al. under the terms of a commissioning contract issued by the Secretary of State for Healthand Social Care. This issue may be freely reproduced for the purposes of private research and study and extracts (or indeed, the full report) may be included in professionaljournals provided that suitable acknowledgement is made and the reproduction is not associated with any form of advertising. Applications for commercial reproduction shouldbe addressed to: NIHR Journals Library, National Institute for Health Research, Evaluation, Trials and Studies Coordinating Centre, Alpha House, University of Southampton SciencePark, Southampton SO16 7NS, UK.
77
Informed consent was obtained and each group was audiotaped. Data were anonymised and transcribedverbatim. The transcripts were analysed using thematic analysis.133 The analysis was descriptive andinterpretative and facilitated by the use of NVivo version 10 (QSR International, Melbourne, VIC, Australia)to code emerging themes and subthemes.
Results
A total of 74 participants were invited to attend a focus group, with 26 ultimately participating. Therewere four groups of completers and two groups of non-completers. The characteristics of those who tookpart are outlined in Appendix 5.
A thematic analysis of all six focus groups resulted in three generic themes. A fourth theme was generatedfrom only the non-completers’ responses, as shown in Table 37.
Theme 1: perceived benefits of the study
Personal behaviour changesParticipants described positive lifestyle changes they had made with regards to their diet and PA duringthe study:
I found it beneficial. I took on the pedometer stuff, I took on the five a day, I took on the number ofglasses of water a day, the oily fish, all of those, you know, don’t just live a sedentary lifestyle of anight, get up and move around, all of those things, were lessons that I took on board . . . they havebeen beneficial to me.
Participant 9
I am in a habit of doing daily exercises in the morning. Although I do it at home at least half an hourstretching and dancing. So that makes up for the lack of walking. All in all it has made quite apositive impact.
Participant 5
TABLE 37 Summary of themes and subthemes
Themes Subthemes
1. Perceived benefits of the study l Personal behaviour changesl Increased health awareness
2. Factors enhancing behaviour change l Social support and learning from othersl Ease of programme structure and contentl Continuity and strength of therapeutic alliance
3. Perceived risk of CVD l Perceptions of their own CVD riskl Perceptions of the CVD risk to others
4. Potential barriers to change and overcoming these barriers l Lack of feedbackl Lack of engagementl The role of authority
QUALITATIVE FINDINGS: THE VIEWS OF PARTICIPANTS
NIHR Journals Library www.journalslibrary.nihr.ac.uk
78
Lifestyle changes were sustained following the completion of the sessions:
They’re in there. They’re programmed in. So on an evening, I try not to sit there plonked in front ofthe television, I get up and do stuff. Make the tea, go and get some fruit. You know, just keep gettingup and doing stuff rather than just have a sedentary evening every evening.
Participant 9
I found I am counting the number of different fruits and veg that I’m having each day . . . and thenI was like ‘Ohh . . . five today,’ ‘Uh fine gosh, seven yesterday oh well’. You know, I am still doing itevery single day . . . what am I going to eat . . . when am I having it. Oh yeah . . . every day.
Participant 4
Increased health awarenessThe main benefits described by the participants are the increased knowledge and health awareness fromtaking part in the intervention. Primarily, individuals reported that the sessions highlighted the importanceof keeping active and making healthy lifestyle choices regarding their food intake:
I think I’ve got much more of an awareness of how . . . Oh perhaps I can leave the car behind for ashort journey. Do I need it? It’s that permanent awareness. Do I need to? Are we having enough fruitand veg? Oh gosh. We haven’t had fish for quite a . . . quite a long time. You know . . . Just. It’s thereall the time.
Participant 2
But what MOVE IT did for me certainly did highlight that I wasn’t doing it. So it’s made me moreaware, and that’s why I ate oily fish before I came out today, not particularly because I was coming tothis focus group, but it’s ingrained in my subconscious now that I ought to eat a certain amount. I . . .so just to reinforce . . . what this has done is benefited me in that it’s now in my consciousness. I don’tadhere to it religiously but overall I feel it’s been beneficial.
Participant 9
More specifically, there was an increase of awareness and understanding of the use of the labels onpackaging (i.e. the traffic light system):
It wasn’t until I noted how much sugar and how much saturated fat was in food that we eat. Sowhen we buy things we’re more aware of what we’re buying and now and then we’ve got foodthat’s got a bit of red in it [laughs] on the traffic lights . . . But as long as . . . it’s not really frequentlywe don’t get too upset about it.
Participant 16
Theme 2: factors enhancing behaviour change
Social support and learning from othersParticipants who had attended group sessions rather than individual sessions felt that being part of agroup had a positive impact on their ability to engage with the study. The opportunity to discuss theirachievements or setbacks and be in a positive social environment was something they appreciated andenjoyed:
It was nice to, have other people there were going through the same experiences if you like. And youwould talk about it and bring back the same sort of problems or any success. So it’s nice to haveexperience with it.
Participant 16
DOI: 10.3310/hta23690 HEALTH TECHNOLOGY ASSESSMENT 2019 VOL. 23 NO. 69
© Queen’s Printer and Controller of HMSO 2019. This work was produced by Ismail et al. under the terms of a commissioning contract issued by the Secretary of State for Healthand Social Care. This issue may be freely reproduced for the purposes of private research and study and extracts (or indeed, the full report) may be included in professionaljournals provided that suitable acknowledgement is made and the reproduction is not associated with any form of advertising. Applications for commercial reproduction shouldbe addressed to: NIHR Journals Library, National Institute for Health Research, Evaluation, Trials and Studies Coordinating Centre, Alpha House, University of Southampton SciencePark, Southampton SO16 7NS, UK.
79

I think it’s quite good really, because you know, you. People in our group you know got on quite well,quite nice to talk to other people. Yeah . . . how you been doing, how many steps they done thatweek. No . . . I think it’s quite a good social atmosphere.
Participant 13
In addition, those who had individual sessions felt that they would have benefited from having supportfrom others:
Whether it’s an individual session or a group session, maybe a group session more, you have todevelop a kind of . . . a group dynamic, that compels people to want to come back, because they’re apart of that group. I think the first three groups, the first three meetings or so, if you can really getpeople hooked in, they’ll come back because they’re a part of that group, or something like that.More will come back, because they’re kind of part of that group.
Participant 21
Social support had a beneficial effect for people close to the participants. Participants had the opportunityto share their experiences with family members and see positive effects on them too:
Yeah. I suppose so. For me the family as well. I did tell my wife about it . . . and it did have an effecton her. You know, what she ate and stuff.
Participant 13
What was helpful – because of all the things about the diet etcetera, my son went to for blood testand was told he was potentially diabetic, put me in the panic. So I cooked everything for him . . . I didall the cooking and sent it round. And he lost about 3 stone in very short time and then they said hewasn’t gonna be a diabetic at all . . . So it did for him as well as for me . . . because of what I’ve learnt.Yeah. So that was a bonus.
Participant 15
Ease of programme structure and contentAn important factor reported to enhance behaviour change was the simplicity of the techniques thatparticipants developed throughout the intervention. For example, setting small goals, awareness-raisingand the preparation of setbacks enabled them to achieve sustainable lifestyle changes:
And they told me the procedure was very simple once I started. I found that if I avoid snacking, thenmy weight goes down. So I lost quite a bit of weight.
Participant 9
I thought personally, the pedometer was a very very good thing and it was so simple.Participant 3
That training was excellent. You know, everybody has got a sometime or the other or you can have asetback. So, they told us how to keep going, not to stop. So that was a very good training. There willbe step backs but those techniques help keep going.
Participant 7
You are now conditioned to be a bit more aware, and that is very important. It doesn’t mean that I do10,000 (steps) a day, but it is that awareness, that keeps my mind going.
Participant 7
QUALITATIVE FINDINGS: THE VIEWS OF PARTICIPANTS
NIHR Journals Library www.journalslibrary.nihr.ac.uk
80

Continuity and strength of therapeutic allianceTo sustain healthy behaviour changes, some participants felt that it was important that there wascontinuity of sessions. It was reported that participants felt less motivated to continue during the laterstages of the programme because the sessions were less frequent:
I found the first six sessions really easy, because it was close together and it was just like we knew thatevery Thursday you would go. It’s, when they were spread out then I felt like oh! You know, for thelast one I really did not want to go. But you know, I said it to the nice lady.
Participant 2
Participants highlighted the importance of the therapeutic relationship built with the HLFs and how thisencouraged them to return to the later sessions. During the process, there were changes to the HLFs,which some participants found to be quite disruptive:
I found when they spread out was, so in the first six it was one and the same person and you gotalmost on the one-to-one thing. So you got this rapport with someone then you hear . . . ‘Hello, she’sleft I am taking over’.
Participant 4
‘Well, she’s left, I’ve taken over.’ Well it was complete stranger, there was no rapport, and well theythought, ‘How are you doing?’ And well . . . I don’t know . . . you don’t know . . . And it was acomplete stranger and you have no idea.
Participant 4
Maintaining continuity of staff to sustain engagement with participants was highlighted by participant 2:
I was definitely one of the lucky ones ‘cause I had the same lady all the way through . . . so I mean wehad usually an hour and a half. You know, ‘cause you know, when you to get to know somebody youtalk a lot. I mean, that was very useful.
Participant 2
Theme 3: perceived risk of cardiovascular disease
Participants’ perceptions of their own cardiovascular disease riskParticipants dismissed themselves from being at risk of CVD owing to a lack of family history or an absenceof current health problems. Some associated their risk of CVD solely with their age and discredited thecontribution of other risk factors (e.g. poor diet and lack of PA):
When I got a letter . . . from the King’s College. I was a bit . . . I was a bit surprised. I don’t have aproblem with the heart, so why they did . . . wrote letter like that, join. So I thought it might havesome benefit . . . so I joined.
Participant 14
You know . . . go to the doctor and the doctor had never said . . . oh . . . you know . . . you’re aparticularly high risk of heart disease. So it comes in the post . . . and it says, you’re in this high-riskgroup. So . . . you know . . . you do a bit of a double take. I don’t know whether. But anyway . . .you’ve got nothing to lose and do the . . . come on and do the study and find out. But I think, as[participant 12] said, on the things they use to work out the risk factor, as soon as you put in your ageand put in you’re 70, you’re immediately in the 70% category.
Participant 13
DOI: 10.3310/hta23690 HEALTH TECHNOLOGY ASSESSMENT 2019 VOL. 23 NO. 69
© Queen’s Printer and Controller of HMSO 2019. This work was produced by Ismail et al. under the terms of a commissioning contract issued by the Secretary of State for Healthand Social Care. This issue may be freely reproduced for the purposes of private research and study and extracts (or indeed, the full report) may be included in professionaljournals provided that suitable acknowledgement is made and the reproduction is not associated with any form of advertising. Applications for commercial reproduction shouldbe addressed to: NIHR Journals Library, National Institute for Health Research, Evaluation, Trials and Studies Coordinating Centre, Alpha House, University of Southampton SciencePark, Southampton SO16 7NS, UK.
81

Perceptions of the cardiovascular disease risk to othersThe participants distanced themselves from having a risk of developing CVD and projected this ontoothers. Some felt that those who were selected were not appropriate for the study as they were not at riskor had no history of being at risk of CVD:
I said the thing is, I’m old anyway, surely it’s people who are in their 30s and 40s to preclude them frommaybe getting a risk of or having an inherent risk of heart trouble or whatever. Surely, it’s the peoplewho drive a hundred yards, or a hundred metres to the fish and chip shop, load themselves up – mindyou I love fish and chips – every day of the week, and they are the people, surely at risk.
Participant 8
Well, I think all the people in our group. You know . . . they seemed to be reasonably fit and youknow. You know . . . you harp on about diet really. You know . . . these things . . . are kind ofself-selective aren’t they?
Participant 13
Participant 13 suggests that those who agreed to take part may not actually be the individuals whoneed help:
So you wonder . . . the people that really . . . I’m not saying we didn’t benefit from it, but you know,there weren’t really obese people there. And I think I . . . so you wonder whether the people . . . thepeople who would really benefit from it. You know . . . the people who are possibly volunteering, arethe ones that need it the least.
Participant 13
Theme 4: potential barriers to change and overcoming these barriers
Lack of feedbackA recurrent subtheme for participants in both the individual intervention arm and the group interventionarm was the lack of feedback received during the study. Particularly, participants felt that feedback seemedto be predominantly negative throughout, without the encouragement of positive results to engage themfurther with the study.
One suggestion was to provide positive feedback regarding weight loss and participants’ progress as ameans of potentially increasing motivation:
The person doing the testing didn’t want us to give feedback about the group. I understand. But wedidn’t seem to get any feedback, like ‘Oh, your weight’s gone up’ or you know . . . because that’s amotivation in itself. You know . . . there was never that kind of discussion. Like ‘this has changed, yourcholesterol’s . . . whatever . . . or’. ‘Cause the things they test, there didn’t seem to be any feedback.Now, I thought it would have been important to say to people ‘well, this is OK . . . but this is notgood’ you know . . . and whatever. ‘Cause that’s a motivation in itself.
Participant 21
So you’d get the negative, we would get it if it was a negative result but if you wanna keep peoplemore motivated they need to know about, the positive stuff as well, because that’s why they’re going.They want to know, they’re getting better. If you’re not gonna tell me you’re getting better . . .well why?
Participant 23
QUALITATIVE FINDINGS: THE VIEWS OF PARTICIPANTS
NIHR Journals Library www.journalslibrary.nihr.ac.uk
82
Lack of engagementA further barrier that was described was the lack of engagement or a relationship being developed on apersonal level during the study:
There you well ‘mm . . . you’ve been doing this for a year, it’s been bought to your mind. What arethe consequences? What’s changed in your life at all . . . that’s not enabled you to do it’ whatever . . .you know it’s just. I think that relates to my earlier point. I think there is a lack of engagement on apersonal level. If you want to motivate people, you need to get people hooked in partly, as anindividual as well as the group . . . I think I became this name and this number without any particularrelationship being developed.
Participant 21
The role of authorityThere were varying suggestions surrounding possible reasons why some individuals might not havedecided to take part and changes that may improve this in the future. A recurrent theme was theimportance of the role of authority from a health-care professional, such as a GP.
One participant suggested that their involvement may therefore be helpful to encourage those who aremore reluctant to take part:
Now . . . people tend to listen to their doctor . . . or respond to the doctor, better than the MOVE ITstudy from, King’s Univ- well, who the hell are they? You know, you got to . . . there’s noengagement there. Whereas, if the doctor sends the letter, or a covering letter . . . then . . . as a as anintro, that’s a more powerful intro than just a letter from you know because clearly . . . well . . . if adoctor said, we are collaborating or co-operating whatever word you choose, with this study from ah,and from your records it would appear that you are at risk of . . . whatever. Perhaps you would be,you’d, perhaps it would be ah, they could suggest that the study might be beneficial to you. Now,now that would be, that would be a fairly powerful introduction I think.
Participant 21
This was also highlighted by the completers, who mentioned that their GPs were unaware of their risk:
. . . and I thought . . . oh . . . all right . . . I’ll go along with it. Then when I next saw my doctor, I said,like you know, what’s this about high risk of heart attack and he looked at me vacantly and he says‘I dunno’. He said probably your age. He said, that’s all I can think of.
Participant 12
Summary
This qualitative analysis explored the views of participants allocated to the intervention arms of MOVE IT.The main themes that emerged were (1) perceived benefits of the study, (2) factors enhancing behaviourchange and (3) perceived risk of CVD. One further theme that emerged solely for the non-completers was(4) potential barriers to change and overcoming these barriers.
We found that participants described having positive experiences during the intervention sessions, citingthe benefits of increased health awareness, positive lifestyle changes and the opportunity to learn fromothers. We identified several factors that might have affected the maintenance of participant behaviourchange. Primarily, participants noted that the continuity of sessions and having the staff involvedthroughout were very important. The changes to the HLFs who carried out the sessions were disruptive forsome and led to reduced engagement with the intervention. The continuity and frequency of sessions alsohad an impact on participants’ motivation to take part and make healthy lifestyle changes. Owing to thepragmatic design, duration of the intervention and short-term contracts of the HLFs, there was a natural
DOI: 10.3310/hta23690 HEALTH TECHNOLOGY ASSESSMENT 2019 VOL. 23 NO. 69
© Queen’s Printer and Controller of HMSO 2019. This work was produced by Ismail et al. under the terms of a commissioning contract issued by the Secretary of State for Healthand Social Care. This issue may be freely reproduced for the purposes of private research and study and extracts (or indeed, the full report) may be included in professionaljournals provided that suitable acknowledgement is made and the reproduction is not associated with any form of advertising. Applications for commercial reproduction shouldbe addressed to: NIHR Journals Library, National Institute for Health Research, Evaluation, Trials and Studies Coordinating Centre, Alpha House, University of Southampton SciencePark, Southampton SO16 7NS, UK.
83
staff turnover that could not be prevented, except with a vast increase in funding to potentially hire moreHLFs or offer longer contracts.
Non-completers had expressed that there was a lack of feedback and engagement throughout theintervention. To improve this, it would be beneficial to provide more positive feedback from HLFs or tohave an alternative method of self-reflection during the sessions. This would increase motivation forpatients to continue participation and for behaviour change to be sustained. Participants’ perceptions oftheir own CVD risk may be viewed as a barrier to engagement.
Most participants did not believe CVD risk to be an issue and often attributed the risk to their age ratherthan their own lifestyle choices. In addition, some GPs were not aware of their patients’ risks or the studyitself, which may have altered individuals’ perceptions of CVD risks. Therefore, for future interventions, it isimportant to work more closely with GPs to emphasise the benefits for patients’ health and potential toameliorate CVD risk. There may be other reasons why the non-completers felt a lack of engagement, asthey may have higher levels of psychological distress or social problems that were not articulated duringthe focus group.
MOVE IT emphasised the importance of the use of qualitative methodology in providing detailedexperiences of participants for assessing the effectiveness of a RCT. As previously reported, studies havesupported the benefits of lifestyle interventions in the short term but few have supported them in the longterm.49,131,132
The detailed reflections from participants involved in a long-term intervention support the use of qualitativemethods for gaining greater understanding of the factors facilitating engagement and barriers toengagement. The responses from participants highlight the benefits of lifestyle interventions and themaintenance of behaviour changes for diet and PA levels. Finally, this study reveals areas of improvementfor the future delivery and implementation of the study, including continuity of care and duration of theintervention. Although attendance at group sessions was lower than attendance at individual sessions,those who attended group sessions appeared to value the peer support aspect.
QUALITATIVE FINDINGS: THE VIEWS OF PARTICIPANTS
NIHR Journals Library www.journalslibrary.nihr.ac.uk
84
Chapter 10 Qualitative findings: the views ofhealthy lifestyle facilitators and clinical psychologists
Background
The HLF team were trained by a CP to deliver MOVE IT. Training in MI involves achieving a number of corecompetencies,134 and HLFs were also trained to incorporate BCTs into intervention delivery.52 There is nofixed length for the training of MI; however, a review of 28 studies found that most training schedulesrequired 9–16 hours of training.135 The training methods for MI involve didactic supervision and learningactivities, such as role play, group exercises, discussions and feedback.42
The application of MI is considered helpful in working with patients towards lifestyle changes in primarycare by nurses who incorporate it into their practice.136,137 Previous studies of the application of MI inpractice have suggested that it can be demanding but rewarding and that the spirit of MI and simplecompetencies are frequently achieved, but that the application of MI skills reduces over time and furthersupport is required for more complicated competencies.136,138 The ability to reflect on practice, continuingto develop skills and ongoing supervision are thought to be crucial to enhancing the long-term benefitsof a MI approach.139 There is evidence that enhancing MI with CBT techniques is achievable for nursessupporting diabetes mellitus control140 or alcohol cessation,62 and that intervention providers perceive bothpositive and negative impacts of the intervention on patient care depending on the patient’s ability toengage.141 Evaluating any novel intervention, from the perspective of stakeholders such as the interventionproviders, is important for translation to policy.142
The views and experiences of intervention providers are vital to assessing the feasibility of widespreadimplementation into practice, by exploring the challenges in training and delivery. The HLF role was newlydeveloped for the MOVE IT trial, drawing on the promising preliminary findings of the NHS health trainerprogramme, and adapted to be in line with MI, which underpins the intervention. Therefore, as theintervention and job role are both novel, we sought to gain detailed feedback on HLF training andintervention delivery from both the CPs who were responsible for training and supervision and the HLFteam.
Methods
A qualitative approach was adopted to study HLFs’ and CPs’ views and experiences of developing anddelivering the interventions. All 13 HLFs and two CPs were invited to interviews. Semistructured interviewswere carried out, consisting of open-ended questions relating to the training, supervision, intervention,participants and values in psychological therapies. The topic guides used for HLFs and CPs are provided inAppendix 6. Interviewees were invited to give their feedback and the discussion was audiotaped. To gathermeaning from the data, inductive thematic analysis explored any underlying concepts that were mentionedregularly.
The interviews were conducted by an independent research assistant to avoid response bias, which couldexist if the interviewer was part of the MOVE IT team. Audiotapes were transcribed verbatim and the datacollected were anonymised. NVivo software was used to analyse the data. Emerging themes from theinterview transcripts were coded and categorised into themes and subthemes.
DOI: 10.3310/hta23690 HEALTH TECHNOLOGY ASSESSMENT 2019 VOL. 23 NO. 69
© Queen’s Printer and Controller of HMSO 2019. This work was produced by Ismail et al. under the terms of a commissioning contract issued by the Secretary of State for Healthand Social Care. This issue may be freely reproduced for the purposes of private research and study and extracts (or indeed, the full report) may be included in professionaljournals provided that suitable acknowledgement is made and the reproduction is not associated with any form of advertising. Applications for commercial reproduction shouldbe addressed to: NIHR Journals Library, National Institute for Health Research, Evaluation, Trials and Studies Coordinating Centre, Alpha House, University of Southampton SciencePark, Southampton SO16 7NS, UK.
85
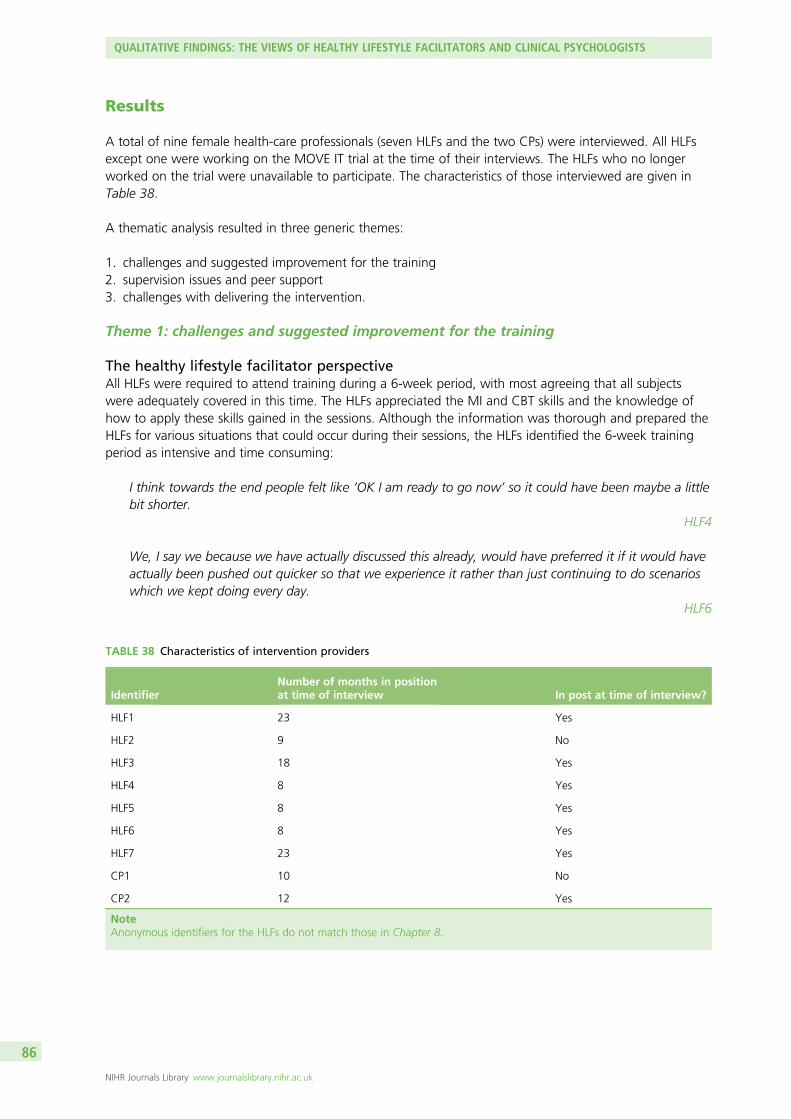
Results
A total of nine female health-care professionals (seven HLFs and the two CPs) were interviewed. All HLFsexcept one were working on the MOVE IT trial at the time of their interviews. The HLFs who no longerworked on the trial were unavailable to participate. The characteristics of those interviewed are given inTable 38.
A thematic analysis resulted in three generic themes:
1. challenges and suggested improvement for the training2. supervision issues and peer support3. challenges with delivering the intervention.
Theme 1: challenges and suggested improvement for the training
The healthy lifestyle facilitator perspectiveAll HLFs were required to attend training during a 6-week period, with most agreeing that all subjectswere adequately covered in this time. The HLFs appreciated the MI and CBT skills and the knowledge ofhow to apply these skills gained in the sessions. Although the information was thorough and prepared theHLFs for various situations that could occur during their sessions, the HLFs identified the 6-week trainingperiod as intensive and time consuming:
I think towards the end people felt like ‘OK I am ready to go now’ so it could have been maybe a littlebit shorter.
HLF4
We, I say we because we have actually discussed this already, would have preferred it if it would haveactually been pushed out quicker so that we experience it rather than just continuing to do scenarioswhich we kept doing every day.
HLF6
TABLE 38 Characteristics of intervention providers
IdentifierNumber of months in positionat time of interview In post at time of interview?
HLF1 23 Yes
HLF2 9 No
HLF3 18 Yes
HLF4 8 Yes
HLF5 8 Yes
HLF6 8 Yes
HLF7 23 Yes
CP1 10 No
CP2 12 Yes
NoteAnonymous identifiers for the HLFs do not match those in Chapter 8.
QUALITATIVE FINDINGS: THE VIEWS OF HEALTHY LIFESTYLE FACILITATORS AND CLINICAL PSYCHOLOGISTS
NIHR Journals Library www.journalslibrary.nihr.ac.uk
86
At the beginning was kind of a lot of practising, it was a bit too much and it became mechanicbecause we did it with each other so much.
HLF7
There was particular reference to the role-playing exercises during the training, as reflected by commentssuch as:
. . . since we were role playing between ourselves we were taking it easy on each other.HLF6
So we had training for 2 months, September and October. It was intense and it got quite repetitiveand in my opinion it got quite tedious to the point where we started overthinking everything we did.
HLF7
The HLFs reported that sessions varied considerably in terms of the participant and their motivations toparticipate in the MOVE IT trial. This differed from the preparation they had undertaken in the trainingperiod:
The patients that we had were totally opposite of what we were trained to do and that’s what threweveryone off. Everyone was trained to talk a certain way, got to their patients but then everyone wasthe total opposite.
HLF2
The clinical psychologist perspectiveBoth CPs were interviewed regarding their views on the training that had been developed by CP1. CP1trained and handed over responsibilities to CP2 over an 8-week period. Within the first year, five out ofthe eight HLFs that CP2 had trained had left the study, leaving three HLFs to split the workload. When CP2was employed, three new HLFs joined the study, bringing the total number of HLFs to six. The curriculumwas adapted as the training was designed for larger groups. Despite this, CP2 felt that the HLFs managedthe situation very well despite the intensity of the curriculum and amount of material covered:
I think it was kind of split into sort of face-to-face interactive sessions . . . They were given resources togo and self-study and some ideas of what to practice and how to practice the sessions . . . None ofthem really had previous experience of actually delivering psychology-based interventions . . . I supposethe tricky thing with something like MI, which I suppose is the key approach that is underpinningeverything in MOVE IT, is that actually there is only so much you can teach directly because a lot of itis actually through practice and getting things wrong and reflecting on it . . . I guess that was alsoanother challenge, just to know which were the crucial elements to kind of teach and how to getthose across in a simplified and manageable way . . . It is quite a challenge because the concept of MIis still quite undefined in some ways as an intervention.
CP2
They came more from a health promotion background so their thing is being much more directive,telling people what to do, getting information, giving education, so they love all that . . . what’sdifficult is to try to pick them up into it and to try not to destroy their confidence too much so thatthey do not want to come back to training . . . what we can teach people and what we can actuallytake on board in my experience is quite different, so you can probably cut it [the curriculum] down byhalf and they might get some of that. Maybe the content, maybe it’s more about doing less, better.
CP1
DOI: 10.3310/hta23690 HEALTH TECHNOLOGY ASSESSMENT 2019 VOL. 23 NO. 69
© Queen’s Printer and Controller of HMSO 2019. This work was produced by Ismail et al. under the terms of a commissioning contract issued by the Secretary of State for Healthand Social Care. This issue may be freely reproduced for the purposes of private research and study and extracts (or indeed, the full report) may be included in professionaljournals provided that suitable acknowledgement is made and the reproduction is not associated with any form of advertising. Applications for commercial reproduction shouldbe addressed to: NIHR Journals Library, National Institute for Health Research, Evaluation, Trials and Studies Coordinating Centre, Alpha House, University of Southampton SciencePark, Southampton SO16 7NS, UK.
87
Along with MI and CBT skills and the process of being assessed, requiring knowledge of CVD and its riskfactors contributed to the length of the training, as CP1 explains:
. . . we had been working on another trial which was training diabetes nurses also in MI and someCBT techniques, so we were looking for a length of time which would allow them enough time tounderstand the theory, enough time to get to know each other and role play with each other, andunderstand a whole new curriculum and how to deliver it, plus everyone needed to be assessed whichis a really lengthy process . . . I think the additional thing is that it is also the third strand is having toprovide education about CVD.
CP1
Theme 2: supervision issues and peer support
Issues with supervisionA recurrent theme regarded the supervision received and lack of support provided, as seen in the followingexcerpts:
If we had a problem it was hard to know who we should go to and sort it out quickly because theytended to palm it off on each other quite a lot, not to be disrespectful or anything.
HLF1
But in terms of managerial supervision, we had that, but it was kind of formalities as opposed to kindof a necessity, I don’t think they wanted to be there and we didn’t really want to be there either andI think towards the end there was some tension between the HLFs and the supervisor.
HLF2
The project manager didn’t really come to our supervision that much, I thought they were going to bethere more to like help out with any other problems. I suppose the project manager could have been abit more hands on, in supervision I mean.
HLF3
In addition, the HLFs felt that there were positive and negative consequences of some of them being atdifferent stages of their sessions. On the one hand, a HLF further along in the training provided usefulinformation to listen to and learn from. However, for those HLFs who were ahead, they felt that this wastime consuming and that the time could be used to complete other tasks:
After the training, which was an intense period, you go out so it was good to constantly have thatreminder of techniques and things, and then also that other girls are at different stages in theirdelivery so you can kind of hear about what’s upcoming if someone is a session or two ahead of you. . . I think timing was probably a thing with supervision because they do seem to drag and it seemedlike talking about the same thing a lot.
HLF4
Peer supportIn relation to the lack of support experienced from management, the HLFs recognised the importance ofsupporting each other through difficult situations:
We, I say we because we have actually spoken about it. It’s very useful in the sense that you get tohear what other HLFs are experiencing as well, so you might pick up on something someone elsebrings up and because we are talking about it in the supervision you get to help each other.Therefore, if that kind of situation presents itself again you know what to do.
HLF6
QUALITATIVE FINDINGS: THE VIEWS OF HEALTHY LIFESTYLE FACILITATORS AND CLINICAL PSYCHOLOGISTS
NIHR Journals Library www.journalslibrary.nihr.ac.uk
88
If there are similar problems and successes then it’s nice to hear it but we talk about them anyway.And it’s not nice to brag about it if someone else has an issue so I tend not to say too much, I didn’treally participate too much.
HLF2
Once you are away from that sort of life it can be hard to come back to it, but they all encouraged meand the clinical psychologist is really very supportive . . . They are so supportive. At the beginning I wasreally slow with the IT and that sort of thing. Each other they helped with something, all of them. Sothey helped me a lot.
HLF5
We were a tight family; there were eight of us and all around similar ages and personalities. We goton so well that we were like one big team and family, we supported each other more than anyoneelse did in the study.
HLF2
Healthy lifestyle facilitators 4 and 5 also expressed a lack of guidance for the administrative work that wasrequired. However, the situation improved after the MOVE IT administrator assisted in liaising with bookingrooms for sessions, scheduling sessions with participants and contacting potential volunteer groupfacilitators:
. . . I know probably everyone is saying it, but I feel like I wasted a lot of time trying to sort that out[administrative work] when I could have actually been doing what I am supposed to be doing.
HLF4
The administrator is helping us quite a lot and that way is fine. Even the last group invitations theadministrator helped send it and is looking for volunteers, there is help for us from there and weare lucky in that aspect.
HLF5
One HLF was promoted to a senior position and organised meetings to discuss practicalities andproblem-solve non-clinical issues that arose. The senior HLF (HLF1) could then mediate between thegroup and the CPs:
I think that’s really helped [promoting HLF] because it means that supervision with me is a bit moreprotective for perhaps other more therapeutic issues or issues with the curriculum itself.
CP2
Reflective logsIt was noted that the communication and structure of fortnightly supervision meetings improved after asenior HLF was appointed. Both CP1 and CP2 highlighted the benefits of the weekly reflective log thateach HLF completed:
Sometimes when we would start, maybe because it’s a little anxiety-provoking as well, they don’tnecessarily have issues that they would come out with then the way around that is that they havethese reflective practice logs . . . They fill in these weekly practice logs and then supervision is everyfortnight so often I would make a few notes of things that they brought up in their practice logs andthen we would talk about it in more depth.
CP2
DOI: 10.3310/hta23690 HEALTH TECHNOLOGY ASSESSMENT 2019 VOL. 23 NO. 69
© Queen’s Printer and Controller of HMSO 2019. This work was produced by Ismail et al. under the terms of a commissioning contract issued by the Secretary of State for Healthand Social Care. This issue may be freely reproduced for the purposes of private research and study and extracts (or indeed, the full report) may be included in professionaljournals provided that suitable acknowledgement is made and the reproduction is not associated with any form of advertising. Applications for commercial reproduction shouldbe addressed to: NIHR Journals Library, National Institute for Health Research, Evaluation, Trials and Studies Coordinating Centre, Alpha House, University of Southampton SciencePark, Southampton SO16 7NS, UK.
89
The supervision was in two parts, one was a face-to-face [meeting] every fortnight and the other wasweekly e-mail exchange where they would fill in a reflective practice log about what had gone welland less well and what we needed to focus on for the following week. I would read everyone’s entryand reply by e-mail, so they would get that support as well which worked pretty well becauseeveryone could read everyone else’s logs so they were all learning from each other continuously.Everyone had to log at the end of the week.
CP1
The CPs felt that adequate support was provided, consisting of face-to-face supervision and reflectivepractice logs. CP1 provided an example of the importance of a weekly log when a HLF was unable toattend face-to-face supervision:
. . . there was one person who had a string of supervision that clashed with her running groups, thatwas kind of bad because I felt like she really needed to come to supervision but again you have thiscomfort with getting numbers through for the trial so we couldn’t have her abandon the group, butthankfully she was active with the logs.
CP1
Theme 3: challenges with delivering the intervention
Challenges with patientsAll HLFs mentioned enjoying interactions with patients and building a bond with them; they saw thepatients benefiting from the interventions and received positive feedback:
What I love is when they come back with the results, when they say they used to be size 20 and nowthey are size 18, that’s really nice. I had someone who came off one of their medications, so theywere on medication before to control their blood pressure and cholesterol but now they are notanymore because they have managed their diet and changed their lifestyle.
HLF6
However, challenges with delivering the intervention emerged as a common theme. Resistant patientsdisputing any advice proved challenging for the HLFs, as did those who did not engage:
. . . one person walked out of the session as soon as we started with introductions the person just said‘I’m out I’m out!’ and that scared me.
HLF7
Two of the HLFs mentioned the age of the participants as a barrier to delivering the intervention:
The participants are of an age range that aren’t used to ‘collaborative’ care and often just want to betold/prescribed advice. This can make session delivery difficult as participants get frustrated at notbeing given a straight answer.
HLF4
The patients that we had were totally opposite of what we were trained to do and that’s what threweveryone off. Everyone was trained to talk a certain way, got to their patients but then everyone wasthe total opposite.
HLF2
QUALITATIVE FINDINGS: THE VIEWS OF HEALTHY LIFESTYLE FACILITATORS AND CLINICAL PSYCHOLOGISTS
NIHR Journals Library www.journalslibrary.nihr.ac.uk
90

Another challenge that the majority of the HLFs encountered was that participants often thought that theHLFs were medical health experts; CP1 also noted this as a potential issue when delivering the intervention:
There are other issues that they has like their health problems, we are only trained to do theintervention but if they come to you with other problems you are not skilled in it you don’t reallyknow what to do . . . I had to keep telling them that I am not in the medical profession.
HLF2
If you say that five a day is good for you then he would immediately disagree and ask where Iresearched that from and how do I know if the fruit is actually good for you and not full of chemicals.
HLF6
I think other things that HLFs found challenging, especially with an older population with realisticmedical problems was when participants would say that they couldn’t exercise due to back pains, anginaor other various reasons. Then the HLFs are a bit stumped because they weren’t sure how to respond tothat because they think that it could be dangerous for them to make the participants do X, Y.
CP1
The HLFs also mentioned that the initial information sheet sent out to the participating patients was notsufficient to prepare them for what the intervention would involve. HLF7 felt that a lot of patients wouldbe less reluctant to participate in the trial if they knew what each session would include:
I feel like people aren’t aware of what they are signing up to at the researcher stage, so many peopleare not sure what we are talking about and I just wonder what they are told in the beginning. Iwonder if it’s been made clear that once they’ve done this then they are going to be given something,some people are really hot on it and some have no clue what you’re talking about . . . That’s one bigthing that I feel that people aren’t aware of what they are signing up to.
HLF4
From my perspective people do not want to join the group because some expected to be weighed, ordo some physical activity because of our name like healthy lifestyle facilitators – facilitate what, is itexercise? The name is good for using and the letter didn’t explain anything. I would expect lessdropout if you explain yourself better in the letter, because people become less nervous.
HLF7
Issues with the activity bookletThe lengths of the sessions (group and individual) were praised by the HLFs as there was adequate time tocover the material and manage digressive conversations. A common issue referred to the provided activitybooklet being inappropriate for the age group. Participants had found the activity booklet childish orpatronising:
It’s probably the actual booklet; some people like it and some people think it’s referred to a sort ofworking class. Some of the examples and case studies in there don’t particularly relate to them . . .I guess they’ve had to write it for it to cater to different sort of educations, so some people areobviously very well educated and it’s pretty much very basic. Some people find that a little offensivealmost so that builds up some resistance and then you are battling against that almost, so myself andloads of the other girls have found that kind of tricky in terms of sort of putting the workbook a bit tothe side and chatting with them about things . . . There are bits in the actual goal-setting that peopledon’t particularly like, which makes us feel like you almost don’t want to mention the question andjust want to put your hand over it and pretend it isn’t there.
HLF1
DOI: 10.3310/hta23690 HEALTH TECHNOLOGY ASSESSMENT 2019 VOL. 23 NO. 69
© Queen’s Printer and Controller of HMSO 2019. This work was produced by Ismail et al. under the terms of a commissioning contract issued by the Secretary of State for Healthand Social Care. This issue may be freely reproduced for the purposes of private research and study and extracts (or indeed, the full report) may be included in professionaljournals provided that suitable acknowledgement is made and the reproduction is not associated with any form of advertising. Applications for commercial reproduction shouldbe addressed to: NIHR Journals Library, National Institute for Health Research, Evaluation, Trials and Studies Coordinating Centre, Alpha House, University of Southampton SciencePark, Southampton SO16 7NS, UK.
91
Aspects of the actions plan such as rewards and reminders can be difficult to have this ‘older’ generationunderstand. Often they will say ‘why do I need a reward/reminder, if I’m going to do it . . . I’ll do it’.
HLF4
People often say that this is not us but then I refer them and couple of individuals have mentionedthat this is quite patronising, the curriculum examples could be better and more age-fitting becausethe patients do not relate.
HLF5
CP1 observed the struggles that the HLFs had with the activity booklet:
I think the HLFs found that difficult because they were trying to do a manualised structured worksheetthat they must fill in and the participants were just not on board, and they struggled with that.
CP1
Despite the issues with the activity booklet, CP2 highlighted the competence of the HLFs in guiding theparticipants towards the booklet during an observation of a session:
They are also very good at, I suppose this is where their comfort zone is, giving the information in avery clear way and making use of the resources in the workbook and pointing and steering peopletowards those.
CP2
Summary
This qualitative analysis explored the views of HLFs and CPs regarding the process of implementingMOVE IT. Of all 13 HLFs invited to interviews, we gained feedback from seven; we also gained feedbackfrom both of the CPs who trained and supervised the HLF team. The main themes that emerged were(1) challenges faced during training and suggested improvements, (2) issues with supervision and peersupport and (3) difficulties in delivering the intervention.
The HLFs enjoyed learning how to implement MOVE IT in addition to working with the patients. Thetraining was described as time consuming and arduous, and HLFs felt that it could have been completed ina shorter time allowing more time for hands-on learning. Although there was a lot of information to cover,none of the HLFs mentioned a lack of confidence in the delivery of the intervention. With regards to therelationship with their supervisors, many of the HLFs felt that the fortnightly sessions were not utilisedefficiently or that they could become repetitive.
The HLFs developed a strong support network between one another, and the relationship with theirsuperiors improved once a HLF was promoted and could mediate between them, making better use of theirtime. It was noted that the activity booklets were age-inappropriate for the participants involved, whichbecame a barrier during some sessions. In addition, some participants assumed that the HLFs were medicalprofessionals who were able to discuss other health complaints and HLFs would have to reiterate that theywere not medically trained while ensuring that the participants did not lose confidence in the help that theycould provide. Both CPs noted the proficiency of the HLFs in working around these difficulties.
Enhanced MI was reported as an enriching and effective approach. The training undertaken by the HLFsin this study could have been adapted to allow the HLFs to learn via experience as opposed to continualrehearsal. This analysis also demonstrated the importance of effective and useful communication andsupport between HLFs and those managing them. It is therefore important to consider a practical andongoing support structure. Furthermore, it may be useful to adapt the tools used in such an interventionto the age of the target group to remove potential barriers to engagement.
QUALITATIVE FINDINGS: THE VIEWS OF HEALTHY LIFESTYLE FACILITATORS AND CLINICAL PSYCHOLOGISTS
NIHR Journals Library www.journalslibrary.nihr.ac.uk
92
Chapter 11 Discussion
Summary of the clinical effectiveness of MOVE IT
This three-arm parallel RCT study tested the effectiveness of an enhanced MI intervention, delivered byspecially trained health trainers (HLFs), in a group versus individual format, versus UC for reducing weightand increasing PA in adults at high risk (≥ 20.0%) of developing CVD in the next 10 years.
For the primary objective, the main findings were that there were no significant changes in weight or PA24 months later between group enhanced MI or individual enhanced MI compared with UC.
For the secondary objectives, we found that MOVE IT delivered in a group format was not more effectivethan when delivered in the individual format in reducing weight and increasing PA or in reducing LDLcholesterol or CVD risk score 24 months later. There were no differences in the number of fatal ornon-fatal cardiovascular events and other recorded AEs between the three treatment arms.
The health economic results revealed that there was little difference in terms of service use and costsbetween the three arms other than that resulting from the interventions themselves. Total service costsover the follow-up period were highest for the individual intervention arm, followed by the groupintervention arm, followed by the UC arm. Differences were not statistically significant. QALYs were verysimilar for each arm. The group intervention was dominated by UC in that the latter had lower costs andproduced more QALYs. The individual intervention did produce more QALYs than UC but the ICERindicated a cost per QALY far in excess of the threshold commonly used by NICE. For this reason, neitherform of the intervention was cost-effective. There was much uncertainty around the cost and outcomedifferences but the conclusions of a lack of cost-effectiveness hold.
The findings of the process evaluation were as follows.
l Mediators: we found that dietary changes did not mediate any treatment effects on the primaryoutcomes. We did not conduct any further mediational analyses, as there was no change in the primaryor secondary outcomes.
l Participation bias: we found that there was significant evidence of reduced reach in that those with ahigher CVD risk, higher level of deprivation status and of African-Caribbean ethnicity were less likely toreply to invitations to participate from their general practice.
l Fidelity analysis: there were significant methodological limitations of conducting a fidelity analysis but,based on the much-reduced highly selected sample, there was evidence that nearly all of the HLFs hadsufficient competencies in at least one MI skillset.
l Patient experience: the main themes that emerged were (1) perceived benefits of the study (benefitsof increased health awareness, positive lifestyle changes and the opportunity to learn from others),(2) factors enhancing behaviour change (continuity of sessions over a longer period and havingcontinuity of the same HLF) and (3) perceived risk of CVD (this was lower than was expected). Onefurther theme that emerged for the non-completers only was (4) potential barriers to change andovercoming these barriers, such as lack of feedback and lack of engagement by their GPs.
l Therapist experience: the overall view was that the formal training period could have been shortened,more exposure to training cases could have been provided and the HLFs had not been prepared for thereal-world challenges once in the clinical setting. They perceived themselves as competent in the MIapproach and BCTs. They observed the importance of working with patients towards their goals butthere were some common challenges, such as patients not engaging and some of the interventionmaterials not being deemed age-appropriate. The HLFs felt that support from supervisors, andadministrative support, was insufficient but that they could problem-solve by supporting each other.
DOI: 10.3310/hta23690 HEALTH TECHNOLOGY ASSESSMENT 2019 VOL. 23 NO. 69
© Queen’s Printer and Controller of HMSO 2019. This work was produced by Ismail et al. under the terms of a commissioning contract issued by the Secretary of State for Healthand Social Care. This issue may be freely reproduced for the purposes of private research and study and extracts (or indeed, the full report) may be included in professionaljournals provided that suitable acknowledgement is made and the reproduction is not associated with any form of advertising. Applications for commercial reproduction shouldbe addressed to: NIHR Journals Library, National Institute for Health Research, Evaluation, Trials and Studies Coordinating Centre, Alpha House, University of Southampton SciencePark, Southampton SO16 7NS, UK.
93
Strengths and limitations
This RCT was powered to detect small effect sizes and, therefore, we can be confident that our (negative)findings are statistically valid. We used accelerometers as the gold standard for measuring PA. However,there may still have been a Hawthorne effect because the participants were aware of equipment andwere not blind to allocation as this was a talking therapy. If there was a Hawthorne effect of wearingthe accelerometer then it was negligible as the overall effect of the intervention was minimal on PA andweight loss. We had greater attrition for complete PA follow-up data. Previous research has set a standardfor the amount of accelerometer wear time required per wear-day owing to variability between days of theweek.143 We found that those not providing sufficient data at follow-up were less active and more likelyto smoke, had no formal educational qualifications and had more depressive symptoms. However, in theHealth Survey for England, participants who provided sufficient accelerometer wear time did not differfrom those who did not wear their accelerometer for the requested time.144 As participants in our recruitedsample were older than the target population, the use of fewer days of accelerometer wear data may beacceptable, as previous work has detailed that 3 consecutive wear-days accurately predicts PA levels inolder adults.145 Analysis of sedentary behaviour can require more wear-days, but this was not a mainoutcome of our study.
We recruited from all 12 CCGs covering the South London region, which has > 3 million residentsrepresenting a diverse socioeconomic and ethnically diverse community, including some inner-city Londonboroughs with high rates of CVD mortality. This was a positive aspect of the study. On the other hand,we did not include residents from the rest of the UK where there are high rates of CVD mortality, such asthe north of England, south Wales and central Scotland, and therefore this sample may not have beenrepresentative of all people at high CVD risk.146 Another limitation is that the South London sample maynot be representative of the rest of the UK (i.e. owing to the health inequalities between the north andsouth of the UK). In addition, those London CCGs with more deprivation were slower to respond to theinvitation and therefore when we were already halfway through recruitment and by the time we hadcompleted recruitment, less time had been spent recruiting from these CCGs. This may also have led tounder-recruitment of those most at risk, namely from deprived areas and non-white ethnic groups.
A pragmatic feature and strength of this study included using the GP QRISK2 tool, which is routinelyavailable on the electronic records software for calculating CVD risk. Although this was a strength becauseit is an objective measure of risk, which could potentially be easily used by GPs, the limitation was that ithad a high false-positive rate, generating a very high denominator number of patients, all of whom wereinvited for consent for screening for eligibility. The accuracy, completeness and age of data required forthe QRISK2 algorithm based on the data stored in medical records were variable. This resulted in invitingand consenting many patients who turned out to have lower and therefore ineligible QRISK2 scores whenscreened. We had to assess an additional 1332 patients who turned out to be ineligible to participate,which was costly and time consuming. However, there were few other options. The NHS Health Checkprogramme was not appropriate as it achieved a lower-than-expected uptake across England.12
A limitation of the study was that there were delays in recruitment that had repercussions in that theintervention delivery was delayed for some participants. The unexpected inefficiency in using the NHSHealth Check led to delaying recruitment. Switching recruitment strategy to using the QRISK2 toolintroduced another delay, which had repercussions for the delivery of the intervention. This is because theswitch from Health Checks to QRISK2 required a protocol change, ethics approval and application of a costextension from NIHR. The delays in recruitment and uncertainty of funding extension approval resulted inmost of the HLFs seeking jobs elsewhere as their contracts started coming to an end. At around the sametime, the co-applicant’s clinical health psychologist also resigned. We had to employ and complete theinduction of a second clinical health psychologist and train a new cohort of HLFs. This meant that whenrecruitment returned once additional funding and ethics approval had been secured there was a waitinglist for delivery of the intervention. This may have contributed to some of the dropout from theintervention.
DISCUSSION
NIHR Journals Library www.journalslibrary.nihr.ac.uk
94
A strength was that our intervention was embedded and delivered in the heart of the community tomatch the real-world setting and we were able to be flexible with timing of the sessions (including lateafternoons and early evenings). Our intervention focused on supporting maintenance once changes hadbeen made in the initial phases. However, a limitation was that we could not offer sessions immediatelyand there was a waiting list for patients while HLFs were trained to competency. Approximately 50% ofparticipants randomised to the individual and group interventions dropped out of the intervention after theintroductory session. As most of our participants were retired, providing flexibility in the timing of sessionsaround work schedules was less important. We observed that participants in both the group and individualintervention arms generally adhered well to the intervention, based on the HLFs asking participants to settargets at each session and record if these were achieved or not.
We developed a standardised health trainer manual that could be readily replicated and used for trainingand supervision. A limitation was that the HLFs preferred practical training rather than didactic learningand classroom-based role play. We would have preferred to have the HLFs undertake more practicaltraining with patients and this might have improved competencies, but this was impossible in terms ofresources and the inherent nature of delivering a complex intervention as a research study. The HLFs wereemployed as NHS staff on short-term contracts; thus, we would have had to set up a CVD risk clinic veryquickly, screen patients and then offer the intervention. As this was a 12-month intervention, this was notfeasible.
We conducted a comprehensive process evaluation to understand the underlying mechanisms of action.We ensured a long follow-up to capture both short-term and long-term, or maintenance, outcomes.As a result of the process evaluation, we found that we did not reach those at the highest risk of CVD,participants who did not complete the intervention expressed lack of feedback and engagement as areason, and participants attributed their high CVD risk to their age rather than their own lifestyle choices.Although we did observe several participation biases (see Chapter 7), it is unclear if more specific targetingof the intervention would have had a clinical effect, given that the absolute differences observed weresmall and a large sample was recruited. In addition, participants noted a lack of engagement from theirGP concerning their high CVD risk, which may have negatively influenced any treatment effects. However,given the large number of GPs recruited to the study, it would not have been feasible to incorporate alarger amount of GP engagement in the study design.
Our PPI group was interactive and involved throughout. There are a number of areas in which themethodology of the trial may be improved. For instance, the importance of the invitation process andmaterials were highlighted by both PPI members and the intervention providers, and appropriate targetingof those who may benefit most from participation in the trial may improve the reach of the study.
There were limitations in the cost-effectiveness analyses. We relied on self-report of service use informationand this may have led to recall inaccuracy. This was largely unavoidable given the range of services we wishedto include in the measure of cost. Other studies have found this approach to be reasonable and there is noreason to suppose that any inaccuracy biased the findings.147,148 A further limitation was that the EQ-5D-3Lmay not have been sensitive to change in this patient group. It is the recommended measure for suchanalyses but further work on assessing its appropriateness is warranted. The lack of differences in QALYsdoes support the main clinical findings of the study. Finally, we had hoped to include lost employmentcosts in a societal perspective; however, data on this were not available.
Interpretation
There are several possible explanations for the results of this trial: (1) although the clinical population wasat high risk of CVD, the risk factors were not modifiable by lifestyle interventions, or (2) the psychologicaltheories were not the most appropriate and/or psychotherapeutic approaches are not sufficiently potentalone.
DOI: 10.3310/hta23690 HEALTH TECHNOLOGY ASSESSMENT 2019 VOL. 23 NO. 69
© Queen’s Printer and Controller of HMSO 2019. This work was produced by Ismail et al. under the terms of a commissioning contract issued by the Secretary of State for Healthand Social Care. This issue may be freely reproduced for the purposes of private research and study and extracts (or indeed, the full report) may be included in professionaljournals provided that suitable acknowledgement is made and the reproduction is not associated with any form of advertising. Applications for commercial reproduction shouldbe addressed to: NIHR Journals Library, National Institute for Health Research, Evaluation, Trials and Studies Coordinating Centre, Alpha House, University of Southampton SciencePark, Southampton SO16 7NS, UK.
95
One explanation for the negative findings is that we may not have recruited those with high CVD risk whohad modifiable risk factors. The use of a QRISK2 score of ≥ 20.0% ensured that our study recruited thoseat the highest risk of CVD in accordance with an objective risk algorithm that takes into account numerousmodifiable risk factors. However, the risk factors with the greatest weighting in the algorithm are thenon-modifiable risk factors: age, sex and ethnicity.20 It has previously been shown that risk calculators,including the QRISK2, may not have the specificity to identify CVD risk at the individual, as opposed tothe population, level.149 Those patients of older age, male sex and South Asian ethnicity are at the highestrisk, but these individuals may be otherwise healthy in terms of their modifiable risk factors that are inputtedinto the algorithm, and therefore the aims and contents of the intervention may not be applicable to them.The use of a QRISK2 score of ≥ 20.0% may have meant that the recruitment strategy led to a sampleskewed against those with high BMIs, blood pressure and LDL cholesterol levels (exactly those participantswho were most likely to benefit as these risk factors are modifiable).
Indeed, we found that older people with a normal or underweight BMI were recruited, raising challengesfor the intervention team considering the primary aim of a reduction in weight. Previous research hasdemonstrated that participants at the highest risk benefit most from preventative interventions. In Gidlowet al.,69 an observational study based in primary care in Stoke-on-Trent, followed three groups of patients:those with at least one modifiable CVD risk factor using the Framingham risk engine score, those withdiabetes mellitus or coronary heart disease (secondary prevention) and those who were obese and had aCVD risk of > 15%. They received a patient-tailored, health-trainer-delivered, lifestyle intervention over6–12 months with face-to-face and telephone/SMS (short message service) support. They observed modestimprovements in risk factors and health-related quality of life, but not in CVD risk score, except in thesubsample of patients who were at highest risk (> 20%) at baseline. In the study by Hardcastle et al.,49
the investigators focused on CVD risk factors, such as excess weight (BMI of ≥ 28 kg/m2, based on a valueused in the recruiting general practice), hypertension (systolic/diastolic blood pressure of ≥ 150/90 mmHg) orhypercholesterolemia (≥ 5.2 mmol/l), rather than CVD risk score. They observed that the MI intervention wasparticularly effective for patients with elevated numbers of CVD risk factors at baseline.
The participants in this trial had average step counts at baseline that were in line with that previously reportedfor healthy older adults who were participating in exercise classes.150 Therefore, on average, the participantsrecruited to MOVE IT may at baseline have been at their ceiling in terms of PA achieved, leaving little roomfor improvement. Previous studies of PA interventions for older adults, using accelerometer measurement asan outcome measure, tend to report significant increases up to a 12-month follow-up but there have beenfew psychological interventions to help maintain the increased PA.151 Another explanation for the negativefindings is that patients in our sample were not obese. The association between increasing PA and decreasingHbA1c level following behavioural intervention is stronger in those who are obese (BMI of ≥ 30 kg/m2),152 andit may be that our sample was not at a high enough risk (the mean BMI was 28.3 kg/m2) to see significancein outcomes.
The objective accelerometer measurement of PA provides a more reliable measure than self-report as it isless prone to bias. However, the days for which the PA measure is collected may not represent normal PAlevels of participants; they may, for example, be elevated above the usual level owing to social desirability.153
A review of the impact of interventions combining BCTs that target diet and PA found no differences inPA outcomes with UC when self-report PA outcome measures were used.154 These studies did find asignificant impact on BMI, suggesting that beneficial effects of the intervention had taken place and thatperhaps a change in PA levels could not be successfully captured by the self-report measure or at thelong-term follow-up. It may be that participants in our study made some initial increases in PA levels thatwere not captured at the 12- and 24-month follow-ups through accelerometry or at baseline; in addition,outcome PA measures of all participants may have been artificially raised. To further investigate the impactof interventions on PA, studies would need to undertake continuous objective measurement throughoutparticipation, as opposed to the norm of 4–7 consecutive days’ wear.143 Low-cost and unobtrusive means tomonitor PA throughout participation in a RCT, such as wearable and smartphone technology, provide thisopportunity, although the reliability and validity of these methods are yet to be assessed.155,156
DISCUSSION
NIHR Journals Library www.journalslibrary.nihr.ac.uk
96
A second possible explanation for the negative findings is that the intervention potency or overall dose wassuboptimal. The psychological skills were based on sound well-established psychological theories: (1) thetheory of planned behaviour for initiation of behaviour change, which states that in order to changebehaviour, people need to form an intention,53 (2) principles underpinning MI that emphasise that thepatient’s motivation to change can be used as a therapeutic tool,41 (3) CBT91 and (4) social cognitivetheory,92 which emphasises the importance of peer support in shaping behaviour, which was applied tothe group intervention arm of MOVE IT.
We used well-established and evidence-based psychotherapeutic techniques to apply the theoreticalframework for MOVE IT. MI was used to support participants in forming healthy intentions. MI is acollaborative conversation style for strengthening a person’s own motivation, belief and commitment tochange. We used principles from CBT to support the transition from intention to action and from action tomaintenance93 by identifying and challenging unhelpful thoughts or thinking styles and promoting morepositive emotions and behaviours. Using an iterative process, we devised the intervention curriculum and aparticipant workbook to support training, supervision, collaboration and replication. We had an intensivephase and the maintenance phase consisted of four sessions delivered at 3, 6, 9 and 12 months fromintervention commencement. Those randomised to the group intervention arm were encouraged to use peerlearning and the peer-support environment to facilitate change during both the intensive and maintenancephases. Novel methods and teaching aids were used to supplement the delivery of BCTs, such as visual aids(food labels)/cue cards, exercise demonstrations, video/audio material of patient testimonials, activity-basedlearning around meal planning and SMS/e-mail reminders. Cultural and religious awareness is built in to theintervention.
We employed and trained health trainers with an intensive package of didactic learning, role playing andfeedback, group exercises, reading and case study discussion over 3 months. Competency in administeringthe intervention was assessed through a knowledge quiz and delivering several sessions to volunteers.94–96
For HLFs that were not competent, they underwent further training until competent. HLF competency wasmonitored throughout the intervention by the CP regular supervision and quality assurance by reviewingaudiotaped sessions.
This process is a standard approach to developing and evaluating a set of psychotherapeutic skills. It maybe that for this clinical setting this approach is, or components of this approach are, insufficient. Thetheoretical frameworks were originally developed for mental health conditions that can remit, such asalcohol dependence, anxiety and depressive disorders. It would seem that a clinical state such as risk ofCVD as a construct that could remit if one could develop and change one’s thinking patterns aboutlifestyles has face validity for applying similar psychotherapeutic techniques. However, perhaps apsychological model is not appropriate and intensive instruction is more apt.
Landmark studies have repeatedly shown that intensive lifestyle instruction that focuses primarily onbehaviour change, such as the diabetes prevention studies,157–159 weight reduction programmes160 and,recently, studies on reversal of type 2 diabetes mellitus,161 does lead to significantly improved outcomes.Even the simple behavioural act of prescribing a pedometer leads to improved PA.34 In these interventions,the clinically active ingredients were access to intensive, highly-structured and prescribed dietary and/or PAinstruction following a counselling approach with minimal psychotherapeutic techniques. Our approachwas to use talking therapies to instigate behaviour change rather than instruction, with the philosophy thatintentions need to change before behaviours do and that changing people’s way of thinking (as opposedto instructing them) would also be cheaper in the long term and more likely to be maintained. It could bethat with lifestyles interventions the active ingredients are intensive instruction and advice. This suggeststhat the theoretical models of theory of planned behaviour and the theory that everyone has a degree ofmotivation and intent may not be appropriate for lifestyle change.
DOI: 10.3310/hta23690 HEALTH TECHNOLOGY ASSESSMENT 2019 VOL. 23 NO. 69
© Queen’s Printer and Controller of HMSO 2019. This work was produced by Ismail et al. under the terms of a commissioning contract issued by the Secretary of State for Healthand Social Care. This issue may be freely reproduced for the purposes of private research and study and extracts (or indeed, the full report) may be included in professionaljournals provided that suitable acknowledgement is made and the reproduction is not associated with any form of advertising. Applications for commercial reproduction shouldbe addressed to: NIHR Journals Library, National Institute for Health Research, Evaluation, Trials and Studies Coordinating Centre, Alpha House, University of Southampton SciencePark, Southampton SO16 7NS, UK.
97
A related, but perhaps separate, explanation is that the techniques we used to apply these theories weretoo weak. Secondary to factors totally outside our control, we could not assess competencies fully, but theextremely limited evidence we had was that the competencies, although acceptable, were not highlyproficient. Assuming that this was indeed the case, then despite the intensive MI training of the HLFs thisin itself was insufficient and one needs to establish very high levels of competencies in these skills. Thehealth trainers did refer to this in the process evaluation; they thought that there was too much didacticand classroom-based teaching when they would have preferred more clinical cases and more supervisionduring the intervention. There have been very few studies that measure the competencies of low-intensitypsychotherapy in lifestyle-based interventions. In the field of supporting self-management in type 2diabetes mellitus, there have been only three studies that have formally tested competencies in MI.105,162,163
The original landmark studies of MI were delivered by those who had developed the models, were leadersin the field and specialised wholly in MI.41 As champions of MI and developers of the competencymaterials, it is likely that the earlier studies of MI would have shown high competencies and that this led toimproved outcomes. It is unfortunate that although these data were collected we are not able to measurethe competencies that would allow us to examine the level of skill. It may be reasonable to assume thatthe competencies delivered were probably adequate even if not excellent, in keeping with what would beexpected for a large-scale delivery of MI by NHS band 3 equivalent health trainers. The reasons are that thehealth trainers were self-selected, most already had experience in this field and were given excellentreferences, they received high-intensity training and supervision, and their own feedback suggested thatthey were very motivated to improve their skills and seek more practical support and had insight into theirclinical needs.
Although we observed that the HLFs generally had lower than expected competency in delivering the BCTs,it is important to note that the employed BCT coding framework was developed by us and was not validated,potentially leading us to underestimate HLFs’ competencies in this domain. If we had the full data set ofrecorded intervention sessions, we believe that we would have observed much higher levels of competency.Anecdotes from the HLFs suggested that they were highly motivated, professional, committed, ambitious andknew that they were being observed; these are all the key generic therapist elements often needed to becompetent in delivering talking therapies.
Finally, it is worth considering that participants in the UC arm may have received a high level of standardcare over the course of the study, which could have positively affected their PA and weight, thus obscuringany treatment effects from MOVE IT. However, given that the UC arm did not have a significant increasein PA or reduction in weight, this alternative is unlikely.
Clinical implications
There are a number of clinical implications to consider. These findings suggest that low-intensitypsychological intervention in the form of MI to the general population at high risk of CVD risk is noteffective. The acquisition of a workforce of health trainers who have received extensive training in MI toa level of low-to-moderate skills in MI is probably also not indicated. If this kind of training was to beoffered, perhaps the focus should use the manual we have developed as a basis but to focus on practicallearning through case work (i.e. practical experience and case studies). There is also some consideration tobe given as to whether these findings apply to other clinical settings that require lifestyle change, such asobesity, prediabetes, diabetes mellitus and people with CVD. Some older, male patients have a perceptionthat they are not at risk of CVD or that this risk is to be expected at this stage in their lives. This view mayneed to be studied further to understand if it is associated with worse health outcomes.
The implication of the cost-effectiveness analyses is that introducing a generic enhanced MI-based healthtrainer programme for people at high risk of CVD is not a cost-effective use of resources.
DISCUSSION
NIHR Journals Library www.journalslibrary.nihr.ac.uk
98
Research implications and future directions
There are number of potential directions for the future. The first is to test whether or not this interventionwould be more successful with people at much higher risk of CVD who have modifiable risk factors. Thiswould involve selecting patients from primary care or community settings, and perhaps younger patients,with higher levels of obesity, lipids and other CVD risk factors that are potentially modifiable (unlike riskfactors such as age, ethnicity and sex, which are not modifiable). One potential next step could be to modelthe intervention in different populations, as we are not aware of intensive MI interventions to supportlifestyle change in which there was improved targeting.
An alternative approach would have been to increase the actual CVD risk for eligibility and to restrict thestudy to a younger population, those living in deprived areas and those of non-white ethnicity. Anotherimprovement could be to change the format of the intervention or its delivery (i.e. being led by a practicenurse).164 Setting BMI thresholds for recruitment would be another improvement to our methodology,which may mean that we recruit patients at higher risk and who may have benefited more from theintervention. However, our sensitivity analyses adjusting for different BMI thresholds did not indicate thatthis factor influenced the effect of intervention.
Second, there may need to be a paradigm shift in the psychological constructs underpinning lifestylechange in chronic disease self-management. Brief interventions for medical conditions that are chronic areincreasingly showing to be not effective and outdated. New concepts are needed that take into accountthe burden, or the long haul, of living with a chronic condition. Our intervention was for 12 months butperhaps interventions that consist of bursts of support over years need to be evaluated; the dilemma isthat these are expensive to fund and the results take a long time to be reported, and there may be a cohorteffect as medical science might move forward in that time. MOVE IT emphasised the importance of the useof qualitative methodology in providing detailed experiences of participants for assessing the effectivenessof a RCT. As previously reported, studies have supported the benefits of lifestyle interventions in the shortterm but few have supported their benefits in the long term.49,131,132 In MOVE IT, continuity of care andduration of the intervention was of value to those who attended. Although attendance to group sessionswas less than attendance to individual sessions, those who attended group sessions appear to value thepeer support. Future research should include more qualitative work on why those at the highest risk of CVDor those with modifiable risk factors do not attend lifestyle interventions. It was impossible to do this inMOVE IT as we could not gain ethics approval to contact patients who had not replied to our invitation sentvia their GPs.
Summary
An intensive lifestyle intervention using enhanced MI skills was not associated with reduced weight orincreased PA in a sample of people at risk of CVD. The reasons for this are probably attributable to thesample having predominantly non-modifiable risk factors. Future interventions should focus on those athigh CVD risk and with modifiable risk factors and should be delivered at high levels of measuredcompetency.
DOI: 10.3310/hta23690 HEALTH TECHNOLOGY ASSESSMENT 2019 VOL. 23 NO. 69
© Queen’s Printer and Controller of HMSO 2019. This work was produced by Ismail et al. under the terms of a commissioning contract issued by the Secretary of State for Healthand Social Care. This issue may be freely reproduced for the purposes of private research and study and extracts (or indeed, the full report) may be included in professionaljournals provided that suitable acknowledgement is made and the reproduction is not associated with any form of advertising. Applications for commercial reproduction shouldbe addressed to: NIHR Journals Library, National Institute for Health Research, Evaluation, Trials and Studies Coordinating Centre, Alpha House, University of Southampton SciencePark, Southampton SO16 7NS, UK.
99

Acknowledgements
F irst, we would like to thank the 1742 participants who took part in this trial, as well as the 1441 whowere screened but did not participate. We are grateful for the support of the 135 participating general
practices across South London, including the collaboration of GP partners, health-care professionals andpractice staff. We also wish to thank the TSC and DMEC members for their oversight and support of thestudy (details are provided in Trial Steering Committee and Data Monitoring and Ethics Committee). Wewould like to thank the research team, the HLF team, CPs, PPI members and the South London ClinicalResearch Network, who have supported the study, and Waad Al-Fawaz (PhD student) who led the dietaryassessments.
Contributions of authors
Khalida Ismail (Professor of Psychiatry and Medicine and Consultant Liaison Psychiatrist) led the grantapplication and conduct of all aspects of the trial as PI.
Daniel Stahl (Reader in Biostatistics and Head of the Statistics Learning Group) contributed to the grantapplication, protocol writing and ongoing study monitoring, developed the statistical analysis plan, advisedon the collection of outcome measures and data management and conducted the primary and secondaryanalyses.
Adam Bayley (Clinical Trial Manager) provided oversight of the research team, contributed to the day-to-dayconduct of the trial and was involved in writing and collating contributions to the report.
Katherine Twist (Clinical Trial Manager) provided oversight of the research team and contributed torecruitment of research sites and the day-to-day conduct of the trial.
Kurtis Stewart (Trial Administrator) provided administrative support to the trial and contributed tosections of the report, including intervention details and fidelity analysis.
Katie Ridge (Assistant Trial Manager) contributed to the recruitment of research sites, data collectionschedule development and ongoing day-to-day running of the trial.
Emma Britneff (Assistant Trial Manager) provided oversight of the research team and contributed to theday-to-day conduct of the trial.
Mark Ashworth (Senior Lecturer in General Practice) contributed to the grant application, protocolwriting and ongoing study monitoring. He networked with, advised and facilitated the study for the newCCGs in South London and advised on primary-care-related issues.
Nicole de Zoysa (Senior Clinical Psychologist) contributed to the grant application, protocol writing andintervention development. She developed the manual, curriculum and competency framework and trainedand supervised the HLF team.
Jennifer Rundle (Clinical Psychologist) provided ongoing training and supervision of the HLF team andcontributed to the development of the process evaluation, including preliminary fidelity analyses.
Derek Cook (Professor of Epidemiology) contributed to the grant application, protocol writing and ongoingstudy monitoring. He supervised setup and collection of PA data and the interpretation of outcomemeasures.
DOI: 10.3310/hta23690 HEALTH TECHNOLOGY ASSESSMENT 2019 VOL. 23 NO. 69
© Queen’s Printer and Controller of HMSO 2019. This work was produced by Ismail et al. under the terms of a commissioning contract issued by the Secretary of State for Healthand Social Care. This issue may be freely reproduced for the purposes of private research and study and extracts (or indeed, the full report) may be included in professionaljournals provided that suitable acknowledgement is made and the reproduction is not associated with any form of advertising. Applications for commercial reproduction shouldbe addressed to: NIHR Journals Library, National Institute for Health Research, Evaluation, Trials and Studies Coordinating Centre, Alpha House, University of Southampton SciencePark, Southampton SO16 7NS, UK.
101

Peter Whincup (Professor of Cardiovascular Epidemiology) contributed to the grant application, protocolwriting and ongoing study monitoring. He was responsible for senior supervision of all aspects of CVDepidemiology, Health Checks and health service aspects of the trial.
Janet Treasure (Professor of Psychiatry) contributed to the grant application, intervention development(MI approach, training and manual development) and ongoing study monitoring.
Paul McCrone (Professor of Health Economics) contributed to the grant application, protocol writing andongoing study monitoring. He conducted the cost-effectiveness analysis.
Anne Greenough (Professor of Neonatology and Clinical Respiratory Physiology) contributed to the grantapplication, protocol writing and ongoing study monitoring.
Kirsty Winkley (Postdoctoral Fellow and Lecturer in Diabetes and Psychology) contributed to the grantapplication, protocol writing and ongoing study monitoring. As the senior project manager, she providedoversight of both the research team and the HLF team during recruitment and intervention delivery. Shesupervised the recruitment of staff members, the quality assurance of data collection and the processevaluation.
The MOVE IT trial team
We set up a multidisciplinary team to ensure that all scientific and practical considerations were addressedfor the successful conduct of this study. This represented international reputations and expertise in healthpsychology, clinical psychology, nursing, clinical epidemiology of long-term conditions (obesity, depression,CVD and diabetes mellitus), clinical trials, health economics of complex interventions, statistics in behaviouralsciences, academic and commissioning primary care and project management. Collectively, we have awealth of expertise in running large cohort clinical trials of complex interventions and in the disseminationand translation into local services and training programmes, especially in the local multicultural setting.Our strength also lies in the collaboration between two teaching hospitals via the health innovation andeducation cluster.
Members
l Principal investigator: Khalida Ismail.l Co-investigators: Mark Ashworth, Derek Cook, Anne Greenough, Paul McCrone, Daniel Stahl,
Janet Treasure, Peter Whincup and Kirsty Winkley.l Trial managers: Adam Bayley, Emma Britneff, Katie Ridge and Katherine Twist.l Trial administrators: Kurtis Stewart and Clare Tucker.l Research assistants: Hina Akram, Jasmine Anilmis, Jennifer Bales, Naomi Croft, Stephanie Fincham-Campbell,
Lucinda Gledhill, Ana Jovovic, Alexandra Keyes, Paulina Kuczynska, Lisa Kuriakose, Leona McGarrigle,Louise Mercer, Anna Rokakis, Arann Rowe, Katherine Sparrow and Emily Staite.
l Clinical psychologists: Nicole de Zoysa and Jennifer Rundle.l HLFs: Mwaita Bonga, Anna-Marie Bowtle, Nurcan Cahill, Emily Costelloe, Elizabeth Cruz,
Salwa Dafalla, Charlotte Irving, Jessica Mark, Kashmir Mangat, Arbaktun Mohammed, Ekta Patel andRaquel Ramos-Fraga.
l PPI: Jennifer Bostock and Carole Haynes.l Volunteers and students: Gita Ahluwalia, Emily Bralee, Christina Deller, Aurelia Harjanto, Vera Ludwig,
Tracy Tang, Patrick Timpel, Alexander Warrilow-Wilson, Farah Yakub and Natalie Zaremba.
ACKNOWLEDGEMENTS
NIHR Journals Library www.journalslibrary.nihr.ac.uk
102
Trial Steering Committee
We would like to thank the TSC members: Professor Steve Iliffe (Chairperson), University College London;Professor Tom Marshall (member of the Health Technology Assessment and Efficacy and MechanismEvaluation boards, 2009–11), University of Birmingham; Professor James Carpenter, London School ofHygiene and Tropical Medicine, Medical Research Council Clinical Trials Unit; and Dr Tim Anstiss,independent medical doctor and consultant. We would also like to thank the PPI members for attendingall TSC meetings throughout the trial.
Data Monitoring and Ethics Committee
We would like to thank the DMEC members: Professor Betty Kirkwood (previous Chairperson), LondonSchool of Hygiene and Tropical Medicine; Professor Helen Weiss (Chairperson), London School of Hygieneand Tropical Medicine; Professor Stephanie Taylor, Queen Mary University of London, Barts and TheLondon School of Medicine and Dentistry, Blizard Institute; and Dr David Blane, Imperial College London.
Publications
Bayley A, de Zoysa N, Cook DG, Whincup PH, Stahl D, Twist K, et al. Comparing the effectiveness of anenhanced MOtiVational intErviewing InTervention (MOVE IT) with usual care for reducing cardiovascularrisk in high risk subjects: study protocol for a randomised controlled trial. Trials 2015;16:112.
Bayley A , Stahl D, Ashworth M, Cook D, Whincup P, Treasure J, et al. Response bias to a randomisedcontrolled trial of a lifestyle intervention in people at high risk of cardiovascular disease: a cross-sectionalanalysis. BMC Public Health 2018;18:1092.
Ismail K, Bayley A, Twist K, Stewart K, Ridge K, Britneff E, et al. Reducing weight and increasing physicalactivity in people at high risk of cardiovascular disease: a randomised controlled trial comparing theeffectiveness of enhanced motivational interviewing intervention with usual care [published online aheadof print December 12 2019]. Heart 2019.
Data-sharing statement
All data requests should be submitted to the corresponding author for consideration. Access to availableanonymised data may be granted following review.
Patient data
This work uses data provided by patients and collected by the NHS as part of their care and support. Usingpatient data is vital to improve health and care for everyone. There is huge potential to make better use ofinformation from people’s patient records, to understand more about disease, develop new treatments,monitor safety, and plan NHS services. Patient data should be kept safe and secure, to protect everyone’sprivacy, and it’s important that there are safeguards to make sure that it is stored and used responsibly.Everyone should be able to find out about how patient data are used. #datasaveslives You can find outmore about the background to this citation here: https://understandingpatientdata.org.uk/data-citation.
DOI: 10.3310/hta23690 HEALTH TECHNOLOGY ASSESSMENT 2019 VOL. 23 NO. 69
© Queen’s Printer and Controller of HMSO 2019. This work was produced by Ismail et al. under the terms of a commissioning contract issued by the Secretary of State for Healthand Social Care. This issue may be freely reproduced for the purposes of private research and study and extracts (or indeed, the full report) may be included in professionaljournals provided that suitable acknowledgement is made and the reproduction is not associated with any form of advertising. Applications for commercial reproduction shouldbe addressed to: NIHR Journals Library, National Institute for Health Research, Evaluation, Trials and Studies Coordinating Centre, Alpha House, University of Southampton SciencePark, Southampton SO16 7NS, UK.
103

References
1. World Health Organization. Global Status Report on Noncommunicable Diseases 2010. Geneva:World Health Organization; 2011.
2. Whitlock G, Lewington S, Sherliker P, Clarke R, Emberson J, Halsey J, et al. Body-mass index andcause-specific mortality in 900 000 adults: collaborative analyses of 57 prospective studies. Lancet2009;373:1083–96. https://doi.org/10.1016/S0140-6736(09)60318-4
3. Lewington S, Clarke R, Qizilbash N, Peto R, Collins R, Prospective Studies Collaboration.Age-specific relevance of usual blood pressure to vascular mortality: a meta-analysis of individualdata for one million adults in 61 prospective studies. Lancet 2002;360:1903–13. https://doi.org/10.1016/S0140-6736(02)11911-8
4. Lewington S, Whitlock G, Clarke R, Sherliker P, Emberson J, Halsey J, et al. Blood cholesteroland vascular mortality by age, sex, and blood pressure: a meta-analysis of individual data from61 prospective studies with 55,000 vascular deaths. Lancet 2007;370:1829–39. https://doi.org/10.1016/S0140-6736(07)61778-4
5. Kvaavik E, Batty GD, Ursin G, Huxley R, Gale CR. Influence of individual and combined healthbehaviors on total and cause-specific mortality in men and women: the United Kingdom healthand lifestyle survey. Arch Intern Med 2010;170:711–18. https://doi.org/10.1001/archinternmed.2010.76
6. Yusuf S, Hawken S, Ounpuu S, Dans T, Avezum A, Lanas F, et al. Effect of potentially modifiablerisk factors associated with myocardial infarction in 52 countries (the INTERHEART study):case-control study. Lancet 2004;364:937–52. https://doi.org/10.1016/S0140-6736(04)17018-9
7. Backholer K, Peters SAE, Bots SH, Peeters A, Huxley RR, Woodward M. Sex differences in therelationship between socioeconomic status and cardiovascular disease: a systematic review andmeta-analysis. J Epidemiol Community Health 2017;71:550–7. https://doi.org/10.1136/jech-2016-207890
8. Wild SH, Fischbacher C, Brock A, Griffiths C, Bhopal R. Mortality from all causes and circulatorydisease by country of birth in England and Wales 2001-2003. J Public Health 2007;29:191–8.https://doi.org/10.1093/pubmed/fdm010
9. Unal B, Critchley JA, Capewell S. Explaining the decline in coronary heart disease mortality inEngland and Wales between 1981 and 2000. Circulation 2004;109:1101–7. https://doi.org/10.1161/01.CIR.0000118498.35499.B2
10. Hardoon SL, Whincup PH, Lennon LT, Wannamethee SG, Capewell S, Morris RW. How much ofthe recent decline in the incidence of myocardial infarction in British men can be explained bychanges in cardiovascular risk factors? Evidence from a prospective population-based study.Circulation 2008;117:598–604. https://doi.org/10.1161/CIRCULATIONAHA.107.705947
11. Department of Health and Social Care (DHSC). Vascular Checks: Risk Assessment andManagement. London: DHSC; 2008.
12. Robson J, Dostal I, Sheikh A, Eldridge S, Madurasinghe V, Griffiths C, et al. The NHS HealthCheck in England: an evaluation of the first 4 years. BMJ Open 2016;6:e008840. https://doi.org/10.1136/bmjopen-2015-008840
13. Usher-Smith JA, Mant J, Martin A, Harte E, MacLure C, Meads C, et al. NHS Health CheckProgramme Rapid Evidence Synthesis. 2017. URL: www.rand.org/content/dam/rand/pubs/external_publications/EP60000/EP67129/RAND_EP67129.pdf (accessed 1 November 2017).
DOI: 10.3310/hta23690 HEALTH TECHNOLOGY ASSESSMENT 2019 VOL. 23 NO. 69
© Queen’s Printer and Controller of HMSO 2019. This work was produced by Ismail et al. under the terms of a commissioning contract issued by the Secretary of State for Healthand Social Care. This issue may be freely reproduced for the purposes of private research and study and extracts (or indeed, the full report) may be included in professionaljournals provided that suitable acknowledgement is made and the reproduction is not associated with any form of advertising. Applications for commercial reproduction shouldbe addressed to: NIHR Journals Library, National Institute for Health Research, Evaluation, Trials and Studies Coordinating Centre, Alpha House, University of Southampton SciencePark, Southampton SO16 7NS, UK.
105

14. Cochrane T, Davey R, Iqbal Z, Gidlow C, Kumar J, Chambers R, Mawby Y. NHS health checksthrough general practice: randomised trial of population cardiovascular risk reduction. BMC PublicHealth 2012;12:944. https://doi.org/10.1186/1471-2458-12-944
15. Krogsbøll LT, Jørgensen KJ, Grønhøj Larsen C, Gøtzsche PC. General health checks in adults forreducing morbidity and mortality from disease: Cochrane systematic review and meta-analysis.BMJ 2012;345:e7191. https://doi.org/10.1136/bmj.e7191
16. Dalton AR, Bottle A, Okoro C, Majeed A, Millett C. Uptake of the NHS Health Checks programmein a deprived, culturally diverse setting: cross-sectional study. J Public Health 2011;33:422–9.https://doi.org/10.1093/pubmed/fdr034
17. Anderson KM, Odell PM, Wilson PW, Kannel WB. Cardiovascular disease risk profiles. Am Heart J1991;121:293–8. https://doi.org/10.1016/0002-8703(91)90861-B
18. Woodward M, Brindle P, Tunstall-Pedoe H, SIGN group on risk estimation. Adding socialdeprivation and family history to cardiovascular risk assessment: the ASSIGN score from theScottish Heart Health Extended Cohort (SHHEC). Heart 2007;93:172–6. https://doi.org/10.1136/hrt.2006.108167
19. Hippisley-Cox J, Coupland C, Vinogradova Y, Robson J, May M, Brindle P. Derivation andvalidation of QRISK, a new cardiovascular disease risk score for the United Kingdom: prospectiveopen cohort study. BMJ 2007;335:136. https://doi.org/10.1136/bmj.39261.471806.55
20. Hippisley-Cox J, Coupland C, Vinogradova Y, Robson J, Minhas R, Sheikh A, Brindle P. Predictingcardiovascular risk in England and Wales: prospective derivation and validation of QRISK2. BMJ2008;336:1475–82. https://doi.org/10.1136/bmj.39609.449676.25
21. National Institute for Health and Care Excellence (NICE). Cardiovascular Disease: Risk Assessmentand Reduction, Including Lipid Modification. London: NICE; 2016.
22. Wahid A, Manek N, Nichols M, Kelly P, Foster C, Webster P, et al. Quantifying the associationbetween physical activity and cardiovascular disease and diabetes: a systematic review andmeta-analysis. J Am Heart Assoc 2016;5:e002495. https://doi.org/10.1161/JAHA.115.002495
23. Department of Health and Social Care (DHSC). UK Physical Activity Guidelines. London:DHSC; 2011.
24. Hamer M, Chida Y. Walking and primary prevention: a meta-analysis of prospective cohortstudies. Br J Sports Med 2008;42:238–43. https://doi.org/10.1136/bjsm.2007.039974
25. Morris JN, Hardman AE. Walking to health. Sports Med 1997;23:306–32. https://doi.org/10.2165/00007256-199723050-00004
26. Ogilvie D, Foster CE, Rothnie H, Cavill N, Hamilton V, Fitzsimons CF, et al. Interventions topromote walking: systematic review. BMJ 2007;334:1204. https://doi.org/10.1136/bmj.39198.722720.BE
27. Craig R, Mindell J, Hirani V. Health Survey for England 2008. Volume 1: Physical Activity andFitness. 2009. URL: https://files.digital.nhs.uk/publicationimport/pub00xxx/pub00430/heal-surv-phys-acti-fitn-eng-2008-rep-v1.pdf (accessed 1 November 2017).
28. Conn VS, Hafdahl AR, Mehr DR. Interventions to increase physical activity among healthy adults:meta-analysis of outcomes. Am J Public Health 2011;101:751–8. https://doi.org/10.2105/AJPH.2010.194381
29. Foster C, Hillsdon M, Thorogood M, Kaur A, Wedatilake T. Interventions for promoting physicalactivity. Cochrane Database Syst Rev 2005;1:CD003180. https://doi.org/10.1002/14651858.CD003180.pub2
REFERENCES
NIHR Journals Library www.journalslibrary.nihr.ac.uk
106
30. Lamming L, Pears S, Mason D, Morton K, Bijker M, Sutton S, et al. What do we know aboutbrief interventions for physical activity that could be delivered in primary care consultations?A systematic review of reviews. Prev Med 2017;99:152–63. https://doi.org/10.1016/j.ypmed.2017.02.017
31. GC V, Wilson EC, Suhrcke M, Hardeman W, Sutton S, VBI Programme Team. Are briefinterventions to increase physical activity cost-effective? A systematic review. Br J Sports Med2016;50:408–17. https://doi.org/10.1136/bjsports-2015-094655
32. Murtagh EM, Nichols L, Mohammed MA, Holder R, Nevill AM, Murphy MH. The effect of walkingon risk factors for cardiovascular disease: an updated systematic review and meta-analysis ofrandomised control trials. Prev Med 2015;72:34–43. https://doi.org/10.1016/j.ypmed.2014.12.041
33. Cress ME, Buchner DM, Prohaska T, Rimmer J, Brown M, Macera C, et al. Best practices forphysical activity programs and behavior counseling in older adult populations. J Aging Phys Act2005;13:61–74. https://doi.org/10.1123/japa.13.1.61
34. Bravata DM, Smith-Spangler C, Sundaram V, Gienger AL, Lin N, Lewis R, et al. Using pedometersto increase physical activity and improve health: a systematic review. JAMA 2007;298:2296–304.https://doi.org/10.1001/jama.298.19.2296
35. Harris T, Kerry SM, Limb ES, Victor CR, Iliffe S, Ussher M, et al. Effect of a primary care walkingintervention with and without nurse support on physical activity levels in 45- to 75-year-olds: thePedometer And Consultation Evaluation (PACE-UP) cluster randomised clinical trial. PLOS Med2017;14:e1002210. https://doi.org/10.1371/journal.pmed.1002210
36. Michie S, Ashford S, Sniehotta FF, Dombrowski SU, Bishop A, French DP. A refined taxonomy ofbehaviour change techniques to help people change their physical activity and healthy eatingbehaviours: the CALO-RE taxonomy. Psychol Health 2011;26:1479–98. https://doi.org/10.1080/08870446.2010.540664
37. Bhattarai N, Prevost AT, Wright AJ, Charlton J, Rudisill C, Gulliford MC. Effectiveness ofinterventions to promote healthy diet in primary care: systematic review and meta-analysis ofrandomised controlled trials. BMC Public Health 2013;13:1203. https://doi.org/10.1186/1471-2458-13-1203
38. Gulliford MC, Bhattarai N, Charlton J, Rudisill C. Cost-effectiveness of a universal strategy of briefdietary intervention for primary prevention in primary care: population-based cohort study andMarkov model. Cost Eff Resour Alloc 2014;12:4. https://doi.org/10.1186/1478-7547-12-4
39. Rees K, Dyakova M, Ward K, Thorogood M, Brunner E. Dietary advice for reducing cardiovascularrisk. Cochrane Database Syst Rev 2013;3:CD002128. https://doi.org/10.1002/14651858.CD002128.pub4
40. Dansinger ML, Tatsioni A, Wong JB, Chung M, Balk EM. Meta-analysis: the effect of dietarycounseling for weight loss. Ann Intern Med 2007;147:41–50. https://doi.org/10.7326/0003-4819-147-1-200707030-00007
41. Miller W, Rollnick S. Motivational Interviewing: Preparing People to Change Addictive Behavior.2nd edn. New York, NY: Guilford Press; 2002.
42. Miller WR, Rollnick S. Motivational Interviewing: Helping People Change. 3rd edn. New York,NY: Guilford Press; 2012.
43. Lundahl B, Moleni T, Burke BL, Butters R, Tollefson D, Butler C, Rollnick S. Motivationalinterviewing in medical care settings: a systematic review and meta-analysis of randomizedcontrolled trials. Patient Educ Couns 2013;93:157–68. https://doi.org/10.1016/j.pec.2013.07.012
DOI: 10.3310/hta23690 HEALTH TECHNOLOGY ASSESSMENT 2019 VOL. 23 NO. 69
© Queen’s Printer and Controller of HMSO 2019. This work was produced by Ismail et al. under the terms of a commissioning contract issued by the Secretary of State for Healthand Social Care. This issue may be freely reproduced for the purposes of private research and study and extracts (or indeed, the full report) may be included in professionaljournals provided that suitable acknowledgement is made and the reproduction is not associated with any form of advertising. Applications for commercial reproduction shouldbe addressed to: NIHR Journals Library, National Institute for Health Research, Evaluation, Trials and Studies Coordinating Centre, Alpha House, University of Southampton SciencePark, Southampton SO16 7NS, UK.
107

44. Burke BL, Arkowitz H, Menchola M. The efficacy of motivational interviewing: a meta-analysis ofcontrolled clinical trials. J Consult Clin Psychol 2003;71:843–61. https://doi.org/10.1037/0022-006X.71.5.843
45. Rubak S, Sandbaek A, Lauritzen T, Christensen B. Motivational interviewing: a systematic reviewand meta-analysis. Br J Gen Pract 2005;55:305–12.
46. VanBuskirk KA, Wetherell JL. Motivational interviewing with primary care populations: asystematic review and meta-analysis. J Behav Med 2014;37:768–80. https://doi.org/10.1007/s10865-013-9527-4
47. Lee WW, Choi KC, Yum RW, Yu DS, Chair SY. Effectiveness of motivational interviewing onlifestyle modification and health outcomes of clients at risk or diagnosed with cardiovasculardiseases: a systematic review. Int J Nurs Stud 2016;53:331–41. https://doi.org/10.1016/j.ijnurstu.2015.09.010
48. Jansink R, Braspenning J, Keizer E, van der Weijden T, Elwyn G, Grol R. No identifiable Hb1Ac orlifestyle change after a comprehensive diabetes programme including motivational interviewing:a cluster randomised trial. Scand J Prim Health Care 2013;31:119–27. https://doi.org/10.3109/02813432.2013.797178
49. Hardcastle SJ, Taylor AH, Bailey MP, Harley RA, Hagger MS. Effectiveness of a motivationalinterviewing intervention on weight loss, physical activity and cardiovascular disease risk factors:a randomised controlled trial with a 12-month post-intervention follow-up. Int J Behav Nutr PhysAct 2013;10:40. https://doi.org/10.1186/1479-5868-10-40
50. Baker MK, Simpson K, Lloyd B, Bauman AE, Singh MA. Behavioral strategies in diabetesprevention programs: a systematic review of randomized controlled trials. Diabetes Res Clin Pract2011;91:1–12. https://doi.org/10.1016/j.diabres.2010.06.030
51. Ebrahim S, Taylor F, Ward K, Beswick A, Burke M, Davey Smith G. Multiple risk factorinterventions for primary prevention of coronary heart disease. Cochrane Database Syst Rev2011;1:CD001561. https://doi.org/10.1002/14651858.CD001561.pub3
52. Greaves CJ, Sheppard KE, Abraham C, Hardeman W, Roden M, Evans PH, et al. Systematic reviewof reviews of intervention components associated with increased effectiveness in dietary andphysical activity interventions. BMC Public Health 2011;11:119. https://doi.org/10.1186/1471-2458-11-119
53. Ajzen I. The theory of planned behavior. Organ Behav Hum Decis Process 1991;50:179–211.https://doi.org/10.1016/0749-5978(91)90020-T
54. Abraham C, Michie S. A taxonomy of behavior change techniques used in interventions.Health Psychol 2008;27:379–87. https://doi.org/10.1037/0278-6133.27.3.379
55. Greaves C, Gillison F, Stathi A, Bennett P, Reddy P, Dunbar J, et al. Waste the waist: a pilotrandomised controlled trial of a primary care based intervention to support lifestyle change inpeople with high cardiovascular risk. Int J Behav Nutr Phys Act 2015;12:1. https://doi.org/10.1186/s12966-014-0159-z
56. Renjilian DA, Perri MG, Nezu AM, McKelvey WF, Shermer RL, Anton SD. Individual versus grouptherapy for obesity: effects of matching participants to their treatment preferences. J Consult ClinPsychol 2001;69:717–21. https://doi.org/10.1037/0022-006X.69.4.717
57. Kozica SL, Lombard CB, Ilic D, Ng S, Harrison CL, Teede HJ. Acceptability of delivery modes forlifestyle advice in a large scale randomised controlled obesity prevention trial. BMC Public Health2015;15:699. https://doi.org/10.1186/s12889-015-1995-8
58. Després JP, Poirier P. Diabetes: Looking back at Look AHEAD – giving lifestyle a chance.Nat Rev Cardiol 2013;10:184–6. https://doi.org/10.1038/nrcardio.2013.16
REFERENCES
NIHR Journals Library www.journalslibrary.nihr.ac.uk
108
59. Ismail K, Lawrence-Smith G, Cheah Y, Winkley K, Yadav R, Thomas S, et al. Motivationalenhancement therapy with and without cognitive-behavioural therapy to treat type 1 diabetes:the long-term outcomes of a randomised controlled trial. Diabetologia 2009;52:S14-S.
60. Ridge K, Bartlett J, Cheah Y, Thomas S, Lawrence-Smith G, Winkley K, Ismail K. Do the effectsof psychological treatments on improving glycemic control in type 1 diabetes persist over time?A long-term follow-up of a randomized controlled trial. Psychosom Med 2012;74:319–23.https://doi.org/10.1097/PSY.0b013e31824c181b
61. Ismail K, Maissi E, Thomas S, Chalder T, Schmidt U, Bartlett J, et al. A randomised controlled trialof cognitive–behavioural therapy and motivational interviewing for people with Type 1 diabetesmellitus with persistent sub-optimal glycaemic control: a Diabetes and Psychological Therapies(ADaPT) study. Health Technol Assess 2010;14(22). https://doi.org/10.3310/hta14220
62. Anton RF, O’Malley SS, Ciraulo DA, Cisler RA, Couper D, Donovan DM, et al. Combinedpharmacotherapies and behavioral interventions for alcohol dependence: the COMBINE study:a randomized controlled trial. JAMA 2006;295:2003–17. https://doi.org/10.1001/jama.295.17.2003
63. Department of Health and Social Care (DHSC). Choosing Health: Making Healthy Choices Easier.London: DHSC; 2004.
64. South J, Woodward J, Lowcock D. New beginnings: stakeholder perspectives on the role of healthtrainers. J R Soc Promot Health 2007;127:224–30. https://doi.org/10.1177/1466424007081791
65. Lhussier M, Carr SM. Health-related lifestyle advice: critical insights. Crit Public Health2008;18:299–309. https://doi.org/10.1080/09581590802225738
66. Visram S, Carr SM, Geddes L. Can lay health trainers increase uptake of NHS Health Checks inhard-to-reach populations? A mixed-method pilot evaluation. J Public Health 2015;37:226–33.https://doi.org/10.1093/pubmed/fdu041
67. Carr SM, Lhussier M, Forster N, Geddes L, Deane K, Pennington M, et al. An evidence synthesisof qualitative and quantitative research on component intervention techniques, effectiveness,cost-effectiveness, equity and acceptability of different versions of health-related lifestyle advisorrole in improving health. Health Technol Assess 2011;15(9). https://doi.org/10.3310/hta15090
68. Attree P, Clayton S, Karunanithi S, Nayak S, Popay J, Read D. NHS health trainers: a review ofemerging evaluation evidence. Crit Public Health 2012;22:25–38. https://doi.org/10.1080/09581596.2010.549207
69. Gidlow CJ, Cochrane T, Davey R, Beloe M, Chambers R, Kumar J, et al. One-year cardiovascularrisk and quality of life changes in participants of a health trainer service. Perspect Public Health2014;134:135–44. https://doi.org/10.1177/1757913913484419
70. Bayley A, de Zoysa N, Cook DG, Whincup PH, Stahl D, Twist K, et al. Comparing the effectivenessof an enhanced MOtiVational intErviewing InTervention (MOVE IT) with usual care for reducingcardiovascular risk in high risk subjects: study protocol for a randomised controlled trial. Trials2015;16:112. https://doi.org/10.1186/s13063-015-0593-5
71. Office for National Statistics (ONS). Census 2011. Newport ONS; 2011. URL: www.ons.gov.uk/census/2011censuspages/1b.asp (accessed 5 May 2017).
72. Collins GS, Altman DG. Predicting the 10 year risk of cardiovascular disease in the United Kingdom:independent and external validation of an updated version of QRISK2. BMJ 2012;344:e4181.https://doi.org/10.1136/bmj.e4181
73. Morgan PJ, Lubans DR, Collins CE, Warren JM, Callister R. The SHED-IT randomized controlledtrial: evaluation of an internet-based weight-loss program for men. Obesity 2009;17:2025–32.https://doi.org/10.1038/oby.2009.85
DOI: 10.3310/hta23690 HEALTH TECHNOLOGY ASSESSMENT 2019 VOL. 23 NO. 69
© Queen’s Printer and Controller of HMSO 2019. This work was produced by Ismail et al. under the terms of a commissioning contract issued by the Secretary of State for Healthand Social Care. This issue may be freely reproduced for the purposes of private research and study and extracts (or indeed, the full report) may be included in professionaljournals provided that suitable acknowledgement is made and the reproduction is not associated with any form of advertising. Applications for commercial reproduction shouldbe addressed to: NIHR Journals Library, National Institute for Health Research, Evaluation, Trials and Studies Coordinating Centre, Alpha House, University of Southampton SciencePark, Southampton SO16 7NS, UK.
109
74. Rose G. Sick individuals and sick populations. Int J Epidemiol 2001;30:427–32. https://doi.org/10.1093/ije/30.3.427
75. Batistatou E, Roberts C, Roberts S. Sample size and power calculations for trials andquasi-experimental studies with clustering. Stata J 2014;14:159–75. https://doi.org/10.1177/1536867X1401400111
76. Ministry of Housing, Communities and Local Government. English Indices of Deprivation 2010.GOV.UK; 2011. URL: www.gov.uk/government/statistics/english-indices-of-deprivation-2010(accessed 1 November 2017).
77. Noble M, Wright G, Smith G, Dibben C. Measuring multiple deprivation at the small-area level.Environ Plann A 2006;38:169–85. https://doi.org/10.1068/a37168
78. Davis TC, Crouch MA, Long SW, Jackson RH, Bates P, George RB, Bairnsfather LE. Rapidassessment of literacy levels of adult primary care patients. Fam Med 1991;23:433–5.
79. Plasqui G, Westerterp KR. Physical activity assessment with accelerometers: an evaluation againstdoubly labeled water. Obesity 2007;15:2371–9. https://doi.org/10.1038/oby.2007.281
80. Mâsse LC, Fuemmeler BF, Anderson CB, Matthews CE, Trost SG, Catellier DJ, Treuth M.Accelerometer data reduction: a comparison of four reduction algorithms on select outcomevariables. Med Sci Sports Exerc 2005;37(Suppl. 11):544–54. https://doi.org/10.1249/01.mss.0000185674.09066.8a
81. Armstrong T, Bull F. Development of the world health organization global physical activity questionnaire(GPAQ). J Public Health-UK 2006;14:66–70. https://doi.org/10.1007/s10389-006-0024-x
82. Saunders JB, Aasland OG, Babor TF, de la Fuente JR, Grant M. Development of the Alcohol UseDisorders Identification Test (AUDIT): WHO Collaborative Project on Early Detection of Personswith Harmful Alcohol Consumption – II. Addiction 1993;88:791–804. https://doi.org/10.1111/j.1360-0443.1993.tb02093.x
83. Nelson M, Haraldsdóttir J. Food photographs: practical guidelines I. Design and analysis of studiesto validate portion size estimates. Public Health Nutr 1998;1:219–30. https://doi.org/10.1079/PHN19980038
84. Welch AA, Luben R, Khaw KT, Bingham SA. The CAFE computer program for nutritional analysisof the EPIC-Norfolk food frequency questionnaire and identification of extreme nutrient values.J Hum Nutr Diet 2005;18:99–116. https://doi.org/10.1111/j.1365-277X.2005.00593.x
85. Spitzer RL, Kroenke K, Williams JB. Validation and utility of a self-report version of PRIME-MD: thePHQ primary care study. JAMA 1999;282:1737–44. https://doi.org/10.1001/jama.282.18.1737
86. Frasure-Smith N, Lespérance F, Talajic M. Depression following myocardial infarction. Impact on6-month survival. JAMA 1993;270:1819–25. https://doi.org/10.1001/jama.1993.03510150053029
87. Broadbent E, Petrie KJ, Main J, Weinman J. The Brief Illness Perception Questionnaire.J Psychosom Res 2006;60:631–7. https://doi.org/10.1016/j.jpsychores.2005.10.020
88. Resnick B, Jenkins LS. Testing the reliability and validity of the Self-Efficacy for Exercise scale.Nurs Res 2000;49:154–9. https://doi.org/10.1097/00006199-200005000-00007
89. Rabin R, Gudex C, Selai C, Herdman M. From translation to version management: a history andreview of methods for the cultural adaptation of the EuroQol five-dimensional questionnaire.Value Health 2014;17:70–6. https://doi.org/10.1016/j.jval.2013.10.006
90. Chisholm D, Knapp MRJ, Knudsen HC, Amaddeo F, Gaite L, Van Wijngaarden B. Client Socio-Demographic and Service Receipt Inventory-European Version: development of an instrument forinternational research. Br J Psychiatry 2000;177:s28–33. https://doi.org/10.1192/bjp.177.39.s28
REFERENCES
NIHR Journals Library www.journalslibrary.nihr.ac.uk
110
91. Hobbis ICA, Sutton S. Are techniques used in cognitive–behavioural therapy applicable tobehaviour change interventions based on the theory of planned behaviour? J Health Psychol2005;10:7–18. https://doi.org/10.1177/1359105305048549
92. Bandura A. Social Foundation of Thought and Action: A Social Cognitive Theory. Prentice-Hall, Inc:Englewood Cliffs, NJ; 1986.
93. Varley R, Webb TL, Sheeran P. Making self-help more helpful: a randomized controlled trial ofthe impact of augmenting self-help materials with implementation intentions on promotingthe effective self-management of anxiety symptoms. J Consult Clin Psychol 2011;79:123–8.https://doi.org/10.1037/a0021889
94. Miller WR, Moyers TB, Arciniega L, Ernst D, Forcehimes A. Training, supervision and qualitymonitoring of the COMBINE Study behavioral interventions. J Stud Alcohol Suppl2005;15:188–95. https://doi.org/10.15288/jsas.2005.s15.188
95. Michie S, Churchill S, West R. Indentifying evidence-based competencies required to deliverbehavioural support for smoking cessation. Ann Behav Med 2011;41:59–70. https://doi.org/10.1007/s12160-010-9235-z
96. Dixon D, Johnston M. Health Behaviour Change Competency Framework: Competences to DeliverInterventions to Change Lifestyle Behaviours that Affect Health. NHS Health Scotland; 2010. URL:www.healthscotland.com/uploads/documents/14543-HBCC_framework1.pdf (accessed 21 July 2017).
97. Moyers TB, Martin T, Manuel JK, Miller W, Ernst D. Revised Global Scales: MotivationalInterviewing Treatment Integrity 3.1.1 (MITI 3.1.1). 2010. URL: https://casaa.unm.edu/download/miti3_1.pdf (accessed 1 November 2017).
98. Williams A. The Role of the EuroQol Instrument in QALY Calculations. York: University of YorkCentre for Health Economics; 1995.
99. Beecham J, Knapp M. Costing Psychiatric Interventions: London: Gaskell; 2001.
100. Curtis L. Unit Costs of Health and Social Care. Canterbury: Personal Social Services Research Unit,University of Kent; 2012.
101. Campbell MK, Elbourne DR, Altman DG, CONSORT group. CONSORT statement: extension tocluster randomised trials. BMJ 2004;328:702–8. https://doi.org/10.1136/bmj.328.7441.702
102. Bauer DJ, Sterba SK, Hallfors DD. Evaluating group-based interventions when control participants areungrouped. Multivariate Behav Res 2008;43:210–36. https://doi.org/10.1080/00273170802034810
103. Schafer JL. Analysis of Incomplete Multivariate Data. CRC Press: Boca Raton, FL; 1997.https://doi.org/10.1201/9781439821862
104. Gaughran F, Stahl D, Ismail K, Greenwood K, Atakan Z, Gardner-Sood P, et al. Randomisedcontrol trial of the effectiveness of an integrated psychosocial health promotion interventionaimed at improving health and reducing substance use in established psychosis (IMPaCT).BMC Psychiatry 2017;17:413. https://doi.org/10.1186/s12888-017-1571-0
105. Ismail K, Winkley K, De Zoysa N, Patel A, Heslin M, Graves H, et al. Nurse-led psychologicalintervention for type 2 diabetes: a cluster randomised controlled trial (Diabetes-6 study) in primarycare. Br J Gen Pract 2018;68:e531–e540. https://doi.org/10.3399/bjgp18X696185
106. Villareal DT, Chode S, Parimi N, Sinacore DR, Hilton T, Armamento-Villareal R, et al. Weight loss,exercise, or both and physical function in obese older adults. Obstet Gynecol Surv 2011;66:488–9.https://doi.org/10.1097/OGX.0b013e3182352181
107. Herbert A, Wijlaars L, Zylbersztejn A, Cromwell D, Hardelid P. Data resource profile: HospitalEpisode Statistics Admitted Patient Care (HES APC). Int J Epidemiol 2017;46:1093–1093i.https://doi.org/10.1093/ije/dyx015
DOI: 10.3310/hta23690 HEALTH TECHNOLOGY ASSESSMENT 2019 VOL. 23 NO. 69
© Queen’s Printer and Controller of HMSO 2019. This work was produced by Ismail et al. under the terms of a commissioning contract issued by the Secretary of State for Healthand Social Care. This issue may be freely reproduced for the purposes of private research and study and extracts (or indeed, the full report) may be included in professionaljournals provided that suitable acknowledgement is made and the reproduction is not associated with any form of advertising. Applications for commercial reproduction shouldbe addressed to: NIHR Journals Library, National Institute for Health Research, Evaluation, Trials and Studies Coordinating Centre, Alpha House, University of Southampton SciencePark, Southampton SO16 7NS, UK.
111
108. Public Health England. National General Practice Profiles. London: Public Health England; 2016.URL: https://fingertips.phe.org.uk/profile/general-practice (accessed 21 July 2017).
109. Stuart-Buttle C, Read J, Sanderson H, Sutton Y. A language of health in action: Read codes,classifications and groupings. Proc AMIA Annu Fall Symp 1996:75–9.
110. Ismail K, Bayley A, Twist K, Stewart K, Ridge K, Britneff E, et al. Reducing weight and increasingphysical activity in people at high risk of cardiovascular disease: a randomised controlled trialcomparing the effectiveness of enhanced motivational interviewing intervention with usual care[published online ahead of print December 12 2019]. Heart 2019. https://doi.org/10.1136/heartjnl-2019-315656
111. Ministry of Housing, Communities and Local Government. English Indices of Deprivation 2015.GOV.UK; 2015. URL: www.gov.uk/government/statistics/english-indices-of-deprivation-2015(accessed 1 November 2017).
112. Rogers A, Harris T, Victor C, Woodcock A, Limb E, Kerry S, et al. Which older people declineparticipation in a primary care trial of physical activity and why: insights from a mixed methodsapproach. BMC Geriatr 2014;14:46. https://doi.org/10.1186/1471-2318-14-46
113. Tully MA, Cupples ME, Chan WS, McGlade K, Young IS. Brisk walking, fitness, and cardiovascularrisk: a randomized controlled trial in primary care. Prev Med 2005;41:622–8. https://doi.org/10.1016/j.ypmed.2004.11.030
114. Foster CE, Brennan G, Matthews A, McAdam C, Fitzsimons C, Mutrie N. Recruiting participantsto walking intervention studies: a systematic review. Int J Behav Nutr Phys Act 2011;8:137.https://doi.org/10.1186/1479-5868-8-137
115. Go AS, Mozaffarian D, Roger VL, Benjamin EJ, Berry JD, Blaha MJ, et al. Executive summary:heart disease and stroke statistics – 2014 update: a report from the American Heart Association.Circulation 2014;129:399–410. https://doi.org/10.1161/01.cir.0000442015.53336.12
116. Ives DG, Traven ND, Kuller LH, Schulz R. Selection bias and nonresponse to health promotion inolder adults. Epidemiology 1994;5:456–61. https://doi.org/10.1097/00001648-199407000-00013
117. Harris TJ, Victor CR, Carey IM, Adams R, Cook DG. Less healthy, but more active: opposingselection biases when recruiting older people to a physical activity study through primary care.BMC Public Health 2008;8:182. https://doi.org/10.1186/1471-2458-8-182
118. Groeneveld IF, Proper KI, van der Beek AJ, Hildebrandt VH, van Mechelen W. Factors associatedwith non-participation and drop-out in a lifestyle intervention for workers with an elevated risk ofcardiovascular disease. Int J Behav Nutr Phys Act 2009;6:80. https://doi.org/10.1186/1479-5868-6-80
119. van Heuvelen MJ, Hochstenbach JB, Brouwer WH, de Greef MH, Zijlstra GA, van Jaarsveld E,et al. Differences between participants and non-participants in an RCT on physical activity andpsychological interventions for older persons. Aging Clin Exp Res 2005;17:236–45. https://doi.org/10.1007/BF03324603
120. Golomb BA, Chan VT, Evans MA, Koperski S, White HL, Criqui MH. The older the better: are elderlystudy participants more non-representative? A cross-sectional analysis of clinical trial and observationalstudy samples. BMJ Open 2012;2:e000833. https://doi.org/10.1136/bmjopen-2012-000833
121. Forsberg L, Berman AH, Kallmén H, Hermansson U, Helgason AR. A test of the validity ofthe Motivational Interviewing Treatment Integrity code. Cogn Behav Ther 2008;37:183–91.https://doi.org/10.1080/16506070802091171
122. Martin T, Christopher PJ, Houck JM, Moyers TB. The structure of client language and drinkingoutcomes in project match. Psychol Addict Behav 2011;25:439–45. https://doi.org/10.1037/a0023129
REFERENCES
NIHR Journals Library www.journalslibrary.nihr.ac.uk
112
123. Moyers TB, Martin T, Manuel JK, Hendrickson SM, Miller WR. Assessing competence in theuse of motivational interviewing. J Subst Abuse Treat 2005;28:19–26. https://doi.org/10.1016/j.jsat.2004.11.001
124. Cicchetti DV, Sparrow SA. Developing criteria for establishing interrater reliability of specific items:applications to assessment of adaptive behavior. Am J Ment Defic 1981;86:127–37.
125. Oakley A, Strange V, Bonell C, Allen E, Stephenson J, RIPPLE Study Team. Process evaluation inrandomised controlled trials of complex interventions. BMJ 2006;332:413–16. https://doi.org/10.1136/bmj.332.7538.413
126. Lewin S, Glenton C, Oxman AD. Use of qualitative methods alongside randomised controlledtrials of complex healthcare interventions: methodological study. BMJ 2009;339:b3496.https://doi.org/10.1136/bmj.b3496
127. Hotham ED, Atkinson ER, Gilbert AL. Focus groups with pregnant smokers: barriers to cessation,attitudes to nicotine patch use and perceptions of cessation counselling by care providers.Drug Alcohol Rev 2002;21:163–8. https://doi.org/10.1080/09595230220139064
128. Paterson C, Zheng Z, Xue C, Wang Y. ‘Playing their parts’: the experiences of participants in arandomized sham-controlled acupuncture trial. J Altern Complement Med 2008;14:199–208.https://doi.org/10.1089/acm.2007.0682
129. Tonnon SC, Proper KI, van der Ploeg HP, Westerman MJ, Sijbesma E, van der Beek AJ. Aqualitative study of the anticipated barriers and facilitators to the implementation of a lifestyleintervention in the Dutch construction industry. BMC Public Health 2014;14:1317. https://doi.org/10.1186/1471-2458-14-1317
130. Zhang X, Devlin HM, Smith B, Imperatore G, Thomas W, Lobelo F, et al. Effect of lifestyleinterventions on cardiovascular risk factors among adults without impaired glucose tolerance ordiabetes: a systematic review and meta-analysis. PLOS ONE 2017;12:e0176436. https://doi.org/10.1371/journal.pone.0176436
131. Britt E, Hudson SM, Blampied NM. Motivational interviewing in health settings: a review.Patient Educ Couns 2004;53:147–55. https://doi.org/10.1016/S0738-3991(03)00141-1
132. Burke BL, Dunn CW, Atkins DC, Phelps JS. The emerging evidence base for motivationalinterviewing: a meta-analytic and qualitative inquiry. J Cogn Psychother 2004;18:309–22.https://doi.org/10.1891/jcop.18.4.309.64002
133. Braun V, Clarke V. Using thematic analysis in psychology. Qual Res Psychol 2006;3:77–101.https://doi.org/10.1191/1478088706qp063oa
134. Miller WR, Moyers TB. Eight stages in learning motivational interviewing. J Teaching Addict2006;5:3–17. https://doi.org/10.1300/J188v05n01_02
135. Madson MB, Loignon AC, Lane C. Training in motivational interviewing: a systematic review.J Subst Abuse Treat 2009;36:101–9. https://doi.org/10.1016/j.jsat.2008.05.005
136. Brobeck E, Bergh H, Odencrants S, Hildingh C. Primary healthcare nurses’ experiences withmotivational interviewing in health promotion practice. J Clin Nurs 2011;20:3322–30.https://doi.org/10.1111/j.1365-2702.2011.03874.x
137. Östlund AS, Wadensten B, Kristofferzon ML, Häggström E. Motivational interviewing: experiencesof primary care nurses trained in the method. Nurse Educ Pract 2015;15:111–18. https://doi.org/10.1016/j.nepr.2014.11.005
138. van Eijk-Hustings YJ, Daemen L, Schaper NC, Vrijhoef HJ. Implementation of MotivationalInterviewing in a diabetes care management initiative in the Netherlands. Patient Educ Couns2011;84:10–15. https://doi.org/10.1016/j.pec.2010.06.016
DOI: 10.3310/hta23690 HEALTH TECHNOLOGY ASSESSMENT 2019 VOL. 23 NO. 69
© Queen’s Printer and Controller of HMSO 2019. This work was produced by Ismail et al. under the terms of a commissioning contract issued by the Secretary of State for Healthand Social Care. This issue may be freely reproduced for the purposes of private research and study and extracts (or indeed, the full report) may be included in professionaljournals provided that suitable acknowledgement is made and the reproduction is not associated with any form of advertising. Applications for commercial reproduction shouldbe addressed to: NIHR Journals Library, National Institute for Health Research, Evaluation, Trials and Studies Coordinating Centre, Alpha House, University of Southampton SciencePark, Southampton SO16 7NS, UK.
113
139. Hirdle J, Vaughan T. Exploring the impact of motivational interviewing training for qualified healthvisitors. Community Pract 2016;89:38–42.
140. Maissi E, Ridge K, Treasure J, Chalder T, Roche S, Bartlett J, et al. Nurse-led psychologicalinterventions to improve diabetes control: assessing competencies. Patient Educ Couns2011;84:e37–43. https://doi.org/10.1016/j.pec.2010.07.036
141. Graves H, Garrett C, Amiel SA, Ismail K, Winkley K. Psychological skills training to supportdiabetes self-management: qualitative assessment of nurses’ experiences. Prim Care Diabetes2016;10:376–82. https://doi.org/10.1016/j.pcd.2016.03.001
142. Moore GF, Audrey S, Barker M, Bond L, Bonell C, Hardeman W, et al. Process evaluation ofcomplex interventions: Medical Research Council guidance. BMJ 2015;350:h1258. https://doi.org/10.1136/bmj.h1258
143. Schrack JA, Cooper R, Koster A, Shiroma EJ, Murabito JM, Rejeski WJ, et al. Assessing dailyphysical activity in older adults: unraveling the complexity of monitors, measures, and methods.J Gerontol A Biol Sci Med Sci 2016;71:1039–48. https://doi.org/10.1093/gerona/glw026
144. Roth MA, Mindell JS. Who provides accelerometry data? Correlates of adherence to wearingan accelerometry motion sensor: the 2008 Health Survey for England. J Phys Act Health2013;10:70–8. https://doi.org/10.1123/jpah.10.1.70
145. Hart TL, Swartz AM, Cashin SE, Strath SJ. How many days of monitoring predict physical activityand sedentary behaviour in older adults? Int J Behav Nutr Phys Act 2011;8:62. https://doi.org/10.1186/1479-5868-8-62
146. British Heart Foundation. CVD Statistics – BHF UK Factsheet. 2018. URL: www.bhf.org.uk/what-we-do/our-research/heart-statistics (accessed 1 November 2017).
147. Goldberg RW, Seybolt DC, Lehman A. Reliable self-report of health service use by individuals withserious mental illness. Psychiatr Serv 2002;53:879–81. https://doi.org/10.1176/appi.ps.53.7.879
148. Calsyn RJ, Allen G, Morse GA, Smith R, Tempelhoff B. Can you trust self-report data provided byhomeless mentally ill individuals? Eval Rev 1993;17:353–66. https://doi.org/10.1177/0193841X9301700306
149. van Staa TP, Gulliford M, Ng ES, Goldacre B, Smeeth L. Prediction of cardiovascular risk usingFramingham, ASSIGN and QRISK2: how well do they predict individual rather than populationrisk? PLOS ONE 2014;9:e106455. https://doi.org/10.1371/journal.pone.0106455
150. Tudor-Locke C, Bassett DR. How many steps/day are enough? Sports Med 2004;34:1–8.https://doi.org/10.2165/00007256-200434010-00001
151. Hobbs N, Godfrey A, Lara J, Errington L, Meyer TD, Rochester L, et al. Are behavioral interventionseffective in increasing physical activity at 12 to 36 months in adults aged 55 to 70 years? Asystematic review and meta-analysis. BMC Med 2013;11:75. https://doi.org/10.1186/1741-7015-11-75
152. Bakrania K, Yates T, Edwardson CL, Bodicoat DH, Esliger DW, Gill JM, et al. Associations ofmoderate-to-vigorous-intensity physical activity and body mass index with glycated haemoglobinwithin the general population: a cross-sectional analysis of the 2008 Health Survey for England.BMJ Open 2017;7:e014456. https://doi.org/10.1136/bmjopen-2016-014456
153. Pedisic Z, Bauman A. Accelerometer-based measures in physical activity surveillance: currentpractices and issues. Br J Sports Med 2015;49:219–23. https://doi.org/10.1136/bjsports-2013-093407
REFERENCES
NIHR Journals Library www.journalslibrary.nihr.ac.uk
114
154. Hankonen N, Sutton S, Prevost AT, Simmons RK, Griffin SJ, Kinmonth AL, Hardeman W. Whichbehavior change techniques are associated with changes in physical activity, diet and body massindex in people with recently diagnosed diabetes? Ann Behav Med 2015;49:7–17. https://doi.org/10.1007/s12160-014-9624-9
155. Bauman A, Pedisic Z, Bragg K. Objective Measurement in Physical Activity Surveillance: Present Roleand Future Potential. In Shephard RJ, Tudor-Locke C, editors. The Objective Monitoring of PhysicalActivity: Contributions of Accelerometry to Epidemiology, Exercise Science and Rehabilitation. Berlin:Springer; 2016. pp. 347–67. https://doi.org/10.1007/978-3-319-29577-0_13
156. Paul L, Brewster S, Wyke S, McFadyen AK, Sattar N, Gill JM, et al. Increasing physical activity inolder adults using STARFISH, an interactive smartphone application (app); a pilot study. J RehabilAssist Technol Eng 2017;4:2055668317696236. https://doi.org/10.1177/2055668317696236
157. Pan XR, Li GW, Hu YH, Wang JX, Yang WY, An ZX, et al. Effects of diet and exercise inpreventing NIDDM in people with impaired glucose tolerance. The Da Qing IGT and DiabetesStudy. Diabetes Care 1997;20:537–44. https://doi.org/10.2337/diacare.20.4.537
158. Tuomilehto J, Lindström J, Eriksson JG, Valle TT, Hämäläinen H, Ilanne-Parikka P, et al. Preventionof type 2 diabetes mellitus by changes in lifestyle among subjects with impaired glucosetolerance. N Engl J Med 2001;344:1343–50. https://doi.org/10.1056/NEJM200105033441801
159. Diabetes Prevention Program Research Group. Reduction in the incidence of type 2 diabetes withlifestyle intervention or metformin. N Engl J Med 2002;346:393403.
160. Ahern AL, Wheeler GM, Aveyard P, Boyland EJ, Halford JCG, Mander AP, et al. Extended andstandard duration weight-loss programme referrals for adults in primary care (WRAP): arandomised controlled trial. Lancet 2017;389:2214–25. https://doi.org/10.1016/S0140-6736(17)30647-5
161. Lean ME, Leslie WS, Barnes AC, Brosnahan N, Thom G, McCombie L, et al. Primary care-ledweight management for remission of type 2 diabetes (DiRECT): an open-label, cluster-randomisedtrial. Lancet 2018;391:541–51. https://doi.org/10.1016/S0140-6736(17)33102-1
162. Welch G, Zagarins SE, Feinberg RG, Garb JL. Motivational interviewing delivered by diabeteseducators: does it improve blood glucose control among poorly controlled type 2 diabetespatients? Diabetes Res Clin Pr 2011;91:54–60. https://doi.org/10.1016/j.diabres.2010.09.036
163. Waker CL. The Effects of Motivational Interviewing on Diabetes Self-Management Behaviors andGlycemic Control in Type 2 Diabetes: A Translational Study. Cincinnati, OH: University ofCincinnati; 2012.
164. Harris T, Kerry SM, Limb ES, Furness C, Wahlich C, Victor CR, et al. Physical activity levels in adultsand older adults 3-4 years after pedometer-based walking interventions: long-term follow-upof participants from two randomised controlled trials in UK primary care. PLOS Med2018;15:e1002526. https://doi.org/10.1371/journal.pmed.1002526
165. Ingersoll K. Rating the fidelity of MI groups sessions: the AMIGOS coding system, bridging thegap between MI practice, evaluation and research. Fourth International Conference onMotivational Interviewing, Amsterdam, 16–18 June 2014, abstract no. 167.
DOI: 10.3310/hta23690 HEALTH TECHNOLOGY ASSESSMENT 2019 VOL. 23 NO. 69
© Queen’s Printer and Controller of HMSO 2019. This work was produced by Ismail et al. under the terms of a commissioning contract issued by the Secretary of State for Healthand Social Care. This issue may be freely reproduced for the purposes of private research and study and extracts (or indeed, the full report) may be included in professionaljournals provided that suitable acknowledgement is made and the reproduction is not associated with any form of advertising. Applications for commercial reproduction shouldbe addressed to: NIHR Journals Library, National Institute for Health Research, Evaluation, Trials and Studies Coordinating Centre, Alpha House, University of Southampton SciencePark, Southampton SO16 7NS, UK.
115

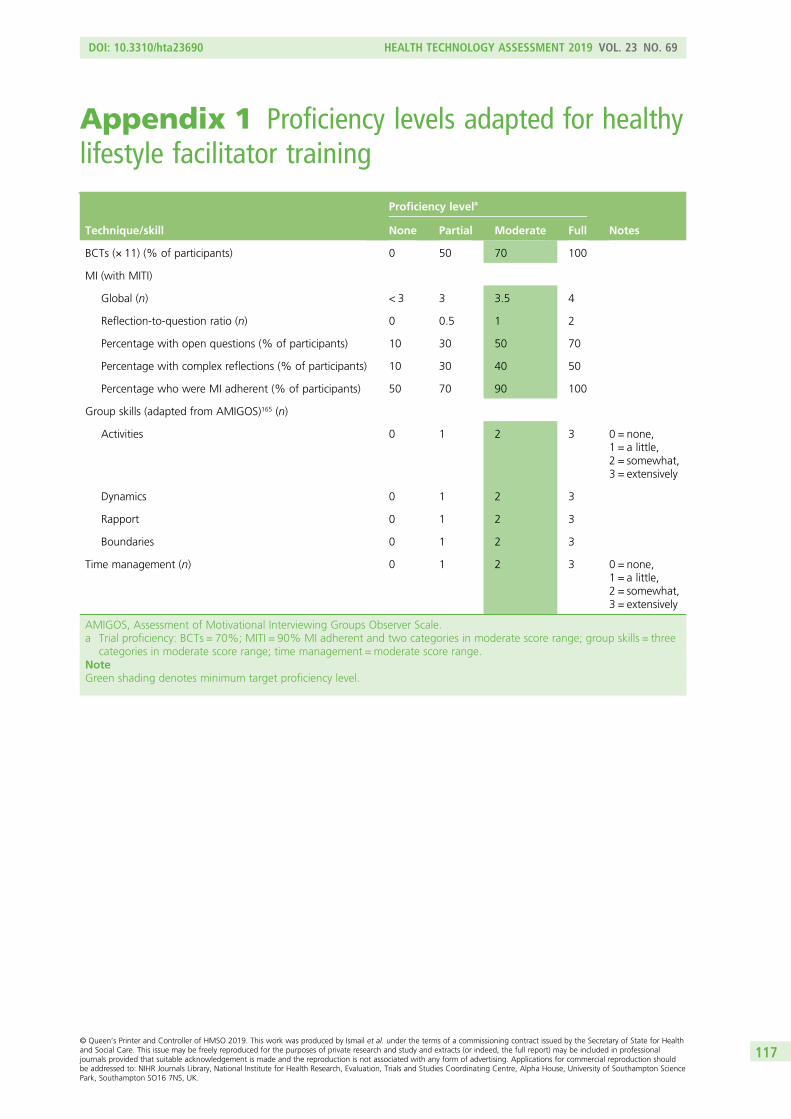
Appendix 1 Proficiency levels adapted for healthylifestyle facilitator training
Technique/skill
Proficiency levela
NotesNone Partial Moderate Full
BCTs (× 11) (% of participants) 0 50 70 100
MI (with MITI)
Global (n) < 3 3 3.5 4
Reflection-to-question ratio (n) 0 0.5 1 2
Percentage with open questions (% of participants) 10 30 50 70
Percentage with complex reflections (% of participants) 10 30 40 50
Percentage who were MI adherent (% of participants) 50 70 90 100
Group skills (adapted from AMIGOS)165 (n)
Activities 0 1 2 3 0 = none,1 = a little,2 = somewhat,3 = extensively
Dynamics 0 1 2 3
Rapport 0 1 2 3
Boundaries 0 1 2 3
Time management (n) 0 1 2 3 0 = none,1 = a little,2 = somewhat,3 = extensively
AMIGOS, Assessment of Motivational Interviewing Groups Observer Scale.a Trial proficiency: BCTs = 70%; MITI = 90% MI adherent and two categories in moderate score range; group skills = three
categories in moderate score range; time management = moderate score range.NoteGreen shading denotes minimum target proficiency level.
DOI: 10.3310/hta23690 HEALTH TECHNOLOGY ASSESSMENT 2019 VOL. 23 NO. 69
© Queen’s Printer and Controller of HMSO 2019. This work was produced by Ismail et al. under the terms of a commissioning contract issued by the Secretary of State for Healthand Social Care. This issue may be freely reproduced for the purposes of private research and study and extracts (or indeed, the full report) may be included in professionaljournals provided that suitable acknowledgement is made and the reproduction is not associated with any form of advertising. Applications for commercial reproduction shouldbe addressed to: NIHR Journals Library, National Institute for Health Research, Evaluation, Trials and Studies Coordinating Centre, Alpha House, University of Southampton SciencePark, Southampton SO16 7NS, UK.
117


Appendix 2 List of participating general practices
DOI: 10.3310/hta23690 HEALTH TECHNOLOGY ASSESSMENT 2019 VOL. 23 NO. 69
© Queen’s Printer and Controller of HMSO 2019. This work was produced by Ismail et al. under the terms of a commissioning contract issued by the Secretary of State for Healthand Social Care. This issue may be freely reproduced for the purposes of private research and study and extracts (or indeed, the full report) may be included in professionaljournals provided that suitable acknowledgement is made and the reproduction is not associated with any form of advertising. Applications for commercial reproduction shouldbe addressed to: NIHR Journals Library, National Institute for Health Research, Evaluation, Trials and Studies Coordinating Centre, Alpha House, University of Southampton SciencePark, Southampton SO16 7NS, UK.
119
TABLE 39 List of participating general practices
CCG and generalpractice name
Generalpracticecode
Date when thefirst participantwas recruited
List size on1 April 2013
Number ofpatients aged40–74 years
Generalpractice IMD2010 score76
Anonymisedsearch saveda
Number ofpotentiallyeligible patientsinvited
Number of patients
Whorespondedb
Whoconsented Randomised
Bexley
Good Health G83630 4 December 2013 5807 1836 30.20 No 63 12 11 4
Ingleton AvenueSurgery
G83024 20 September 2013 5038 2110 11.00 No 87 23 21 18
Lakeside MedicalPractice
G83018 8 July 2013 15,320 5253 33.50 Yes 335 38 34 15
Lyndhurst RoadMedical Centre
G83049 3 April 2014 7943 3600 14.30 No 70 – 13 5
Plas Meddyg Surgery G83029 7 October 2013 7220 3188 7.77 No 111 36 34 28
Slade Green MedicalCentre
G83062 2 August 2013 6521 2315 29.70 No 107 14 4 2
The Westwood Surgery G83002 5 August 2013 7770 3191 10.90 No 157 40 22 10
Welling MedicalPractice
G83025 5 August 2013 13,368 5984 15.00 No 85 35 17 7
Woodlands Surgery G83057 14 August 2013 10,424 4749 11.30 No 158 47 21 14
Bromley
Ballater Surgery G84040 21 August 2014 6685 2890 11.50 Yes 138 – 31 21
Bromley CommonPractice
G84024 2 December 2013 7814 3031 14.50 No 29 5 4 2
Broomwood RoadSurgery
G84019 27 August 2013 9978 3923 32.90 No 107 – 42 17
Charterhouse Surgery G84021 9 July 2013 9127 4374 8.37 Yes 150 – 49 30
Chelsfield Surgery G84020 18 July 2013 7552 3591 8.91 No 211 51 61 27
Cornerways Surgery G84018 24 June 2014 8531 3810 9.61 No 179 46 42 30
Derry Downs Surgery G84005 21 January 2014 5630 2440 26.50 No 110 35 27 15
APPEN
DIX
2
NIHRJournals
Librarywww.journalslibrary.nihr.ac.uk
120
CCG and generalpractice name
Generalpracticecode
Date when thefirst participantwas recruited
List size on1 April 2013
Number ofpatients aged40–74 years
Generalpractice IMD2010 score76
Anonymisedsearch saveda
Number ofpotentiallyeligible patientsinvited
Number of patients
Whorespondedb
Whoconsented Randomised
Eden Park Surgery G84011 9 October 2013 8180 3609 11.80 No 171 31 45 24
Forge Close Surgery G84030 2 April 2014 6563 3002 6.87 Yes 113 27 32 19
Links Medical Practice G84003 27 August 2013 10,638 3974 30.60 Yes 221 23 33 14
London Lane Clinic G84016 7 August 2013 15,558 6699 15.00 No 304 20 72 47
Park Group Practice G84025 1 August 2013 8147 2983 30.10 No 126 16 15 8
Pickhurst Surgery G84033 12 December 2013 6786 3106 6.82 Yes 180 44 56 28
Poverest MedicalCentre
G84007 25 September 2013 9141 3791 23.40 Yes 199 34 53 32
Robin Hood Surgery G84029 27 February 2014 5725 2541 27.20 Yes 93 14 14 6
South View Partnership G84001 20 March 2014 6114 2647 11.70 No 195 51 69 45
Station Road Surgery G84015 23 July 2013 12,572 5873 7.80 Yes 100 – 79 47
Stock Hill Surgery G84004 31 July 2013 11,241 5386 10.40 Yes 323 – 92 55
Sundridge MedicalCentre
G84629 16 December 2013 5066 1844 16.80 Yes 112 18 15 10
Trinity Medical Centre G84022 28 July 2014 6006 2346 27.80 No 120 – 13 6
Tudor Way Surgery G84035 20 August 2014 7108 3076 7.76 No 63 – 10 8
Woodlands Practice Y00542 31 July 2014 9161 3812 19.80 Yes 202 – 31 19
continued
DOI:10.3310/hta23690
HEA
LTHTECH
NOLO
GYASSESSM
ENT2019
VOL.23
NO.69
©Queen
’sPrinter
andController
ofHMSO
2019.This
work
was
producedby
Ismailet
al.under
theterm
sof
acom
missioning
contractissued
bythe
Secretaryof
Statefor
Health
andSocialC
are.This
issuemay
befreely
reproducedfor
thepurposes
ofprivate
researchand
studyand
extracts(or
indeed,the
fullreport)may
beincluded
inprofessional
journalsprovided
thatsuitable
acknowledgem
entismade
andthe
reproductionisnot
associatedwith
anyform
ofadvertising.
Applications
forcom
mercialreproduction
shouldbe
addressedto:
NIHRJournals
Library,NationalInstitute
forHealth
Research,Evaluation,
Trialsand
StudiesCoordinating
Centre,
Alpha
House,
University
ofSoutham
ptonScience
Park,Southam
ptonSO
167N
S,UK.
121
TABLE 39 List of participating general practices (continued )
CCG and generalpractice name
Generalpracticecode
Date when thefirst participantwas recruited
List size on1 April 2013
Number ofpatients aged40–74 years
Generalpractice IMD2010 score76
Anonymisedsearch saveda
Number ofpotentiallyeligible patientsinvited
Number of patients
Whorespondedb
Whoconsented Randomised
Croydon
Brigstock FamilyPractice
H83608 21 June 2013 4211 1474 25.00 Yes 172 – 30 13
East Croydon MedicalCentre
H83044 18 November 2013 12,308 4189 17.90 Yes 287 – 63 30
Greenside MedicalPractice
H83631 16 August 2013 7833 2347 33.60 No 36 – 2 1
Keston MedicalPractice
H83016 30 January 2014 9406 3968 15.80 Yes 216 – 58 34
Leander Road Surgery H83042 25 June 2014 7035 2620 21.20 Yes 127 – 25 14
London Road MedicalPractice (CavendishHouse)
H83021 30 September 2014 5866 2240 28.10 Yes 114 – 12 6
Morland Road Surgery H83023 10 July 2013 6942 2638 23.00 Yes 193 – 24 15
Old Coulsdon MedicalPractice
H83013 27 January 2014 12,527 5526 13.20 Yes 237 – 58 32
Parchmore MedicalCentre
H83053 16 June 2014 13,878 5173 27.70 Yes 186 – 29 17
Parkside GroupPractice
H83015 2 April 2014 12,505 5020 15.40 Yes 206 – 43 31
Portland MedicalCentre
H83001 3 July 2013 12,829 4987 28.40 No 164 – 15 7
Selsdon Park MedicalPractice
H83018 22 July 2013 10,679 4759 13.10 Yes 258 – 42 23
Stovell House Surgery H83039 25 September 2013 7116 2973 18.50 Yes 250 – 61 31
Upper Norwood GroupPractice
H83005 12 September 2013 11,077 3981 27.40 No 35 – 10 5
APPEN
DIX
2
NIHRJournals
Librarywww.journalslibrary.nihr.ac.uk
122
CCG and generalpractice name
Generalpracticecode
Date when thefirst participantwas recruited
List size on1 April 2013
Number ofpatients aged40–74 years
Generalpractice IMD2010 score76
Anonymisedsearch saveda
Number ofpotentiallyeligible patientsinvited
Number of patients
Whorespondedb
Whoconsented Randomised
Greenwich
All Saints MedicalCentre
G83030 27 May 2014 5006 1945 36.70 No 93 22 18 11
Burney Street G83065 6 January 2015 13,146 3594 28.50 No 55 8 10 5
Coldharbour Hill G83003 14 November 2014 4098 1706 25.10 No 141 31 23 13
New Eltham G83628 27 June 2014 5788 2188 13.40 No 125 20 15 9
Glyndon G83060 13 November 2014 7014 2466 40.80 No 66 8 4 2
Manor Brook G83001 18 June 2014 12,590 4831 27.20 Yes 276 54 47 27
Mostafa G83647 17 June 2014 5701 2050 32.50 No 96 20 12 6
Plumstead HealthCentre
G83019 18 December 2014 5445 2400 30.50 No 89 10 7 4
Royal Arsenal MedicalCentre
G83016 3 June 2014 5823 2207 36.20 No 60 9 6 2
Sherard Road MedicalCentre
G83027 19 December 2014 9790 3828 31.30 No 171 6 5 3
St Mark’s G83039 26 June 2014 7325 2662 39.00 No 55 11 8 6
Tewson Road Practice G83007 25 June 2014 4972 2073 30.60 No 102 11 10 3
Vanbrugh GroupPractice
G83021 6 March 2014 9520 3349 26.20 No 174 24 16 10
Waverley G83635 6 November 2014 5253 2103 27.60 No 77 11 7 4
continued
DOI:10.3310/hta23690
HEA
LTHTECH
NOLO
GYASSESSM
ENT2019
VOL.23
NO.69
©Queen
’sPrinter
andController
ofHMSO
2019.This
work
was
producedby
Ismailet
al.under
theterm
sof
acom
missioning
contractissued
bythe
Secretaryof
Statefor
Health
andSocialC
are.This
issuemay
befreely
reproducedfor
thepurposes
ofprivate
researchand
studyand
extracts(or
indeed,the
fullreport)may
beincluded
inprofessional
journalsprovided
thatsuitable
acknowledgem
entismade
andthe
reproductionisnot
associatedwith
anyform
ofadvertising.
Applications
forcom
mercialreproduction
shouldbe
addressedto:
NIHRJournals
Library,NationalInstitute
forHealth
Research,Evaluation,
Trialsand
StudiesCoordinating
Centre,
Alpha
House,
University
ofSoutham
ptonScience
Park,Southam
ptonSO
167N
S,UK.
123
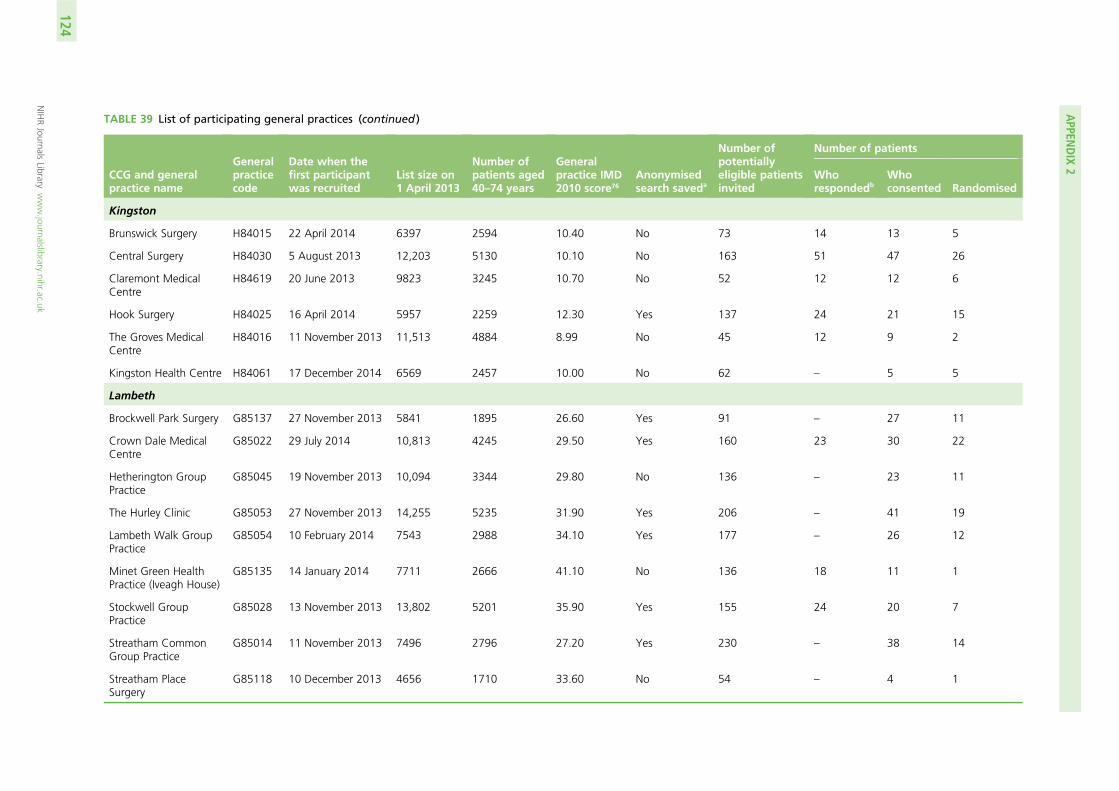
TABLE 39 List of participating general practices (continued )
CCG and generalpractice name
Generalpracticecode
Date when thefirst participantwas recruited
List size on1 April 2013
Number ofpatients aged40–74 years
Generalpractice IMD2010 score76
Anonymisedsearch saveda
Number ofpotentiallyeligible patientsinvited
Number of patients
Whorespondedb
Whoconsented Randomised
Kingston
Brunswick Surgery H84015 22 April 2014 6397 2594 10.40 No 73 14 13 5
Central Surgery H84030 5 August 2013 12,203 5130 10.10 No 163 51 47 26
Claremont MedicalCentre
H84619 20 June 2013 9823 3245 10.70 No 52 12 12 6
Hook Surgery H84025 16 April 2014 5957 2259 12.30 Yes 137 24 21 15
The Groves MedicalCentre
H84016 11 November 2013 11,513 4884 8.99 No 45 12 9 2
Kingston Health Centre H84061 17 December 2014 6569 2457 10.00 No 62 – 5 5
Lambeth
Brockwell Park Surgery G85137 27 November 2013 5841 1895 26.60 Yes 91 – 27 11
Crown Dale MedicalCentre
G85022 29 July 2014 10,813 4245 29.50 Yes 160 23 30 22
Hetherington GroupPractice
G85045 19 November 2013 10,094 3344 29.80 No 136 – 23 11
The Hurley Clinic G85053 27 November 2013 14,255 5235 31.90 Yes 206 – 41 19
Lambeth Walk GroupPractice
G85054 10 February 2014 7543 2988 34.10 Yes 177 – 26 12
Minet Green HealthPractice (Iveagh House)
G85135 14 January 2014 7711 2666 41.10 No 136 18 11 1
Stockwell GroupPractice
G85028 13 November 2013 13,802 5201 35.90 Yes 155 24 20 7
Streatham CommonGroup Practice
G85014 11 November 2013 7496 2796 27.20 Yes 230 – 38 14
Streatham PlaceSurgery
G85118 10 December 2013 4656 1710 33.60 No 54 – 4 1
APPEN
DIX
2
NIHRJournals
Librarywww.journalslibrary.nihr.ac.uk
124
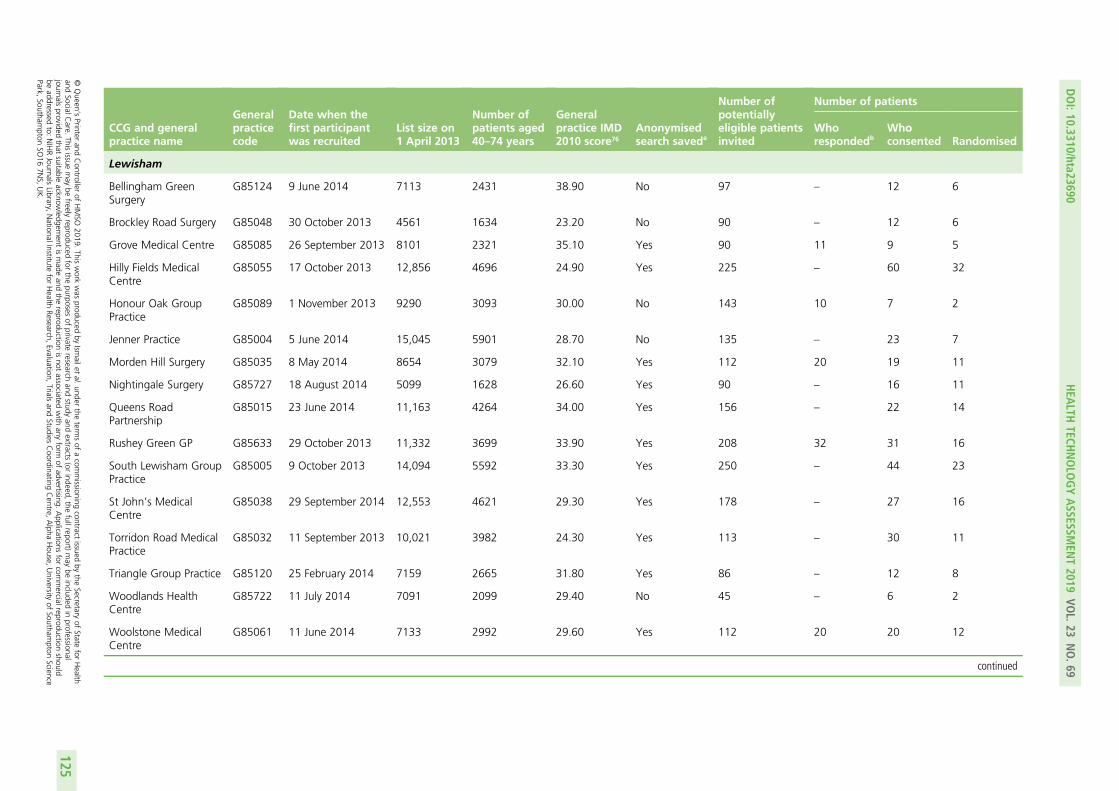
CCG and generalpractice name
Generalpracticecode
Date when thefirst participantwas recruited
List size on1 April 2013
Number ofpatients aged40–74 years
Generalpractice IMD2010 score76
Anonymisedsearch saveda
Number ofpotentiallyeligible patientsinvited
Number of patients
Whorespondedb
Whoconsented Randomised
Lewisham
Bellingham GreenSurgery
G85124 9 June 2014 7113 2431 38.90 No 97 – 12 6
Brockley Road Surgery G85048 30 October 2013 4561 1634 23.20 No 90 – 12 6
Grove Medical Centre G85085 26 September 2013 8101 2321 35.10 Yes 90 11 9 5
Hilly Fields MedicalCentre
G85055 17 October 2013 12,856 4696 24.90 Yes 225 – 60 32
Honour Oak GroupPractice
G85089 1 November 2013 9290 3093 30.00 No 143 10 7 2
Jenner Practice G85004 5 June 2014 15,045 5901 28.70 No 135 – 23 7
Morden Hill Surgery G85035 8 May 2014 8654 3079 32.10 Yes 112 20 19 11
Nightingale Surgery G85727 18 August 2014 5099 1628 26.60 Yes 90 – 16 11
Queens RoadPartnership
G85015 23 June 2014 11,163 4264 34.00 Yes 156 – 22 14
Rushey Green GP G85633 29 October 2013 11,332 3699 33.90 Yes 208 32 31 16
South Lewisham GroupPractice
G85005 9 October 2013 14,094 5592 33.30 Yes 250 – 44 23
St John’s MedicalCentre
G85038 29 September 2014 12,553 4621 29.30 Yes 178 – 27 16
Torridon Road MedicalPractice
G85032 11 September 2013 10,021 3982 24.30 Yes 113 – 30 11
Triangle Group Practice G85120 25 February 2014 7159 2665 31.80 Yes 86 – 12 8
Woodlands HealthCentre
G85722 11 July 2014 7091 2099 29.40 No 45 – 6 2
Woolstone MedicalCentre
G85061 11 June 2014 7133 2992 29.60 Yes 112 20 20 12
continued
DOI:10.3310/hta23690
HEA
LTHTECH
NOLO
GYASSESSM
ENT2019
VOL.23
NO.69
©Queen
’sPrinter
andController
ofHMSO
2019.This
work
was
producedby
Ismailet
al.under
theterm
sof
acom
missioning
contractissued
bythe
Secretaryof
Statefor
Health
andSocialC
are.This
issuemay
befreely
reproducedfor
thepurposes
ofprivate
researchand
studyand
extracts(or
indeed,the
fullreport)may
beincluded
inprofessional
journalsprovided
thatsuitable
acknowledgem
entismade
andthe
reproductionisnot
associatedwith
anyform
ofadvertising.
Applications
forcom
mercialreproduction
shouldbe
addressedto:
NIHRJournals
Library,NationalInstitute
forHealth
Research,Evaluation,
Trialsand
StudiesCoordinating
Centre,
Alpha
House,
University
ofSoutham
ptonScience
Park,Southam
ptonSO
167N
S,UK.
125
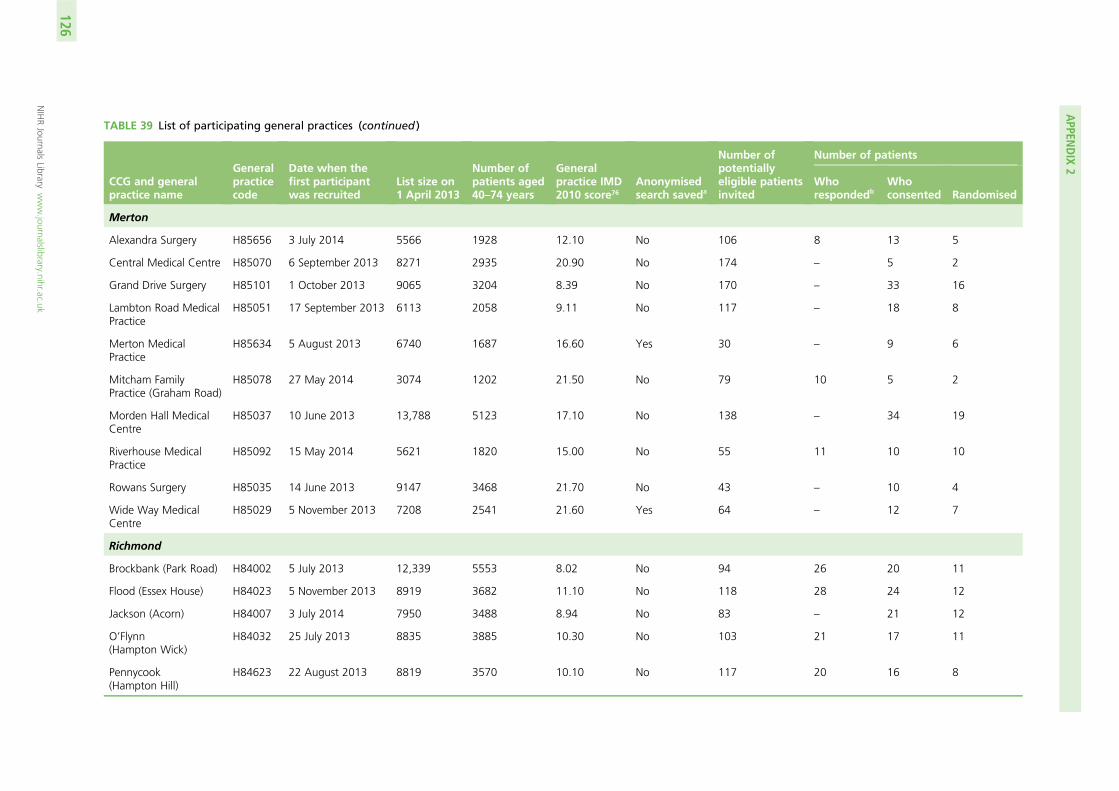
TABLE 39 List of participating general practices (continued )
CCG and generalpractice name
Generalpracticecode
Date when thefirst participantwas recruited
List size on1 April 2013
Number ofpatients aged40–74 years
Generalpractice IMD2010 score76
Anonymisedsearch saveda
Number ofpotentiallyeligible patientsinvited
Number of patients
Whorespondedb
Whoconsented Randomised
Merton
Alexandra Surgery H85656 3 July 2014 5566 1928 12.10 No 106 8 13 5
Central Medical Centre H85070 6 September 2013 8271 2935 20.90 No 174 – 5 2
Grand Drive Surgery H85101 1 October 2013 9065 3204 8.39 No 170 – 33 16
Lambton Road MedicalPractice
H85051 17 September 2013 6113 2058 9.11 No 117 – 18 8
Merton MedicalPractice
H85634 5 August 2013 6740 1687 16.60 Yes 30 – 9 6
Mitcham FamilyPractice (Graham Road)
H85078 27 May 2014 3074 1202 21.50 No 79 10 5 2
Morden Hall MedicalCentre
H85037 10 June 2013 13,788 5123 17.10 No 138 – 34 19
Riverhouse MedicalPractice
H85092 15 May 2014 5621 1820 15.00 No 55 11 10 10
Rowans Surgery H85035 14 June 2013 9147 3468 21.70 No 43 – 10 4
Wide Way MedicalCentre
H85029 5 November 2013 7208 2541 21.60 Yes 64 – 12 7
Richmond
Brockbank (Park Road) H84002 5 July 2013 12,339 5553 8.02 No 94 26 20 11
Flood (Essex House) H84023 5 November 2013 8919 3682 11.10 No 118 28 24 12
Jackson (Acorn) H84007 3 July 2014 7950 3488 8.94 No 83 – 21 12
O’Flynn(Hampton Wick)
H84032 25 July 2013 8835 3885 10.30 No 103 21 17 11
Pennycook(Hampton Hill)
H84623 22 August 2013 8819 3570 10.10 No 117 20 16 8
APPEN
DIX
2
NIHRJournals
Librarywww.journalslibrary.nihr.ac.uk
126
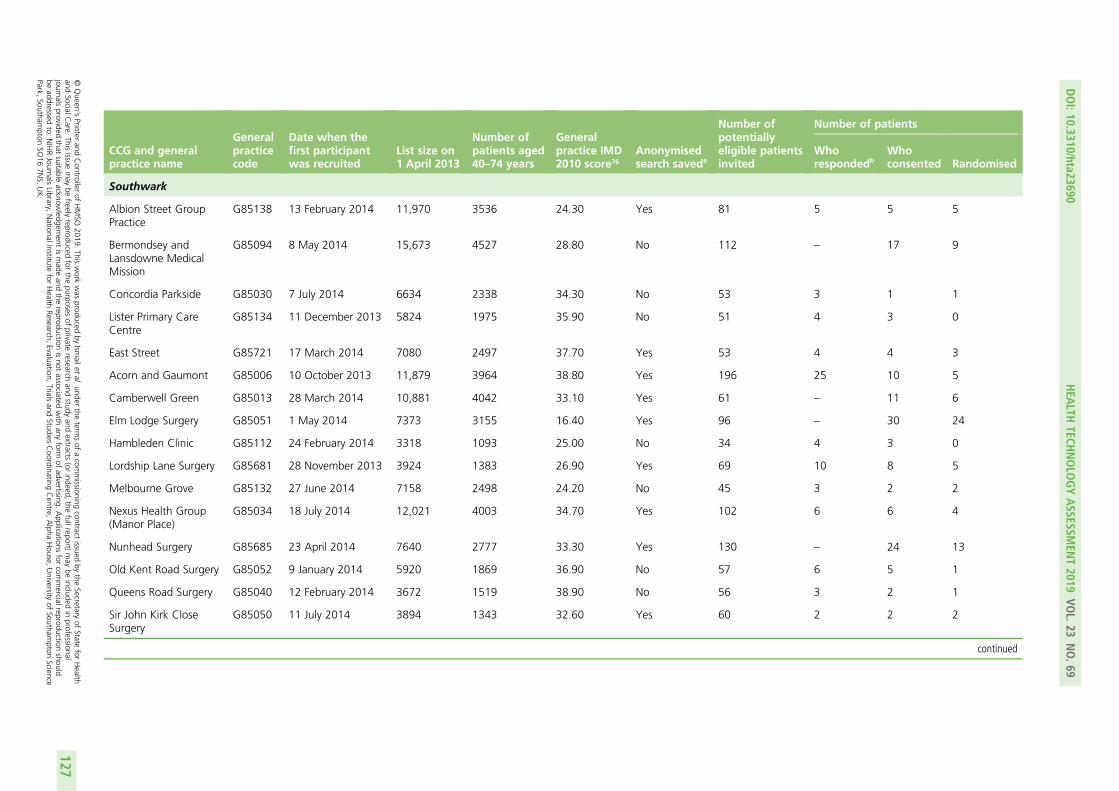
CCG and generalpractice name
Generalpracticecode
Date when thefirst participantwas recruited
List size on1 April 2013
Number ofpatients aged40–74 years
Generalpractice IMD2010 score76
Anonymisedsearch saveda
Number ofpotentiallyeligible patientsinvited
Number of patients
Whorespondedb
Whoconsented Randomised
Southwark
Albion Street GroupPractice
G85138 13 February 2014 11,970 3536 24.30 Yes 81 5 5 5
Bermondsey andLansdowne MedicalMission
G85094 8 May 2014 15,673 4527 28.80 No 112 – 17 9
Concordia Parkside G85030 7 July 2014 6634 2338 34.30 No 53 3 1 1
Lister Primary CareCentre
G85134 11 December 2013 5824 1975 35.90 No 51 4 3 0
East Street G85721 17 March 2014 7080 2497 37.70 Yes 53 4 4 3
Acorn and Gaumont G85006 10 October 2013 11,879 3964 38.80 Yes 196 25 10 5
Camberwell Green G85013 28 March 2014 10,881 4042 33.10 Yes 61 – 11 6
Elm Lodge Surgery G85051 1 May 2014 7373 3155 16.40 Yes 96 – 30 24
Hambleden Clinic G85112 24 February 2014 3318 1093 25.00 No 34 4 3 0
Lordship Lane Surgery G85681 28 November 2013 3924 1383 26.90 Yes 69 10 8 5
Melbourne Grove G85132 27 June 2014 7158 2498 24.20 No 45 3 2 2
Nexus Health Group(Manor Place)
G85034 18 July 2014 12,021 4003 34.70 Yes 102 6 6 4
Nunhead Surgery G85685 23 April 2014 7640 2777 33.30 Yes 130 – 24 13
Old Kent Road Surgery G85052 9 January 2014 5920 1869 36.90 No 57 6 5 1
Queens Road Surgery G85040 12 February 2014 3672 1519 38.90 No 56 3 2 1
Sir John Kirk CloseSurgery
G85050 11 July 2014 3894 1343 32.60 Yes 60 2 2 2
continued
DOI:10.3310/hta23690
HEA
LTHTECH
NOLO
GYASSESSM
ENT2019
VOL.23
NO.69
©Queen
’sPrinter
andController
ofHMSO
2019.This
work
was
producedby
Ismailet
al.under
theterm
sof
acom
missioning
contractissued
bythe
Secretaryof
Statefor
Health
andSocialC
are.This
issuemay
befreely
reproducedfor
thepurposes
ofprivate
researchand
studyand
extracts(or
indeed,the
fullreport)may
beincluded
inprofessional
journalsprovided
thatsuitable
acknowledgem
entismade
andthe
reproductionisnot
associatedwith
anyform
ofadvertising.
Applications
forcom
mercialreproduction
shouldbe
addressedto:
NIHRJournals
Library,NationalInstitute
forHealth
Research,Evaluation,
Trialsand
StudiesCoordinating
Centre,
Alpha
House,
University
ofSoutham
ptonScience
Park,Southam
ptonSO
167N
S,UK.
127
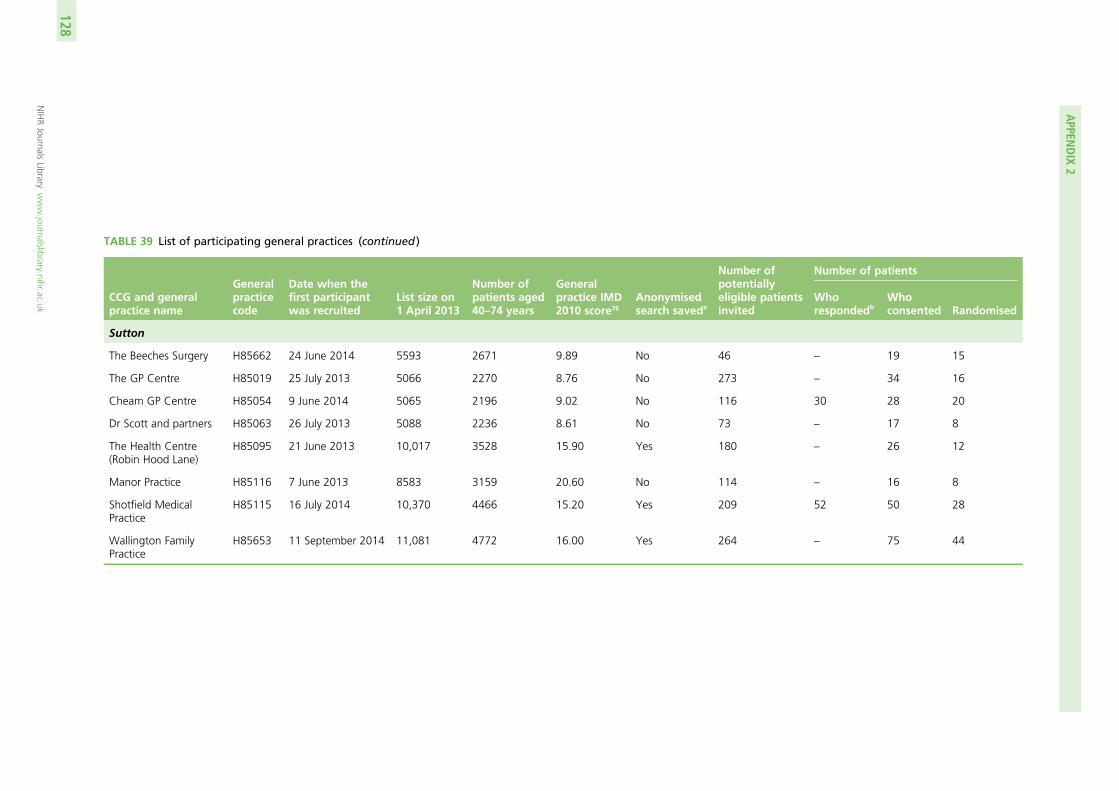
TABLE 39 List of participating general practices (continued )
CCG and generalpractice name
Generalpracticecode
Date when thefirst participantwas recruited
List size on1 April 2013
Number ofpatients aged40–74 years
Generalpractice IMD2010 score76
Anonymisedsearch saveda
Number ofpotentiallyeligible patientsinvited
Number of patients
Whorespondedb
Whoconsented Randomised
Sutton
The Beeches Surgery H85662 24 June 2014 5593 2671 9.89 No 46 – 19 15
The GP Centre H85019 25 July 2013 5066 2270 8.76 No 273 – 34 16
Cheam GP Centre H85054 9 June 2014 5065 2196 9.02 No 116 30 28 20
Dr Scott and partners H85063 26 July 2013 5088 2236 8.61 No 73 – 17 8
The Health Centre(Robin Hood Lane)
H85095 21 June 2013 10,017 3528 15.90 Yes 180 – 26 12
Manor Practice H85116 7 June 2013 8583 3159 20.60 No 114 – 16 8
Shotfield MedicalPractice
H85115 16 July 2014 10,370 4466 15.20 Yes 209 52 50 28
Wallington FamilyPractice
H85653 11 September 2014 11,081 4772 16.00 Yes 264 – 75 44
APPEN
DIX
2
NIHRJournals
Librarywww.journalslibrary.nihr.ac.uk
128
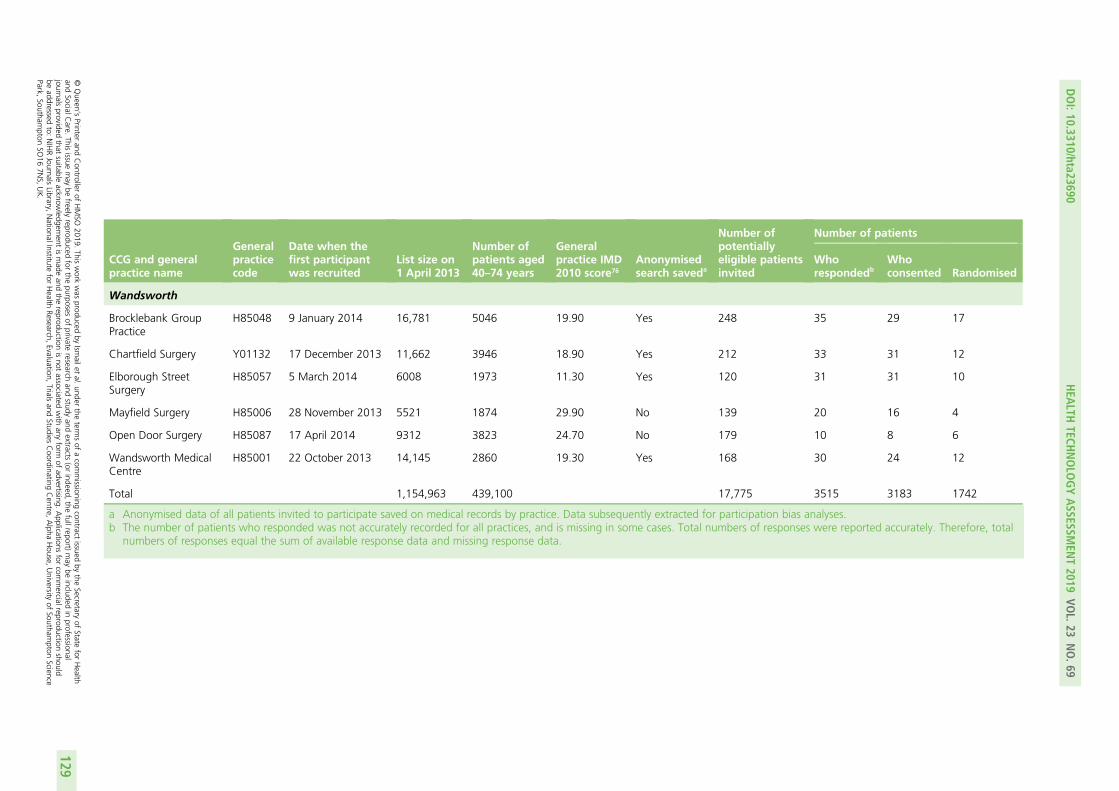
CCG and generalpractice name
Generalpracticecode
Date when thefirst participantwas recruited
List size on1 April 2013
Number ofpatients aged40–74 years
Generalpractice IMD2010 score76
Anonymisedsearch saveda
Number ofpotentiallyeligible patientsinvited
Number of patients
Whorespondedb
Whoconsented Randomised
Wandsworth
Brocklebank GroupPractice
H85048 9 January 2014 16,781 5046 19.90 Yes 248 35 29 17
Chartfield Surgery Y01132 17 December 2013 11,662 3946 18.90 Yes 212 33 31 12
Elborough StreetSurgery
H85057 5 March 2014 6008 1973 11.30 Yes 120 31 31 10
Mayfield Surgery H85006 28 November 2013 5521 1874 29.90 No 139 20 16 4
Open Door Surgery H85087 17 April 2014 9312 3823 24.70 No 179 10 8 6
Wandsworth MedicalCentre
H85001 22 October 2013 14,145 2860 19.30 Yes 168 30 24 12
Total 1,154,963 439,100 17,775 3515 3183 1742
a Anonymised data of all patients invited to participate saved on medical records by practice. Data subsequently extracted for participation bias analyses.b The number of patients who responded was not accurately recorded for all practices, and is missing in some cases. Total numbers of responses were reported accurately. Therefore, total
numbers of responses equal the sum of available response data and missing response data.
DOI:10.3310/hta23690
HEA
LTHTECH
NOLO
GYASSESSM
ENT2019
VOL.23
NO.69
©Queen
’sPrinter
andController
ofHMSO
2019.This
work
was
producedby
Ismailet
al.under
theterm
sof
acom
missioning
contractissued
bythe
Secretaryof
Statefor
Health
andSocialC
are.This
issuemay
befreely
reproducedfor
thepurposes
ofprivate
researchand
studyand
extracts(or
indeed,the
fullreport)may
beincluded
inprofessional
journalsprovided
thatsuitable
acknowledgem
entismade
andthe
reproductionisnot
associatedwith
anyform
ofadvertising.
Applications
forcom
mercialreproduction
shouldbe
addressedto:
NIHRJournals
Library,NationalInstitute
forHealth
Research,Evaluation,
Trialsand
StudiesCoordinating
Centre,
Alpha
House,
University
ofSoutham
ptonScience
Park,Southam
ptonSO
167N
S,UK.
129


Appendix 3 Behaviour change technique codingframework for the fidelity analysis
DOI: 10.3310/hta23690 HEALTH TECHNOLOGY ASSESSMENT 2019 VOL. 23 NO. 69
© Queen’s Printer and Controller of HMSO 2019. This work was produced by Ismail et al. under the terms of a commissioning contract issued by the Secretary of State for Healthand Social Care. This issue may be freely reproduced for the purposes of private research and study and extracts (or indeed, the full report) may be included in professionaljournals provided that suitable acknowledgement is made and the reproduction is not associated with any form of advertising. Applications for commercial reproduction shouldbe addressed to: NIHR Journals Library, National Institute for Health Research, Evaluation, Trials and Studies Coordinating Centre, Alpha House, University of Southampton SciencePark, Southampton SO16 7NS, UK.
131
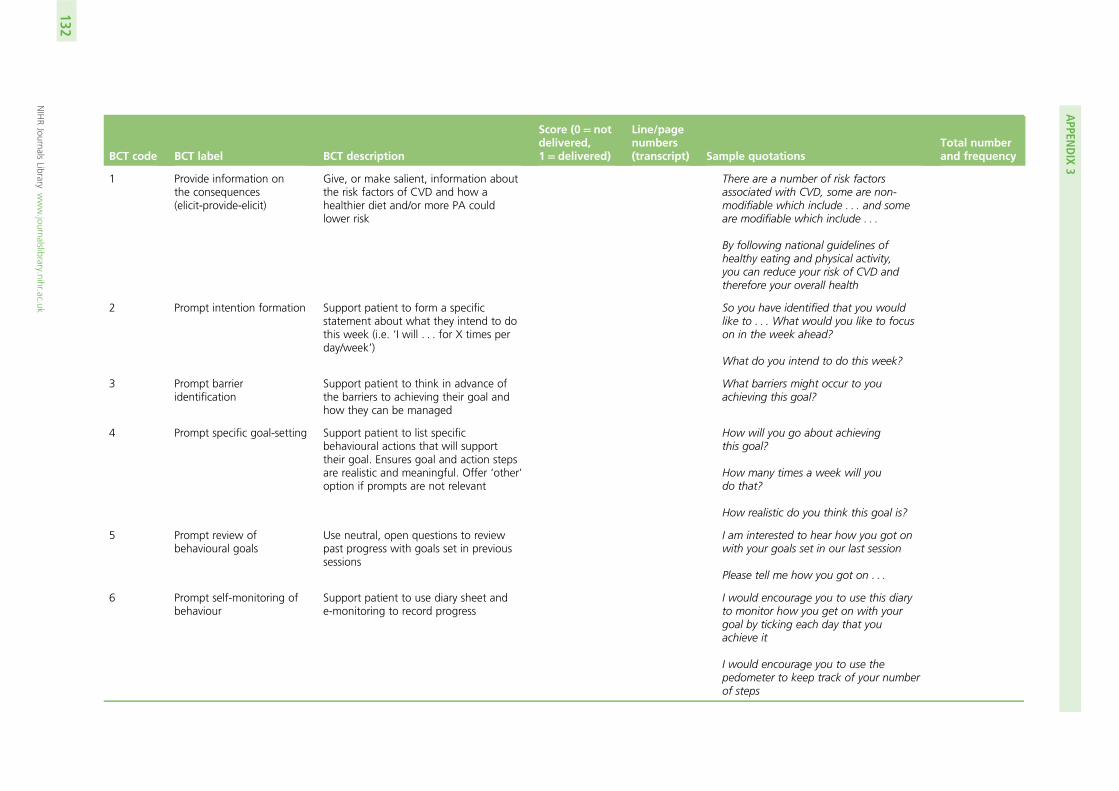
BCT code BCT label BCT description
Score (0= notdelivered,1= delivered)
Line/pagenumbers(transcript) Sample quotations
Total numberand frequency
1 Provide information onthe consequences(elicit-provide-elicit)
Give, or make salient, information aboutthe risk factors of CVD and how ahealthier diet and/or more PA couldlower risk
There are a number of risk factorsassociated with CVD, some are non-modifiable which include . . . and someare modifiable which include . . .
By following national guidelines ofhealthy eating and physical activity,you can reduce your risk of CVD andtherefore your overall health
2 Prompt intention formation Support patient to form a specificstatement about what they intend to dothis week (i.e. ‘I will . . . for X times perday/week’)
So you have identified that you wouldlike to . . . What would you like to focuson in the week ahead?
What do you intend to do this week?
3 Prompt barrieridentification
Support patient to think in advance ofthe barriers to achieving their goal andhow they can be managed
What barriers might occur to youachieving this goal?
4 Prompt specific goal-setting Support patient to list specificbehavioural actions that will supporttheir goal. Ensures goal and action stepsare realistic and meaningful. Offer ‘other’option if prompts are not relevant
How will you go about achievingthis goal?
How many times a week will youdo that?
How realistic do you think this goal is?
5 Prompt review ofbehavioural goals
Use neutral, open questions to reviewpast progress with goals set in previoussessions
I am interested to hear how you got onwith your goals set in our last session
Please tell me how you got on . . .
6 Prompt self-monitoring ofbehaviour
Support patient to use diary sheet ande-monitoring to record progress
I would encourage you to use this diaryto monitor how you get on with yourgoal by ticking each day that youachieve it
I would encourage you to use thepedometer to keep track of your numberof steps
APPEN
DIX
3
NIHRJournals
Librarywww.journalslibrary.nihr.ac.uk
132
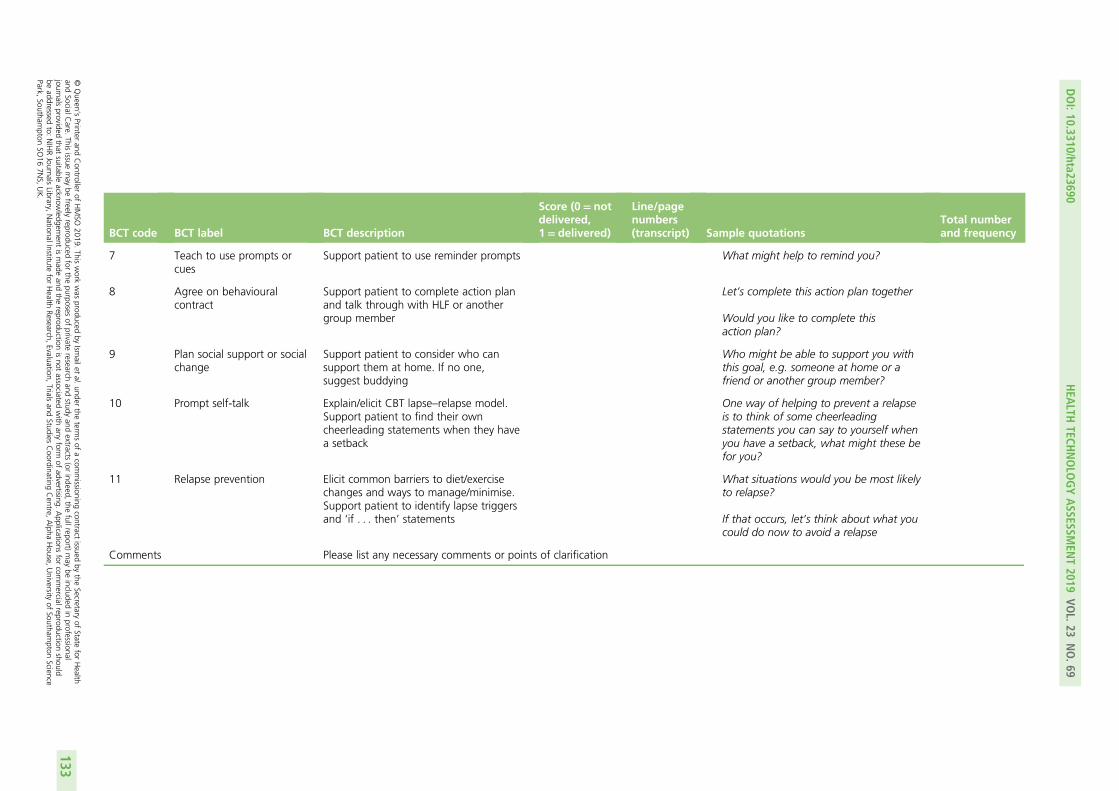
BCT code BCT label BCT description
Score (0= notdelivered,1= delivered)
Line/pagenumbers(transcript) Sample quotations
Total numberand frequency
7 Teach to use prompts orcues
Support patient to use reminder prompts What might help to remind you?
8 Agree on behaviouralcontract
Support patient to complete action planand talk through with HLF or anothergroup member
Let’s complete this action plan together
Would you like to complete thisaction plan?
9 Plan social support or socialchange
Support patient to consider who cansupport them at home. If no one,suggest buddying
Who might be able to support you withthis goal, e.g. someone at home or afriend or another group member?
10 Prompt self-talk Explain/elicit CBT lapse–relapse model.Support patient to find their owncheerleading statements when they havea setback
One way of helping to prevent a relapseis to think of some cheerleadingstatements you can say to yourself whenyou have a setback, what might these befor you?
11 Relapse prevention Elicit common barriers to diet/exercisechanges and ways to manage/minimise.Support patient to identify lapse triggersand ‘if . . . then’ statements
What situations would you be most likelyto relapse?
If that occurs, let’s think about what youcould do now to avoid a relapse
Comments Please list any necessary comments or points of clarification
DOI:10.3310/hta23690
HEA
LTHTECH
NOLO
GYASSESSM
ENT2019
VOL.23
NO.69
©Queen
’sPrinter
andController
ofHMSO
2019.This
work
was
producedby
Ismailet
al.under
theterm
sof
acom
missioning
contractissued
bythe
Secretaryof
Statefor
Health
andSocialC
are.This
issuemay
befreely
reproducedfor
thepurposes
ofprivate
researchand
studyand
extracts(or
indeed,the
fullreport)may
beincluded
inprofessional
journalsprovided
thatsuitable
acknowledgem
entismade
andthe
reproductionisnot
associatedwith
anyform
ofadvertising.
Applications
forcom
mercialreproduction
shouldbe
addressedto:
NIHRJournals
Library,NationalInstitute
forHealth
Research,Evaluation,
Trialsand
StudiesCoordinating
Centre,
Alpha
House,
University
ofSoutham
ptonScience
Park,Southam
ptonSO
167N
S,UK.
133


Appendix 4 Participant focus group topic guides
Focus group 1: participants who received six or more intervention sessions
Invitation/information receivedOur first set of questions are about the invitation you received from your GP informing you of the studyand inviting you to take part. This letter would have informed you of your high risk of heart disease, whowas running the study and the motivational interviewing that would be used. In order to participate youwould have had to send back a reply slip expressing your interest.
Q1) What made you volunteer to take part?How did the following influence your decision to take part?
l Finding out that you were at high risk of heart disease (according to the NHS screening)l Potential health benefits of a healthy lifestyle interventionl Potential for helping others prevent heart disease in the futurel The researcher appointment, which included clinical tests and questionnaires about your lifestyle.
SessionsYou would have received sessions with a healthy lifestyle facilitator. You may have had different experiences ofthis – different HLFs, different number of sessions, different types of session (one-to-one or in a group). Wewant to hear about all of your thoughts and experiences. The weekly sessions consisted of an introduction tothe concept of heart disease and its risk factors, followed by two sessions on exercise, two on diet and two onmaintaining healthy habits. After which there were follow-up meetings once every 3 months.
Q2) Did you change any aspects of your lifestyle as a result of the treatment?
l If there were changes, could you give some examples?l If there were no changes, why do you think that was?
Q3) How did the treatment impact on your lifestyle?
l Could you tell us more about how effective you thought the following aspects of the intervention werein helping you change your lifestyle?
¢ Content of sessions (information given, tools, workbook)¢ Format/structure (length, number, spacing of sessions)¢ Behaviour change techniques (action plans, reminders, talking about setbacks)¢ Conversation style (including relationship with HLF)¢ Social support (other group members, family and friends).
Q4) The study aimed to invite a diverse range of people from different cultural, social andethnic minority backgrounds. Based on the treatment you received, what aspects of thetreatment made it suitable or unsuitable for a wide range of populations to participate?Were any of the following aspects of the treatment a help or a hindrance?
l The materials used.l What was it about the HLF that helped/did not help?
¢ Did you feel you had something in common with the HLF?¢ Or the opposite, having nothing in common (e.g. did not come from your world/culture/age group).
DOI: 10.3310/hta23690 HEALTH TECHNOLOGY ASSESSMENT 2019 VOL. 23 NO. 69
© Queen’s Printer and Controller of HMSO 2019. This work was produced by Ismail et al. under the terms of a commissioning contract issued by the Secretary of State for Healthand Social Care. This issue may be freely reproduced for the purposes of private research and study and extracts (or indeed, the full report) may be included in professionaljournals provided that suitable acknowledgement is made and the reproduction is not associated with any form of advertising. Applications for commercial reproduction shouldbe addressed to: NIHR Journals Library, National Institute for Health Research, Evaluation, Trials and Studies Coordinating Centre, Alpha House, University of Southampton SciencePark, Southampton SO16 7NS, UK.
135
l The other members of your group (if applicable).
¢ Did you feel you had something in common with the other group members?¢ Or the opposite, having nothing in common (e.g. did not come from your world/culture/age group).
Q5) Is there anything I have not mentioned that you would like to add?
l Is there anything you would change about MOVE IT?
Focus group 2: participants who received fewer than twointervention sessions
Invitation/information receivedOur first set of questions are about the invitation you received from your GP informing you of the studyand inviting you to take part. This letter would have informed you of your high risk of heart disease, whowas running the study and the motivational interviewing that would be used. In order to participate youwould have had to send back a reply slip expressing your interest.
Q1) What made you volunteer to take part?How did the following influence your decision to take part?
l Finding out that you were at high risk of heart disease (according to the NHS screening)l Potential health benefits of a healthy lifestyle interventionl Potential for helping others prevent heart disease in the futurel The researcher appointment, which included clinical tests and questionnaires about your lifestyle.
SessionsYou were allocated to receive either one-to-one or individual sessions with a healthy lifestyle facilitator.However, you either did not attend any sessions or attended only the first session. We think that it isimportant for us to find out why this may be.
Q2) What were the key reasons that made you drop out?Examples of reasons we thought some people might drop out are:
l Lack of time to take part. If time was an issue for you, can you tell us more specifically about whatresulted in time being a problem?
l The MOVE IT workbook/documents you may have received from the HLF in session 0; if this was areason for dropping out, can you tell us what things you didn’t like?
l Participants not necessarily feeling that the treatment relates to them or would not be useful. If thisinfluenced your reason for dropping out, can you tell us what aspects of the treatment you felt did notrelate to you?
l The allocation (group or individual) you were assigned to. Would you have been more likely to take partif allocated to the other condition?
l The duration of each session, the number of sessions and the intervention duration as a whole(12-month period)? If this relates to you, can you tell us more about how this affected your participation?
l Ill health or illness within your family. If this relates to you, can you tell us more about how this affectedyour participation?
l Not wanting to share personal information, with either the HLF or other group members. If this relatesto you, can you tell us more about how this affected your participation?
l Can you tell us more about what influenced your decision to drop out?
APPENDIX 4
NIHR Journals Library www.journalslibrary.nihr.ac.uk
136

Q3) The study aimed to invite a diverse range of people from different cultural, socialand ethnic minority backgrounds. Based on the treatment you received, what aspectsof the treatment made it suitable or unsuitable for a wide range of populations toparticipate?Were any of the following aspects of the treatment a help or a hindrance?
l The materials used.l What was it about the HLF that helped/did not help?
¢ Did you feel you had something in common with the HLF?
l Or the opposite, having nothing in common (e.g. did not come from your world/culture/age group).l The other members of your group (if applicable).l Did you feel you had something in common with the other group members?l Or the opposite, having nothing in common (e.g. did not come from your world/culture/age group).
Q4) What would have helped you to continue with the treatment?
Q5) Is there anything I have not mentioned that you would like to add?
DOI: 10.3310/hta23690 HEALTH TECHNOLOGY ASSESSMENT 2019 VOL. 23 NO. 69
© Queen’s Printer and Controller of HMSO 2019. This work was produced by Ismail et al. under the terms of a commissioning contract issued by the Secretary of State for Healthand Social Care. This issue may be freely reproduced for the purposes of private research and study and extracts (or indeed, the full report) may be included in professionaljournals provided that suitable acknowledgement is made and the reproduction is not associated with any form of advertising. Applications for commercial reproduction shouldbe addressed to: NIHR Journals Library, National Institute for Health Research, Evaluation, Trials and Studies Coordinating Centre, Alpha House, University of Southampton SciencePark, Southampton SO16 7NS, UK.
137


Appendix 5 Characteristics of focus groupattendees
DOI: 10.3310/hta23690 HEALTH TECHNOLOGY ASSESSMENT 2019 VOL. 23 NO. 69
© Queen’s Printer and Controller of HMSO 2019. This work was produced by Ismail et al. under the terms of a commissioning contract issued by the Secretary of State for Healthand Social Care. This issue may be freely reproduced for the purposes of private research and study and extracts (or indeed, the full report) may be included in professionaljournals provided that suitable acknowledgement is made and the reproduction is not associated with any form of advertising. Applications for commercial reproduction shouldbe addressed to: NIHR Journals Library, National Institute for Health Research, Evaluation, Trials and Studies Coordinating Centre, Alpha House, University of Southampton SciencePark, Southampton SO16 7NS, UK.
139
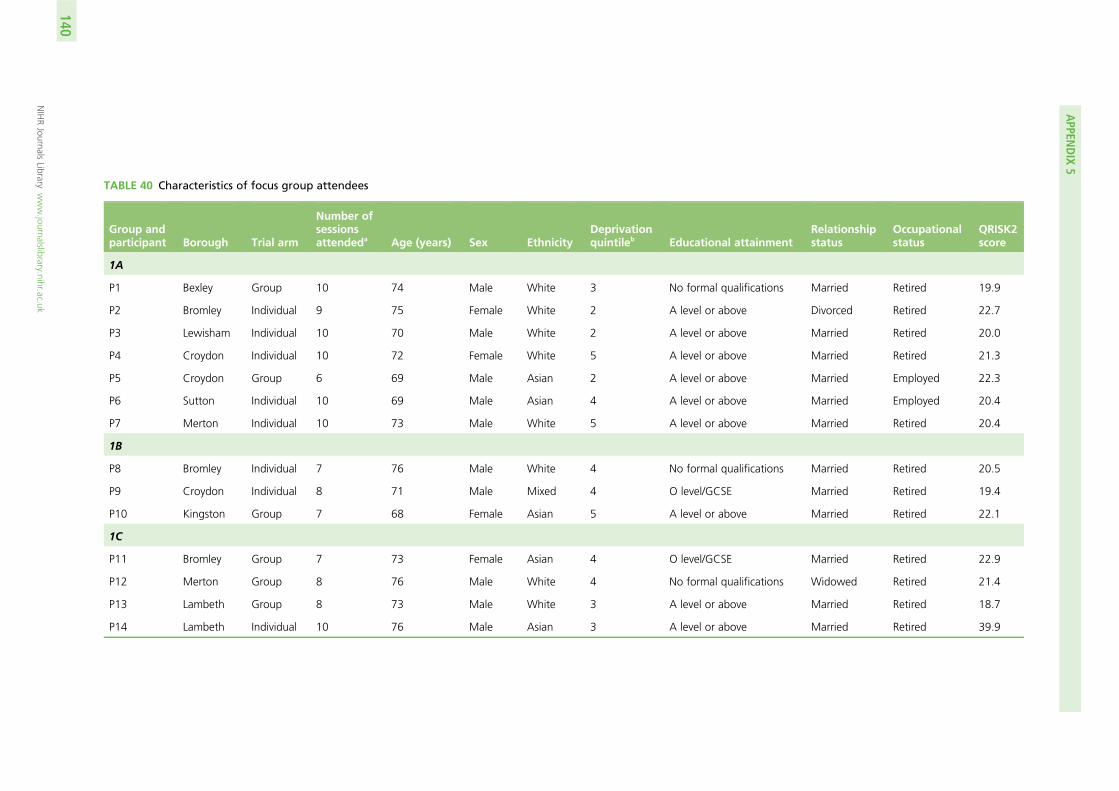
TABLE 40 Characteristics of focus group attendees
Group andparticipant Borough Trial arm
Number ofsessionsattendeda Age (years) Sex Ethnicity
Deprivationquintileb Educational attainment
Relationshipstatus
Occupationalstatus
QRISK2score
1A
P1 Bexley Group 10 74 Male White 3 No formal qualifications Married Retired 19.9
P2 Bromley Individual 9 75 Female White 2 A level or above Divorced Retired 22.7
P3 Lewisham Individual 10 70 Male White 2 A level or above Married Retired 20.0
P4 Croydon Individual 10 72 Female White 5 A level or above Married Retired 21.3
P5 Croydon Group 6 69 Male Asian 2 A level or above Married Employed 22.3
P6 Sutton Individual 10 69 Male Asian 4 A level or above Married Employed 20.4
P7 Merton Individual 10 73 Male White 5 A level or above Married Retired 20.4
1B
P8 Bromley Individual 7 76 Male White 4 No formal qualifications Married Retired 20.5
P9 Croydon Individual 8 71 Male Mixed 4 O level/GCSE Married Retired 19.4
P10 Kingston Group 7 68 Female Asian 5 A level or above Married Retired 22.1
1C
P11 Bromley Group 7 73 Female Asian 4 O level/GCSE Married Retired 22.9
P12 Merton Group 8 76 Male White 4 No formal qualifications Widowed Retired 21.4
P13 Lambeth Group 8 73 Male White 3 A level or above Married Retired 18.7
P14 Lambeth Individual 10 76 Male Asian 3 A level or above Married Retired 39.9
APPEN
DIX
5
NIHRJournals
Librarywww.journalslibrary.nihr.ac.uk
140
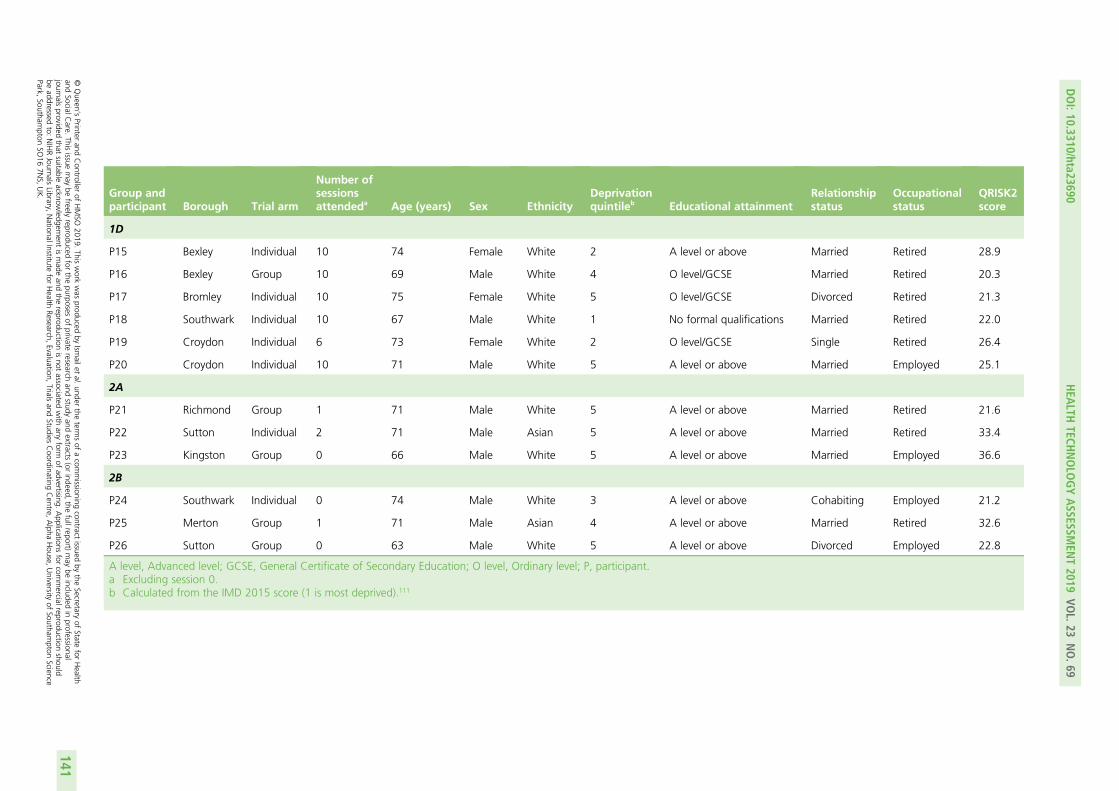
Group andparticipant Borough Trial arm
Number ofsessionsattendeda Age (years) Sex Ethnicity
Deprivationquintileb Educational attainment
Relationshipstatus
Occupationalstatus
QRISK2score
1D
P15 Bexley Individual 10 74 Female White 2 A level or above Married Retired 28.9
P16 Bexley Group 10 69 Male White 4 O level/GCSE Married Retired 20.3
P17 Bromley Individual 10 75 Female White 5 O level/GCSE Divorced Retired 21.3
P18 Southwark Individual 10 67 Male White 1 No formal qualifications Married Retired 22.0
P19 Croydon Individual 6 73 Female White 2 O level/GCSE Single Retired 26.4
P20 Croydon Individual 10 71 Male White 5 A level or above Married Employed 25.1
2A
P21 Richmond Group 1 71 Male White 5 A level or above Married Retired 21.6
P22 Sutton Individual 2 71 Male Asian 5 A level or above Married Retired 33.4
P23 Kingston Group 0 66 Male White 5 A level or above Married Employed 36.6
2B
P24 Southwark Individual 0 74 Male White 3 A level or above Cohabiting Employed 21.2
P25 Merton Group 1 71 Male Asian 4 A level or above Married Retired 32.6
P26 Sutton Group 0 63 Male White 5 A level or above Divorced Employed 22.8
A level, Advanced level; GCSE, General Certificate of Secondary Education; O level, Ordinary level; P, participant.a Excluding session 0.b Calculated from the IMD 2015 score (1 is most deprived).111
DOI:10.3310/hta23690
HEA
LTHTECH
NOLO
GYASSESSM
ENT2019
VOL.23
NO.69
©Queen
’sPrinter
andController
ofHMSO
2019.This
work
was
producedby
Ismailet
al.under
theterm
sof
acom
missioning
contractissued
bythe
Secretaryof
Statefor
Health
andSocialC
are.This
issuemay
befreely
reproducedfor
thepurposes
ofprivate
researchand
studyand
extracts(or
indeed,the
fullreport)may
beincluded
inprofessional
journalsprovided
thatsuitable
acknowledgem
entismade
andthe
reproductionisnot
associatedwith
anyform
ofadvertising.
Applications
forcom
mercialreproduction
shouldbe
addressedto:
NIHRJournals
Library,NationalInstitute
forHealth
Research,Evaluation,
Trialsand
StudiesCoordinating
Centre,
Alpha
House,
University
ofSoutham
ptonScience
Park,Southam
ptonSO
167N
S,UK.
141


Appendix 6 Health-care professional feedbacktopic guides
Healthy lifestyle facilitator interview topic guides
**Some content has not been reproduced here**
TrainingYou attended the training and supervision at King’s.
l What were your views on the supervision?l Can you tell me any ways in which you think the supervision could have been improved?l Have you had any previous supervision in facilitating psychological therapies?
Supervision
l What are your views about the supervision you received throughout the study?l What are your views about the support you received from the research team in general?l How did other members of staff at your practice feel about you taking part in the study?
¢ Were they supportive/not supportive? How so?
l What would have made it easier for you to participate?
InterventionNow I’d like to ask you about delivering the intervention.
l What went well, could you give me some examples?l What went less well?l How did you find the sessions with patients?
¢ How did you find the length of the sessions?
l What are your views about the admin time involved in the study?
Self-awareness
l How confident did you feel about delivering the group intervention?l How confident did you feel delivering the individual intervention?l How confident did you feel about managing the caseload?
Patients
l Can you tell me about any difficulties you experienced in getting patients to attend the sessions?
¢ Was there any difference in response between the individual and group sessions?¢ Which method (group or individual) do you feel is more effective?¢ Did you book the patients in yourself?
l What were the challenges that you faced in using CBT skills with these patients?l What other challenges were there when delivering the intervention?
DOI: 10.3310/hta23690 HEALTH TECHNOLOGY ASSESSMENT 2019 VOL. 23 NO. 69
© Queen’s Printer and Controller of HMSO 2019. This work was produced by Ismail et al. under the terms of a commissioning contract issued by the Secretary of State for Healthand Social Care. This issue may be freely reproduced for the purposes of private research and study and extracts (or indeed, the full report) may be included in professionaljournals provided that suitable acknowledgement is made and the reproduction is not associated with any form of advertising. Applications for commercial reproduction shouldbe addressed to: NIHR Journals Library, National Institute for Health Research, Evaluation, Trials and Studies Coordinating Centre, Alpha House, University of Southampton SciencePark, Southampton SO16 7NS, UK.
143
Clinical psychologist interview topic guides
TrainingYou delivered the training and supervision to the HLFs.
l What were your views on the supervision?
¢ HLF engagement?¢ Frequency?¢ Length?
l Can you tell me about any problems you experienced with the supervision?
¢ What would have made it easier for you?¢ What were the challenges that you faced when teaching CBT skills to the HLFs?
l Can you tell me any ways in which you think the supervision could have been improved?l Have you had any previous experience in facilitating psychological therapies?l What are your views about the support you received from the trial manager and your team (NDZ)
in general?
¢ Were they supportive/not supportive? How so?¢ What would have made it easier for you to participate more?
Supervision (fortnightly)What are your views about the supervision you have delivered throughout the study?
l Can you tell me about any difficulties you experienced in getting HLFs to attend the supervision?l Do the HLFs find it useful/helpful?l Have you had any negative feedback about the supervision from the HLFs, if so could you give me
some examples?l Have you had any positive feedback about the supervision from the HLFs, if so could you give me
some examples?
InterventionNow I’d like to ask you about your views on delivery of the intervention. You sometimes shadow the HLFsat their surgeries, from your perspective:
l What goes well, could you give me some examples?l What goes less well, could you give me some examples?l What are your views about the HLF admin time involved in the study?l Which method (group or individual) do you feel is more effective?
APPENDIX 6
NIHR Journals Library www.journalslibrary.nihr.ac.uk
144


EMEHS&DRHTAPGfARPHRPart of the NIHR Journals Librarywww.journalslibrary.nihr.ac.uk
This report presents independent research funded by the National Institute for Health Research (NIHR). The views expressed are those of the author(s) and not necessarily those of the NHS, the NIHR or the Department of Health and Social Care
Published by the NIHR Journals Library