Embed Size (px)
Citation preview

1
Benchmarking
June 2018
Business Confidential

2
Disclaimer
Although all information and opinions expressed in this document were obtained in
good faith from sources believed to be reliable, no representation or warranty, express
or implied, is made as to its accuracy or completeness. Information, opinions and prices
indicated are subject to change without notice. Asset classes, asset allocation and
investment instruments are indicative.
Past performance of an investment is not a guide to its future performance. Some
investments may be subject to sudden and large falls in value and on realization you
may receive back less than you invested or may be required to pay more. Changes in FX
rates may have an adverse effect on the price, value or income of an investment.
Furthermore, performance information may be based on simulations and/or be for
illustration only.
This presentation is intended only for substantial investors who have the knowledge and
understanding to enable them to assess the risks attaching to investment and who
qualify as professional clients for the purposes of the rules of the Financial Conduct
Authority. We would recommend that you take financial and/or legal advice as to the
implications of investing in any of the products mentioned herein, including tax
matters. Sparrows Capital Limited does not provide tax advice.
This document may not be reproduced or circulated without prior authority of Sparrows
Capital Limited.
This document is not intended for distribution. © Sparrows Capital Limited, London,
UK.
Sparrows Capital Limited is authorised and regulated by the Financial Conduct Authority
It is UK registered and headquartered at One Aldgate, London, EC3N 1RE, United Kingdom
3
Table of Contents
Section 1: Sparrows Capital 4 Section 2: Investment Philosophy 5 Section 3: Benchmarking 7
Section 3.1: The Evidence 9 Section 3.2: Common Practices 11 Section 3.3: A Complementary Solution 15
Section 4: Case Study 17 Section 5: Proposition 22 Appendix 1: Key People 26
4
Section 1: Sparrows Capital Sparrows Capital Limited is a private investment office managing assets for family
offices, trusts and selected institutions. Since 2008 we have overseen the liquid assets of
our founding family in line with the principles now employed at Sparrows Capital.
Our approach is distinctive, simple and intuitive. We use Exchange Traded Funds
(ETFs) and Index Funds to build portfolios designed to track markets. We do not
attempt to pick individual stocks and shares, and we do not time markets.
Our investment proposition is based on long term evidence backed by robust academic
studies, which suggest that it will produce better results than conventional asset
management across the economic cycle. Basing an investment strategy on empirical
evidence helps to avoid the subjective decisions that often detract from potential long
term returns.
Our aim is to bring clarity to the investment management process and to help alleviate
our clients’ concerns about the performance of their portfolios.
Our vision is to be insightful, clear and liberating in everything we present
and do.
5
Section 2: Investment Philosophy
Evidence-based investing applies the lessons of over a century of investment history,
systematically and unemotionally. Conclusions from historical data are incorporated
only where these are backed by robust academic studies. This approach reveals five key
findings which inform our investment model:
1. Return is primarily a function of risk An investor’s strategic asset allocation explains over 90% of portfolio returns1. The
allocation of risk across asset classes and across geographies is the single most
important decision in the investment process. Risk management focuses on the
individual investor’s risk tolerance and financial capacity in order to assess the
appropriate level of portfolio risk. Risk should never be dialled up in order to meet an
investment objective; if the appropriate risk allocation is not capable of meeting the
desired outcome, then either the objective must be reassessed, or the invested amount
increased through additional savings or transfer.
2. Certain risks attract a persistent premium The market has historically awarded a return premium to certain risk categories over
the long term. A factor-based investment approach favours these categories with a view
to improving portfolio performance and efficiency across the cycle relative to traditional
benchmarks. The allocation to specific risk factors can be tailored to the individual
client.
3. Stock picking and market timing seldom add value Evidence suggests that the claim made by many investment managers that they can
capture alpha (outperform the market by clever stock picking or market timing) rarely
holds up over any reasonable period of time. At Sparrows Capital we believe that the
1 Does Asset Allocation Policy Explain 40, 90, or 100 Percent of Performance? by Roger G. Ibbotson and Paul D. Kaplan (2000)
6
appropriate objective for most investors, at least across the core part of their portfolio, is
to achieve the return of the broader market across the full economic cycle.
4. It is critical to remain invested across the full cycle Trying to time the market can be costly. Major market moves, both up and down, tend
to be concentrated in short periods lasting just a few days at a time. A commonly cited
rule of thumb suggests 90% of the market’s absolute return is typically accounted for by
the moves of only 10% of the trading days. Missing out on just one of these days can
significantly affect long term returns.
5. Cost control is critical to long term returns
The costs of investing - management charges, fund charges, custody and transaction
costs - can be substantial. A major benefit of evidence-based investing is its use of ultra-
low cost securities, including ETFs and Index Funds. The discipline produces low
turnover rates and focuses on delivering market returns as efficiently as possible.
These 5 key findings inform an investment approach which can be
described as evidence-based, risk-driven, factor-based and cost efficient.
Sparrows Capital’s intention is to harvest an enhanced market return
across the full investment cycle. We achieve this by designing bespoke
portfolios for our clients using selected highly efficient investment vehicles
including ETFs and Index Funds.
7
Section 3: Benchmarking
A benchmark is a standard, or yardstick, against which something may be measured,
compared or evaluated. Benchmarking is ubiquitous in most disciplines, including
industry, corporate management, engineering, and medicine. But it is in the investment
field that benchmarks have acquired a truly special place.
In one sense, investment benchmarks resemble their counterparts in corporate
management and engineering — theoretical constructs used to measure real world
performance. In another sense, however, if the benchmarks are well constructed, they
represent much more: they embody the inherent opportunity set of an asset class. The
return on the benchmark, or index, represents the theoretical return available from that
asset class before the application of management skill, while the return from associated
index funds represents the actual return from that asset class. Intriguingly, the
benchmark return is also the return (before costs) on the aggregation of all active
managers who participate in the asset class. That is a lot of work for a benchmark to do2.
“Faulty benchmarks lead to bad investment decisions, poor client relations, and costly
manager turnover. Having the correct benchmark is good for both the manager, the
adviser and the client. Investing the time to pick the right benchmark is critical.”3
A good benchmark is investible, accessible, transparent, independent, and relevant.
“….the great value of an index return is that it can be disaggregated; that is, the total
benchmark return is the sum of its parts. The ability to break down an index’s return is
essential for attribution analysis, which is important to provide insight into the value the
manager is creating.”4
2 Benchmarks and Investment Management by Laurence B. Siegel - The Ford Foundation, August 2003
3 Benchmarks and Investment Management by Laurence B. Seigl, The Ford Foundation
4 Does Your Benchmark Measure Up? by Carl Bacon, CIPM & Neil E. Riddles, CFA, CIPM – CFA Institute 2015

8
In the early 1960’s active managers in the U.S. tried to find a measurable, indisputable
way in which they could quantify and present to clients the value added by their actions.
Russell Investments designed a benchmark mirroring the aggregate performance of all
large companies in the U.S. equity market, hailing it as the first and best-in-class
benchmark. Known as the Russell 3000 index, this benchmark is still widely used today.
Since its introduction, the Russell 3000 has been instrumental in demonstrating that
over long time periods (3+ years), most active managers’ performance falls short of the
benchmark once costs are taken into account. In other words, net of fees, the majority of
active managers deliver negative alpha5.
5 During the same period an important innovation in index construction was made by the Standard
Securities Corporation (now Standard & Poor’s), which had, as early as 1923, constructed the first market-
capitalisation weighted index. This index, a composite of 223 securities, later evolved into what is known
today as the S&P 500 Index.
9
3.1 The Evidence
The argument that most active managers’ performance falls short of the market
benchmark is supported by evidence from numerous independent and impartial
sources.
In 1991, Professor William F. Sharpe published an article explaining the fundamental
mathematical principles that apply to investment professionals6, and why they are
destined to always – as a collective – fall short of the index (or ‘the market’). This
assertion was bolstered in 2005 in a comprehensive academic paper by Barras, Scaillet
and Wermers7. Aiming to differentiate between skill and luck in investment
management, the research looked at the performance of 1,456 mutual funds in the U.S.
that have trackable performance at any time between 1975 and 2002. It concludes: “we
find that 76.6% of them have zero alphas. 21.3% yield negative performance and the
remaining 2.1% with positive alphas are located at the extreme right tail.”
The U.S. analysis was followed by a similar academic study focused on the United
Kingdom, published in 20088. Data covered the performance of 935 Unit Trusts and
Open Ended Investment Companies (OEICs), representing almost the entire set of
equity funds that existed during the sample period of April 1975 to December 2002. The
paper concludes: “we find stock picking ability for somewhere between 5% and 10% of
top performing UK equity mutual funds (i.e. performance which is not solely due to
good luck). This is broadly consistent with recent US empirical evidence”.
6 The Arithmetic of Active Management by William F. Sharpe, Financial Analysts Journal January-February 1991
7 False Discoveries in Mutual Fund Performance: Measuring Luck in Estimated Alphas by L. Barras , O. Scaillet and R. Wermers,
September 2005
8 UK mutual fund performance: Skill or luck? by Keith Cuthbertson, Dirk Nitzsche and Niall O'Sullivan, Journal of Empirical
Finance, October 2007
10
Academics are not alone in scrutinising the performance of investment managers. The
Financial Conduct Authority recently conducted its own independent market study of
the asset management sector9. The interim report, published in late 2016, concludes:
“Our evidence suggests that actively managed investments do not outperform their
benchmarks after costs”. Perhaps more worrying is the FCA’s statement that: “fund
performance is not always reported against an appropriate benchmark”.
9 https://www.fca.org.uk/publications/market-studies/asset-management-market-study
11
3.2 Common Practices
Evidence of lacklustre performance by the investment management industry makes
benchmarking even more important. Investors need an effective tool with which to
identify zero or negative performance by managers. This tool must enable the investor
to isolate the effect of manager skill on his / her portfolio in order to hold the manager
accountable.
Off-the shelf solutions provided by the industry for assessing added value are limited in
number and often present significant drawbacks. Examples include:
Market Indices
There exist a large number of regulated, publicly available indices, each of which
represents a theoretical portfolio designed to reflect a market or segment. The better
known indices (FTSE, MSCI, S&P DJI) provide a good overview of the performance of
the broader markets, and these have been supplemented in recent years by specialist
indices reflecting sectors, factors and specialist strategies.
Market indices are valuable components of a benchmarking strategy as they provide
insight into the inherent return of a given market sector. However, they are often not
suitable as standalone benchmarks for multi-asset portfolios for the following reasons:
Publicly available indices are generally restricted to a single asset class (e.g.
equity, debt, money markets, commodities), and are therefore not directly
applicable to a multi-asset portfolio. For this reason the development of bespoke
composites of publicly available indices is generally required for benchmarking
purposes.
Many of the recognised global indices focus on the larger issuers in each
geography / sector, and lack the granularity necessary to reflect the performance
12
of the entire market. More specifically (in relation to equity markets) they tend
not to capture the performance of small and micro-cap companies. A bespoke
selection of granular region indices is therefore likely to be more representative of
the market opportunity.
So while public market indices are a valuable component of a proper benchmarking
process, they are not a solution in their own right.
Morningstar Rating™
The Morningstar Rating, most commonly referred to as the “star rating,” is a
quantitative, backward-looking measure of performance. It is based on a fund’s risk-
and cost-adjusted historical performance over 3, 5, and 10 year periods and helps
investors to quickly and easily assess a fund’s track record relative to its peer group10.
The Morningstar star rating is very effective in identifying managers who have been
successful in the past, with the benefit of hindsight; however, it is far less effective when
trying to identify a manager who will be successful in the future.
Past performance is not a reliable indicator of future results. Asset managers are
required by regulators to add this disclosure to retail communications in recognition of
the proven lack of correlation between past and future performance.
The FCA, in its report on asset management, agrees: “our analysis shows that over our
assessment period ratings and best buy lists did not on average identify funds that
outperformed their Morningstar category benchmarks”; and “Gold, Silver or Bronze
rated funds did not outperform their Morningstar category benchmarks”.
10 www.morningstar.co.uk/uk/research/funds/about.aspx
13
Peer Group Indices
The investment consulting industry is another source for readily available
benchmarking solutions. Acutely aware that very few active managers persistently
outperform the market, the investment consulting industry favours a relative
performance approach, and has constructed a number of peer group indices for this
purpose. This technique allows managers to be measured against their peers in a
number of ‘risk buckets’, on a spectrum from low to high risk profiles. This discipline is
effective in identifying the best performing asset managers in a given market, again
largely on the basis of historical track record.
In the private wealth management space, peer group benchmarks are ubiquitous,
notably those maintained by Asset Risk Consultants (ARC) and The Enhance Group
(Enhance). Peer indices include the ARC PCI, STEP TMPI, PIMFA (Private Investor
Series), and The Investment Association Fund Sectors.
The ARC PCI and STEP TMPI focus not on fund managers, but on the performance of
discretionary private client investment managers. This is to ensure that they reflect real-
world client experience, inclusive of transaction and custody costs.
Peer group comparison has certain limitations:
The mean return of the peer group ignores the inherent opportunity set available
to the investor. By comparing managers to their peers one may end up identifying
“the tallest dwarf in the room”, but with no real sense of how tall the market is.
Consultant reports typically show the rating of a given manager by quartile or
decile. However, even top decile performance does not necessarily equate to
having outperformed the opportunity set.
Peer groups are sensitive to inconsistency. Strategies that have failed to live up to
the expected returns tend to either be terminated or merged into more successful
14
funds. Therefore, the track record of the peer groups may be biased towards the
successful and moderately successful managers.
Investors will have a natural desire to ensure that their manager is best in class;
however this desire must logically sit alongside a requirement that the portfolio return
at least meets the tangible market return after all costs.
SPIVA ®
The SPIVA Scorecard is a widely-referenced research project conducted and published
by S&P DJI (Dow Jones Indices) which compares actively managed funds against
market benchmarks on a semi-annual basis11. S&P DJI produces scorecards in the
following countries and regions: Australia, Canada, Europe, India, Japan, Latin
America, South Africa, and the U.S.
The latest SPIVA analysis shows that in the U.S., out of a total of 703 funds open for
investment four years ago, only two funds (0.3%!) have delivered positive alpha to their
investors.
SPIVA takes a macro view on the investment industry, and does not provide a bespoke,
micro view, on any individual active manager or portfolio, so it is of limited value for
measuring the performance of an individual portfolio.
Sparrows Capital does not argue that all current forms of benchmarking should be
dismissed. We argue that the existing methods of benchmarking all have their respective
merits and should be used when applicable. However, they all fail, in isolation, to
provide investors with the objective, tangible, bespoke and easy-to-use tool to measure
the performance of their selected managers, and ensure they receive value for money.
11 https://us.spindices.com/spiva/
15
3.3 A Complementary Approach
The primary benefit of an appropriate benchmark for a portfolio is that it clearly
highlights the value for money provided by the manager.
In the view of Sparrows Capital, a portfolio should therefore be measured against a real-
world benchmark portfolio which fulfils the following criteria:
Appropriately Weighted – tailored to the mandate. Market-cap weighting is
the most widely accepted basis of index construction
Complete – encapsulating the performance of the full relevant investible universe
/ opportunity set
Systematic – strictly adhering to objective and transparent predefined rules,
regardless of changing market conditions
Transparent – derived from a complete data set in a transparent, auditable
manner and be presented in a simple fashion
Accepted – trusted by the client
Net of all costs – taking account of OCF, transaction fees, custody and advice
A market benchmark may comprise a single market index or a composite of multiple
indices, depending on the granularity and sophistication of the portfolio design.
Benchmarks for multi-asset portfolios are composites of multiple market indices, and
the number of component parts will grow as asset classes, sub-asset classes or factor
tilts are included in the design.
Market indices themselves are not directly investible, and as such they represent the
theoretical return of portfolio. The theoretical return does not account for the frictional
costs of replication using real traded instruments, and therefore overstates the
performance that would be achievable in the real world. Replication of the composite
16
indices using ETFs and Index Funds, on the other hand, does provides true, tangible,
auditable evidence of the inherent returns available after all costs.
An implementation of the portfolio benchmark using ETFs and index funds therefore
fulfils the requirements of a good benchmark but adds the further benefits of being fully
investible and of proving the inherent return achievable from the portfolio design –
before the application of manager skill. This process transforms the theoretical
benchmark return into a tangible benchmark return.
Sparrows Capital advocates investing a portion of any portfolio into a tangible clone of
the benchmark, with multiple benefits to the investor:
clear, continuous, real-life evidence of the beta returns deriving from the
opportunity set
explanation of market-induced portfolio performance and associated volatility
measurement of the added value, or alpha, provided by the actively managed
portion of the portfolio over time
Applying this technique alongside other benchmarking techniques ensures that any
assessment of the performance of an incumbent manager looks at two comparisons,
both on a net of costs basis:
How they have performed relative to their peers – ideally, of course, a manager
should be best in class
How they performed relative to the opportunity set – but best in class means
nothing if the portfolio underperforms the market
With these comparisons in place, investors and their advisors are far better equipped to
identify and assess the value added through skill as well as identifying and addressing
any historical underperformance.
17
Section 4: Case Study
We use a real life example to show how Sparrows Capital approaches analysis of
historical portfolio performance relative to the portfolio benchmark.
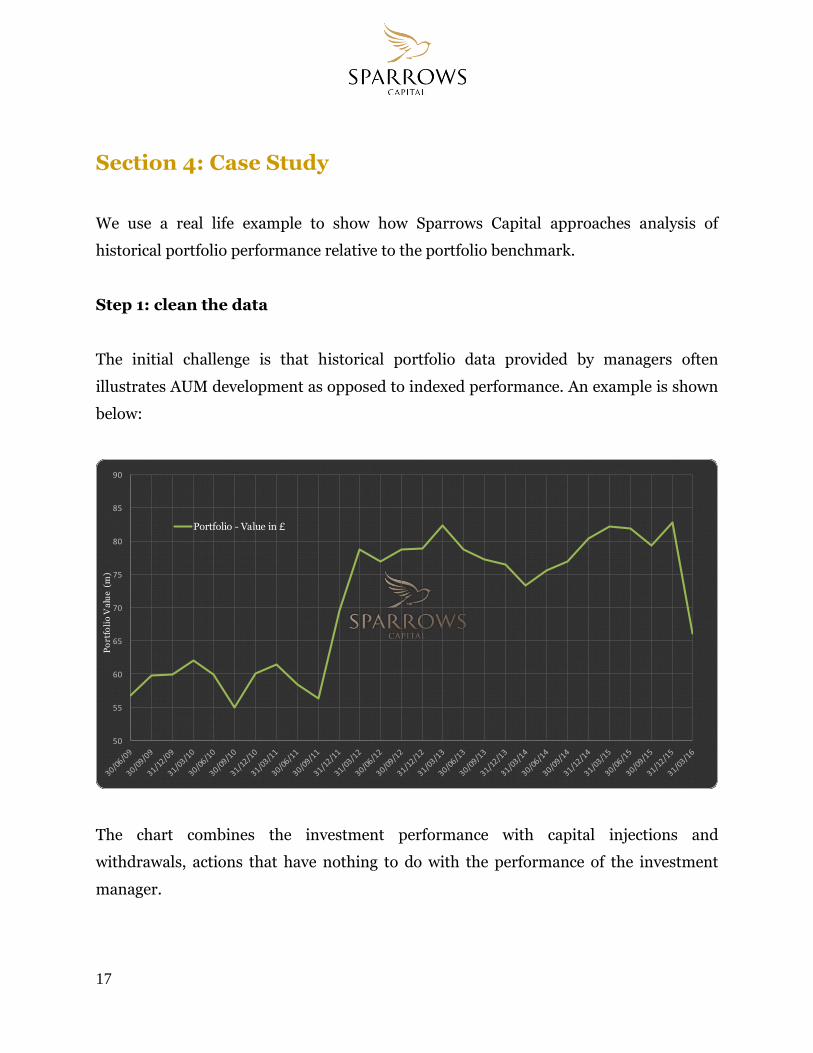
Step 1: clean the data
The initial challenge is that historical portfolio data provided by managers often
illustrates AUM development as opposed to indexed performance. An example is shown
below:
50
55
60
65
70
75
80
85
90
Po
rtfo
lio
Va
lue
(m
)
Portfolio - Value in £
The chart combines the investment performance with capital injections and
withdrawals, actions that have nothing to do with the performance of the investment
manager.
18
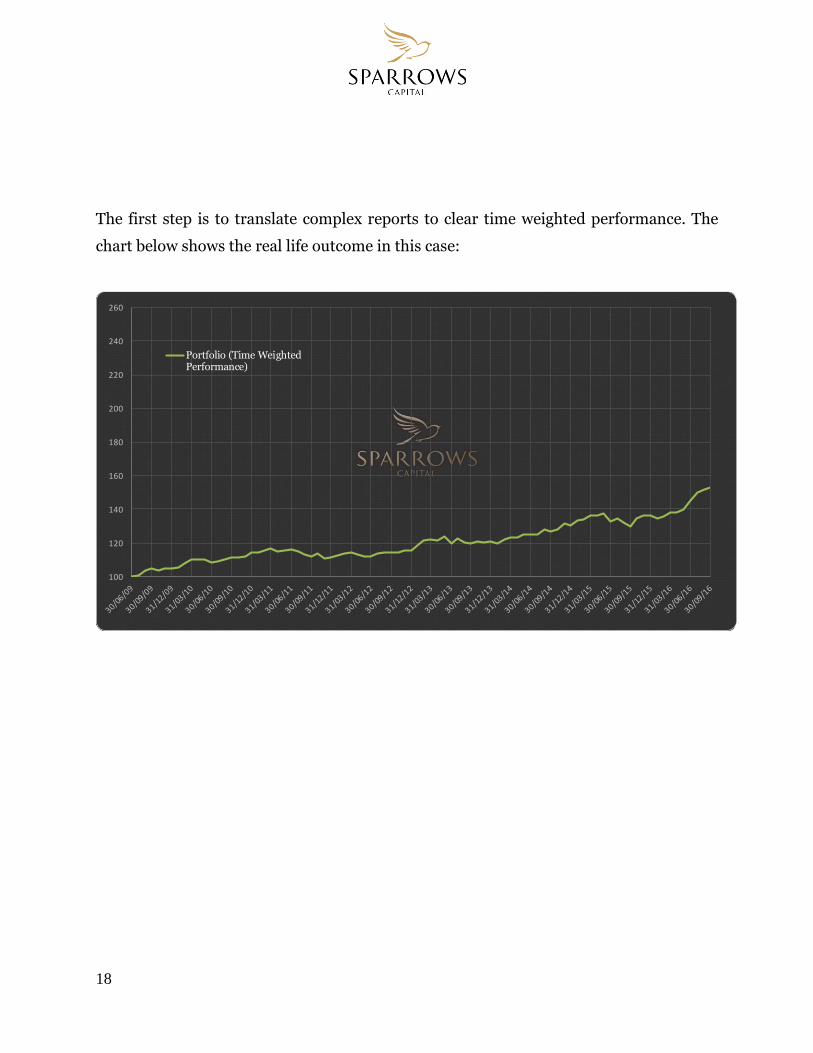
The first step is to translate complex reports to clear time weighted performance. The
chart below shows the real life outcome in this case:
100
120
140
160
180
200
220
240
260
Portfolio (Time WeightedPerformance)
19
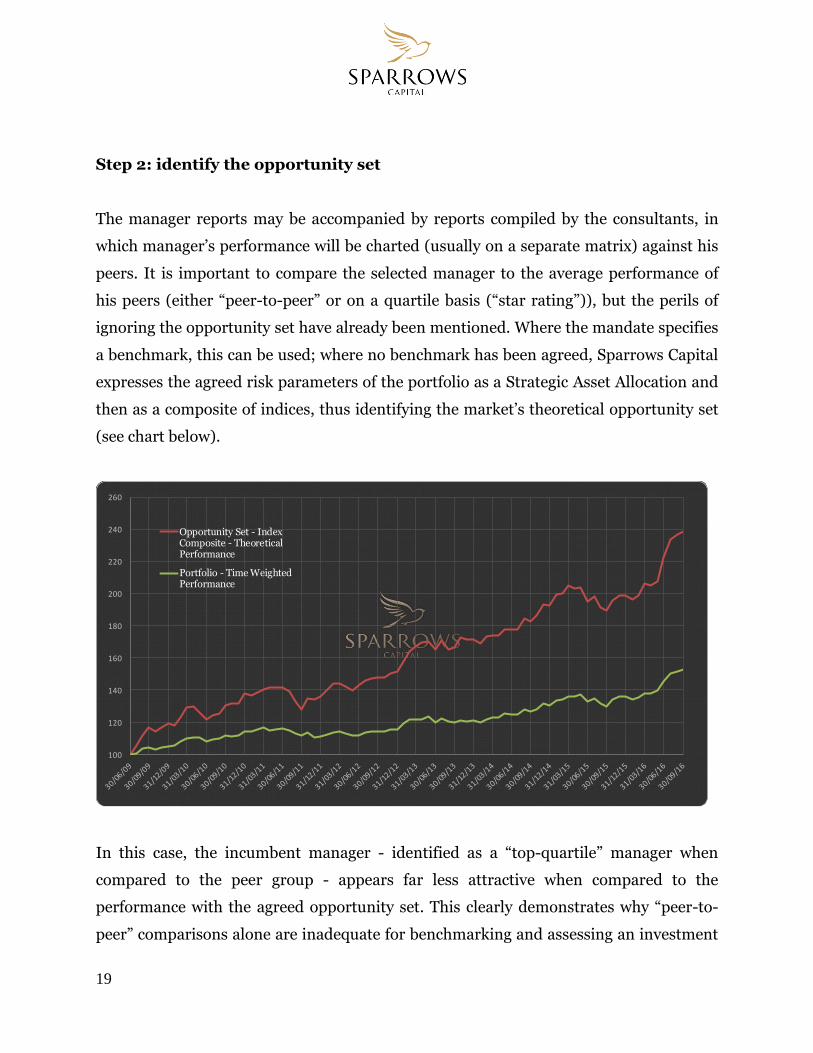
Step 2: identify the opportunity set
The manager reports may be accompanied by reports compiled by the consultants, in
which manager’s performance will be charted (usually on a separate matrix) against his
peers. It is important to compare the selected manager to the average performance of
his peers (either “peer-to-peer” or on a quartile basis (“star rating”)), but the perils of
ignoring the opportunity set have already been mentioned. Where the mandate specifies
a benchmark, this can be used; where no benchmark has been agreed, Sparrows Capital
expresses the agreed risk parameters of the portfolio as a Strategic Asset Allocation and
then as a composite of indices, thus identifying the market’s theoretical opportunity set
(see chart below).
100
120
140
160
180
200
220
240
260
Opportunity Set - IndexComposite - TheoreticalPerformance
Portfolio - Time WeightedPerformance
In this case, the incumbent manager - identified as a “top-quartile” manager when
compared to the peer group - appears far less attractive when compared to the
performance with the agreed opportunity set. This clearly demonstrates why “peer-to-
peer” comparisons alone are inadequate for benchmarking and assessing an investment
20
manager, and shows how Sparrows Capital works to address the concerns expressed by
the FCA and others.
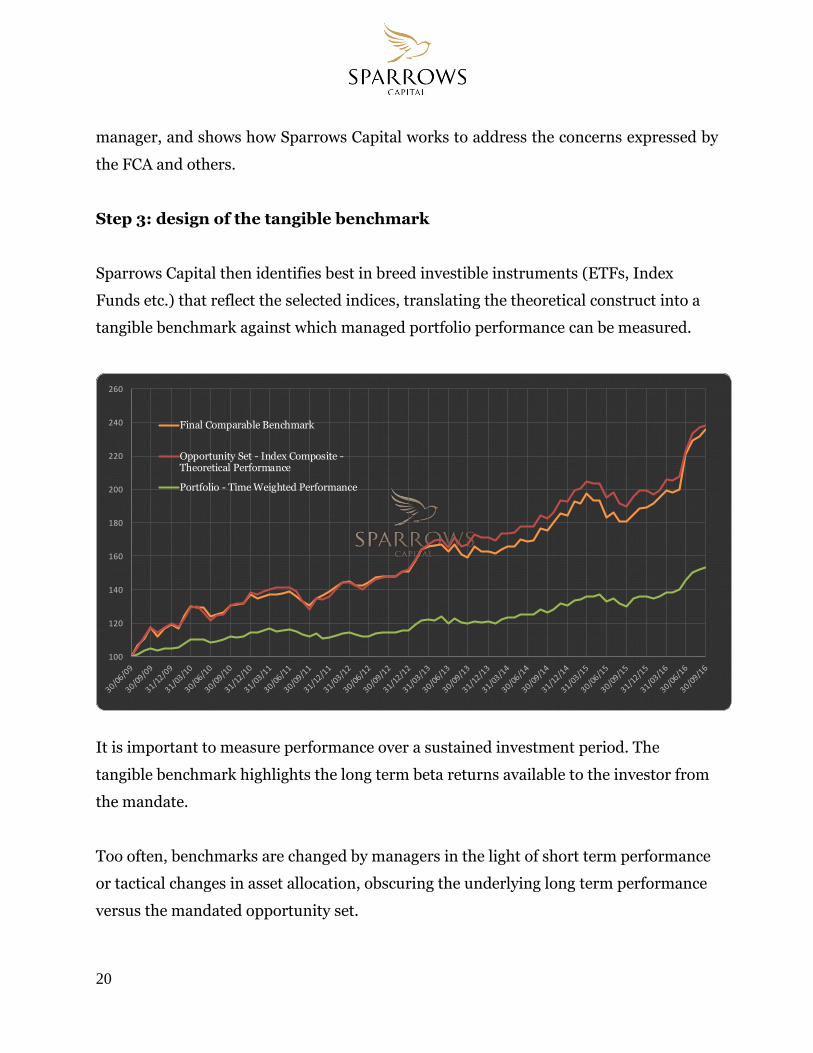
Step 3: design of the tangible benchmark
Sparrows Capital then identifies best in breed investible instruments (ETFs, Index
Funds etc.) that reflect the selected indices, translating the theoretical construct into a
tangible benchmark against which managed portfolio performance can be measured.
100
120
140
160
180
200
220
240
260
Final Comparable Benchmark
Opportunity Set - Index Composite -Theoretical Performance
Portfolio - Time Weighted Performance
It is important to measure performance over a sustained investment period. The
tangible benchmark highlights the long term beta returns available to the investor from
the mandate.
Too often, benchmarks are changed by managers in the light of short term performance
or tactical changes in asset allocation, obscuring the underlying long term performance
versus the mandated opportunity set.
21
With this analysis, the investor now has a powerful tool with which to observe how their
investment managers fare since inception of the mandate. It also highlights any short
term performance anomalies, providing the basis for in-depth discussion of the drivers
of recent relative returns. Managers are paid to outperform benchmarks, and this
mechanism allows the investor to determine whether or not this is being achieved over
time.
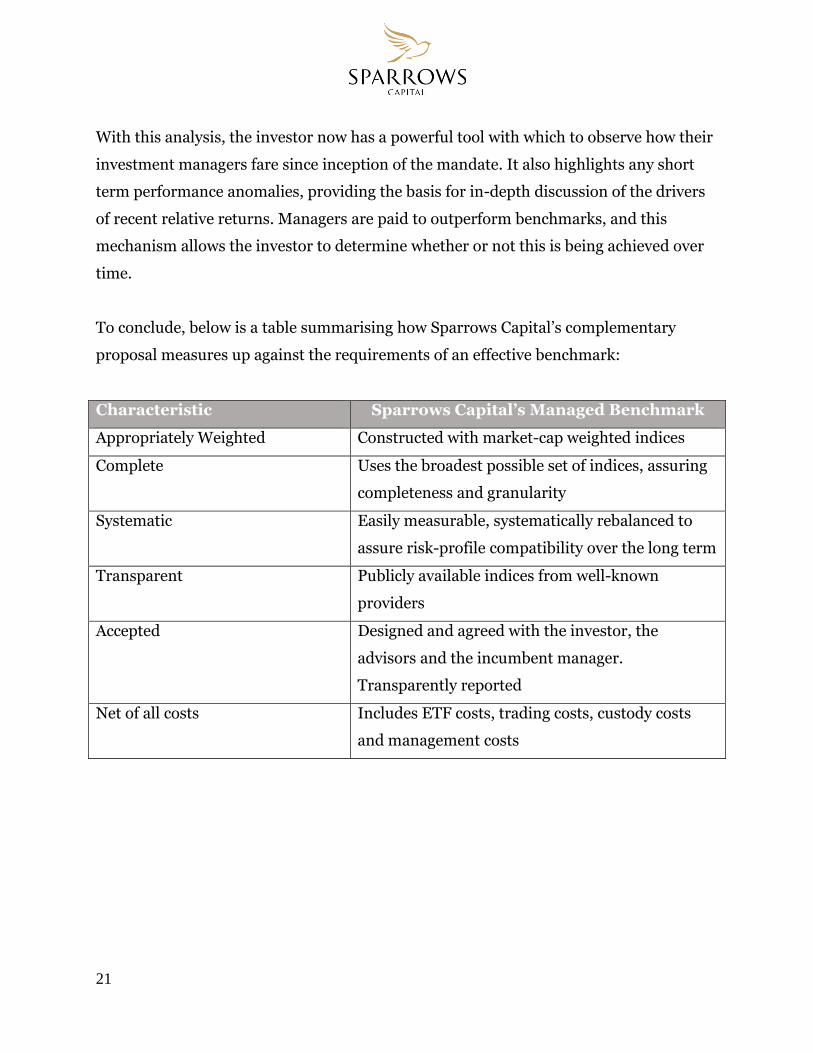
To conclude, below is a table summarising how Sparrows Capital’s complementary
proposal measures up against the requirements of an effective benchmark:
Characteristic Sparrows Capital’s Managed Benchmark
Appropriately Weighted Constructed with market-cap weighted indices
Complete Uses the broadest possible set of indices, assuring
completeness and granularity
Systematic Easily measurable, systematically rebalanced to
assure risk-profile compatibility over the long term
Transparent Publicly available indices from well-known
providers
Accepted Designed and agreed with the investor, the
advisors and the incumbent manager.
Transparently reported
Net of all costs Includes ETF costs, trading costs, custody costs
and management costs
22
Section 5: Implementation
Live benchmarking involves the design and execution of rule-based control portfolios at
a client level. These will be composites of publicly available (regulated) benchmarks,
selected to represent the market opportunity set relevant to the agreed client mandate.
Specification of Portfolio Benchmark
In order to ensure that live portfolio benchmarks are relevant to the particular client
mandates, there are three options of implementation. Selection depends on the level of
detail provided in the client’s Investment Policy Statement, or mandated Strategic Asset
Allocation.
1. Composite Benchmark
Ideally a composite benchmark will have been defined, comprising a set of agreed
indices against which the investment performance will be measured. Where this is the
case, we will refine the composite benchmark to ensure that the indices expressed are all
fully investible. For example, if the composite benchmark includes a hedge fund index,
then we would replace that with an equivalent representative asset class.
2. Strategic Asset Allocation
Where the Investment Policy Statement does not specify a composite benchmark but
defines a broad Strategic Asset Allocation, Sparrows Capital generates an appropriate
composite benchmark using liquid market indices.
23
3. Risk appetite
Where the Investment Policy Statement or general client objective is limited to
describing the client’s risk tolerance, a rule-based model portfolio service (MPS) can
serve as a tangible benchmark. Sparrows Capital’s own suite of models comprises 10
standard portfolios, 5 portfolios in each denominated currency (USD and GBP), ranging
on the risk spectrum from risk averse (non-equity) to growth.
In all cases, the output will be a composite index benchmark relevant to the individual
client mandate. Indices are selected to reflect the liquid investible universe taking
account of any proposed factor tilt. Sparrows Capital tends to avoid global products in
favour of regional indices in order to achieve the appropriate granularity; similarly we
take care to ensure that the selected indices do not stray into excessively illiquid or
inefficient segments of the market.
ETF Screening and Selection
The ETFs and index funds tracking the selected indices are then screened and evaluated.
We score the relevant instruments for tracking difference, liquidity and cost. We review
the fund prospectus, with a focus on structure, methodology, counterparty risk, and
lending policies. An investible portfolio is constructed with a view to maximising
liquidity and minimising tracking difference.
Rebalancing
Benchmark portfolios should rebalanced on a systematic basis without engaging in
tactical allocation or market timing.
Portfolio Management

24
ETFs must be monitored for liquidity and tracking error, and individual instruments
replaced where necessary.
Performance Reporting
It is important that the benchmark portfolio is incorporated into the clients’ existing
reporting structure to facilitate future performance comparison.
Advantages of a Live Portfolio Benchmark
The benefits of this proposition are clear. By clearly demonstrating the beta returns
available (expressed as real money), the client will be able to properly assess their active
mandates and the alpha they are achieving.
Our suggestion is to allocate between 5% and 20% of each client’s portfolio to a live
benchmark.
25
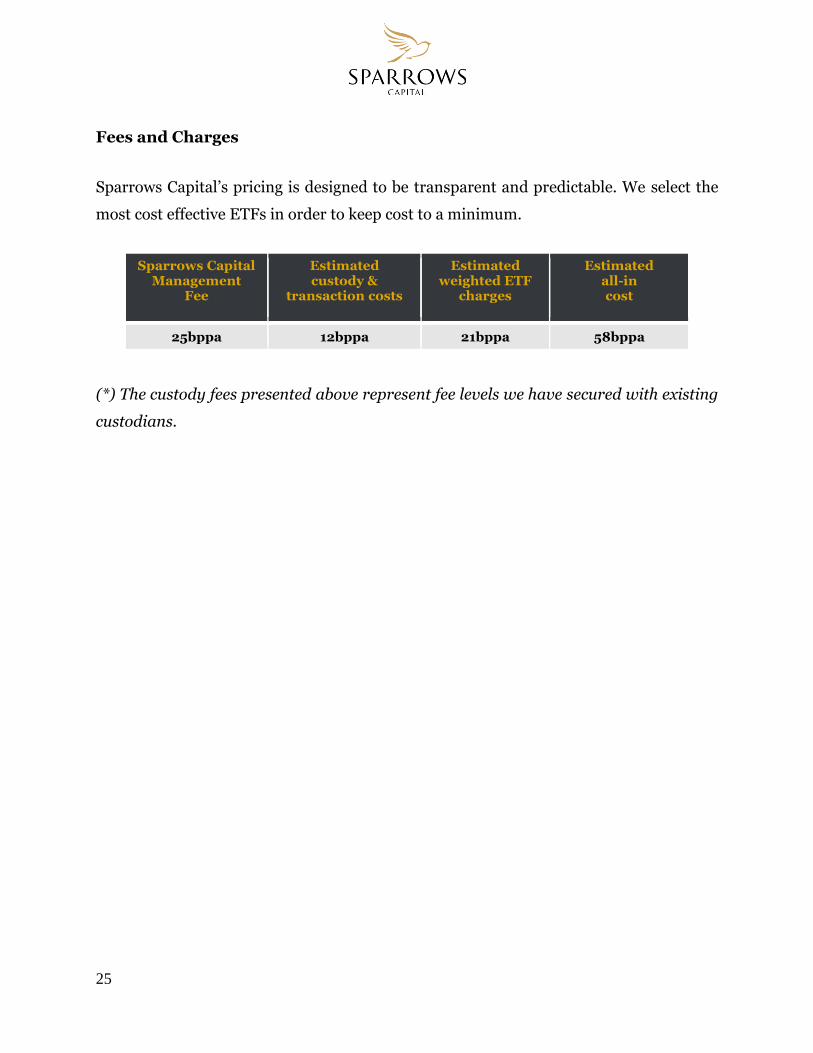
Fees and Charges
Sparrows Capital’s pricing is designed to be transparent and predictable. We select the
most cost effective ETFs in order to keep cost to a minimum.
Sparrows Capital Management
Fee
Estimated custody &
transaction costs
Estimated weighted ETF
charges
Estimated all-in cost
25bppa 12bppa 21bppa 58bppa
(*) The custody fees presented above represent fee levels we have secured with existing
custodians.

26
Appendix 1: Key People
Yariv Haim, Founder and CEO, has over ten years of experience in
evidence-based investing, risk management and asset allocation. He has
worked with the founding family for more than 20 years. Yariv is a sought-
after lecturer in wealth management and efficient investing strategies. He
holds a BA in Economics and an Executive MBA from Tel-Aviv University.
Listed in the wealth manager category of the 2018 Spear’s 500.
Professor Elroy Dimson, Consultant to the Board co-directs
Cambridge University’s Centre for Endowment Asset Management and is
Emeritus Professor of Finance at London Business School. Until 2016 he
chaired the Strategy Council for Norway’s sovereign wealth fund and advised
several large funds. A co-designer of the FTSE 100 index, Elroy chairs FTSE
Russell’s advisory and policy boards, and serves on the Council of Financial
Analysts Journal. He is past President of the European Finance Association,
and Honorary Fellow of the Institute of Actuaries and the CFA Society of the
UK. His publications include Triumph of the Optimists, Endowment Asset
Management, and the Global Investment Returns Yearbook. He has received
numerous awards for his research on investing for the long term. Elroy’s PhD
is from London Business School.
Dr. Raymond Backreedy has over a decade of professional experience
within the financial marketplace. His experience includes hands-on research,
development and management of quantitative models and portfolios. He was
a founding partner at Evolutionary Trading and Tekio Capital, and consultant
to the executive committee and board of trustees of a large Dutch pension
fund. Raymond has a PhD and MEng from the University of Leeds.

27
William Ladenburg started his career as an accountant before moving to
WH Ireland as an Assistant Investment Manager where he spent 4 years. He
joined Close Brothers in January 2010 as a Private Client Adviser before
helping to set up the Client Relationship and Business Development teams
which he managed until his departure to Sparrows Capital. William is a
Member of the Chartered Institute of Securities and Investment and in 2014
was named in the PAM Top 40 under 40.
Mark Northway is a seasoned financial markets practitioner with wide
ranging managerial and governance experience across credit, fixed income,
equity and treasury markets. His knowledge spans multiple disciplines
including marketing, asset management, trading, investment and the
management of complex financial and regulatory risk. He has previously
worked for Brookfield, LBBW, Rabobank and Standard Chartered Bank.
Steven Fogel, Chairman Until March 2012, Steven was managing partner
of the London office of international law firm Dechert LLP, where he also
served for many years as a board member. He was the senior partner at
Titmuss Sainer before its merger in 2000. In addition, from 2008 to 2010, he
was on the advisory board of surveyors CWM.
Today, he is Chair of Uropharma, a medical device company, is a non-
executive member of the board of international solicitors, King & Wood
Mallesons, formerly SJ Berwin LLP, and is an adviser to the Landon Family
Trusts. As well as being on the University of London’s Board of Trustees,
Steven has also worked with a number of not-for-profit organisations,
including the international wheelchair charity Motivation, and the Freud
Museum.
Marianne Bruce after graduating from the University of Nottingham with a
BEng, Marianne began her career as an analytics operative at Richard Davies
Investor Relations Limited. She joined Sparrows Capital in 2017, and is
currently studying to gain her IMC qualification.