Embed Size (px)
Citation preview

1Subject to change without notice
®
Instruments
Manual
Spectrum-AnalyzerHM5012/14
SoftwareSW5012
EN
GLIS
H
MANUAL•HANDBUCH•MANUEL

2 Subject to change without notice
Spectrumanalyzer HM5012/HM5014
General information regarding the CE marking ............................ 4
Technical Characteristics .................................................................. 6
The Interface .................................................................................. 7The Software ................................................................................. 7HZ530 EMI Near Field Sniffer Probe Set(Optional accessories) . 10Specifications ............................................................................... 10
General Information ........................................................................ 11
Symbols ....................................................................................... 11Tilt handle ..................................................................................... 11Safety ........................................................................................... 12Operating Conditions ................................................................... 13Warranty ....................................................................................... 13Maintenance ................................................................................ 14Selecting the Line Voltage ........................................................... 14Introduction .................................................................................. 15Operating Instructions ................................................................. 16
Control Elements ............................................................................. 17
Operation - first steps ..................................................................... 27
Introduction to Spectrum Analysis ............................................... 29
Types of Spectrum Analyzers ...................................................... 30Spectrum Analyzer Requirements ............................................... 32Frequency Measurements ........................................................... 32Resolution .................................................................................... 33Sensitivity ..................................................................................... 33Video Filtering .............................................................................. 34Spectrum Analyzer Sensitivity ..................................................... 35Frequency Response ................................................................... 36Tracking Generators ..................................................................... 36
CODES for serial Interface RS232 ................................................... 38
St.
201
000
Zim
/tke

3Subject to change without notice
Table of contents
Software SW5012
Software package SW5012 ............................................................ 42
Pulldown Menu 1: ............................................................................ 42
Data .............................................................................................. 42
Pulldown Menu 2: (Command Mode Normal) ............................. 45
Settings ........................................................................................ 45
Pulldown Menu 3: ............................................................................ 45
Operating Modes ......................................................................... 46Normal Mode ............................................................................... 46Correction on ............................................................................... 46Calculation on ............................................................................... 46EMC Mode Functions, Software tasks ....................................... 47Definition of new components .................................................... 48Configuration of a test system .................................................... 50Definition of limit lines ................................................................. 51Define Test ................................................................................... 52
EMC Test Procedure ........................................................................ 54
4 Subject to change without notice
General information regarding the CE marking
HAMEG instruments fulfill the regulations of the EMC directive. The conformity test madeby HAMEG is based on the actual generic- and product standards. In cases where diffe-rent limit values are applicable, HAMEG applies the severer standard. For emission thelimits for residential, commercial and light industry are applied. Regarding the immunity(susceptibility) the limits for industrial environment have been used.
The measuring- and data lines of the instrument have much influence on emmission andimmunity and therefore on meeting the acceptance limits. For different applications thelines and/or cables used may be different. For measurement operation the following hintsand conditions regarding emission and immunity should be observed:
1. Data cables
For the connection between instruments resp. their interfaces and external devices,(computer, printer etc.) sufficiently screened cables must be used. Without a specialinstruction in the manual for a reduced cable length, the maximum cable length of a datalinemust be less than 3 meters and not be used outside buildings. If an interface has severalconnectors only one connector must have a connection to a cable.
Basically interconnections must have a double screening. For IEEE-bus purposes the doublescreened cables HZ72S and HZ72L from HAMEG are suitable.
2. Signal cables
Basically test leads for signal interconnection between test point and instrument shouldbe as short as possible. Without instruction in the manual for a shorter length, signal linesmust be less than 3 meters and not be used outside buildings.
Signal lines must screened (coaxial cable - RG58/U). A proper ground connection is required.In combination with signal generators double screened cables (RG223/U, RG214/U) mustbe used.
3. Influence on measuring instruments.
Under the presence of strong high frequency electric or magnetic fields, even with carefulsetup of the measuring equipment an influence of such signals is unavoidable.This will not cause damage or put the instrument out of operation. Small deviations of themeasuring value (reading) exceeding the instruments specifications may result from suchconditions in individual cases.
December 1995HAMEG GmbH
5Subject to change without notice
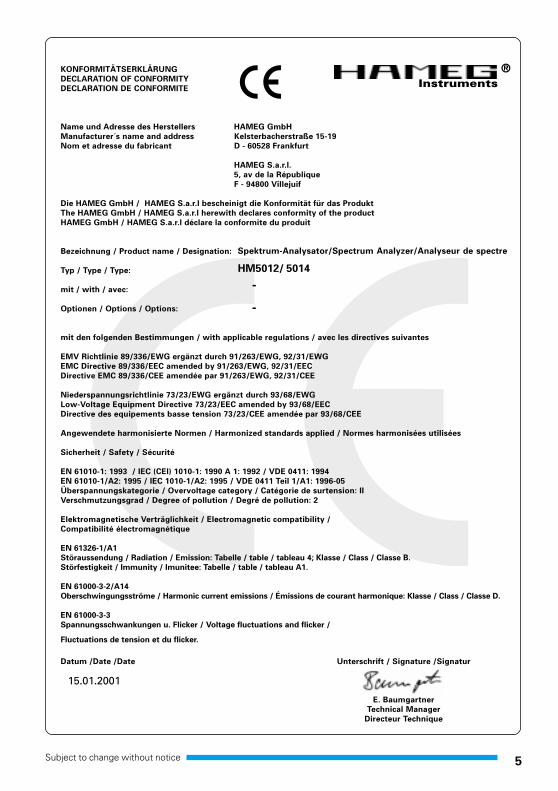
KONFORMITÄTSERKLÄRUNG
DECLARATION OF CONFORMITY
DECLARATION DE CONFORMITE
Name und Adresse des Herstellers HAMEG GmbH
Manufacturer´s name and address Kelsterbacherstraße 15-19
Nom et adresse du fabricant D - 60528 Frankfurt
HAMEG S.a.r.l.
5, av de la République
F - 94800 Villejuif
Die HAMEG GmbH / HAMEG S.a.r.l bescheinigt die Konformität für das Produkt
The HAMEG GmbH / HAMEG S.a.r.l herewith declares conformity of the product
HAMEG GmbH / HAMEG S.a.r.l déclare la conformite du produit
Bezeichnung / Product name / Designation:
Typ / Type / Type:
mit / with / avec:
Optionen / Options / Options:
mit den folgenden Bestimmungen / with applicable regulations / avec les directives suivantes
EMV Richtlinie 89/336/EWG ergänzt durch 91/263/EWG, 92/31/EWG
EMC Directive 89/336/EEC amended by 91/263/EWG, 92/31/EEC
Directive EMC 89/336/CEE amendée par 91/263/EWG, 92/31/CEE
Niederspannungsrichtlinie 73/23/EWG ergänzt durch 93/68/EWG
Low-Voltage Equipment Directive 73/23/EEC amended by 93/68/EEC
Directive des equipements basse tension 73/23/CEE amendée par 93/68/CEE
Angewendete harmonisierte Normen / Harmonized standards applied / Normes harmonisées utilisées
Sicherheit / Safety / Sécurité
EN 61010-1: 1993 / IEC (CEI) 1010-1: 1990 A 1: 1992 / VDE 0411: 1994
EN 61010-1/A2: 1995 / IEC 1010-1/A2: 1995 / VDE 0411 Teil 1/A1: 1996-05
Überspannungskategorie / Overvoltage category / Catégorie de surtension: II
Verschmutzungsgrad / Degree of pollution / Degré de pollution: 2
Elektromagnetische Verträglichkeit / Electromagnetic compatibility /
Compatibilité électromagnétique
EN 61326-1/A1
Störaussendung / Radiation / Emission: Tabelle / table / tableau 4; Klasse / Class / Classe B.
Störfestigkeit / Immunity / Imunitee: Tabelle / table / tableau A1.
EN 61000-3-2/A14
Oberschwingungsströme / Harmonic current emissions / Émissions de courant harmonique: Klasse / Class / Classe D.
EN 61000-3-3
Spannungsschwankungen u. Flicker / Voltage fluctuations and flicker /
Fluctuations de tension et du flicker.
Datum /Date /Date Unterschrift / Signature /Signatur
E. Baumgartner
Technical Manager
Directeur Technique
Instruments®
HM5012/ 5014
-
-
Spektrum-Analysator/Spectrum Analyzer/Analyseur de spectre
15.01.2001

6 Subject to change without notice
Continuous frequency range from 150 kHz to 1050 MHz.
Amplitude range from –100 dBm to +13 dBm
(7 dBµV to 120 dBµV) 80 dB on-screen
Resolution bandwidths of 9 kHz, 120 kHz, 400 kHz
Intermodulation-free dynamic range 75 dB
Save / Recall
HM5012 & HM5014, the Spectrum Analyzers
for EMC Measurements
Technical Characteristics
The new spectrum analyzer HM5012and HM5014 is based in general on thehigh frequency characteristics of theHM5010 and the HM5011 analyzers. Theusable frequency range is therefore from150 kHz to above 1 GHz. The availableresolution bandwidths are 9kHz, 120kHzand 400 kHz. Completely new is primarilythe processor-controlled operation and adigital signal display which works in real-time, and is resolved with up to 4,000points over the entire screen. The screenwill also display all selected frequencysettings and the marker results.
The unique features of this spectrumanalyzer are the extensive EMC measure-ment capabilities. These include the am-plitude indication in Peak and Averagemodes. For the precise evaluation of thesignals a marker is provided that will givea readout for amplitude and frequency on-screen.
An additional advantage is that newlyacquired signals can be compared withthe content of the reference storage.Complicated and repeatedly used equip-ment adjustments can be saved by use ofthe Save/Recall function.
7Subject to change without notice
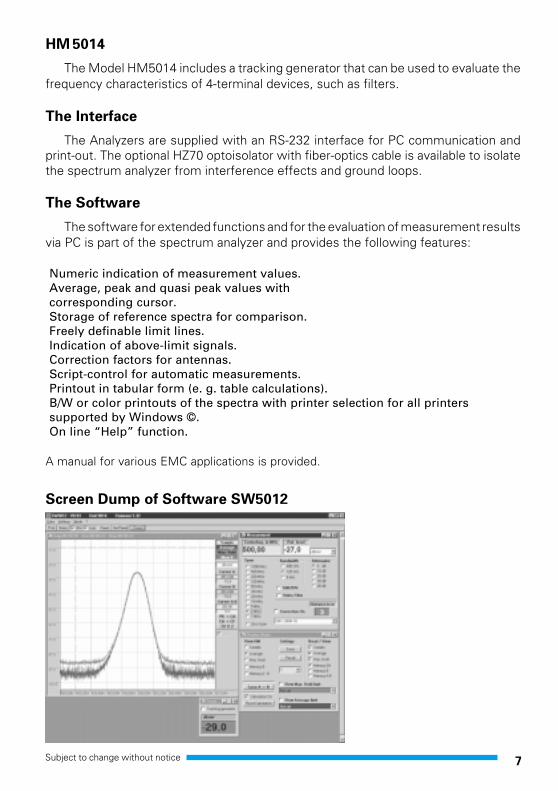
HM 5014
The Model HM5014 includes a tracking generator that can be used to evaluate thefrequency characteristics of 4-terminal devices, such as filters.
The Interface
The Analyzers are supplied with an RS-232 interface for PC communication andprint-out. The optional HZ70 optoisolator with fiber-optics cable is available to isolatethe spectrum analyzer from interference effects and ground loops.
The Software
The software for extended functions and for the evaluation of measurement resultsvia PC is part of the spectrum analyzer and provides the following features:
Numeric indication of measurement values.Average, peak and quasi peak values withcorresponding cursor.Storage of reference spectra for comparison.Freely definable limit lines.Indication of above-limit signals.Correction factors for antennas.Script-control for automatic measurements.Printout in tabular form (e. g. table calculations).B/W or color printouts of the spectra with printer selection for all printerssupported by Windows ©.On line “Help” function.
A manual for various EMC applications is provided.
Screen Dump of Software SW5012

8 Subject to change without notice
Specifications
Frequency
Frequency Range: 0.15 MHz to 1050MHzFrequency Resolution displayed: 10kHz (5½ Digit in Readout)Center Frequency Range 0.15 MHz - 1050 MHzAccuracy: ±100kHzStability (Drift): <150kHz / hourSpan: Zero span and 100kHz/Div to 100MHz/Div
in steps of 1-2-5-10Accuracy: ±5%Marker: absolute MarkerMarker Resolution (Frequency) 5½ digitsMarker Resolution (Level) 3½ digits
Marker Readout Accuracy: ±(0.1% span + 100kHz)Resolution Bandwidth, RBW (3dB): 9kHz, 120kHz and 400kHzVideo Bandwidth, VBW: 4kHzSWT (fixed): 40ms, 320ms, 1s(1)
Amplitude
Measurement Range: –100dBm to +13dBmDisplayed Average Noise Level: –102dBm (120kHz RBW)Frequency Response
Relative to 500 MHz, ATTN 10 dB ±2 dBInput Attenuator Range: 40 dB, 10 dB stepsAccuracy (reference level): ±1 dBMaximum Safe Input Level
Attenuator setting 20db: +20 dBm (0,1W)Attenuator setting 0dB: +10 dBmDC: ±25 V
Display Range: 40, 80 dB, 8 DivisionsScale Units dBmReference Level: -99 to +13 dBm (+var.)Resolution Bandwidth Switching Uncertainty: ±1dBSpurious responses:
Intermodulation (3rd Order): –75 dBc(2 Signals, –27 dBm each, Frequency distance>3MHz)
Harmonic Distortion (2nd, 3rd): <–75 dBcAbsolute Amplitude Accuracy: ±2.5 dB
Inputs / Outputs
Front Panel
Input Connector BNC (F) Impedance: 50ΩProbe Power: 6V (Near field probes)Tracking Generator Out (HM5014) BNC (F) Impedance: 50Ω

9Subject to change without notice
Special Functions
Average 32 measurementsSAVE/RECALL 9 complete Set-upsPeak-Detection
Max. Hold
Hold Trace stored on screenReference Curve
AM-Demodulator Ear Phones
Tracking Generator (only Model HM5014)
Output Frequency Range: 150 kHz to 1050 MHzOutput Power Level –50dBm bis +1dBmOutput flatness (150 kHz to 1 GHz) ±1.0dBSpurious Outputs
Harmonic Spurs >20dBcNon-Harmonic Spurs >20dBc
General
Temperature Range
Operating 10°C to 40° CStorage: –40°C to 70° C
Power Requirements:
Voltage 115 / 230VFrequency 50-60HzPower consumption approx. 43VA
CRT: 8 x 10cmProtective System: Safety Class I (IEC 1010-1)Dimensions W 285, H 125, D 380mmWeight: approx.: 6kg
1) only if EMC set-up is usedSubject to change without notice 06/98
Accessories supplied
Software for evaluation, Documentation and Remote
Control. Power Cable, Operating Manual.
Optional accessories
Optical Interface (RS232) HZ70
Telescope Antenna HZ520
Transient Limiter HZ560
Near Field Probes (E, H, High Imp. Probe) HZ530
LISN (EMC) HM6050

10 Subject to change without notice
HZ530 EMI Near Field Sniffer Probe Set (Optional accessories)
The HZ530 is the ideal toolkit for theinvestigation of RF electromagnetic fields.It is indispensible for EMI pre-compliancetesting during product development, priorto third party testing. The set includes 3hand-held probes with a built-in pre-amplifier covering the frequency range from10 kHz to 1000 MHz depending on probetype. The set includes one magnetic fieldprobe, one electric field probe and onehigh impedance probe. All have highsensitivity and are matched to the 50Ωinputs of spectrum analyzers. The powercan be supplied either from the batteries orthrugh a power cord directly connected toan HM5012/14 series spectrum analyzer.Signal feed is via a 1.5m BNC-cable. Whenused in conjunction with a spectrum analyzeror a measuring receiver, the probes can beused to locate and qualify EMI sources.They are especially suited to locateemission “hot spots” on PCBs and cables,as well as evaluate EMC problems at thebreadboard and prototype level. Theyenable the user to evaluate radiated fieldsand perform shield effectivity comparisons.Mechanical screening performance andimmunity tests on cables and componentsare easily performed. Faulty componentsand poor bonding locations can be isolated.
The magnetic probe incorporates a highdegree of rejection of both stray and directelectric fields, and provides far greater
Specifications
Frequency
Frequency range: 0.1MHz to 1000MHz(lower frequency limit
depends on probe type)Output impedance: 50 ΩOutput connector: BNC-jackInput capacitance: 2pF
(high imped. probe)Max. Input Level: +10dBm
(without destruction)1dB-compression point: -2dBm
(frequency range dependent)DC-input voltage: 20V max.Supply Voltage: 6V DC
4 AA size batteries
Supply-power of HM5012/5014Supply Current: 8mA (H-Field Probe)
15mA (E-FieldProbe)24mA(High imp.Probe)
Probe Dimensions: 40x19x195mm (WxDxL)Housing: Plastic; (electrically
shielded internally)
Package contents: Carrying case1 H-Field Probe1 E-Field Probe1 High Impedance Probe1 BNC cable (1.5m)1 Power Supply Cable
(Batteries or Ni-Cads are not included)
repeatability than with conventional fieldprobes. Measurements can be made on thevery near field area that is close to compo-nents or radiation sources. The electric field(mono-pole) probe has the highestsensitivity of all three probes. It can beused to check screening and perform pre-compliance testing on a comparative basis.The high impedance probe is used tomeasure directly on the componentsunder test or at the conductive trace of a PCboard. It has an input capacitance of only2pF and supplies virtually no electricalcharge to the device under test.
11Subject to change without notice
General Information
The HM5012/14 spectrum analyzer is easy to operate.The logicalarrangement of the controls allows anyone to quickly becomefamiliar with the operation of the instrument, however, experiencedusers are also advised to read through these instructions so thatall functions are understood. Immediately after unpacking, theinstrument should be checked for mechanical damage and looseparts in the interior. If there is transport damage, the supplier mustbe informed immediately. The instrument must then not be putinto operation.
Symbols
ATTENTION - refer to manual
Danger - High voltage
Protective ground (earth) terminal
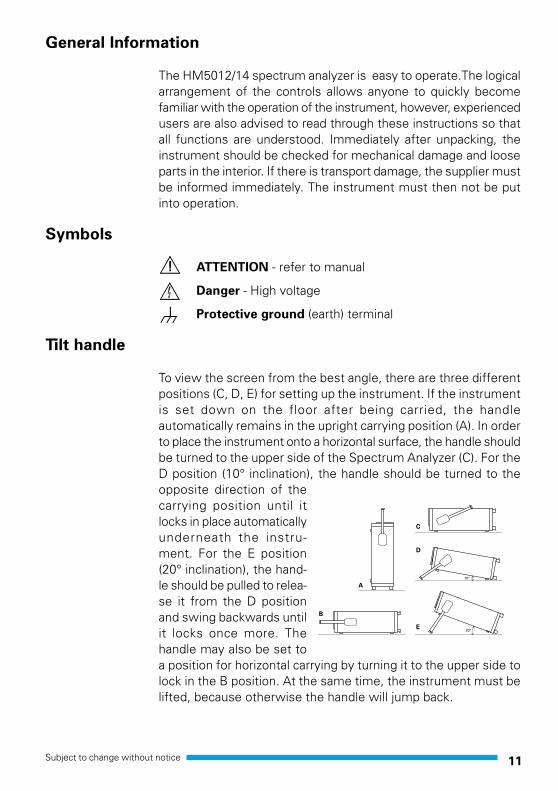
Tilt handle
To view the screen from the best angle, there are three differentpositions (C, D, E) for setting up the instrument. If the instrumentis set down on the floor after being carried, the handleautomatically remains in the upright carrying position (A). In orderto place the instrument onto a horizontal surface, the handle shouldbe turned to the upper side of the Spectrum Analyzer (C). For theD position (10° inclination), the handle should be turned to theopposite direction of thecarrying position until itlocks in place automaticallyunderneath the instru-ment. For the E position(20° inclination), the hand-le should be pulled to relea-se it from the D positionand swing backwards untilit locks once more. Thehandle may also be set toa position for horizontal carrying by turning it to the upper side tolock in the B position. At the same time, the instrument must belifted, because otherwise the handle will jump back.
12 Subject to change without notice
Safety
This instrument has been designed and tested in accordance withIEC Publication 1010-1, Safety requirements for electrical
equipment for measurement, control, and laboratory use. TheCENELEC regulations EN 61010-1 correspond to this standard. Ithas left the factory in a safe condition. This instruction manualcontains important information and warnings which have to befollowed by the user to ensure safe operation and to retain theSpectrum Analyzer in a safe condition. The case, chassis and allmeasuring terminals are connected to the protective earth contactof the appliance inlet. The instrument operates according to Safety
Class I (three-conductor power cord with protective earthingconductor and a plug with earthing contact). The mains/line plugshall only be inserted in a socket outlet provided with a protectiveearth contact. The protective action must not be negated by theuse of an extension cord without a protective conductor.
The mains/line plug should be inserted before connections aremade to measuring circuits. The grounded accessible metal parts(case, sockets, jacks) and the mains/line supply contacts (line/live,neutral) of the instrument have been tested against insulationbreakdown with 2200V DC. Under certain conditions, 50Hz or 60Hzhum voltages can occur in the measuring circuit due to the inter-connection with other mains/line powered equipment orinstruments. This can be avoided by using an isolation transformer(Safety Class II) between the mains/line outlet and the power plugof the device being investigated. Most cathode-ray tubes developX-rays. However, the dose equivalent rate falls far below the
maximum permissible value of 36pA/kg (0.5mR/h). Wheneverit is likely that protection has been impaired, the instrument shallbe made inoperative and be secured against any unintendedoperation. The protection is likely to be impaired if, for example,the instrument
• shows visible damage,
• fails to perform the intended measurements,
• has been subjected to prolonged storage under unfavourableconditions (e.g. in the open or in moist environments),
• has been subject to severe transport stress (e.g. in poorpackaging).
13Subject to change without notice
Operating Conditions
The instrument has been designed for indoor use. The permissibleambient temperature range during operation is +10°C (+50°F) ...+40°C (+104°F). It may occasionally be subjected to temperaturesbetween +10°C (+50°F) and –10°C (+14°F) without degrading itssafety. The permissible ambient temperature range for storageor transportation is –40°C (+14°F) ... +70°C (+158°F).
The maximum operating altitude is up to 2200m. The maximumrelative humidity is up to 80%.
If condensed water exists in the instrument it should beacclimatized before switching on. In some cases (e.g. instrumentextremely cold) two hours should be allowed before theinstrument is put into operation. The instrument should be keptin a clean and dry room and must not be operated in explosive,corrosive, dusty, or moist environments. The spectrum analyzercan be operated in any position, but the convection cooling mustnot be impaired. For continuous operation the instrument shouldbe used in the horizontal position, preferably tilted upwards, restingon the tilt handle.
The specifications stating tolerances are only valid if the
instrument has warmed up for 60 minutes at an ambient
temperature between +15°C (+59°F) and +30°C (+86°F).
Values without tolerances are typical for an average
instrument.
Warranty
HAMEG warrants to its Customers that the products itmanufactures and sells will be free from defects in materials andworkmanship for a period of 3 years. This warranty shall notapply to any defect, failure or damage caused by improper use orinadequate maintenance and care. HAMEG shall not be obligedto provide service under this warranty to repair damage resultingfrom attempts by personnel other than HAMEG representativesto install, repair, service or modify these products.In order to obtain service under this warranty, Customers mustcontact and notify the distributor who has sold the product.
Each instrument is subjected to a quality test with 10 hour burn-in before leaving the production. Practically all early failures are

14 Subject to change without notice
detected by this method. In the case of shipments by post, rail orcarrier it is recommended that the original packing is carefullypreserved. Transport damages and damage due to grossnegligence are not covered by the waranty.
In the case of a complaint, a label should be attached to thehousing of the instrument which describes briefly the faultsobserved. If at the same time the name and telephone number(dialing code and telephone or direct number or departmentdesignation) is stated for possible queries, this helps towardsspeeding up the processing of waranty claims.
Maintenance
Various important properties of the spectrum analyzer should becarefully checked at certain intervals. Only in this way it is certainthat all signals are displayed with the accuracy on which thetechnical data are based.
The exterior of the instrument should be cleaned regularly with adusting brush. Dirt which is difficult to remove on the casing andhandle, the plastic and aluminium parts, can be removed with amoistened cloth (99% water +1% mild detergent). Spirit or was-hing benzine (petroleum ether) can be used to remove greasy dirt.
The screen may be cleaned with water or washing benzine (butnot with spirit (alcohol) or solvents), it must then be wiped with adry clean lint-free cloth. Under no circumstances may the cleaningfluid get into the instrument. The use of other cleaning agentscan attack the plastic and paint surfaces.
Selecting the Line Voltage
The spectrum analyzer operates at mains/line voltages of 115VAC and 230V AC. The voltage selection switch is located on therear of the instrument and displays the selected voltage. Thecorrect voltage can be selected using a small screwdriver.
Remove the power cable from the power connector prior tomaking any changes to the voltage setting. The fuses must alsobe replaced with the appropriate value (see table below) prior toconnecting the power cable. Both fuses are externally accessibleby removing the fuse cover located above the 3-pole powerconnector.

15Subject to change without notice
The fuseholder can be released by pressing its plastic retainerswith the aid of a small screwdriver. The retainers are located onthe right and left side of the holder and must be pressed towardsthe center. The fuse(s) can then be replaced and pressed in untillocked on both sides.
Use of patched fuses or short-circuiting of the fuseholder is notpermissible; HAMEG assumes no liability whatsoever for anydamage caused as a result, and all warranty claims become nulland void.
Fuse type:
Size 5 x 20 mm; 250-Volt AC;must meet IEC specification 127,Sheet III (or DIN 41 662 or
DIN 41 571, sheet 3).Time characteristic: time-lag
Line voltage 115V~ ±10%: Fuse rating: T 630mA
Line voltage 230V~ ±10%: Fuse rating: T 315mA
.Introduction
The spectrum analyzer permits the detection of spectrumcomponents of electrical signals in the frequency range of 0.15to 1050MHz. The detected signal and its content have to berepetitive. In contrast to an oscilloscope operated in Yt mode,where the amplitude is displayed on the time domain, thespectrum analyzer displays amplitude on the frequency domain(Yf). The individual spectrum components of “a signal” becomevisible on a spectrum analyzer. The oscilloscope would displaythe same signal as one resulting waveform.
The spectrum analyzer works according to the triple superhetreceiver principle. The signal to be measured (fin = 0.15MHz to1050MHz) is applied to the 1st mixer where it is mixed with thesignal of a variable voltage controlled oscillator (fLO 1350MHz -2350MHz). This oscillator is called the 1st LO (local oscillator). Thedifference between the oscillator and the input frequency (fLO - fin= 1st IF) is the first intermediate frequency, which passes througha waveband filter tuned to a center frequency of 1350MHz. It thenenters an amplifier, and this is followed by two additional mixingstages, oscillators and amplifiers. The second IF is 29.875MHz and

16 Subject to change without notice
the third is 2.75MHz. In the third IF stage, the signal can beselectively transferred through a filter with 400kHz or 20kHzbandwidth before arriving at an AM demodulator. The logarithmicoutput (video signal) is transferred directly, or via a low pass filterto another amplifier. This amplifier output is connected to the Ydeflection plates of the CRT.The X deflection is performed with a ramp generator voltage. Thisvoltage can also be superimposed on a dc voltage which allows forthe control of 1st LO. The spectrum analyzer scans a frequencyrange depending on the ramp height. This span is determined bythe scanwidth setting. In ZERO SCAN mode only the direct voltagecontrols the 1st LO.
The HM5014 also includes a tracking generator. This generatorprovides sine wave voltages within the frequency range of 0.15to 1050MHz. The tracking generator frequency is determined bythe first oscillator (1st LO) of the spectrum analyzer section.Spectrum analyzer and tracking generator are frequencysynchronized.
Operating Instructions
It is very important to read the paragraph “Safety” including theinstructions prior to operating the HM5012/14. No specialknowledge is necessary for the operation of the HM5012/14. Thestraightforward front panel layout and the limitation to basicfunctions guarantee efficient operation immediately. To ensureoptimum operation of the instrument, some basic instructionsneed to be followed.
Attention!
The most sensitive component of the HM5012/HM5014 is
the input section of the spectrum analyzer. It consists of
the signal attenuator and the first mixer. Without input
attenuation, the voltage at the input must not exceed
+10dBm (0.7Vrms) AC or ±25 volt DC. With a maximum input
attenuation of 40dB the AC voltage must not exceed
+20dBm.
These limits must not be exceeded
otherwise the input attenuator and/or the first mixer would
be destroyed.
17Subject to change without notice
When measuring via a LISN (line impedance stabilization
network) the input of the Spectrum Analyzer must be
protected by means of a transient limiter (HZ560).
Prior to examining unidentified signals, the presence ofunacceptable high voltages has to be checked. It is alsorecommended to start measurements with the highest possibleattenuation and a maximum frequency range (1000MHz). The usershould also consider the possibility of excessively high signalamplitudes outside the covered frequency range, although notdisplayed (e.g. 1200MHz). The frequency range of 0Hz to 150kHzis not specified for the HM5012/14 spectrum analyzer. Spectrallines within this range would be displayed with incorrect amplitude.A particularly high intensity setting shall be avoided. The way signalsare displayed on the spectrum analyzer typically allows for any signalto be recognized easily, even with low intensity.
Due to the frequency conversion principle, a spectral line is visibleat 0Hz. It is called IF-feedthrough. The line appears when the 1stLO frequency passes the IF amplifiers and filters. The level ofthis spectral line is different in each instrument. A deviation fromthe full screen does not indicate a malfunctioning instrument.
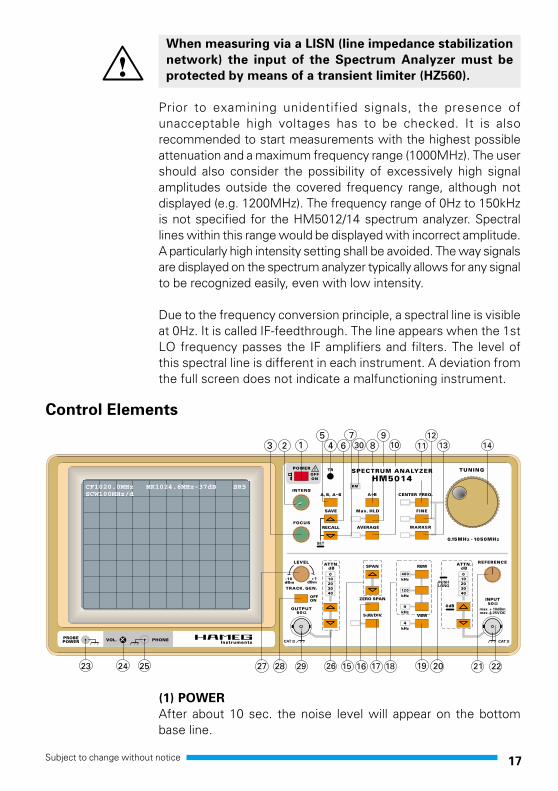
Control Elements
(1) POWER
After about 10 sec. the noise level will appear on the bottombase line.

18 Subject to change without notice
(2) INTENS: Beam intensity adjustment.
(3) FOCUS: Beam sharpness adjustment.
(4) TR:
Trace Rotation - In spite of Mumetal-shielding of CRT, effects ofearth’s magnetic field on the horizontal trace position cannot becompletely avoided. A potentiometer accessible through anopening can be used for correction. Slight pincushion distortionis unavoidable and cannot be corrected.
(5) A/B/A-B:
The instrument has two memories, memory A and memory B.Actual measurement results are always stored in A, wherebymemory B can only accept copies of memory A results. FunctionA-B allows for the subtraction of B results from updated measuringresults stored in A.
Retrieve:
Displays of memory A, B and balance of memory results (A-B)can be achieved by quickly pushing the A/B, A-B button. Thereadout on the screen will inform the user which storage spaceis being displayed on screen.
Remark:
After copying A to B, memory of B is displayed. By pushing button„A/B, A-B“ short it switches to A-B, and another short push todisplay A. The readout will show if „A“, „B“ or „A-B“ is currentlydisplayed.
(6) SAVE:
For storing of up to 10 configuration settings. If a setup was saved,it can be retrieved via the RECALL button. Frequently used settingscan be reenacted quickly and error-free. The saved information isretained also when the unit is separated from power or switchedoff.
How to choose the SAVE memory location:To choose memorylocation quickly push SAVE repeatedly up to number 9 location,and to return back to 0 location push RECALL button.
Storing:
After selection of memory location push SAVE long to save settingand to leave SAVE function.

19Subject to change without notice
Remark:
Functions AVERAGE and MAX.HLD cannot be part of a storageoperation, meaning that SAVE cannot be performed if thesefunctions are activated. An acoustic signal will alert the user inthis case.
Interrupt:
If no instrument setting is to be saved the SAVE setting willautomatically be deactivated after 3 sec.
(7) RECALL
This function allows to RECALL stored instrument settings fromSAVE.
To activate: Press RECALL long.
Remark:
The RECALL function can not be performed if AVERAGE orMAX.HOLD are activated. An acoustic signal will alert the user inthis case.
Choose memory location:
To choose memory location quickly push SAVE repeatedly up tonumber 9 location, and to return back to 0 location push RECALLbutton.
To call-up: After selecting desired memory location, push RECALLlong and instrument will display stored parameter settings.
20 Subject to change without notice
Interrupt: If no instrument setting is to be saved the SAVE settingwill automatically be deactivated after 3 sec.
(8) A B:
Allows for temporary storage of settings from memory A tomemory B for comparison purposes. Push short to store the actualcontents of A in B. The instrument will automatically display storedB memory. To get back to the actual signal, push „A/B/A-B“ twotimes. If pushed one time, „A B“ will be displayed.Memory contents of B will be deleted when power is turned off.
(9) Max.HLD. (Maximum Hold)This function allows the automatic storage of maximum signallevel readings of the instrument. The display of the measurementresults will only be updated if the measured value exceedspreviously gathered values. Any smaller as previously recordedmeasurements will not be displayed. This function thereforeaccurately records maximum signal values of pulsating RF signals.Therefore, prior to taking measurement readings it should be madesure that measurement result display has been maximized.
Remark:
Pulsating signals should be recorded in lowest-possible SPAN,highest-possible Bandwidth and with video filter turned off in orderto prevent transient response errors of the filters. If settings ofspan and RBW are set in certain ways, something can be gainedby the slower sweep speed, active in some settings.
Pull-up: Push Max. HLD. The respective LED will light to showfunction is activated.
Remark:
To erase display of a measurement (Max.HLD), function Max.HLDhas to be terminated and re-activated to be used again. Switchingto AVERAGE directly will not affect the memory contents of Max.HLD.
Interrupt: Push Max.HLD. Respective LED will turn off andindicate interruption of Max.HLD function.
(10) AVERAGE
This function allows the automatic storage of average signal levelreadings of the instrument. Using the AVERAGE function thedisplayed noise band can be reduced. Thus, signals that would

21Subject to change without notice
otherwise not be visible due to the noise floor on screen, can beobserved clearly. The AVERAGE function is activated by pushingthe AVERAGE button a short time. The respective LED will lightto show function is activated.
Remark:
The noise reduction (digital) using the AVERAGE function will notaffect amplitude accuracy even for bigger spans, as would thevideo filter. So digital averaging doen’t have the response timelimitation that a video filter possesses.
Pull-up: Push AVERAGE. The respective LED will light to showfunction is activated.
Remark:
To erase display of a measurement (AVERAGE), functionAVERAGE has to be terminated and re-activated to be used again.Switching to MAX. HLD. will not affect the memory contents ofAVERAGE.
Interrupt: Push AVERAGE. Respective LED will turn off andindicate interruption of AVERAGE function.
(11) CENTER FREQ.
By pushing CENTER FREQ. Button, input for center frequency isbeing enabled and respective LED is lit. Now Center Frequencycan be adjusted via tuning knob (14). The frequency is displayedin the upper left-hand corner behind the letter „C“.

22 Subject to change without notice
Remark:
Is center frequency near lower end or SPAN increased, a spectralline might be visible, possibly even without a signal connected. Itis commonly referred to as „Zero Frequency marking“ (ZEROPeak) and is not unusual to be seen in analyzers using the superhetprinciple. What is observed is the carrier of the 1st LO (1stOscillator) to become visible when the frequency comes withinthe transmission range of the 1st IF filter. The level of the ZEROpeak mark may be different in each instrument and cannot beused as calibration level.
(12) FINE
If the FINE button is pushed (LED is lit), frequency inputs (withLED CENTER FREQ. lit) or Marker movements (LED MARKER islit) is performed in very small steps.
Pushing FINE again will cause the more coarse steps to be activeagain. The FINE LED will be unlit.
(13) MARKER
In order to evaluate measurement curves, the instrument isequipped with a running Marker (X). The Marker can be moved inX-orientation via the tuning dial and follows the measurementcurve in Y-orientation. To activate the Marker, the Marker has tobe activated (LED lit) by pushing MARKER. The numeric indicationof marker frequency and amplitude is displayed on-screen (i.e.:M 100.00MHz –29dBm). Push CENTER to leave MARKER mode
Remark:
The FINE function also affects the input for the Marker position.
(14) Tuning Dial:
The tuning dial either selects Center Frequency or Marker position,depending on CENTER FREQ. or MARKER being activated.
(15) SPAN
The span of sweep of the analyzer is set via the two SPAN buttons.The SPAN is displayed in the upper right-hand corner of the screenand is marked with the letter „S“. At full SPAN (1000MHz) thefrequency axis is scaled in 100MHz steps per (vertical) graticuleline. Moving from the center graticule line towards the right screenedge, the frequency increases by 100MHz per each line.Therefore, the frequency of a displayed spectral line would be500MHz + 5x100MHz = 1000MHz. The frequency reduces

23Subject to change without notice
accordingly when moving towards the left screen edge. Theoutermost left line therefore corresponds to 0MHz.
(16) ZERO SPAN:
With the ZERO SPAN button a SPAN of 0 Hz is being selected. Ifa SPAN of 0Hz is selected, the analyzer performs as a selectivelevel meter, which can be calibrated via the Center Frequency(CENTER FREQ.). The display of the measured level is displayedvia a horizontal line. The ZERO SPAN mode is activated by pushingthe ZERO SPAN button. Press again to revert to previous span.
Above illustration explains the terms SPAN, Center Frequency,Extent of Scale, and Attenuator. The gray area shows themaximum measuring range of the HM5012, whereby the whitearea shows the area which can be displayed on screen. The heightof the „window“ is limited to 80dB due to the extent of the scale,however, the display range can be shifted up and down byswitching on or off the attenuators and by setting anotherreference level. The width of the displayed range is set via theSPAN of the analyzer, which may comprise of the entire gray areaor only part of it. The location of this range is set via the CenterFrequency (CENTER FREQ.). It is always advisable to select theprecise Center Frequency and the SPAN as low as possible(resolution of display) so the signal can be viewed easily. Anunnecessarily high SPAN has a rather negative effect.
Remark:
The HM5012/5014 spectrum analyzer is internally programmedfor always choosing the appropriate sweep time related to thespan, resolution bandwidth and video bandwidth, whereverpossible. The UNCAL indicator in the readout will be visible in

24 Subject to change without notice
order to prevent possible measuring errors due to insufficienttransient response time.
(17) 5dB/Div.
Py pushing the 5 dB/Div. button, the vertical scale is set to 5 dB/Div. The respective LED will then be lit. To enter again in 10 dB/Div. mode, push 5 dB/Div. again.
(18) RBW (Resolution Bandwidth):
The instrument is equipped with resolution filters of 9kHz, 120kHz,and 400kHz, which can be selected via the „RBW“ buttons. Therespective LED will indicate which bandwidth is selected.
Remark:
A maximum measuring bandwidth and the Max.HLD functionshould be selected for pulsed signals.
(19) VBW-Video Filter:
The Video Filter has the purpose of reducing video and noisebandwidth and therefore reducing noise distribution. Whenmeasuring low level values, which are situated within the regularnoise level, the Video Filter (low pass) can be used to reduce thenoise level. This allows for the detection of even small signalswhich might otherwise not be visible.
Remarks:
Please note that if frequency range (SPAN) is too high and VideoFilter is active, amplitude readings might be wrong (too small)

25Subject to change without notice
(UNCAL display). In this case, SPAN needs to be reduced. Withthe aid of the Center Frequency (CENTER FREQ.) setting, firstthe signal to be tested needs to be centered on screen, then theSPAN can be reduced.
If SPAN is reduced without the signal to be tested centered it ispossible for the signal to end up outside of the screen.
The Video Filter should not be used - if possible - when pulsedsignals are measured in order to prevent measuring errors(transient response time).
(20) ATTN:
The buttons to set the input attenuation are marked ATTN. Bypushing the UP and DOWN buttons, the attenuation can be setfrom 0 dB to 40 dB in 10 dB steps.
To enter 0 dB attenuation, it is neccessary to push button long,this is for protection of the input stage, so this setting can’t beset accidentally.
Remark:
For reasons of protection of the input stage, the instrument willalways set an attenuation of 10 dB when switched on.It needs to be pointed out again that the maximum allowableinput voltages may not be surpassed. This is especially important,as it may be possible that the spectrum analyzer will display onlypart of a signal under test, if other input signals are present butnot visible at current span.
(21) REFERENCE
With rotary knob REFERENCE the so called reference level isset, to this level all amplitude readings on screen are referenced.The reference level is always at the topmost horizontal graticuleline. Depending also on attenuator setting, the reference levelmay be set between –99.8 dBm and +13 dBm.
(22) INPUT:
50 Ω Input of Spectrum Analyzer. Without attenuation of inputsignal the maximum allowable input voltage is ±±±±±25V DC or+10dBm AC respectively. With a maximum attenuation of theinput signal (40dB) +20dBm is allowed. These values may not beexceeded, otherwise the input stages will be damaged.

26 Subject to change without notice
(23) PROBE POWER:
PROBE POWER is used solely to supply power for the near fieldprobes HZ530. The required special power cable is supplied withthe probe set.
(24) VOL.: To regulate the volume for the head set.
(25) PHONE:
Connector for headset. The head set should be equipped with a3.5mm stereo phone connector and have >8 Ohm of impedance.
(26) ATTN. (not included in HM5012)The TG output attenuator HM5014 has 5 positions,which can bechosen via the UP/DOWN-buttons. The output attenuator is usedfor reducing the output level of the Tracking Generator.
(27) LEVEL (not included in HM5012)With the LEVEL knob the output level of the Tracking generatorcan be varied in steps of 0.2 dB. The range for level settings is 11dB. The output level is shown in the readout, also dependent onthe attenuator setting.
Attention:
If Tracking Generator is not activated, the output level can
be still varied, this is visible in the readout. For having
this signal appliued to the output, the Tracking generator
must be activated. This is a security measure to prevent
damages to sensitive loads.

27Subject to change without notice
(28) Tracking Generator (not included in HM5012)After switching on the instrument, the Tracking generator will beinactive. This is a security measure to protect any loads connected.In the readout this is shown by the minuscule „t“. By pushingTRACK. GEN., the Tracking Generator is activated. Now a capital„T“ will appear in the readout, and one of the attenuator LEDs(26) will be lit. By again pushing TRACK. GEN., the Tracking Ge-nerator is deactivated.
(29) Output (not included in HM5012)50 Ω output of Tracking Generators. The output level is set usingthe rotary knob LEVEL (27) and the attenuator buttons (26). Theoutput level can be set between +1 dBm and –50 dBm.
(30) RM (Remote) LED
The RM-LED indicates that the instrument is controlled via theserial interface. If the LED is lit, it is not possible to use controlson front panel. This state can either be ended via a serialcommando, or by switching off the instrument. The remote-modecan be activated only by a serial command via the interface.
Operation - first steps
Settings:
Before an unknown signal is applied to the input of the instrument,it should be verified that the DC component is smaller than +-25Vand maximum amplitude is below +20 dBm.

28 Subject to change without notice
ATTN. :
As a protective measure the attenuation should be set to 40 dB(LED „40“ is lit).
Frequency setting:
Set CENTER FREQ. to 500 MHz (C500MHz) and choose a span of1000 MHz.
Bandwidth:
For the first measurements the 400 MHz filter should be selected,and video filter off.
If the noise band moves upward on screen when decreasing inputattenuation, this indicates a possible other high-amplitude inputsignal present but not visible in the chosen frequency range. If nosignal is visible, the attenuation can be consecutively decreased.
In any case the attenuator setting must be in correspondence tothe biggest input signal (not Zero-peak). The correct signal level isachieved if the biggest signal („0 Hz“ - 1000 MHz) just touchesthe reference line. If the signal surpasses the reference line, theattenuation must be increased, or an external attenuator of suitablepower rating and attenuation must be used.
Measuring in full-span mode serves mostly as a quick overview.To analyze the detected signals more closely, the span has to bedecreased. Previous to this, the center frequency has to be set sothe signal is at center of screen. Then span can be reduced.
Then the resolution bandwidth can be decreased, and the videofilter used if neccessary. The warning „uncal“ in the readout mustnot be displayed, otherwise measurement results may be incorrect.

29Subject to change without notice
Obtaining values:
For a numerical value of a measurement result the easiest way isthe use of the marker. The marker frequency is set by the rotarydial, if necessary, use the fine step mode. Then, read the value forthe amplitude, which is shown in the readout. The amplitude isautomatically corrected for the attenuator setting.
If a value is to be measured without using the marker, then measurethe difference of the reference line to the signal. Observe that thescale may be either 5 dB/Div. or 10 dB/Div. In the reference levelvalue the setting of the input attenuator is already included, it isnot neccessary to make a correction afterwards.
The signal shown in the picture shows an amplitude difference ofabout –16 dB to the reference line. Assuming that the referencelevel is –27 dBm, and the scale 10 dB/Div.
Thus the signal has an amplitude of (–27 dBm) + (–16 dB) =-43dBm. In this value the setting of the input attenuator is alreadyincluded. It is not necessary for the user to correct the value forany attenuator setting.
Introduction to Spectrum Analysis
The analysis of electrical signals is a fundamental problem formany engineers and scientists. Even if the immediate problem isnot electrical, the basic parameters of interest are often changedinto electrical signals by means of transducers. The rewards fortransforming physical parameters to electrical signals are great,as many instruments are available for the analysis of electricalsignals in the time and frequency domains.The traditional way of observing electrical signals is to view themin the time domain using an oscilloscope. The time domain isused to recover relative timing and phase information which isneeded to characterize electric circuit behavior. However, not allcircuits can be uniquely characterized from just time domaininformation. Circuit elements such as amplifiers, oscillators,mixers, modulators, detectors and filters are best characterizedby their frequency response information. This frequencyinformation is best obtained by viewing electrical signals in thefrequency domain. To display the frequency domain requires adevice that can discriminate between frequencies whilemeasuring the power level at each. One instrument which displaysthe frequency domain is the spectrum analyzer. It graphically
30 Subject to change without notice
displays voltage or power as a function of frequency on a CRT(cathode ray tube).
In the time domain, all frequency components of a signal are seensummed together. In the frequency domain, complex signals (i.e.signals composed of more than one frequency) are separatedinto their frequency components, and the power level at eachfrequency is displayed. The frequency domain is a graphicalrepresentation of signal amplitude as a function of frequency. Thefrequency domain contains information not found in the timedomain and therefore, the spectrum analyzer has certainadvantages compared with an oscilloscope.The analyzer is more sensitive to low level distortion than a scope.Sine waves may look good in the time domain, but in the frequencydomain, harmonic distortion can be seen. The sensitivity and widedynamic range of the spectrum analyzer is useful for measuringlow-level modulation. It can be used to measure AM, FM and pulsedRF. The analyzer can be used to measure carrier frequency,modulation frequency, modulation level, and modulation distortion.Frequency conversion devices can be easily characterized. Suchparameters as conversion loss, isolation, and distortion are readilydetermined from the display.The spectrum analyzer can be used to measure long and shortterm stability. Parameters such as noise sidebands on an oscillator,residual FM of a source and frequency drift during warm-up can bemeasured using the spectrum analyzer’s calibrated scans. Theswept frequency responses of a filter or amplifier are examples ofswept frequency measurements possible with a spectrum analyzer.These measurements are simplified by using a tracking generator.
Types of Spectrum Analyzers
There are two basic types of spectrum analyzers, swept-tuned andreal-time analyzers. The swept-tuned analyzers are tuned byelectrically sweeping them over their frequency range. Therefore,the frequency components of a spectrum are sampled sequentiallyin time. This enables periodic and random signals to be displayed,but makes it impossible to display transient responses. Real-timeanalyzers, on the other hand, simultaneously display the amplitudeof all signals in the frequency range of the analyzer; hence thename real-time. This preserves the time dependency betweensignals which permits phase information to be displayed. Real-timeanalyzers are capable of displaying transient responses as well asperiodic and random signals.
31Subject to change without notice
The swept-tuned analyzers are usually of the trf (tuned radiofrequency) or superheterodyne type. A trf analyzer consists of abandpass filter whose center frequency is tunable over a desiredfrequency range, a detector to produce vertical deflection on a CRT,and a horizontal scan generator used to synchronize the tunedfrequency to the CRT horizontal deflection. It is a simple,inexpensive analyzer with wide frequency coverage, but lacksresolution and sensitivity. Because trf analyzers have a swept filterthey are limited in sweep width depending on the frequency range(usually one decade or less). The resolution is determined by thefilter bandwidth, and since tunable filters dont usually have constantbandwith, is dependent on frequency.
The most common type of spectrum analyzer differs from the trfspectrum analyzers in that the spectrum is swept through a fixedbandpass filter instead of sweeping the filter through the spectrum.The analyzer is basically a narrowband receiver which iselectronically tuned in frequency by applying a saw-tooth voltageto the frequency control element of a voltage tuned local oscillator.This same saw-tooth voltage is simultaneously applied to the ho-rizontal deflection plates of the CRT. The output from the receiveris synchronously applied to the vertical deflection plates of theCRT and a plot of amplitude versus frequency is displayed.The analyzer is tuned through its frequency range by varying thevoltage on the LO (local oscillator). The LO frequency is mixedwith the input signal to produce an IF (intermediate frequency)which can be detected and displayed. When the frequencydifference between the input signal and the LO frequency is equalto the IF frequency, then there is a response on the analyzer. Theadvantages of the superheterodyne technique are considerable.It obtains high sensitivity through the use of IF amplifiers, andmany decades in frequency can be tuned.
Also, the resolution can be varied by changing the bandwidth ofthe IF filters. However, the superheterodyne analyzer is not real-time and sweep rates must be consistent with the IF filter timeconstant. A peak at the left edge of the CRT is sometimes calledthe “zero frequency indicator” or “local oscillator feedthrough”.It occurs when the analyzer is tuned to zero frequency, and thelocal oscillator passes directly through IF creating a peak on theCRT even when no input signal is present. (For zero frequencytuning, FLO=FIF). This effectively limits the lower tuning limit.

32 Subject to change without notice
Spectrum Analyzer Requirements
To accurately display the frequency and amplitude of a signal on aspectrum analyzer, the analyzer itself must be properly calibrated.A spectrum analyzer properly designed for accurate frequencyand amplitude measurements has to satisfy many requirements:1. Wide tuning range2. Wide frequency display range3. Stability4. Resolution5. Flat frequency response6. High sensitivity7. Low internal distortion
Frequency Measurements
The frequency scale can be scanned in three different modesfull, per division, and zero scan. The full scan mode is used tolocate signals because the widest frequency ranges are displayedin this mode. (Not all spectrum analyzers offer this mode).The per division mode is used to zoom-in on a particular signal. Inper division, the center frequency of the display is set by theTuning control and the scale factor is set by the Frequency Spanor Scan Width control. In the zero scan mode, the analyzer actsas a fixed-tuned receiver with selectable bandwidths.Absolute frequency measurements are usually made from thespectrum analyzer tuning dial. Relative frequency measurementsrequire a linear frequency scan. By measuring the relativeseparation of two signals on the display, the frequency differencecan be determined.It is important that the spectrum analyzer be more stable thanthe signals being measured. The stability of the analyzer dependson the frequency stability of its local oscillators. Stability is usuallycharacterized as either short term or long term. Residual FM is ameasure of the short term stability which is usually specified inHz peak-to-peak. Short term stability is also characterized by noisesidebands which are a measure of the analyzers spectral purity.Noise sidebands are specified in terms of dB down and Hz awayfrom a carrier in a specific bandwidth. Long term stability ischaracterized by the frequency drift of the analyzers LOs.Frequency drift is a measure of how much the frequency changesduring a specified time (i.e., Hz/min. or Hz/hr).
Resolution
33Subject to change without notice
Before the frequency of a signal can be measured on a spectrumanalyzer it must first be resolved. Resolving a signal meansdistinguishing it from its nearest neighbours. The resolution of aspectrum analyzer is determined by its IF bandwidth. The IFbandwidth is usually the 3dB bandwidth of the IF filter. The ratioof the 60dB bandwidth (in Hz) to the 3dB bandwidth (in Hz) isknown as the shape factor of the filter. The smaller the shapefactor, the greater is the analyzer’s capability to resolve closelyspaced signals of unequal amplitude. If the shape factor of a filteris 15:1, then two signals whose amplitudes differ by 60dB mustdiffer in frequency by 7.5 times the IF bandwidth before they canbe distinguished separately. Otherwise, they will appear as onesignal on the spectrum analyzer display.The ability of a spectrum analyzer to resolve closely spaced signalsof unequal amplitude is not a function of the IF filter shape factoronly. Noise sidebands can also reduce the resolution. They appearabove the skirt of the IF filter and reduce the offband rejection ofthe filter. This limits the resolution when measuring signals ofunequal amplitude.The resolution of the spectrum analyzer is limited by its narrowestIF bandwidth. For example, if the narrowest bandwidth is 10kHzthen the nearest any two signals can be and still be resolved is10kHz. This is because the analyzer traces out its own IF band-pass shape as it sweeps through a CW signal. Since the resolutionof the analyzer is limited by bandwidth, it seems that by reducingthe IF bandwdith infinitely, infinite resolution will be achieved.The fallacy here is that the usable IF bandwidth is limited by thestability (residual FM) of the analyzer. If the internal frequencydeviation of the analyzer is 10kHz, then the narrowest bandwidththat can be used to distinguish a single input signal is 10kHz. Anynarrower IF-filter will result in more than one response or anintermittent response for a single input frequency. A practicallimitation exists on the IF bandwidth as well, since narrow filtershave long time constants and would require excessive scan time.
Sensitivity
Sensitivity is a measure of the analyzer’s ability to detect smallsignals. The maximum sensitivity of an analyzer is limited by itsinternally generated noise. This noise is basically of two types:thermal (or Johnson) and nonthermal noise. Thermal noise powercan be expressed as:
PN = k × T × B
34 Subject to change without notice
where:PN = Noise power in wattsk = Boltzmanns Constant
(1.38 ⋅ 10-23 Joule/K)T = absolute temperature, KB = bandwidth of system in Hertz
As seen from this equation, the noise level is directly proportio-nal to bandwidth. Therefore, a decade decrease in bandwidthresults in a 10dB decrease in noise level and consequently 10dBbetter sensitivity. Nonthermal noise accounts for all noiseproduced within the analyzer that is not temperature dependent.Spurious emissions due to nonlinearities of active elements,impedance mismatch, etc. are sources of nonthermal noise. Afigure of merit, or noise figure, is usually assigned to this non-thermal noise which when added to the thermal noise gives thetotal noise of the analyzer system. This system noise which ismeasured on the CRT, determines the maximum sensitivity ofthe spectrum analyzer. Because noise level changes withbandwith it is important, when comparing the sensitivity of twoanalyzers, to compare sensitivity specifications for equalbandwidths. A spectrum analyzer sweeps over a wide frequencyrange, but is really a narrow band instrument. All of the signalsthat appear in the frequency range of the analyzer are convertedto a single IF frequency which must pass through an IF filter; thedetector sees only this noise at any time. Therefore, the noisedisplayed on the analyzer is only that which is contained in the IFpassband. When measuring discrete signals, maximum sensitivityis obtained by using the narrowest IF bandwidth.
Video Filtering
Measuring small signals can be difficult when they areapproximately the same amplitude as the average internal noiselevel of the analyzer. To facilitate the measurement, it is best touse video filtering. A video filter is a post-detection low pass filterwhich averages the internal noise of the analyzer. When the noiseis averaged, the input signal may be seen. If the resolutionbandwidth is very narrow for the span, the video filter should notbe selected, as this will not allow the amplitude of the analyzedsignals to reach full amplitude due to its video bandwidth limitingproperty.
Spectrum Analyzer Sensitivity
35Subject to change without notice
Specifying sensitivity on a spectrum analyzer is somewhat arbitrary.One way of specifying sensitivity is to define it as the signal levelwhen signal power = average noise power.The analyzer always measures signal plus noise. Therefore, whenthe input signal is equal to the internal noise level, the signal willappear 3dB above the noise. When the signal power is added tothe average noise power, the power level on the CRT is doubled(increased by 3dB) because the signal power=average noise power.The maximum input level to the spectrum analyzer is the damagelevel or burn-out level of the input circuit. This is (for the HM5012/14) +10dBm for the input mixer and +20dBm for the inputattenuator. Before reaching the damage level of the analyzer, theanalyzer will begin to gain compress the input signal. This gaincompression is not considered serious until it reaches 1dB. Themaximum input signal level which will always result in less than1dB gain compression is called the linear input level. Above 1dBgain compression the analyzer is considered to be operatingnonlinearly because the signal amplitude displayed on the CRT isnot an accurate measure of the input signal level.
Whenever a signal is applied to the input of the analyzer, distortionsare produced within the analyzer itself. Most of these are causedby the non-linear behavior of the input mixer. For the HM5012/5014 these distortions are typically 70dB below the input signallevel for signal levels not exceeding –27dBm at the input of thefirst mixer. To accommodate larger input signal levels, anattenuator is placed in the input circuit before the first mixer. Thelargest input signal that can be applied, at each setting of theinput attenuator, while maintaining the internally generateddistortions below a certain level, is called the optimum input levelof the analyzer. The signal is attenuated before the first mixerbecause the input to the mixer must not exeed –27dBm, or theanalyzer distortion products may exceed the specified 70dB range.This 70dB distortion-free range is called the spurious-free dynamicrange of the analyzer. The display dynamic range is defined asthe ratio of the largest signal to the smallest signal that can bedisplayed simultaneously with no analyzer distortions present.Dynamic range requires several things then. The display rangemust be adequate, no spurious or unidentified response can occur,and the sensitivity must be sufficient to eliminate noise from thedisplayed amplitude range.
The maximum dynamic range for a spectrum analyzer can be easily

36 Subject to change without notice
determined from its specifications. First check the distortion spec.For example, this might be “all spurious products 70dB down for –27dBm at the input mixer”. Then, determine that adequatesensitivity exists. For example, 70dB down from –27dBm is –97dB.This is the level we must be able to detect, and the bandwidthrequired for this sensitivity must not be too narrow or it will beuseless. Last, the display range must be adequate.Notice that the spurious-free measurement range can be exten-ded by reducing the level at the input mixer. The only limitation,then, is sensitivity. To ensure a maximum dynamic range on theCRT display, check to see that the following requirements aresatisfied.
1.The largest input signal does not exceed the optimum input levelof the analyzer (typically –27dBm with 0dB input attenuation).
2.The peak of the largest input signal rests at the top of the CRTdisplay (reference level).
Frequency Response
The frequency response of an analyzer is the amplitude linearity ofthe analyzer over its frequency range. If a spectrum analyzer is todisplay equal amplitudes for input signals of equal amplitude, inde-pendent of frequency, then the conversion (power) loss of the inputmixer must not depend on frequency. If the voltage from the LO istoo large compared to the input signal voltage then the conversionloss of the input mixer is frequency dependent and the frequencyresponse of the system is nonlinear. For accurate amplitudemeasurements, a spectrum analyzer should be as flat as possibleover its frequency range. Flatness is usually the limiting factor inamplitude accuracy since it is extremely difficult to calibrate out.And, since the primary function of the spectrum analyzer is tocompare signal levels at different frequencies, a lack of flatnesscan seriously limit its usefulness.
Tracking Generators
The tracking generator (HM5014 only) is a special signal sourcewhose RF output frequency tracks (follows) some other signalbeyond the tracking generator itself. In conjunction with thespectrum analyzer, the tracking generator produces a signal whosefrequency precisely tracks the spectrum analyzer tuning. Thetracking generator frequency precisely tracks the spectrum analyzer
37Subject to change without notice
tuning since both are effectively tuned by the same VTO. Thisprecision tracking exists in all analyzer scan modes. Thus, in fullscan, the tracking generator output is a start-stop sweep, in zeroscan the output is simply a CW signal.
The tracking generator signal is generated by synthesizing andmixing two oscillators. One oscillator is part of the trackinggenerator itself, the other oscillator is the spectrum analyzer’s1st LO. The spectrum analyzer/tracking generator system is usedin two configurations: open-loop and closed-loop. In the open-loop configuration, unknown external signals are connected tothe spectrum analyzer input and the tracking generator outputis connected to a counter. This configuration is used for makingselective and sensitive precise measurement of frequency, bytuning to the signal and switching to zero scan.
In the closed-loop configuration, the tracking generator signal isfed into the device under test and the output of the device undertest is connected to the analyzer input.
In this configuration, the spectrum analyzer/tracking generatorbecomes a self-contained, complete (source, detector, anddisplay) swept frequency measurement system. An internalleveling loop in the tracking generator ensures a leveled outputover the entire frequency range. The specific swept measure-ments that can be made with this system are frequency response(amplitude vs. frequency), magnitude only reflection coefficient,and return loss. From return loss or reflection coefficient, theSWR can be calculated. Swept phase and group delaymeasurements cannot be made with this system; however, itdoes make some unique contributions not made by other sweptsystems, such as a sweeper/network analyzer, a sweeper/spectrum analyzer, or a sweeper/detector oscilloscope.
Precision tracking means at every instant of time the generatorfundamental frequency is in the center of the analyzer passband,and all generator harmonics, whether they are generated in theanalyzer or are produced in the tracking generator itself, are outsidethe analyzer passband. Thus only the tracking generator funda-mental frequency is displayed on the analyzer’s CRT. Second andthird order harmonics and intermodulation products are clearlyout of the analyzer tuning and, therefore, they are not seen. Thus,while these distortion products may exist in the measurementset-up, they are completely eliminated from the CRT display.

38 Subject to change without notice
The 1dB gain compression level is a point of convenience, but itis nonetheless considered the upper limit of the dynamic range.The lower limit, on the other hand, is dictated by the analyzersensitivity which, as we know, is bandwidth dependent. Thenarrowest usable bandwidth in turn is limited by the trackinggenerator residual FM and any tracking drift between the analyzertuning and the tracking generator signal.
Appendix A
CODES for serial interface RS232Spectrum Analyzer HM5012 / HM5014
RS232 parameters when unit is turned on:
4800 baud, 8 data bits, 1 stopbit, no parityReceive following information when unit is turned on:HAMEG HM5012 V___, or
HM5014 V___ respectively.
Commands to HM5012 / 5014 via PC:
To be noted: First symbol of any command is „#“ (0x23) which is followed by therespective characters, i.e. TG for Tracking Generator, and further followed by additionalsymbols, which are explained in detail below. Each command is executed by pushingthe „Enter“ key (hex: OxOd). No differentiation is made between capital and lower-case letters (i.e. TG = tg). Units of measurement are always definite (i.e. span valuegiven in MHz) and are therefore not indicated.
(E) = „enter“ key
#kl0 (E) = Key-Lock off#kl1 (E) = Key-Lock on (Remote-LED lit)#tg0 (E) = Tracking Generator off#TG1 (E) = Tracking Generator on#vf0 (E) = Video Filter off#Vf1 (E) = Video Filter on#Tl+01.0 (E) = Tracking Level of +1.0 dB#tl-50.0 (E) = Tracking Level to -50.0 dB in 0.2 dB steps#rl-27.0 (E) = Reference Level of -27.0 dB#rl-99.6 (E) = Reference Level to -99.6 dB in 0.4 dB steps#at0 (E) = Attenuator 0 (10, 20, 30, 40) dB#bw400 (E) = Bandwidth 400 (120, 9) kHz#sp1000 E) = Span 1000 (500, 200, . . . 5, 2, 1) MHz#sp0 (E) = Zero Span#db5 (E) = 5 dB/div.#db10 (E) = 10 dB/div.#cf0500.00(E) = Center Frequency in xxx.xx MHz

39Subject to change without notice
Appendix A#dm0 (E) = Detect mode off#dm1 (E) = Detect mode on#sa (E) = Save signal A as signal B#vm0 (E) = View mode: Signal A#vm1 (E) = View mode: Signal B (stored signal)#vm2 (E) = View mode: Signal A - B#vm3 (E) = View mode: Average#vm4 (E) = View mode: Max. Hold
#br4800 (E) = baudrate 4800 (9600, 19200, 38400, 115200 ) Bd#bm1 (E) = transfer signal in block mode (2048 bytes)
2044 signal bytes, 3 checksum bytes and (0x0D)#rc0 (E) = Recall (0 to 9)#sv0 (E) = Save (0 to 9)
Special commands for emc measurement in combination with zero-span:
#es0 (E) = 1 second sweep disable#es1 (E) = 1 second sweep enable (measuring time 1 second; select
zero-span and bandwidth 9/120/400 kHz)
#ss1 (E) = Start 1 second sweep at a selected center frequency#ss2 (E) = Start 1 second sweep at a selected center frequency (i.e
100MHz) + frequency step(s) (i.e. 100.12MHz, 100.24MHz,...). step = bandwidth: 400, 120, 10 (9) kHz
After receiving and processing the command, the instrument transmitts „RD(hex:0x0d)“.
Polling of Parameters:
Syntax:
#xx (E) = Send parameter xx (xx = tg, tl, rl, vf, at, bw, sp, cf, db, kl,hm, vn, vm, uc)
1st example:
#uc (uncalibrated): PC transmitts #uc (E), instrument replies:uc0 (calibrated), uc1 (uncalibrated)
2nd example:
#tl (E) = PC query for Tracking Level: PC transmitts #tl(E), instrumentreplies: TL-12.4(E)
3rd example: sequence control via external computer:
#kl1 (E) = switches to remotes status, RM LED is lit
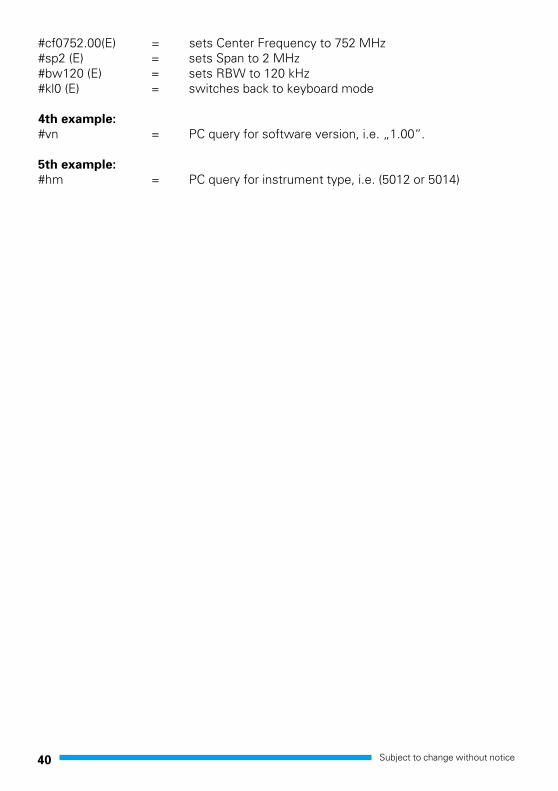
40 Subject to change without notice
#cf0752.00(E) = sets Center Frequency to 752 MHz#sp2 (E) = sets Span to 2 MHz#bw120 (E) = sets RBW to 120 kHz#kl0 (E) = switches back to keyboard mode
4th example:
#vn = PC query for software version, i.e. „1.00“.
5th example:
#hm = PC query for instrument type, i.e. (5012 or 5014)

41Subject to change without notice
Manual
Software
SW5012
Instruments

42 Subject to change without notice
Software package SW5012
Functions and set-up.Menu overview.
Pulldown Menu 1:
DataLoad
Save
Settings Load and Save set-up information for theinstrument
Measurement Load and Save measurement data
New/Copy

43Subject to change without notice
Edit
Delete
New, Copy, Edit, Delete regarding to the following items:
Limit Definition
Definition of limit lines
Loss/Gain Components
Set-up of the correction curves for amplifiers, cables etc., acquiredby measured data (damping curve).
Config
Set-up for used equipment and DUT, attachment of correctioncurves of amplifiers and cables for calculation purposes.
EMC Test
Test procedure set-up (single test): start frequency, stop frequency,correction curve, filter settings, etc.
44 Subject to change without notice
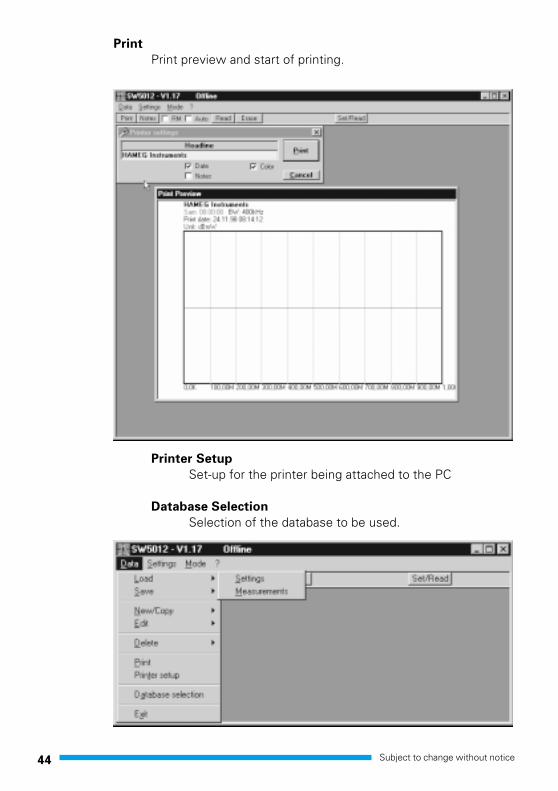
Print preview and start of printing.
Printer Setup
Set-up for the printer being attached to the PC
Database Selection
Selection of the database to be used.
45Subject to change without notice
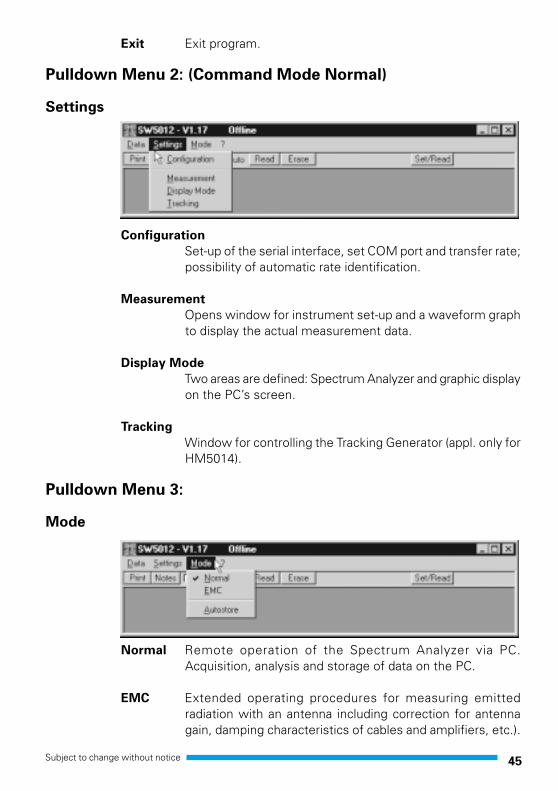
Exit Exit program.
Pulldown Menu 2: (Command Mode Normal)
Settings
Configuration
Set-up of the serial interface, set COM port and transfer rate;possibility of automatic rate identification.
Measurement
Opens window for instrument set-up and a waveform graphto display the actual measurement data.
Display Mode
Two areas are defined: Spectrum Analyzer and graphic displayon the PC’s screen.
Tracking
Window for controlling the Tracking Generator (appl. only forHM5014).
Pulldown Menu 3:
Mode
Normal Remote operation of the Spectrum Analyzer via PC.Acquisition, analysis and storage of data on the PC.
EMC Extended operating procedures for measuring emittedradiation with an antenna including correction for antennagain, damping characteristics of cables and amplifiers, etc.).
46 Subject to change without notice
Autostore
Timer controlled measurement in Normal Mode with automaticstorage in the PC’s memory/hard disk.
Operating Modes:
Normal Mode
This mode of man-machine-interface corresponds one-to-one tothe functions available on the instrument’s front panel.
A mouse click on “Normal” enables the user to remotely controlthe functions of the Spectrum Analyzer from the measurementwindow. The “Remote” indicator (visible in the second bar of thewindow) has to be activated first ( RM) by a mouse click on therelated button (a small hook is visible after activation).
When Remote has been activated any center frequency withinthe allowed range may be selected by typing in the desirednumeric value, closed by a carriage return.
The indication for RevLevel is actualized automatically accordingto any modification in the attenuator settings. A dedicated windowallows the selection of the unit in which the signal level valuesshall be indicated. Furthermore one can configure the set-up forspan, filter bandwidth, scaling, and video filter.
Correction on
Single spectral lines can be analyzed in mode “EMC” in menu“Function Correction”. When “Correction on” is activated allcorrection data according to the selected EMC settings will beused during the calculations. Limit line data can be loaded at anytime and graphically displayed in the window.
Calculation on
The Display Mode window is split into two areas: the left one(“Analyzer” and “Settings”) is directly related to the instrument,the other one (“Read/View”) belongs to the representation onthe PC’s screen.
Using function Save A → B the data of the actual curve A will betransferred into the reference memory.

47Subject to change without notice
In the “Settings” window ten different instrument set-ups canbe saved and recalled. This responds directly to the front panelfunction of the instrument.
There are three different modes to display data after acquisitionby the Spectrum Analyzer: “Sample” (actual curve A), “Reference
B” or “A-B”. When the function “Calculation” is activated one ofthe following curves may be indicated: “Max. Hold” or“Average”. The “Max. Hold” and “Average” curves arecalculated in real-time. After a mouse click on button “ResetCalculation” the sampling will be started anew. The window inthe right area (“Read/View”) enables the user to select the datatype to be transferred from the instrument to the PC and thecurve(s) to be displayed on the screen. The attached colors areexplained at the right edge of the window, the time stamp for thelast acquisition is indicated at the upper edge. The calculation ofthe curve data is switched off with “Calculation off”. Neitherthe “Max. Hold” nor the “Average” curve will be actualized inthis state since data acquisition inside the instrument is switchedoff. The displayed curves may be erased by a mouse click onbutton “Erase”. After modifying the value for center frequencythe curves will be erased automatically and calculated anew duringthe next data transfer from the instrument to the PC.
EMC Mode Functions, Software tasks
The EMC Mode enables the user to integrate the SpectrumAnalyzer as one device into a pre-compliance EMC test system.Normally a test system like this is an assembly of several devices.The software package supports the definition of dedicated testprocedures as well as the configuration of the attached devices.
A typical test system is a composition of:LISN, BNC cable and receiver (Spectrum Analyzer) orAntenna, amplifier, BNC cable and receiver.
Supported by integrated procedures the user is able to define anentire EMC test system including all attached components. Thespectral response of each single component can be used forcorrection calculations. The frequency response data of each singlecomponent is stored in a dedicated database and used for correctioncalculations according to a test system set-up, which - in a dedicatedwindow - can be defined in a pipeline arrangement of componentsand then stored as an entire EMC test system procedure.
48 Subject to change without notice
Furthermore the software package includes quasi peak andaverage calculations. In its operating mode ‘zero span’ theinstrument acquires data over a period of 1 s, followed by theaveraging of the data. Also, the quasi peak values are calculatedby applying digital filter calculations.
Several ways exist to configure the software program:
1. The frequency response curve of each component must be availableand stored inside the PC. There is no limit for the number ofcomponents; nevertheless the data files must have different names
2. An arrangement of devices as EMC test system is given an evidentfile name and stored as desired. A maximum of five componentsmight be arranged to build up a single configuration, which seems tobe sufficient for ordinary applications. An ideal cable is used to simulatenonexistent components. There is no limit for the number ofarrangements; nevertheless the filenames must be different.
3. According to the regulations certain signal levels may not be exceeded.Thus limit lines have to be defined before they can be displayed onthe screen. Any number of limit lines can be defined, as long as theyare given different file names. A maximum of two limit lines can bedisplayed in one window.
4. After the completion of these steps a test system can be arranged byusing the limit lines and the component configurations. At least it isnecessary to enter the values for start frequency, stop frequency,bandwidth, damping, and the measuring procedure to be used.
After the set-up as described the system is ready to performcomplex EMC test procedures, which - in most applications - canbe executed automatically.
Definition of new components
To add a new component select the menu called Data New/
Copy and then Loss/Gain-Components. The according windowwill appear. A field to be filled in with the name of a newcomponent is located in the upper area. A maximum number of80 characters may be entered, including space characters. Eachentry must be closed by a carriage return. After a mouse click onAdd New the new component will be added to the database.
By using the Copy function data of an existing component canbe copied to define a new component. This procedure isrecommended if only few data are different.

49Subject to change without notice
In the next step – for example - the frequency response of acomponent has to be defined. First make a mouse click on buttonView limit definition or, after closing this window, select Data/
Edit/ (Loss/Gain-Components). After the appearance of thewindow, select the component type: antenna, loss componentor amplifier. The frequency response of an antenna always isrelated to the distance of measurement, thus the field Distance
(m)” has to be filled in with meter units.

50 Subject to change without notice
Now the system is ready to accept ”Freq. in MHz” and ”Level”
(correction, in dB) values in the appropriate fields, each onefollowed by a carriage return to add the value to the table. Thesoftware automatically sorts the data in an ascending order forthe frequency.
In case of an erroneous data input just select the wrong entrywith a mouse click (highlighted) and delete it by pushing the DELkey. The entry will be removed from the table, the data sorted,and the graphic curve refreshed.
The table can be supplemented by a comment, for example: dateof calibration, responsible technician, etc.
After entering all frequency response data of the components tobe used, they are available for the following correction calculations.
Configuration of a test system
The menu “configuration” supports the definition of an entiretest system by arranging several components.
To add a new configuration set-up, select ”Data/Edit/Config”
from the menu bar. A window called “Configuration” will beopened.
The way the signal takes from one device to the other during thetest procedure is highlighted, starting at the signal source andwalking on to the Spectrum Analyzer.
If an antenna is part of the test system it must be defined in theuppermost field –, as it is the component most closely located tothe DUT. Of course only one antenna can be used in a test system,thus other components will follow, as there are:Damping elements, amplifiers, and cables. In case a field is notused for a component it has to be defined as an ideal cable
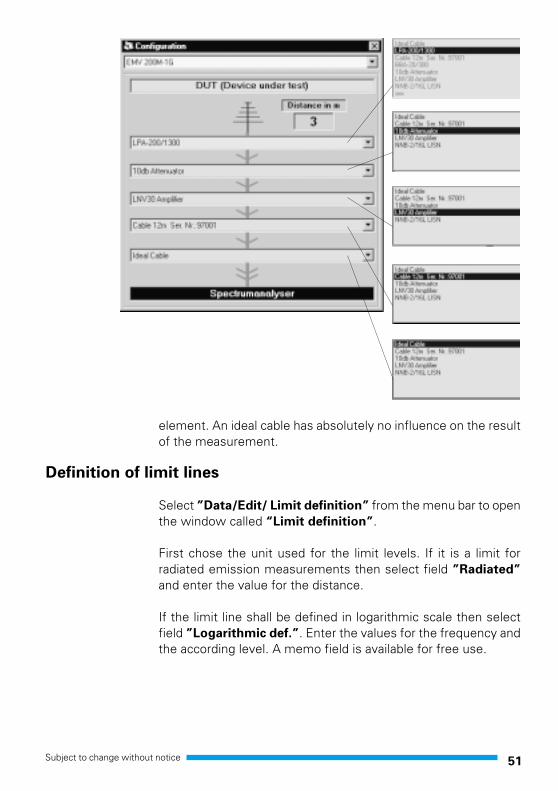
51Subject to change without notice
element. An ideal cable has absolutely no influence on the resultof the measurement.
Definition of limit lines
Select ”Data/Edit/ Limit definition” from the menu bar to openthe window called “Limit definition”.
First chose the unit used for the limit levels. If it is a limit forradiated emission measurements then select field ”Radiated”
and enter the value for the distance.
If the limit line shall be defined in logarithmic scale then selectfield ”Logarithmic def.”. Enter the values for the frequency andthe according level. A memo field is available for free use.
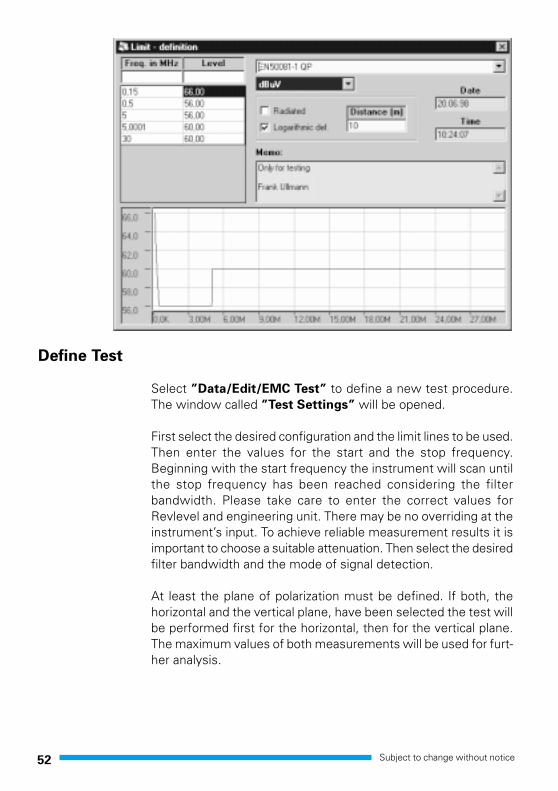
52 Subject to change without notice
Define Test
Select ”Data/Edit/EMC Test” to define a new test procedure.The window called ”Test Settings” will be opened.
First select the desired configuration and the limit lines to be used.Then enter the values for the start and the stop frequency.Beginning with the start frequency the instrument will scan untilthe stop frequency has been reached considering the filterbandwidth. Please take care to enter the correct values forRevlevel and engineering unit. There may be no overriding at theinstrument’s input. To achieve reliable measurement results it isimportant to choose a suitable attenuation. Then select the desiredfilter bandwidth and the mode of signal detection.
At least the plane of polarization must be defined. If both, thehorizontal and the vertical plane, have been selected the test willbe performed first for the horizontal, then for the vertical plane.The maximum values of both measurements will be used for furt-her analysis.

53Subject to change without notice
The next step to be defined is the mode of testing.
Step:
In this mode the signal level will be detected over a measuringperiod of 1 s (zero span). The test begins at the start frequencyas defined, for further measurement steps the frequency isincremented according to the selected bandwidth and terminatesat the stop frequency. In addition to the basic measuring periodof 1 s the transfer time for the data from the instrument to the PChas to be taken into consideration. The entire period for one stepmight exceed 1.5 s to 2 s. The high accuracy of measurement isan advantage, at the price of a time consuming test procedure.
Sweep + Step:
In this mode the value for the span will be chosen as high aspossible according to the selected bandwidth. When using the“Max. Hold” acquisition method the center frequency is modifiedbetween the start and the stop frequency until the completefrequency range will be covered by the measurement (sweep).The length of the acquisition
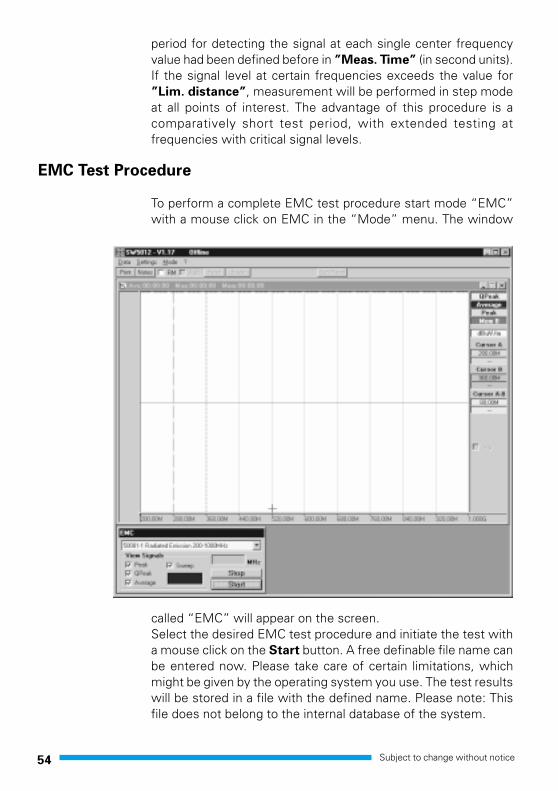
54 Subject to change without notice
period for detecting the signal at each single center frequencyvalue had been defined before in ”Meas. Time” (in second units).If the signal level at certain frequencies exceeds the value for”Lim. distance”, measurement will be performed in step modeat all points of interest. The advantage of this procedure is acomparatively short test period, with extended testing atfrequencies with critical signal levels.
EMC Test Procedure
To perform a complete EMC test procedure start mode “EMC”with a mouse click on EMC in the “Mode” menu. The window
called “EMC” will appear on the screen.Select the desired EMC test procedure and initiate the test witha mouse click on the Start button. A free definable file name canbe entered now. Please take care of certain limitations, whichmight be given by the operating system you use. The test resultswill be stored in a file with the defined name. Please note: Thisfile does not belong to the internal database of the system.

55Subject to change without notice
Now follow the steps as indicated on the screen. The procedurewill differ according to the set-up of the test system.
Values indicated in field Peak, Qpeak, Average, and Sweep haveno influence on the measurement procedure itself, but are usedfor a proper display of the results on the screen. The measurementitself is performed according to the test settings.
Repeatedly after every fifty steps the graphic display will berefreshed or, in sweep mode, after terminating the sweep.
At any time a scan can be stopped by a mouse click on the buttonStop. There is no way to continue the scan after it has beenstopped. Nevertheless it is possible to load, visualize, and printthe measurement results at any time, if desired.

Oscilloscopes
Multimeters
Counters
Frequency Synthesizers
Generators
R- and LC-Meters
Spectrum Analyzers
Power Supplies
Curve Tracers
Time Standards
Printed in Germany
Hongkong
HAMEG LTDFlat B, 7/F,Wing Hing Ind. Bldg.,499 Castle Peak Road,Lai Chi Kok, KowloonPhone (852) 2 793 0218Telefax (852) 2 763 5236E-mail: [email protected]
United States of America
HAMEG, Inc.266 East Meadow AvenueEAST MEADOW, NY 11554Phone (516) 794 4080Toll-free (800) 247 1241Telefax (516) 794 1855E-mail: [email protected]
Great Britain
HAMEG LTD74-78 Collingdon StreetLUTON Bedfordshire LU1 1RXPhone (01582) 413174Telefax (01582) 456416E-mail: [email protected]
Spain
HAMEG S.L.Villarroel 172-17408036 BARCELONATeléf. (93) 4301597Telefax (93) 321220E-mail: [email protected]
France
HAMEG S.a.r.l5-9, av. de la République94800-VILLEJUIFTél. (1) 4677 8151Telefax (1) 4726 3544E-mail: [email protected]
Germany
HAMEG ServiceKelsterbacher Str. 15-1960528 FRANKFURT am MainTel. (069) 67805 - 24 -15Telefax (069) 67805 - 31E-mail: [email protected]
HAMEG GmbHIndustriestraße 663533 MainhausenTel. (06182) 8909 - 0Telefax (06182) 8909 - 30E-mail: [email protected]
Instruments
®
42
- 50
14
- 00
E0